bangladesh - food and agriculture organization · bangladesh is one of the most densely populated...
TRANSCRIPT

Forestry Department
Food and Agriculture Organization of the United Nations
FRA2010/017 Rome, 2010
GLOBAL FOREST RESOURCES
ASSESSMENT 2010
COUNTRY REPORTS
BANGLADESH

2
The Forest Resources Assessment Programme Sustainably managed forests have multiple environmental and socio-economic functions important at the global, national and local scales, and play a vital part in sustainable development. Reliable and up-to-date information on the state of forest resources - not only on area and area change, but also on such variables as growing stock, wood and non-wood products, carbon, protected areas, use of forests for recreation and other services, biological diversity and forests’ contribution to national economies - is crucial to support decision-making for policies and programmes in forestry and sustainable development at all levels.
FAO, at the request of its member countries, regularly monitors the world’s forests and their management and uses through the Forest Resources Assessment Programme. This country report forms part of the Global Forest Resources Assessment 2010 (FRA 2010). The reporting framework for FRA 2010 is based on the thematic elements of sustainable forest management acknowledged in intergovernmental forest-related fora and includes variables related to the extent, condition, uses and values of forest resources, as well as the policy, legal and institutional framework related to forests. More information on the FRA 2010 process and the results - including all the country reports - is available on the FRA Web site (www.fao.org/forestry/fra ). The Global Forest Resources Assessment process is coordinated by the Forestry Department at FAO headquarters in Rome. The contact person for matters related to FRA 2010 is: Mette Løyche Wilkie Senior Forestry Officer FAO Forestry Department Viale delle Terme di Caracalla Rome 00153, Italy E-mail: [email protected] Readers can also use the following e-mail address: [email protected]
DISCLAIMER The designations employed and the presentation of material in this information product do not imply the expression of any opinion whatsoever on the part of the Food and Agriculture Organization of the United Nations concerning the legal status of any country, territory, city or area or of its authorities, or concerning the delimitation of its frontiers or boundaries. The Global Forest Resources Assessment Country Report Series is designed to document and make available the information forming the basis for the FRA reports. The Country Reports have been compiled by officially nominated country correspondents in collaboration with FAO staff. Prior to finalisation, these reports were subject to validation by forestry authorities in the respective countries.

FRA 2010 – Country Report, Bangladesh
3
Contents
INTRODUCTION .................................................................................................................................................. 5
TABLE T1 – EXTENT OF FOREST AND OTHER WOODED LAND ......................................................... 6
2 TABLE T2 – FOREST OWNERSHIP AND MANAGEMENT RIGHTS ............................................ 21
3 TABLE T3 – FOREST DESIGNATION AND MANAGEMENT ......................................................... 25
4 TABLE T4 – FOREST CHARACTERISTICS ...................................................................................... 30
5 TABLE T5 – FOREST ESTABLISHMENT AND REGENERATION................................................ 34
6 TABLE T6 – GROWING STOCK.......................................................................................................... 36
7 TABLE T7 – BIOMASS STOCK ........................................................................................................... 39
8 TABLE T8 – CARBON STOCK ............................................................................................................. 41
9 TABLE T9 – FOREST FIRES ............................................................................................................... 43
10 TABLE T10 – OTHER DISTURBANCES AFFECTING FOREST HEALTH AND VITALITY ...... 45
11 TABLE T11 – WOOD REMOVALS AND VALUE OF REMOVALS ................................................ 48
12 TABLE T12 – NON-WOOD FOREST PRODUCTS REMOVALS AND VALUE OF REMOVALS ............ 50
13 TABLE T13 – EMPLOYMENT ............................................................................................................... 52
14 TABLE T14 – POLICY AND LEGAL FRAMEWORK ........................................................................ 54
15 TABLE T15 – INSTITUTIONAL FRAMEWORK ................................................................................. 56
16 TABLE T16 – EDUCATION AND RESEARCH................................................................................... 58
17 TABLE T17 – PUBLIC REVENUE COLLECTION AND EXPENDITURE ...................................... 60

FRA 2010 – Country Report, Bangladesh
4
Report preparation and contact persons The present report was prepared by the following person(s):
Name (FAMILY NAME, First name)
Institution / address E-mail Fax Tables
Shamsuddin, A K M
Chief Conservator of Forests, Forest Department, Bana Bhaban, Agargaon, Dhaka-1207, Bangladesh
[email protected] 8802 8118671
Motaleb, Md. Abdul Deputy Chief Conservator of Forests, Planning Wing, Forest Department
dccf-plan@ bforest.gov.bd
Ahmad, Ishtiaq Uddin Conservator of Forests, Administration and Finance Forest Department
Ali, Md. Yunus Conservator of Forests, Central Circle Forest Department
Banik, Haradhan Conservator of Forests, Social Forest Circle Forest Department
Latif, Md. Abdul
Chief Research Officer, Bangladesh Forest Research Institute, Solashahar, Chittagong.
Islam, Md. Mozaharul
Assistant Chief Conservator of Forests Development Planning Unit, Forest Department
Chowdhury, Ruhul Mohaiman
Assistant Conservator of Forests, Development Planning Unit, Forest Department

FRA 2010 – Country Report, Bangladesh
5
Introduction Bangladesh lies in the north-eastern part of the South Asia between 2034 and 2638 north latitude and 8801 and 9241 east longitude. The area of the country is 14.757 million hectares (ha). Here tropical climate prevails throughout the year with distinct rainfall and dry period. Bangladesh is one of the most densely populated countries of the world. According to Bangladesh Bureau of Statistics (BBS 2004) population is 135.0 million of which 77% live in the rural areas. Overall per capita availability of land and forest are about 0.12 ha and 0.02 ha respectively. The total forest area in Bangladesh, according to Forest Department, is estimated to be 2.52 million ha corresponding to 17.4% of the surface area of the country. This includes 1.52 million ha Forest Department controlled land, 0.73 million ha Unclassified State Forests (USF) under the control of District Administration and 0.27 million ha village forest land (mostly homesteads). However, National forest and tree resources assessment 2005-2007 found forest cover of the country as 9.8% as per definition of FAO. Under the auspices of Global Forest Resources Assessment (GFRA), recently Bangladesh Forest Department has implemented a technical cooperation project namely "Strengthening Capacity to Generate Quality Information on Forest Resources (TCP/BGD/3001)" during 2005-2007 with the technical and financial assistance from FAO of the UN. Under this project, the first National Forest Assessment (NFA) was conducted both in forests and TOF areas whereby earlier management inventories were confined within the designated forest reserves only. The NFA was guided by remote sensing analysis as well as ground inventory with 296 sampling plots all over the country. Results show that almost 50% of the country has some kind of tree cover. Further, the inventory enumerated national landuse area, growing stock, biodiversity and regeneration, social and economical aspects of forests and trees and biomass and carbon as per guidelines of FAO. The FRA2010 of Bangladesh is developed based primarily on the 'National Forest and Tree Resources Assessment 2005-2007' and supplemented with national data generated by the Forest Department.

FRA 2010 – Country Report, Bangladesh
6
Table T1 – Extent of Forest and Other wooded land
1.1 FRA 2010 Categories and definitions
Category Definition Forest Land spanning more than 0.5 hectares with trees higher than 5 meters and
a canopy cover of more than 10 percent, or trees able to reach these thresholds in situ. It does not include land that is predominantly under agricultural or urban land use.
Other wooded land Land not classified as “Forest”, spanning more than 0.5 hectares; with trees higher than 5 meters and a canopy cover of 5-10 percent, or trees able to reach these thresholds in situ; or with a combined cover of shrubs, bushes and trees above 10 percent. It does not include land that is predominantly under agricultural or urban land use.
Other land All land that is not classified as “Forest” or “Other wooded land”. Other land with tree cover (Subordinated to “Other land”)
Land classified as “Other land”, spanning more than 0.5 hectares with a canopy cover of more than 10 percent of trees able to reach a height of 5 meters at maturity.
Inland water bodies Inland water bodies generally include major rivers, lakes and water reservoirs.
1.2 National data
1.2.1 Data sources
References to sources of information
Quality (H/M/L)
Variable(s) Year(s) Additional comments
GOB. 1961. Inventory of Sangu- Matamuhari Reserved Forests.
H Extent 1958 and 1961
GOB. 1963. Forestal, Forestry and Engineering International Ltd.. Inventory of Sitaphar .
H Extent 1963
GOB. 1963. Forestal, Forestry and Engineering International Ltd.. Inventory of Kasalong
H Extent 1963
GOB. 1963. Forestal, Forestry and Engineering International Ltd. Inventory of Rankiang
H Extent 1963
ANON, 1964. Forest Inventory Survey of Chittagong Hill Tracts in 1961-1963, Forestal, Forestry and Engineering International Ltd.
M Extent 1963
Hammermaster, E. T., 1981. Village Forest Inventory of Bangladesh: Inventory Results. Field Document No. 5. UNDP/FAO Project BGD/78/020
M Extent 1981
FAO 1988. Assistance to the Forestry Sector of Bangladesh. Project Findings and Recommendations. FD/BGD/79/017 Terminal Report.
H Extent 1983
Drigo et al 1987. FAO/UNDP/BGD/85/085.
H Extent 1984

FRA 2010 – Country Report, Bangladesh
7
FMP, 1993. Forestry Master Plan, Ministry of Environment and Forest, Government of Bangladesh. GOB.1993. Asian Development Bank (UNDP/FAO/BGD/88/025). Main and supporting volumes
M Extent 1985, 1990, 1991, 1992
Ghani, . Q., A. ALim and P.R. Stevens. 1990. Rehabilitation and land use of Sal Forests. FAO/UNDP Project BGD/85/085.
M Extent 1990
Revilla Jr. J. A. V et. al. 1998. Final Report: Forest Inventory of the natural forests and Forest plantation (Sundarbans Forest Division) Mandela Agricultural Development Corporation and Forest Department, Ministry of Environment and Forests. Bangladesh.
H Extent 1995
Revilla Jr. J. A. V et. al. 1998. Final Report: Forest Inventory of the natural forests and Forest plantation (Cox’s Bazar Forest Division) Mandela Agricultural Development Corporation and Forest Department, Ministry of Environment and Forests. Bangladesh.
H Extent 1996
Revilla Jr. J. A. V et. al., 1998. Final Report: Forest Inventory of the natural forests and Forest plantation (Chittagong Forest Division) Mandela Agricultural Development Corporation and Forest Department, MOEF. Bangladesh.
H Extent 1996
Revilla Jr. J. A. V et. al. 1998. Final Report: Forest Inventory of the natural forests and Forest plantation (Sylhet Forest Division) Mandela Agricultural Development Corporation and Forest Department, MOEF. Bangladesh.
H Extent 1996
Revilla Jr. J. A. V et. al. 1998. Final Report: Forest Inventory of the natural forests and Forest plantation (Coastal Afforestation) Mandela Agricultural Development Corporation and Forest Department, MOEF. Bangladesh.
H Extent 1998
Sylvander, R., Latif, M. A. and Karlsson, A. 2000. Forest Inventory of the Sal Forests of Bangladesh. Forestry Sector Project, Forest Department, MOEF, Bano Bhaban, Dhaka.
H Extent 2000
SYB, 2000. Statistical yearbook M Extent 2000
FRA 2010 – Country Report, Bangladesh
8
of Bangladesh. Twenty-First edition. Bangladesh Statistics Division, Ministry of Planning, Government of the People’s Republic of Bangladesh, Dhaka. GOB, 2002. Ek-najare Bangladesh Ban Bibhag, Information Cell, National Tree Planting Movement and Tree Fair.
M Extent 2002
ANON, 2004. Office Letter of BFIDC, No. 455 of 19 Dec. 2004
M Extent 2004
National Forest and Tree Resources Assessment 2005-2007
H Extent 2005-2007
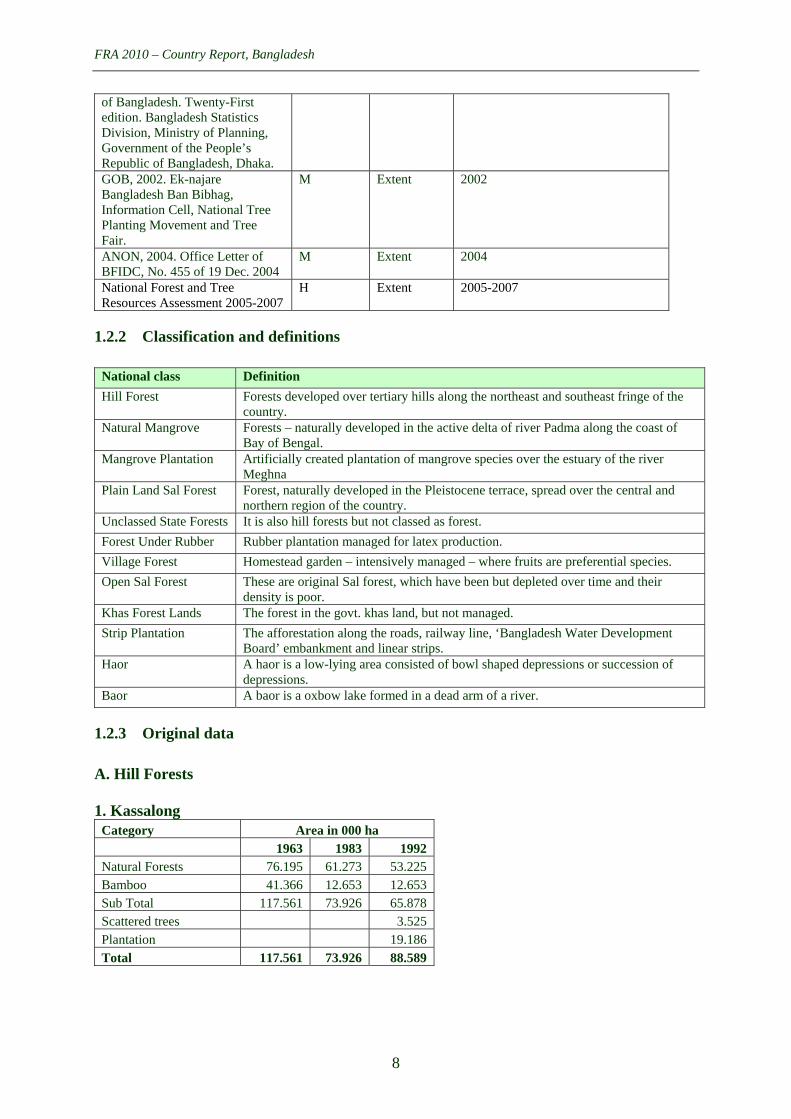
1.2.2 Classification and definitions
National class Definition
Hill Forest Forests developed over tertiary hills along the northeast and southeast fringe of the country.
Natural Mangrove Forests – naturally developed in the active delta of river Padma along the coast of Bay of Bengal.
Mangrove Plantation Artificially created plantation of mangrove species over the estuary of the river Meghna
Plain Land Sal Forest Forest, naturally developed in the Pleistocene terrace, spread over the central and northern region of the country.
Unclassed State Forests It is also hill forests but not classed as forest.
Forest Under Rubber Rubber plantation managed for latex production.
Village Forest Homestead garden – intensively managed – where fruits are preferential species.
Open Sal Forest These are original Sal forest, which have been but depleted over time and their density is poor.
Khas Forest Lands The forest in the govt. khas land, but not managed.
Strip Plantation The afforestation along the roads, railway line, ‘Bangladesh Water Development Board’ embankment and linear strips.
Haor A haor is a low-lying area consisted of bowl shaped depressions or succession of depressions.
Baor A baor is a oxbow lake formed in a dead arm of a river.
1.2.3 Original data
A. Hill Forests 1. Kassalong
Category Area in 000 ha 1963 1983 1992 Natural Forests 76.195 61.273 53.225 Bamboo 41.366 12.653 12.653 Sub Total 117.561 73.926 65.878 Scattered trees 3.525 Plantation 19.186 Total 117.561 73.926 88.589

FRA 2010 – Country Report, Bangladesh
9
2. Rankhiang Variable Area in 000 ha 1963 1983 1992 Natural Forests 27.258 10.344 5.052 Bamboo 27.907 13.606 13.606 Sub Total 55.165 23.95 18.658 Scatter trees 6.494 Plantation 18.718 Total 55.165 23.95 43.87
3. Sitapahar
Area in 000 ha Category 1984 1990 Natural Forests 0.65 0.65 Plantation (teak) 3.81 3.74
Sub total 4.46 4.39
Non-productive forests 0.35 0.30 Other 0.62 0.75
Sub-Total 0.98 1.05
TOTAL 5.44 5.44
4. Sangu Matamuhari
Area in 000 ha Category 1958 1983
Timber mixed 9.48 8.70
Bamboo – Timber 64.24 47.84
Sub Total 73.72 56.54
Jhum 0.03 17.10
Other 0.75 0.86
Sub Total 0.78 17.96
Total 74.50 74.50
5. Chittagong
Category Area in 000 ha 1984 1996 Natural Forests 30.003 22.224 Bamboo 3.299 Sub Total Forests 30.003 25.523 Scatter trees OWL 22.468 34.157 Plantation 13.223 14.109 Total 65.694 73.789

FRA 2010 – Country Report, Bangladesh
10
6. Cox’s Bazar Category Area in 000 ha
1984 1996 Natural Forests 31.294 26.867 Bamboo Sub Total Forests 31.294 26.867 Scatter trees OWL 3.205 3.532 Plantation 18.044 19.439 Total 52.543 49.838
7. Sylhet
Category Area in 000 ha 1984 1996 Natural Forests 3.337 2.782 Bamboo 13.933 20.04 Sub Total Forests 17.270 22.822 Scatter trees OWL 2.832 0.872 Plantation 11.502 17.872 Total 31.604 41.566
8. Jhum Plantations The FMP, 1993 has indicated following area of Jhum Control plantations in the hills. Forest Plantation Area in 000 ha (1990) Jhum Plantations 15.36
B. Plain Sal Forests 1. Dhaka
Category Area in 000 ha 1990 2000 Natural Forests 6.734 9.88 Plantation (wood lot) 0.917 2.04 Total 7.651 11.92
2. Tangail
Category Area in 000 ha 1990 2000 Natural Forests 9.975 8.130 Plantation (wood lot) 5.157 7.250 Total 15.132 15.38
3. Mymensingh
Category Area in 000 ha 1990 2000 Natural Forests 5.787 2.320 Plantation (wood lot) 3.844 5.136 Total 9.631 7.456

FRA 2010 – Country Report, Bangladesh
11
4. Dinajpur Category Area in 000 ha 1990 2000 Natural Forests 0.946 1.472 Plantation (wood lot) 3.450 1.856 Total 4.396 3.328
5. Rangpur
Category Area in 000 ha 1990 2000 Natural Forests 0.084 0.064 Plantation (wood lot) 1.746 0.568 Total 1.83 0.632
6. Rajshahi
Category Area in 000 ha 1990 2000 Natural Forests not available 0.128 Plantation (wood lot) not available 0.200 Total not available 0.328
C. Littoral Forests (Mangrove and Coastal Afforestation) 1. Sunderbans
Category Area in 000 ha 1981 1995 Forests 405.257 399.465 Plantations 0.351 0.217 Total 405.608 399.682
2. Coastal Afforestation
Coastal Areas Area in 000 ha 1984 1996 Bhola CA 3.565 12.42 Chittagong CA 3.342 20.042 Noakhali CA 6.065 34.223 PatuaKhali CA 4.007 9.848 Total 16.979 76.533
D. Rubber Plantation
Category Area in 000 ha 1990 2000 Rubber Plantations 19.800 35.430
E. Unclassed State Forests There is more than 700,000 ha of hill land under district administration and most of this land is barren and lacks forest cover (GOB, 1993 Page 84 Main volume). No information is available on extent of forest cover on this land except for following plantations in the hills (FMP, 1993). Hence its area, excluding following plantations, will be classified as “Other Land” under FRA 2005 Category.

FRA 2010 – Country Report, Bangladesh
12
Forest Plantation Area in 000 ha (1990) Khagrachari 1.41 Bandarban Pulpwood 8.72 Bandarban 9.36 Kaptai Pulpwood 18.17
F. Strip Plantations Bangladesh Forest Department (GOB, 2002) estimates that the country has about 72,498.37 km long strip plantations. If average width of these plantations is assumed to be 10 meters then 1 km long plantation is equal to 1 hectare and the total strip plantation in Bangladesh in 2002 may be treated as covering about 72, 498 ha. It will be classified as “Other Land with tree cover ” under FRA 2005 Category. G. Village Homestead Forests The “Forest Master Plan” indicates that about 270,000 ha are under village homestead forests comprising of bamboo as well as trees (GOB, 1993. “Statistical Report” – Village Forest Inventory- Page 1, one of the supplementary volumes to the “Forest Master Plan”). It will be classified as “Other Land with tree cover ” under FRA 2005 Category.
H. National Forest Assessment 2005-2007 National Land Use Classes International
LUCs Level 1 Level 2 Level 3 Codes
Area
(000ha) Hill forest (FH) 551 Sal forest (FSa) 34 Mangrove forest (saltwater) (FM) 436
Natural Forest (FN) 1,204 Bamboo or mixed Bamboo/broad-
leaved forest (FB) 184
Long rotation forest plantation (PL) 131 Short/medium rotation forest plantation
(PS) 54
Mangrove Plantation (PM) 45
Forest (F)
1,442
Forest (F)
1,442
Forest Plantations
(FP) 237
Rubber Plantation (PR) 8 Shrubs (Sh) 266 Other
Wooded Land (OWL)
289
Shrubs (S) 289
Swamps with shrubs (Sw) 23
Barren/Grass Land (BG) 89 Annual Crops without trees (CA0) 6,583 Annual Crops with trees 0.1-0.5 ha (CA1) 784
Annual Crops (CA) 7492 Annual Crops with trees >0.5 ha (CA2) 126
Perennial Crops without trees (CP0) 19 Perennial Crops with trees 0.1-0.5 ha (CP1) 8
Perennial Crops (CP)
106 Perennial Crops with trees >0.5 ha (CP2) 79 Range Land/ Pasture (RL) 25
Cultivated Land (Cult.)
8327
Wooded land with shifting cultivation (Fallow) (Fa) 327 Rural settlement without trees (SR0) 95 Rural settlement with trees 0.1-0.5 ha (SR1) 1,090
Villages (Vill.) 2862 Rural settlement with trees > 0.5 ha (SR2) 1,677
Urban settlements (SU) 85
Other Land (OL)
11005
Built-up Areas(BUA)
104 Highways and other artificial areas (HA) 19
Lake (WL) 43 River (WR) 1,070 Pond (WP) 286
Inland Water (W) 2022
Inland Water (W)
2022 Haor & Baor (WHB) 622
Total country area of Bangladesh 14,757

FRA 2010 – Country Report, Bangladesh
13
1.3 Analysis and processing of national data
1.3.1 Calibration
National Statistics on Total Area and Inland water bodies area
Category Country Variables Area (000 hectare) Inland Water 1770.0 Haor, Baor & Lakes 133.8 Rivers 1506.2 Ponds 130.0 Total for country Country Area 14,757.0
Source: SYB 2000, Table- 2.02 page-20. UN Statistics on Total Land Area and Inland Water bodies The total area of the country in FAOSTAT is 14,400 (000 ha) and the area of inland water is 1383 (000 ha), which is different than the above. The calibration has been done to match the area of the country and inland water bodies with FAOSTAT/UNSTAT by adjusting these area differences in the area of the “other land”.
1.3.2 Estimation and forecasting
The estimating and the forecasting for 1990, 2000 and 2005 have been done separately for each sub-national forest boundary of inventory or assessment as these has been inventoried or surveyed in different years as indicated in the original data. A. Hill Forests 1. Kassalong The linear trend has been used for natural forests and bamboo area. Since only one point information was available for Bamboo, Scattered trees and Plantations same figure has been used for 1990, 2000 and 2005.
Category Area in 000 ha 1990 2000 2005 Natural Forests 55.01 46.07 41.60 Bamboo 12.65 12.65 12.65 Sub Total 67.67 58.72 54.25 Scattered trees 3.53 3.53 3.53 Plantation 19.19 19.19 19.19 Total 90.38 81.44 76.96

FRA 2010 – Country Report, Bangladesh
14
2. Rankhiang The linear trend has been used for natural forests and bamboo area. Since only one point information was available for Bamboo, Scattered trees and Plantations same figure has been used for 1990, 2000 and 2005
Area in 000 ha 1990 2000 2005 Natural Forests 6.23 0.35 0.35 Bamboo 13.61 13.61 13.61 Sub Total 19.83 13.95 13.95 Scatter trees 6.49 6.49 6.49 Plantation 18.72 18.72 18.72 Total 45.05 39.17 39.17
3. Sita Pahar The linear interpolation and extrapolation method has been used for estimating area of natural forests, plantations and non-productive forests in 1990, 2000 and 2005.
Area in 000 ha Category 1990 2000 2005 Natural Forests 0.65 0.65 0.65 Plantation (teak) 3.74 3.62 3.56 Sub total 4.39 4.27 4.21 Non-productive forests 0.30 0.21 0.17 Other 0.75 0.96 1.06 Sub-Total 1.05 1.17 1.23 TOTAL 5.44 5.44 5.44
4. Sanghu Matamuhari The linear interpolation and extrapolation method has been used for estimating areas of timber and bamboo-timber natural forests. The area of Jhum has been assumed constant since 1990. Category 1990 2000 2005 Timber mixed 8.48 8.17 8.01 Bamboo – Timber 43.25 36.69 33.41 Sub Total 51.73 44.86 41.42 Jhum 17.10 17.10 17.10 Other 5.67 12.54 15.98 Sub Total 22.77 29.64 33.08 Total 74.50 74.50 74.50

FRA 2010 – Country Report, Bangladesh
15
3. Chittagong The interpolation and extrapolation method has been used for estimating and forecasting the area of natural forests. Since bamboo had only data hence same figure has been assumed for the three reference years. Area under plantation for 1990 has been interpolated, while for 2000 and 2005 it has been assumed same as in 1996. The area under scattered trees for 1990 has been interpolated for 1990 but for 2000 and 2005 it has been treated as remainder area such that the total does not increase the actual original level of 1996.
Category Area in 000 ha
1990 2000 2005 Natural Forests 26.114 19.631 16.390 Bamboo 3.299 3.299 3.299 Sub Total Forests 29.413 22.930 19.689 Scatter trees 28.313 36.750 39.991 Plantation 13.666 14.109 14.109 Total 71.391 73.789 73.789
4. Cox’s Bazar The interpolation and extrapolation method has been used for natural forests. Area under plantation for 1990 has been interpolated, while for 2000 and 2005 it has been assumed as in 1996. The area under Scattered trees for 1990 has been interpolated for 1990 but for 2000 and 2005 it has been treated as remainder area such that the total does not increase the actual original level of 1996.
Category Area in 000 ha
1990 2000 2005 Natural Forests 29.081 25.391 23.547 Bamboo 0 0 0 Sub Total Forests 29.081 25.391 23.547 Scatter trees OWL 3.369 5.008 6.852 Plantation 18.742 19.439 19.439 Total 51.191 49.838 49.838
5. Sylhet The interpolation and extrapolation method has been used for estimating and forecasting the areas of natural forests. Area under bamboo has been interpolated for 1990 but for 2000 and 2005 it has been assumed same as in 1996. The area under plantation for 1990 has been interpolated, while for 2000 and 2005 it has been assumed as in 1996. The area under Scattered trees for 1990 has been interpolated for 1990 but for 2000 and 2005 it has been treated as remainder area such that the total maintains the original level of 1996.
Category Area in 000 ha
1990 2000 2005 Natural Forests 3.060 2.597 2.366 Bamboo 16.987 20.04 20.04 Sub Total Forests 20.046 22.637 22.406 Scatter trees OWL 1.852 1.057 1.288 Plantation 14.687 17.872 17.872 Total 36.585 41.566 41.566

FRA 2010 – Country Report, Bangladesh
16
6. Other Plantations The area in 1990 has been assumed for 2000 and 2005 since there was only one point in time information available for the following plantations in the hills.
Area in 000 ha Category 1990 2000 2005 Khagrachari 1.41 1.41 1.41 Bandarban Pulpwood 8.72 8.72 8.72 Bandarban 9.36 9.36 9.36 Kaptai Pulpwood 18.17 18.17 18.17 Jhum control 15.36 15.36 15.36 Total 53.02 53.02 53.02
Total Hill Forests The above estimating and forecasting for different forest areas has lead to the following total of forest, bamboo, plantation and scattered trees (OWL) areas in the hills of Bangladesh.
Category Area in 000 ha
1990 2000 2005 Natural Forests 128.63 102.86 92.91 Bamboo 89.79 86.29 83.01 Sub-total Forests 218.42 189.15 175.92 Plantation 141.76 145.97 145.91 Sub-Total Forests and Plantation 360.18 335.12 321.83 Scattered trees (Other wooded lands)_ 43.55 52.83 58.15 Grand Total 403.73 387.95 379.98
B. Plain Sal Forests The figures for 1990 and 2000 were available. The figures of 2000 have been assumed for 2005 as they present more realistic picture of the forest resources on the ground. 1. Dhaka
Category Area in 000 ha
1990 2000 2005 Natural Forests 6.734 9.88 9.88 Plantation (wood lot) 0.917 2.04 2.04 Total 7.651 11.92 11.92
2. Tangail
Category Area in 000 ha
1990 2000 2005 Natural Forests 9.975 8.130 8.130 Plantation (wood lot) 5.157 7.250 7.250 Total 15.132 15.38 15.38
3. Mymensingh
Category Area in 000 ha
1990 2000 2005 Natural Forests 5.787 2.320 2.320 Plantation (wood lot) 3.844 5.136 5.136 Total 9.631 7.456 7.456

FRA 2010 – Country Report, Bangladesh
17
4. Dinajpur Category Area in 000 ha
1990 2000 2005 Natural Forests 0.946 1.472 1.472 Plantation (wood lot) 3.450 1.856 1.856 Total 4.396 3.328 3.328
5. Rangpur
Category Area in 000 ha
1990 2000 2005 Natural Forests 0.084 0.064 0.064 Plantation (wood lot) 1.746 0.568 0.568 Total 1.83 0.632 0.632
6. Rajshahi Category Area in 000 ha
1990 2000 2005 Natural Forests 0.128 0.128 0.128 Plantation (wood lot) 0.200 0.200 0.200 Total 0.328 0.328 0.328
Total Plains Forest The above figures lead to the following total of the forest resources in the plains of Bangladesh.
Category Area in 000 ha
1990 2000 2005 Natural Forests 23.654 21.994 21.994 Plantation (wood lot) 15.314 17.050 17.050 Total 38.968 39.044 39.044
C. Littoral Forests (Mangroves and Coastal Afforestation) Interpolation and extrapolation has been used to estimate the areas figures for 1990, 2000 and 2005 in littoral forest of Bangladesh. 1. Sunderbans
Area in 000 ha Category 1990 2000 2005 Natural Forests 401.53 397.40 395.33 Plantation 0.26 0.22 0.22 Total 401.80 397.61 395.54
2. Coastal Afforestation Interpolation and extrapolation has been used to estimate data for 1990, 2000 and 2005.
Area in 000 ha Coastal Areas 1990 2000 2005 Bhola CA 10.21 12.42 12.90 Chittagong CA 15.87 20.04 20.82 Noakhali CA 27.18 34.22 35.55 PatuaKhali CA 8.39 9.85 10.23 Total 61.65 76.53 79.50

FRA 2010 – Country Report, Bangladesh
18
Total Littoral Forests Category Area in 000 ha
1990 2000 2005
Forests 401.53 397.40 395.33
Plantations 61.91 76.75 79.72
Total 463.44 474.15 475.05 D. Rubber Plantations The figure for 2005 has been assumed same as of 2000. Category Area in 000 ha 1990 2000 2005Rubber Plantation 19.800 35.430 35.430
E. Unclassed State Forests There is more than 700,000 ha of hill land under district administration and most of this land is barren and lacks forest cover (GOB, 1993 Page 84 Main volume). Detail information is not available on extent of forest cover on this land. Since only point (1992) information is available for village homestead forests the same information is being assumed for 1990, 2000 and 2005.
Category Area in 000 ha 1990 2000 2005 Un-classed State forests 700 700 700
F. Strip Plantations Bangladesh Forest Department (GOB, 2002) estimates that the country has about 72,498.37 km long strip plantations. If average width of these plantations is assumed to be 10 meters then 1 km long plantation is equal to 1 hectare and the total strip plantation in Bangladesh in 2002 may be treated as covering about 72, 498 ha.
Category Area in 000 ha 1990 2000 2005 Strip plantations 73 73 73
G. Village Homestead Forests Since only point (1992) information is available for village homestead forests the same information is being assumed for 1990, 2000 and 2005. This assumption is also based on the cultural practice to maintain and conserve village homesteads.
Category Area in 000 ha 1990 2000 2005 Village homestead forests 270 270 270

FRA 2010 – Country Report, Bangladesh
19
H. Total Hills, Plain and Littoral Forests and Rubber Plantation
Area in 000 ha National Category 1990 2000 2005
Natural Forests Hills 218.42 189.14 175.92
Plain 23.65 21.99 21.99
Littoral 401.53 397.40 395.33
Sub Total 643.61 608.53 593.24
Plantations Hills 141.76 145.97 145.91
Plain 15.31 17.05 17.05
Littoral 61.91 76.75 79.72
Rubber 19.80 35.43 35.43
Sub Total 238.79 275.20 278.11
Sub Total Forest 882.39 883.74 871.35
Scattered Trees (OWL) 43.55 52.83 58.15
Homestead Forest and Strip Plantations 342.50 342.71 342.67 The same figures from NFMA have been assumed valid for 2010. For the previous reference years, the change rate of -2600 ha of forest per year (calculated in the period 2000-2005) has been applied to the NFMA figures. For other wooded land the change of 1000 ha per year has been applied. This assumption was necessary since the latest available figures from the NFMA 2005-2007 were not directly comparable with the previous forest inventories, and their comparison would have led to an unrealistic trend in forest cover areas over the period.
1.3.3 Reclassification into FRA 2010 categories
FRA 2005 Categories Country Variables
Forest Other Wooded
land
Other land
Other land of which with tree
cover
Inland Water bodies
Natural Forests 100 Forest Plantation 100 Scattered Trees 100
Rubber Plantations 100 Unclassed State Forests 100
Strip Plantations 100
Village Homesteads 100
All remaining national categories 100 Haor, Baor & Lakes 100 Rivers 100Ponds 100
(Note: Inland water bodies’ areas will be calibrated (set equal to) with area of Inland water bodies in FAOSTAT. The area of the land remaining after accounting forests and other wooded land will be allocated to the category of “other land”) For the National forest assessment 2005-2007 there is no need of reclassifying since the categories of Forest, Other wooded land, other land and inland water already correspond to the FRA categories.

FRA 2010 – Country Report, Bangladesh
20
1.4 Data for Table T1
Area (1000 hectares) FRA 2010 categories
1990 2000 2005 2010
Forest 1494 1468 1455 1442 Other wooded land 269 279 284 289 Other land 11254 11270 11278 11286 ...of which with tree cover 2209 Inland water bodies 1 383 1 383 1 383 1 383 Total for country 14 400 14 400 14 400 14 400
1.5 Comments to Table T1
Variable / category
Comments related to data, definitions, etc. Comments on the reported trend
Forest Data are different from FRA2005 report that was based on partial inventories from different reference years. Present data have been updated based on National Forest and Tree Resources Assessment (NFA) 2005-2007 which is supported by remote sensing analysis. The reliability of the figures is confirmed by the fact that the BSS in 2000 reported that forest area was 2.6 million ha and 2.5 in 2004. These figures are much higher than what here reported but the BSS mainly reports on legally designated forest area which also include garden areas (NFMA 2005-2007)
Other wooded land
Other land
Other land with tree cover
Inland water bodies As found through remote sensing study.
Other general comments to the table The national land use categories and definitions are already defined in the NFA2005-2007 supported by the FAO of the UN and the information in the above table has been derived from the said inventory.
Expected year for completion of ongoing/planned national forest inventory and/or RS survey / mapping Field inventory National forest inventory was compiled in 2006 under NFA
supported by FAO. Remote sensing survey / mapping Remote sensing analysis and mapping was completed in
2007

FRA 2010 – Country Report, Bangladesh
21
2 Table T2 – Forest ownership and management rights
2.1 FRA 2010 Categories and definitions
Category Definition Public ownership Forest owned by the State; or administrative units of the public
administration; or by institutions or corporations owned by the public administration.
Private ownership Forest owned by individuals, families, private co-operatives, communities, corporations and other business entities, religious and educational institutions, pension or investment funds, NGOs, nature conservation associations and other private institutions.
Individuals (sub-category of Private ownership)
Forest owned by individuals and families.
Private business entities and institutions (sub-category of Private ownership)
Forest owned by private corporations, co-operatives, companies and other business entities, as well as private non-profit organizations such as NGOs, nature conservation associations, and religious and educational institutions etc.
Local communities (sub-category of Private ownership)
Forest owned by a group of individuals belonging to the same community residing within or in the vicinity of a forest area. The community members are co-owners that share exclusive rights and duties, and benefits contribute to the community development.
Indigenous / tribal communities (sub-category of Private ownership)
Forest owned by communities of indigenous or tribal people.
Other types of ownership Other kind of ownership arrangements not covered by the categories above. Also includes areas where ownership is unclear or disputed.
Categories related to the holder of management rights of public forest resources Public Administration
The Public Administration (or institutions or corporations owned by the Public Administration) retains management rights and responsibilities within the limits specified by the legislation.
Individuals/households Forest management rights and responsibilities are transferred from the Public Administration to individuals or households through long-term leases or management agreements.
Private institutions
Forest management rights and responsibilities are transferred from the Public Administration to corporations, other business entities, private co-operatives, private non-profit institutions and associations, etc., through long-term leases or management agreements.
Communities
Forest management rights and responsibilities are transferred from the Public Administration to local communities (including indigenous and tribal communities) through long-term leases or management agreements.
Other form of management rights
Forests for which the transfer of management rights does not belong to any of the categories mentioned above.
2.2 National data
2.2.1 Data sources

FRA 2010 – Country Report, Bangladesh
22
References to sources of information
Quality (H/M/L)
Variable(s) Year(s) Additional comments
National Forest and Tree Resources Assessment 2005-2007
H
Landuse area, Growing stock, Biodiversity and regeneration, Social and Economic products/ services, Biomass & carbon
2005-2007
Due to small area coverage under Sal forests and Mangrove plantations, distribution of sample plots were inadequate for the two categories as inventory layout follows systematic sampling.
2.2.2 Classification and definitions
National class Definition
State ownership Forest owned by the State; or administrative units of the public administration; or by institutions or corporations owned by the public administration.
Public Ownership Regional
The forest lands under land ministry.
Community Ownership
Forest owned by a group of individuals belonging to the same community residing within or in the vicinity of a forest area. The community members are co-owners that share exclusive rights and duties, and benefits contribute to the community development.
Indigenous Ownership Forest owned by communities of indigenous or tribal people.
Industrial Ownership Forest owned by private corporations, co-operatives, companies and other business entities, as well as private non-profit organizations such as NGOs, nature conservation associations, and religious and educational institutions etc.
Individual Ownership
Forest owned by individuals and families. Forest owned by individuals, families, private co-operatives, communities, corporations and other business entities, religious and educational institutions, pension or investment funds, NGOs, nature conservation associations and other private institutions.
Other/Unknown Ownership
2.2.3 Original data
National Forest and Tree Resources Assessment 2005-2007.
Ownership category Area
(000ha) %Public ownership 888 0.62 Private ownership 521 0.36 ...of which owned by individuals 177 0.12 ...of which owned by private business entities and institutions 0 0.00 ...of which owned by local communities 0 0.00 ...of which owned by indigenous / tribal communities 344 0.24
Other types of ownership 33 0.02 TOTAL 1442 1.00

FRA 2010 – Country Report, Bangladesh
23
2.3 Analysis and processing of national data
2.3.1 Calibration
2.3.2 Estimation and forecasting
Since no data is available on the forest ownership apart from the NFMA 2005-2007 data, the same percentages of different ownerships have been applied to the forest areas as from T1.
2.3.3 Reclassification into FRA 2010 categories
2.4 Data for Table T2 Table 2a - Forest ownership
Forest area (1000 hectares) FRA 2010 Categories
1990 2000 2005 Public ownership 926 910 902 Private ownership 538 528 524 ...of which owned by individuals 179 176 175 ...of which owned by private business entities and institutions 0 0 0 ...of which owned by local communities 0 0 0 ...of which owned by indigenous / tribal communities 359 352 349
Other types of ownership 30 30 29
TOTAL 1494 1468 1455 Note: If other types of ownership is reported, please specify details in comment to the table.
Yes Does ownership of trees coincide with ownership of the land on which they are situated? No If No above, please describe below how the two differ: Not applicable
Table 2b - Holder of management rights of public forests
Forest area (1000 hectares) FRA 2010 Categories
1990 2000 2005 2010 Public Administration n.a. n.a. n.a. n.a. Individuals n.a. n.a. n.a. n.a. Private corporations and institutions n.a. n.a. n.a. n.a. Communities n.a. n.a. n.a. n.a. Other n.a. n.a. n.a. n.a.
TOTAL n.a. n.a. n.a. n.a.

FRA 2010 – Country Report, Bangladesh
24
2.5 Comments to Table T2
Variable / category
Comments related to data, definitions, etc.
Comments on the reported trend
Public ownership FAO Definitions commensurate with National Definitions
Data reflected in the table T2 has been generated for the first time under the NFA 2005-2007.
Private ownership
Other types of ownership
Management rights
Other general comments to the table Data presented here is derived from National Forest and Tree Resources Assessment 2005-2007.

FRA 2010 – Country Report, Bangladesh
25
3 Table T3 – Forest designation and management
3.1 FRA 2010 Categories and definitions Term Definition Primary designated function The primary function or management objective assigned to a management unit
either by legal prescription, documented decision of the landowner/manager, or evidence provided by documented studies of forest management practices and customary use.
Protected areas Areas especially dedicated to the protection and maintenance of biological diversity, and of natural and associated cultural resources, and managed through legal or other effective means.
Categories of primary designated functions Production Forest area designated primarily for production of wood, fibre, bio-energy
and/or non-wood forest products. Protection of soil and water Forest area designated primarily for protection of soil and water. Conservation of biodiversity
Forest area designated primarily for conservation of biological diversity. Includes but is not limited to areas designated for biodiversity conservation within the protected areas.
Social services Forest area designated primarily for social services. Multiple use Forest area designated primarily for more than one purpose and where none of
these alone is considered as the predominant designated function. Other Forest areas designated primarily for a function other than production,
protection, conservation, social services or multiple use. No / unknown No or unknown designation. Special designation and management categories Area of permanent forest estate (PFE)
Forest area that is designated to be retained as forest and may not be converted to other land use.
Forest area within protected areas
Forest area within formally established protected areas independently of the purpose for which the protected areas were established.
Forest area under sustain-able forest management
To be defined and documented by the country.
Forest area with management plan
Forest area that has a long-term (ten years or more) documented management plan, aiming at defined management goals, which is periodically revised.
3.2 National data
3.2.1 Data sources
References to sources of information
Quality (H/M/L)
Variable(s) Year(s) Additional comments
FMP, 1993. Forestry Master Plan, Ministry of Environment and Forest, Government of Bangladesh. GOB (Government of Bangladesh) 1993. Asian Development Bank (UNDP/FAO/BGD/88/025). Main and supporting volumes Forest Resources Management Project
M As designated under different inventories
1985, 1990, 1991 and 1992 1997
FRA2010 report mainly based on the 'National Forest and Tree Resources Assessment 2005-2007'.

FRA 2010 – Country Report, Bangladesh
26
(FRMP) Inventory Forestry Sector Project (FSP) Inventory
2000
National Forest and Tree Resources Assessment
H 2005-2007
ANON, 2004. Office Letter of BFIDC, No. 455 of 19th December 2004.
M Rubber Plantations
2004
3.2.2 Classification and definitions
Following has been assumed since there is no national classification by designation for forests.
National class Definition
Production Hill and Plains Forests less areas under forests designated for Conservation, Social services and Protection of Soil and water.
All Rubber Plantation Protection of Soil and Water
Rankheong, Kassalong, and Sangu, Matamuhuri reserves in Chittagong Hill tracts
Conservation of Biodiversity
Protected Areas (PAs)
Social Services Areas under ecological and Safari parks Multiple Purpose Forest lands that provide multiple usages to the society e.g. wood, fuel,
environmental and production purposes.
3.2.3 Original data
A. Protected Areas
Area in 000 ha Forest Areas Protected Area 1990 2000 2005 2010 Hill Forest and Plantations
Himchari National Park 1.73 1.73 1.73 1.73
Lawachara National Park 1.25 1.25 1.25 1.25 Rema-Kalenga WS 1.80 1.80 1.80 1.80 Hail Haor 1.43 1.43 1.43 Hazarikhil 2.91 2.91 2.91 2.91 Chunati WS 7.76 7.76 7.76 7.76 Teknaf Game Reserve 11.62 11.62 11.62 11.62 Kaptai National Park 5.46 PablaKhali Wildlife Sanctuary 42.09 Medha Kachapia National Park 0.40 Sathchari National Park 0.24 Khadim Nagar National Park 0.68 Fashiakhali Wildlife Sanctuary 1.30 Sub TOTAL 28.49 28.49 28.49 77.24 Sal Forests and Plantation Bhawal National Park 5.02 5.02 5.02 5.02 Modhupur National Park 8.44 8.44 8.44 8.44 Ramsagar National Park 0.05 0.05 0.05 0.05 Mirpur Botanic Garden 0.09 0.09 0.09 Sub TOTAL 13.60 13.60 13.60 13.51

FRA 2010 – Country Report, Bangladesh
27
(WS= Wildlife Sanctuary)
B. Social Services Areas
Forest Type Social Service Areas Area in 000 ha 1990 2000 2005 2010 Hill Forests Rampahar-Sitapahar 3.026 3.026 3.026 Dulahazara Safari Park 1.6 1.6 1.6 1.60 Madhabkunda Eco Park 4.23 4.23 4.23 4.23
Sitakundu Botanical Garden and Eco Park
0.81 0.81 0.81 0.81
Banskhali Eco-Park 1.20 Tilahgarh Eco-Park 0.046 Borshizora Eco-Park 0.325 Sub-total 8.21 Sal Forests Baldah Garden 0.001 0.001 0.001 0.001 Modhutila Eco Park 0.12 0.12 0.12 0.12 Dhanshiri Eco-Park 0.02 National Botanic Garden, Dhaka 0.09 Sub-total 0.23 Litoral Forest Kuakata Eco-Park 5.66 Sub-total 5.66 TOTAL 9.787 9.787 9.787 14.10
C. Protection of Soil and Water Forest Type Protection of Soil and Water Areas Area in 000 ha 1990 2000 2005 2010
Rankhiang and Kasalong Forests less Pablakhali Wildlife Sanctuary 87.500 72.678 68.207 68.207 Sangu-Matamuhuri reserve forests 41.42
Hill Forests and Plantations
TOTAL 87.500 72.678 68.207 109.627 D. Multiple Function Areas
Area in 000 ha Forest Type 1990 2000 2005 2010
All areas of natural mangroves (saltwater) and mangrove plantations less "PA"s
323.74 334.45 335.35 358.95
Littoral forests TOTAL 323.74 334.45 335.35 358.95
Littoral Forests Sundarbans East WS 31.23 31.23 31.23 31.23 Sundarbans South WS 36.97 36.97 36.97 36.97 Sundarbans West WS 71.50 71.50 71.50 71.50 Nijum Dweep National Park 16.35
Char Kukri-Mukri Wildlife Sanctuary
0.04
Sub TOTAL 139.70 139.70 139.70 156.09 Grand Total PA 181.78 181.78 181.78 246.84

FRA 2010 – Country Report, Bangladesh
28
E. Production Forests Areas Area in 000 ha Forest Type
1990 2000 2005 2010
Hill Forests and Plantations
All areas less Rankhiang, Kassalong, Sangu-Matamuhuri, "PA"s and Social service areas.
244.19 233.95 225.14 650.223
Sal Forests and Plantations
All areas less "PA"s and Social Service areas
15.59 15.66 15.66 54.26
Rubber Plantations All areas under rubber plantations. 19.80 35.43 35.43 8.00
TOTAL 279.58 285.04 276.23 712.483
3.3 Analysis and processing of national data
3.3.1 Calibration
The different percentages of forest designation have been applied to the total forest area for 1990, 2000 and 2005 as coming from T1.
3.3.2 Estimation and forecasting
Not needed
3.3.3 Reclassification into FRA 2010 categories
A. Primary Function National Category Percentage of area serving Primary function Production Protection Conservation Social Ser. Multiple Production 100 Protection 100 Conservation 100 Social Service 100 Multiple 100
3.4 Data for Table T3
Table 3a – Primary designated function
Forest area (1000 hectares) FRA 2010 Categories
1990 2000 2005 2010 Production 474 473 461 713 Protection of soil and water 147 121 114 110 Conservation of biodiversity 308 302 304 247 Social services 17 17 17 14 Multiple use 548 555 559 358 Other (please specify in comments below the table) 0 0 0 0 No / unknown 0 0 0 0 TOTAL 1494 1468 1455 1442

FRA 2010 – Country Report, Bangladesh
29
Table 3b – Special designation and management categories
Forest area (1000 hectares) FRA 2010 Categories
1990 2000 2005 2010 Area of permanent forest estate 1225 1225 1225 1225 Forest area within protected areas 308 302 304 247 Forest area under sustainable forest management n.a. n.a. n.a. 978 Forest area with management plan n.a. n.a. n.a. 871
3.5 Comments to Table T3
Variable / category
Comments related to data, definitions, etc.
Comments on the reported trend
Production Hill and Plain land forests less area designated under Conservation, Social services and Protection of Soil and water.
FRA 2010 categories were different from the categories designated for the previous years
Protection of soil and water
Rankheong, Kassalong and Sangu-Matamuhuri reserves in Chittagong Hill Tracts
Newly included areas of Sangu- Matamuhuri forest reserves
Conservation of biodiversity
Protected Areas (PAs) Trend of forest area within this category may not be realistic due to necessary adjustment that was made to the forest area figures because of differences in the datasets.
Social services Areas under ecological and safari parks included
New areas included.
Multiple use Forest land provides multiple usages to the society e.g. wood, fuel, environmental and production services
Afforestation in the coastal areas included.
Other
No / unknown designation
Area of permanent forest estate (PFE)
All reserved forests declared under Forest Act 1927
Forest area under the PFE
Forest area within protected areas
All designated Protected Areas (PAs) namely wildlife sanctuaries, national parks and game reserve
Data available for the first time
Forest area under sustainable forest management
The forest which is managed to produce regular and continuous supply of desired forest produces.
Forest area with management plan
Areas under approved Management Plans for 10/20 years aiming to achieve defined management goals.
Other general comments to the table Data taken mainly from FD data sources and National Forest and Tree Resources Assessment 2005-2007. Hail Haor is excluded from the list of PAs since it does not belong to the PA under forest categories.

FRA 2010 – Country Report, Bangladesh
30
4 Table T4 – Forest characteristics
4.1 FRA 2010 Categories and definitions
Term / category Definition Naturally regenerated forest Forest predominantly composed of trees established through natural
regeneration. Introduced species A species, subspecies or lower taxon, occurring outside its natural range
(past or present) and dispersal potential (i.e. outside the range it occupies naturally or could occupy without direct or indirect introduction or care by humans).
Characteristics categories Primary forest Naturally regenerated forest of native species, where there are no clearly
visible indications of human activities and the ecological processes are not significantly disturbed.
Other naturally regenerated forest Naturally regenerated forest where there are clearly visible indications of human activities.
Other naturally regenerated forest of introduced species (sub-category)
Other naturally regenerated forest where the trees are predominantly of introduced species.
Planted forest Forest predominantly composed of trees established through planting and/or deliberate seeding.
Planted forest of introduced species (sub-category)
Planted forest, where the planted/seeded trees are predominantly of introduced species.
Special categories Rubber plantations Forest area with rubber tree plantations.
Mangroves Area of forest and other wooded land with mangrove vegetation.
Bamboo Area of forest and other wooded land with predominant bamboo
vegetation.
4.2 National data
4.2.1 Data sources
References to sources of information
Quality (H/M/L)
Variable(s) Year(s) Additional comments
National Forest and Tree Resources Assessment 2005-2007
H
Landuse area, Growing stock, Biodiversity and regeneration, Social and Economic products/ services, Biomass & carbon
2005-2007
Natural mangrove forests is considered as primary forest; Hill and Sal forests are considered as other naturally regenerated forests.
FMP, 1993. Forestry Master Plan, Ministry of Environment and Forest, Government of Bangladesh.
M Characteristics 1985, 1990, 1991 and
FMP, 1993. Forestry Master Plan, Ministry of Environment and Forest, Government of Bangladesh. GOB (Government

FRA 2010 – Country Report, Bangladesh
31
GOB (Government of Bangladesh) 1993. Asian Development Bank (UNDP/FAO/BGD/88/025). Main and supporting volumes
1992 of Bangladesh) 1993. Asian Development Bank (UNDP/FAO/BGD/88/025). Main and supporting volumes
ANON, 2004. Office Letter of BFIDC, No. 455 Dated : 19-12-2004.
M Rubber Plantations
2004 ANON, 2004. Office Letter of BFIDC, No. 455 Dated : 19-12-2004.
4.2.2 Classification and definitions
National class Definition
Naturally regenerated forest
Forest predominantly composed of trees established through natural regeneration.
Introduced species A species, subspecies or lower taxon, occurring outside its natural range (past or present) and dispersal potential (i.e. outside the range it occupies naturally or could occupy without direct or indirect introduction or care by humans).
Primary forest Naturally regenerated forest of native species, where there are no clearly visible indications of human activities and the ecological processes are not significantly disturbed.
Other naturally regenerated forest
Naturally regenerated forest where there are clearly visible indications of human activities.
Other naturally regenerated forest of introduced species (sub-category)
Other naturally regenerated forest where the trees are predominantly of introduced species.
Planted forest Forest predominantly composed of trees established through planting and/or deliberate seeding.
Planted forest of introduced species (sub-category)
Planted forest, where the planted/seeded trees are predominantly of introduced species.
Special categories
Rubber plantations Forest area with rubber tree plantations. Mangroves Area of forest and other wooded land with mangrove vegetation.
Bamboo Area of forest and other wooded land with predominant bamboo vegetation.
4.2.3 Original data
Area in 000 ha Plantations 1990 2000 2005 Protective Plantations
Teknaf GR 2.40 2.40 2.40 Chunati WS 1.45 1.45 1.45 Sundarbans 0.26 0.22 0.22
Costal Afforestation 61.64 76.53 79.50 Sub Total 65.75 80.60 83.56
Productive plantation (Total less protective) 173.04 194.61 194.55 Total Plantation 238.79 270.74 278.11

FRA 2010 – Country Report, Bangladesh
32
4.3 Analysis and processing of national data
4.3.1 Calibration
4.3.2 Estimation and forecasting
Same figure on primary forest (from NFMA 2005-2007) has been considered for all the reference years. Total forest area as coming from T1, less primary forest and planted forest has been considered as other naturally regenerated forest. For mangroves estimates for 1990, 2000 and 2005 have been taken from the FAO Mangroves study that used as original sources the following two reference documents: -1981 Ibid Combined National Level Mangrove Estimate based on remote sensing studies. -1995 Ibid Combined National Level Mangrove Estimate based on remote sensing studies Estimates for bamboo for 2010 comes from the NFMA while for the other reference year, the FRA 2005 Thematic study on bamboo was used.
4.3.3 Reclassification into FRA 2010 categories
4.4 Data for Table T4
Table 4a Forest Characteristics
Forest area (1000 hectares) FRA 2010 Categories
1990 2000 2005 2010 Primary forest 436 436 436 436 Other naturally regenerated forest 819 761 741 769 ...of which of introduced species n.a. n.a. n.a. n.a. Planted forest 239 271 278 237 ...of which of introduced species n.a. n.a. n.a. 40 TOTAL 1494 1468 1455 1442
Table 4b
Area (1000 hectares) FRA 2010 Categories
1990 2000 2005 2010 Rubber plantations (Forest) 20 35 35 8 Mangroves (Forest and OWL) 460 476 476 504 Bamboo (Forest and OWL) 90 86 83 186
4.5 Comments to Table T4
Variable / category
Comments related to data, definitions, etc.
Comments on the reported trend
Primary forest The forests under naturally regenerated forest with native species and the ecological process are not significantly disturbed but some degrees of human interventions are visible.
Reported for the first time

FRA 2010 – Country Report, Bangladesh
33
Other naturally regenerating forest
All natural forests, except primary forests, includes hill forests, sal forests and bamboo or mixed bamboo/broad-leaved forests
Planted forest All plantations including long rotation, short rotation, mangrove plantations and rubber plantation areas.
Long rotation plantations cover almost 10% of total forest area. Trend of forest area within this category may not be realistic due to necessary adjustment that was made to the forest area figures because of differences in the datasets
Rubber plantations
All Rubber plantation area Also the trend in rubber plantations does not look very realistic, due to differences in the datasets.
Mangroves All natural and plantation Mangroves and Swamp with shrubs. Hill forests and Mangrove forests cover more than 2/3 of total forest area.
Bamboo All bamboo or mixed bamboo/broad-leaved forests and Shrub lands
Bamboo covers almost 13% of the total forest area
Other general comments to the table Figures adopted from 'National Forest and Tree Resources Assessment 2005-2007'.

FRA 2010 – Country Report, Bangladesh
34
5 Table T5 – Forest establishment and regeneration
5.1 FRA 2010 Categories and definitions
Term Definition Afforestation Establishment of forest through planting and/or deliberate seeding on
land that, until then, was not classified as forest. Reforestation Re-establishment of forest through planting and/or deliberate seeding on
land classified as forest. Natural expansion of forest Expansion of forests through natural succession on land that, until then,
was under another land use (e.g. forest succession on land previously used for agriculture).
5.2 National data
5.2.1 Data sources
References to sources of information
Quality (H/M/L)
Variable(s) Year(s) Additional comments
Forest Department Reports
M area 2008
5.2.2 Classification and definitions
National class Definition
As per FAO definitions
5.2.3 Original data
5.3 Analysis and processing of national data
5.3.1 Calibration
5.3.2 Estimation and forecasting
5.3.3 Reclassification into FRA 2010 categories
5.4 Data for Table T5
Annual forest establishment (hectares/year)
...of which of introduced species1) (hectares/year)
FRA 2010 Categories
1990 2000 2005 2010 1990 2000 2005 2010 Afforestation n.a. n.a. n.a. 5000 n.a. n.a. n.a. n.a.Reforestation n.a. n.a. n.a. 10000 n.a. n.a. n.a. 8000 ...of which on areas previously planted
n.a. n.a. n.a. 5000 n.a. n.a. n.a. 4000
Natural expansion of forest n.a. n.a. n.a. 427 n.a. n.a. n.a. n.a.
Note: The figures for the reporting years refer to the averages for the 5-year periods 1988-1992, 1998-2002 and 2003-2007 respectively.

FRA 2010 – Country Report, Bangladesh
35
5.5 Comments to Table T5
Variable / category
Comments related to data, definitions, etc.
Comments on the reported trend
Afforestation Definition adopted from FAO guidelines Report generated for the first time
Reforestation Second rotation plantation and plantation in the degraded forest areas
Natural expansion of forest
Natural succession in newly accreted land.
Other general comments to the table The category under natural expansion of forest is mainly considered the newly accreted land with natural succession in the mangrove forests of Sundarbans.

FRA 2010 – Country Report, Bangladesh
36
6 Table T6 – Growing stock
6.1 FRA 2010 Categories and definitions
Category Definition Growing stock Volume over bark of all living trees more than X cm in diameter at breast
height (or above buttress if these are higher). Includes the stem from ground level or stump height up to a top diameter of Y cm, and may also include branches to a minimum diameter of W cm.
Growing stock of commercial species
Growing stock (see def. above) of commercial species.
6.2 National data
6.2.1 Data sources
References to sources of information
Quality (H/M/L)
Variable(s) Year(s) Additional comments
NFA 2005-2007 H Landuse area, Growing stock, Biodiversity and regeneration, Social and Economic products/ services, Biomass & carbon
2005-2007
Growing stock based on the National Forest and Tree Resources Assessment 2005-2007
6.2.2 Classification and definitions
There no national definitions and classification relevant to this table.
National class Definition
As per FAO definitions
FRA 2010 – Country Report, Bangladesh
37
6.2.3 Original data
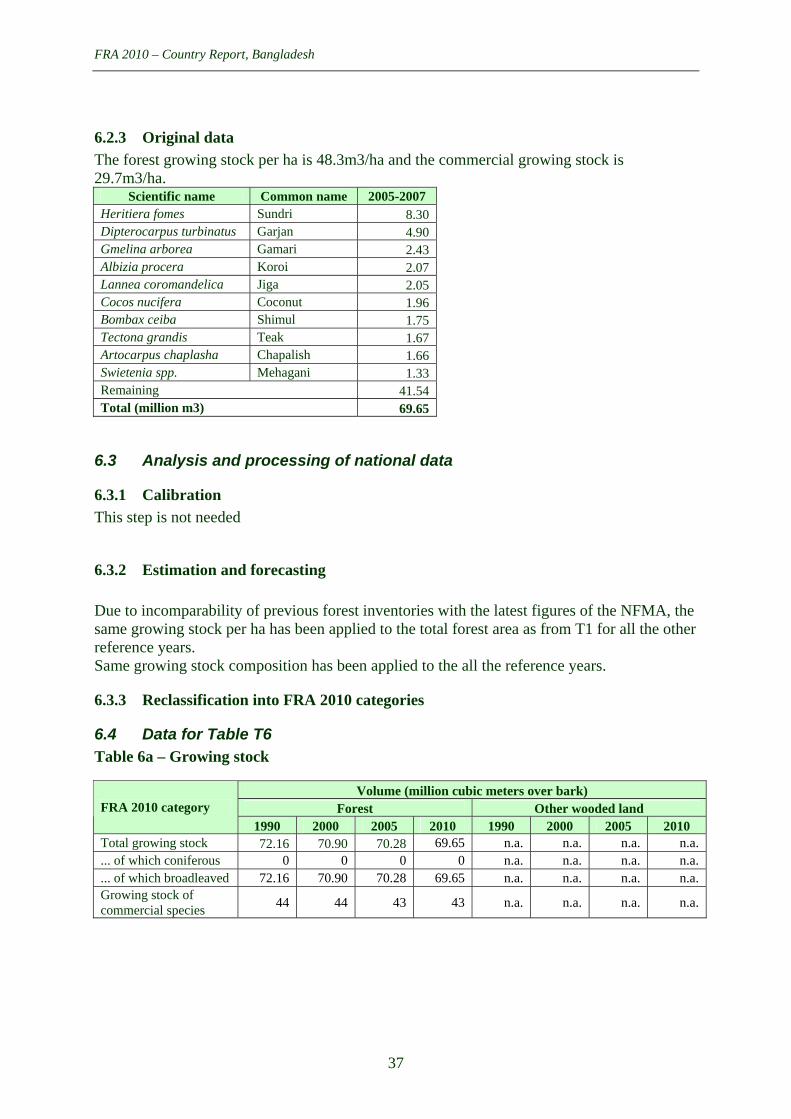
The forest growing stock per ha is 48.3m3/ha and the commercial growing stock is 29.7m3/ha.
Scientific name Common name 2005-2007 Heritiera fomes Sundri 8.30 Dipterocarpus turbinatus Garjan 4.90 Gmelina arborea Gamari 2.43 Albizia procera Koroi 2.07 Lannea coromandelica Jiga 2.05 Cocos nucifera Coconut 1.96 Bombax ceiba Shimul 1.75 Tectona grandis Teak 1.67 Artocarpus chaplasha Chapalish 1.66 Swietenia spp. Mehagani 1.33 Remaining 41.54 Total (million m3) 69.65
6.3 Analysis and processing of national data
6.3.1 Calibration
This step is not needed
6.3.2 Estimation and forecasting
Due to incomparability of previous forest inventories with the latest figures of the NFMA, the same growing stock per ha has been applied to the total forest area as from T1 for all the other reference years. Same growing stock composition has been applied to the all the reference years.
6.3.3 Reclassification into FRA 2010 categories
6.4 Data for Table T6 Table 6a – Growing stock
Volume (million cubic meters over bark) Forest Other wooded land FRA 2010 category
1990 2000 2005 2010 1990 2000 2005 2010 Total growing stock 72.16 70.90 70.28 69.65 n.a. n.a. n.a. n.a. ... of which coniferous 0 0 0 0 n.a. n.a. n.a. n.a.... of which broadleaved 72.16 70.90 70.28 69.65 n.a. n.a. n.a. n.a.Growing stock of commercial species
44 44 43 43 n.a. n.a. n.a. n.a.

FRA 2010 – Country Report, Bangladesh
38
Table 6b – Growing stock of the 10 most common species
FRA 2010 category / Species name Growing stock in forest (million cubic meters)
Rank Scientific name Common name 1990 2000 2005 1st Heritiera fomes Sundri 8.59 8.45 8.37 2nd Dipterocarpus turbinatus Garjan 5.07 4.98 4.94 3rd Gmelina arborea Gamari 2.52 2.48 2.45 4th Albizia procera Koroi 2.15 2.11 2.09 5th Lannea coromandelica Jiga 2.12 2.08 2.07 6th Cocos nucifera Coconut 2.03 2.00 1.98 7th Bombax ceiba Shimul 1.81 1.78 1.77 8th Tectona grandis Teak 1.73 1.70 1.69 9th Artocarpus chaplasha Chapalish 1.72 1.69 1.67 10th Swietenia spp. Mehagani 1.38 1.35 1.34 Remaining 43.04 42.28 41.91 TOTAL 72.16 70.90 70.28
Note: Rank refers to the order of importance in terms of growing stock, i.e. 1st is the species with the highest growing stock. Year 2000 is the reference year for defining the species list and the order of the species. Table 6c – Specification of threshold values Item Value Complementary information Minimum diameter (cm) at breast height1 of trees included in growing stock (X) 5 cm
In NFA 2005-2007, 10cm diameter at breast height was adopted
Minimum diameter (cm) at the top end of stem for calculation of growing stock (Y) 10 cm
For gross volume total height was taken whereas for commercial height upto 10 cm or up to the branching was taken
Minimum diameter (cm) of branches included in growing stock (W) 20 cm
10 cm
Volume refers to “above ground” (AG) or “above stump” (AS) AS
Above ground volume is calculated
6.5 Comments to Table T6 Variable / category
Comments related to data, definitions, etc.
Comments on the reported trend
Total growing stock
Volume over bark of all living trees more than 10 cm in diameter at breast height.
Growing stock is increasing. The NFA 2005-07 represents the entire country while the previous data calibrated from different management inventories
Growing stock of broadleaved / coniferous
Gross volume enumerated in NFA 2005-07 represents broadleaved forests only
Growing stock of commercial species
growing stock for commercial species is similar to total growing stock
Growing stock composition
Other general comments to the table Total growing stock corresponds to the growing stock of commercial species. Growing stock for Other Wooded Land (OWL) has not been enumerated during NFA2005-2007.
1 Diameter at breast height (DBH) refers to diameter over bark measured at a height of 1.30 m above ground level or 30 cm above buttresses if these are higher than 1 m.
FRA 2010 – Country Report, Bangladesh
39
7 Table T7 – Biomass stock
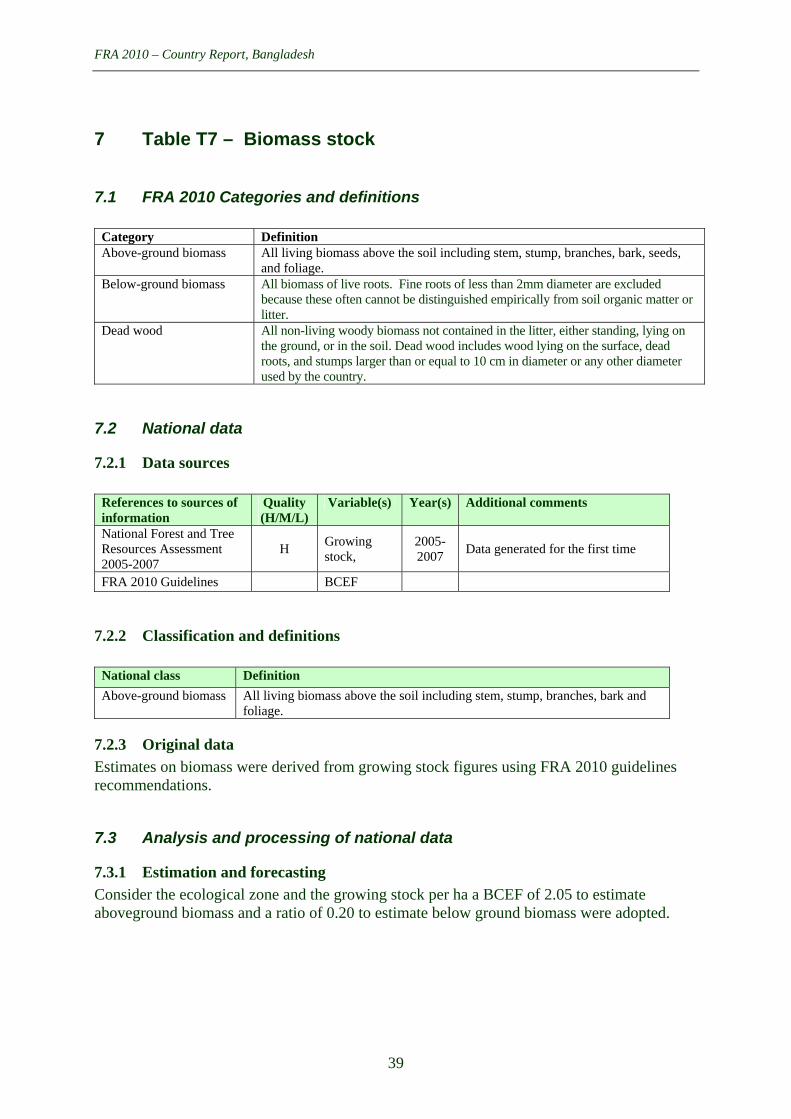
7.1 FRA 2010 Categories and definitions
Category Definition Above-ground biomass All living biomass above the soil including stem, stump, branches, bark, seeds,
and foliage. Below-ground biomass All biomass of live roots. Fine roots of less than 2mm diameter are excluded
because these often cannot be distinguished empirically from soil organic matter or litter.
Dead wood All non-living woody biomass not contained in the litter, either standing, lying on the ground, or in the soil. Dead wood includes wood lying on the surface, dead roots, and stumps larger than or equal to 10 cm in diameter or any other diameter used by the country.
7.2 National data
7.2.1 Data sources
References to sources of information
Quality (H/M/L)
Variable(s) Year(s) Additional comments
National Forest and Tree Resources Assessment 2005-2007
H Growing stock,
2005-2007
Data generated for the first time
FRA 2010 Guidelines BCEF
7.2.2 Classification and definitions
National class Definition
Above-ground biomass All living biomass above the soil including stem, stump, branches, bark and foliage.
7.2.3 Original data
Estimates on biomass were derived from growing stock figures using FRA 2010 guidelines recommendations.
7.3 Analysis and processing of national data
7.3.1 Estimation and forecasting
Consider the ecological zone and the growing stock per ha a BCEF of 2.05 to estimate aboveground biomass and a ratio of 0.20 to estimate below ground biomass were adopted.

FRA 2010 – Country Report, Bangladesh
40
7.4 Data for Table T7
Biomass (million metric tonnes oven-dry weight) Forest Other wooded land FRA 2010 category
1990 2000 2005 2010 1990 2000 2005 2010 Above-ground biomass 148 145 144 143 n.a. n.a. n.a. n.a.Below-ground biomass 30 29 29 29 n.a. n.a. n.a. n.a.Dead wood n.a. n.a. n.a. n.a. n.a. n.a. n.a. n.a.
TOTAL n.a. n.a. n.a. n.a. n.a. n.a. n.a. n.a.
7.5 Comments to Table T7
Variable / category
Comments related to data, definitions, etc.
Comments on the reported trend
Above-ground biomass
In NFA 2005-2007, Above ground biomass is calculated using 'Brown and Lugo 1992' formula
Data generated for the first time
Below-ground biomass
Dead wood
Other general comments to the table Next NFA may include parameters like below ground biomass, dead wood biomass and biomass for OWL.

FRA 2010 – Country Report, Bangladesh
41
8 Table T8 – Carbon stock
8.1 FRA 2010 Categories and definitions
Category Definition Carbon in above-ground biomass Carbon in all living biomass above the soil, including stem, stump,
branches, bark, seeds, and foliage. Carbon in below-ground biomass Carbon in all biomass of live roots. Fine roots of less than 2 mm diameter
are excluded, because these often cannot be distinguished empirically from soil organic matter or litter.
Carbon in dead wood Carbon in all non-living woody biomass not contained in the litter, either standing, lying on the ground, or in the soil. Dead wood includes wood lying on the surface, dead roots, and stumps larger than or equal to 10 cm in diameter or any other diameter used by the country.
Carbon in litter Carbon in all non-living biomass with a diameter less than the minimum diameter for dead wood (e.g. 10 cm), lying dead in various states of decomposition above the mineral or organic soil.
Soil carbon Organic carbon in mineral and organic soils (including peat) to a specified depth chosen by the country and applied consistently through the time series.
8.2 National data
8.2.1 Data sources
References to sources of information
Quality (H/M/L)
Variable(s) Year(s) Additional comments
National Forest and Tree Resources Assessment 2005-2007
H Growing stock,
2005-2007
Data generated for the first time
8.2.2 Classification and definitions
National class Definition
Carbon in above-ground biomass
Carbon in all living biomass above the soil, including stem, stump, branches, bark, and foliage.
8.2.3 Original data
No original data on carbon were available, so the default value of 0.47 has been used to convert biomass figures into carbon. Furthermore following FRA 2010 specification, a default value of 2.1t/ha of carbon in litter has been applied.

FRA 2010 – Country Report, Bangladesh
42
8.3 Data for Table T8
Carbon (Million metric tonnes) Forest Other wooded land
FRA 2010 Category
1990 2000 2005 2010 1990 2000 2005 2010 Carbon in above-ground biomass
70 68 68 67 n.a. n.a. n.a. n.a.
Carbon in below-ground biomass
14 14 14 13 n.a. n.a. n.a. n.a.
Sub-total: Living biomass
83 82 81 81 n.a. n.a. n.a. n.a.
Carbon in dead wood
n.a. n.a. n.a. n.a. n.a. n.a. n.a. n.a.
Carbon in litter 3.14 3.08 3.06 3.03 n.a. n.a. n.a. n.a.Sub-total: Dead wood and litter
n.a. n.a. n.a. n.a. n.a. n.a. n.a. n.a.
Soil carbon n.a. n.a. n.a. n.a. n.a. n.a. n.a. n.a.TOTAL n.a. n.a. n.a. n.a. n.a. n.a. n.a. n.a.
Soil depth (cm) used for soil carbon estimates n/a
8.4 Comments to Table T8
Variable / category
Comments related to data, definitions, etc.
Comments on the reported trend
Carbon in above-ground biomass
Carbon in all living biomass above the soil, including stem, stump, branches, bark, and foliage.
Data generated for the first time
Carbon in below-ground biomass
not available not applicable
Carbon in dead wood
not available not applicable
Carbon in litter not available not applicable
Soil carbon not available not applicable
Other general comments to the table Next NFA may include other necessary relevant parameters.

FRA 2010 – Country Report, Bangladesh
43
9 Table T9 – Forest fires
9.1 FRA 2010 Categories and definitions
Category Definition Number of fires Average number of vegetation fires per year in the country. Area affected by fire Average area affected by vegetation fires per year in the country. Vegetation fire (supplementary term)
Any vegetation fire regardless of ignition source, damage or benefit.
Wildfire Any unplanned and/or uncontrolled vegetation fire. Planned fire A vegetation fire regardless of ignition source that burns according to
management objectives and requires limited or no suppression action.
9.2 National data
9.2.1 Data sources
References to sources of information
Quality (H/M/L)
Variable(s) Year(s) Additional comments
National Forest and Tree Resources Assessment 2005-2007
H Biosocial 2005-2007
Data generated for the first time
9.2.2 Classification and definitions
National class Definition
Wild fire Fire due to unknown reasons.
9.3 Data for Table T9
Table 9a
Annual average for 5-year period 1990 2000 2005 2010
FRA 2010 category
1000 hectares
number of fires
1000 hectares
number of fires
1000 hectares
number of fires
1000 hectares
number of fires
Total land area affected by fire
n.a. n.a. n.a. n.a. n.a. n.a. 56 n.a.
... of which on forest
n.a. n.a. n.a. n.a. n.a. n.a. 56 n.a.
... of which on other wooded land
n.a. n.a. n.a. n.a. n.a. n.a. n.a. n.a.
... of which on other land
n.a. n.a. n.a. n.a. n.a. n.a. n.a. n.a.
Table 9b
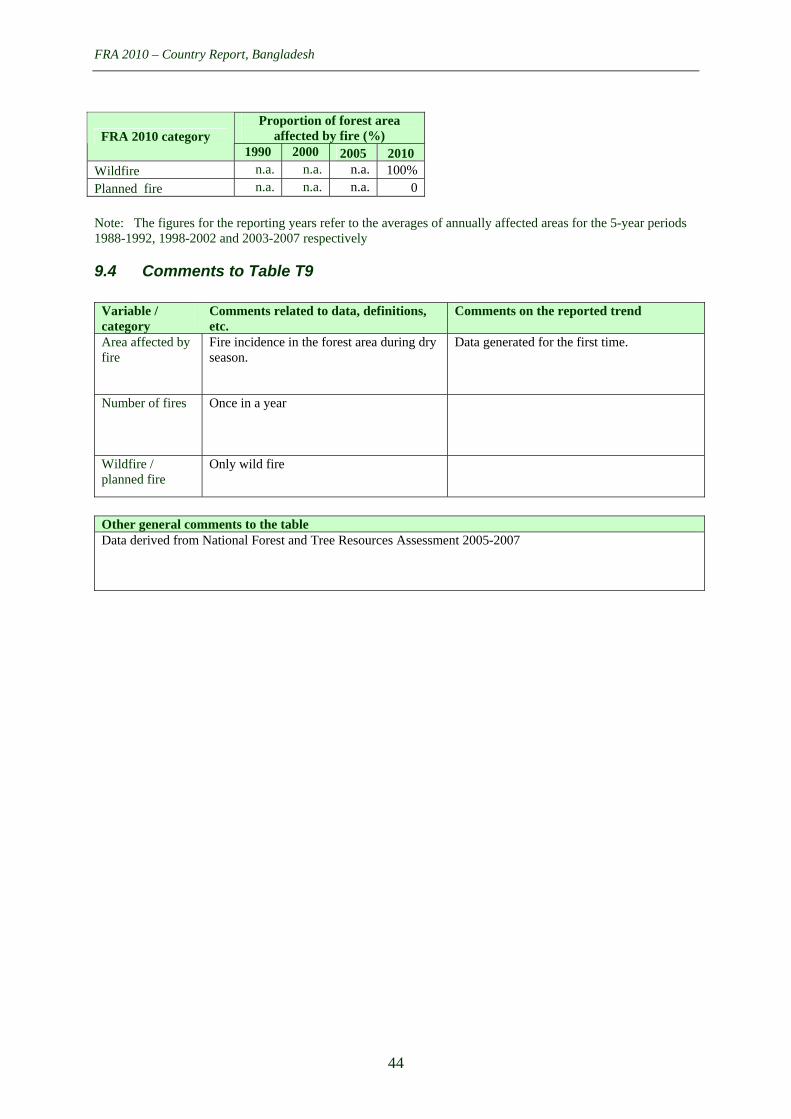
FRA 2010 – Country Report, Bangladesh
44
Proportion of forest area
affected by fire (%) FRA 2010 category 1990 2000 2005 2010
Wildfire n.a. n.a. n.a. 100%
Planned fire n.a. n.a. n.a. 0
Note: The figures for the reporting years refer to the averages of annually affected areas for the 5-year periods 1988-1992, 1998-2002 and 2003-2007 respectively
9.4 Comments to Table T9
Variable / category
Comments related to data, definitions, etc.
Comments on the reported trend
Area affected by fire
Fire incidence in the forest area during dry season.
Data generated for the first time.
Number of fires Once in a year
Wildfire / planned fire
Only wild fire
Other general comments to the table Data derived from National Forest and Tree Resources Assessment 2005-2007

FRA 2010 – Country Report, Bangladesh
45
10 Table T10 – Other disturbances affecting forest health and vitality
10.1 FRA 2010 Categories and definitions
Term Definition
Disturbance Damage caused by any factor (biotic or abiotic) that adversely affects the vigour and productivity of the forest and which is not a direct result of human activities.
Invasive species Species that are non-native to a particular ecosystem and whose introduction and spread cause, or are likely to cause, socio-cultural, economic or environmental harm or harm to human health.
Category Definition
Disturbance by insects Disturbance caused by insect pests.
Disturbance by diseases Disturbance caused by diseases attributable to pathogens, such as bacteria, fungi, phytoplasma or virus.
Disturbance by other biotic agents
Disturbance caused by biotic agents other than insects or diseases, such as wildlife browsing, grazing, physical damage by animals, etc.
Disturbance caused by abiotic factors
Disturbances caused by abiotic factors, such as air pollution, snow, storm, drought, etc.
10.2 National data
10.2.1 Data sources
References to sources of information
Quality (H/M/L)
Variable(s) Year(s) Additional comments
Anon. 2004. Office record of Bangladesh Forest department and Bangladesh Forest Research Institute. Bangladesh.
M Insect and Disease
2000
National Forest and Tree Resources Assessment 2005-2007
H Bio-social 2005-2007
Banik, 2004. Bangladesher Sundarban
M Top dying of Sundri
2004
Report mainly based on NFA2005-2007 and Banik, 2004.
10.2.2 Classification and definitions
No national classification or definitions relevant to this table are available.
National class Definition
Adopted from FAO definitions

FRA 2010 – Country Report, Bangladesh
46
Table 10a – Disturbances
Affected forest area (1000 hectares) FRA 2010 category 1990 2000 2005 Disturbance by insects n.a. 0.073 146 Disturbance by diseases n.a. 0.006 n.a. Disturbance by other biotic agents n.a. n.a. n.a. Disturbance caused by abiotic factors n.a. n.a. n.a. Total area affected by disturbances n.a. n.a. n.a.
Notes: The figures for the reporting years refer to the averages of annually affected areas for the 5-year periods
1988-1992, 1998-2002 and 2003-2007 respectively.
The total area affected by disturbances is not necessarily the sum of the individual disturbances as these may be overlapping.
Table 10b – Major outbreaks of insects and diseases affecting forest health and vitality
Description / name Tree species or genera affected
(scientific name) Year(s) of
latest outbreak
Area affected
(1000 hectares)
If cyclic, approx. cycle
(years) Top dying of Sundri Heretiera fomes 1996 0.07274 n/a Loranthus Gmelina arborea 1995 0.006 n/a
Note: Area affected refers to the total area affected during the outbreak. Table 10c – Area of forest affected by woody invasive species
Scientific name of woody invasive species Forest area
affected 2005 (1000 hectares)
Forest area affected 2010
(1000 hectares) Data not available n/a n/a
Total forest area affected by woody invasive species Note: The total forest area affected by woody invasive species is not necessary the sum of the values above, as
these may be overlapping.

FRA 2010 – Country Report, Bangladesh
47
10.3 Comments to Table T10
Variable / category
Comments related to data, definitions, etc.
Comments on the reported trend
Disturbance by insects
For 2005 separated data on disturbance by disease are not available and they are included in the insects category
Disturbance by diseases
Disturbance by other biotic agents
Disturbance caused by abiotic factors
Major outbreaks Top-dying of Sundri Infestation of Loranthus on Gmelina arborea
Invasive species Data not available
Other general comments to the table Data for 2005 was derived from 'National Forest and Tree Resources Assessment 2005-2007' which states that 10% of the forest is affected by pests.

FRA 2010 – Country Report, Bangladesh
48
11 Table T11 – Wood removals and value of removals
11.1 FRA 2010 Categories and definitions
Category Definition Industrial roundwood removals
The wood removed (volume of roundwood over bark) for production of goods and services other than energy production (woodfuel).
Woodfuel removals
The wood removed for energy production purposes, regardless whether for industrial, commercial or domestic use.
11.2 National data
11.2.1 Data sources
References to sources of information
Quality (H/M/L)
Variable(s) Year(s) Additional comments
Forest Department M 2008
11.2.2 Classification and definitions
National class Definition
As per FAO definitions
11.2.3 Original data
A five year average has been calculated for 1990. The averaged 1990 figure along with 2004 original figure has been used for linear interpolation and extrapolation to estimate and forecast figures for 2000 and 2005.
Wood Removal in “000”m3 Category 1990 2000 2005 Industrial wood 240 249 253 Wood fuel 562 865 1016 Total 802 1113 1269
11.3 Analysis and processing of national data
11.3.1 Calibration
11.3.2 Estimation and forecasting

FRA 2010 – Country Report, Bangladesh
49
11.3.3 Reclassification into FRA 2010 categories
11.4 Data for Table T11 Industrial roundwood
removals Woodfuel removals
FRA 2010 Category 1990 2000 2005 1990 2000 2005
Total volume (1000 m3 o.b.) 240 249 253 562 865 1016 ... of which from forest Unit value (local currency / m3 o.b.) n.a. n.a. n.a. n.a. n.a. n.a. Total value (1000 local currency) n.a. n.a. n.a. n.a. n.a. n.a.
Note: The figures for the reporting years refer to the averages for the 5-year periods 1988-1992, 1998-2002
and 2003-2007 respectively. 1990 2000 2005 2010 Name of local currency Taka
11.5 Comments to Table T11
Variable / category
Comments related to data, definitions, etc.
Comments on the reported trend
Total volume of industrial roundwood removals
Amount of Round wood removal from all over the country
Data generate for the first time. These figures and those related to woodfuel removals are substantially different from FAOSTAT.
Total volume of woodfuel removals
Amount of Woodfuel removal from all over the country
Unit value Average auction price of roundwood and wood fuel.
Total value Total value of roundwood and woodfuel
Other general comments to the table Desired parameters may be included in the next NFA

FRA 2010 – Country Report, Bangladesh
50
12 Table T12 – Non-wood forest products removals and value of removals
12.1 FRA 2010 Categories and definitions
Term Definition Non-wood forest product (NWFP)
Goods derived from forests that are tangible and physical objects of biological origin other than wood.
Value of NWFP removals For the purpose of this table, value is defined as the market value at the site of collection or forest border.
NWFP categories
Category Plant products / raw material 1. Food 2. Fodder 3. Raw material for medicine and aromatic products 4. Raw material for colorants and dyes 5. Raw material for utensils, handicrafts & construction 6. Ornamental plants 7. Exudates 8. Other plant products Animal products / raw material 9. Living animals 10. Hides, skins and trophies 11. Wild honey and bee-wax 12. Wild meat 13. Raw material for medicine 14. Raw material for colorants 15. Other edible animal products 16. Other non-edible animal products
12.2 National data
12.2.1 Data sources
References to sources of information
Quality (H/M/L)
Variable(s) Year(s) Additional comments
National Forest and Tree Resources Assessment 2005-2007
H 2005-2007
Considered important NWFPs.
12.2.2 Classification and definitions
National class Definition
Non-wood forest product (NWFP)
Goods derived from forests that are tangible and physical objects of biological origin other than wood.

FRA 2010 – Country Report, Bangladesh
51
12.3 Data for Table T12
NWFP removals 2010
Rank Name of product
Key species Unit Quantity
Value (1000 local
currency)
NWFP category
1st Fruits Mangifera indica n/a n/a n/a 1
2nd
Construction materials from Bamboo, Rattan and Murta
Mabmusa spp., Calamus spp, Schumannianthus dochotoma
n/a n/a n/a 5
3rd Bamboo Mabmusa spp., n/a n/a n/a 5 4th Wheel of cart Acacia nilotica n/a n/a n/a 5
5th Myrobalans Amblica officinalis n/a n/a n/a 3
6th Uri grass Uri grass n/a n/a n/a 2
7th Utensils and handicrafts
Bamboo, Rattan and Murta n/a n/a n/a 5
8th Date and Palm juice
Phoenix sylvestris Borasus flabilifar
n/a n/a n/a 7
9th Natural dyes
Diospyras peregrira (Gab), Syzygium cumini (Jam), Terminalia chebula (Horitoki)
n/a n/a n/a 4
10th Aromatic products
Shorea robusta n/a n/a n/a 3
All other plant products n/a
All other animal products n/a
TOTAL n/a
2005 2010 Name of local currency Taka 1 US$ = 69 BDTaka
12.4 Comments to Table T12
Variable / category Comments related to data, definitions, etc. 10 most important products Based on the NFA 2005-2007 data.
Other plant products n/a Other animal products n/a Value by product n/a Total value n/a
Other general comments to the table Categorized national data not available.

FRA 2010 – Country Report, Bangladesh
52
13 Table T13 – Employment
13.1 FRA 2010 Categories and definitions
Category Definition Full-time equivalents (FTE)
A measurement equal to one person working full-time during a specified reference period.
Employment Includes all persons in paid employment or self-employment. Paid employment Persons who during a specified reference period performed some work for
wage or salary in cash or in kind. Self-employment Persons who during a specified reference period performed some work for
profit or family gain in cash or in kind (e.g. employers, own-account workers, members of producers' cooperatives, contributing family workers).
13.2 National data
13.2.1 Data sources
References to sources of information Quality
(H/M/L) Variable(s) Year(s) Additional
comments FMP, 1993. Forestry Master Plan, Ministry of Environment and Forest, Government of Bangladesh. GOB.1993. Asian Development Bank (UNDP/FAO/BGD/88/025). Main and supporting volumes.
M Extent 1985, 1990, 1991, 1992
Statistical yearbook of Bangladesh 2000 M Employed persons in forestry and related services
2000
13.2.2 Classification and definitions
National class Definition
Employment in primary production of goods
Employment derived from forestry activities
...of which paid employment Persons work in forests and forest industries etc on payment basis;
...of which self-employment persons engaged in forestry activities in own enterprise, nursery etc.
Employment in management of protected areas
Employment in activities related to management of protected areas within the forests.
13.2.3 Original data
The FMP (1993) estimates that at the 1990 level of primary activities, the forest land annually provides employment to about 97,900 persons or about 0.1109 person years per ha.

FRA 2010 – Country Report, Bangladesh
53
13.2.4 Estimation and forecasting
The total number of employment on forest land in 2000 has been calculated assuming same level of activities (or number of persons per ha) as in 1990. Variable 1990 Forest land (000 ha) 882 Per ha person year employment 0.1109 Employment on forest land in "000" 97.9
This total employment has been apportioned to the employment relating to the “provision of services” on the basis of percentage of area under conservation of biodiversity (Table T3) to total area of forest in 1990 which is about 20.6%. The rest of the employment has been apportioned to the employment relating to the “production of goods”. The figure of 116 from the Statistical Yearbook of Bangladesh has been used to estimate forest employment in 2000 and in 2005. The 20% of employment related to the provision of service has been deducted and this figure has been also used for 2005, since there was a lack of reliable updated figures.
13.2.5 Reclassification into FRA 2010 categories
13.3 Data for Table T13
Employment (1000 years FTE) FRA 2010 Category
1990 2000 2005 Employment in primary production of goods
77.7 93 93
...of which paid employment 77.7 93 93
...of which self-employment Employment in management of protected areas
n.a. n.a. n.a.
13.4 Comments to Table T13
Variable / category
Comments related to data, definitions, etc.
Comments on the reported trend
Employment in primary production of goods
Employment derived from forestry activities
Data generated for the first time
Paid employment / self-employment
Paid employment: Who works in forests and forest industries etc on payment basis; Self-employment: persons engaged in forestry activities in own enterprise, nursery etc.
Employment in forestry sector increasing
Employment in management of protected areas
Employment in activities related to management of protected areas within the forests.
Data generated for the first time
Other general comments to the table Category-wise data may be included in the future NFA

FRA 2010 – Country Report, Bangladesh
54
14 Table T14 – Policy and legal framework
14.1 FRA 2010 Categories and definitions
Term Definition Forest policy A set of orientations and principles of actions adopted by public authorities in
harmony with national socio-economic and environmental policies in a given country to guide future decisions in relation to the management, use and conservation of forest and tree resources for the benefit of society.
Forest policy statement
A document that describes the objectives, priorities and means for implementation of the forest policy.
National forest programme (nfp)
A generic expression that refers to a wide range of approaches towards forest policy formulation, planning and implementation at national and sub-national levels. The national forest programme provides a framework and guidance for country-driven forest sector development with participation of all stakeholders and in consistence with policies of other sectors and international policies.
Law (Act or Code) on forest
A set of rules enacted by the legislative authority of a country regulating the access, management, conservation and use of forest resources.
14.2 Data for Table T14
Indicate the existence of the following (2008)
Yes Forest policy statement with national scope
No
Year of endorsement 1994 If Yes above, provide:
Reference to document Forest Policy 1994
Yes National forest programme (nfp)
No
Name of nfp in country Forestry Sector Master Plan 1995-2015 Starting year 1995
In formulation
In implementation
Under revision Current status
Process temporarily suspended
If Yes above, provide:
Reference to document or web site
www.bforest.gov.bd
Yes, specific forest law exists
Yes, but rules on forests are incorpo-rated in other (broader) legislation Law (Act or Code) on forest with national scope
No, forest issues are not regulated by national legislation
Year of enactment The Forest Act, 1927 Bangladesh Wildlife (Preservation) Order 1973
Year of latest amendment The Forest (Amendment) Act 2000 Bangladesh Wildlife (Preservation)(Amendment) Act 1974
If Yes above, provide:
Reference to document Forest Act 1927 Bangladesh Wildlife (Preservation) Order 1973

FRA 2010 – Country Report, Bangladesh
55
In case the responsibility for forest policy- and/or forest law-making is decentralized, please indicate the existence of the following and explain in the comments below the table how the responsibility for forest policy- and law-making is organized in your country.
Yes Sub-national forest policy statements
No
If Yes above, indicate the number of regions/states/provinces with forest policy statements
Yes Sub-national Laws (Acts or Codes) on forest
No
If Yes above, indicate the number of regions/states/provinces with Laws on forests
14.3 Comments to Table T14
Variable / category Comments related to data, definitions, etc. Forest policy statement with national scope
Development of forestry sector guided by the National Forest Policy 1994, which is linked up with other national policies and development strategies.
National forest programme (nfp)
Forestry Sector Master Plan (1995-2015) states to increase forest cover upto 20% by the year 2015.
Law (Act or Code) on forest with national scope
A set of Forest Acts and Rules enacted for management and development of forests
Sub-national forest policy statements
Not needed
Sub-national Laws (Acts or Codes) on forest
Not needed
Other general comments to the table Employment in forestry sector increasing

FRA 2010 – Country Report, Bangladesh
56
15 Table T15 – Institutional framework
15.1 FRA 2010 Categories and definitions
Term Definition Minister responsible for forest policy-making
Minister holding the main responsibility for forest issues and the formulation of the forest policy.
Head of Forestry The Head of Forestry is the Government Officer responsible for implementing the mandate of the public administration related to forests.
Level of subordination Number of administrative levels between the Head of Forestry and the Minister. University degree Qualification provided by University after a minimum of 3 years of post
secondary education.
15.2 Data for Table T15 Table 15a – Institutions FRA 2010 Category 2008 Minister responsible for forest policy formulation : please provide full title
Minister Ministry of Environment and Forests Government of the Peoples' Republic of Bangladesh Bangladesh Secretariat, Dhaka
1st level subordination to Minister
2nd level subordination to Minister
3rd level subordination to Minister
Level of subordination of Head of Forestry within the Ministry
4th or lower level subordination to Minister Other public forest agencies at national level
Bangladesh National Herbarium Bangladesh Forest Research Institute (BFRI) Bangladesh Forest Industries Corporation (BFIDC)
Institution(s) responsible for forest law enforcement
Forest Department and Department of Police
Table 15b – Human resources
Human resources within public forest institutions 2000 2005 2008 FRA 2010 Category
Number %Female Number %Female Number %Female Total staff n.a. n.a. n.a. n.a. 12000 3%
...of which with university degree or equivalent
n.a. n.a. n.a. n.a. 500 10%
Notes: 1. Includes human resources within public forest institutions at sub-national level 2. Excludes people employed in State-owned enterprises, education and research, as well as temporary /
seasonal workers.

FRA 2010 – Country Report, Bangladesh
57
15.3 Comments to Table T15
Variable / category Comments related to data, definitions, etc. Comments on the reported trend
Minister responsible for forest policy formulation
Minister directly involved in formulation of forest policy
Level of subordination of Head of Forestry within the Ministry
Chief Conservator of Forests, with the rank and status of Additional Secretary to the Government
Other public forest agencies at national level
Under the Ministry of Environment and Forests
Institution(s) responsible for forest law enforcement
Forest Department and Department of Police are empowered to execute forest law.
Human resources within public forest institutions
Personnel employed in Forest Department
Other general comments to the table No institution at the sub-national level.

FRA 2010 – Country Report, Bangladesh
58
16 Table T16 – Education and research
16.1 FRA 2010 Categories and definitions
Term Definition Forest-related education Post-secondary education programme with focus on forests and related subjects. Doctor’s degree (PhD) University (or equivalent) education with a total duration of about 8 years. Master’s degree (MSc) or equivalent
University (or equivalent) education with a total duration of about five years.
Bachelor’s degree (BSc) or equivalent
University (or equivalent) education with a duration of about three years.
Technician certificate or diploma
Qualification issued from a technical education institution consisting of 1 to 3 years post secondary education.
Publicly funded forest research centers
Research centers primarily implementing research programmes on forest matters. Funding is mainly public or channelled through public institutions.
16.2 National data
16.2.1 Data sources
References to sources of information
Quality (H/M/L)
Variable(s) Year(s) Additional comments
Forest Department M 2008 Data generated for the first time
16.3 Data for Table T16
Graduation 1) of students in forest-related education 2000 2005 2008 FRA 2010 Category
Number %Female Number %Female Number %Female Master’s degree (MSc) or equivalent
n.a. n.a. n.a. 75 5%
Bachelor’s degree (BSc) or equivalent
n.a. n.a. n.a. n.a. 125 5%
Forest technician certificate / diploma
n.a. n.a. n.a. n.a. 150 1%
Professionals working in publicly funded forest research centres 2) 2000 2005 2008 FRA 2010 Category
Number %Female Number %Female Number %Female Doctor’s degree (PhD) n.a. n.a. n.a. n.a. 10 10% Master’s degree (MSc) or equivalent
n.a. n.a. n.a. n.a. 79 14%
Bachelor’s degree (BSc) or equivalent
n.a. n.a. n.a. n.a. 13 -
Notes:
1. Graduation refers to the number of students that have successfully completed a Bachelor’s or higher degree or achieved a certificate or diploma as forest technician.
2. Covers degrees in all sciences, not only forestry.

FRA 2010 – Country Report, Bangladesh
59
16.4 Comments to Table T16
Variable / category Comments related to data, definitions, etc.
Comments on the reported trend
Graduation of students in forest-related education
Forestry graduates from public Universities
Data generated for the first time
Professionals working in public forest research centres
Professionals from Bangladesh Forest Research Institute and Bangladesh National Herbarium
Other general comments to the table Other required variables may be included in the next NFA

FRA 2010 – Country Report, Bangladesh
60
17 Table T17 – Public revenue collection and expenditure
17.1 FRA 2010 Categories and definitions
Category Definition Forest revenue All government revenue collected from the domestic production and trade of
forest products and services. For this purpose, forest products include: roundwood; sawnwood; wood-based panels; pulp and paper; and non-wood forest products. As far as possible, this should include revenue collected by all levels of government (i.e. central, regional/provincial and municipal level), but it should exclude the income of publicly owned business entities.
Public expenditure All government expenditure on forest related activities (further defined below). Operational expenditure (sub-category to Public expenditure)
All government expenditure on public institutions solely engaged in the forest sector. Where the forest administration is part of a larger public agency (e.g. department or ministry), this should only include the forest sector component of the agency’s total expenditure. As far as possible, this should also include other institutions (e.g. in research, training and marketing) solely engaged in the forest sector, but it should exclude the expenditure of publicly owned business entities.
Transfer payments (sub-category to Public expenditure)
All government expenditure on direct financial incentives paid to non-government and private-sector institutions, enterprises communities or individuals operating in the forest sector to implement forest related activities.
Domestic funding
Public expenditure funded from domestic public financial resources, including: retained forest revenue; forest-related funds; and allocations from the national budget (i.e. from non-forest sector public revenue sources).
External funding
Public expenditure funded from grants and loans from donors, non-governmental organisations, international lending agencies and international organisations, where such funds are channelled through national public institutions.
17.2 National data
17.2.1 Data sources
References to sources of information
Quality (H/M/L)
Variable(s) Year(s) Additional comments
Forest Department M Budget and expenditure
2008 Data generated for the first time
17.2.2 Classification and definitions
National class Definition
Forest revenue Revenue collected by the Forest Department.
Public expenditure All government expenditure incurred by Forest Department.
17.3 Data for Table T17 Table 17a - Forest revenues
Revenues (1000 local currency) FRA 2010 Categories
2000 2005 2010 Forest revenue 734,735 Public expenditure 1680,000

FRA 2010 – Country Report, Bangladesh
61
Table 17b - Public expenditure in forest sector by funding source
Domestic funding (1000 local currency)
External funding (1000 local currency)
Total (1000 local currency) FRA 2010
Categories 2000 2005 2010 2000 2005 2010 2000 2005 2010
Operational expenditure
n.a. n.a. 1 480 000 n.a. n.a. 200 000 n.a. n.a. 1 680 000
Transfer payments
n.a. n.a. n.a. n.a. n.a. n.a. n.a. n.a.
Total public expenditure
n.a. n.a. 1 480 000 n.a. n.a. 200 000 n.a. n.a. 1 680 000
Reforestation Afforestation Forest inventory and/or planning Conservation of forest biodiversity Protection of soil and water Forest stand improvement Establishment or maintenance of protected areas
If transfer payments are made for forest management and conservation, indicate for what specific objective(s) - Please tick all that apply.
Other, specify below Training and Education MIS Development
17.4 Comments to Table T17
Variable / category Comments related to data, definitions, etc.
Comments on the reported trend
Forest revenue Revenue earned by selling forest produces and services by the Forest Department
Data generated for the first time 1 US $ = BDTK 69.0
Operational expenditure Expenditure incurred by Forest Department only
Transfer payments Not applicable Not applicable
Other general comments to the table The figure corresponds to the annual revenue earnings and operational expenditure of Forest Department.