bank handlowy w warszawie s.a. 2014 preliminary ... · 2014 preliminary consolidated financial...
TRANSCRIPT

Bank Handlowy w Warszawie S.A. 2014 Preliminary consolidated financial results
February 12th, 2015

2
Summary of 2014 in Citi Handlowy
Highlights:
• Distributable profit increase to PLN 971 MM (+4% YoY)
• Dynamic growth in loan (+10% YoY) and deposit volume (+12% YoY)
• High efficiency of the Bank – ROTE, ROE i ROA ratios above the sector
• High quality of assets and equity confirmed in stress test results on the assumption that dividend
payout ratio at 100% of 2014-2016 net income
• The lack of problems with CHF mortgage loans
Challenges:
• Historic low interest rates: reference rate (-50 bps YoY) and lombard rate (-100 bps YoY)
• Regulatory changes regarding interchange fee reduction

3
Institutional Banking – leader in strategic areas F
ina
nc
ial M
ark
ets
Implementing new
transactional platform
CitiFX Pro
Key transactions in
the capital market
Tra
nsa
cti
on
Ban
kin
g
#1 Top Cash Manager in Poland
in Euromoney Cash
Management Survey 2014
#1 DMBH - turnover in
the equity secondary
market
Market share
Turnover volume
Volume
+11% YoY
Market share
4% .
Trade
finance
Len
din
g a
cti
vit
y
Institutional customers’ loans
2010-2014 (PLN B):
● Shares and ETF
acquisition and
disposal on biggest
and foreign stock
exchange and FX
market instruments on
OTC
● Ivesmtent account
increase:
+7% YoY
Citi Handlowy supports strategic
projects:
6,9 9,6 11,0 9,9 10,9
2010 2011 2012 2013 2014
CAGR +16%
Sector +9%
Volume
+7% YoY
Revenue per card
+3% YoY
.
Card
products
Volume
+10% YoY
Market share
7% .
Foreign
transfers
Volume
+5% YoY
Market share
2% .
Local
transfers
A tender offer
for shares
PLN 4,1 B
Revolving credit
2 500 000 000 USD
Creditor
April 2014
in the contest of Ministry of
Finance
to be act as
Treasury Securities Dealer
Increase in
popularity
Volume
+8% YoY
#1 on the market
13% +0,6 p.p. YoY
PLN 55 B
Revolving credit
2 000 000 000 EUR
Refinance credit lines
and financing needs of
corporate
Acted as Global
Coordinator and the Chef
Arranger of the consortium
of banks
July 2014

Dynamic development of Retail Banking in Citi Handlowy
4
13 #Smart Branches
+10% YoY
Citiold clients
+15% YoY
Investment AUM
Since implementation date:
• 64% more transactions, 84% higher volumes
• 73% higher average daily transactions
The lowest foreign
exchange rate
Online transfers
within Citi around
world
• 33% more transfers from Citi Handlowy account to Citi
accounts YoY
• 37% higher volume of transactions YoY
• 32% more foreign transactions used by card assigned to
banking account YoY
• 29% higher volume of transactions YoY 1,3 2,0
2013 2014
+54% YoY
+15% YoY
Cash loans
balance
+16% YoY.
Mortgage loans
balance
Unsecured loans sales (PLN MM)
First Smart Citigold HUB branch
2,5x 7-10x
More clients visit
Smart branch than
traditional branch
More products
are bought in
Smart branch by
customers
8x
Time shorter to
credit cards
issue +18 YoY
Investment products
sales
#1private
banking
#1Super
Affluent
#1 International
clients
CitiPriority
Complex offer for VIP clients
• Customized offer –
investor, credit and
company packages
• Benefits resulted from
Global Banking
80% Deposits clients choose
CitiPriority
Foreign payments
without FX
conversion
• miles never expire
• cashback for airlines ticket purchase

5
9 948 10 886
2013 2014
Institutional non-banking customers’ loans
+9%
Customer volumes
Institutional non-banking customers’ deposits Individual customers’ deposits
Individual customers’ loans
Growth in loans
Growth in deposits of individual customers as a result of focus on operating accounts
SME’S & MME’s
(+25% YoY)
Corporate clients
(-11% YoY) 22%
33%
/PL
N M
M/
Other
Global clients
(-2% YoY)
5 283 5 885
2013 2014
+11%
Mortgage loans
(16% YoY)
Cash loans
(+15% YoY)
Credit cards
(+6% YoY) 36%
42%
21%
/PL
N M
M/
11 372 13 165
7 806
8 673
19 178 21 838
2013 2014
/PL
N M
M/
Term deposits
(+11% YoY)
Demand deposits
(+16% YoY)
+14%
5 932 6 373
975 1 289
6 907 7 662
2013 2014
/PL
N M
M/
Term deposits
(+32% YoY)
Demand deposits
(incl. saving
accounts)
(+7% YoY)
+11%
Sector: +6% Sector: +5%
Sector: +10% Sector: +9%
39%

6
Distributable profit increase
973 947
2013 2014
-3%
935 971
2013 2014
Net profit (PLN MM) Key financial ratios in 2014*
ROA
ROE
Cost/
Income
Loans/
Deposits 105%
Tier 1** 13,7%
NPL 7,0%
Bank* Sektor
ROTE
1,1%
10,1%
51%
10,3%
17,5%
4,9%
2,0%
14,6%
53%
60%
18,1%
* Indicators calculated based on the consolidated results
+4%
Stand alone net profit – for distribution to shareholders
Consolidated net profit
** Tier1 for the sector based on 3Q’14 data
Dividend payout ratio: 100%
Dividend Yield: 7%
The results of stress tests
allow for 100% payment of
dividend
High efficiency of the Bank – ratios better than the sector and strategic targets

7
2,7% 2,4%
3,2% 2,8%
2,5% 2,3%
2013 2014NIM on interest-bearing assets (sum of 4 quarters)
NIM on interest-bearing assets (annualized)
NIM on interest-bearing assets - sector
Net interest income and net fee & commission income
298 265
1 242 1 164
2013 2014
IV Q
I-III Q
-6%
Citi
Handlowy
Sector
Net Interest Income (PLN MM) Net Interest Margin (NIM) – Bank vs. sector
Sector: +7%
-11%
161 150
642 619
2013 2014
IV Q
I-III Q
Sector: +0,7%
-6%
Net fee & commission (PLN MM)
• Interchange decrease resulted in a fee
income decrease of PLN 30 MM
• Excluding interchange reduction, fee
income would increase by 1% YoY
-4%
15%
32%
53% 0%
Corporate Banking
48%
42%
10%
Transaction Banking
incl. trade products
+6% YoY
Custody
+9% YoY
Brokerage
-31% YoY
• Market leader
• Increase in market
share by 0,6 p.p.
Investment & insurance
products
+7% YoY
Retail Banking
Cash loans
and other
+17% YoY • Mainly due to lower
interchange level
Credit
cards
-14% YoY
8
2013 2014
IV Q
I-III Q
2013 2014
IV Q
I-III Q
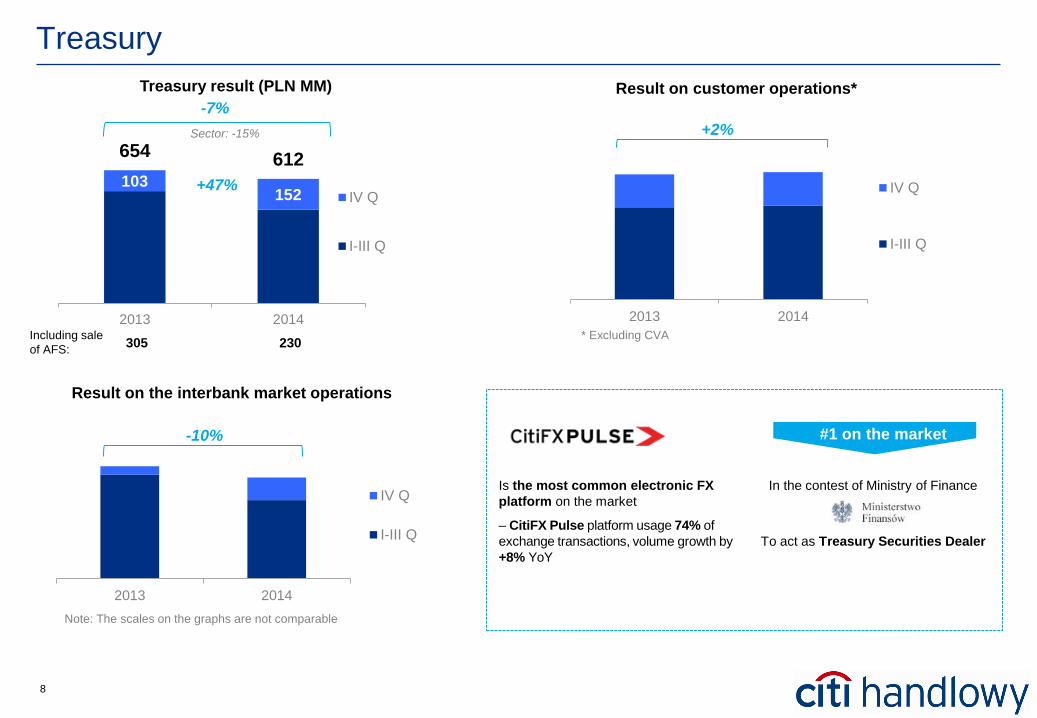
Treasury
103 152
654 612
2013 2014
IV Q
I-III Q
-7%
Treasury result (PLN MM)
Sector: -15%
+47%
Result on customer operations*
Result on the interbank market operations
In the contest of Ministry of Finance
To act as Treasury Securities Dealer
Is the most common electronic FX
platform on the market
– CitiFX Pulse platform usage 74% of
exchange transactions, volume growth by
+8% YoY
Note: The scales on the graphs are not comparable
305 230 Including sale
of AFS:
#1 on the market
* Excluding CVA
+2%
-10%

9
690 580
191
174
118
135
102
100
201
213
63 71
1 365 1 274
2013 2014
Restructuring
provision
7,2
Restructuring
provision
55,2
External services
Premises
Consistent cost control
Staff expenses
IT & Telecom
Depreciation
-16%
-9%
14%
-2%
14%
Change
YoY
-7%
• The YoY decrease in Bank’s expenses mainly due to:
• employment restructuring (the decrease in staff expenses)
• the branch network optimization (partially offset by
investment in the Bank Ecosystem Smart)
• reduce spending on telecommunication charges and
hardware
• Cost / Income ratio at 53% for 2014 r.
314 315
62 12
1 365 1 274
2013 2014
IV Q
I-III Q
1 302 1 262
Sector: -1%
Expenses and depreciation (PLN MM) Expenses and depreciation (PLN MM) by type
Other 6%
-7%
Operating expenses in 4Q 2013 include restructuring provision of PLN
62,4 MM and in 4Q 2014 provision for completion of cooperation with
selected external partners of 12 PLN MM .
After excluding provisions decrease in costs is 3% YoY.
Restructuring
provision
-3% (excl. provisions)
Completion of cooperation
with selected external
partners

10
7,0%
4,9%
7,4% 7,0%
2013 2014
Bank Sector
(26,1) (1,6)
62,3
19,4
36,2
17,8
(70)
(55)
(40)
(25)
(10)
5
20
35
50
65
80
2013 2014
Institutional Banking Retail Banking
Low Cost of Risk
Net impairment losses (PLN MM)
Non-performing loans ratio (NPL)
• Stabilization of retail portfolio quality improvement – 2014 cost
of risk significantly better than the sector (0,3% vs.
-0,9% in the sector)
• Sale of impaired portfolio of credit cards and cash loans:
• 4Q 2014 - portfolio value of PLN 162 MM
- impact on P&L of PLN 34,7MM
• NPL ratio and provision coverage ratio better than sector
Provision coverage ratio
• High quality of assets and equity confirmed in stress test
results:
• CAR / CET 1 for 2016 year-end: 15,74% in base
scenario and 14,92% in adverse scenario on the
assumption that dividend payout ratio at 100% of
2014-2016 net income
• The lack of the problems with Swiss franc mortgage
loans
80% 85%
55% 55%
2013 2014
Bank Sector

11
90
95
100
105
110
115
120
125
130
Sh
are
pri
ce
(P
LN
)
Citi Handlowy WIG 30 WIG Banks
Creating value for shareholders
Banks share price index WIG30 and WIG Banks against in the latest 12
months horizon
Dividends paid by Citi Handlowy since its debut on the WSE
* Uwzględnia tylko zysk z 2004 r., bez specjalnej dywidendy
Citi Handlowy member of the prestigious
WSE indices Citi Handlowy:
+9% (incl.: 7% DY)
WIG30: -3%,
WIG Banks: -13%
1997 1998 1999 2000 2001 2002 2003 2004 2005 2006 2007 2008 2009 2010 2011 2012 2013
Dividend payout
ratio 23% 31% 39% 64% 100% 100% 100% 100%* 80% 86% 77% 0% 94% 100% 50% 75% 100%
Dividend Yield 3,1% 1,9% 3,8% 1,7% 2,3% 2,6% 3,1% 18,7% 5,6% 5,8% 4,5% - 7,1% 7,1% 3,3% 7,1% 7,0%
Responsible company index with high
standards of corporate governance,
information and investor relation
governance.
Citi Handlowy was the eighth time in the
group of socially responsible companies.
• Citi Handlowy member of the prestigious
index of companies with high standards in
the areas of corporate governance,
environmental protection and social
responsibility.
Note: The latest listing as of February, 11th 2015 (Citi Handlowy: PLN 109,10 )

Appendix

13
Income statement – Bank
PLN M M PLN MM %
Net interest income 298 293 302 304 265 1 242 1 164 (78) (6%)
Interest income 390 379 388 386 336 1 646 1 489 (157) (10%)
Interest expenses (91) (86) (86) (82) (71) (404) (325) 79 (20%)
Net fee and commission income 161 157 167 144 150 642 619 (23) (4%)
Dividend income 0 - 6 0 0 4 6 1 31%
Gains on AFS debt securities 20 40 66 58 67 305 230 (75) (25%)
FX and proffesional market 83 125 106 66 85 349 382 33 10%
Hedge accounting 2 (1) - 0 - 2 (0) (2) -
Treasury 105 164 172 124 152 656 612 (45) (7%)
Net gain on equity investment instruments - 3 - 1 3 2 6 5 -
Net other operating income (9) 3 5 4 (1) (0) 11 11 -
Revenue 555 621 651 577 568 2 547 2 417 (129) (5%)
Expenses (357) (296) (310) (286) (310) (1 302) (1 203) 99 (8%)
Depreciation (19) (18) (18) (18) (18) (63) (71) (9) 14%
Expenses and depreciation (376) (314) (328) (304) (327) (1 365) (1 274) 91 (7%)
Operating margin 179 306 323 273 241 1 182 1 143 (39) (3%)
Net impairment losses 19 2 (4) 8 12 36 18 (18) -
EBIT 198 309 319 282 258 1 218 1 168 (50) (4%)
Corporate income tax (46) (61) (53) (53) (53) (245) (220) 25 (10%)
Net profit 152 248 266 228 205 973 947 (25) (3%)
C/I ratio 68% 51% 50% 53% 58% 54% 53%
3Q142Q144Q13 1Q14 4Q14 2013 20142014 vs. 2013

14
Institutional Banking – income statement
PLN M M PLN MM %
Net interest income 136 132 137 132 116 581 516 (65) (11%)
Interest income 208 199 203 194 168 887 764 (123) (14%)
Interest expenses (72) (67) (66) (62) (52) (306) (248) 58 (19%)
Net fee and commission income 73 69 73 66 71 297 280 (17) (6%)
Dividend income 0 - 2 0 0 1 2 1 49%
Gains on AFS debt securities 20 40 66 58 67 305 230 (75) (25%)
FX and proffesional market 75 118 98 57 77 316 351 35 11%
Hedge accounting 2 (1) - 0 - 2 (0) (2) -
Treasury 97 157 164 115 144 623 580 (43) (7%)
Net gain on equity investment instruments - 3 - 1 3 2 6 5 -
Net other operating income 2 11 9 10 2 27 32 5 17%
Revenue 308 371 385 324 337 1 531 1 416 (115) (7%)
Expenses (139) (129) (137) (119) (131) (560) (516) 44 (8%)
Depreciation (6) (6) (6) (6) (6) (26) (24) 2 (7%)
Expenses and depreciation (146) (135) (142) (125) (137) (585) (540) 46 (8%)
Operating margin 162 236 243 199 199 946 877 (69) (7%)
Net impairment losses (8) (2) 0 12 (12) (26) (2) 24 -
EBIT 154 234 243 212 187 919 876 (43) (5%)
C/I ratio 47% 36% 37% 39% 41% 38% 38%
3Q14 4Q144Q13 1Q14 2Q14 2013 20142014 vs. 2013

15
Retail Banking – income statement
PLN M M PLN MM %
Net interest income 162 161 165 172 149 661 648 (13) (2%)
Interest income 182 180 185 192 168 759 725 (34) (4%)
Interest expenses (19) (19) (20) (20) (19) (98) (78) 21 (21%)
Net fee and commission income 88 88 94 78 79 346 339 (7) (2%)
Dividend income - - 4 - - 3 4 1 22%
FX and proffesional market 8 8 8 9 8 33 31 (2) (6%)
Net other operating income (12) (8) (4) (6) (3) (27) (21) 6 (23%)
Revenue 247 250 266 253 232 1 016 1 001 (15) (1%)
Expenses (218) (167) (174) (167) (179) (742) (687) 56 (8%)
Depreciation (12) (12) (12) (12) (12) (37) (47) (11) 29%
Expenses and depreciation (230) (179) (186) (179) (190) (779) (734) 45 (6%)
Operating margin 16 70 80 75 42 237 267 30 13%
Net impairment losses 27 5 (5) (4) 24 62 19 (43) (69%)
EBIT 44 75 75 70 71 299 292 (7) (2%)
C/I ratio 93% 72% 70% 71% 82% 77% 73%
4Q13 1Q14 2Q14 3Q14 4Q142014 vs. 2013
2013 2014

16
Balance Sheet
Cash and balances with the Central Bank 0,8 2,0 1,2 0,7 1,5 0,8 126% 0,7 96%
Amounts due from banks 3,5 4,1 4,6 2,6 2,1 (0,6) (22%) (1,5) (42%)
Financial assets held-for-trading 5,8 7,6 7,0 10,8 12,7 2,0 18% 7,0 121%
Debt securities available-for-sale 17,6 13,4 12,9 15,8 14,4 (1,4) (9%) (3,2) (18%)
Customer loans 15,2 18,0 17,0 17,7 16,8 (0,9) (5%) 1,5 10%
Financial sector entities 0,7 2,6 1,2 1,3 1,0 (0,2) (19%) 0,3 43%
including reverse repo receivables 0,1 2,0 0,6 0,7 0,6 (0,1) (9%) 0,5 495%
Non-financial sector entities 14,5 15,4 15,8 16,4 15,7 (0,6) (4%) 1,2 8%
Corporate Banking 9,2 10,0 10,1 10,6 9,9 (0,7) (7%) 0,6 7%
Consumer Banking 5,3 5,4 5,6 5,8 5,9 0,1 1% 0,6 11%
Unsecured receivables 4,2 4,3 4,5 4,6 4,6 0,0 0% 0,4 10%
Credit cards 2,0 2,0 2,1 2,1 2,1 (0,0) (1%) 0,1 6%
Cash loans 2,2 2,2 2,4 2,4 2,5 0,0 2% 0,3 15%
Other unsecured receivables 0,1 0,1 0,1 0,1 0,1 (0,0) (16%) (0,0) (17%)
Mortgage 1,1 1,1 1,1 1,2 1,2 0,0 4% 0,2 16%
Other assets 2,5 2,9 2,7 2,7 2,3 (0,4) (15%) (0,2) (6%)
Total assets 45,4 48,0 45,4 50,3 49,8 (0,4) (1%) 4,4 10%
Liabilities due to banks 6,4 6,9 4,1 8,8 5,1 (3,7) (42%) (1,3) (20%)
Financial liabilities held-for-trading 4,2 5,2 5,8 6,4 6,8 0,4 6% 2,6 61%
Financial liabilities due to customers 26,6 26,6 26,3 26,4 29,6 3,2 12% 3,1 12%
Financial sector entities - deposits 3,3 4,1 4,6 4,7 3,1 (1,6) (33%) (0,1) (4%)
Non-financial sector entities - deposits 22,8 21,1 21,2 21,1 26,4 5,3 25% 3,6 16%
Corporate Banking 15,9 13,8 13,9 13,7 18,7 5,0 37% 2,8 18%
Consumer Banking 6,9 7,2 7,4 7,4 7,7 0,3 4% 0,8 11%
Other financial liabilities 0,5 1,4 0,5 0,7 0,1 (0,6) (81%) (0,4) (73%)
Other liabilities 0,9 1,8 2,3 1,4 0,9 (0,5) (36%) (0,0) (4%)
Total liabilities 38,1 40,5 38,4 43,1 42,4 (0,6) (1%) 4,3 11%
Equity 7,3 7,5 6,9 7,2 7,4 0,2 3% 0,1 1%
Total liabilities & equity 45,4 48,0 45,4 50,3 49,8 (0,4) (1%) 4,4 10%
Loans / Deposits ratio 64% 73% 74% 78% 60%
Capital Adequacy Ratio 17,5% 16,6% 17,0% 16,4% 17,5%
3Q14
4Q14 vs. 3Q14
PLN B %4Q14
End of period
2Q144Q13 1Q14PLN B
4Q14 vs. 4Q13
PLN B %