bank handlowy w warszawie s.a. - banking with citi | · pdf file · 2006-12-121997...
TRANSCRIPT
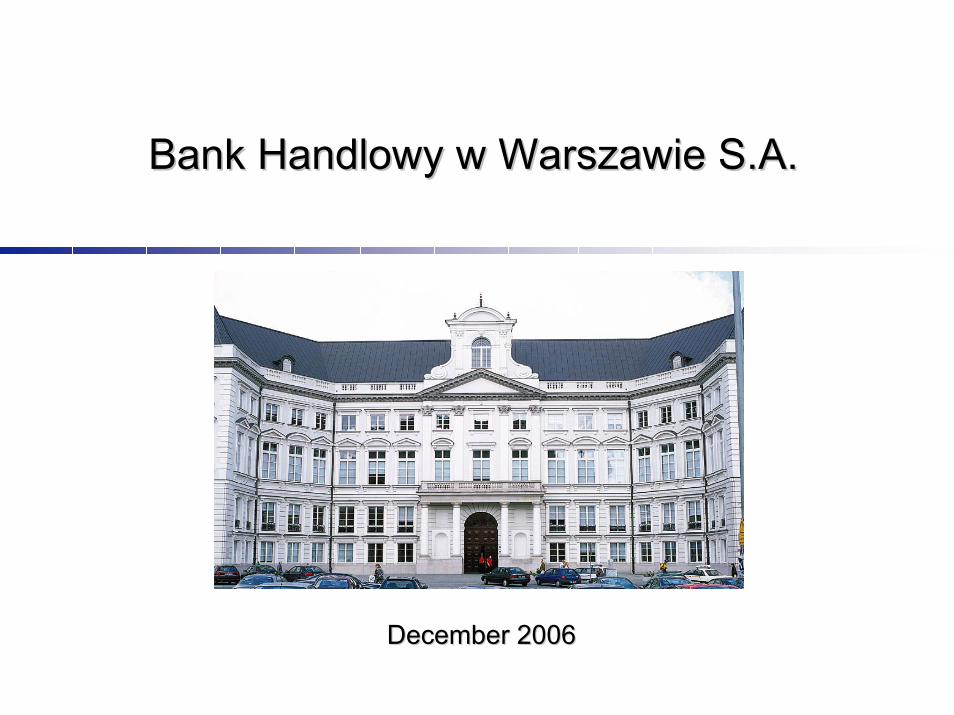
Bank Bank HandlowyHandlowy ww WarszawieWarszawie S.A. S.A.
DecemberDecember 20062006

2
Agenda
� Strategy and business highlights
� Distribution channels
� Corporate and Investment Bank
� Consumer Bank
� Financial snapshot after 3Q 2006

3
�

4
History of Citibank Handlowy
� 1870 – Bank Handlowy w Warszawie established as a privately-owned joint stock company by a group of investors formed by Leopold Kronenberg
� 1918-1939 – Bank Handlowy develops into the largest privately-owned bank in Poland
� 1939-1945 – the Bank continues its operations despite WW2� 1946-1966 – the State Treasury gradually increases its ownership of
the Bank to 100%� 1963 – the Bank entrusted with an official monopoly on servicing
Poland’s foreign trade� 1989 – the Bank diversifies its business towards
corporate lending and investment banking
Historical Head Office of the Bank, Warsaw, 7/9 Traugutta Street
� 1991 – Citibank enters the Polish market � 1997 – reprivatisation and listing of Bank Handlowy w
Warszawie on the WSE� 2000 – Citigroup acquires 85% stake in Bank Handlowy� 2001 – Bank Handlowy w Warszawie merges with Citibank
(Poland); Citigroup’s stake in Bank Handlowy increases to 89%
� 2003 – Legal name: Bank Handlowy w Warszawie SA, CitibankHandlowy - single brand
Current Head Office of the Bank, Warsaw, 16 Senatorska Street

5
From past to present
WealthManagement
Retail Banking
Commercial Bank
CitiFinancial
800Employees4,7008Outlets15645,000Consumer Customers240,0002,000Corporate Customers14,000PLN 9.6 billionAssetsPLN 21.5 billion
3% (TOP 12 bank)Merger in March 2001Revenue Market Share6% (TOP 4 bank)
GTS
Platinum

6
�

7
Tailored branch network
85Retail
106CitiFinancial
Branches that service CitiBusiness clientsOut of 85:� 72 Multifunctional� 12 CitiGold� 1 Investment Center
39Corporate 22
Retail Servicing
13Joint branches
KrakKrakóóww
WarszawaWarszawa
WrocWrocłławaw
SzczecinSzczecin
PoznaPoznańń
BydgBydgoszcoszczz
GdaGdańńsksk
LublinLublinKielceKielce
BiaBiałłystokystok
RzeszRzeszóóww
OlsztynOlsztyn
OpoleOpole
KaliszKalisz
SSłłupskupsk
Zielona Zielona GGóraóra
BielskBielskoo--
BiaBiałłaa
KatowiceKatowice
ŁódźŁódź
Branch network currently – 230 branches
Branch network in 2007 – 314 branches
� 127 branches servicing both individual and corporate customers
� 187 CitiFinancial branches
OVER 50% INCREASE IN THE NUMBER OF BRANCHES SERVICING INDIVIDUAL CUSTOMERS!

8
Citiservice
� Specialised Citiservice team to handle corporate clients’ queries and investigations over the phone
� High standards of service: 99,48% customer calls are answered within 10 seconds
� Exceeding expectations by offering transaction banking products based on client knowledge and daily relationship
� Personalised and tailored service for platinum and global clients
� User-friendly Interactive Voice Response option for instant information and service
Investigations resolved untimely Calls abandoned & calls answered after 10 sec.
0,0%
0,5%
1,0%
1,5%
2,0%
2,5%
3,0%
3,5%
Apr May Jun Jul Aug Sep Oct
Benchmark
CitiService
0,0%0,5%1,0%1,5%2,0%2,5%3,0%3,5%
Apr May Jun Jul Aug Sep Oct
Benchmark
Answered untimelyAbandoned calls

9
CitiPhone
� High standards in waiting time, waiting time for 80% phone calls - below 20 seconds
� Each day every tenth customer signs up for a new service or product
� Toll free CitiPhone number for customers calling from abroad
� Under CitiPhone – integration of electronic and phone channels
Number of products and services purchased via
CitiPhone
0
100,000
200,000
300,000
400,000
2004 2005 2006 2007

10
Strategy – closer to the Client
5
6 4
8
4
44
7
2/23
1/9
1/91/6
1/9
5
6 4
8
4
44
7
2/23
1/9
1/91/6
1/9
BP gas stations� Alternative channels� Innovative access channels – BP gas stations,
malls� Outlets in companies – mini-branches� 2007
� 100 BP gas stations� 10 malls� 20 Mini –branches

11
�

12
CIB business model
Strong product coverage in all segments
BLUE
SILVER
GOLD
PLATINUM
GTS
9%
9%
Hybrid
Standard-offthe shelf
Tailored
Tailored / sophisticated products
Product focus
7%
20%
BLUE2-25
SILVER25-50
GOLD50-250
>250
SegmentationCriteria Turnover
($ MM)Market share
Cash Mgmt & Trade dominated
Product focus
CB
G Mid
dle
Mar
ket
SME
Plat
inum
Revenue structureCitibank Handlowy #1 on the corporate market with 9% market share – first or second position in 5 out of 7 categories
PLATINUM
GTS
Other
CBG
13
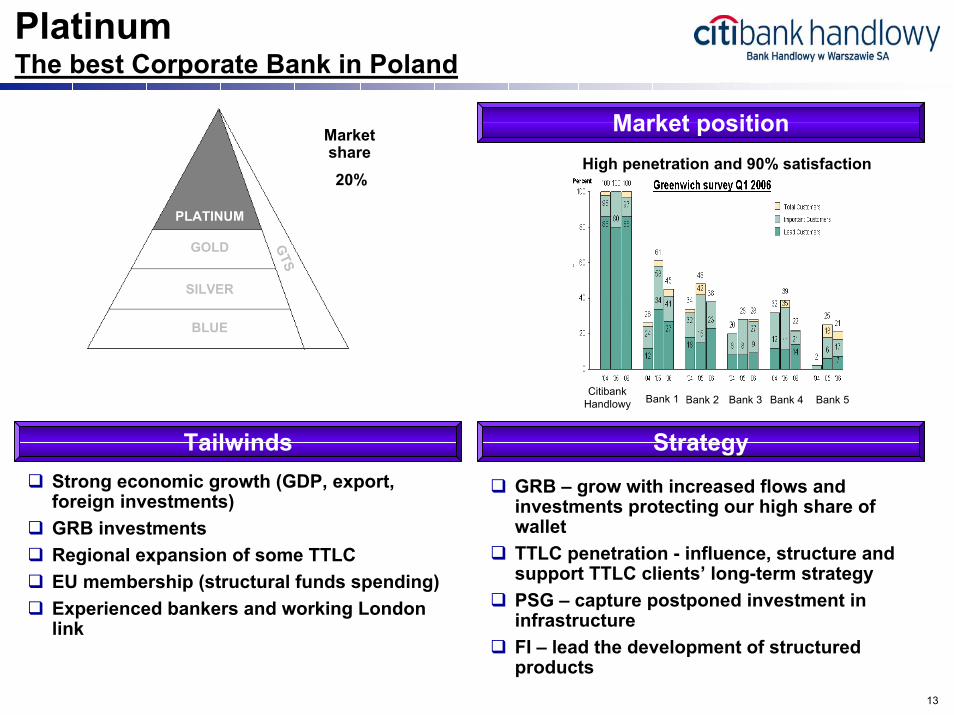
PlatinumThe best Corporate Bank in Poland
Market position
BLUE
SILVER
GOLD
PLATINUM
GTS
20%
Market share
High penetration and 90% satisfaction
Citibank Handlowy Bank 2 Bank 3Bank 1 Bank 4 Bank 5
Tailwinds Strategy
� GRB – grow with increased flows and investments protecting our high share of wallet
� TTLC penetration - influence, structure and support TTLC clients’ long-term strategy
� PSG – capture postponed investment in infrastructure
� FI – lead the development of structured products
� Strong economic growth (GDP, export, foreign investments)
� GRB investments� Regional expansion of some TTLC � EU membership (structural funds spending)� Experienced bankers and working London
link

14
Platinum – key deals closed in 2006
Deals closed
MTN program
PLN 100 mnMLA
2006
MTN program
PLN 100 mnMLA
2006
Revenue bondsII Tranche
PLN 400 mnMLA
2006
Revenue bondsII Tranche
PLN 400 mnMLA
2006
Club-deal facility
USD 780 mnMLA (club-deal)
2006
Club-deal facility
USD 780 mnMLA (club-deal)
2006
Syndicated loan
EUR 604 mnMLA
2006
Syndicated loan
EUR 604 mnMLA
2006
Acquisition of a listed company
USD 200 mnFinancial Advisor to the Buyer
2006
Acquisition of a listed company
USD 200 mnFinancial Advisor to the Buyer
2006
Bonds program& Swap
USD 250 mnMLA
2006
Bonds program& Swap
USD 250 mnMLA
2006
Acquisition of EMAXPLN 480 mn
Major M&A transaction
2006
Acquisition of EMAXPLN 480 mn
Major M&A transaction
2006
15
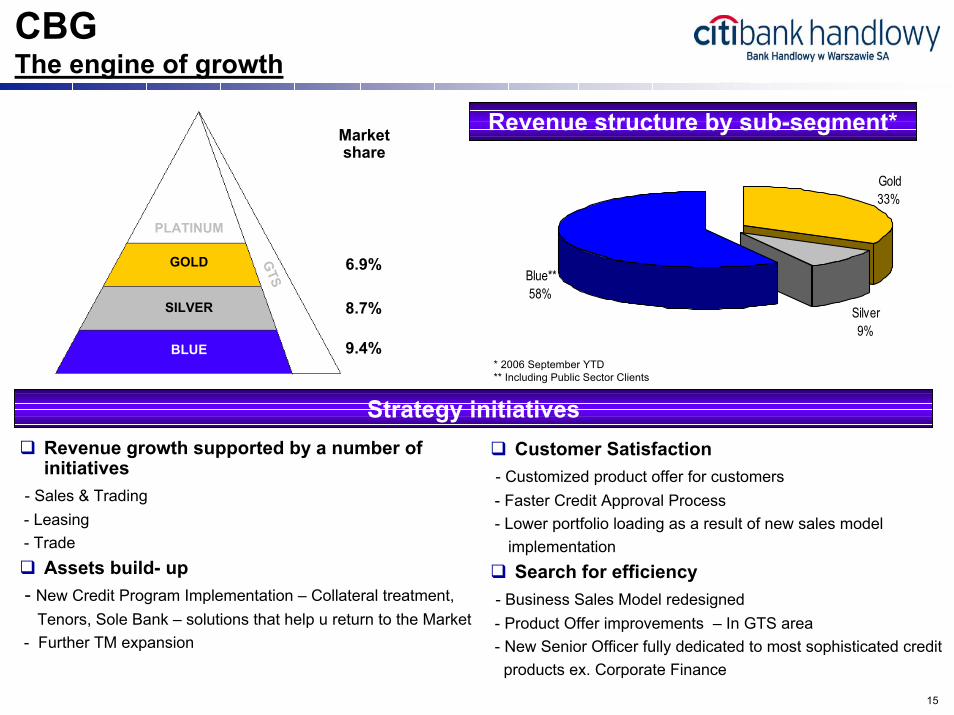
CBGThe engine of growth
Revenue structure by sub-segment*
* 2006 September YTD** Including Public Sector Clients
Gold33%
Silver9%
Blue**58%
BLUE
SILVER
GOLD
PLATINUM
GTS
Market share
6.9%
8.7%
9.4%
Strategy initiatives� Revenue growth supported by a number of
initiatives- Sales & Trading- Leasing- Trade� Assets build- up- New Credit Program Implementation – Collateral treatment,
Tenors, Sole Bank – solutions that help u return to the Market- Further TM expansion
� Customer Satisfaction - Customized product offer for customers- Faster Credit Approval Process- Lower portfolio loading as a result of new sales model
implementation� Search for efficiency- Business Sales Model redesigned- Product Offer improvements – In GTS area- New Senior Officer fully dedicated to most sophisticated credit
products ex. Corporate Finance

16
GTS SegmentThe best in class for GRB customers
* 2006 July YTD
GRB59%
FI41%
Revenue structure by sub-segment*
BLUE
SILVER
GOLD
PLATINUM
GTS
Market share
65%
RETAILERS(hypermarkets)
70%
MARKET SHARE
GRB CORPORATE
1st or 2nd bank
In banking relationship
PENSION FUNDS
75%
MARKET SHARE
INSURANCE
65%
MARKET SHARE
� Revenue growth- Operating account strategy (multiproduct & volume
x-sell)- Client acquisition/wallet penetration within
relationship groups- Regional leverage for green field investments /
capturing of new clients & product development� Search for efficiency
- Decrease the average sales time by 15%- All goals to be achieved with the same HC level
maintained� Customer satisfaction
- Providing top-class banking service for client coverage by relationship team (both local & international)
StrategyDriven by quality and innovation

17
Treasury
Customer business
Customer72%
Trading16%
Gain/loss on AFS
sale12%
Revenue structure after 3Q 2006� Customer Acquisition and attrition
management� Conversion of active customers and new
customer acquisition through on-line trading platform
� Platform capacity; Call Manager (IVR) implementation to manage >10,000 customers
� Long-term Euro zone convergence� Significant increase in risk taking due
to lower nominal yields� Management of excess liquidity and
improve yield on placements
Trading Risk Treasury� Maintain leading position in flow
business:- Bond Market Making (market making desk for Citigroup)
- IR Derivatives Market Making - Foreign Exchange Market Making
*estimates
Professional market products Market share* Market position*FX 15-20% 1
Debt 10-15% 3Derivatives 25% 1
18
�

19
Consumer Bank – segments
A
Middle
LowIncome
Customer Segment
Product offer
Accounts, credit cards, credit products, investment and insurance products
Credit products, insurance products
A
B
C1
C2
Low incomeLow income
Very lowVery lowincomeincome C3/D
CitiBanking
CitiBlueCitiGold Wealth Management, credit cards
Medium Medium incomeincome
High incomeHigh income
Credit cards, credit products, insurance products
CitiBusiness

20
Consumer Bank – market position20062006 20062006
Internet users20062006
8%
92%
Citibank Handlowy
Other banksOther banks
95,7%
4,3%
The Bank’s share in revenue of
retail banking segment in Poland(Q2, 2006)
60%
40%
Distribution of foreign mutual funds
20062006
17%
83%
Wealth Management
20062006
20062006
27%
73%
Value of credit card transactions

21
Credit cards
88%
12%
Number of cards issued
* NBP data for 2Q 2006
Transaction value
73%
27%75%
25%
Number of transactions
Credit cards average net receivables
Citibank HandlowyOther banks
�637 thousand credit cards issued as at Sept 30, 2006
�Differentiated offer!�Safest cards!�The biggest discount program
– 2400 points of sale!
32%MM PLN
3Q0 5 4Q0 5 1Q0 6 2Q0 6 3Q0 6
22
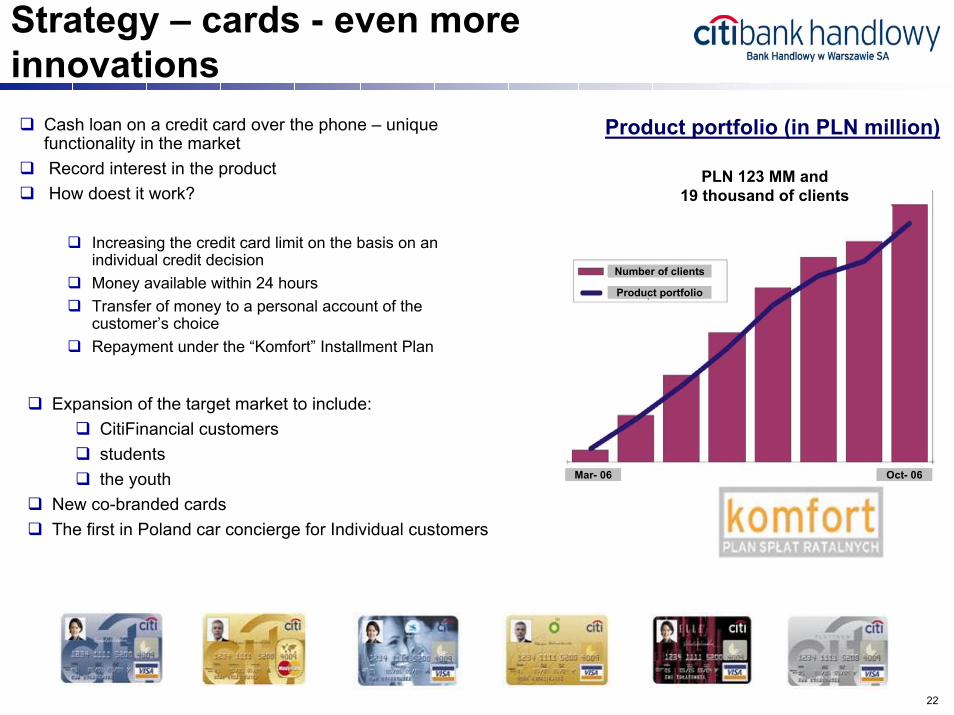
Strategy – cards - even more innovations
Product portfolio (in PLN million)� Cash loan on a credit card over the phone – unique functionality in the market
� Record interest in the product� How doest it work?
� Increasing the credit card limit on the basis on an individual credit decision
� Money available within 24 hours� Transfer of money to a personal account of the
customer’s choice� Repayment under the “Komfort” Installment Plan
� Expansion of the target market to include:� CitiFinancial customers� students � the youth
� New co-branded cards� The first in Poland car concierge for Individual customers
Number of clients
Product portfolio
Oct- 06Mar- 06
PLN 123 MM and 19 thousand of clients

23
Investment and Insurance products
19%
81%
On-shore funds Off-shore funds
3Q 05 3Q06
24%
3Q 05 3Q06
81%
3Q 05 3Q06
57%
Mutual Fund assets acquired through the Bank
Single Premium Unit Linked
Structured Products
Client choice in the best Polish and foreign mutual funds:
� Best return investment funds� Coherent investment management� Highly qualified and transparent
governance� Compliance with Citigroup
standards

24
Strategy – account
Number of e-statement users increased by 60% (vs. Q3, 2005)
1
� Mortgage loans and savings accounts
� Online transfers free of charge
� Account opening via the Internet – e-account
� Multifunctional, transparent debit card (possibility to perform non-cash transactions via the Internet)
2006 2007
20%
80% Transactions via Internet
OtherOther
15%
85%
Other

25
Strategy – Clients – CitiFinancial
� Mortgage loan
� Credit card for CitiFinancial customers
� About 60% increase in the number of branches by the end of 2007
Number of CitiFinancial branches
0
20
40
60
80
100
120
2002 2003 2004 2005 2006
Branches Authorized outlets
Customer-friendly education program – „Droga do dobrego kredytu” [The Road to Good Credit]

26
�

27
Almost 80% of the previous year profit achieved after 3Q 2006
MM PLN
485
616
138
180
179 142
236
107
120
0
200
400
600
2005 3Q06
4Q
3Q2Q
1Q
Source: Bank’s Financial Disclosures

28
Cumulative 3Q 2006 results
PLN MM 3Q 06 3Q 05 %Net interest income 771.9 769.1 2.8 0.4%Net fee and commission income 447.2 439.2 8.0 1.8%Dividend income 3.7 2.1 1.6 75.5%Treasury 286.3 481.1 (194.8) (40.5%)Other operating revenue 61.1 53.5 7.6 14.1%Recurring income 1,570.1 1,745.0 (174.9) (10.0%)Expenses and depreciation (1,114.1) (1,144.5) (30.4) (2.7%)Income on fixed assets sale 117.2 0.1 117.1 n.m.Movements in provisions 47.6 39.3 8.3 21.1%Share in subs' profits 4.1 -7.8 11.9 (152.9%)EBIT 625.0 632.2 (7.1) (1.1%)Corporate tax (140.1) (135.3) 4.8 3.6%
Net profit 484.9 496.9 (12.0) (2.4%)
Source: Bank’s Financial Disclosures, data in MM PLN

29
Ratios
Net income, MM PLN
Gross income, MM PLN
Return on Assets
Capital Adequacy Ratio
Operating Income, MM PLN
Return on Equity
VARIANCE
1,745
(1.1%)
(2.4%)
3Q 2006
11.2%
15.1%
1,570
Cost / Income
3Q 2005
(10.0%)
632625
497485
10.1%
1.8% 1.8%
66.5% 66.5%
14.6%*
* as at Dec 31, 2005
Source: Bank’s Financial Disclosures
30
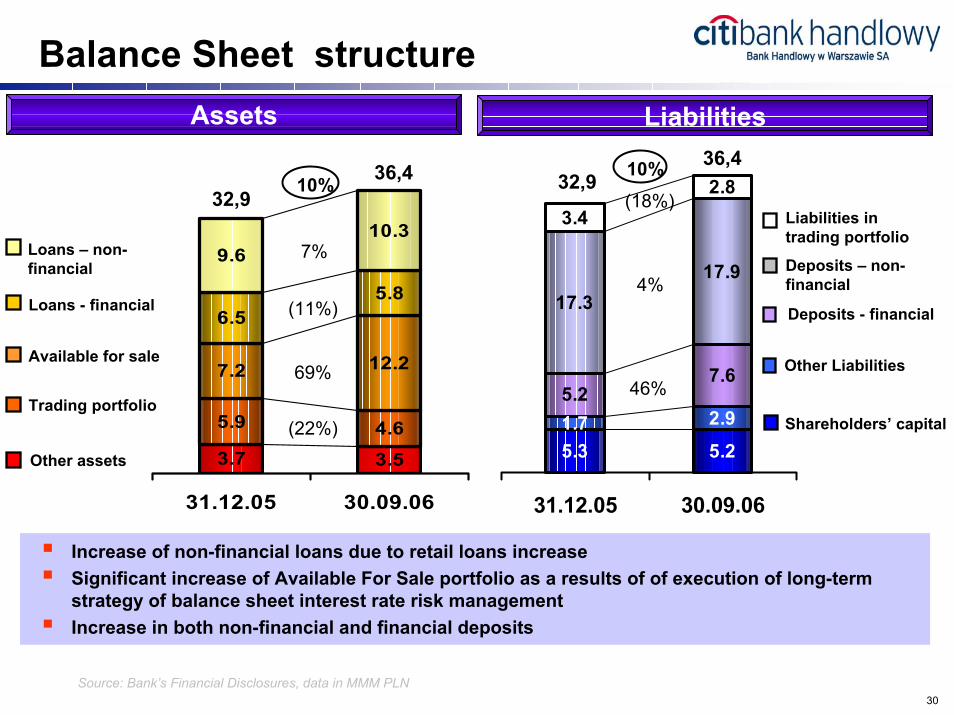
Balance Sheet structure
5.3 5.2
5.27.6
17.317.9
3.42.8
1.7 2.9
31.12.05 30.09.06
3.7 3.5
7.2 12.2
6.55.8
9.610.3
5.9 4.6
31.12.05 30.09.06
Available for sale
Loans - financial
Trading portfolio
Other assets
Loans – non-financial
Deposits - financial
Other Liabilities
Shareholders’ capital
Deposits – non-financial
Liabilities in trading portfolio
7%
69%
(22%)
10%32,9
36,4
(11%)
10% 36,4
(18%)
4%
46%
32,9
Source: Bank’s Financial Disclosures, data in MMM PLN
� Increase of non-financial loans due to retail loans increase � Significant increase of Available For Sale portfolio as a results of of execution of long-term
strategy of balance sheet interest rate risk management� Increase in both non-financial and financial deposits
Assets Liabilities

31
Loans
-2,5% 24%
17%
Market (excl.mortgage)
9%
Market
Non-financial sector loans
31.12.2005 30.09.2006
Corporate clients loans Retails loans
0
2000
4000
6000
8000
31.12.05 30.09.060
2000
31.12.05 30.09.06
Corporates Individuals
26%74% 31%
69%
Source: Estimates, pro-forma data

32
Deposits
4%2%
12%
Market
5%
Market
Non-financial sectors deposits
Non-Financial Corporate deposits Individuals’ deposits
31.12.2005 30.09.2006
27%73%
Corporates Individuals
25%
75%
0
4000
8000
12000
31.12.05 30.09.060
2000
4000
6000
31.12.05 30.09.06
Source: Estimates, pro-forma data
33
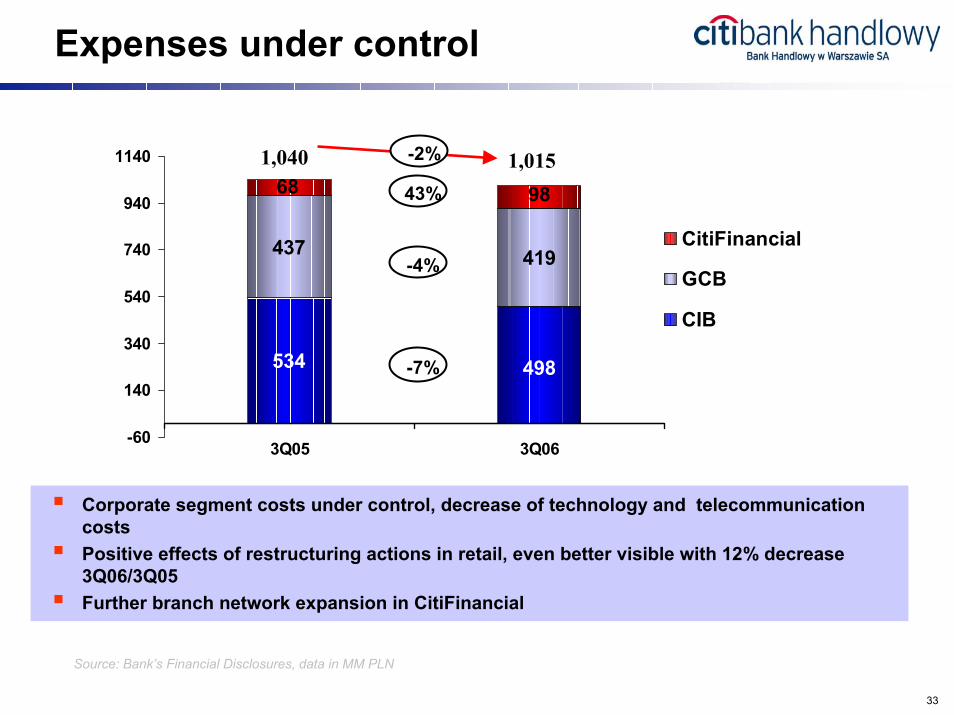
Expenses under control
534
437 419
498
9868
-60
140
340
540
740
940
1140
3Q05 3Q06
CitiFinancial
GCB
CIB
43%
-4%
-7%
1,040 1,015-2%
� Corporate segment costs under control, decrease of technology and telecommunication costs
� Positive effects of restructuring actions in retail, even better visible with 12% decrease 3Q06/3Q05
� Further branch network expansion in CitiFinancial
Source: Bank’s Financial Disclosures, data in MM PLN

34
Cost of Credit
12%13%
Portfolio approach
Individual Impairment loss
80%81%Provision coverage ratio
31.12.2005 30.09.06
Loans portfolio quality Impairment split as at 30 Sept 2006
-3000-100010003000500070009000
1100013000150001700019000
2005 3Q06
Not at riskloans
At risk ofimpairment
Provisions
26%
74%
� Decrease of loans at risk of impairment
Source: Bank’s Financial Disclosures, data pro-forma
35
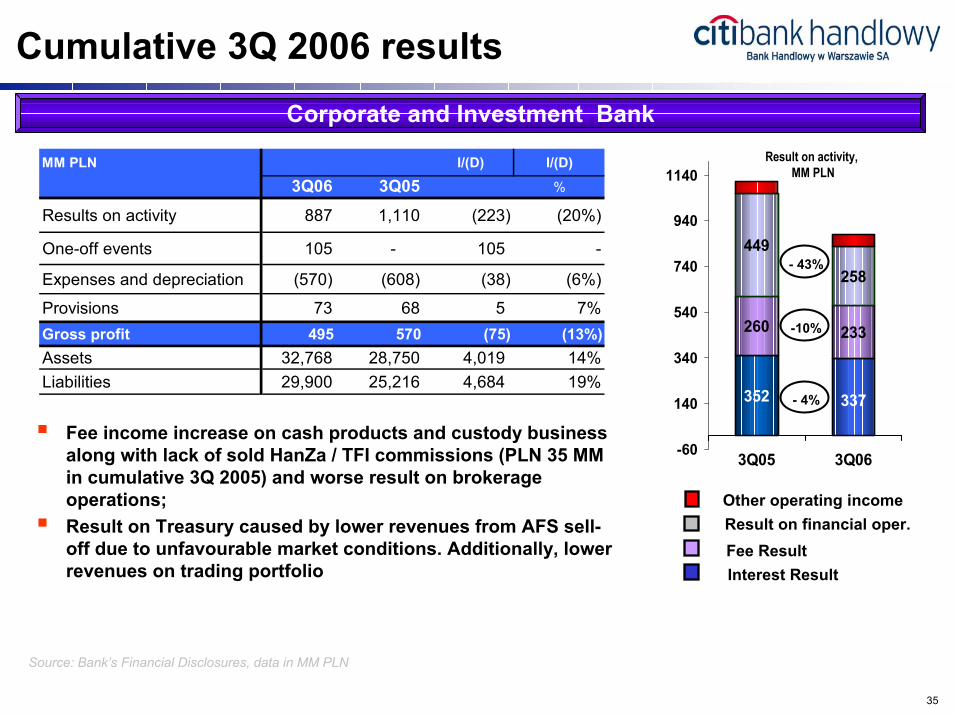
Cumulative 3Q 2006 results
260 233
449
258
352 337
-60
140
340
540
740
940
1140
3Q05 3Q06
Result on activity,MM PLN
- 43%
-10%
- 4%
Corporate and Investment Bank
MM PLN I/(D) I/(D)
3Q06 3Q05 %
Results on activity 887 1,110 (223) (20%)
One-off events 105 - 105 -
Expenses and depreciation (570) (608) (38) (6%)
Provisions 73 68 5 7%Gross profit 495 570 (75) (13%)Assets 32,768 28,750 4,019 14%Liabilities 29,900 25,216 4,684 19%
� Fee income increase on cash products and custody business along with lack of sold HanZa / TFI commissions (PLN 35 MM in cumulative 3Q 2005) and worse result on brokerage operations;
� Result on Treasury caused by lower revenues from AFS sell-off due to unfavourable market conditions. Additionally, lower revenues on trading portfolio
Other operating incomeResult on financial oper.Fee ResultInterest Result
Source: Bank’s Financial Disclosures, data in MM PLN
36
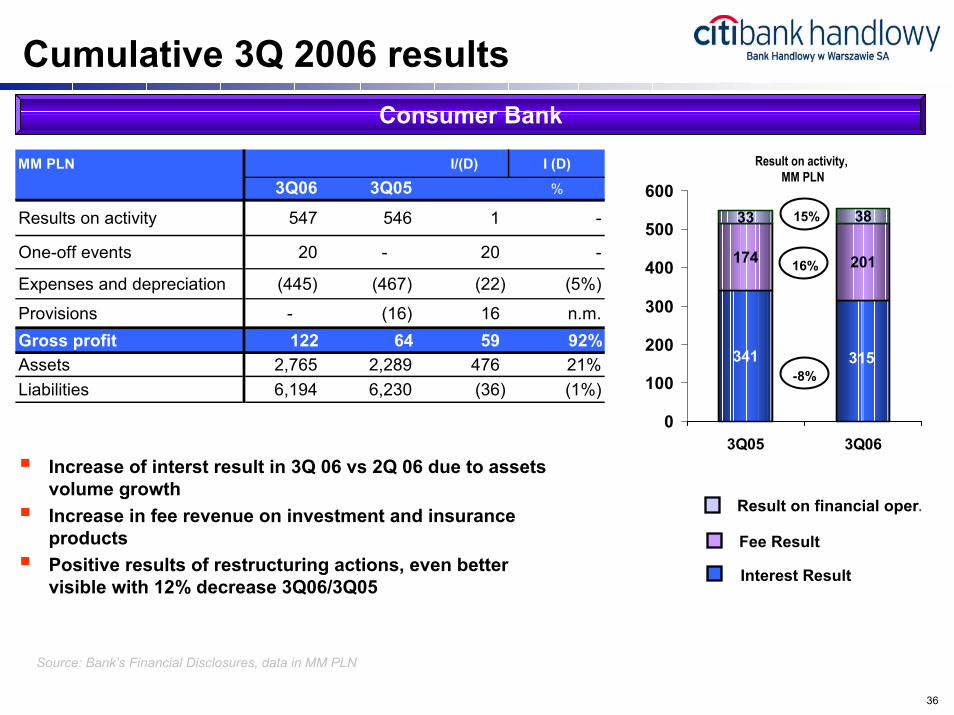
Cumulative 3Q 2006 resultsConsumer Bank
MM PLN I/(D) I (D)
3Q06 3Q05 %
Results on activity 547 546 1 -
One-off events 20 - 20 -
Expenses and depreciation (445) (467) (22) (5%)
Provisions - (16) 16 n.m.Gross profit 122 64 59 92%Assets 2,765 2,289 476 21%Liabilities 6,194 6,230 (36) (1%)
341
174 201
33 38
315
0
100
200
300
400
500
600
3Q05 3Q06
Result on activity,MM PLN
-8%
15%
16%
� Increase of interst result in 3Q 06 vs 2Q 06 due to assets volume growth
� Increase in fee revenue on investment and insurance products
� Positive results of restructuring actions, even better visible with 12% decrease 3Q06/3Q05
Result on financial oper.
Fee Result
Interest Result
Source: Bank’s Financial Disclosures, data in MM PLN

37
Cumulative 3Q 2006 results
Source: Bank’s Financial Disclosures, data in MM PLN
� 57% interest result increaseand 158% fee results increase due to significantly larger portfolio
� Further expansion of outlets’ network – 9branches and 2 points of sale in 3Q 06
76
119
5
13
0
25
50
75
100
125
3Q05 3Q06
Interest Result Fee Result
Result on activity,MM PLN
57%
158%
MM PLN I/(D) I (D)
3Q06 3Q05 %
Results on activity 132 81 51 63%
Expenses and depreciation (99) (69) 30 43%
Provisions (25) (13) (12) 95%Gross profit 8 (1) 9 n.m.Assets 826 529 297 56%Liabilities 265 122 143 118%
3Q0 5 4Q0 5 1Q0 6 2Q0 6 3Q0 6
59%
CitiFinancial
Significant increase of cash loans receivables

38
Share price / market ratios
Market ratiosMarket capitalization:PLN 10.3 bn ($ 3.6 bn)P/E 17.03 (banking sector average: 21.6)
P/BV 2.02 (banking sector average: 3.8)
55
60
65
70
75
80
Septem
ber/05
October/
05Nove
mber/0
5Dec
ember/
05Ja
nuary/06
Febru
ary/06
March
/06April/
06May
/06Ju
ne/06
July/
06Augu
st/06
Septem
ber/06
October/
06Nove
mber/0
6
Sto
ck P
rice
(PLN
)
0
200
400
600
800
1,000
1,200
Sto
cks
(thou
sand
s)
Volume
BHW stock price

39
Shareholders structure changes
� 10.2 pp higher free-float as compared to the end of 2Q 06
� 12.7 pp out of 14.33% BHW shares available for exchange has been converted
Current shareholders structure
Current total free float: $ 835 MM
Shareholders changes�2004: Citibank N.A. issued $ 437
MM notes exchangeable to Citibank Handlowy shares, shares transfer to IFA, (voting right limited to 75%)
�2006: Notes were exchanged tillDecember 1 (on Dec 7 notes were redeemed)
Citigroup Other shareholders
75%
25%
75%
2%
23%
COIC IFA
Pozostali
As at 8 Dec, 2006
Total potential free float at the year end: $ 890 MM

40
Investor Relations
Sławomir SikoraPresident of the Management Board
Lidia Jabłonowska-LubaManagement Board Member, CFO
Katarzyna Otko-Dąbrowska Investor Relations
citibank handlowyBank Handlowy w Warszawie S.A.Ul. Senatorska 1600-923 WarszawaPolskaTel. +48 (22) 657 72 [email protected]