bank of america merrill lynch 2016 refining conference€¦ · · 2016-03-02bank of america...
TRANSCRIPT

Bank of America Merrill Lynch 2016 Refining Conference Tim Griffith, Senior Vice President and CFO
March 3, 2016
Forward‐Looking Statements This presentation contains forward-looking statements within the meaning of federal securities laws regarding Marathon Petroleum Corporation (“MPC”) and MPLX LP (“MPLX”). These forward-looking statements relate to, among other things, expectations, estimates and projections concerning the business and operations of MPC and MPLX. You can identify forward-looking statements by words such as “anticipate,” “believe,” “design,” “estimate,” “expect,” “forecast,” “goal,” "guidance," “imply,” “intend,” “objective,” “opportunity,” “outlook,” "plan,“ “position,” “pursue,” “prospective,” “predict,” “project,” "potential," “seek,” “target,” “could,” “may,” “should,” “would,” “will” or other similar expressions that convey the uncertainty of future events or outcomes. Such forward-looking statements are not guarantees of future performance and are subject to risks, uncertainties and other factors, some of which are beyond the companies’ control and are difficult to predict. Factors that could cause MPC’s actual results to differ materially from those implied in the forward-looking statements include: risks described below relating to MPLX and the MPLX/MarkWest Energy Partners, L.P. (“MarkWest”) transaction; changes to the expected construction costs and timing of pipeline projects; continued/further volatility in and/or degradation of market and industry conditions; the availability and pricing of crude oil and other feedstocks; slower growth in domestic and Canadian crude supply; the effects of the lifting of the U.S. crude oil export ban; completion of pipeline capacity to areas outside the U.S. Midwest; consumer demand for refined products; transportation logistics; the reliability of processing units and other equipment; MPC’s ability to successfully implement growth opportunities; modifications to MPLX earnings and distribution growth objectives; federal and state environmental, economic, health and safety, energy and other policies and regulations, including the cost of compliance with the Renewable Fuel Standard; MPC’s ability to successfully integrate the acquired Hess retail operations and achieve the strategic and other expected objectives relating to the acquisition; changes to MPC’s capital budget; other risk factors inherent to MPC’s industry; and the factors set forth under the heading "Risk Factors" in MPC's Annual Report on Form 10-K for the year ended Dec. 31, 2015, filed with Securities and Exchange Commission (SEC). Factors that could cause MPLX's actual results to differ materially from those implied in the forward-looking statements include: negative capital market conditions, including a persistence or increase of the current yield on common units, which is higher than historical yields, adversely affecting MPLX’s ability to meet its distribution growth guidance; risk that the synergies from the acquisition of MarkWest by MPLX may not be fully realized or may take longer to realize than expected; disruption from the MPLX/MarkWest transaction making it more difficult to maintain relationships with customers, employees or suppliers; risks relating to any unforeseen liabilities of MarkWest; the adequacy of MPLX's respective capital resources and liquidity, including, but not limited to, availability of sufficient cash flow to pay MPLX’s distributions, and the ability to successfully execute their business plans and growth strategies; the timing and extent of changes in commodity prices and demand for crude oil, refined products, feedstocks or other hydrocarbon-based products; volatility in and/or degradation of market and industry conditions; completion of midstream infrastructure by competitors; disruptions due to equipment interruption or failure, including electrical shortages and power grid failures; the suspension, reduction or termination of MPC's obligations under MPLX's commercial agreements; modifications to earnings and distribution growth objectives; the level of support from MPC, including drop-downs, alternative financing arrangements, taking equity units, and other methods of sponsor support, as a result of the capital allocation needs of the enterprise as a whole and its ability to provide support on commercially reasonable terms; federal and state environmental, economic, health and safety, energy and other policies and regulations; changes to MPLX's capital budget; other risk factors inherent to MPLX’s industry; and the factors set forth under the heading "Risk Factors" in MPLX's Annual Report on Form 10-K for the year ended Dec. 31, 2015, filed with the SEC. In addition, the forward-looking statements included herein could be affected by general domestic and international economic and political conditions. Unpredictable or unknown factors not discussed here, in MPC's Form 10-K or in MPLX's Form 10-K could also have material adverse effects on forward-looking statements. Copies of MPC's Form 10-K are available on the SEC website, MPC's website at http://ir.marathonpetroleum.com or by contacting MPC's Investor Relations office. Copies of MPLX's Form 10-K are available on the SEC website, MPLX's website at http://ir.mplx.com or by contacting MPLX's Investor Relations office.
Non-GAAP Financial Measures EBITDA, Adjusted EBITDA and distributable cash flow are non-GAAP financial measures provided in this presentation. EBITDA, Adjusted EBITDA and distributable cash-flow reconciliations to the nearest GAAP financial measure are included in the Appendix to this presentation. EBITDA, Adjusted EBITDA and distributable cash flow are not defined by GAAP and should not be considered in isolation or as an alternative to net income attributable to MPC or MPLX or other financial measures prepared in accordance with GAAP. The EBITDA forecast related to MPC’s marine assets was determined on an EBITDA-only basis. Accordingly, information related to the elements of net income, including tax and interest, are not available and, therefore, a reconciliation of this non-GAAP financial measure to the nearest GAAP financial measure has not been provided.
2
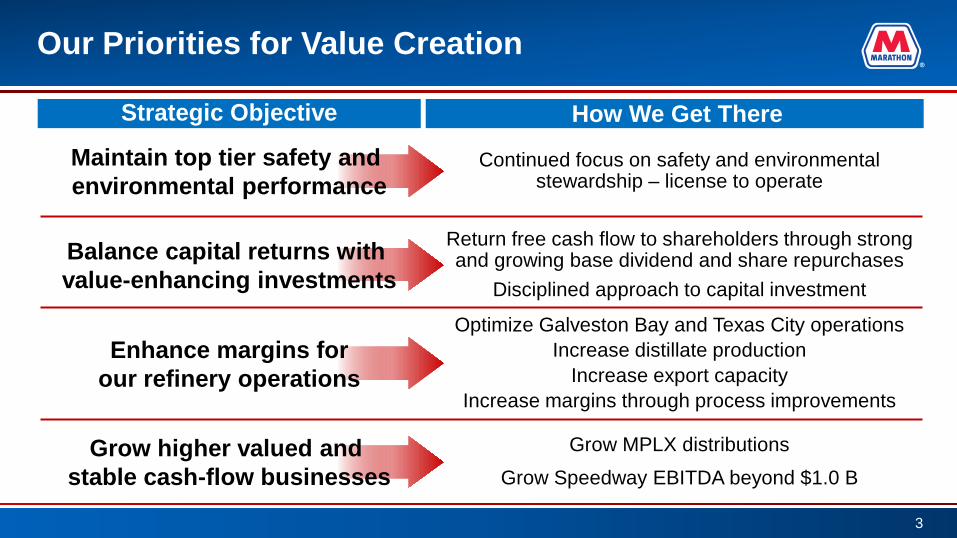
Our Priorities for Value Creation
3
How We Get There
Balance capital returns with value-enhancing investments
Enhance margins for our refinery operations
Return free cash flow to shareholders through strong and growing base dividend and share repurchases
Disciplined approach to capital investment
Optimize Galveston Bay and Texas City operations Increase distillate production
Increase export capacity Increase margins through process improvements
Grow MPLX distributions
Grow Speedway EBITDA beyond $1.0 B
Maintain top tier safety and environmental performance
Continued focus on safety and environmental stewardship – license to operate
Strategic Objective
Grow higher valued and stable cash-flow businesses

Balanced Approach to Returning Capital and Investment
4
$7.2 B
$2.2 B
$13.8 B
$7.2 B returned to shareholders through repurchases, representing 28% of shares outstanding
Five dividend increases resulting in a 29.5% CAGR
Strategic investments providing long-term stable cash flows
Since July 2011 Share Repurchases
Dividends
Investing in the Business*
*Represents cash capital expenditures, acquisitions, investments and contingent consideration
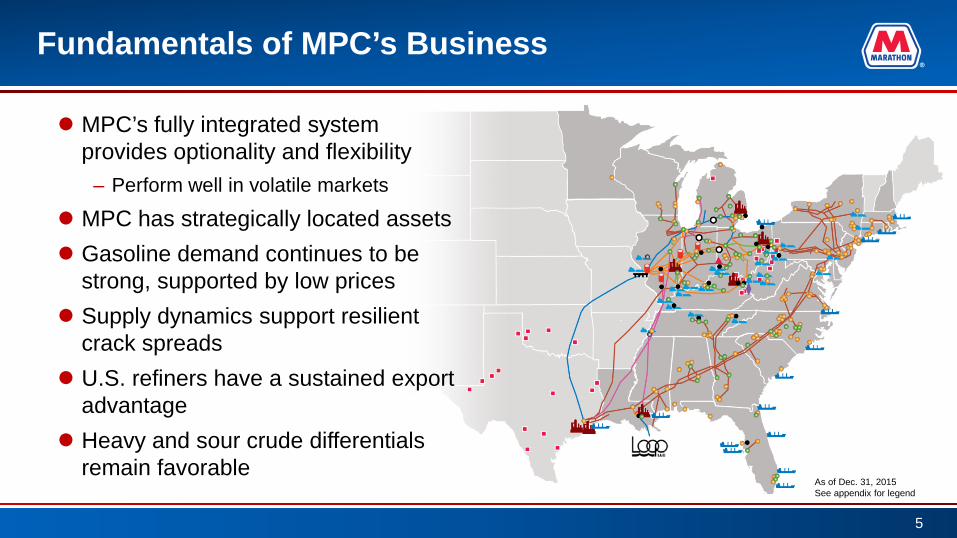
Fundamentals of MPC’s Business
MPC’s fully integrated system provides optionality and flexibility
– Perform well in volatile markets
MPC has strategically located assets Gasoline demand continues to be
strong, supported by low prices Supply dynamics support resilient
crack spreads U.S. refiners have a sustained export
advantage Heavy and sour crude differentials
remain favorable
5
As of Dec. 31, 2015 See appendix for legend

Refining Increasing EBITDA and Driving Value
6
Enhancing Margins and Process Improvements
Increasing EBITDA through process improvements
Optimizing Galveston Bay and Texas City operations
Investing in Galveston Bay
Increasing distillate yield and conversion capacity
Growing refined product export capacity

South Texas Asset Repositioning (STAR) Program
7
Creating a World-Class Refining Complex
~$2.0 B of total investment – IRR 26%
Increase residual oil (resid) processing – Expand resid hydrocracker – Improve gas oil recovery
Revamp crude unit – Increase distillate and gas oil recovery – Improve reliability – Increase capacity 40 MBD
Install a new ULSD hydrotreater – Produce 100% ULSD/ULSK – Increase finished distillate 65 MBD
Full integration of Galveston Bay and Texas City refineries
110 175
315
540
580
270
0
500
1,000
1,500
2,000
2016E &prior
2017E 2018E 2019E 2020E 2021E
$MM
Investment
80
550 730
0
200
400
600
800
2016-2020E Avg. 2021E 2022E$M
M
EBITDA

0
100
200
300
400
500
600
700
2013 2014 2015 2016E 2019E
$MM
EBITDA Improvement
Galveston Bay Process Improvements and Synergies*
Process improvements – Unit optimization – Improved unit yields – Bottlenecks removed – Catalyst changes
Synergy capture
– Crude optimization – Process unit utilization
Future improvements
– Shutdown inefficient units – Integrate utilities
8
*STAR investment program excluded
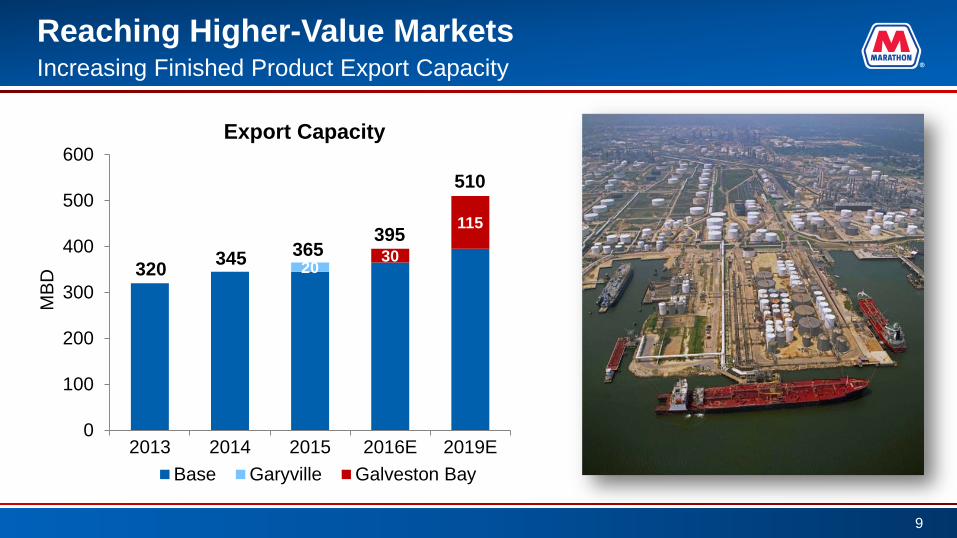
320 345 395
510
365 20
30
115
0
100
200
300
400
500
600
2013 2014 2015 2016E 2019E
MB
D
Base Garyville Galveston Bay
Export Capacity
Reaching Higher-Value Markets
9
Increasing Finished Product Export Capacity
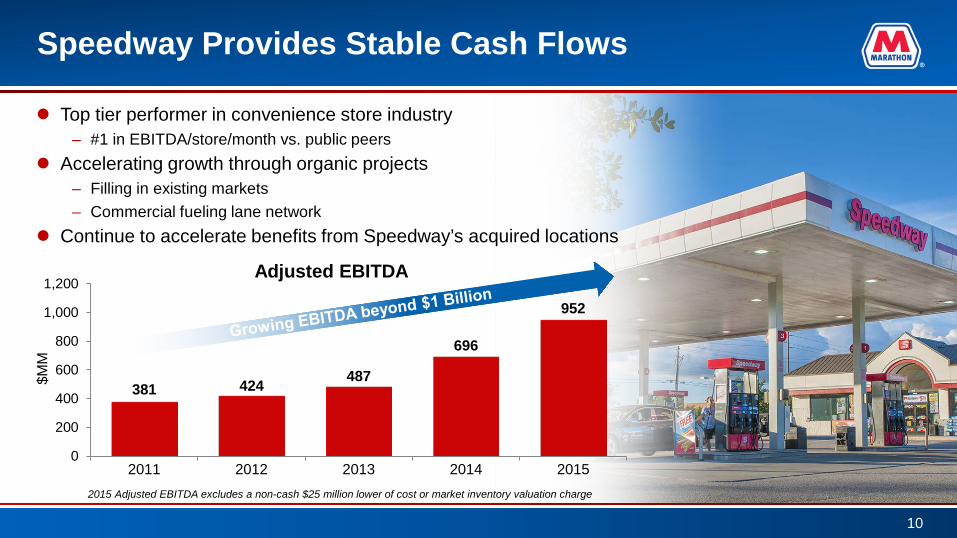
Speedway Provides Stable Cash Flows
Top tier performer in convenience store industry – #1 in EBITDA/store/month vs. public peers
Accelerating growth through organic projects – Filling in existing markets – Commercial fueling lane network
Continue to accelerate benefits from Speedway’s acquired locations
10
381 424 487
696
952
0
200
400
600
800
1,000
1,200
2011 2012 2013 2014 2015
$MM
Adjusted EBITDA
2015 Adjusted EBITDA excludes a non-cash $25 million lower of cost or market inventory valuation charge

Maintain Financial Flexibility Through Cycle
Maintain an investment grade credit profile
Optimize capital spend – Disciplined entity-wide capital allocation process – 2016 capital expenditure forecast reduced by $1.2 B – Continual evaluation of capital spend
11

MPC Consolidated 2016 Revised Capital Outlook
0
500
1,000
1,500
2,000
2,500
3,000
3,500
4,000
4,500
2016 CapitalBudget
Refining &Marketing*
MPLX** Midstream*** Speedway Corporate andOther
2016 RevisedCapital Outlook
$MM
12
(~$100)
(~$650)
(~$400) (~$50) (~$20)
$3.0 B
$4.2 B
*Excludes Midstream. Includes 6-9 month deferral on spending for STAR program **Represents midpoint of MPLX capital expenditure guidance ***Includes R&M Midstream
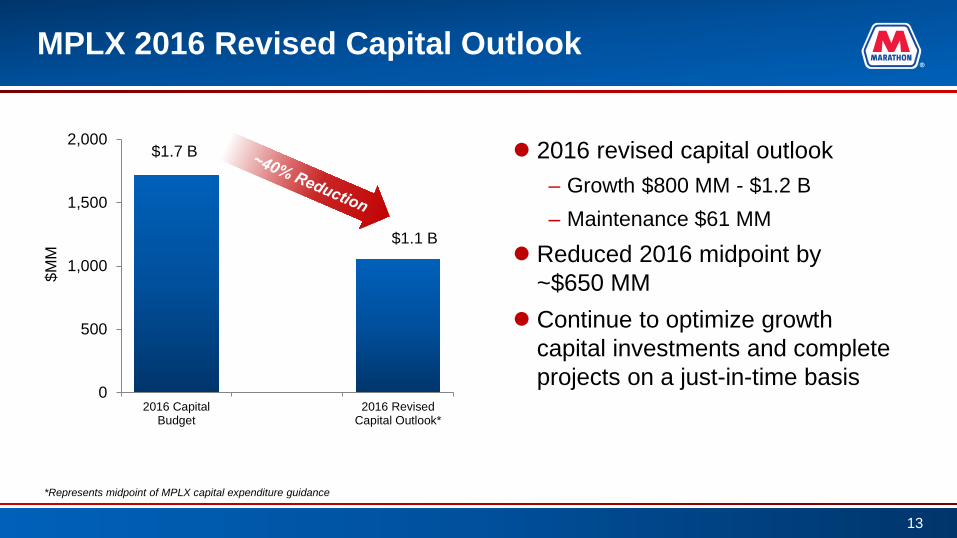
MPLX 2016 Revised Capital Outlook
0
500
1,000
1,500
2,000
2016 CapitalBudget
2016 RevisedCapital Outlook*
$MM
2016 revised capital outlook – Growth $800 MM - $1.2 B – Maintenance $61 MM
Reduced 2016 midpoint by ~$650 MM
Continue to optimize growth capital investments and complete projects on a just-in-time basis
13
*Represents midpoint of MPLX capital expenditure guidance
$1.1 B
$1.7 B

Growing More Stable Cash-Flow Business Segments
14
2016 Capital Outlook – $3.0 B
MPC – $1.9 B Refining & Marketing, excluding
Midstream – $1,045 MM
Midstream* – $440 MM
Speedway – $310 MM
Corporate & Other – $95 MM
MPLX – $1.1 B Growth $1,000 MM** Maintenance $61 MM
23%
13%
15%
36%
10% 3%
Speedway
Midstream*
MPLX
Refining Margin Enhancement
Corporate & Other
Refining Sustaining Capital
*Includes ~$250 MM of midstream investments included in the R&M segment. Excludes MPLX. **Represents midpoint of MPLX capital expenditure guidance

MPLX Outlook Supported by Forecasted Production Growth
(6,000)
(4,000)
(2,000)
-
2,000
4,000
6,000
8,000
10,000
Jan-14 Apr-14 Jul-14 Oct-14 Jan-15 Apr-15 Jul-15 Oct-15 Jan-16 Apr-16 Jul-16 Oct-16
MM
cf/d
YoY Gross Gas Production Growth by Region (MMcf/d)
Northeast Midwest Southeast Texas Southwest Rockies Net
Source: Bentek Market Call: North American NGLs – January 26, 2016
Forecast History
15
MPLX assets in prolific Northeast shale plays
Moderated volume growth in light of low commodity price environment
Quality producer-customers operate more efficiently in response to lower prices

Supporting MPLX’s Distribution Growth
Targeting a 12-15% growth rate in 2016, double digit distribution growth for 2017 Sale of marine business to MPLX in 2Q 2016 (~$120 MM of annual EBITDA)
– Supportive valuation of not greater than 6x EBITDA and will be accretive to MPLX – Securities issued to MPC in exchange for assets – Fee-for-capacity contracts with MPC
Potential for private placement of up to $1 B of securities from MPC – Direct funding or a combination of sponsor support tools eliminates need to access public markets in 2016
16

MPLX Enhances MPC’s Value
MarkWest Energy merger – Adds scale and diversity to MPC
– Adds high quality natural gas and NGL assets in prolific shale regions
– Significant commercial synergies and opportunities across value chain
Near term support provides long-term
value uplift – Cash distributions to MPC via LP units,
IDRs and drop-down proceeds
– Substantial inherent value
17

Driving Top Tier Financial Performance Through Sustainable Competitive Advantages
18
Fully integrated system provides optionality and flexibility
Strategically located assets Value of MPLX Consistent and reliable operator Sustained performance through all
cycles Disciplined, balanced approach to
capital allocation and capital return Top tier retail system
As of Dec. 31, 2015 See appendix for legend

Appendix
19
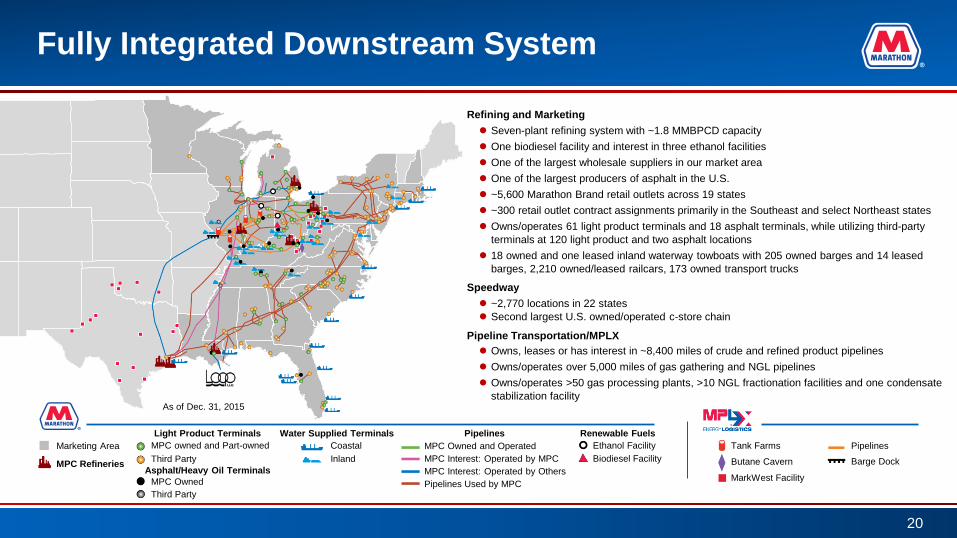
Fully Integrated Downstream System
Refining and Marketing Seven-plant refining system with ~1.8 MMBPCD capacity One biodiesel facility and interest in three ethanol facilities One of the largest wholesale suppliers in our market area One of the largest producers of asphalt in the U.S. ~5,600 Marathon Brand retail outlets across 19 states ~300 retail outlet contract assignments primarily in the Southeast and select Northeast states Owns/operates 61 light product terminals and 18 asphalt terminals, while utilizing third-party
terminals at 120 light product and two asphalt locations 18 owned and one leased inland waterway towboats with 205 owned barges and 14 leased
barges, 2,210 owned/leased railcars, 173 owned transport trucks
Speedway ~2,770 locations in 22 states Second largest U.S. owned/operated c-store chain
Pipeline Transportation/MPLX Owns, leases or has interest in ~8,400 miles of crude and refined product pipelines Owns/operates over 5,000 miles of gas gathering and NGL pipelines Owns/operates >50 gas processing plants, >10 NGL fractionation facilities and one condensate
stabilization facility
20
MPC Refineries
Light Product Terminals MPC owned and Part-owned Third Party
Asphalt/Heavy Oil Terminals MPC Owned Third Party
Water Supplied Terminals Coastal Inland
Pipelines MPC Owned and Operated MPC Interest: Operated by MPC MPC Interest: Operated by Others Pipelines Used by MPC
Marketing Area
MarkWest Facility
Tank Farms
Butane Cavern
Pipelines
Barge Dock
Ethanol Facility Biodiesel Facility
Renewable Fuels
As of Dec. 31, 2015

02468
1012141618
2010 2011 2012 2013 2014 2015 2016 2017 2018 2019 2020 2021 2022 2023 2024 2025
$/M
MB
tu
Natural Gas Price Comparison Japanese Liquefied Natural Gas (World Bank)*European Natural Gas (World Bank)*HH Spot Price (World Bank)
U.S. Refiners have a Sustained Export Advantage
21
Access to lower cost feedstocks Low cost natural gas Large, complex refineries High utilization rates Sophisticated workforce
Region 2014
Utilization Rate
North America 88%
MPC 95%
Former Soviet Union 80%
Europe 78%
Asia 77%
Latin America 75%
Middle East 71%
Africa 66%
Sources: World Bank, IEA, PIRA
*Average import border price

Distillate Also Leads U.S. Domestic Petroleum Fuels Demand
22
0
1
2
3
4
5
6
7
8
9
10
MM
BD
Compounded Annual
Growth Rates
Sources: U.S. Energy Information Administration (EIA), MPC
Gasoline
Gasoline ex ethanol
Distillate
Jet Fuel
Resid
-0.8%
-0.9%
+1.3%
+0.8%
-3.2%
Forecast Actual Gasoline demand declines due to corporate average fuel economy (CAFE) standards despite increased travel
Assuming 2014 vehicle efficiencies for all periods, gasoline demand (including ethanol): – 11.0 MMBD by 2020 – 12.3 MMBD by 2030
0
20
40
60
80
100
120
MM
BD
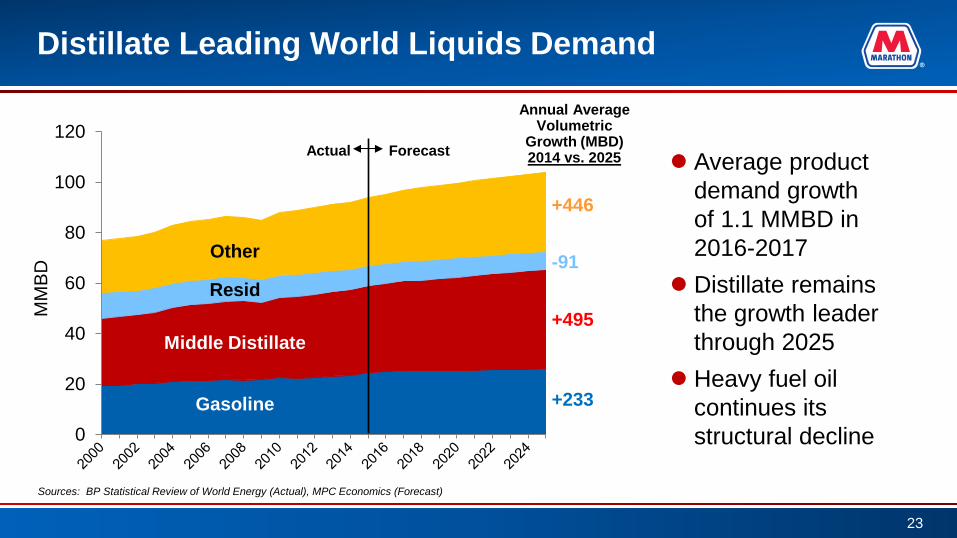
Distillate Leading World Liquids Demand
Average product demand growth of 1.1 MMBD in 2016-2017
Distillate remains the growth leader through 2025
Heavy fuel oil continues its structural decline
23
Sources: BP Statistical Review of World Energy (Actual), MPC Economics (Forecast)
Middle Distillate
Gasoline
Resid
Other
Annual Average Volumetric
Growth (MBD) 2014 vs. 2025
+446
-91
+495
+233
Forecast Actual
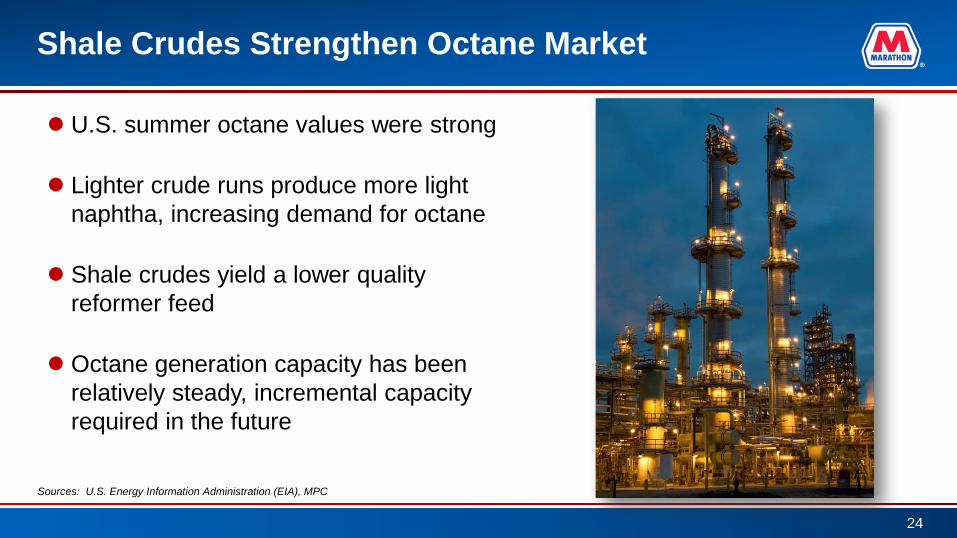
Shale Crudes Strengthen Octane Market
U.S. summer octane values were strong
Lighter crude runs produce more light naphtha, increasing demand for octane
Shale crudes yield a lower quality reformer feed
Octane generation capacity has been relatively steady, incremental capacity required in the future
24
Sources: U.S. Energy Information Administration (EIA), MPC
0
2
4
6
8
10
12
14
16
2010 2012 2014 2016 2018 2020
MM
BD
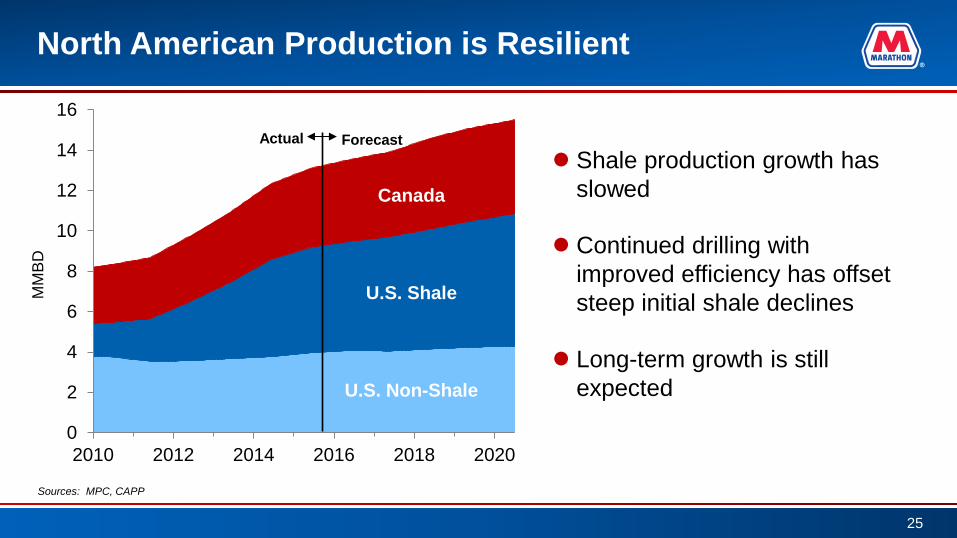
North American Production is Resilient
Shale production growth has slowed
Continued drilling with improved efficiency has offset steep initial shale declines
Long-term growth is still expected
25
Canada
U.S. Shale
Forecast Actual
U.S. Non-Shale
Sources: MPC, CAPP

Shale Producers Improving Efficiency
Shale producers becoming more efficient in low price environment
Producers are benefiting from: −Reduced services costs
(20-30%) −High grading acreage − Improved drilling and completion
efficiency − Improved production per well − Improved logistics to market
26
Sources: ITG IR, PIRA
0
100
200
300
400
500
600
700
2008 2009 2010 2011 2012 2013 2014 2015
BO
ED
Peak Production Added Per Rig
Alaska Coal-bed Methane
Tight Gas
Shale Gas
0
2
4
6
8
10
12
14
16
18
2000 2003 2006 2009 2012 2015 2018 2021 2024 2027 2030
MM
BO
ED
L48 Onshore Conventional
L48 Offshore
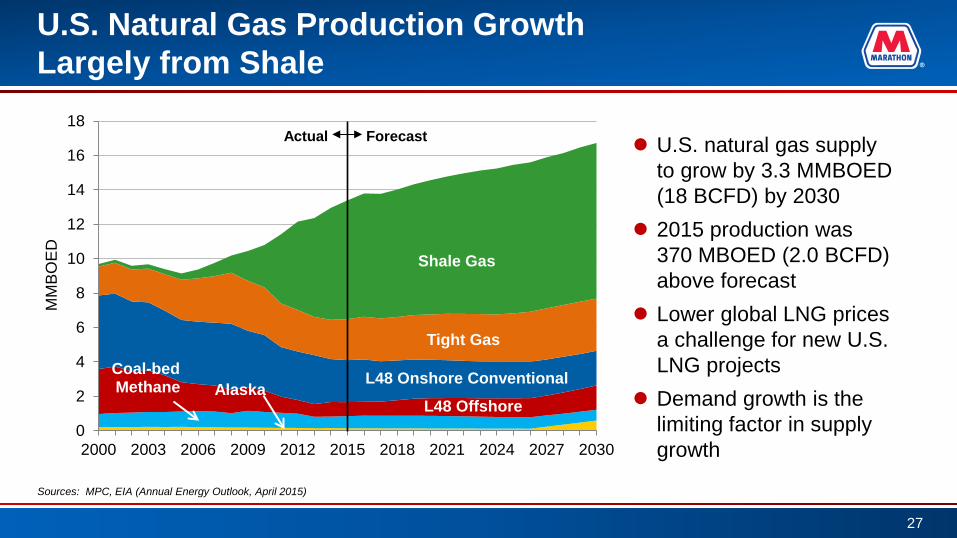
U.S. Natural Gas Production Growth Largely from Shale
U.S. natural gas supply to grow by 3.3 MMBOED (18 BCFD) by 2030
2015 production was 370 MBOED (2.0 BCFD) above forecast
Lower global LNG prices a challenge for new U.S. LNG projects
Demand growth is the limiting factor in supply growth
27
Sources: MPC, EIA (Annual Energy Outlook, April 2015)
Forecast Actual

U.S. NGL Volume Growth Creates a Need for Incremental Infrastructure
28
Nat. Gasoline
Butanes
Propane
Purity Ethane
Rejected Ethane
0
1
2
3
4
5
6
7
2005 2010 2015 2020 2025 2030
MM
BD
Forecast Actual
Source: MPC 2015 LT Forecast
2015 NGL production was up 250 MBD from March 2015’s forecast
Supply growth will be slowed but not derailed by lower prices
Ethane is rejected (retained in natural gas) when the ethane price nears the natural gas price
Ethane’s share of NGL production has fallen as more was rejected in 2015

U.S. Natural Gas and NGL Trade Flows Changing
Paradigm shift from U.S. Northeast being a significant importer to a significant exporter
Driven by Marcellus and Utica production growth Infrastructure continuing to build out to reflect changes in trade flows
29

Returning Capital to Shareholders Through Share Repurchases
30
0
2,000
4,000
6,000
8,000
$MM
Cumulative Share Repurchases
$10 B share repurchases authorized
$7.24 B returned to shareholders through repurchases
28% of June 30, 2011 shares outstanding repurchased
Since July 2011

$71 $89 $87 $85
$119 $116 $116 $113 $129 $126 $123 $122
$141 $138 $136 $136
$171 $170 $170
0
50
100
150
200
250
300
350
0.00
0.05
0.10
0.15
0.20
0.25
0.30
0.35
Q32011
Q42011
Q12012
Q22012
Q32012
Q42012
Q12013
Q22013
Q32013
Q42013
Q12014
Q22014
Q32014
Q42014
Q12015
Q22015
Q32015
Q42015
Q12016
$MM
$/S
hare
Dividend per Share Total Dividends Paid per Quarter
+25% $0.125
$0.10
+40% $0.175
+20% $0.21
+19% $0.25
+28% $0.32
Returning Capital to Shareholders Through Dividends
31
Note: All values adjusted for stock split in 2Q 2015

Galveston Bay-Texas City World-Class Refining Complex
32
Integrated Galveston Bay-Texas City Refinery Post-STAR
BPCD Unless Noted Galveston
Bay* Crude 585,000 Vacuum Distillation 225,200 Residual Hydrocracking 94,300 Coking 29,800 Catalytic Cracking 184,800 Catalytic Reforming 124,300 Catalytic Hydrocracking 65,600 Catalytic Hydrotreating 452,900 Alkylation 51,800 ROSE – Solvent Deasphalter 18,000 Aromatics 33,800 Isomerization — Selective Toluene Disproportionation 60,800 Cumene — Coke (Short Tons per Day) (1) 2,263 Sulfur (Long Tons per Day) (2) 1,351 Asphalt —
(1) Short Ton = 2,000 lbs. (2) Long Ton = 2,240 lbs. MPC estimates *Post STAR program completion in 2021

Refining Increasing EBITDA Through Continuous Process Improvements
Low or no investment projects
Focus on technical excellence
Improvements in process unit performance
EBITDA improvement of approximately $0.8 B since 2012
33
0
200
400
600
800
1,000
2013 2014 2015M
argi
n Im
prov
emen
t $M
M
Refining Process Improvements*
Galveston Bay All Other*Galveston Bay synergies included

0
50
100
150
200
250
300
350
2010 2011 2012 2013 2014 2015
MBD
MPC Finished Product Exports
0
200
400
600
800
1,000
1,200
1,400
1,600
1,800
2010 2011 2012 2013 2014 2015 NovYTD
MBD
Gross U.S. Finished Product Exports
Other U.S. MPC
Capitalizing on Growing U.S. Finished Product Exports
34
Sources: MPC, EIA

Producing Higher-Value Products
35
Investments of ~$360 MM contribute ~$130 MM EBITDA
Fluid Catalytic Cracking (FCC) projects Increase alkylate and light products
Garyville FCC/Alky – 2016 Investment: ~$220 MM
IRR 27%
Detroit FCC – 2018 Investment: ~$140 MM
IRR 26%
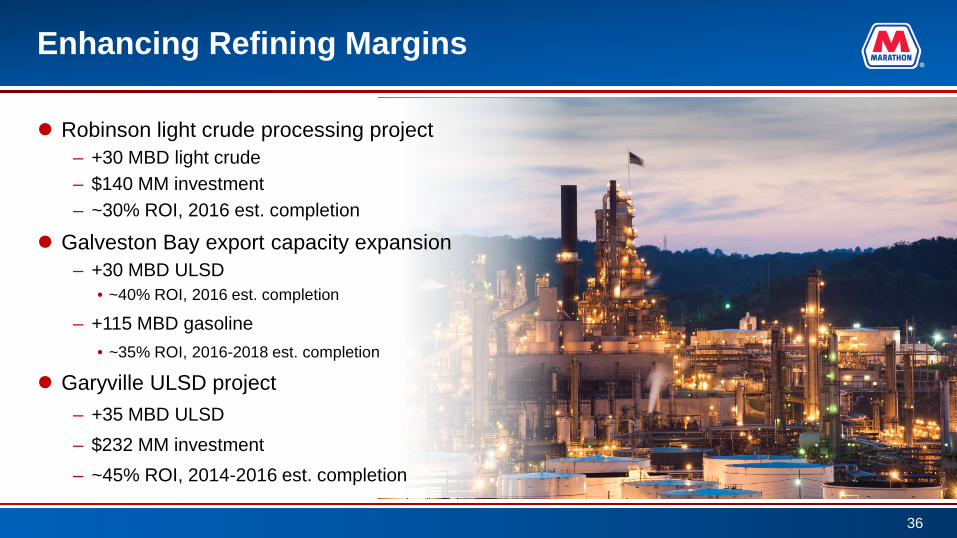
Enhancing Refining Margins
Robinson light crude processing project – +30 MBD light crude – $140 MM investment – ~30% ROI, 2016 est. completion
Galveston Bay export capacity expansion – +30 MBD ULSD
• ~40% ROI, 2016 est. completion
– +115 MBD gasoline • ~35% ROI, 2016-2018 est. completion
Garyville ULSD project – +35 MBD ULSD – $232 MM investment – ~45% ROI, 2014-2016 est. completion
36

Balance in Refining Network
Midwest Capacity 710,000 BPCD
Louisiana Capacity 539,000 BPCD
Texas Capacity 545,000 BPCD
BPCD NCI
Canton (Ohio) 93,000 7.8
Catlettsburg (Ky.) 273,000 9.2
Detroit (Mich.) 132,000 9.7
Robinson (Ill.) 212,000 10.5
Galveston Bay (Texas) 459,000 13.5
Texas City (Texas) 86,000 7.8
Garyville (La.) 539,000 11.2
Total 1,794,000 10.9*
37
*Weighted Average NCI
The Nelson Complexity Index is a construction cost-based measurement used to describe the investment cost of a refinery in terms of the process operations being conducted. It is basically the ratio of the process investment downstream of the crude unit to the investment of the crude unit itself. This index has many limitations as an indicator of value and is not necessarily a useful tool in predicting profitability. There is no consideration for operating, maintenance or energy efficiencies and no consideration of non-process assets such as tanks, docks, etc. Likewise it does not consider the ability to take advantage of market related feedstock opportunities. Source: MPC data as reported in the Oil & Gas Journal effective Dec. 31, 2015

MPC’s Value of Integration
Flexible refining system
Large retail presence
Extensive logistics with considerable optionality
1,000
1,500
2,000
2,500
3,000
3,500
1Q12 2Q12 3Q12 4Q12 1Q13 2Q13 3Q13 4Q13 1Q14 2Q14 3Q14 4Q14 1Q15 2Q15 3Q15 4Q15
$MM
Gross Margin Indicator Reported Gross Margin
Crude Price
Decline RIN $ Distortion
38
4Q 2015 excludes a non-cash $345 million lower of cost or market inventory valuation charge

Key Strengths
39
Balanced Operations
40% 60%
Crude Oil Refining Capacity
PADD IIPADD III
55% 45%
Crude Slate
Sour CrudeSweet Crude
~70% ~30% Assured Sales
Wholesale andOther Sales
Assured Sales of Gasoline Production (Speedway + Brand + Wholesale Contract Sales)
As of Dec. 31, 2015 4Q 2015
4Q 2015

Speedway: Pursuing Attractive and Accretive Acquisitions
Leverage MPC’s supply and logistical network
– Increase assured sales
– Optimize terminal utilization
Fill market voids in Speedway footprint
– High quality assets
– Continue focus in Pennsylvania and Tennessee
– Growth opportunities in Georgia, South Carolina and Florida panhandle
Capitalize on opportunistic acquisition environment
40
As of Dec. 31, 2015 See appendix for legend
Speedway Marketing Area
Speedway Location
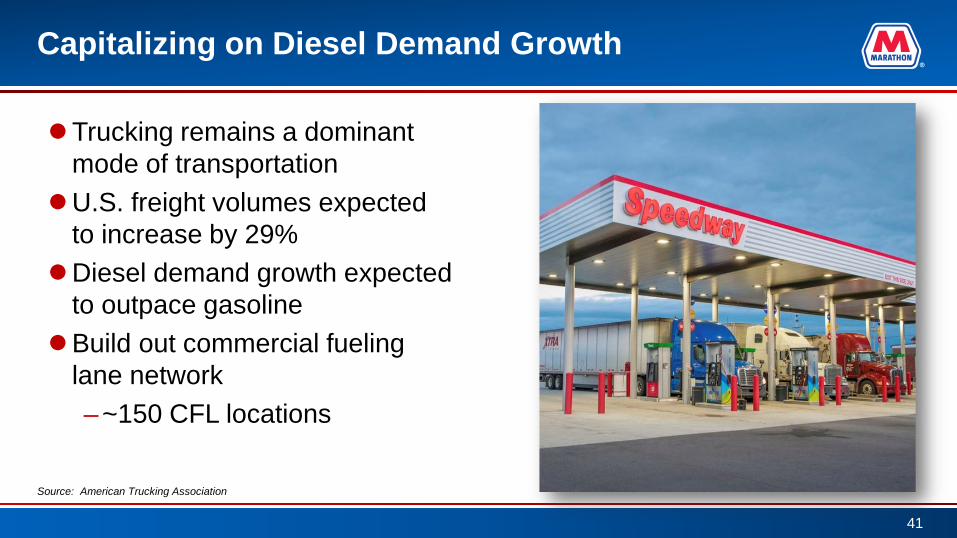
Capitalizing on Diesel Demand Growth
Trucking remains a dominant mode of transportation
U.S. freight volumes expected to increase by 29%
Diesel demand growth expected to outpace gasoline
Build out commercial fueling lane network –~150 CFL locations
41
Source: American Trucking Association

Following Through on Goals for Acquired Locations
Invest ~$570 MM in conversions, remodels and maintenance
Convert 1,245 stores to Speedway brand and technology platforms
Remodel approximately 700 locations to drive marketing enhancements
Generate $365 MM of annual EBITDA in 2017
Achieve $190 MM in annual synergies in 2017
42
20 30 35 10 20 40 45 45
45 25
70
0
50
100
150
200
2014E** 2015E 2016E 2017E
$MM
Synergies and Marketing Enhancements (Original Guidance)
WilcoHess Synergies Operating and G&A Expense SynergiesLight Product Supply and Logistics Marketing Enhancements
175
365 35 40
45 70
0
100
200
300
400
2013Pro Forma Hess
EBITDA*
Form 10WilcoHessSynergies
Operating andG&A Expense
Synergies
Light ProductSupply and
Logistics
MarketingEnhancements
2017E HessEBITDA
$MM
Earnings Opportunities (Original Guidance)
**Based on Oct. 1, 2014 closing
Sources: Company reports, MPC internal estimates *Sept. 30, 2013 Form 10 Pro Forma annualized
190
20
75
120

Focus on Improving Light Product Breakeven
Measure of operating efficiency and merchandise contribution to total expense
Potential to drive substantial value in the business over time
7.13
-1
1
3
5
7
9
11
13
2005 2013
Ligh
t Pro
duct
Bre
akev
en (c
pg)
2.56
12.39 Each 1.00 cent per
gallon improvement = ~$30 MM annual pretax earnings
Speedway Hess Sept. 30, 2013 Form 10 Estimate
LPBE = Total Expenses –
Merchandise Margin Light Product
Volume
43

Speedway and Hess Side-by-Side Comparison
Speedway generates an incremental $17,300 of merchandise margin per store per month
~$250 MM of additional annual merchandise margin potential across Hess retail
Hessa Speedwayb
Company Operated Sites 1,255 1,478
Fuel Sales (gallons/store/month) 198,500 177,400
Fuel Margin ($/gallon) $0.137 $0.144
Merchandise Sales ($/store/month) $111,000 $176,800
Merchandise Margin ($/store/month) $29,200 $46,500
a) 2013PF data provided in Hess Retail Corporation Form 10 SEC filing b) 2013 data provided in Marathon Petroleum Corporation 10K SEC filing
44
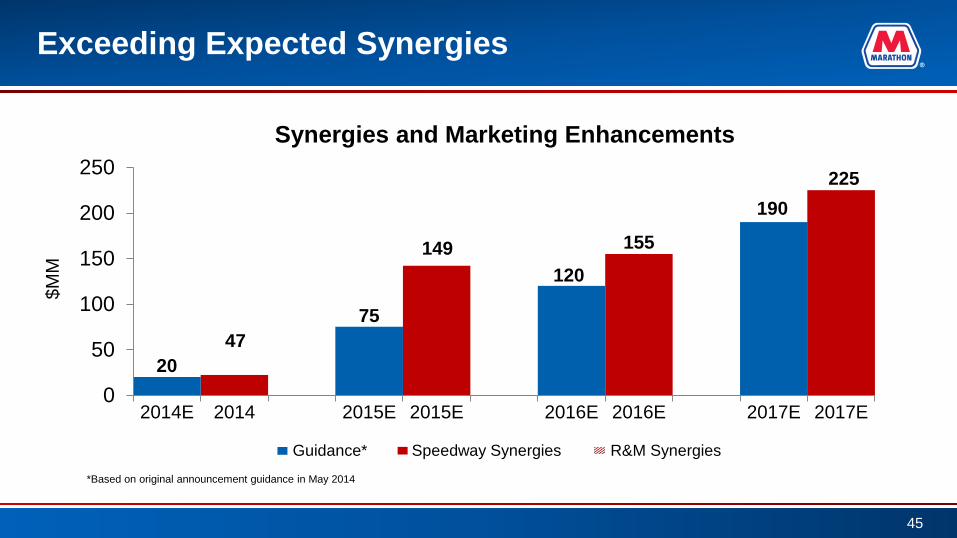
Exceeding Expected Synergies
20
75
120
155
190 225
0
50
100
150
200
250
2014E 2014 2015E 2015E 2016E 2016E 2017E 2017E
$MM
Synergies and Marketing Enhancements
Guidance* Speedway Synergies R&M Synergies
47
149
45
*Based on original announcement guidance in May 2014
2% GP interest
100% interest
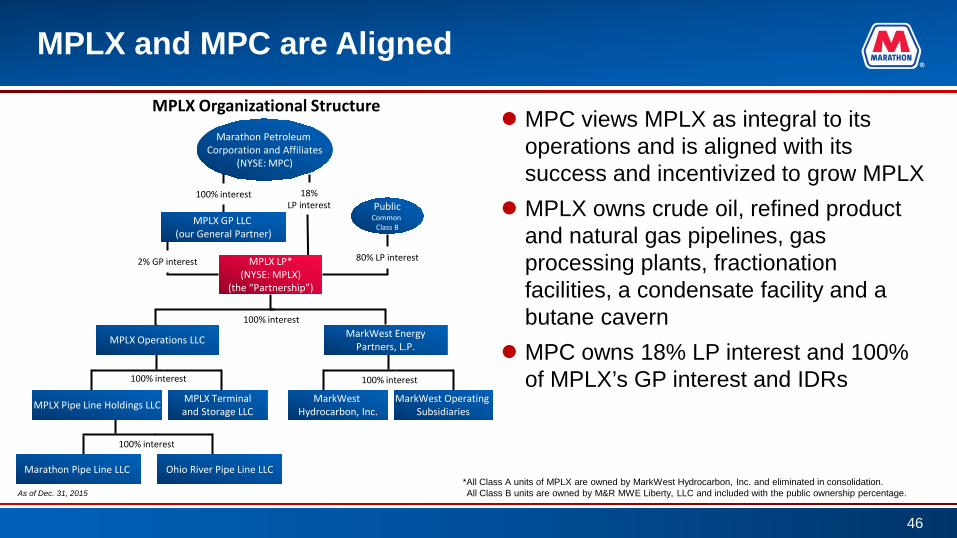
MPLX and MPC are Aligned
MPC views MPLX as integral to its operations and is aligned with its success and incentivized to grow MPLX
MPLX owns crude oil, refined product and natural gas pipelines, gas processing plants, fractionation facilities, a condensate facility and a butane cavern
MPC owns 18% LP interest and 100% of MPLX’s GP interest and IDRs
100% interest
r
100% interest Public
Common Class B
80% LP interest
Marathon Pipe Line LLC
100% interest
Ohio River Pipe Line LLC
MPLX GP LLC (our General Partner)
18% LP interest
MPLX LP* (NYSE: MPLX)
(the “Partnership”)
Marathon Petroleum Corporation and Affiliates
(NYSE: MPC)
MPLX Organizational Structure
46
As of Dec. 31, 2015 *All Class A units of MPLX are owned by MarkWest Hydrocarbon, Inc. and eliminated in consolidation. All Class B units are owned by M&R MWE Liberty, LLC and included with the public ownership percentage.
MPLX Pipe Line Holdings LLC MPLX Terminal and Storage LLC
MarkWest Energy Partners, L.P.
100% interest
MarkWest Hydrocarbon, Inc.
MarkWest Operating Subsidiaries
MPLX Operations LLC
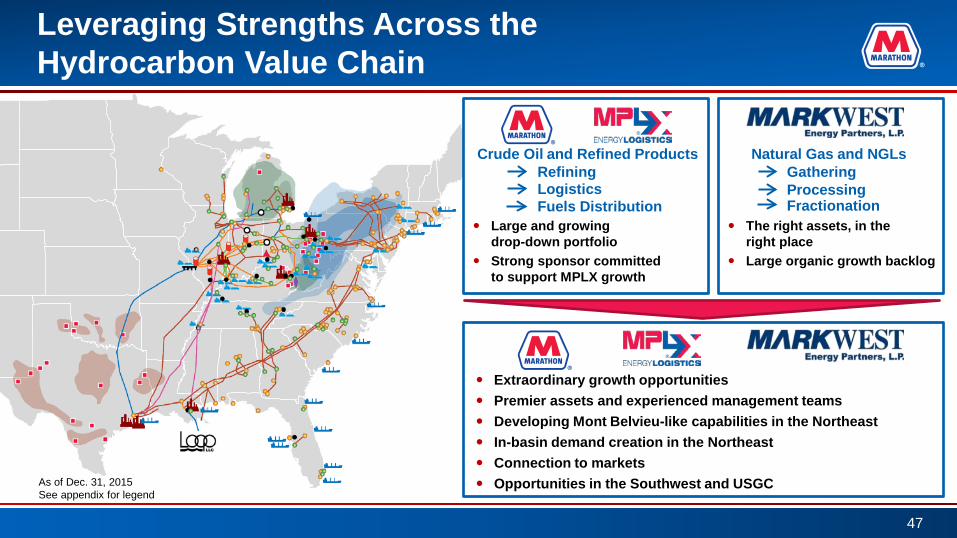
Leveraging Strengths Across the Hydrocarbon Value Chain
47
As of Dec. 31, 2015 See appendix for legend
Extraordinary growth opportunities Premier assets and experienced management teams Developing Mont Belvieu-like capabilities in the Northeast In-basin demand creation in the Northeast Connection to markets Opportunities in the Southwest and USGC
Crude Oil and Refined Products
Logistics Fuels Distribution
Refining
Large and growing drop-down portfolio
Strong sponsor committed to support MPLX growth
Natural Gas and NGLs
Processing Fractionation
Gathering
The right assets, in the right place
Large organic growth backlog

MarkWest History
48
2002: IPO of MarkWest Energy Partners 2002 – 2006: Rapid growth in Southwest; ~$1 B in acquisitions
2006 marks first No. 1 ranking in customer service 2008: MarkWest Hydrocarbon and MarkWest Energy Partners merge
Begins development in Marcellus Shale 2009 - 2011: Forms JV with Energy & Minerals Group (EMG) in Marcellus
Rapidly expands Marcellus footprint Acquires EMG interest; forms new JV for Utica development
2012 - 2015: Reaches 5 Bcf/d processing capacity Accelerates shale development: 30+ facilities and $7 B in organic capital
2015: 2nd largest gas processor, 4th largest fractionator in U.S. Strategic combination with MPLX
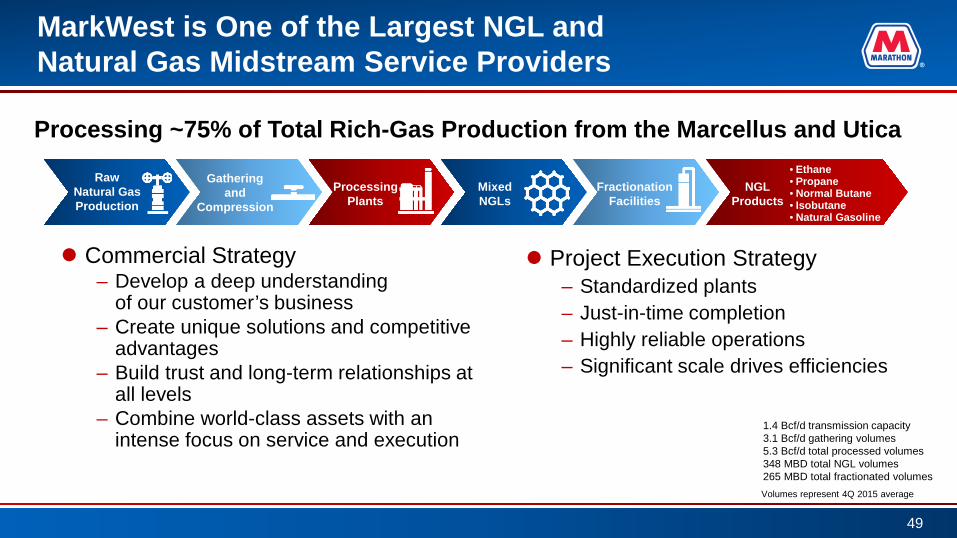
MarkWest is One of the Largest NGL and Natural Gas Midstream Service Providers
Processing ~75% of Total Rich-Gas Production from the Marcellus and Utica
Raw Natural Gas Production
Processing Plants
Mixed NGLs
Fractionation Facilities
NGL Products
• Ethane • Propane • Normal Butane • Isobutane • Natural Gasoline
Gathering and
Compression
Commercial Strategy – Develop a deep understanding
of our customer’s business – Create unique solutions and competitive
advantages – Build trust and long-term relationships at
all levels – Combine world-class assets with an
intense focus on service and execution
Project Execution Strategy – Standardized plants – Just-in-time completion – Highly reliable operations – Significant scale drives efficiencies
49
Volumes represent 4Q 2015 average
1.4 Bcf/d transmission capacity 3.1 Bcf/d gathering volumes 5.3 Bcf/d total processed volumes 348 MBD total NGL volumes 265 MBD total fractionated volumes
Doddridge
Marshall
Wetzel
Harrison
Noble
Butler
Washington
WEST VIRGINIA
PENNSYLVANIA
OHIO
Washington
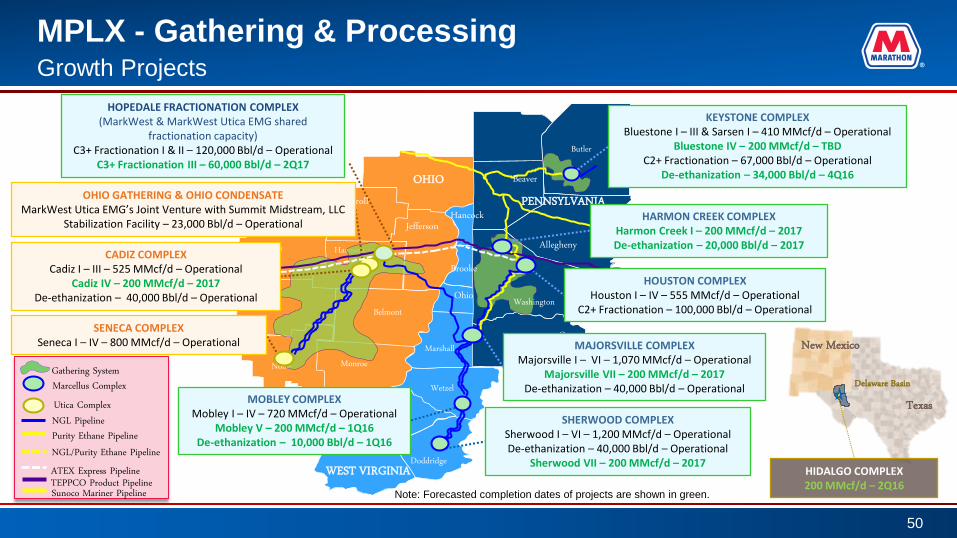
MPLX - Gathering & Processing
50
Growth Projects
Utica Complex
ATEX Express Pipeline
Purity Ethane Pipeline NGL Pipeline
NGL/Purity Ethane Pipeline
Sunoco Mariner Pipeline
Marcellus Complex Gathering System
TEPPCO Product Pipeline
Belmont
Monroe
Jefferson
Carroll
Tuscarawas
Beaver
Allegheny
Brooke
Hancock
Ohio
Greene
KEYSTONE COMPLEX Bluestone I – III & Sarsen I – 410 MMcf/d – Operational
Bluestone IV – 200 MMcf/d – TBD C2+ Fractionation – 67,000 Bbl/d – Operational
De-ethanization – 34,000 Bbl/d – 4Q16
HARMON CREEK COMPLEX Harmon Creek I – 200 MMcf/d – 2017 De-ethanization – 20,000 Bbl/d – 2017
HOUSTON COMPLEX Houston I – IV – 555 MMcf/d – Operational
C2+ Fractionation – 100,000 Bbl/d – Operational
MAJORSVILLE COMPLEX Majorsville I – VI – 1,070 MMcf/d – Operational
Majorsville VII – 200 MMcf/d – 2017 De-ethanization – 40,000 Bbl/d – Operational
MOBLEY COMPLEX Mobley I – IV – 720 MMcf/d – Operational
Mobley V – 200 MMcf/d – 1Q16 De-ethanization – 10,000 Bbl/d – 1Q16
SHERWOOD COMPLEX Sherwood I – VI – 1,200 MMcf/d – Operational De-ethanization – 40,000 Bbl/d – Operational
Sherwood VII – 200 MMcf/d – 2017
HOPEDALE FRACTIONATION COMPLEX (MarkWest & MarkWest Utica EMG shared
fractionation capacity) C3+ Fractionation I & II – 120,000 Bbl/d – Operational
C3+ Fractionation III – 60,000 Bbl/d – 2Q17
CADIZ COMPLEX Cadiz I – III – 525 MMcf/d – Operational
Cadiz IV – 200 MMcf/d – 2017 De-ethanization – 40,000 Bbl/d – Operational
SENECA COMPLEX Seneca I – IV – 800 MMcf/d – Operational
OHIO GATHERING & OHIO CONDENSATE MarkWest Utica EMG’s Joint Venture with Summit Midstream, LLC
Stabilization Facility – 23,000 Bbl/d – Operational
HIDALGO COMPLEX 200 MMcf/d – 2Q16
Texas
New Mexico
Delaware Basin
Note: Forecasted completion dates of projects are shown in green.

MPLX - Gathering & Processing
51
Marcellus & Utica Processing
Area 4Q15 Average
Capacity (MMcf/d)(a)
4Q15 Average Volume (MMcf/d)
4Q15 Utilization
(%)
Marcellus 3,835 2,841 74%
Utica 1,325 1,080 82%
4Q15 Total 5,160 3,921 76%
3Q15 Total 5,039 3,795 75% -
1,000
2,000
3,000
4,000
5,000
1Q13 1Q14 1Q15 1Q16F
MMcf/d
Forecasted Avg. Increase from FY2015 to FY2016
~20%
Total gas processed of 3.9 Bcf/d; facility utilization of 76%
Six processing plants with 1.2 Bcf/d of capacity placed into service in 2015
Growing producer activity in 2016 to support 20% increase in year-over-year processed volumes
(a) Based on weighted average number of days plant(s) in service
1Q16
thro
ugh
4Q16
Avg
.

MPLX - Gathering & Processing
52
Marcellus & Utica Fractionation
Area
4Q15 Average Capacity
(MBbl/d)(a)
4Q15 Average Volume (MBbl/d)
4Q15 Utilization
(%)
4Q15 Total C3+ 207 175 85%
4Q15 Total C2 150 78 52%
3Q15 Total C3+ 192 169 88%
3Q15 Total C2 134 71 53% -
50
100
150
200
250
300
1Q13 1Q14 1Q15 1Q16F
MBbl/d
Forecasted Avg. Increase from FY2015 to FY2016
~30%
Completed over 70,000 Bbl/d of C2+ fractionation capacity at the Keystone and Sherwood complexes
Approximately 30% forecasted average increase in fractionation volumes from 2015 to 2016
(a) Based on weighted average number of days plant(s) in service
1Q16
thro
ugh
4Q16
Avg
.

-
200
400
600
800
1,000
1,200
1,400
1Q13 1Q14 1Q15 1Q16F
MMcf/d
MPLX - Gathering & Processing
53
Southwest Processing
Area
4Q15 Average Capacity
(MMcf/d)(a)
4Q15 Average Volume (MMcf/d)
4Q15 Utilization
(%)
East Texas 600 478 80%
Western OK 435 312 72%
Southeast OK(b) 120 120 100%
Gulf Coast 142 112 79%
4Q15 Total 1,297 1,022 79%
3Q15 Total 1,201 1,006 84%
Total gas processed of over 1 Bcf/d
New 200 MMcf/d processing plant in Permian expected to commence in 2Q16
Cana-Woodford and Permian to support 15% processed volume increase in 2016
~15% Forecasted
Avg. Increase from FY2015 to FY2016
(a) Based on weighted average number of days plant(s) in service (b) Processing capacity includes Partnership’s portion of Centrahoma JV
1Q16
thro
ugh
4Q16
Avg
.
3
8
13
18
23
28
55
56
57
58
59
60
61
62
63
64
65
Jan-10 Jan-11 Jan-12 Jan-13 Jan-14 Jan-15 Jan-16
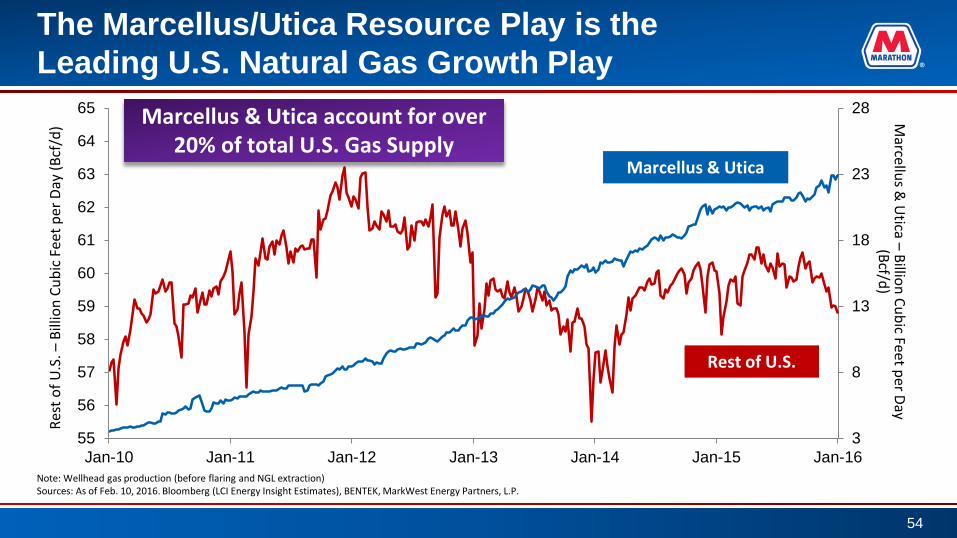
The Marcellus/Utica Resource Play is the Leading U.S. Natural Gas Growth Play
Rest
of U
.S. –
Bill
ion
Cubi
c Fe
et p
er D
ay (B
cf/d
)
Note: Wellhead gas production (before flaring and NGL extraction) Sources: As of Feb. 10, 2016. Bloomberg (LCI Energy Insight Estimates), BENTEK, MarkWest Energy Partners, L.P.
Marcellus &
Utica – Billion Cubic Feet per Day
(Bcf/d)
Marcellus & Utica account for over 20% of total U.S. Gas Supply
Marcellus & Utica
Rest of U.S.
54

Overall Midstream Growth Investments of over $9 B Contributing Approximately $1.3 B EBITDA(1)
55
24 to 36 months
MarkWest Growth Investments - Cash Flow Return Profile
$7.5 B of forecasted growth capital to be
invested from 2016-2020
~7.0x Cash Flow Multiple
~$1 B of Mid-2022 Incremental
Run-Rate Cash Flow
MPC/Legacy MPLX Major Midstream Growth Investments Summary
($MM) Estimated Investment Estimated
EBITDA MPC MPLX Total Sandpiper $1,000 $1,000 $150
Blue Water investment 544(2) 544(2) 55
Cornerstone and Utica Build-out $510 510 80
MPC Feedstock Cost of Supply Improvements 55 170 225 35
Pipeline and Tank Farm Expansions 7 133 140 25
Subtotals $1,606(2) $813 $2,419(2) $345 (1) Does not include MPC/MPLX/MarkWest synergistic opportunities (2) Includes both MPC capital investment and assumption of debt

$0 $2 $4 $6 $8 $10 $12 $14 $16 $18 $20 $22 $24 $26 $28 $30 $32 $34
Backlog of Midstream Organic Growth and Drop-down Investment Opportunities
56
$0.8 B $7.5 B
$6 - 9 B
$13 - 16 B
$27 - 33 B
MPLX Organic Capital through 2018*
MarkWest Organic Capital 2016 to 2020 ($1.5 B annual run-rate)
MarkWest/MPLX/MPC Synergistic Capital
MPC Drop-down Capital (Assumes 8-10x EBITDA multiple)
*Does not include MPC organic growth investments, including Sandpiper and blue water equity, which are included in MPC drop-down capital
$27 - 33 B to Support Distribution Growth

$0 $2 $4 $6 $8 $10 $12 $14 $16 $18 $20 $22 $24 $26 $28 $30 $32 $34
Legacy MPLX has Attractive Organic Growth Backlog Estimated to Generate ~$125 MM of EBITDA
$0.8 B MPLX Organic Capital through 2018(1)
Cornerstone and Utica Build-out Industry solution for Utica liquids
57
Pipeline and Tank Farm Expansions MPC and third-party logistics solutions
Robinson Butane Cavern MPC shifting third-party services to MPLX
and optimizing Robinson butane handling
Other projects in development(2)
(1) Estimate does not include MPC organic growth investments, including Sandpiper and blue water equity, which are included in MPC drop-down capital (2) Estimated $0.8 B investment and associated EBITDA does not include other projects in development

$0 $2 $4 $6 $8 $10 $12 $14 $16 $18 $20 $22 $24 $26 $28 $30 $32 $34
$7.5 B
MarkWest has Robust Portfolio of Growth Projects Expected to Deliver ~$1 B of EBITDA
MarkWest Organic Capital 2016 to 2020 ($1.5 B annual run-rate)
Organic Growth Opportunities in the Northeast: Expansion of gas gathering systems Development of additional processing and fractionation
infrastructure Expansion of additional NGL transportation logistics
Organic Growth Opportunities in the Southwest: Expansion of gathering and processing infrastructure to support
continued development of the Cana-Woodford and Haynesville Greenfield development of midstream system in the Delaware Basin
of the Permian
Northeast
Southwest
58

$0 $2 $4 $6 $8 $10 $12 $14 $16 $18 $20 $22 $24 $26 $28 $30 $32 $34
Leveraging Premier Positions Across the Value Chain with Substantial Incremental Combined Opportunities
59
$6 - 9 B MarkWest/MPLX/MPC Synergistic Capital
Opportunity Investment 1 Northeast (N.E.) alkylation facility $1.5 - 2.0 B
2 N.E. gasoline blending/storage/dehydrogenation $1.0 - 2.0 B
3 N.E. and long-haul NGL pipeline/infrastructure $1.0 - 1.5 B
4 Rogersville shale infrastructure $1.0 B
5 Northeast dry gas gathering (Ohio, Pa., W.Va.) $0.5 - 1.0 B
6 Ethane cracker infrastructure $0.5 - 1.0 B
7 Midstream infrastructure to support refineries $0.5 - 1.0 B
8 NGL logistics infrastructure in the USGC and SW $0.5 - 1.0 B
9 N.E. condensate stabilization expansion $0.1 B
1
2
3 4 5
6
7
8 9

$0 $2 $4 $6 $8 $10 $12 $14 $16 $18 $20 $22 $24 $26 $28 $30 $32 $34
Growing MPC’s Drop-down Inventory Provides Visibility to Significant Growth
*Sandpiper Pipeline expected 2019 in-service
● 59 MMBBL storage (tanks and caverns) ● 25 rail loading racks and 26 truck loading racks; 7 owned and 11 non-owned docks ● 2 condensate splitter investments
● 21 owned and 2,189 leased ● 793 general service; 1,102 high pressure; 315 open-top hoppers
● ~ 5,400 miles of additional pipelines (owns, leases or has an ownership interest) ● Southern Access Extension Pipeline and Sandpiper Pipeline*
● 61 light product; ~20 MMBBL storage; 187 loading lanes ● 18 asphalt; ~4 MMBBL storage; 68 loading lanes ● Utica investments (crude & condensate trucking and truck/barge terminals)
● 205 owned and 14 leased inland barges ● 18 owned and one leased inland towboats ● Equity in 50/50 blue water JV with Crowley
● 20 B gallons of fuels distribution volume at MPC/Speedway
60
$13 - 16 B MPC Drop-down Capital (Assumes 8-10x EBITDA multiple)
Railcars
Pipelines
Terminals
Marine
Refineries Fuels Distribution

Butane to Alkylate (BTA) – Developing Mt. Belvieu Capabilities in the Northeast: $1.5 - 2 B of Opportunity
61
Combines MarkWest’s leading Northeast NGL position with MPC’s premier downstream
expertise to transform refinery blendstock supply in the Northeast and Midwest
Enhancing the gasoline blendstock value chain
Alkylate is an ideal gasoline blending component that will become increasingly valuable with pending fuel regulations (Tier 3, NAAQS, CAFÉ)
The U.S. still imports over 500 MBD of gasoline blendstock components into the Northeast; opportunity to displace imports
Upgrade butane from the Marcellus and Utica into alkylate, leveraging MarkWest and MPC’s position
Provides additional local demand for Marcellus and Utica NGL production, and a new supply source of refinery blendstock
Cost: $1.5 - 2.0 B IRR: ~15% EBITDA: $400 - 500 MM Estimated in-service: 2nd half 2020

UMTP
- Operated by Kinder Morgan - Batched purity and y-grade to Gulf Coast - Conversion of Tennessee Gas Pipeline
Northeast and Long-Haul NGL Pipeline and Related Infrastructure Development
62
NGL/Light Products to East Coast
- Large-scale East Coast LPG export terminal - Rail/pipeline to East Coast export terminal - Optionality and operational certainty for
producers
Centennial Pipeline
- Repurpose refined products line to deliver NGLs to the Gulf Coast
2
1
$1 – 1.5 B in Opportunities
3
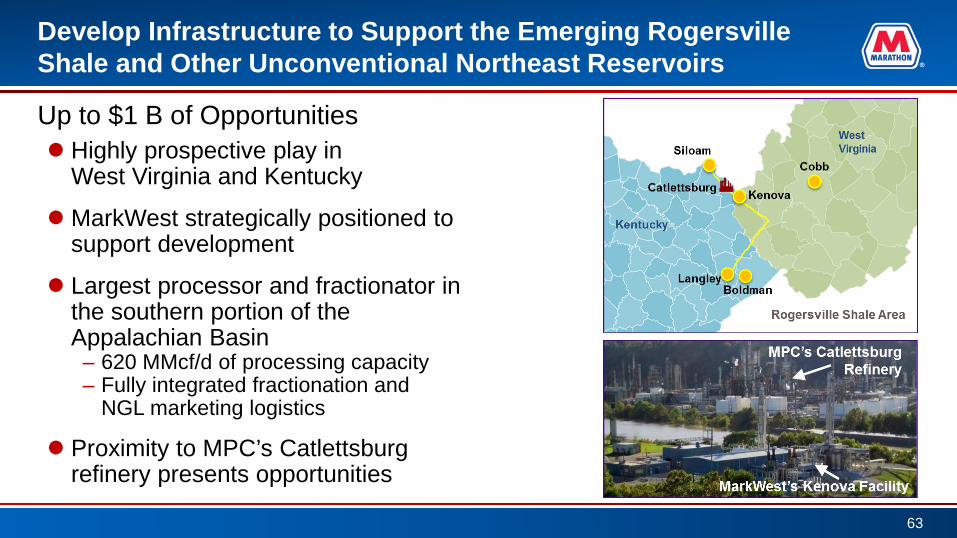
Develop Infrastructure to Support the Emerging Rogersville Shale and Other Unconventional Northeast Reservoirs
Highly prospective play in West Virginia and Kentucky
MarkWest strategically positioned to support development
Largest processor and fractionator in the southern portion of the Appalachian Basin – 620 MMcf/d of processing capacity – Fully integrated fractionation and
NGL marketing logistics
Proximity to MPC’s Catlettsburg refinery presents opportunities
63
Up to $1 B of Opportunities
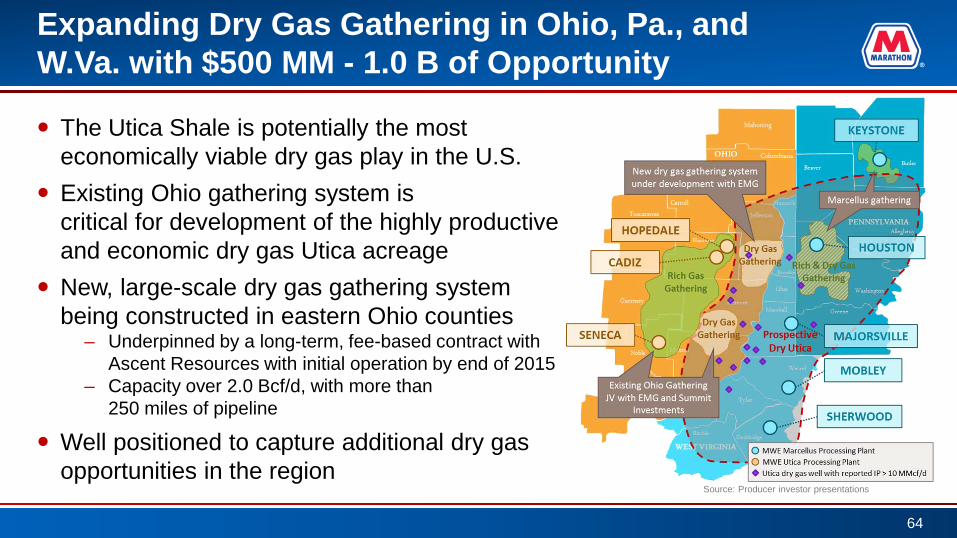
Expanding Dry Gas Gathering in Ohio, Pa., and W.Va. with $500 MM - 1.0 B of Opportunity
64
The Utica Shale is potentially the most economically viable dry gas play in the U.S.
Existing Ohio gathering system is critical for development of the highly productive and economic dry gas Utica acreage
New, large-scale dry gas gathering system being constructed in eastern Ohio counties
– Underpinned by a long-term, fee-based contract with Ascent Resources with initial operation by end of 2015
– Capacity over 2.0 Bcf/d, with more than 250 miles of pipeline
Well positioned to capture additional dry gas opportunities in the region
Source: Producer investor presentations

MPLX Gathering & Processing Contract Structure
65
Durable long-term partnerships across leading basins
Marcellus Utica Southwest Resource Play
Marcellus, Upper Devonian
Utica Haynesville, Cotton Valley, Woodford, Anadarko Basin, Granite Wash, Cana-Woodford, Permian, Eagle Ford
Producers 14 – including Range, Antero, EQT, CNX, Noble, Southwestern, Rex and others
10 – including Antero, Gulfport, Ascent, Rice, Rex, PDC and others
140 – including Anadarko, Newfield, Devon, BP, Chevron, PetroQuest, and others
Contract Structure Long-term agreements initially 10-15 years, which contain renewal provisions
Long-term agreements initially 10-15 years, which contain renewal provisions
Long-term agreements initially 10-15 years, which contain renewal provisions
Volume Protection (MVCs) 70% of 2016 capacity contains minimum volume commitments
25% of 2016 capacity contains minimum volume commitments
15% of 2016 capacity contains minimum volume commitments
Area Dedications 4 million acres 3.9 million acres 1.4 million acres
Inflation Protection Yes Yes Yes

69%
23%
8%
MPC Commited MPC Additional Third Party
MPLX Logistics & Storage Contract Structure
L&S assets consist of fee-based pipeline systems and storage assets
Minimal commodity exposurec
MPC has historically accounted for over 85% of the volumes shipped on MPLX’s crude and product pipelines
MPC has entered into multiple long-term transportation and storage agreements with MPLX
– Terms of up to 10 years, beginning in 2012 – Pipeline tariffs linked to FERC-based rates – Indexed storage fees
66
2015 Revenue – Customer Mix
MPC = 92%
$400 MM
$130 MM
$47 MM
a,b
Notes: a) Includes revenues generated under Transportation and Storage agreements with MPC b) Volumes shipped under joint tariff agreements are accounted for as third party for GAAP purposes, but represent MPC barrels shipped c) Commodity exposure only to the extent of volume gains and losses

MPLX 2016 Forecast
67
$X,X
XX-$
X,XX
X
$XXX
-$XX
X
Financial Measure 2016 Forecast
Net Income $325 million - $485 million
Adjusted EBITDA $1.25 billion - $1.40 billion
Distributable Cash Flow $970 million - $1.10 billion
Distribution Growth Rate 12% - 15%
Growth Capital Expenditures $0.8 billion - $1.2 billion

U.S./Canada Key Existing and Planned Pipelines
MBPD Pipeline In-Service Date
200 Diamond 2017
450 Dakota Access 2017
450 ETCO (Trunkline Conversion)
2017
225/375 Sandpiper 2019
300 +590
Trans Mountain Trans Mountain Expansion
Current 2019
525 Northern Gateway 2019
1,100 Energy East 2020
Sources: Publicly available Information
68

Opportunity Set for Investment is Expanded
69
Multiple Funding Options - Extensive Financial Flexibility
• Capacity to incubate MPLX growth projects at MPC
• Ability to take back MPLX units as payment for drop-downs
• Intercompany funding
• Other options
MPC Sponsor Support for MPLX
Earnings MLP Distribution MLP Proceeds Capital Markets
Capital Sources
Sustaining Growth Refining
Major Projects
Midstream Pipeline Projects Terminal Projects Marine Projects
Retail
Sustaining Growth Cornerstone
MPLX Pipeline Butane Cavern
MarkWest Investments MPC Drop-downs
Capital Sources Earnings
Equity (Units) Debt
MPC Support
Interest Taxes
Maintenance Dividends
Capital Return
Distributions Coverage
Maintenance Interest
Equity Incubate Projects
Growth Management

MPC’s Strong Liquidity and Capitalization
Committed to maintaining investment grade credit profile and financial flexibility Operate with prudent leverage and strong liquidity throughout the refining cycle
70
Immediately Available Liquidity As of December 31, 2015 ($MM)
Cash and Cash Equivalents $ 1,127
Revolver (undrawn) 2,500
Trade Receivable Facility (undrawn)*
668
Total $ 4,295 *Availability is a function of refined product selling prices
Liquidity and Capitalization($MM except ratio data)
As of 12/31/15
Total Debt Outstanding(1) 11,925$ Stockholders' Equity 19,675Total Capitalization 31,600Total Cash 1,127Net Debt 10,798
LTM EBITDA(2) 6,338Total Debt/EBITDA 1.88xDebt-to-Capital Ratio (book) 38%
Debt-to-Capital Ratio (market)(3) 43%(1)Includes amounts due within one year(2)Non-GAAP - see appendix for reconciliation(3)Calculated based on market prices and shares outstanding at Dec. 31, 2015

4,300
600
800
2,500
400
750-1,750
Requirements DownsideOperatingCash Flow
Revolver TradeReceivables
Facility
Implied Cash0
500
1,000
1,500
2,000
2,500
3,000
3,500
4,000
Sustaining Core Liquidity Under All Environments
$30/BBL crude price environment
Operating Requirements (Non-Discretionary Capex, Interest, Taxes, Dividends)
Unexpected Liquidity Needs (Letters of Credit, Operating Upset, Working Capital)
Crude Price - Core Liquidity Sensitivity (Primarily a function of working capital exposure and credit availability)
(a) $1.0 B facility - forecasted 2016 availability is approximately $400 MM. Availability is a function of refined product selling prices.
Target Cash
200 – 600
(a)
$MM
71

MPLX’s Financial Flexibility to Manage and Grow Asset Base
Committed to maintaining investment grade credit profile
Completed bond exchange in December 2015
Increased revolving credit facility to $2 B
Entered into a $500 MM credit facility with MPC
72
($MM except ratio data) As of 12/31/15
Cash and cash equivalents 43
Total assets 15,677
Long-term debt(a) 5,255
Total equity 9,254
Consolidated total debt to consolidated EBITDA ratio (covenant basis)(b)(c) 4.6x
Outstanding balance of $2.0 B revolving credit agreement 877
Outstanding balance of $500 MM credit agreement with MPC 8
(a) Includes all long-term debt and amounts drawn on revolving credit facilities (b) Maximum covenant ratio <= 5.0 or 5.5 during the six month period following certain acquisitions (c) Consolidated EBITDA is subject to adjustments for certain acquisitions completed and capital projects undertaken during the relevant period

Generating Significant Cash Flow Through All Cycles
73
Pro Forma EBITDA Adjusted for Current Configuration
Pro Forma EBITDA
*MarkWest mid-cycle EBITDA based on 2015 results
0
2,000
4,000
6,000
8,000
10,000
2008 2009 2010 2011 2012 2013 2014 2015 2008 thru2015 Mid-
CycleRefining and Marketing SpeedwayPipeline Transportation Depr. & Amort. less corporate expenseGME DHOUPGalveston Bay Hess RetailMarkWest*
$MM

Source: Company Reports
MPC vs. Peer Companies’ Operating Income per Barrel
74
MPC’s Rank
Competitor Range
Companies Ranked*
Operating Income Per Barrel of Crude Throughput**
*Current companies ranked: BP, CVX, HFC, MPC, PSX, TSO, VLO, XOM, PBF **Adjusted domestic operating income per barrel of crude oil throughput
11 12 11 9 10 9 8 9 9 8 10 8 8 8 8 8 8 9
December YTD
Preliminary
-5
0
5
10
15
20
1998 1999 2000 2001 2002 2003 2004 2005 2006 2007 2008 2009 2010 2011 2012 2013 2014 2015
$/B
BL
3 3 2
1
2 3 7
2 1
5 3
1 3
1 2
2 3 6

Reconciliations
75
($MM) 2011 2012 2013 2014 2015 Speedway Segment Income from Operations 271 310 375 544 673 Plus: Depreciations and Amortization 110 114 112 152 254 Plus: Lower of Cost or Market Inventory Valuation Charge - - - - 25 Speedway Segment Adjusted EBITDA 381 424 487 696 952
Speedway Segment Adjusted EBITDA to Segment Income from Operations
EBITDA to Net Income for Acquired Locations
($MM) 1st Twelve Month Estimate
1st Twelve Month Actual 2017E*
Income from Operations 93 166 138 Plus: Provision for income taxes 33 58 78 Plus: Depreciation and Amortization 124 124 149 Acquired Locations EBITDA 250 348 365
*Based on original announcement guidance in May 2014
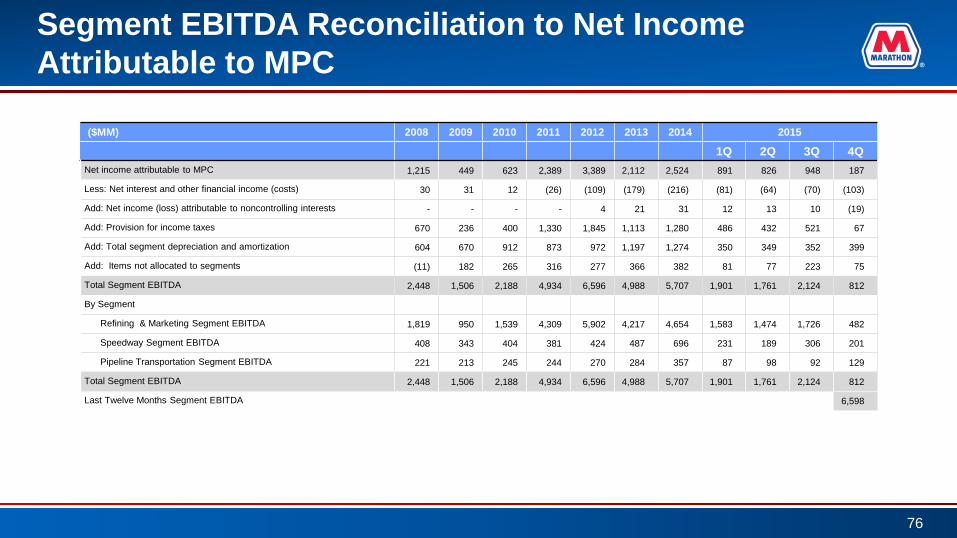
Segment EBITDA Reconciliation to Net Income Attributable to MPC
76
($MM) 2008 2009 2010 2011 2012 2013 2014 2015
1Q 2Q 3Q 4Q Net income attributable to MPC 1,215 449 623 2,389 3,389 2,112 2,524 891 826 948 187
Less: Net interest and other financial income (costs) 30 31 12 (26) (109) (179) (216) (81) (64) (70) (103)
Add: Net income (loss) attributable to noncontrolling interests - - - - 4 21 31 12 13 10 (19)
Add: Provision for income taxes 670 236 400 1,330 1,845 1,113 1,280 486 432 521 67
Add: Total segment depreciation and amortization 604 670 912 873 972 1,197 1,274 350 349 352 399
Add: Items not allocated to segments (11) 182 265 316 277 366 382 81 77 223 75
Total Segment EBITDA 2,448 1,506 2,188 4,934 6,596 4,988 5,707 1,901 1,761 2,124 812
By Segment
Refining & Marketing Segment EBITDA 1,819 950 1,539 4,309 5,902 4,217 4,654 1,583 1,474 1,726 482
Speedway Segment EBITDA 408 343 404 381 424 487 696 231 189 306 201
Pipeline Transportation Segment EBITDA 221 213 245 244 270 284 357 87 98 92 129
Total Segment EBITDA 2,448 1,506 2,188 4,934 6,596 4,988 5,707 1,901 1,761 2,124 812
Last Twelve Months Segment EBITDA 6,598

EBITDA Reconciliation to Net Income Attributable to MPC
77
($MM) 2014 2015
1Q 2Q 3Q 4Q 1Q 2Q 3Q 4Q
Net income attributable to MPC 199 855 672 798 891 826 948 187
Less: Net interest and other financial income (costs) (46) (48) (50) (72) (81) (64) (70) (103)
Add: Net income (loss) attributable to noncontrolling interests 8 9 7 7 12 13 10 (19)
Add: Provision for income taxes 108 457 333 382 486 432 521 67
Add: Total depreciation and amortization 320 325 322 359 363 362 508 413
Total EBITDA 681 1,694 1,384 1,618 1,833 1,697 2,057 751
Last Twelve Months EBITDA 6,338

EBITDA Reconciliation to Net Income for Hess
78
($MM) 2013* 2017E
Net Income 47 138
Less: Net interest and other financial income (costs) (12) -
Add: Provision for income taxes 22 78
Add: Total depreciation and amortization 94 149
EBITDA 175 365
*Based on Hess Sept. 30, 2013 Form 10 data annualized
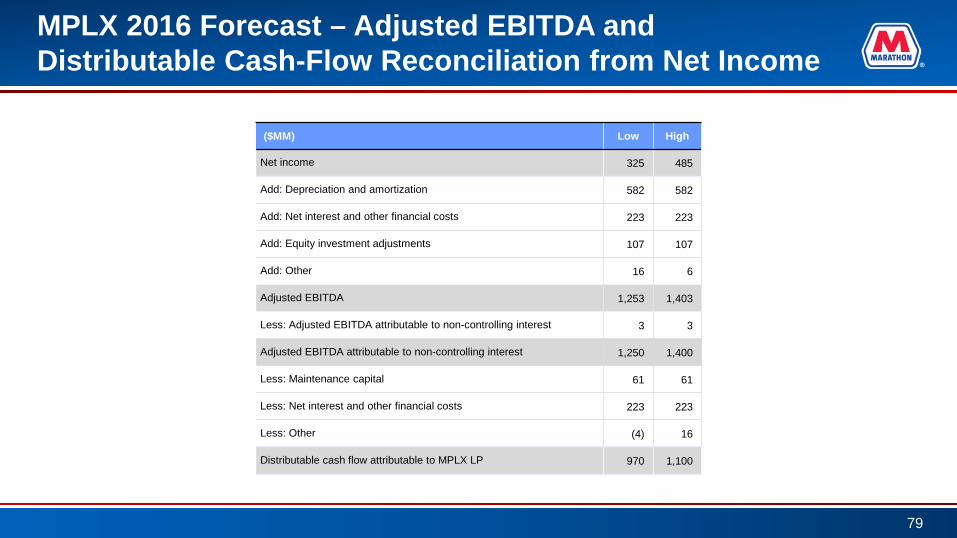
MPLX 2016 Forecast – Adjusted EBITDA and Distributable Cash-Flow Reconciliation from Net Income
79
($MM) Low High
Net income 325 485
Add: Depreciation and amortization 582 582
Add: Net interest and other financial costs 223 223
Add: Equity investment adjustments 107 107
Add: Other 16 6
Adjusted EBITDA 1,253 1,403
Less: Adjusted EBITDA attributable to non-controlling interest 3 3
Adjusted EBITDA attributable to non-controlling interest 1,250 1,400
Less: Maintenance capital 61 61
Less: Net interest and other financial costs 223 223
Less: Other (4) 16
Distributable cash flow attributable to MPLX LP 970 1,100

Annual Price and Margin Sensitivities $MM (After Tax)
LLS 6-3-2-1 Crack Spread* Sensitivity ~$450 (per $1.00/barrel change) Sweet/Sour Differential** Sensitivity ~$220 (per $1.00/barrel change) LLS-WTI Spread*** Sensitivity ~$90 (per $1.00/barrel change) Natural Gas Price Sensitivity ~$140 (per $1.00/MMbtu change in Henry Hub)
*Weighted 40% Chicago and 60% USGC LLS 6-3-2-1 crack spreads and assumes all other differentials and pricing relationships remain unchanged
**Light Louisiana Sweet (prompt) - [Delivered cost of sour crudes: Arab Light + Kuwait + Maya + Western Canadian Select + Mars]
***Assumes 20% of crude throughput volumes are WTI-based domestic crudes
80

1Q 2016 Outlook
81
*Region throughput data includes inter-refinery transfers, but MPC totals exclude transfers **Includes utilities, labor, routine maintenance and other operating costs ***Includes $1 MM of pension settlement expense in 1Q 2015 ****$/barrel throughput
Crude Throughput*
Other Charge/
Feedstocks Throughput*
Total Throughput*
Percent of WTI-priced
Crude
Turnaround and Major
Maintenance
Depreciation and
Amortization
Other Manufacturing
Cost**
Total Direct
Operating Costs
Corporate and Other
Unallocated Items***
in MBD Refinery Direct Operating Costs****
Proj
ecte
d
1Q 2
016
Gulf Coast Region 975 200 1,175 4% $3.15 $1.20 $4.50 $8.85 Midwest Region 575 50 625 42% $2.00 $2.10 $4.75 $8.85
MPC Total 1,550 150 1,700 18% $2.90 $1.55 $4.90 $9.35 $85 MM
1Q 2
015
Gulf Coast Region 1,031 179 1,210 5% $0.80 $1.14 $3.99 $5.93 Midwest Region 641 36 677 43% $0.73 $1.85 $4.51 $7.09
MPC Total 1,672 180 1,852 20% $0.79 $1.42 $4.26 $6.47 $81 MM

Market Indicators Used in Project EBITDA Calculations
82
2016-2020 Average
2016-2020 Range
REG UNL (USGC; $/GAL)* $2.03 $1.60 - $2.23
ULSD (USGC; $/GAL)* $2.32 $1.89 - $2.52
LLS (St. James, LA; $/BBL) $79.47 $61.80 - $87.43
Natural Gas (Henry Hub, LA; $/MMBTU) $4.27 $3.50 - $5.00
*Prices exclude RIN value obligation