bank of america merrill lynch 2017 energy credit conference · © 2017 csi compressco lp bank of...
TRANSCRIPT

© 2017 CSI Compressco LP
www.CSICompressco.com
Bank of America Merrill Lynch2017 Energy Credit Conference
June 6, 2017
Elijio SerranoChief Financial Officer

© 2017 CSI Compressco LP
This presentation contains “forward-looking statements” and information based on our beliefs and those of our general partner. Forward-lookingstatements in this presentation are identifiable by the use of the following words and other similar words: “anticipates”, “assumes”, “believes”,“budgets”, “could”, “estimates”, “expects”, “forecasts”, “goal”, “intends”, “may”, “might”, “plans”, “predicts”, “projects”, “schedules”, “seeks”, “should,“targets”, “will” and “would”. These forward-looking statements may include statements concerning expected results of operations for 2017,anticipated benefits and growth of CSI Compressco LP following the acquisition of Compressor Systems, Inc. (CSI), including increases in cashdistributions per unit, financial guidance, estimated distributable cash, estimated earnings, earnings per unit, and statements regarding CSICompressco’s beliefs, expectations, plans, goals, future events and performance, and other statements that are not purely historical. When used,such forward-looking statements reflect our current views with respect to future events and financial performance and are based on assumptions thatwe believe to be reasonable but such forward-looking statements are subject to numerous risks and uncertainties, including, but not limited to:economic and operating conditions that are outside of our control, including the supply, demand, and prices of crude oil and natural gas; the levels ofcompetition we encounter; the activity levels of our customers; the availability of adequate sources of capital to us; our ability to comply withcontractual obligations, including those under our financing arrangements; our operational performance; risks related to acquisitions and our growthstrategy, including our acquisition of Compressor Systems, Inc.; the availability of raw materials and labor at reasonable prices; risks related to ourforeign operations; the effect and results of litigation, regulatory matters, settlements, audits, assessments, and contingencies; and other risks anduncertainties contained in our most recent Annual Report on Form 10-K and other filings with the U.S. Securities and Exchange Commission(“SEC”), which are available free of charge on the SEC website at www.sec.gov. The risks and uncertainties referred to above are generally beyondour ability to control and we cannot predict all the risks and uncertainties that could cause our actual results to differ from those indicated by theforward-looking statements. If any of these risks or uncertainties materialize, or if any of the underlying assumptions prove incorrect, actual resultsmay vary from those indicated by the forward-looking statements, and such variances may be material. All subsequent written and oral forward-looking statements made by or attributable to us or to persons acting on our behalf are expressly qualified in their entirety by reference to these risksand uncertainties. You should not place undue reliance on forward-looking statements. Each forward-looking statement speaks only as of the dateof the particular statement, and we undertake no obligation to update or revise any forward-looking statements we may make, except as may berequired by law.
Please Note: CSI Compressco™, GasJack®, VJack™, and Compressco® are jointly registered trademarks or trademarks of CSI CompresscoOperating LLC and CSI Compressco Sub Inc. in the United States and/or other countries.
2
Forward Looking Statements

© 2017 CSI Compressco LP
CSI Compressco LP (NASDAQ: CCLP) 46 years of growth supporting oil and gas industry Over 600 employees in more than 30 locations 1.11M Hp in fleet with 0.85M Hp operating as of March 31, 2017
TETRA Technologies, Inc. (NYSE: TTI) Owns 2% GP interest and IDR’s as well as 43% of common units
3
CSI Compressco LP Overview
NASDAQ: CCLP
Recent Unit Price [1] $5.50
Market Capitalization [1] $189.8M
Enterprise Value [1] $787.0M
Distribution Annualized [2] $0.75
Distribution Yield [2] 13.6%
Corporate Headquarters The Woodlands, TX
1970 201720102005200019951990
1971Compressor
Systems, Inc. “CSI” established
1993CSI surpasses 1,000,000 Hp of
compression packaged
1997CSI compression fleet exceeds 250,000 Hp 2001
CSI surpasses 2,000,000 Hp of
compression packaged
2006CSI compression fleet exceeds 500,000 Hp 2012
CSI surpasses 4,000,000 Hp of
compression packaged
2004Compressco Field Services
acquired by TETRA Technologies, Inc.
1985GasJack invented;
GasJack Co. established
1999GasJack Co. renamed
Compressco Field Services
2011Compressco Partners
IPO on NASDAQ under ticker GSJK
2014Combined CCLP fleet exceeds 1,000,000 Hp
20095,000th GasJack
built
(1) Unit price as of market close May 31, 2017; Market Capitalization and Enterprise Value based upon March 31, 2017 most recently reported units outstanding and debt(2) Q1 2017 quarterly distribution of $0.1875 per common unit paid May 15, 2017; Yield calculated as annualized quarterly distribution of $0.75 divided by $5.50 unit price as of market close May 31, 2017
Largest Vertically Integrated Compression Provider
2014Compressco Partners acquires
Compressor Systems, Inc. formingCSI Compressco LP
(ticker changed to CCLP)
© 2017 CSI Compressco LP 4
Q1 2017 Highlights
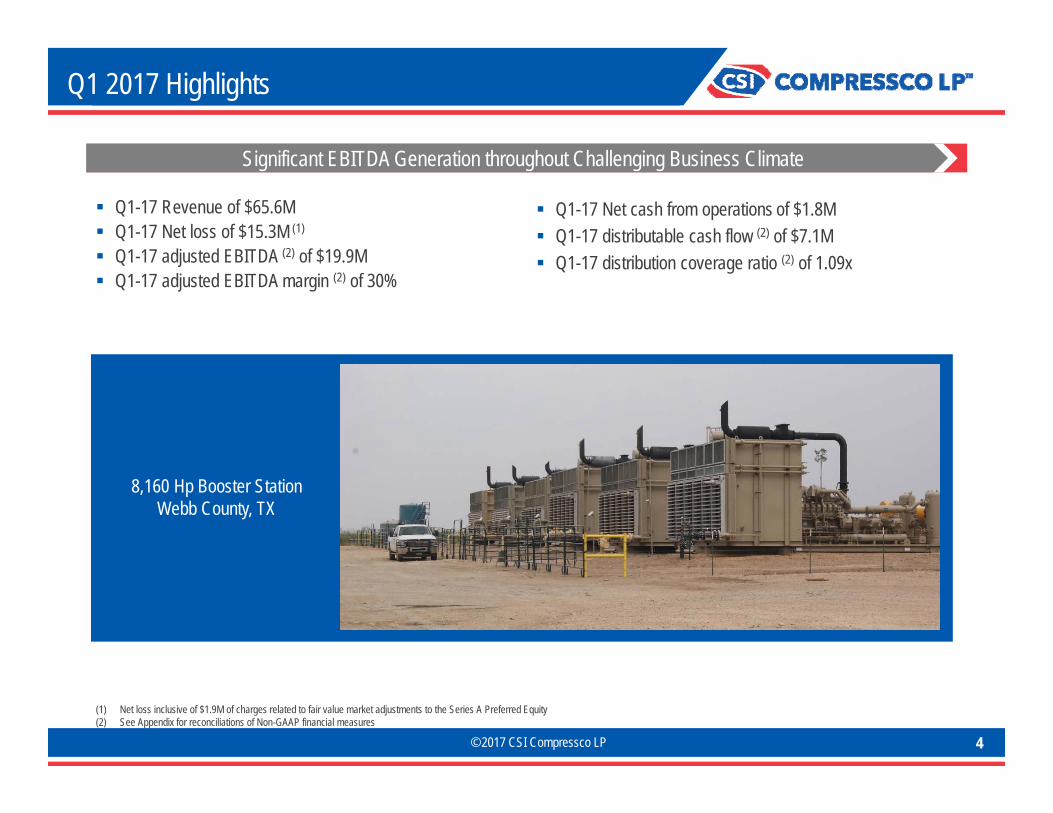
Q1-17 Revenue of $65.6M Q1-17 Net loss of $15.3M (1)
Q1-17 adjusted EBITDA (2) of $19.9M Q1-17 adjusted EBITDA margin (2) of 30%
Significant EBITDA Generation throughout Challenging Business Climate
1,380 Hp Compression ServiceField Gathering
Midland County, TX
(1) Net loss inclusive of $1.9M of charges related to fair value market adjustments to the Series A Preferred Equity(2) See Appendix for reconciliations of Non-GAAP financial measures
Q1-17 Net cash from operations of $1.8M Q1-17 distributable cash flow (2) of $7.1M Q1-17 distribution coverage ratio (2) of 1.09x
1,380 Hp Compression ServiceField Gathering
Midland County, TX8,160 Hp Booster Station
Webb County, TX
© 2017 CSI Compressco LP 5
Investment Highlights
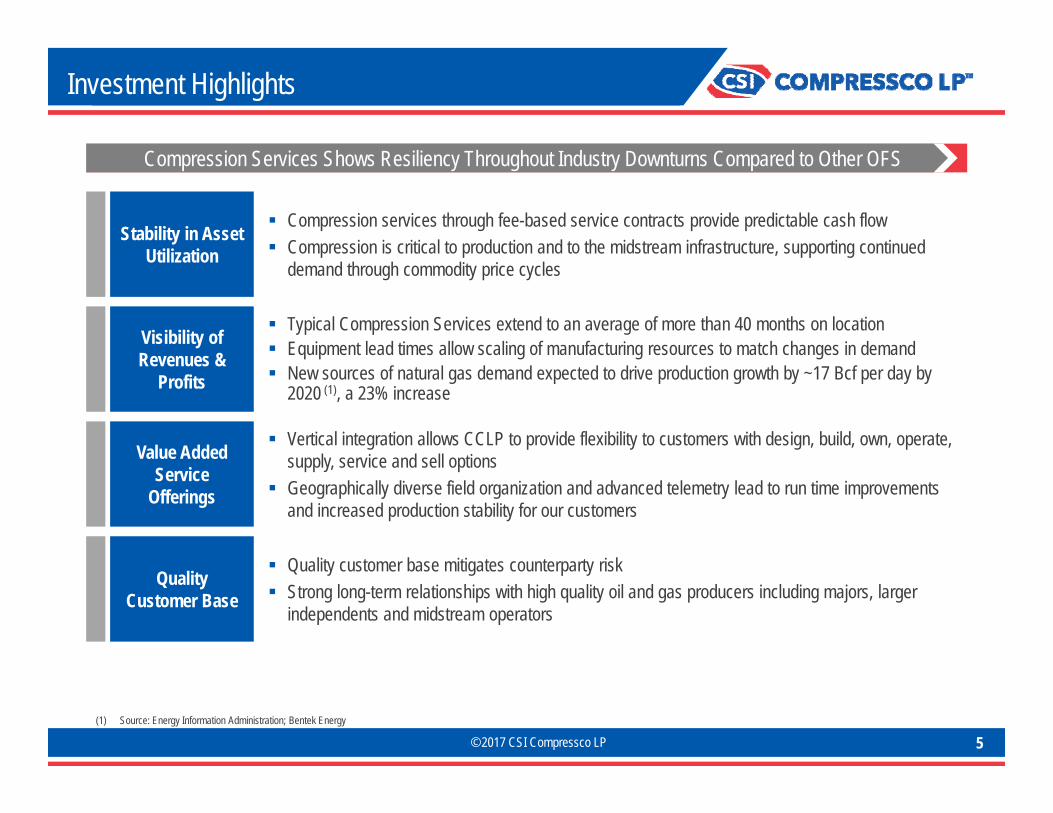
Compression services through fee-based service contracts provide predictable cash flow Compression is critical to production and to the midstream infrastructure, supporting continued
demand through commodity price cycles
Stability in Asset Utilization
Value Added Service
Offerings
Vertical integration allows CCLP to provide flexibility to customers with design, build, own, operate, supply, service and sell options
Geographically diverse field organization and advanced telemetry lead to run time improvements and increased production stability for our customers
Quality Customer Base
Quality customer base mitigates counterparty risk Strong long-term relationships with high quality oil and gas producers including majors, larger
independents and midstream operators
Visibility of Revenues &
Profits
Typical Compression Services extend to an average of more than 40 months on location Equipment lead times allow scaling of manufacturing resources to match changes in demand New sources of natural gas demand expected to drive production growth by ~17 Bcf per day by
2020 (1), a 23% increase
Compression Services Shows Resiliency Throughout Industry Downturns Compared to Other OFS
(1) Source: Energy Information Administration; Bentek Energy
© 2017 CSI Compressco LP 6
Compression Overview
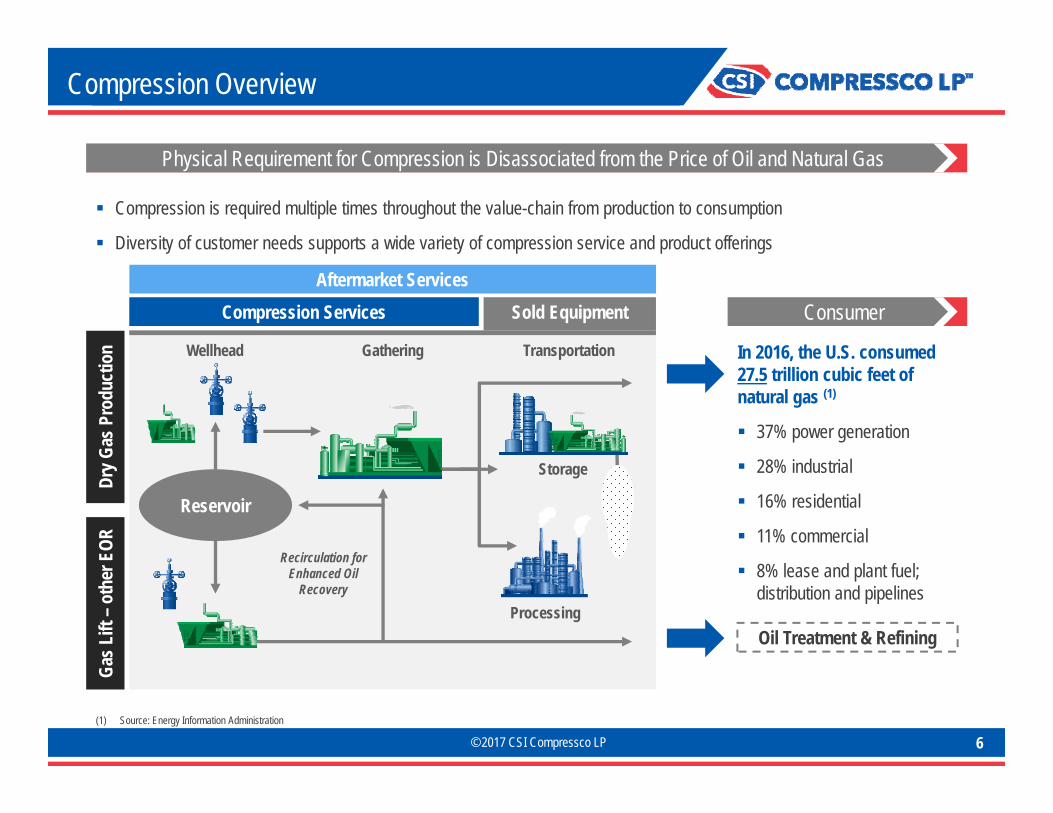
Compression is required multiple times throughout the value-chain from production to consumption
Diversity of customer needs supports a wide variety of compression service and product offerings
(1) Source: Energy Information Administration
In 2016, the U.S. consumed 27.5 trillion cubic feet of natural gas (1)
37% power generation
28% industrial
16% residential
11% commercial
8% lease and plant fuel; distribution and pipelines
Consumer
Oil Treatment & Refining
Reservoir
Dry G
as P
rodu
ctio
nGa
s Lift
–ot
her E
OR
Compression Services
GatheringWellhead
Processing
Transportation
Sold Equipment
Storage
Recirculation for Enhanced Oil
Recovery
Physical Requirement for Compression is Disassociated from the Price of Oil and Natural Gas
Aftermarket Services
© 2017 CSI Compressco LP 7
CCLP Business Model – Vertically Integrated
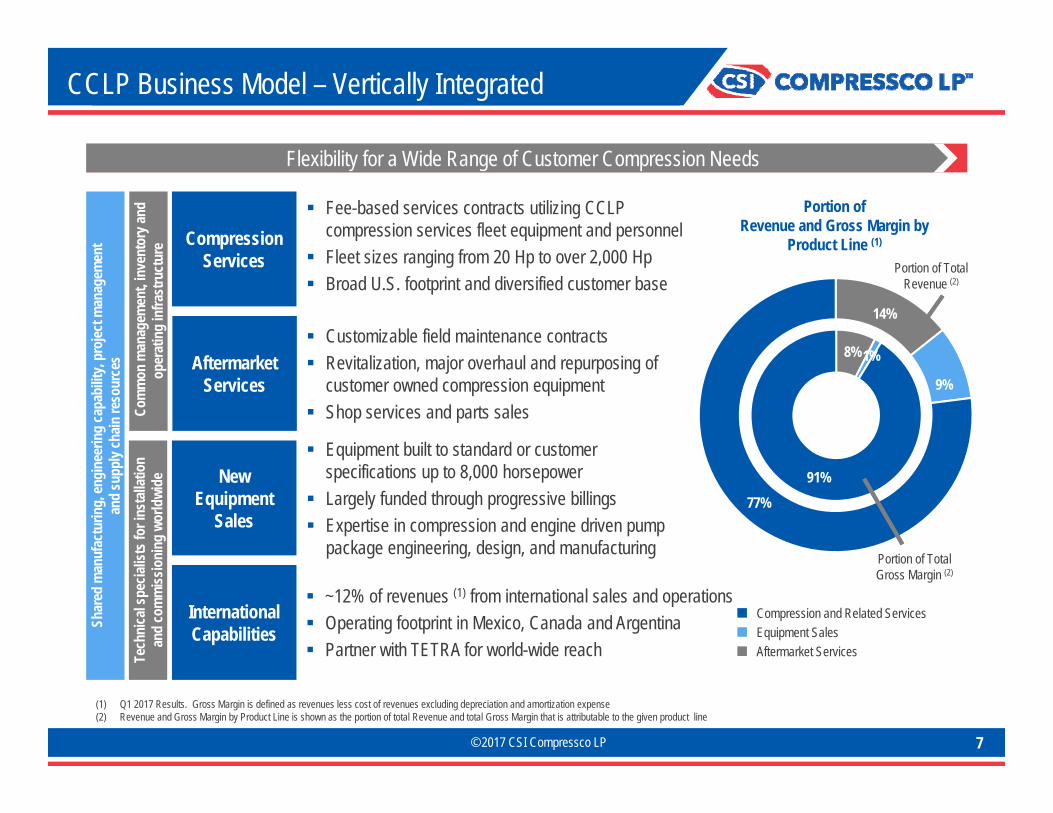
(1) Q1 2017 Results. Gross Margin is defined as revenues less cost of revenues excluding depreciation and amortization expense(2) Revenue and Gross Margin by Product Line is shown as the portion of total Revenue and total Gross Margin that is attributable to the given product line
Compression Services
Aftermarket Services
New Equipment
Sales
International Capabilities
Fee-based services contracts utilizing CCLP compression services fleet equipment and personnel
Fleet sizes ranging from 20 Hp to over 2,000 Hp Broad U.S. footprint and diversified customer base
~12% of revenues (1) from international sales and operations Operating footprint in Mexico, Canada and Argentina Partner with TETRA for world-wide reach
Com
mon
man
agem
ent,
inve
ntor
y and
op
erat
ing
infra
stru
ctur
e
Customizable field maintenance contracts Revitalization, major overhaul and repurposing of
customer owned compression equipment Shop services and parts sales
Equipment built to standard or customer specifications up to 8,000 horsepower
Largely funded through progressive billings Expertise in compression and engine driven pump
package engineering, design, and manufacturing
Shar
ed m
anuf
actu
ring,
engi
neer
ing
capa
bilit
y, pr
ojec
t man
agem
ent
and
supp
ly ch
ain re
sour
ces
14%
9%
77%
8%1%
91%
Portion ofRevenue and Gross Margin by
Product Line (1)
Flexibility for a Wide Range of Customer Compression Needs
Portion of Total Revenue (2)
Portion of Total Gross Margin (2)
Compression and Related Services
Tech
nica
l spe
cialis
ts fo
r ins
talla
tion
and
com
miss
ioni
ng w
orld
wide
Equipment SalesAftermarket Services

© 2017 CSI Compressco LP 8
Compression Services Stability
Q1-17 second quarter of sequential Hp increases, following six quarters of sequential declines
Commodity price stability is leading to increased activity among customers
Diverse geographic deployment of compression fleet able to respond to customer demand
U.S. Natural Gas Consumption (2) Fleet Utilization vs. Economic Variability (2),(3)
(1) CSI Compressco utilized Hp, composition, and fleet application as of March 31, 2017(2) Source: Energy Information Administration; Baker Hughes(3) Utilization based on management Pro Forma 2008 – 2013YE combined fleet utilization of Compressco Partners and Compressor Systems, Inc. prior to Compressco Partners acquisition of Compressor Systems, Inc.
77%Utilization
~853,000 Hp
Fleet Utilization and Composition (1)
Gas Liftother EOR
21%
Dry Gas14%
Gathering65%
Fleet Application (1)
Most Profitable Product Line is also Most Stable Product Line
79%Dry gas and
gas gathering
63%
72%
87%
0-100 Hp
101-800 Hp
801+ Hp 16%
41%
43%
Utilization
Composition
-
5,000
10,000
15,000
20,000
25,000
30,000
2010 2011 2012 2013 2014 2015 2016
Bcf /
d
Fuel and Distribution Commercial Residential Industrial Power Generation
- 100 200 300 400 500 600 700 800 900 1,000
Horsepower in thousands
0%10%20%30%40%50%60%70%80%90%100%
-90%-80%-70%-60%-50%-40%-30%-20%-10%
0%10%
2008 2009 2010 2011 2012 2013 2014 2015 Q1-16 Q2-16 Q3-16 Q4-16 Q1-17
Mac
roec
onom
ic Va
riabil
ity
CCLP Fleet Utilization Active Hp HH Gas Price WTI Oil Price Rig Count

© 2017 CSI Compressco LP 9
Compression Services Geographic Diversity
27% of Compression Fleet Deployed in the Permian Basin
(1) CSI Compressco fleet geography as of March 31, 2017
HP Distribution by CCLP Region (1)
Operating UnitsBasinsShale Plays
Gas Jack® unit on Well Head Service
South Texas22%
Permian Basin27%West
16%
Mid-Con18%
East11%
International4%

© 2017 CSI Compressco LP
3,079
1,428 1,400
853
510
-
500
1,000
1,500
2,000
2,500
3,000
3,500
Archrock(APLP & AROC)
USAC CDM CSI Compressco
JW Others
In T
hous
ands
10
Compression Services Market Position
4th Largest Compression Services
Fleet by Hp
10.5% Market share U.S. and Canada (1)
9% Market share internationally (2)
Largest vertically integrated
compression provider
Revenue Generating Hp (3)
Compression Services Competitive Landscape
(1) Internal estimate based on data from Gas Compressor Association “GCA” and considering only markets served by GCA member companies and other quantified fleets, excludes offshore compression(2) Spears & Associates, Inc. Oilfield Market Report 2017(3) CSI Compressco utilized Hp as of March 31, 2017; others per most recent available data and management estimates
© 2017 CSI Compressco LP 11
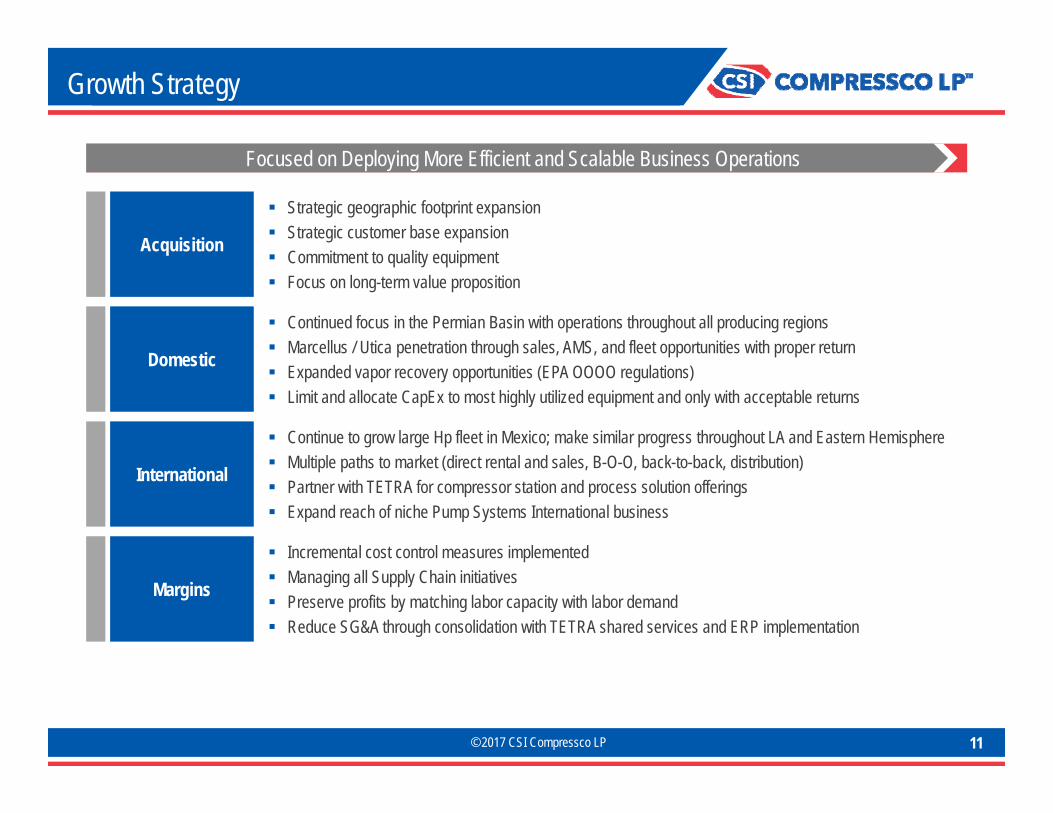
Growth Strategy
Strategic geographic footprint expansion Strategic customer base expansion Commitment to quality equipment Focus on long-term value proposition
Acquisition
International
Continue to grow large Hp fleet in Mexico; make similar progress throughout LA and Eastern Hemisphere Multiple paths to market (direct rental and sales, B-O-O, back-to-back, distribution) Partner with TETRA for compressor station and process solution offerings Expand reach of niche Pump Systems International business
Margins
Incremental cost control measures implemented Managing all Supply Chain initiatives Preserve profits by matching labor capacity with labor demand Reduce SG&A through consolidation with TETRA shared services and ERP implementation
Domestic
Continued focus in the Permian Basin with operations throughout all producing regions Marcellus / Utica penetration through sales, AMS, and fleet opportunities with proper return Expanded vapor recovery opportunities (EPA OOOO regulations) Limit and allocate CapEx to most highly utilized equipment and only with acceptable returns
Focused on Deploying More Efficient and Scalable Business Operations
© 2017 CSI Compressco LP 12
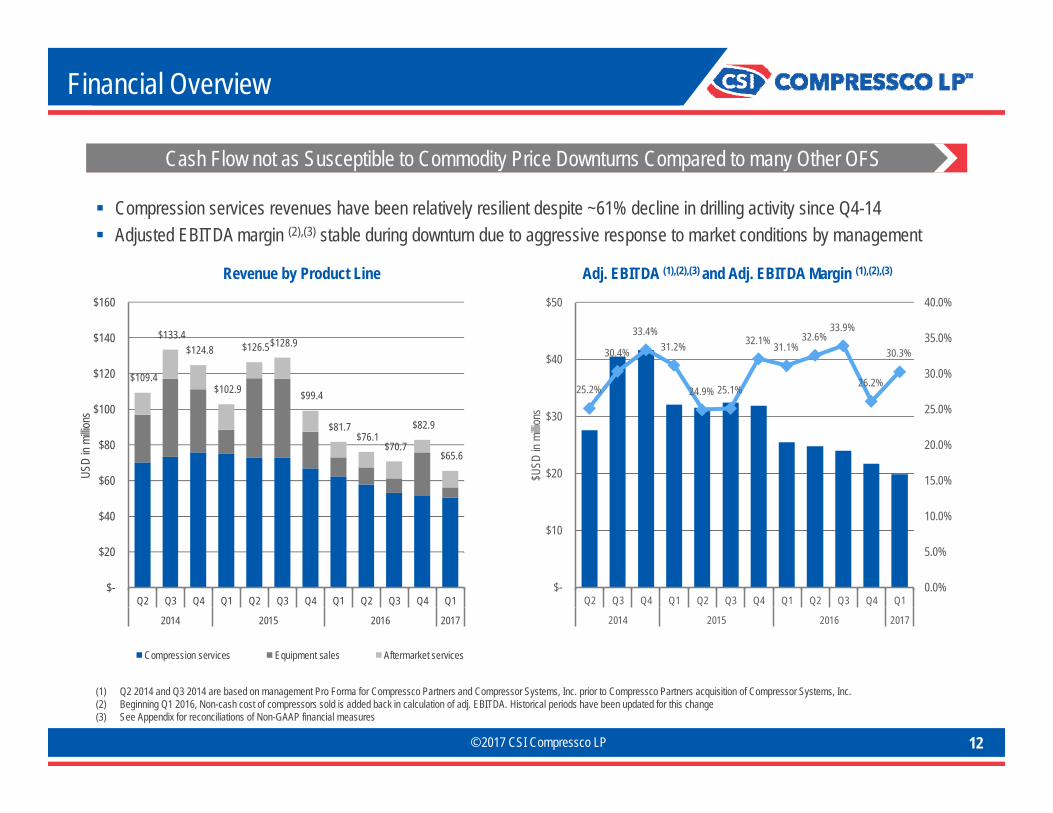
Financial Overview
Cash Flow not as Susceptible to Commodity Price Downturns Compared to many Other OFS
Revenue by Product Line Adj. EBITDA (1),(2),(3) and Adj. EBITDA Margin (1),(2),(3)
Compression services revenues have been relatively resilient despite ~61% decline in drilling activity since Q4-14 Adjusted EBITDA margin (2),(3) stable during downturn due to aggressive response to market conditions by management
(1) Q2 2014 and Q3 2014 are based on management Pro Forma for Compressco Partners and Compressor Systems, Inc. prior to Compressco Partners acquisition of Compressor Systems, Inc.(2) Beginning Q1 2016, Non-cash cost of compressors sold is added back in calculation of adj. EBITDA. Historical periods have been updated for this change(3) See Appendix for reconciliations of Non-GAAP financial measures
25.2%
30.4%
33.4% 31.2%
24.9% 25.1%
32.1% 31.1% 32.6%
33.9%
26.2%
30.3%
0.0%
5.0%
10.0%
15.0%
20.0%
25.0%
30.0%
35.0%
40.0%
$-
$10
$20
$30
$40
$50
Q2 Q3 Q4 Q1 Q2 Q3 Q4 Q1 Q2 Q3 Q4 Q1
2014 2015 2016 2017
$USD
in m
illions
$109.4
$133.4 $124.8
$102.9
$126.5 $128.9
$99.4
$81.7 $76.1
$70.7
$82.9
$65.6
$-
$20
$40
$60
$80
$100
$120
$140
$160
Q2 Q3 Q4 Q1 Q2 Q3 Q4 Q1 Q2 Q3 Q4 Q1
2014 2015 2016 2017
USD
in mi
llions
Compression services Equipment sales Aftermarket services

© 2017 CSI Compressco LP 13
Covenants, Debt & Liquidity
Amended Credit Facility Leverage Covenants in Q2-17 to Provide Additional Flexibility
Issued $80M in convertible preferred equity in Q3-16 Proceeds used to retire $54.1M of senior notes at
discount and reduce revolver borrowings
Debt (1) and Liquidity (1),(2) Leverage Ratio (1),(3)
(1) See Appendix for reconciliations of Non-GAAP financial measures(2) Liquidity amounts are subject to compliance with financial covenants and other provisions of the Credit Agreement which may limit borrowings
$99 $65 $71
$113 $74
$31
$589 $588 $590
$521 $528 $525
$-
$100
$200
$300
$400
$500
$600
Q4 Q1 Q2 Q3 Q4 Q1
2015 2016 2017
$USD
in m
illions
Liquidity Debt
No debt maturing before 2019 Amended leverage covenants provide compliance cushion
4.56x 4.80x
5.04x 4.83x
5.40x 5.67x 5.25x 5.25x 5.50x
5.75x 5.95x 5.95x
6.75x 6.75x 6.50x 6.50x
0.00x
1.00x
2.00x
3.00x
4.00x
5.00x
6.00x
7.00x
Q4 Q1 Q2 Q3 Q4 Q1 Q2 Q3 Q4 Q1
2015 2016 2017 2018
Leverage Ratio Covenant
© 2017 CSI Compressco LP 14
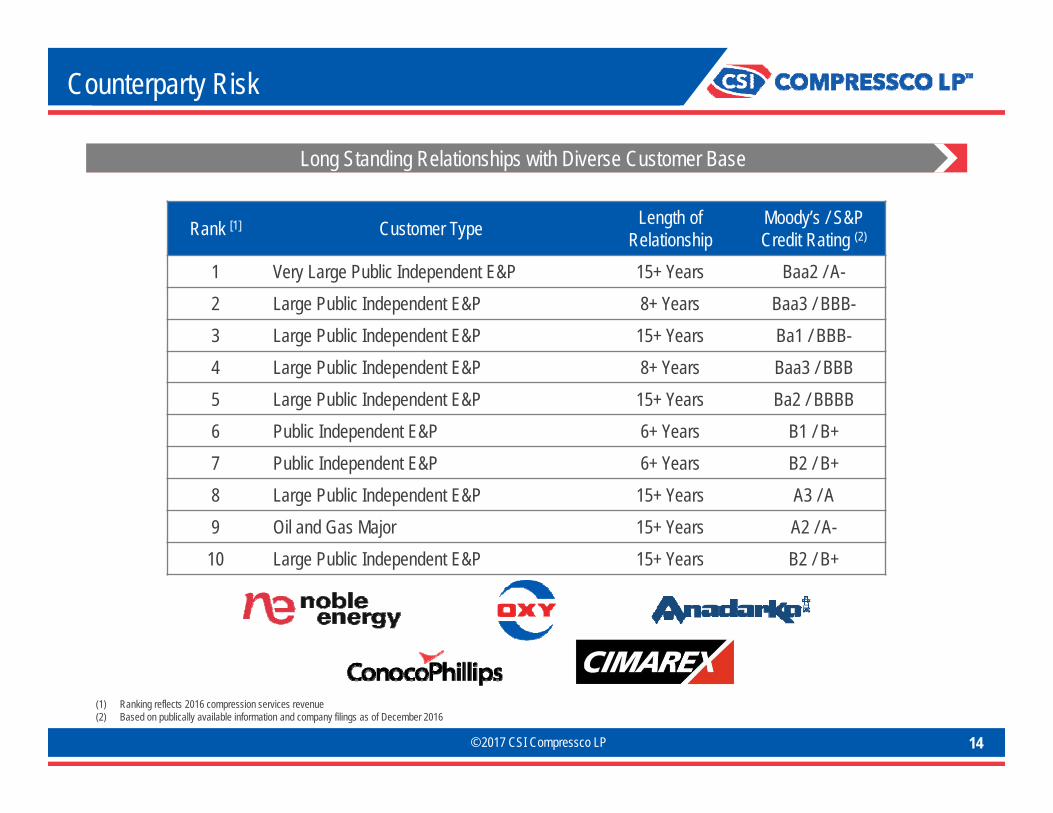
Counterparty Risk
Long Standing Relationships with Diverse Customer Base
Rank [1] Customer Type Length of Relationship
Moody’s / S&PCredit Rating (2)
1 Very Large Public Independent E&P 15+ Years Baa2 / A-2 Large Public Independent E&P 8+ Years Baa3 / BBB-3 Large Public Independent E&P 15+ Years Ba1 / BBB-4 Large Public Independent E&P 8+ Years Baa3 / BBB5 Large Public Independent E&P 15+ Years Ba2 / BBBB6 Public Independent E&P 6+ Years B1 / B+7 Public Independent E&P 6+ Years B2 / B+8 Large Public Independent E&P 15+ Years A3 / A9 Oil and Gas Major 15+ Years A2 / A-10 Large Public Independent E&P 15+ Years B2 / B+
(1) Ranking reflects 2016 compression services revenue(2) Based on publically available information and company filings as of December 2016

© 2016 CSI Compressco LP
Appendix
15

© 2017 CSI Compressco LP 16
Non-GAAP Financial MeasuresCSI Compressco LP (“the Partnership”) includes in this presentation the non-GAAP financial measures Adjusted EBITDA, Adjusted EBITDA margin, enterprise value, distributable cash flow, distribution coverage ratio, leverage ratio, liquidity and free cash flow. Adjusted EBITDA is used as a supplemental financial measure by the Partnership's management to:
• assess the Partnership's ability to generate available cash sufficient to make distributions to the Partnership's unitholders and general partner; • evaluate the financial performance of its assets without regard to financing methods, capital structure or historical cost basis; • measure operating performance and return on capital as compared to those of our competitors; • determine the Partnership's ability to incur and service debt and fund capital expenditures; and• approximate the financial performance measure used in the Partnership’s bank credit facility financial covenant.
The Partnership defines Adjusted EBITDA as earnings before interest, taxes, depreciation and amortization, and before certain non-cash charges, including impairments, bad debt expense attributable to bankruptcy, costs of compressors sold, equity compensation, fair value adjustments to our Preferred Units, gain or loss on extinguishment of debt, transaction costs and severance.
The Partnership defines Adjusted EBITDA margin as Adjusted EBITDA divided by revenue.
Enterprise value is defined as market capitalization plus the sum of long-term and short-term debt on the consolidated balance sheet, less cash, excluding restricted cash on the consolidated balance sheet. ThePartnership’s management uses enterprise value as a measure of the market value of the Partnership if it were free of debt.
Distributable cash flow is used as a supplemental financial measure by the Partnership's management as it provides important information relating to the relationship between our financial operating performance and ourcash distribution capability. Additionally, the Partnership uses distributable cash flow in setting forward expectations and in communications with the board of directors of our general partner. The Partnership definesdistributable cash flow as Adjusted EBITDA less current income tax expense, maintenance capital expenditures, interest expense and severance, plus the amortization of finance costs.
The Partnership also calculates the ratio of distributable cash flow to the total cash distributed (the distribution coverage ratio) as it provides important information relating to the relationship between the Partnership’sfinancial operating performance and its cash distribution capability. The Partnership defines the distribution coverage ratio as the ratio of distributable cash flow to the quarterly distribution payable on all outstandingcommon and subordinated units and the general partner interest.
The Partnership defines leverage ratio as debt at the end of the period divided by sum of last twelve months of adjusted EBITDA in accordance with bank covenants
The Partnership defines liquidity as the potential availability under its Credit Agreement (consisting of maximum credit commitment, less balance outstanding) less adjustment associated with compliance with financialcovenants and other provisions of the credit agreement that may limit borrowings plus the sum of cash on the consolidated balance sheet. Management views liquidity as a measure of the Partnership’s ability to fundinvesting and financing activities.
The Partnership defines free cash flow as cash from operations less capital expenditures, net of sales proceeds. Management primarily uses this metric to assess our ability to retire debt, evaluate our capacity to furtherinvest and grow, and measure our performance as compared to our peer group of companies.
These non-GAAP financial measures should not be considered an alternative to net income, operating income, cash flows from operating activities or any other measure of financial performance presented in accordancewith GAAP. These non-GAAP financial measures may not be comparable to Adjusted EBITDA, distributable cash flow, free cash flow or other similarly titled measures of other entities, as other entities may not calculatethese non-GAAP financial measures in the same manner as CSI Compressco. Management compensates for the limitation of these non-GAAP financial measures as an analytical tool by reviewing the comparable GAAPmeasures, understanding the differences between the measures and incorporating this knowledge into management's decision making process. Furthermore, these non-GAAP measures should not be viewed as indicativeof the actual amount of cash that CSI Compressco has available for distributions or that the Partnership plans to distribute for a given period, nor should they be equated to available cash as defined in the Partnership'spartnership agreement.

© 2017 CSI Compressco LP
Distributable Cash Flow$ in millions Q2-14 Q3-14 Q4-14 Q1-15 Q2-15 Q3-15 Q4-15 Q1-16 Q2-16 Q3-16 Q4-16 Q1-17
Net income 4.4$ 1.8$ 1.2$ 1.6$ (151.2)$ (105.3)$ (4.7)$ (16.0)$ (12.1)$ (15.6)$ Income taxes (1.0) 0.6 0.3 0.4 (1.4) 0.7 0.6 0.2 0.4 0.8
Income (loss) before taxes 0.6 (0.1) 3.4 2.4 1.5 2.0 (152.6) (104.7) (4.1) (15.8) (11.8) (14.8)
Interest expense, net [1] 7.5 7.8 8.4 8.6 8.7 8.9 8.8 8.8 8.9 9.8 10.6 10.4 Depreciation and amortization 18.4 18.9 20.2 20.0 20.6 20.6 20.6 18.5 18.7 17.8 17.1 17.3 Goodwill / long lived asset impairment - - - - - - 151.2 100.2 - - 2.4 -
Non-cash cost of compressors sold [2] 0.1 0.3 6.2 0.2 - 0.4 2.8 1.8 0.2 0.9 3.9 2.3 Equity compensation 0.2 0.5 0.6 0.5 0.7 0.5 0.5 0.6 0.8 0.8 0.8 1.0 Non-cash allocated expenses - - - - - - - - - - 1.6 1.7
Unusual items [3] 0.8 13.1 2.9 0.4 0.0 0.0 0.5 0.2 0.3 10.5 (2.9) 2.0 Adjusted EBITDA 27.6$ 40.5$ 41.6$ 32.1$ 31.5$ 32.4$ 31.9$ 25.4$ 24.8$ 24.0$ 21.7$ 19.9$
Less:Pro Forma adjustments 17.1 15.0 - - - - - - - - - -
Adjusted EBITDA prior to acquisition 10.5$ 25.5$ 41.6$ 32.1$ 31.5$ 32.4$ 31.9$ 25.4$ 24.8$ 24.0$ 21.7$ 19.9$
Less:Current income tax expense / (benefit) 0.7 (0.3) 2.4 0.4 0.9 (1.3) 0.5 0.5 0.4 0.3 0.6 0.7 Maintenance capital expenditures 0.2 1.8 2.9 2.2 2.0 3.7 3.4 2.3 1.4 2.8 4.8 4.6 Interest expense, net 0.1 5.4 8.4 8.6 8.7 8.9 8.8 8.8 8.9 9.8 10.6 10.4 Non-transaction related unusual items - 0.2 0.2 0.0 0.0 0.5 0.2 0.2 0.1 - 0.1
Plus:Non-cash interest expense charges - 0.4 0.7 0.7 0.7 0.7 0.7 0.7 1.4 1.6 3.2 2.9
Distributable cash flow 9.4$ 19.0$ 28.4$ 21.4$ 20.6$ 21.8$ 19.4$ 14.2$ 15.2$ 12.7$ 8.8$ 7.1$
Cash distributions attributable to the period 7.2$ 15.6$ 16.6$ 17.1$ 17.3$ 17.4$ 12.8$ 12.8$ 12.8$ 12.8$ 12.9$ 6.5$
Distribution coverage ratio 1.30x 1.21x 1.71x 1.25x 1.19x 1.25x 1.52x 1.11x 1.19x 0.99x 0.68x 1.09x
17
Non-GAAP Reconciliations
(1) Amortization of financing costs are included in interest expense(2) Starting from Q1 2016, non-cash cost of compressors sold is included in adjusted EBITDA; historical periods have been updated for this change(3) Unusual items is primarily associated with non-recurring fees and expenses plus severance as well as one time costs associated with transactions and fair value adjustments(4) Q2 2014 and Q3 2014 are based on management Pro Forma for Compressco Partners and Compressor Systems, Inc. prior to Compressco Partners acquisition of Compressor Systems, Inc.
(4)
© 2017 CSI Compressco LP 18
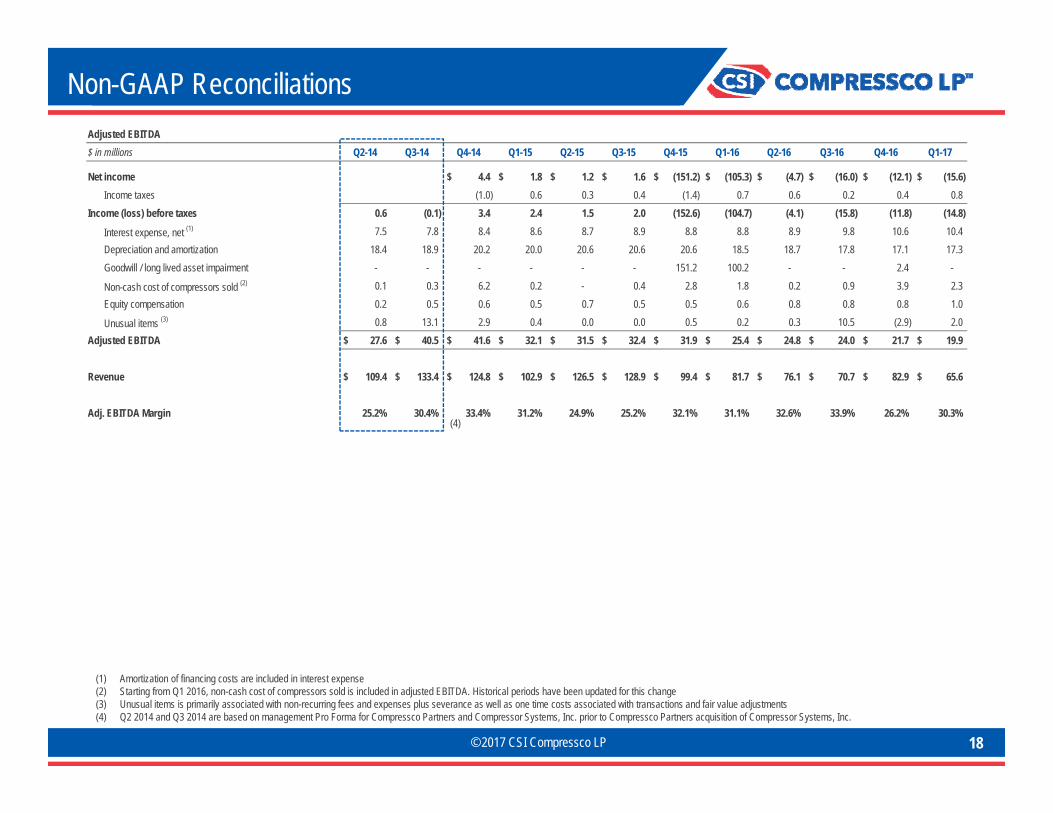
Non-GAAP Reconciliations
(1) Amortization of financing costs are included in interest expense(2) Starting from Q1 2016, non-cash cost of compressors sold is included in adjusted EBITDA. Historical periods have been updated for this change(3) Unusual items is primarily associated with non-recurring fees and expenses plus severance as well as one time costs associated with transactions and fair value adjustments(4) Q2 2014 and Q3 2014 are based on management Pro Forma for Compressco Partners and Compressor Systems, Inc. prior to Compressco Partners acquisition of Compressor Systems, Inc.
Adjusted EBITDA$ in millions Q2-14 Q3-14 Q4-14 Q1-15 Q2-15 Q3-15 Q4-15 Q1-16 Q2-16 Q3-16 Q4-16 Q1-17
Net income 4.4$ 1.8$ 1.2$ 1.6$ (151.2)$ (105.3)$ (4.7)$ (16.0)$ (12.1)$ (15.6)$ Income taxes (1.0) 0.6 0.3 0.4 (1.4) 0.7 0.6 0.2 0.4 0.8
Income (loss) before taxes 0.6 (0.1) 3.4 2.4 1.5 2.0 (152.6) (104.7) (4.1) (15.8) (11.8) (14.8)
Interest expense, net (1) 7.5 7.8 8.4 8.6 8.7 8.9 8.8 8.8 8.9 9.8 10.6 10.4 Depreciation and amortization 18.4 18.9 20.2 20.0 20.6 20.6 20.6 18.5 18.7 17.8 17.1 17.3 Goodwill / long lived asset impairment - - - - - - 151.2 100.2 - - 2.4 -
Non-cash cost of compressors sold (2) 0.1 0.3 6.2 0.2 - 0.4 2.8 1.8 0.2 0.9 3.9 2.3 Equity compensation 0.2 0.5 0.6 0.5 0.7 0.5 0.5 0.6 0.8 0.8 0.8 1.0
Unusual items (3) 0.8 13.1 2.9 0.4 0.0 0.0 0.5 0.2 0.3 10.5 (2.9) 2.0 Adjusted EBITDA 27.6$ 40.5$ 41.6$ 32.1$ 31.5$ 32.4$ 31.9$ 25.4$ 24.8$ 24.0$ 21.7$ 19.9$
Revenue 109.4$ 133.4$ 124.8$ 102.9$ 126.5$ 128.9$ 99.4$ 81.7$ 76.1$ 70.7$ 82.9$ 65.6$
Adj. EBITDA Margin 25.2% 30.4% 33.4% 31.2% 24.9% 25.2% 32.1% 31.1% 32.6% 33.9% 26.2% 30.3%(4)

© 2017 CSI Compressco LP 19
Non-GAAP Reconciliations
(1) Amortization of financing costs are included in interest expense(2) Starting from Q1 2016, non-cash cost of compressors sold is included in adjusted EBITDA. Historical periods have been updated for this change(3) Unusual items is primarily associated with non-recurring fees and expenses plus severance as well as one time costs associated with transactions(4) Net of certain items including Series A Preferred transaction costs, fair value adjustments and gain on extinguishment of debt which included in Net cash provided by operating activities
Adjusted EBITDA$ in millions Q4-14 Q1-15 Q2-15 Q3-15 Q4-15 Q1-16 Q2-16 Q3-16 Q4-16 Q1-17
Net cash provided by operating activities 13.5$ 32.5$ 19.7$ 11.3$ 38.4$ 15.1$ 20.5$ 10.0$ 15.9$ 0.9$ Changes in operating assets and liabilities 11.1 (9.2) 3.0 13.9 (17.7) (0.2) (3.0) 4.4 (7.7) 6.4 Provision for deferred income taxes 2.3 (0.2) 0.6 (1.7) 1.8 (0.1) (0.2) 0.1 0.2 (0.1) Other non-cash charges and credits (1.6) (0.9) (0.8) (0.9) (1.4) (0.8) (2.4) (1.2) (1.2) (1.3)
Interest expense, net (1) 8.4 8.6 8.7 8.9 8.8 8.8 8.9 9.8 10.6 10.4 Series A accrued PIK - - - - - - - (0.9) (2.2) (2.2) Income taxes (1.0) 0.6 0.3 0.4 (1.4) 0.7 0.6 0.2 0.4 0.8
Non-cash cost of compressors sold (2) 6.2 0.2 - 0.4 2.8 1.8 0.2 0.9 3.9 2.3 Non-cash allocated expenses - - - - - - - - 1.6 1.7
Unusual items, net (3),(4) 2.9 0.4 0.0 0.0 0.5 0.2 0.3 0.8 0.1 1.0 Adjusted EBITDA 41.6$ 32.1$ 31.5$ 32.4$ 31.9$ 25.4$ 24.8$ 24.0$ 21.7$ 19.9$

© 2017 CSI Compressco LP 20
Non-GAAP Reconciliations
(1) Adjustment for leverage capacity reflects the limitation of amounts available under the revolving credit facility in order to maintain compliance with the leverage ratio covenant(2) Leverage ratio is Total Debt divided by Consolidated TTM EBITDA per Credit Agreement(3)
Liquidity & Leverage$ in millions Q4-15 Q1-16 Q2-16 Q3-16 Q4-16 Q1-17
Consolidated TTM EBITDA per Credit Agreement 129.0$ 122.4$ 117.2$ 107.9$ 97.7$ 92.6$
Senior notes 350.0 350.0 350.0 330.0 295.9 295.9 Revolving credit facility outstanding 235.0 234.0 236.0 181.0 222.0 225.0 Letters of credit and surety bonds 3.7 3.8 3.9 9.7 10.0 4.0 Total debt per Bank Agreement 588.7 587.8 589.9 520.7 528.0 524.9
Revolving credit facility, total 400.0 400.0 340.0 340.0 315.0 315.0 Amounts currently outstanding (235.0) (234.0) (236.0) (181.0) (222.0) (225.0) Bank letters of credit (1.6) (2.1) (2.1) (7.7) (8.0) (1.9) Revolving credit facility, available 163.4 163.9 101.9 151.3 85.0 88.1 Less:
Adjustment for leverage capacity (1) 75.0 109.4 47.5 51.7 31.4 62.3 Plus:
Cash excluding restricted cash 10.6 10.3 16.7 13.4 20.8 5.4 Liquidity 99.1$ 64.8$ 71.1$ 113.0$ 74.4$ 31.2$
Leverage Covenant 5.25x 5.25x 5.50x 5.75x 5.95x 5.95x
Leverage Ratio (2) 4.56x 4.80x 5.04x 4.83x 5.40x 5.67x
Market Capitalization Reconciliation$ and Units in thousands
Unit Price as of 5/31/2017 5.50$ Units Oustanding as of 3/31/2017 34,495 Market Capitalization 189,722 Plus:
Debt Outstanding, net as of 3/31/2017 507,812
Series A Preferred balance, as of 3/31/2017 (3) 89,500 Enterprise Value 787,034$
Series A Preferred as of March 31, 2017$ in thousands
Series A aggregate issuance 80,000$ Series A Preferred paid in kind distributions 5,329 Series A Preferred conversions (2,770) Series A Preferred balance 82,560 Series A Preferred fair value adjustment 6,940 Series A Preferred as reported 89,500$