barbopoulos, leonidas and marshall, andrew and macinnes ... · pdf file3 international...
TRANSCRIPT

Barbopoulos, Leonidas and Marshall, Andrew and MacInnes, Cameron
and McColgan, Patrick (2014) Foreign direct investment in emerging
markets and acquirers' value gains. International Business Review, 23
(3). pp. 604-619. ISSN 0969-5931 ,
http://dx.doi.org/10.1016/j.ibusrev.2013.10.003
This version is available at https://strathprints.strath.ac.uk/46016/
Strathprints is designed to allow users to access the research output of the University of
Strathclyde. Unless otherwise explicitly stated on the manuscript, Copyright © and Moral Rights
for the papers on this site are retained by the individual authors and/or other copyright owners.
Please check the manuscript for details of any other licences that may have been applied. You
may not engage in further distribution of the material for any profitmaking activities or any
commercial gain. You may freely distribute both the url (https://strathprints.strath.ac.uk/) and the
content of this paper for research or private study, educational, or not-for-profit purposes without
prior permission or charge.
Any correspondence concerning this service should be sent to the Strathprints administrator:
The Strathprints institutional repository (https://strathprints.strath.ac.uk) is a digital archive of University of Strathclyde research
outputs. It has been developed to disseminate open access research outputs, expose data about those outputs, and enable the
management and persistent access to Strathclyde's intellectual output.

1
Foreign Direct Investment in Emerging Markets and Acquirers’ Value Gains
Abstract
We investigate the shareholder wealth effects of 306 Foreign Direct Investment (FDI)
announcements by UK firms in seventy five emerging markets (EM). Our results show that
acquirers enjoy highly significant gains during the announcement period of FDI. Perhaps
surprisingly, the highest gains are accrued to acquirers investing in countries with high
political risk and high corruption ratings. The type of asset acquired has also a significant
effect on the gains of acquirers’ shareholders, with the highest gains accrued to acquirers of
physical assets. Also, investments in physical assets in EM with a high corruption rating elicit
the highest gains. We contend that UK firms following resource-seeking strategies in EM
with a high corruption rating are facilitated access to resources on favorable terms and this is
viewed positively by the market participants. Our results are robust to alternative model
specifications and the endogenous choice to expand internationally.
Keywords: Foreign direct investment; Announcement period returns; Emerging markets;
Political risk; Corruption; Physical assets.
JEL classification: G34

2
1. Introduction
Reflecting the importance of foreign direct investment (FDI) in shaping the modern
corporation, a voluminous literature has emerged investigating whether FDI undertakings
create or destroy value for the shareholders of participating firms (Bruner, 2004; Sudarsanam,
2010).1
The majority of earlier studies document mixed evidence related to the impact of FDI
undertakings on acquirers’ returns, which primarily reflect information about the quality of
FDI, numerous costs and benefits associated with individual transactions, and several other
important elements (i.e., country risks, mode of entry) that affect the likelihood of future
success of the FDI.2
Numerous studies also attempt to further explore the major determinants
of such variation on the distribution of acquirers’ returns and have revealed the significant
impact of several transaction-, country-, and firm-specific factors.3
Despite such findings, a
new and important aspect to outward investment is the substantial increase of FDI flows into
emerging markets (EM), which adds significantly to the level of complexity of FDI success
in generating future cash flows for the firm. Along these lines, academic literature in
1 Firms expand internationally, or engaged into FDI, through the following ways: (a) exporting from to home to
foreign market, (b) licensing a foreign company to produce the goods and services, (c) greenfield investment in
production facilities in the foreign market, (d) merger with, or acquisition of, a firm already operating in the
foreign market, and (e) joint venture or other strategic alliance with a firm operating in the foreign market. The
last three methods are in general considered as FDI with cross-border acquisitions (CBA) to represent the single
most important method of FDI participation (UNCTAD, 2006). We follow these definitions in the data
collection in this paper.
2 Most of previous research concentrates on the acquiring, or internationally expanding, firm’s announcement
period returns. Among others, Doukas (1995) and Francis et al. (2008) find positive shareholder wealth gains to
announcements of CBA while Gande et al. (2009) show that the international diversification benefits are driven
by both the financial and real dimensions of multinationality. On the contrary, Denis et al. (2002) find that
international diversification decreases the market value of acquiring firms. Others have discussed the impact of
various legal system and investor protection regimes worldwide on the gains of US and UK acquirers’
shareholders and show that such gains are sensitive to such country-specific and institutional dynamics (see Bris
and Cabolis, 2008; Barbopoulos et al. 2012, respectively). Scholars have also confirmed the impact of FDI entry
mode on performance (Brouthers et al. 2003), whereas others have shown that firms systematically choose their
entry mode when making FDI (Kogut and Singh, 1988; Hennart and Park, 1993). López-Duarte and García-
Canal (2007) have investigated the announcement period performance of a sample of Spanish firms engaged
into FDI and show that the FDI entry mode shapes the distribution of acquiring firms’ returns.
3 For example, Asquith et al. (1983) show that acquirers’ gains are related to the transaction’s relative size
whereas Sudarsanam and Mahate (2003) show that acquirers’ growth opportunities affect their gains; Moeller et
al. (2004) confirm that the size of the acquirer is an important determinant of acquirers’ gains; other studies
confirm that the target firm’s status and the method of payment in M&A affect acquirers’ gains (Draper and
Paudyal, 2006).

3
international business and finance discusses the associated costs and benefits for firms
undertaking FDI in EM. These can include strategic, behavioral, and economic benefits,
lower costs, new and rich sources of inputs/resources, and fast growing markets which
provide enormous market opportunities (Berry, 2006; Barbopoulos et al. 2012; Erel et al.
2012). To some extent, these benefits are seen by an internationally expanding firm as
outweighing the institutional hazards (country risk and corruption), political and structural
uncertainties, impact on firm overall strategy, weak legal institutions and government
interference of many EM countries (Hoskisson, et al., 2000). As a result, the costs and
benefits of FDI in EM should be directly reflected in the announcement period returns of the
acquiring firms.
Existing literature on the shareholder wealth effects of FDI in EM is limited and
available evidence on whether shareholders of acquiring firms benefit from the international
business expansion is mixed. There have only been a few studies focusing on FDI in EM with
the majority of them concentrating solely on one country, for example China (Gupta, et al.,
1991) or one region, for example Africa (Owhoso, et al., 2002). There have been calls to take
a broader research agenda encompassing all EM regions to consider inter-regional differences
on the same basis as studies on developed-market FDI (Hoskisson, et al. 2000). Moreover, as
yet there have been little attempts to integrate theories from international business literature
with theories from the finance literature in the specific realm of the market reaction to FDI
announcements. Our study aims to fill these gaps by examining the short term market
reaction to FDI in EM to capture shareholders’ perception regarding the future performance

4
of the firm influenced by the FDI announcement.4 A suitable sample to undertake this
research is represented by UK firms investing in EM.5
We extend the existing literature in a number of directions. Firstly, in order to capture a
wide range of geographical, political and cultural diversity conditions we consider the EM
regions of Africa, Asia, Eastern Europe, Latin America and the Middle East. Secondly, we
combine key international business and variables supported by theories from the finance
literature; in particular what benefits the firm’s shareholders accrue and what factors are
relevant in determining the market reaction to these announcements. Since prior research
suggests that corruption affects FDI flows (Egger and Winner, 2005) and high corruption is
characteristic of EM (Abed and Gupta, 2002) we incorporate corruption, a time-varying
variable not previously investigated within the context of wealth effects of FDI.6 In addition
to corruption, we include a time-varying political risk index. The remaining variables include
a cultural distance variable, and a variable that captures the type of asset investment in the
FDI (tangible or intangible). The type of asset invested via FDI could be important in EM
where there could be higher probability of political extraction than in developed economies.
Connected to this we include a variable which captures the strategic aim of the firm in the
FDI, i.e. resource or market seeking (Brouthers, et al., 2008). Resource-seeking FDI involves
obtaining resources from the host country which are either unavailable in the home country or
4 Emerging markets provide the ideal environment to investigate the interaction between corruption, political
risk, type of asset acquired, strategic aims, and cultural distance. For instance, Meyer et al. (2009) discuss how
institutions (rules and legal/regulatory framework) can significantly influence firm strategies such as foreign
entry methods and this is particularly important for EM ‘where institutional frameworks differ significantly
from those in developed economies’.
5 The World Investment Report (2009) (Annex B), for example, shows that in 2007 the total value of global
CBA deals reached over 1.03 trillion US dollars, which represents a record increase of more than 62% over the
value of 2006. In the same year, British firms’ net purchases reached 21.5% of the global market.
6 To the best of our knowledge, the only study to consider this issue is Pantzalis et al. (2008) who focus on the
link between corruption and the value of international diversification. It is important to note that this paper
explores the impact of FDI in EM on firm value and not on FDI flows which are derived from balance of
payments data reflecting external financing of assets. Since EM typically have poor capital markets external
financing is very prominent and this highly correlates with foreign owned assets.

5
too costly to obtain in order to achieve cost minimization. Market-seeking FDI involves
investing in a host country in order to directly serve that market with local production and
distribution. In our research on EM we would argue that this distinction is particularly
important in understanding the market reaction to FDI as they can, for instance, provide
access to vital raw materials or large new previously untapped markets. The UK colonial past
in many EM, particularly in Africa, Asia and the Middle East and to a lesser extent in Latin
America, provides also a useful cultural background to study the wealth effects of FDI for
UK firms. Finally, the mode of entry into the foreign market is an important element that
enters our empirical analysis, given that different entry modes affect FDI performance
(López-Duarte and García-Canal, 2007).
Based on a sample of 306 announcements of FDI by UK firms in seventy-five EM
countries over the sixteen-year period (from 1993 to 2008) our results show that there are
benefits to EM international expansion for UK firms as on average they experience a highly
significant shareholder wealth gain around the announcements of FDI. This indicates a
positive perception of the FDI on future cash flows of the firm. More specifically, our
contribution lies in identifying the interaction of the most relevant factors that should be
considered important when assessing the merits of investing in EM. Our main findings are as
follows: first, perhaps surprisingly, we find that the announcement period returns to be higher
for FDI in EM countries with high political risk or high corruption ratings. This finding can
be more fully understood when we consider the other factors that are significant in explaining
the market reaction. Second, we show that the type of asset invested in, or acquired, has a
bearing on the shareholder wealth effect. Investment in, or acquisition of tangible (physical)
assets leads to significantly higher abnormal returns as opposed to intangible (non-physical)
assets or agreements, even in EM with a high political risk rating. There is also a significant

6
interaction effect between the type of asset investment and corruption. In fact, investments
involving the acquisition of physical assets in EM with a high corruption rating elicit the
highest gains. Our explanation for this result regarding a high level of host country corruption
takes a strategic focus. Specifically, resource seeking FDI in a host country with high
corruption rating elicits higher announcement period returns than a market seeking FDI as
firms are facilitated access to valuable resources at a favorable price and thus FDI can create
resource allocation efficiencies in EM with underdeveloped economic and legal frameworks.
We also find evidence suggesting that cultural differences play an important role in the
market reaction to announcements of FDI in EM. Lastly, our results confirm that the FDI
mode entry plays an important role in shaping the announcement period returns of acquirers.
Overall, our findings have practical implications for both managers and shareholders in
terms of the choice of location and strategy; since EM attract sizeable amounts of FDI and
investors require an enhanced understanding of factors that have an impact on FDI strategies.
Our contribution lies in identifying the important role of corruption, political risk, and asset
investment type and the significance of the type of strategy in consideration of these factors.
Importantly, the assertion of Hoskisson et al. (2000) that the transition and transformation to
market economies can be accompanied by political and structural uncertainties, regulatory
interference and corruption, should not discourage investment in EM since the shareholder
wealth gain is greater for FDI in countries with a high political risk or corruption rating,
especially when the FDI is resource-seeking.
The remainder of this paper is organized as follows. The first section provides a
theoretical background and the development of our hypotheses. The next section describes
our sample and outlines the event-study research method we employ in our analysis. This is

7
followed by a presentation of the findings, discussion based on the findings, and a robustness
section before concluding with a discussion and implications of the results.
2. Theory and Testable Hypotheses
2.1 Short term market reaction
Prior international business and finance research proposes many theories on global
diversification and international business expansion. Berry (2006), for example, concisely
summarizes the positive aspects on firm performance as ‘firms have opportunities to gain
greater returns from their intangible assets and market power, from spreading risk, from
subsidizing poorly performing operations and from seeking less expensive inputs abroad’ and
the negative aspects as ‘increased coordination and management costs, increased cultural and
institutional diversity, and the complexity that results from differing government regulations
and currency fluctuations create substantial barriers’. The financial dimension of
multinationality, or the imperfect capital markets theory (Errunza and Senbet, 1984), suggests
that markets are ‘completed’ by an internationally expanding firm since their shareholders are
provided with indirect access to countries which would be otherwise more difficult to access
due to constraints, such as international capital flow constraints, or information asymmetries.
Thus, this indirect shareholder diversification increases the value of the firm relative to a
similar but non-internationally diversified firm.7
In the research area of the real dimension of multinationality, there are two main theories
which have opposite predictions for firm’s value: the internalization theory and the
managerial objectives theory. The ownership, location, internalization (OLI) paradigm
stresses the advantages of FDI (Dunning, 1998). This theory proposes that firms investing
7 Diversification benefits for domestic investors can also be realised through investing in products such as
country funds.

8
abroad possess competitive advantages such as unique products, superior technology,
managerial know-how, experienced and skilled human capital or marketing ability. Buckley
(1988) suggests that ownership-specific advantages of firms could be internalized through
international expansion. In this framework, when intangible assets, such as technological
know-how, marketing ability and consumer goodwill are spread over a larger scale,
transaction costs associated with the coordination of activities across borders can be reduced.
Another array of studies proposes a resource-based view (Teece, et al., 1997) and
highlight that firms enter foreign markets as a means of creating value (Kogut and Zander,
1993). Specifically, expansion into EM opens up many opportunities for domestic firms for a
number of reasons. First, over four billion potential consumers at the bottom of the
purchasing power parity (PPP) pyramid present both tremendous opportunities and unique
challenges (International Finance Corporation, 2007). There is little doubt that these potential
consumers represent a huge untapped-market opportunity. Second, firms can exploit market
imperfections through regulatory system and tax arbitrage, internalize markets, increase
flexibility, avoid trade barriers and obtain natural resources. In EM in particular, direct access
to low cost labor or raw materials can encourage international expansion. The benefits of
expanding and managing overseas assets to obtain these low cost inputs must be greater than
the simply purchasing these inputs without international expansion. However firms also face
obstacles in expanding into EM, such as cultural barriers, political instability, exchange rate
fluctuations, poor infrastructure, or lack of local knowledge. Also in an attempt to access the
different types of consumers in EM, this can require dramatic changes of the current business
model and/or of the firm's strategy. Therefore intuitively EM FDI can have mixed results on
shareholders' perception and the subsequent market reaction

9
With regard to the empirical question on whether there are benefits of international
expansion, a number of studies attempt to analyze both the financial and real dimensions of
multinationality and presented mixed results.8 Recent studies, which specifically focus on
returns to acquirers of firms from developed countries into EM, demonstrate the benefits to
shareholders of investing in EM. Chari et al. (2010) study the shareholder returns to acquirers
from developed countries of EM firms. They find a significantly positive shareholder wealth
gain for the acquirers of targets from EM. Francis et al. (2008) also find a positive cross-
border M&A effect for US acquirers from the late 1990s through the early 2000s, especially
for acquirers of targets from segmented financial markets relative to targets from integrated
markets. Berry (2006) considers the impact of foreign investments on performance (Tobin’s
q) and argues that shareholders value location choices (developed and EM) differently
depending on firms’ prior experience of foreign investments and the knowledge intensity of
the firm’s industry. She finds that there are benefits to investments in EM but these benefits
depend on the extent of multinational operations of the firm and the knowledge intensity of
the industry. Therefore, the decision of UK firms to expand internationally into EM should
have a positive impact on the synergistic gains of the M&A and thus yield higher returns to
the acquiring firm’s shareholders. Our first hypothesis (stated in the alternate) is as follows:
H1: UK firms expanding internationally into EM experience significantly positive
announcement period returns.
8 Using data from the 1970s, the financial dimension is empirically tested by Errunza and Senbet (1984) who
find evidence of a positive relation between firm value and degree of multinationality. On the contrary, Morck
and Yeung (1991) find no support for the financial dimension. However they do find strong support for the
internalization theory since the positive relation between firm value and degree of multinationality is dependent
on investment in intangibles, namely research and development (R&D) and advertising spending. Gande et al.
(2009) provide evidence of global diversification benefits driven by both the financial and real dimensions. On
the other hand, Denis et al. (2002) find that global diversification results in average firm valuation discounts,
concluding that the costs of global diversification outweigh the benefits. Doukas and Kan (2006) find that FDI
has a negative impact on shareholder wealth but a positive effect on bondholders’ wealth.

10
2.2 Political Risk
Political risk has been identified as a factor considered by firms expanding
internationally (Henisz and Zelner, 2001).9 According to the most recent indices published by
Political Risk Services Inc., their measure of political risk is particularly high in EM (Click,
2005). Robock (1971) categorizes political risk into two elements: macro-political risk is the
country-specific risk affecting all firms within the host country and micro-political risk is
firm-specific, affecting a single firm or industry sector. Political risk can originate from
exogenous factors (for example, the collapse of external markets for a country’s key exports)
or endogenous factors (such as a change in economic policies or ruling political party), or the
interaction between them. EM governmental choices to exercise their ‘option’ to alter
policies can have an effect on a firm’s cash flows from its investment. The most dramatic
form of the exercise of such an option is expropriation but the political risks faced by firms in
EM are wide-ranging. These could involve exchange controls, confiscation of assets,
blocking the repatriation of funds or the imposition of wider economic constraints (Shapiro,
2006). However, it is necessary to distinguish between various types of political and
governmental instability, and the instability of policies that have a direct impact on
investments made by firms. Brewer (1983) finds that the various types of governmental
instability are more strongly correlated with policy instability in developed countries than in
EM. An important implication of this is that governmental instability in EM does not
inevitably translate into policy instability which would have a direct effect on a firm’s
operations.10
Thus, it is important to highlight that political instability need not to be a
9 There is no general description of ‘political risk’ and some debate on the definition, for instance ‘country risk’
and ‘political risk’ are often used interchangeably in academic research.
10 For example, some capitalistic stances tend towards less restrictive controls on FDI and remittances but
nationalistic views can create pressures in favour of restrictive controls. In a similar view, if a country
experiences balance of payments problems and with the balance of power lying with those generally inclined
towards governmental intervention in the economy, restrictions on international funds transfers could well be

11
detriment for firms looking to invest in an EM with a high political risk rating. Indeed, Butler
and Joaquin (1998) argue that changes to governmental policies do not necessarily negatively
affect a firm and can have a positive impact. For instance, International Monetary Fund
(IMF) loans have been used by many countries to help them recover from financial crises,
which usually require, alongside changes to fiscal policies, economic and financial reforms in
the form of tariff and subsidy reductions, financial market liberalizations and banking
reforms. This can result in reduced trade barriers and open up certain industries to global
competition, which often benefits foreign firms.11
In terms of our focus on firm value there are a few empirical studies focusing on political
risk and FDI, ‘Surprisingly, ratings are rarely used to assess the effects of country and
political risk on corporate performance’ (Click, 2005). López-Duarte and García-Canal
(2007) find a positive stock market reaction to announcements of FDI in politically stable
countries but no significant reaction in more unstable countries.12
Accordingly, our second
hypothesis (stated in the alternate) is as follows:
H2: Announcement period returns of UK firms expanding internationally into EM are
positively related to the host country’s political stability.
2.3 Corruption
It would be expected that high levels of corruption would be a barrier to FDI, and that
FDI in countries with high levels of corruption would be viewed skeptically. A number of
studies have examined the impact of host country corruption on FDI flows and found that
imposed. Conversely, if attitudes against governmental intervention prevail, restrictive controls are less likely to
be imposed.
11 Agencies such as the Multilateral Investment Guarantee Agency – a wholly-owned subsidiary of the World
Bank, whose main objective is to encourage the flow of FDI to EM – and the Ex-Im Bank can offer guarantees
on foreign investments against political (non-commercial) risks.
12 However, it is noted that although only focusing on international joint ventures (IJVs) Borde et al. (1998)
find that the market reacts less favourably when firms establish joint ventures in developing countries with
relatively low country risk.

12
corruption in the host country is negatively related to FDI flows (e.g., Wei, 2000) as it
increases costs, acts as an irregular tax, and a distortion on the incentives to invest.13
There is
a ‘trade-off’ between the positive effect of market attractiveness and the negative influence of
corruption – the compensatory model (Brouthers, et al., 2008).
However, there are arguments that corruption can have a positive impact on FDI by
‘facilitating transactions in countries with excessive regulation’ (Cuervo-Cazurra, 2006).
Also based on prior empirical evidence corruption is not necessarily a negative factor for
foreign firms in FDI. Egger and Winner (2005) find a clear positive relation between
corruption and the level of FDI, thus providing evidence of corruption as a stimulus for FDI.
They suggest that in the presence of regulations and other such controls, corruption can act as
a so-called ‘helping hand’. Indeed there are some reported examples of firms, at least in part,
basing the choice of geographic location of their assets and operations on perceived
differences in the inevitability of paying bribes in certain countries.
In terms of the impact of corruption and FDI firm value there has been little prior
evidence, especially on the market reaction. We suggest that the effect of corruption on
expected business profits is complex and the levels of corruption and different types of
industries can also be important factors. However, as high levels of corruption can be a drain
on resources. Accordingly, our third hypothesis (stated in the alternate) is as follows:
H3: Announcement period abnormal returns of UK firms expanding internationally into EM
are negatively related to the host country’s level of corruption.
13 A country’s level of corruption can be defined and measured in a variety of ways. The World Bank stresses
the abuse of public power for private gain (Tanzi, 1998). Western governments and international organizations,
such as the United Nations, equate it with ‘improbity’, a term which incorporates what is not only improper but
also illegal (Malta Conference, 1994). According to the 2008 Corruption Perceptions Index (Transparency
International) EM, including the BRIC countries, have higher corruption ratings than developed countries.

13
2.4 Cultural distance
Cultural distance could have an impact on the market reaction to firms when undertaking
FDI in EM. Although there is debate on the role of cultural distance on firm’s strategies
(Tihanyi, et al., 2005) one of the main themes in the concept of cultural distance is on
performance where it has ‘largely been taken to represent a hindrance to the performance of
MNC’ (Shenkar, 2001). High cultural distance could increase the cost of entry, lead to intra-
organizational conflicts and poor implementation of organizational actions (Tihanyi, et al.,
2005). As cultural distance increases, the integration of the partner or target’s knowledge,
staff and resources becomes increasingly challenging. This concept has long been recognized
as the liability of foreignness (Zaheer, 1995). There are various measures and explanations of
cultural distance. Using Hofstede’s cultural dimensions (power distance, masculinity,
uncertainty avoidance and individualism – see later section on definitions of independent
variables) we find this measure of cultural distance differs significantly across EM. Also, we
believe that a British presence in a former colony, protectorate or mandate in EM, can be
used as a measure of cultural distance. In turn, we link this to La Porta et al. (2008) who
affirm that British common law had spread to former British colonies or countries where the
UK had a mandate or protectorate. Since it is more likely that EM with a low cultural
distance from the UK are former colonies or the UK had a mandate or protectorate there, it
follows that these EM will mostly have laws originating from British common law.
Although no direct evidence exists for the relation between cultural distance and the
shareholder wealth effects of FDI in EM, in the context of international diversification and
performance, Gomez-Mejia and Palich (1997) find no relation between multinational firm

14
value and the cultural relatedness of countries within the firm’s multinational network.14
The
authors contend that cultural distance between the parent and foreign locations is more
relevant to firm value than the distance between various subsidiaries. They interpret their
findings as suggesting that cultural distance imposes a barrier to the exploitation of
internalization advantages. We focus on the cultural distance between the parent entity’s
country and the EM FDI recipient. Accordingly, our fourth hypothesis (stated in the alternate)
is as follows:
H4: Announcement period abnormal returns of UK firms expanding into EM are negatively
related to the home and host countries’ cultural distance.
2.5 Type of Asset
It has been proposed that the structure of a firm’s asset holdings in a FDI is important in
countries where there is a high potential for political extraction. For example, Caprio et al.
(2010) find that firms respond to higher levels of political corruption by holding lower levels
of cash and liquid assets, investing more in tangible fixed assets, and paying higher
dividends. Utilizing assets in such a manner reduces the scope for extracting bribes from the
owners of such firms. It is also well documented that although many EM have undertaken
significant strengthening of their intellectual property rights systems, there remains a weak
enforcement of intellectual property rights in these nations (La Croix and Konan, 2002). It
has been proposed that ‘The primary impediment [to FDI in EM] appears to be the lack of
well-defined property rights that convey exclusivity, transferability, and quality of title... As a
result, institutional capacity building was, and continues to be, key for attracting inward FDI’
(Hoskisson, et al., 2000, p.252).
14 In their meta-analysis of prior research Tihanyi, et al. (2005) find that cultural distance may provide
performance benefits for firms operating in developed countries arguing as firms expand into culturally diverse
but developed markets new knowledge and resources can improve performance.
15
This distinct lack of intellectual property rights could thus influence an intangible
investment made by a firm in these countries, such as R&D collaboration. Consistent with
this view, Pantzalis et al. (2008) find evidence that a lack of property rights protection and
information asymmetry problems reduce the value of intangible assets for multinational
corporations operating primarily in politically corrupt countries. Alternatively, if a firm
invests in tangible assets, or its activities directly involve the acquisition of physical assets
such as a mining operation, its investment could be in danger of expropriation, or
nationalization, in highly corrupt EM. Minor (1994) does show that incidences of
expropriation in EM have been decreasing since 1960. It is also possible that many firms in
FDI consider their exit strategy if the potential gains are not realised or there are changes in
political or economic factors and the firm needs to withdraw from the FDI. Clearly firms that
have low fixed asset investments can withdraw more easily and quickly than those with
substantial tangible investments. Clearly the type of asset invested in is connected to the
strategic motive to invest in EM and whether this is resource-seeking or market-seeking.
Therefore in this paper we interact the asset type with the strategic motive.
Based on this information we argue that the type of asset invested in can have an impact
on the wealth effect of acquirers and that its interaction with political risk, corruption, and
cultural distance, can be associated with the stock price reaction to FDI announcements in
EM. Accordingly, our fifth and final hypothesis (stated in the alternate) is as follows:
H5: Announcement period abnormal returns of UK firms expanding into EM are positively
related to the investment in tangible assets (due to the weak enforcement of property rights in
the majority of EM).

16
3. Data and Research Methods
In this section we present and discuss our dataset and the research method employed to test
our hypotheses.
3.1 Data
Our sample consists of 306 announcements of FDI in seventy-five different EM
countries by 134 UK firms listed on the London Stock Exchange (LSE) over the time period
from 1993 to 2008. To ensure we have as full information as possible on the FDI we identify
announcements from newswires and newspaper files from Lexis-Nexis using key search
words, including acquisitions, takeovers, joint ventures, alliances and agreements rather than
online databases. As this is hand collected data we ensure that the announcement date of FDIs
in our sample is the first discussion of any FDI by our sample firm. However, we do
acknowledge that information could leak out from different sources, particularly in certain
types of FDI announcements, and this could influence the results on a market reaction study.
We exclude announcing firms where we identified any news announcements indicating any
leakage of the FDI and also that have major confounding events, i.e. seasoned equity
offerings, stock reductions, profit announcements, dividend payments, other acquisitions,
domestic JVs, agreements or alliances different from the FDI considered, or changes in a key
executive, within the five days before or after the event day from the sample.15
We obtain
daily returns on the LSE and accounting data from each firm via Datastream.
UK firms stand as the major participants in FDI flows in EM. Recently, FDI in EM by
UK firms has grown in comparison to FDI in developed markets. Figure 1 shows outflows of
FDI from the UK into EM with a ‘boom’ in outward FDI from 2004 onwards. This FDI
15 We exclude 25 announcements of FDI by UK firms in this procedure.

17
‘boom’ in EM contrasts sharply with overall FDI activity by UK firms, as outflows of UK
FDI worldwide plummeted after the stock-market crash of 2000 and did not recover until
2007.16
[Insert Figure 1 about here]
In Table 1 we present the composition of our sample according to industry, year,
geographical region and country. Asia (Middle East) represents the most (least) active FDI
geographical region for UK firms. There is a diverse range of destinations for UK FDI in our
sample with China is the most popular destination for UK FDI but only has 16% of the total
number of FDIs. Table 1 also shows that the FDI activity has increased substantially in more
recent years, with 2006, 2007 and 2008 possessing the highest FDI activity (consistent with
the ONS data reported in Figure 1). There is a substantial amount of FDI research on the
decisions surrounding entry modes (e.g., Mani, et al., 2007) and of particular relevance to this
study is Meyer et al. (2008) who examined entry strategies in EM. Although not the focus of
this study we also break down the sample in Table 1 into the following entry modes:
agreements and alliances, IJVs, partial acquisitions and total acquisitions and then collate into
groupings of agreements and alliances, acquisitions, and partial ownership (i.e. IJVs and
partial acquisitions). All of our other tests are based on our full sample of 306 FDI which
includes all the different types of entry modes.
[Insert Table 1 about here]
3.2 Announcement Period Returns
To analyze the short-term stock price reaction to announcements of FDI by UK firms,
we use a standard event-study method (Brown and Warner, 1985). The research method is
16 Based on data for outward FDI flows taken from the UK Office for National Statistics (ONS).

18
described in Appendix 1. In order to add robustness to our results we use a buy-and-hold
abnormal return (BHAR) approach in addition to the market model for our event study and
describe this approach in Appendix 2.
3.3 Multiple Regression Cross-Section Analysis
We further examine the impact of FDI announcements on the returns accrued to
acquirers shareholders based on a multiple regression approach, where the effects of several
factors shaping the announcement period returns of acquirers are controlled simultaneously.
The estimable model is:
α ε
=
=+ +∑1
N
i i i
i
CAR X (1)
Where: CARi, is the announcement period cumulative abnormal return (hereafter CAR) of
acquirer i (see Appendix 1 and 2); ‘g’ measures the announcement period excess returns to
acquirers’ shareholders after controlling for the effects of all other covariates, denoted ‘X’.
The remainder of this section provides a rationale for the inclusion of these covariates.
Corruption (Control of corruption) is measured using the index published by The
Worldwide Governance Indicators (WGI) (The World Bank Group). Control of corruption
captures perceptions of the extent to which public power is exercised for private gain,
including both petty and grand forms of corruption, as well as ‘capture’ of the state by elites
and private interests. The index of Control of corruption is time varying over our sample
period and it ranges from approximately -2.5 (weak) to 2.5 (strong), i.e., low index represents
higher corruption.
Political risk (Political Stability and Absence of Violence) is measured using the index
published by The Worldwide Governance Indicators (WGI) (The World Bank Group).

19
Political stability and absence of violence measures perceptions of the likelihood that the
government will be destabilized or overthrown by unconstitutional or violent means,
including politically-motivated violence and terrorism. The index of Political Stability is time
varying over our sample period and it ranges from approximately -2.5 (weak) to 2.5 (strong),
i.e., low index represents higher political risk.
Cultural distance refers to the cultural differences, or gap, between two nations across
Hofstede’s four dimensions. Using Equation (2) proposed by Kogut and Singh (1988) we
calculate cultural distance as:
( ){ }== −∑
24
1& 4j ij iu ii
K SI I I V
(2)
Where: ܫ stands for the index for the ܫ th cultural dimension and j th country, ܸ is the
variance of the index of the ܫ th dimension, u indicates the UK, and ܫܵ&ܭ is the cultural
distance of the j th country from the UK. A low ܫܵ&ܭ thus means a low cultural distance.
Physical assets refer to an investment which involves the acquisition of tangible assets.
Non-physical assets refer to an investment which does not involve the acquisition of
tangible assets, such as a distribution agreement.
The Free Cash Flow (FCF) of a firm is defined as earnings before interest, taxes and
depreciation (EBITDA) less capital expenditures, or net operating cash flow, divided by total
assets for the year preceding the announcement of FDI.
Tobin’s q is measured using Equation (3):
+ +=
Pr'
MV ef DebtTobin s q
TA (3)
20
Where: MV is the market value of the firm's common stock for the year preceding the
announcement; Pref is the book value of the firm’s preference shares (preferred stock) for the
year preceding the announcement; Debt is the book value of the firm’s total debt for the year
preceding the announcement; and TA is the total assets for the year preceding the
announcement.17
In each case, we group FDI announcements into high, medium, and low according to the
values for our key explanatory variables. For example, a FDI in an EM with a control of
corruption value at the time of the announcement on the lower 33.3% group would be
classified as a FDI in high corruption country; a FDI in an EM with a control of corruption
value at the time of the announcement on the higher 33.3% group would be classified as a
FDI in low corruption country; a FDI in an EM with a control of corruption value at the time
of the announcement on the medium 33.3% group would be classified as a FDI in medium
corruption country. The only exception to this is for Tobin’s q. Following convention in the
literature (e.g. Doukas, 1995) we categorize high Tobin’s q firms as those with q greater than
1, and low q firms are those with q below 1.
We also include in Equation 1 several other control variables that are possibly important
determinants of the distribution of CAR of acquirers involved in FDI. These include the type
of strategic investment (resource or market seeking 18
as it represents an important variable in
relation to FDI and corruption (Brouthers, et al., 2008)), the size of acquirer (the logarithm of
the acquiring firm’s market capitalization four weeks prior to the announcement of the deal
(Moeller, et al., 2004), industry dummies (based on Datastream industry classifications),
leverage (the book value of the debt to common equity ratio for the year preceding the
17 This measure is consistent with the modified version of Tobin’s q used by Chung and Pruitt (1994). Here, we
use book values of preferred stock and total debt) as there is a far more active market for the trading of corporate
debt in the US compared to the UK which leads to the reliance on book values for these variables in this study.
18 For our sample we have 149 market seeking FDI, 143 resource seeking FDI and 14 that could be classified as
both or were undertaken for other unclassified reasons and were excluded from this part of the analysis.

21
announcement), liquidity (the quick ratio for the year preceding the announcement), and the
FDI entry mode (IJVs, Partial acquisitions, and Total acquisitions). We also include year
dummies to control for any time variation in our empirical results. Finally in additional tests
we include four other control variables related to cultural distance between the EM country
and the UK; colonial relation, physical distance from UK, following UK legal system and a
current member of the UK commonwealth.
We report descriptive statistics for our variables in Table 2.
[Insert Table 2 about here]
4. Results
In this section we present and discuss the main findings of our analysis. We begin
with the discussion of the univariate analysis of acquirers’ announcement period abnormal
returns. In the following sub-section the discussion concentrates on the findings based on the
multiple regression analysis of value gains to acquirers where various robustness tests are
also presented and discussed.
4.1 The Univariate Analysis of Announcement Period Excess Returns
Table 3 presents the announcement period cumulative abnormal returns (CAR) for the
entire sample as well as portfolios of FDI announcements formed according to the FDI mode
of entry and the geographic region of the host country. The average CAR for the entire
sample is 1.57% and highly statistically significant.19
This finding supports our hypothesis
19 The two-day BHAR is 1.69% (statistically significant at the 1% level) – see robustness section.

22
1and is consistent with prior studies analyzing FDI in EM which show at least short-run
benefits to shareholders of the internationally expanding corporation.20
[Insert Table 3 about here]
Further analysis concentrates on the investigation of the mode of entry including
agreements and alliances, IJVs, partial acquisitions, and total acquisitions. Combining
together the modes of entry in the host country allows us to develop additional portfolios.
These include: agreements and alliances together with IJVs, partial acquisitions together with
total acquisitions, and IJVs together with partial acquisitions (partial ownership).
Announcement period performance across all entry modes is significantly positive with the
exception of agreements and alliances on their own, but significantly positive when combined
with IJVs (similar results are obtained based on the 5-day CAR (t-2, t+2)).21
Our analysis
based on the region of the host country including Africa, Asia, Eastern Europe, and Latin
America, shows a significantly positive CAR with the exception of the Middle East region
which experiences zero announcement period returns.22
The highest average CAR is obtained
for FDI in Africa, a continent that historically had policies discouraging entry of foreign
firms, but since the 1990s has seen a change in attitude in many of its countries to FDI. Many
African countries have begun to recognize the potential benefits of FDI and have altered their
policies in this regard (Owhoso, et al., 2002). Overall, evidence presented in Table 3
20 See for example, Gupta et al. (1991) for FDI by US firms in China and Owhoso et al. (2002) for US firms
undertaking FDI in Africa (excluding the negative returns in South Africa). 21
Results based on the 5-day CAR (t-2, t+2) are not reported to conserve space, but they are available from the
authors upon request. 22
We carry out a number of robustness checks for our sample based on various individual country breakdowns.
Using the largest three countries according to FDI destination (China, India and Brazil) we find that UK FDI in
China, China and Brazil, China, Brazil and India do not have a positive market reaction for our sample. In fact
FDI in China on average have significant negative announcement reaction and are therefore FDI in the other EM
countries are driving our overall positive market reaction. Results are available on request from the authors.

23
confirms that there is a positive shareholder wealth effect on the announcement of FDI in EM
by UK corporations.23
4.2 Analysis of Factors Influencing Announcement Period Excess Returns
Based on the results reported in Table 4 we test our hypotheses investigating the impact
of political risk, corruption and cultural distance on the shareholder wealth effects of FDI
undertakings in EM. Initially we find that acquirers of FDI in EM with high political risk
enjoy a 1.93% higher wealth gain compared to FDI in EM with low political risk (Panel A).
This is consistent with our Hypothesis 2.24
Possible explanations could be that the benefits of
economic growth and lower factor costs are greater in EM countries with higher levels of
political risk. Rossi and Volpin (2004) and Barbopoulos et al. (2012) claim that lower
competition in the foreign market (EM) entails lower premiums and thus higher gains for the
acquiring firm.25
Results reported in Table 4 (Panel B) show that the wealth effects of UK acquirers are
sensitive to the corruption level of the host country. Specifically, acquirers involved in FDI in
countries with high corruption level enjoy 1.78% higher gains compared to those acquiring
assets in low corruption countries. This is consistent with our Hypothesis 3 which predicts a
positive relation between the acquirers’ CAR and the host country’s corruption level. EM
with higher corruptions levels are likely to be associated with limited competition and thus
lower premium linked to the deal, which increases the likelihood of success of the deal and
23
Table 2 shows the three main destinations for UK FDI in our sample are China, India and Brazil. We
investigated if the announcement results for these counties were driving the overall positive market reaction.
However we found that a dummy variable for FDIs in these countries have a significantly negative return,
especially driven by a significant negative reaction for FDIs in China. These results are available from the
authors on request. 24
Results based on the 5-day CAR (t-2, t+2) are not reported to conserve space, but they are available from the
authors upon request. 25
Similarly Waheed and Mathur (1995) in their investigation of US banks expansions in EM contend that risky
EM generally present greater barriers to foreign investments than less risky EM. This restricts competition in
risky EM and therefore there is the expectation of higher profitability for new entrants in these markets.
24
thus announcement period returns of acquirers. Table 4 reports also results based on the
analysis of cultural difference between the UK (home market) and the host country. We find
no evidence supporting our Hypothesis 4. There is the possibility that, in the face of
globalization, Hofstede’s cultural dimensions measure needs to be updated or needs to be
reconsidered for EM.
[Insert Table 4 about here]
Next our analysis rests on the impact of the interaction of political risk, corruption, and
cultural distance measures with the type of asset investment, on the announcement period
returns of acquirers. We find support for our Hypothesis 5 as the type of asset involved in the
investment influences the announcement period wealth gains of acquirers. Specifically, FDI
of ‘hard’, or ‘tangible’, assets or activities directly involve the acquisition of physical assets,
enjoy 1.60% (2.09% in the 5-day CAR (t-2, t+2)) higher wealth gains than investments in
‘intangible’ assets or agreements.
[Insert Table 5 about here]
Results reported in Table 5 highlight the interaction effect between asset type and
international business factors (political risk, corruption and cultural distance) in further
shaping the shareholder wealth gains of FDI in EM. The largest gains to FDI announcements
accrue to acquirers investing in physical assets in EM with high political risk and corruption
ratings (the analysis of 5-day CAR (t-2, t+2) confirms these findings). This result is
consistent with the argument of Caprio et al. (2010) that tangible corporate assets are less
easily extractable by corrupt officials. Also this implies the gains are higher for certain
industries (manufacturing, oil and gas, etc). It is possible that the industrial policies of EM
countries are favourable to such industries, for example income tax holidays, less restrictions
in profit repatriations, rent free (low rent) land and premises etc. are offered to these

25
industries to attract foreign investments. Such favourable treatments are unlikely to be
available for other industry groupings such as service industries. Our result can also be
interpreted as complementary to the more general theoretical arguments of Hoskisson et al.
(2000) and the empirical findings of Pantzalis et al. (2008) regarding the weak enforcement
of intellectual property rights in EM, which can be exacerbated in host countries suffering
from higher levels of political corruption.
4.3 Cross-section Analysis
In this section we present and discuss the findings from the multiple regression analysis.
To avoid possible multicollinearity between different sets of covariates, Equation 1 is
estimated in a nested form with various combinations of covariates.26
Tables 6 to 8 report our
findings. Initially, we investigate the impact of the host country’s time varying level of
corruption and political risk, as well as the impact of cultural distance, as continuous
variables across Models 1 to 3. The impact of FDI in physical assets (=1) relative in non-
physical ones (=0) is also investigated in Model 4. In Model 5 we include a dummy variable
capturing the impact of a market-seeking strategy (=1) versus (=0) if the strategy is a
resource-seeking (as in Brouthers et al. 2008). Lastly, in Model 6 we examine the interaction
effects between the asset type acquired and variables representing resource or market seeking
FDI. This is to further investigate whether the type of asset acquired interacts with the main
motive of the FDI in determining acquirers’ returns in the announcement period. Other
variables used in our multiple regression analysis include the acquiring firm’s FCF, Tobin’s
q, log of market capitalization, debt-to-equity ratio and three other dummies variables
capturing the effect of the entry mode in the foreign market.
26
We have also ensured using the Variance inflation factor (VIF) statistic that possible multicollinearity has
been avoided.
26
Our multiple regression analysis not only confirm evidence based in our univariate
analysis but it also corroborates the principal role of levels of corruption, political risk,
cultural distance, as well as several other variables, in determining acquirers’ returns. Overall,
the average acquirer enjoys a significantly positive return around the announcement of the
FDI, as indicated in the positive and statistically significant intercept terms across all
Models.27
Furthermore, the high ratings for corruption and political risk are associated with
higher CAR (Models 1 and 2). These findings offer great support to our Hypotheses 1 to 3,
which foresee positive returns for acquirers engaged in FDI in general, and higher gains to
FDI in EM with high levels of corruption and political risk specifically. However, consistent
with our univariate analysis, the cultural distance is not related to the distribution of
acquirers’ returns (Model 3) even after the effect of several other factors is controlled. We
further examine the impact of cultural distance on the market reaction by examining four
additional control variables related to cultural distance, (former colonial relation, physical
distance from UK, following UK legal system and a current UK commonwealth relation).
The inclusion of these additional control variables does not change the overall significance of
our explanatory variables and only one of the four additional control variables is significant.
We found that if the FDI target country was a former colony protectorate or mandate of the
UK there was a positive relation to the market reaction. Our analysis further shows higher
gains to acquirers of physical than non-physical assets and also to FDI following a resource-
seeking strategy rather a market-seeking one (Models 4 and 5).28
Lastly, the interaction
effects between the type of strategy and the type of asset acquired are tested in Model 6. We
27
We control for industry, year effects and liquidity (using reduced samples for the quick ratio as it is not
available for all firms). For brevity we do not report the results including these controls as they were not
significant in the regressions and did not impact on the significant relations we observe for our key variables. In
addition, we check the robustness of these OLS regression results by using weighted least squares (WLS)
regressions to compensate for the potential violation of the homoscedasticity assumption in OLS regression,
where weights are based on the inverse of the standard error of the cumulative abnormal return. We find that our
significant relations are unchanged in the WLS regression and there are no new significant relations. 28
The univariate test of the mean difference between the two-day CARs for a resource-seeking versus market-
seeking strategy is 2.37%, significant at the 1% level.
27
show that only the interaction between of resource-seeking strategy and physical-assets
appears positive and significant, further indicating the impact of the main motive of FDI
along with the type of asset acquired on the distribution of acquirers’ returns.
[Insert Table 6 about here]
Table 7 shows that a resource-seeking strategy elicits higher returns to acquirers’
shareholders than a market-seeking strategy. In addition, we show that after the inclusion of
the market-seeking dummy variable across our models, the impact of different levels of
corruption and political risk, as well as the impact of type of asset acquired, on the
distribution of acquirers’ returns remains significant (Models 1, 2, 4). Next, we investigate
the interaction effects between the type of asset acquired and different levels of our main
international business variables (corruption, political risk, and cultural distance). Our main
results from this analysis highlight that FDI in highly corrupted EM yields the higher gains
only when physical assets are acquired (Model 5). We argue that FDI in physical assets is
preferred in a highly corrupted EM as the assets are less easily extractable by corrupt
officials. Lastly, our analysis shows that FDI in EM with high cultural distance with the
source country (UK) yield high gains only when intangible assets are acquired (Model 7).
[Insert Table 7 about here]
Table 8 investigates the interaction effects of a resource or market-seeking strategy with
high/low levels of corruption, political risk and cultural distance. We consistently obtain a
significantly positive (negative) relationship between the resource (market) seeking strategy
and high levels of our international business variables (corruption, political risk and cultural
distance). They explain that cost savings arising from cheaper resources might not offset
costs of corruption in countries with a high corruption rating as there is a limit to how cheap

28
resources can be, but no limit to the costs of corruption. However, we believe that in our
firm-level case, our key result acts as an explanation for the positive stock price reaction in
highly corrupt countries. It is plausible that firms are facilitated access to valuable resources
at a favorable price from corrupt countries which is viewed positively in the short-term by the
market. It is also possible that some firms can create resource allocation efficiencies in EM
with underdeveloped economic and legal frameworks.
[Insert Table 8 about here]
Our multiple regression analysis further confirms that smaller acquirers enjoy higher
announcement period returns (see also Moeller et al., 2008).
4.4 Summary
Overall, our findings based on our cross-section analysis confirm evidence from our
univariate analysis reported in Tables 3 to 5, and they further support our hypotheses
foreseeing higher acquirers’ returns from FDI in general, and in EM with high levels of
corruption and political risk specifically. We show that the latter finding is shaped, to a great
extent, by the type of FDI strategy followed (resource versus market seeking). Lastly,
following the theoretical arguments of Hoskisson et al. (2000), the distribution of acquirers’
returns are higher to FDI of physical versus non-physical assets, where firms are less subject
to concerns about enforcement of intellectual property rights.
4.5 Robustness Tests29
In this section we describe the procedures we carry out to ensure robustness of our main
findings.
29
For brevity, we do not report the results of all the testing carried out in this section. Unreported results are
available on request from the authors.

29
4.5.1 Event-study Research Method and Event Window
In addition to the main event window investigated in our analysis (t-1, t=0), we extend
our analysis over a longer event window to confirm the robustness of our results. We also use
the buy-and-hold abnormal returns (BHAR) method, in addition to the market model, to
compute the announcement period market reaction for each FDI in our sample. We examine
average abnormal returns (AAR) over the extended window to identify whether information
about the announcement of the FDI is known in the market before of the formal
announcement, or whether the pricing effects of the FDI announcement are adjusted quickly
in the acquiring firm’s stock price.
The AAR for the event days in the main window analyzed (t-1 and t=0) are 0.49% and
1.04% respectively. We find marginal evidence of negative performance in some of the days
preceding the formal announcement, but the strongest stock market response is observed in
days (t-1 and t=0). There is no evidence of a delayed response to the announcement given the
statistically insignificant abnormal returns in the 15 days following the FDI announcement.
The BHARs are insignificant from events days’ t-15 to t-1 until the compounded BHAR
of 2.26% on the event day. BHAR remain significant for the remainder of the extended event
window. Furthermore, the two-day BHAR is 1.69% and very similar to the CAR of 1.57%
reported in Table 3. We also re-estimate our cross-sectional analysis in Table 6 using BHAR
over the window (t-1, t=0). Our main conclusions related to the impact of political risk,
corruption, and FDI investment in physical assets (and also the interaction between the
international business variables and the type of asset acquired) remain unchanged.
This robustness test further confirms our main findings on the positive effect of FDI in
EM on the announcement period performance of acquirers. They also confirm the importance

30
of international business variables (political risk, corruption, and cultural distance) and the
type of asset acquired, in explaining the distribution of gains accrued to shareholders of
acquirers engaged in FDI in EM.30
4.5.2 Self Selection
The second issue we address under the robustness section is the potential for self
selection bias in our original empirical results. Specifically, we are concerned that those firms
choosing to undertake FDI in EM are precisely the firms that should be doing so, leading to a
spurious positive result in our event study. This problem also has implications for examining
the extent to which the market could be aware of the FDI before the first formal
announcement of the decision, which can vary across entry methods and the type of asset
invested.
To address this we have considered the firm characteristics that are likely to lead to self-
selection in the FDI arena. Following Gande et al. (2009), in the first stage of this process we
use a probit model to determine the likelihood of a firm undertaking FDI in EM. The
dependent variable is a dummy variable equal to one (=1) for our sample firms, and zero (=0)
for a matched or control sample firm. Selecting control firms first involves identifying the
universe of UK public firms that did not undertake FDI within the period 1993 to 2008. We
then match our sample firms to non-FDI firms based on industry and market value for the
year preceding the announcement. We hypothesize that the decision of a firm to be engaged
into FDI is related to its size (measured by the log of market capitalization of acquirer), the
acquirer’s ratio of liabilities to assets, and the acquirer’s EBIT, capital expenditure and R&D
30
In addition, our results are robust to the Corrado (1989) and Generalized Sign procedures and we carried out a
range of parametric and non-parametric diagnostic tests, namely Spearman’s Rank Correlation, Squared Rank,
Rohrbach and Chandra (1989), Runs (Geary), Durbin-Watson, Ramsey’s RESET and Chow tests. These
procedures confirm that our model is well-specified.

31
expenditures, all measured as a fraction of total sales.31
We use the selection equation to
construct the inverse Mills (IML) ratio associated with the selection decision for each sample
firm, and in the second stage of this analysis, we include this as an additional explanatory
variable in our cross-section regressions (Tables 6 to 8). In all specifications the IML ratio
enters insignificantly and our results regarding corruption, political risk, cultural distance,
asset type, strategy (resource/market seeking) and the interaction between political risk,
corruption, and asset type in explaining the shareholder wealth effects of FDI in EM remain
unchanged. The results are qualitatively unchanged to those reported in our main results
section. As an additional robustness check we also re-estimate the probit regression using
multiple non-FDI firm benchmark matches for each of our observations in order to construct
the IML ratio, where we include as control firms all non-FDI firms with market capitalization
within 80% and 120% of our sample firm. The results remain again qualitatively unchanged.
4.5.3 Firm Multinationality and Prior Experience
Berry (2006) considers the location decision of FDI between developed and
developing markets. Although we only consider EM we use some of the arguments of this
paper as robustness checks in our EM sample. Berry (2006) argues that as international
investment in EM is riskier than in developed markets, shareholders may not value the
investment in an EM until the firm has experience from previous international investments.
Prior experience (firm’s multinationality) can be measured in a number of ways (see Berry,
2006). In this test we classified firms as having prior experience if they had prior operational
experience in the host country (210 (96) UK firms had (no) prior experience in the EM host
country of their FDI choice). We did not find a significant difference in the market reaction
between the two groups (both groups yield a significant positive market reaction). Therefore,
31
Unlike Gande et al. (2009) we are unable to include the ratio of advertising expenditures to sales as an
explanatory variable given a lack of reported data on this variable in Datastream for UK firms.

32
the influence of prior experience is not as important in our EM sample as shareholders value
the FDI decision whether the firms have prior experience or not.
5. Conclusion - Discussion and Implications, limitations and future research
5.1 Discussion
In this paper we integrate theories from the international business and finance to
investigate the determinants of short term shareholder wealth effects around FDI
announcements by UK firms in EM. Our analysis concentrates primarily on the wealth
effects of time varying political risk and corruption levels of the host country, cultural
distance between the UK (home market) and the host market, as well as strategic issues (type
of asset acquired, resource or market seeking strategy, method of entry in the foreign market)
on the distribution of acquirers’ announcement period returns.
Our results confirm that UK firms experience a highly significant shareholder wealth
gain from FDI in EM. We show that our results based on market-model based event study are
robust to an alternative specification using BHAR and standardization procedures. The
positive wealth effect is higher for UK firms investing in Africa and is insignificantly
negative for firms investing in the Middle East (and negative for China). However, our
contribution to international business and finance literature lies in identifying the interaction
of the most relevant factors and strategic issues that should be considered important when
assessing the merits of investing in EM. This has practical implications for both managers
and shareholders, since EM attract sizeable amounts of FDI from abroad and investors
require an enhanced understanding of factors that have an impact on the strategies of firms
investing in EM.

33
Firstly, we find both political risk and corruption need not deter a manager from
investing in EM. Indeed, we have found short-term abnormal returns to be significantly
higher when investing in an EM with a high political risk rating or corruption rating. This
would appear to be in line with the argument that corruption can act as a ‘helping hand’ and
prior literature showing that a high political risk rating has a non-negative or positive effect
on shareholder wealth for foreign firms. However this surprising finding is more understood
when we consider some of the other significant factors in our analysis. We find that when
firms invest in countries with a high corruption rating using a resource-seeking strategy, they
enjoy the highest announcement period gains. This evidence could act as an explanation as to
why this particular grouping display the greatest gains for shareholders, since it is plausible
that firms are facilitated access to valuable resources at a favorable price from EM countries
with lower standards/less regulations on corruption which is viewed positively in the short-
term by the market. It is also possible that some firms can create resource allocation
efficiencies in EM with underdeveloped economic and legal frameworks. This is important to
managers considering different FDI target destinations, each with varying levels of political
risk and corruption, and considering what type of strategy they wish to follow. Clearly, the
message for managers is that location choice and strategy do matter.
Secondly, we show that the type of asset invested in, or acquired, has a bearing on the
shareholder wealth effect. Investment in, or acquisition of, ‘hard’ assets leads to significantly
higher abnormal returns relative to investment in intangible assets or agreements. This is
more so in EM with a high political risk rating where there is a higher potential for adverse
governmental actions. There is also a significant interaction effect between the type of asset
investment and corruption. Investments involving the acquisition of physical assets in EM
with a high corruption rating elicit the highest gains. Possible reasons for this result can be

34
related to the structure of a firm’s asset holdings; hard, physical assets are not easily
extractable by corrupt officials, or because physical assets do not suffer to the same extent as
intangibles with regards to enforcement of intellectual property rights.
We find no evidence to suggest that cultural differences between the UK (home market)
and the host country play an important role in determining the distribution of the acquirers’
market reaction to announcements of FDI in EM. This also implies that, in the face of
globalization, or the type of legal system do not play an important role in the wealth effect.
This transfer of ideas and information on a global scale could lead to a reduction in cultural
barriers and reduce the importance of traditional beliefs about cultural distance. There is also
the possibility that, in the face of globalization, Hofstede’s cultural dimensions have changed
over time. However we do find that whether the FID target country was a former UK colony
had a positive relation with the market reaction. Other important results obtained are the
mode of entry in the foreign market, as well as the impact of several other firm-specific
factors such as the size of the acquiring firm.
We contend that the analysis of the above factors on the distribution of acquirers’ returns
during the announcement period of FDI adds significantly to the existing literature of
international business and finance, particularly the importance on the impact of shareholder
wealth of resource seeking strategies when firms invest in countries with a high corruption
rating.
5.2 Implications, limitations and future research
On the whole, our results help to explain varying wealth impacts on the announcement of
FDI in EM and make a contribution to prior research by identifying the integration of key
international business and finance factors impacting on shareholder benefits, including

35
corruption which had not been previously investigated. These results lead to an enhanced
understanding of the decision of expanding into EM. It is conceivable that managers choose
to announce FDI based on considerations that are correlated with political risk, corruption, or
asset type. For example, managers could be reluctant to announce FDI in corrupt countries
until it is finalized or managers could be cautious and delay announcement about investing in
tangible assets until they have eliminated the risk of expropriation. Consequently, FDI
announcements could be a bigger surprise when investing in corrupt countries, or in tangible
assets. Further research could account for multinational financing strategies of firms
expanding into highly politically risky countries, which is a crucial consideration for firms.
For example, a firm can mitigate political risk by raising local debt with the effect of
reducing the net assets of the subsidiary and thus the likelihood of expropriation. Although
expropriation has become somewhat a past occurrence, the firm could also use local debt for
other reasons, such as to reduce the impact of exchange controls.
A clear limitation in this empirical paper is the use of secondary data and proxies. Our
surprising findings that the highest abnormal returns are for FDI in EM countries with high
political risk and corruption rankings (using established proxies) requires further study and
analysis. For instance the corruption index could be serving as a proxy for other issues, such
as greater institutional barriers to imports, or greater dependence on foreign suppliers of
physical capital rather than corrupt behaviour. Also there is a possible time dimension to this
relation as the political risk and corruption rating refers to a particular point in time but
returns are determined by the anticipation of future cashflows. There is the possibility that the
market anticipates political and corruption rankings will improve in the future.
We would also suggest case studies and interviews as a possible further route to further
investigate negotiations and the managers’ perspective on how the acquisitions of physical
assets for resource seeking purposes are determined. Empirically, it would be interesting to
36
test the robustness of our results for more outward FDI countries. For example, we discount
cultural distance between UK and host country in our results, but cultural distance between
UK and host country relative to some competitor outward FDI firm in a country with
differing cultural distance might be a factor. These arguments affect FDI flows but the gains
at the micro level have not been fully documented. It would be interesting to investigate
whether the form of financing the FDI has any impact on the wealth effect of the
announcement. In addition, future research can seek to investigate corporate governance
issues, which could influence the decision to undertake FDI. Finally this is a short term study
and shareholders who anticipate future profits could be disappointed. Therefore future
research should consider a longer term analysis of corporate performance and FDI in EM.

37
References Abed, G. T., & Gupta, S. 2002. Governance, corruption, and economic performance.
Washington D.C.: International Monetary Fund.
Asquith, P., Bruner, R.F., & Mullins, D.W. 1983. The gains to bidding firms from merger.
Journal of Financial Economics, 11: 121-139.
Barbopoulos, L., K., Paudyal & Pescetto, G. 2012. Legal systems and gains from cross-
border acquisitions. Journal of Business Research, 65: 1301-1312.
Berry, H. 2006. Shareholder valuation of foreign investment and expansion. Strategic
Management Journal, 29: 1123-1140.
Borde, S. F., Whyte, A. M., Wiant, K. J., & Hoffman, L. L. 1998. New evidence on factors
that influence the wealth effects of international joint ventures. Journal of Multinational
Financial Management, 8(1): 63-77.
Bris, A. & Cabolis, C. 2008. The Value of investor protection: firm evidence from cross-
border mergers," Review of Financial Studies, 21(2): 605-648. Brewer, T. L. 1983. The instability of governments and the instability of controls on funds
transfers by multinational enterprises: implications for political risk analysis. Journal of
International Business Studies, 14(3): 147-157.
Brouthers, K.D., Brouthers, L.E., & Werner, S. 2003. Transaction cost-enhanced entry mode
choices and firm performance. Strategic Management Journal, 24(12): 1239–1248.
Brouthers, L. E., Gao, Y., & McNicol, J. P. 2008. Corruption and market attractive influences
on different types of FDI. Strategic Management Journal, 29: 673-680.
Brown, S. J., & Warner, J. B. 1985. Using daily stock returns: the case of event studies.
Journal of Financial Economics, 14(1): 3-31.
Bruner, R. 2004. Applied Mergers & Acquisitions, (New Jersey, USA: Wiley).
Buckley, P. J. 1988. The limits of explanation: testing the internalization theory of the
multinational enterprise. Journal of International Business Studies, 19(2): 181-198.
Butler, K. C., & Joaquin, D. C. 1998. A note on political risk and the required return on
foreign direct investment. Journal of International Business Studies, 29(3): 599-607.
Caprio, L., Faccio, M., & McConnell, J. J. 2010. Sheltering corporate assets from political
extraction. Working Paper.
Chang, S. C., Chen, S. S., & Lai, J. H. 2008. The wealth effect of Japanese-US strategic
alliances. Financial Management, 37(2): 271-302.
Chari, A., Page, O., & Tesar, L. 2010. The value of control in emerging markets. Review of
Financial Studies, 23(4): 1741-1770.
Chung, K. H., & Pruitt, S. W. 1994. A simple approximation of Tobin’s Q. Financial
Management, 23: 70-74.
Click, R. W. 2005. Financial and political risks in US direct foreign investment. Journal of
International Business Studies, 36: 559-575.
Corrado, C. J. 1989. A nonparametric test for abnormal security price performance in event
studies. Journal of Financial Economics, 23: 385-395.
Cuervo-Cazurra, A. 2006. Who cares about corruption? Journal of International Business
Studies, 37: 807-822.
Denis, D. J., Denis, D. K., & Yost, K. 2002. Global diversification, industrial diversification,
and firm value. Journal of Finance, 57(5): 1951-1979.
Doukas, J. 1995. Overinvestment, Tobin’s q and gains from foreign acquisitions. Journal of
Banking and Finance, 19(7): 1285-1303.
Doukas, J. A., & Kan, O. B. 2006. Does global diversification destroy firm value? Journal of
International Business Studies, 37(3): 352-371.

38
Draper, P., & Paudyal, K. 2006. Acquisitions: private versus public. European Financial
Management, 12: 57-80.
Dunning, J. 1998. Location and the multinational enterprise: A neglected factor? Journal of
International Business Studies, 29(1): 45-66.
Egger, P., & Winner, H. 2005. Evidence on corruption as an incentive for foreign direct
investment. Journal of Political Economy, 21: 932-952.
Erel, I., Liao, R. C., & Weisbach, M. S. 2012. Determinants of cross-border mergers and
acquisitions. Journal of Finance, 67: 1045-1082.
Errunza, V. R., & Senbet, L. W. 1984. International corporate diversification, market
valuation, and size-adjusted evidence. Journal of Finance, 39(3): 727-743.
Fama, E., Fisher, L., Jensen, M. C., & Roll, R. W. 1969. The adjustment of stock prices to
new information. International Economic Review, 10(1): 1-21.
Francis, B. B., Hasan, I., & Sun, X. 2008. Financial market integration and the value of
global diversification: Evidence for US acquirers in cross-border mergers and acquisitions.
Journal of Banking & Finance, 32: 1522-1540.
Gande, A., Schenzler, C., & Senbet, L. W. 2009. Valuation effects of global diversification.
Journal of International Business Studies, 40: 1515-1532.
Gomez-Mejia, L. R., & Palich, L. R. 1997. Cultural diversity and the performance of
multinational firms. Journal of International Business Studies, 28: 309-335.
Gupta, A., McGowan, C. B., Misra, L., & Missirian, A. 1991. Gains from corporate
multinationalism: evidence from the China experience. Financial Review, 26 (3): 387-407.
Henisz, W. J., & Zelner, B. A. 2001. The institutional environment for telecommunications
investment. Journal of Economics and Management Strategy, 10(1): 123-147.
Hennart, J.-F., & Park, Y.-R. 1993. Greenfield vs. Acquisition: The Strategy of Japanese
Investors in the United States. Management Science, 39(9):1054-1070.
Hoskisson, R. E, Eden, L., Lau, C., & Wright, T. M. 2000. Strategy in emerging economies.
Academy of Management Journal, 43(3): 249-267.
International Finance Corporation (2007). The next four billion – market size and business
opportunity at the base of the pyramid. World Resources Institute.
Kogut, B., & Singh, H. 1988. The effect of national culture on choice of entry mode. Journal
of International Business Studies, 19(3): 411-432.
Kogut, B., & Zander, U. 1993. Knowledge of the firm and the evolutionary theory of the
multinational enterprise. Journal of International Business Studies, 24(4): 625-645.
La Croix, S. J., & Konan, D. E. 2002. Intellectual property rights in China: The changing
political economy of Chinese-American interests. The World Economy, 25: 759-788.
La Porta, R., Lopez-de-Silanes, F., Shleifer, A., & Vishny, R. W. 2008. The economic
consequences of legal origins. Journal of Economic Literature, 46(2): 285-332.
López-Duarte, C., & García-Canal, E. 2007. Stock market reaction to foreign direct
investments: interaction between entry mode and FDI attributes. Management
International Review, 47(3): 393-423.
Malta Conference. 1994. Report of the Netherlands Ministry of Justice. Proceedings of the
19th Conference of the European Ministers of Justice. La Valetta 14-15th of June, 1994.
Strasbourg: Council of Europe Publishing.
Mani, S., Kersi, A. D. & Rindfleisch, A. 2007. Entry mode and equity level: A multilevel
examination of foreign direct investment ownership structure. Strategic Management
Journal, 28: 857-866.
Meyer, K. E., Estrin, S., Bhaumik, S. K. & Peng, M. W. 2009. Institutions, resources, and
entry strategies in emerging economies. Strategic Management Journal, 30: 61-80.

39
Minor, S. 1994. The demise of expropriation as an instrument of LDC policy, 1980-1992.
Journal of International Business Studies, 25(1): 177-188.
Moeller, B.S., Schlingemann, P.F., & Stulz, M.R. 2004. Firm size and gains from
acquisitions. Journal of Financial Economics, 73: 201-228.
Morck, R., & Yeung, B. 1991. Why investors value multinationality. Journal of Business, 64
(2): 165-187.
Owhoso, V., Gleason, K. C., Mathur, I., & Malgwi, C. 2002. Entering the last frontier:
expansion by US multinationals to Africa. International Business Review, 11: 407-430.
Pantzalis, C. P., Park, J. C., & Sutton, N. 2008. Corruption and valuation of multinational
corporations. Journal of Empirical Finance, 15(3): 387-417.
Robock, S. H. 1971. Political risk: Identification and assessment. Columbia Journal of World
Business, 6(4): 6-20.
Rohrbach, K., & Chandra, R. 1989. The power of Beaver’s U against a variance increase in
market model residual. Journal of Accounting Research, 27: 165-183.
Rossi, S. & Volpin, P. F. 2004. Cross-country determinants of mergers and acquisitions.
Journal of Financial Economics, 74: 277–304
Shapiro, A. C. 2006. Multinational financial management. 8th ed. New Jersey: Wiley.
Shenkar, O. 2001.Cultural distance revisited: towards a more rigorous conceptualization and
measurement of cultural differences. Journal of International Business Studies, 32(3): 529-
618.
Sudarsanam, S. 2010. Creating Value from Mergers and Acquisitions: The Challenges.
Pearson Education Limited. London.
Sudarsanam, P. S., & Mahate, A. A. 2003. Glamour acquirers, method of payment and post-
acquisition performance: The UK evidence. Journal of Business, Finance and Accounting,
30: 299-341.
Tanzi, V. 1998. Corruption around the world: causes, consequences, scope, and curses. IMF
Working Paper WP/98/63. Washington D.C.: International Monetary Fund.
Teece, D. J., Pisano, G., & Shuen, A. 1997. Dynamic capabilities and strategic management.
Strategic Management Journal, 18(7): 509-533.
Tihanyi, L., Griffith, D. A., & Russell, C. J. 2005. The effect of cultural distance on entry
mode choice, international diversification, and MNE performance: A meta-analysis.
Journal of International Business Studies, 36(3): 270-283.
UNCTAD. 2006. United Nations Conference on Trade and Development, World Investment
Report, FDI from Developing and Transition Economies: Implications for Development.
United Nations New York and Geneva.
Waheed, A., & Mathur. I. 1995. Wealth effects of foreign expansion by U.S. banks. Journal
of Banking and Finance, 19: 823-842.
Wei, S. 2000. How taxing is corruption on international investors. The Review of Economic
and Statistics, 82(1): 1-11.
World Investment Report. 2009. United Nations Conference on Trade and Development.
Transnational Corporations, Agricultural Production and Development. United Nations
New York and Geneva.
Zaheer, S. 1995. Overcoming the liability of foreignness. Academy of Management Journal,
38(2): 421-363.

40
Appendix 1 – Research Method – Market Model
The event-study method allows us to measure the stock price response during both a 31-day
event window (t-15, t+15) and a two-day event window (t-1, t=0). We report results for the
two-day event window in the main text of the paper. Results for the longer 31-day event
window are reported in the robustness section. Day 0 is the date of the FDI announcement, as
taken from the Lexis-Nexis database. The wealth impact is known as the abnormal return
(AR) on the stock of company ݅ within the event window and is calculated using the market
model proposed by Fama et al. (1969):
( )α β= − −it it i i mtAR R R (4)
where: itR is the realized return on stock ݅ on day t,
mtR is the return on the FTSE All-Share
index on day t, and ߙ and are the OLS market model parameter estimates for company ݅ during the estimation period preceding the event window (t-150, t-16). There are no multiple
FDI decisions by a UK firm within this window. We use the coefficients estimated to
calculate daily abnormal returns (AR) for both the 31-day event window (t-15, t+15) and the
two-day event window (t-1, t=0). ܴܣ௧ is the abnormal return for stock ݅ on day t and is
defined as the difference between the actual return observed and the predicted, or normal,
return according to the market model. We measure the average abnormal return (AAR) across
all securities on day t by:
=
= ∑ 1
1 N
t ittAAR AR
n (5)
where: ܰ is the number of FDI in our sample. Statistical significance of the means and their
differences are tested using t-test.

41
Appendix 2 – Research Method – Buy-and-Hold Abnormal Returns
To calculate BHAR involves firstly matching each one of our sample FDI firms to a non-
event (benchmark) firm based on both market value (MV) and market-to-book value (MBV)
for the year preceding the announcement. For each sample firm, we select a matched control
firm that does not undertake a FDI in the three years before the event firm. We manually
confirm that control firms have not undertaken a FDI during this time period by a search of
the firm’s annual reports and a news search in Lexis-Nexis. Drawing from this sample of non-
event firms, we filter those firms with MV between 70% and 130% of the sample firm. From
this group, we select the matched firm with the MBV closest to that of the sample firm.
The BHAR on security ݅ over the holding period IJ to T (we calculate this over both our
31-day event window and two-day event window) is the difference between the compounded
return on sample stock ݅ and the compounded return on a benchmark firm b.
( ) ( )τ τ τ=== + − +∏ ∏, ,
1 1T T
i T it btt tBHAR R R (6)
where: ܴ௧ is the compounded return on sample stock ݅ and ܴ௧ is the compounded return on
a benchmark firm b. Statistical significance of the means and their differences are tested
using t-test.

42
Figure 1 – Outward UK FDI in Emerging Markets
Source: UK Office for National Statistics
Note: The figure depicts the FDI flows in terms of millions pounds over time between 1996
and 2007.
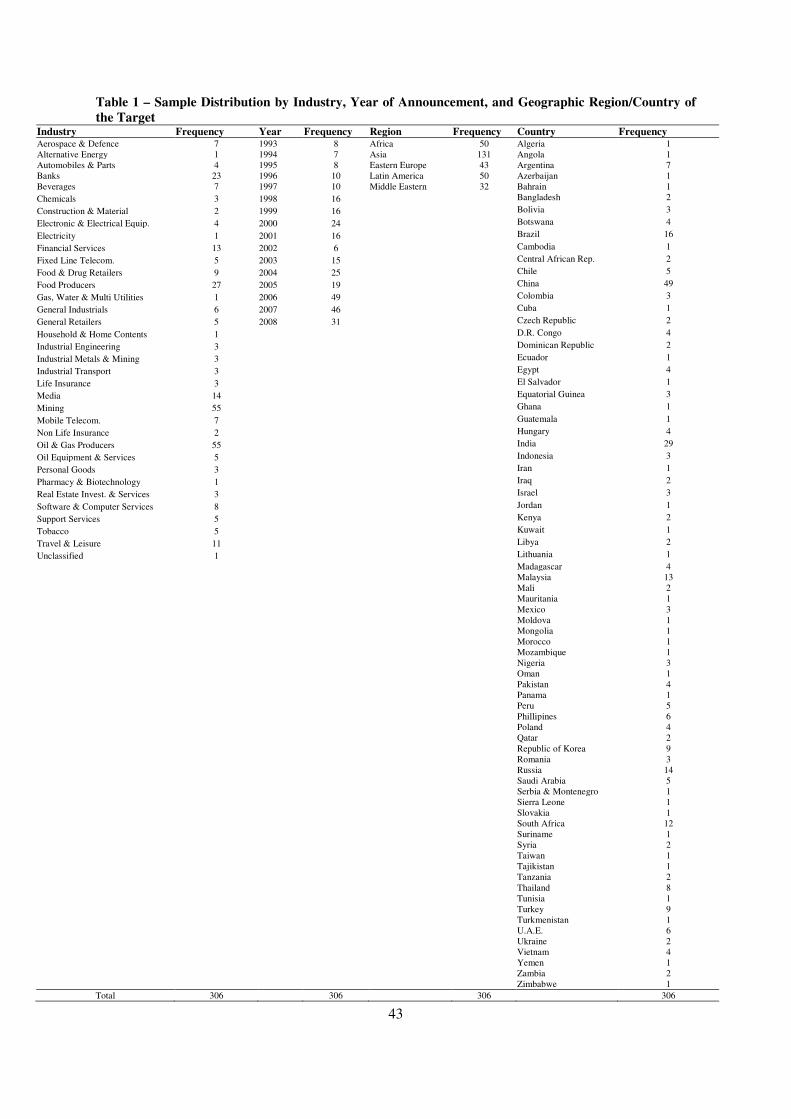
43
Table 1 – Sample Distribution by Industry, Year of Announcement, and Geographic Region/Country of
the Target
Industry Frequency Year Frequency Region Frequency Country Frequency Aerospace & Defence 7 1993 8 Africa 50 Algeria 1
Alternative Energy 1 1994 7 Asia 131 Angola 1
Automobiles & Parts 4 1995 8 Eastern Europe 43 Argentina 7
Banks 23 1996 10 Latin America 50 Azerbaijan 1
Beverages 7 1997 10 Middle Eastern 32 Bahrain 1
Chemicals 3 1998 16
Bangladesh 2
Construction & Material 2 1999 16
Bolivia 3
Electronic & Electrical Equip. 4 2000 24
Botswana 4
Electricity 1 2001 16
Brazil 16
Financial Services 13 2002 6
Cambodia 1
Fixed Line Telecom. 5 2003 15
Central African Rep. 2
Food & Drug Retailers 9 2004 25
Chile 5
Food Producers 27 2005 19
China 49
Gas, Water & Multi Utilities 1 2006 49
Colombia 3
General Industrials 6 2007 46
Cuba 1
General Retailers 5 2008 31
Czech Republic 2
Household & Home Contents 1
D.R. Congo 4
Industrial Engineering 3
Dominican Republic 2
Industrial Metals & Mining 3
Ecuador 1
Industrial Transport 3
Egypt 4
Life Insurance 3
El Salvador 1
Media 14
Equatorial Guinea 3
Mining 55
Ghana 1
Mobile Telecom. 7
Guatemala 1
Non Life Insurance 2
Hungary 4
Oil & Gas Producers 55
India 29
Oil Equipment & Services 5
Indonesia 3
Personal Goods 3
Iran 1
Pharmacy & Biotechnology 1
Iraq 2
Real Estate Invest. & Services 3
Israel 3
Software & Computer Services 8
Jordan 1
Support Services 5
Kenya 2
Tobacco 5
Kuwait 1
Travel & Leisure 11
Libya 2
Unclassified 1
Lithuania 1
Madagascar 4
Malaysia 13
Mali 2
Mauritania 1
Mexico 3
Moldova 1
Mongolia 1
Morocco 1
Mozambique 1
Nigeria 3
Oman 1
Pakistan 4
Panama 1
Peru 5
Phillipines 6
Poland 4
Qatar 2
Republic of Korea 9
Romania 3
Russia 14
Saudi Arabia 5
Serbia & Montenegro 1
Sierra Leone 1
Slovakia 1
South Africa 12
Suriname 1
Syria 2
Taiwan 1
Tajikistan 1
Tanzania 2
Thailand 8
Tunisia 1
Turkey 9
Turkmenistan 1
U.A.E. 6
Ukraine 2
Vietnam 4
Yemen 1
Zambia 2
Zimbabwe 1
Total 306
306
306 306

44
Table 2 – Summary Statistics of Control Variables
Variable N Mean Median Std. Dev.
Political Stability 75 -0.38 -0.32 0.75
Corruption 75 -0.27 -0.33 0.71
K&SI 75 3.13 3.39 1.10
FCF 304 0.04 0.08 0.21
Tobin's q 304 2.39 1.19 11.25
MV (£m) 306 14,026.42 2,254.55 26,618.36
Note: Political Stability (Political Stability and Absence of Violence) is measured using the
index published by The Worldwide Governance Indicators (WGI) (The World Bank Group).
Political stability and absence of violence measures perceptions of the likelihood that the
government will be destabilized or overthrown by unconstitutional or violent means,
including politically-motivated violence and terrorism. The index of Political Stability ranges
from approximately -2.5 (weak) to 2.5 (strong), i.e., low index represents higher political
risk. Corruption (Control of corruption) is measured using the index published by The
Worldwide Governance Indicators (WGI) (The World Bank Group). Control of corruption
captures perceptions of the extent to which public power is exercised for private gain,
including both petty and grand forms of corruption, as well as ‘capture’ of the state by elites
and private interests. The index of Control of corruption ranges from approximately -2.5
(weak) to 2.5 (strong), i.e., low index represents higher corruption. K&SI refers to the
cultural distance from the UK using the equation proposed by Kogut and Singh (1988). FCF
is defined as earnings before interest, taxes and depreciation (EBITDA) less capital
expenditures, or net operating cash flow, divided by total assets for the year preceding the
announcement. Tobin’s q is the ratio of the market value of the firm’s securities to its book
value for the year preceding the announcement. MV is the market capitalization of the firm
on the event day. N refers to the number of observation in each group.

45
Table 3 - Announcement Period Returns of Acquirers According to the Mode of Entry
and Geographic Region of Host Country
CAR t-stat % positive N
Full sample 1.57a 5.47 64% 306
By Individual Type of Deal
Agreements and alliances 0.74c 1.74 56% 45
IJVs 1.74a 3.94 64% 145
Partial acquisitions 1.17b 2.00 67% 63
Total acquisitions 2.30a 2.81 66% 53
By Groupings of Type of Deal
Acquisitions 1.69a 3.44 66% 116
IJVs and agreements and alliances 1.50a 4.24 62% 190
Partial ownership 1.57a 4.42 65% 208
By Region
Africa 2.95a 3.11 60% 50
Asia 0.79a 2.73 65% 131
Eastern Europe 2.59a 3.77 72% 43
Latin America 2.53a 2.84 66% 50
Middle East -0.22 -0.23 50% 32
Note: Two-day CAR (t-1, t=0) on announcements of FDI for subsamples according to entry
mode and geographic region of the host country are presented. Partial ownership refers to
joint ventures and partial acquisitions. c,
b,
a represent significance levels at 10%, 5% and 1%
respectively.

46
Table 4 - Announcement Period Returns of Acquirers: Univarite Analysis
All Low Medium High HML t-stat
Panel A: Political Risk
mean 1.57a 0.38 2.10
a 2.31
a 1.93
a (2.79)
t-stat (5.47) (1.10) (4.10) (3.79)
N 306 109 86 105
Panel B: Corruption
mean 1.57a 0.71
c 1.52
a 2.49
a 1.78
a (2.60)
t-stat (5.47) (1.75) (2.96) (4.52)
N 306 102 103 101
Panel B: K&SI
mean 0.96a 1.17
a 0.18 1.73
a 0.56 (0.81)
t-stat (3.62) (2.94) (0.46) (3.00)
N 239 75 92 72
Note: The table presents the univariate mean differences between two-day CAR (t-1, t=0) for
subsamples of the overall sample. Political Stability (Political Stability and Absence of
Violence) is measured using the index published by The Worldwide Governance Indicators
(WGI) (The World Bank Group). Political stability and absence of violence measures
perceptions of the likelihood that the government will be destabilized or overthrown by
unconstitutional or violent means, including politically-motivated violence and terrorism. The
index of Political Stability ranges from approximately -2.5 (weak) to 2.5 (strong), i.e., low
index represents higher political risk. Corruption (Control of corruption) is measured using
the index published by The Worldwide Governance Indicators (WGI) (The World Bank
Group). Control of corruption captures perceptions of the extent to which public power is
exercised for private gain, including both petty and grand forms of corruption, as well as
‘capture’ of the state by elites and private interests. The index of Control of corruption ranges
from approximately -2.5 (weak) to 2.5 (strong), i.e., low index represents higher corruption.
K&SI refers to the cultural distance from the UK using the equation proposed by Kogut and
Singh (1988). c,
b,
a represent significance levels at 10%, 5% and 1% respectively.

47
Table 5 - Announcement Period Returns of Acquirers: Univarite Analysis
Non-Physical
assets
Physical
assets
Physical vs.
Non-Physical
Panel A: All Deals
All deals
mean 0.66b 2.26a 1.60a
t-stat (2.01) (5.22) (2.95)
N 131 175
Panel B: Political Risk
Low
mean 0.05 0.66 0.61
t-stat (0.09) (1.36) (0.89)
N 50 59
Medium
mean 0.83c 3.02a 2.19b
t-stat (1.98) (3.74) (2.41)
N 36 50
High
mean 1.24c 3.07a 1.83c
t-stat (1.71) (3.42) (1.79)
N 44 61
HML mean 1.19 2.41b
t-stat (1.40) (2.37)
Panel C: Corruption
Low
mean -0.08 1.45b 1.53c
t-stat (-0.16) (2.35) (1.91)
N 49 53
Medium
mean 1.26c 1.70b 0.44
t-stat (1.93) (2.28) (0.45)
N 42 61
High
mean 0.93c 3.52a 2.59a
t-stat (1.76) (4.28) (2.64)
N 40 61
HML mean 1.01 2.07b
t-stat (1.38) (2.02)
Panel D: Cultural distance
Low
mean 0.65b 1.55b 0.90
t-stat (2.36) (2.36) (1.26)
N 32 43
Medium
mean -0.28 0.61 0.89
t-stat (-0.50) (1.11) (1.13)
N 44 48
High
mean 1.97b 1.53b -0.44
t-stat (2.08) (2.15) (-0.38)
N 32 40
HML mean 1.32 -0.02
t-stat (1.34) (-0.02)
Note: The table presents the univariate mean differences between two-day CAR (t-1, t=0) for subsamples of the
overall sample. Political Stability (Political Stability and Absence of Violence) is measured using the index
published by The Worldwide Governance Indicators (WGI) (The World Bank Group). Political stability and
absence of violence measures perceptions of the likelihood that the government will be destabilized or
overthrown by unconstitutional or violent means, including politically-motivated violence and terrorism. The
index of Political Stability ranges from approximately -2.5 (weak) to 2.5 (strong), i.e., low index represents
higher political risk. Corruption (Control of corruption) is measured using the index published by The
Worldwide Governance Indicators (WGI) (The World Bank Group). Control of corruption captures perceptions
of the extent to which public power is exercised for private gain, including both petty and grand forms of
corruption, as well as ‘capture’ of the state by elites and private interests. The index of Control of corruption
ranges from approximately -2.5 (weak) to 2.5 (strong), i.e., low index represents higher corruption. K&SI refers
to the cultural distance from the UK using the equation proposed by Kogut and Singh (1988). Physical Asset
refers to an investment which involves the acquisition of tangible assets; non-physical asset refers to an
investment which does not involve the acquisition of tangible assets such as a distribution agreement. c,
b,
a
represent significance levels at 10%, 5% and 1% respectively.

48
Table 6 - Determinants of Announcement Period Returns of Acquirers: A Cross Sectional Analysis Variable Model 1 Model 2 Model 3 Model 4 Model 5 Model 6
Intercept 0.044a 0.085a 0.033b 0.040a 0.049a 0.036a
(4.22) (3.64) (2.47) (3.68) (4.32) (3.16)
FCF -0.019c -0.020c -0.016 -0.018 -0.014 -0.006
(-1.71) (-1.69) (-1.33) (-1.53) (-0.52) (-0.23)
Tobin's q -0.001 -0.001 -0.001 -0.001 -0.001 -0.001
(-1.44) (-1.47) (-1.43) (-1.40) (-1.33) (-1.34)
D/E -0.001 -0.001 -0.001b -0.001 0.001 0.001
(-1.03) (-1.27) (-2.07) (-0.01) (0.15) (0.27)
Log (MV) -0.005a -0.005a -0.003a -0.005a -0.004a -0.005a
(-4.55) (-4.47) (-3.00) (-4.55) (-3.28) (-3.54)
IJVs 0.005 0.006 0.006 0.004 0.005 0.002
(0.75) (0.87) (0.95) (0.57) (0.70) (0.29)
Partial acquisitions 0.008 0.009 0.017b 0.008 0.007 0.006
(1.00) (1.12) (2.03) (1.08) (0.90) (0.77)
Total acquisitions 0.015c 0.016c 0.015b 0.013 0.021b 0.019b
(1.78) (1.88) (2.18) (1.43) (2.18) (2.05)
Corruption -0.009b
(-2.26)
Political Risk
-0.058c
(-1.78)
Cultural Distance
-0.002
(-1.01)
Asset Type Dummy (Tangible Asset)
0.013b
(2.43)
Market Seeking Dummy
-0.016a
(-3.57)
Resource × Physical Assets
0.023a
(3.74)
Resource × Non-physical Assets 0.003
(0.27)
Market × Non-physical Assets 0.002
(0.41)
Adjusted R-Square (in %) 10.17 10.12 5.12 10.11 10.44 11.55
F Statistic 5.29a 5.18a 2.60a 5.26a 5.21a 4.77a
N 304 298 238 304 290 290
Note: OLS regression estimates of the coefficients in cross-sectional regressions which relate to the two-day window (t-1,
t=0) CAR for UK firms at the announcement of FDI on Free Cash Flow (FCF), Tobin’s q, debt-to-equity (D/E), log of
market value of the firm (Log (MV)), corruption, political risk (PR), cultural distance (K&SI), asset type, resource/market
seeking strategy and combinations of resource/market seeking strategy with asset type. FCF is defined as earnings before
interest, taxes and depreciation (EBITDA) less capital expenditures, or net operating cash flow, divided by total assets for
the year preceding the announcement. Tobin’s q is a variable for the ratio of the market value of the firm’s securities to its
replacement cost. D/E is the ratio of debt to common equity for the year preceding the announcement. Log of MV is the log
of the firm’s market capitalization on the event day. Market seeking dummy is a dummy variable which takes the binary
code 1 if the investment involves a market strategy and the code 0 if it involves a resource strategy. Political Stability
(Political Stability and Absence of Violence) is measured using the index published by The Worldwide Governance
Indicators (WGI) (The World Bank Group). Political stability and absence of violence measures perceptions of the
likelihood that the government will be destabilized or overthrown by unconstitutional or violent means, including politically-
motivated violence and terrorism. The index of Political Stability ranges from approximately -2.5 (weak) to 2.5 (strong), i.e.,
low index represents higher political risk. Corruption (Control of corruption) is measured using the index published by The
Worldwide Governance Indicators (WGI) (The World Bank Group). Control of corruption captures perceptions of the extent
to which public power is exercised for private gain, including both petty and grand forms of corruption, as well as ‘capture’
of the state by elites and private interests. The index of Control of corruption ranges from approximately -2.5 (weak) to 2.5
(strong), i.e., low index represents higher corruption. K&SI refers to the cultural distance from the UK using the equation
proposed by Kogut and Singh (1988). Asset type is a dummy variable which takes the binary code 0 if the asset investment
involves intangibles, and 1 if it involves investment in tangible assets. The interaction variables of resource/market strategy
with asset type are dummy variables which take the value 1 if the situation described in the variable is the case and 0
otherwise. Standard errors are corrected for heteroscedasticity by using White’s (1980) heteroscedasticity consistent standard
errors method. c, b, a represent significance levels at 10%, 5% and 1% respectively.

49
Table 7 - Determinants of Announcement Period Returns of Acquirers: A Cross Sectional Analysis
Variable Model 1 Model 2 Model 3 Model 4
Model 5
Corruption
Model 6
Pol. Risk
Model 7
K&SI
Intercept 0.047a 0.082a 0.038a 0.045a 0.040a 0.053a 0.029b
(4.18) (3.39) (2.88) (3.85) (3.38) (4.31) (2.52)
FCF -0.017 -0.016 0.009 -0.015 -0.015 -0.015 0.009
(-0.61) (-0.60) (0.38) (-0.55) (-0.55) (-0.57) (0.40)
Tobin's q -0.001 -0.001 -0.001 -0.001 -0.001c -0.001 -0.001
(-1.43) (-1.46) (-1.50) (-1.40) (-1.68) (-1.55) (-1.57)
D/E 0.001 0.001 -0.001 0.001 0.001 -0.001 -0.001
(0.16) (0.01) (-0.53) (0.57) (0.09) (-0.13) (-0.77)
Log (MV) -0.004a -0.004a -0.003a -0.004a -0.004a -0.004a -0.003a
(-3.23) (-3.24) (-2.76) (-3.33) (-3.06) (-3.30) (-2.64)
IJVs 0.003 0.003 0.003 0.002 0.004 0.002 0.003
(0.50) (0.49) (0.51) (0.38) (0.59) (0.24) (0.53)
Partial acquisitions 0.005 0.006 0.015c 0.006 0.007 0.006 0.013
(0.67) (0.75) (1.79) (0.78) (0.93) (0.85) (1.58)
Total acquisitions 0.018c 0.019b 0.016b 0.017c 0.020b 0.017b 0.015b
(1.87) (2.10) (2.41) (1.83) (2.21) (1.82) (2.11)
Market Seeking Dummy -0.015a -0.014a -0.012a -0.014a -0.012a -0.012b -0.013a
(-3.19) (-3.07) (-2.67) (-2.93) (-2.73) (-2.39) (-2.74)
Corruption -0.007c
(-1.82)
Political Risk
-0.049c
(-1.72)
Cultural Distance
-0.001
(-0.40)
Asset Type (Physical Asset)
0.009c
(1.72)
Physical Assets × High IB
0.025a 0.008 0.008
(3.11) (0.90) (1.02)
Physical Assets × Low IB
0.002 -0.011 0.013c
(0.23) (-1.58) (1.74)
Non-physical Assets × High
IB
-0.006 -0.004 0.019b
(-0.87) (-0.42) (2.38)
Non-physical Assets × Low
IB
0.007 -0.011 0.007
(0.84) (-1.35) (1.29)
Adjusted R- Square (in %) 10.95 11.05 6.31 10.74 13.15 11.21 7.92
F Statistic 4.95a 4.19a 2.69a 4.86a 4.65a 3.98a 2.62a
N 290 284 227 290 290 284 227
Note: OLS regression estimates of the coefficients in cross-sectional regressions which relate to the two-day window (t-1,
t=0) CAR for UK firms at the announcement of FDI on Free Cash Flow (FCF), Tobin’s q, debt-to-equity (D/E), log of
market value of the firm (Log (MV)), resource/market seeking strategy, corruption, political risk (PR), cultural distance
(K&SI), asset type, and combinations of asset type with our three international business (IB) variables (corruption, PR and
K&SI). FCF is defined as earnings before interest, taxes and depreciation (EBITDA) less capital expenditures, or net
operating cash flow, divided by total assets for the year preceding the announcement. Tobin’s q is a variable for the ratio of
the market value of the firm’s securities to its replacement cost. D/E is the ratio of debt to common equity for the year
preceding the announcement. Log of MV is the log of the firm’s market capitalization on the event day. Market seeking
dummy is a dummy variable which takes the binary code 1 if the investment involves a market strategy and the code 0 if it
involves a resource strategy. Political Stability (Political Stability and Absence of Violence) is measured using the index
published by The Worldwide Governance Indicators (WGI) (The World Bank Group). Political stability and absence of
violence measures perceptions of the likelihood that the government will be destabilized or overthrown by unconstitutional
or violent means, including politically-motivated violence and terrorism. The index of Political Stability ranges from
approximately -2.5 (weak) to 2.5 (strong), i.e., low index represents higher political risk. Corruption (Control of corruption)
is measured using the index published by The Worldwide Governance Indicators (WGI) (The World Bank Group). Control
of corruption captures perceptions of the extent to which public power is exercised for private gain, including both petty and
grand forms of corruption, as well as ‘capture’ of the state by elites and private interests. The index of Control of corruption
ranges from approximately -2.5 (weak) to 2.5 (strong), i.e., low index represents higher corruption. K&SI refers to the
cultural distance from the UK using the equation proposed by Kogut and Singh (1988). Asset type is a dummy variable
which takes the binary code 0 if the asset investment involves intangibles, and 1 if it involves investment in tangible assets.
The interaction variables of resource/market strategy with asset type are dummy variables which take the value 1 if the
situation described in the variable is the case and 0 otherwise. Standard errors are corrected for heteroscedasticity by using
White’s (1980) heteroscedasticity consistent standard errors method. c, b, a represent significance levels at 10%, 5% and 1%
respectively.

50
Table 8 - Determinants of Announcement Period Returns of Acquirers: A Cross Sectional Analysis
Variable
Model 1
Corruption
Model 2
Pol. Risk
Model 3
K&SI
Model 4
Corruption
Model 5
Pol. Risk
Model 6
K&SI
Intercept 0.028b 0.046a 0.018 0.025b 0.043a 0.018
(2.51) (3.77) (1.57) (2.25) (3.62) (1.56)
FCF -0.024 -0.021 0.006 -0.025 -0.023 0.006
(-0.92) (-0.80) (0.26) (-0.92) (-0.84) (0.27)
Tobin's q -0.001c -0.001c -0.001 -0.001c -0.001c -0.001
(-1.65) (-1.67) (-1.48) (-1.70) (-1.75) (-1.47)
D/E -0.001 -0.001 -0.001 0.001 -0.001 -0.001
(-0.55) (-0.86) (-1.20) (0.04) (-0.30) (-1.15)
Log (MV) -0.004a -0.004a -0.003b -0.004a -0.004a -0.002b
(-2.72) (-3.18) (-2.00) (-2.73) (-3.19) (-2.00)
IJVs 0.007 0.004 0.001 0.005 0.002 0.001
(1.05) (0.64) (0.04) (0.75) (0.24) (0.06)
Partial acquisitions 0.007 0.007 0.011 0.006 0.005 0.011
(0.94) (0.86) (1.39) (0.82) (0.66) (1.37)
Total acquisitions 0.023b 0.018b 0.012c 0.020b 0.014 0.012c
(2.45) (1.99) (1.79) (2.13) (1.58) (1.70)
Asset Type (Physical Asset)
0.008 0.009c -0.001
(1.58) (1.67) (-0.09)
Resource × High IB 0.030a 0.015c 0.021a 0.028a 0.014 0.029a
(3.76) (1.72) (2.65) (3.56) (1.58) (3.41)
Resource × Low IB 0.010 -0.016c 0.029a 0.009 -0.017c 0.021a
(1.07) (-1.68) (3.43) (1.03) (-1.83) (2.59)
Market × High IB -0.009c -0.012b 0.003 -0.008 -0.011b 0.002
(-1.67) (-2.28) (0.53) (-1.47) (-2.04) (0.36)
Market × Low IB 0.002 -0.013a 0.002 0.003 -0.012b 0.003
(0.50) (-2.66) (0.37) (0.69) (-2.49) (0.50)
Adjusted R- Square (in %) 12.78 12.15 9.92 13.07 12.63 9.50
F Statistic 4.85a 4.56a 3.26a 4.62a 4.41a 2.98a
N 290 284 227 290 284 227
Note: OLS regression estimates of the coefficients in cross-sectional regressions which relate to the two-day window (t-1,
t=0) CAR for UK firms at the announcement of FDI on Free Cash Flow (FCF), Tobin’s q, debt-to-equity (D/E), log of
market value of the firm (Log (MV)), asset type, and combinations of resource/market seeking strategy with our three
international business (IB) variables (corruption, PR and K&SI). FCF is defined as earnings before interest, taxes and
depreciation (EBITDA) less capital expenditures, or net operating cash flow, divided by total assets for the year preceding
the announcement. Tobin’s q is a variable for the ratio of the market value of the firm’s securities to its replacement cost.
D/E is the ratio of debt to common equity for the year preceding the announcement. Log of MV is the log of the firm’s
market capitalization on the event day. Market seeking dummy is a dummy variable which takes the binary code 1 if the
investment involves a market strategy and the code 0 if it involves a resource strategy. Political Stability (Political Stability
and Absence of Violence) is measured using the index published by The Worldwide Governance Indicators (WGI) (The
World Bank Group). Political stability and absence of violence measures perceptions of the likelihood that the government
will be destabilized or overthrown by unconstitutional or violent means, including politically-motivated violence and
terrorism. The index of Political Stability ranges from approximately -2.5 (weak) to 2.5 (strong), i.e., low index represents
higher political risk. Corruption (Control of corruption) is measured using the index published by The Worldwide
Governance Indicators (WGI) (The World Bank Group). Control of corruption captures perceptions of the extent to which
public power is exercised for private gain, including both petty and grand forms of corruption, as well as ‘capture’ of the
state by elites and private interests. The index of Control of corruption ranges from approximately -2.5 (weak) to 2.5
(strong), i.e., low index represents higher corruption. K&SI refers to the cultural distance from the UK using the equation
proposed by Kogut and Singh (1988). Asset type is a dummy variable which takes the binary code 0 if the asset investment
involves intangibles, and 1 if it involves investment in tangible assets. The interaction variables of resource/market strategy
with asset type are dummy variables which take the value 1 if the situation described in the variable is the case and 0
otherwise. Standard errors are corrected for heteroscedasticity by using White’s (1980) heteroscedasticity consistent standard
errors method. c, b, a represent significance levels at 10%, 5% and 1% respectively.