barc score data discovery - microstrategy...barc score data discovery – data preparation, visual...
TRANSCRIPT
BARC Score Data Discovery Data Preparation, Visual Analysis and Guided Advanced Analytics for Business Analysts
Authors: Larissa Seidler, Robert Tischler, Julia Henneberger
Publication: June 6th, 2017
Abstract
This BARC document is the first edition of our data discovery vendor evaluation using our proven ranking methodology, called BARC Score. This BARC Score evaluates data discovery tools that are able to support business users through all steps of the data discovery process.
Based on countless data points from The BI Survey, many analyst interactions and detailed test case demonstrations, vendors are rated on a variety of criteria, from product capabilities and architecture to sales and marketing strategy, financial performance and customer feedback.
This document is not to be shared, distributed or reproduced in any way without the prior permission of BARC
BARC Score Data Discovery – Data Preparation, Visual Analysis and Guided Advanced Analytics for Business Analysts 2
Table of Contents
BARC Score Data Discovery ....................................................................................................................1 Data Preparation, Visual Analysis and Guided Advanced Analytics for Business Analysts ......... 1
Overview ...................................................................................................................................................3 Inclusion Criteria .......................................................................................................................................4 Evaluation Criteria ....................................................................................................................................5
Portfolio Capabilities...................................................................................................................... 5 Market Execution ........................................................................................................................... 7
Score ........................................................................................................................................................9 Score Regions ............................................................................................................................. 10
Evaluated Products ............................................................................................................................... 11 Vendor Evaluations ............................................................................................................................... 11
Datameer ..................................................................................................................................... 12 Dundas ........................................................................................................................................ 13 IBM .............................................................................................................................................. 14 Microsoft ...................................................................................................................................... 15 MicroStrategy .............................................................................................................................. 16 Oracle .......................................................................................................................................... 17 Qlik .............................................................................................................................................. 18 SAP ............................................................................................................................................. 19 SAS ............................................................................................................................................. 20 Sisense ........................................................................................................................................ 21 Tableau ....................................................................................................................................... 22 TIBCO ......................................................................................................................................... 23 Yellowfin ...................................................................................................................................... 24
Other Vendors ....................................................................................................................................... 25 Related Research Documents .............................................................................................................. 30

BARC Score Data Discovery – Data Preparation, Visual Analysis and Guided Advanced Analytics for Business Analysts 3
Overview The market for software supporting data discovery, while already a significant portion of the BI market, is still emerging. Demand for tools allowing business users to efficiently analyze and explore data is continually increasing, leading to a fast-growing market. Vendors are reacting by trying to address the needs of the market. They are doing this by striving to improve the flexibility and ease of use of their suites, as well as by building a sound platform around isolated tools to provide enterprise readiness.
This report analyzes the strengths and challenges of the leading vendors that offer sophisticated and integrated data discovery features. With all the buzz around data discovery, the perception of the term has become inconsistent. To allow for a fair comparison of vendors and tools, BARC applies its own distinct definition of data discovery:
Data discovery is the business user driven and iterative process of discovering patterns and outliers in data.
Today’s data discovery offering not only has to encompass broad functionality, ranging from data preparation through visual analysis to guided advanced analytics (Figure 1). It also
has to be tightly integrated, user-friendly and supported by a robust platform (i.e. connectivity and security). These are the key issues enabling the increased adoption, use and usefulness of exploratory analysis in business departments. Data discovery software is a key element in today’s organizations’ information landscapes, enabling quick reaction to changing requirements driven by the market.
Figure 1: The three pillars of data discovery for business analysts
As data discovery is becoming increasingly relevant for a variety of businesses and departments, tools have to support a broad range of use cases. The field of application for data discovery tools lies somewhere between traditional self-service BI and highly complex data science and advanced analytics use cases. To enable business users to deliver trusted and high quality results on complex use cases in an efficient manner, data discovery tools must provide more than just excellent usability. The software also has to provide active user advice and guidance. With the increasing incorporation of Artificial Intelligence (AI), this “smart” aspect is becoming an integral part of more and more solutions in the market. BARC expects that AI will continue to increase the productivity of business analysts by allowing them to focus on value added work rather than repetitive tasks.
Despite its ability to provide end-to-end analytics (i.e. from source to results) in an independent and self-reliant manner, data discovery benefits from well-organized and integrated data sources and is not an alternative to them. Therefore, besides buying data discovery tools, organizations must have a proper BI and data strategy in place, defining how the enterprise-wide usage of data should be organized and specifying the role and goals for data discovery. It goes without saying that data discovery tools are also no substitute for the managed reporting of “classic” BI.
Data discovery has already become a crucial means for modern organizations to democratize the use of data and analytics throughout the organization. To align the efforts of different business departments, it is becoming increasingly important to select the proper tools for the desired architecture quickly but with a high level of certainty. This document will help to focus the selection process by evaluating the most commonly used product sets from major vendors.

BARC Score Data Discovery – Data Preparation, Visual Analysis and Guided Advanced Analytics for Business Analysts 4
Inclusion Criteria There are two separate sets of inclusion criteria for this BARC Score: the first is associated with the vendors’ products and the other is linked to their financial results and references. To be listed in this BARC Score, a vendor needs to have a strong focus on providing data discovery functionality in three functional areas in a tightly integrated manner:
• Data preparation
• Visual analysis
• Guided advanced analytics
In addition, the vendor must generate revenues of at least 10 million EUR, spread across at least two separate geographies. We consider the following as individual geographic regions:
• Europe, Middle East and Africa
• North America
• Latin America
• Asia/Pacific
BARC Score Data Discovery – Data Preparation, Visual Analysis and Guided Advanced Analytics for Business Analysts 5
Evaluation Criteria Every vendor is evaluated on two dimensions: portfolio capabilities and market execution. Each dimension represents one axis on the BARC Score and takes into account the following sub-criteria.
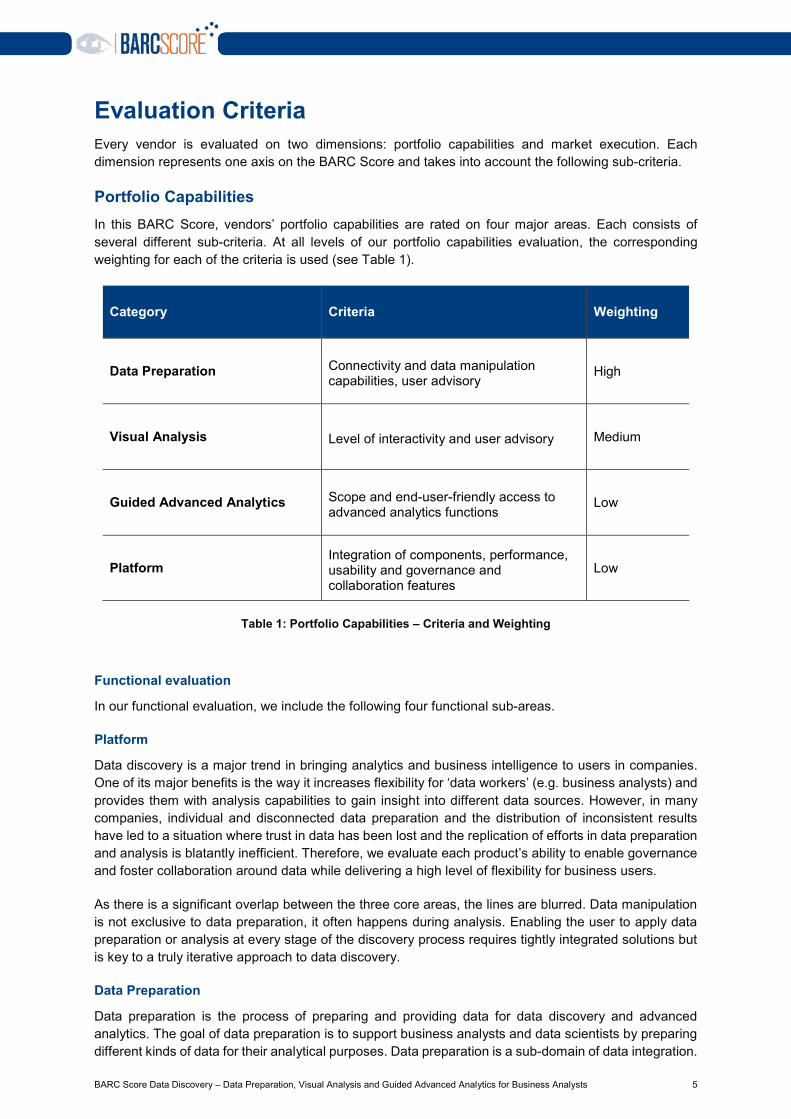
Portfolio Capabilities In this BARC Score, vendors’ portfolio capabilities are rated on four major areas. Each consists of several different sub-criteria. At all levels of our portfolio capabilities evaluation, the corresponding weighting for each of the criteria is used (see Table 1).
Category Criteria Weighting
Data Preparation Connectivity and data manipulation capabilities, user advisory
High
Visual Analysis Level of interactivity and user advisory Medium
Guided Advanced Analytics Scope and end-user-friendly access to advanced analytics functions
Low
Platform Integration of components, performance, usability and governance and collaboration features
Low
Table 1: Portfolio Capabilities – Criteria and Weighting
Functional evaluation
In our functional evaluation, we include the following four functional sub-areas.
Platform
Data discovery is a major trend in bringing analytics and business intelligence to users in companies. One of its major benefits is the way it increases flexibility for ‘data workers’ (e.g. business analysts) and provides them with analysis capabilities to gain insight into different data sources. However, in many companies, individual and disconnected data preparation and the distribution of inconsistent results have led to a situation where trust in data has been lost and the replication of efforts in data preparation and analysis is blatantly inefficient. Therefore, we evaluate each product’s ability to enable governance and foster collaboration around data while delivering a high level of flexibility for business users.
As there is a significant overlap between the three core areas, the lines are blurred. Data manipulation is not exclusive to data preparation, it often happens during analysis. Enabling the user to apply data preparation or analysis at every stage of the discovery process requires tightly integrated solutions but is key to a truly iterative approach to data discovery.
Data Preparation
Data preparation is the process of preparing and providing data for data discovery and advanced analytics. The goal of data preparation is to support business analysts and data scientists by preparing different kinds of data for their analytical purposes. Data preparation is a sub-domain of data integration.

BARC Score Data Discovery – Data Preparation, Visual Analysis and Guided Advanced Analytics for Business Analysts 6
The data preparation capabilities of all the vendors included in this report deliver a higher level of integration with analysis functions than most purpose-built data preparation tools.
While the preparation of data can generally take place either in business departments or be performed centrally by IT, for this BARC Score we focus on the needs of business users. Ease-of-use for business users and guidance throughout the process of profiling and preparing data is rated along with the core functionalities around connectivity, connection options and data manipulation functions.
Highly structured sources like data warehouses still play an important role in many data discovery use cases. The need to quickly access external, unstructured or cloud source data is rising, so we look for connectivity way beyond traditional, structured sources.
Visual Analysis
Interactive visualizations allow users to quickly scan significant amounts of data for patterns or to understand the meaning of a dataset at hand. Diverse types of analysis require different visual representations. Therefore, we rate how well tools are able to perform common analysis and how well the visualizations help to gain insight in data. The recommendation of suitable visualizations to users (user advisory) is currently on the rise and helps business users to focus on the analysis itself, while the software takes care of repetitive tasks.
To enable quick and thorough investigation of data, it is important that data drives the visualization and not the other way around as is typically seen in dashboard-oriented solutions. In traditional BI solutions, visualizations are used as a medium to communicate data, but data discovery uses the interactive graphical representation of data to facilitate its understanding by making use of the human ability to detect patterns.
Natural language processing and natural language querying are becoming increasingly important. Many vendors have already implemented or adopted dedicated functionality.
Guided Advanced Analytics
Advanced analytics (or data mining) represents non-directed, hypothesis-free data analysis. Statistical algorithms are used to scan data sets searching for patterns used for segmentation, classification or association of data. These methods cover statistical data analysis, neural networks, decision trees, time series and many other algorithms.
Guided advanced analytics describes the business user friendly provision of the aforementioned advanced analytics functions. Simple parameterization of predefined and robust algorithms without the need to write code are amongst the most important aspects to putting advanced analytics capabilities in the hands of business users. User advisory leveraging AI can power automated discovery capabilities, finally putting the “smart” into data discovery.
Criteria Weighting
We don’t consider all categories and subcategories to be equally important in this Score. Our weightings are based on BARC’s own view of current user focus and buying patterns.
BARC Score Data Discovery – Data Preparation, Visual Analysis and Guided Advanced Analytics for Business Analysts 7
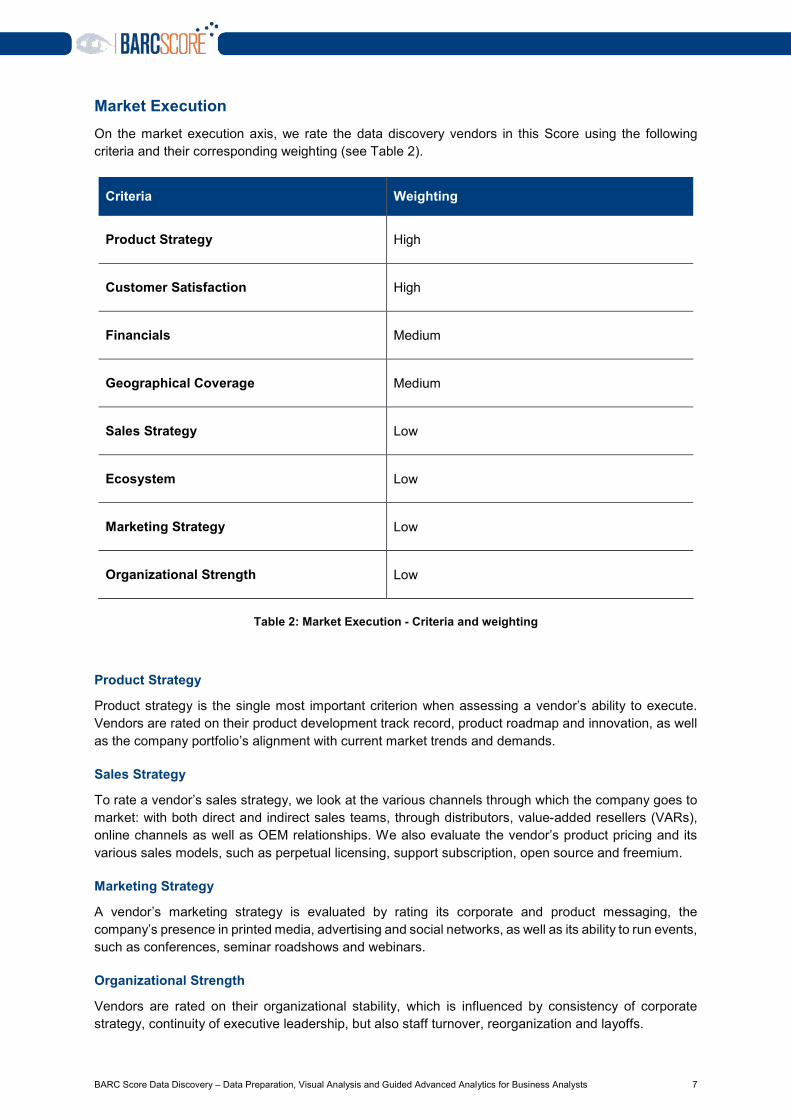
Market Execution On the market execution axis, we rate the data discovery vendors in this Score using the following criteria and their corresponding weighting (see Table 2).
Criteria Weighting
Product Strategy High
Customer Satisfaction High
Financials Medium
Geographical Coverage Medium
Sales Strategy Low
Ecosystem Low
Marketing Strategy Low
Organizational Strength Low
Table 2: Market Execution - Criteria and weighting
Product Strategy
Product strategy is the single most important criterion when assessing a vendor’s ability to execute. Vendors are rated on their product development track record, product roadmap and innovation, as well as the company portfolio’s alignment with current market trends and demands.
Sales Strategy
To rate a vendor’s sales strategy, we look at the various channels through which the company goes to market: with both direct and indirect sales teams, through distributors, value-added resellers (VARs), online channels as well as OEM relationships. We also evaluate the vendor’s product pricing and its various sales models, such as perpetual licensing, support subscription, open source and freemium.
Marketing Strategy
A vendor’s marketing strategy is evaluated by rating its corporate and product messaging, the company’s presence in printed media, advertising and social networks, as well as its ability to run events, such as conferences, seminar roadshows and webinars.
Organizational Strength
Vendors are rated on their organizational stability, which is influenced by consistency of corporate strategy, continuity of executive leadership, but also staff turnover, reorganization and layoffs.

BARC Score Data Discovery – Data Preparation, Visual Analysis and Guided Advanced Analytics for Business Analysts 8
Financial Strength
This criterion covers the financial position of the vendor, from market capitalization, cash position and EBITDA to profitability, burn rate and investment rounds. For vendors that are private companies or don’t break out the numbers for individual product lines, estimated figures are used.
Geographical Coverage
Vendors are evaluated on their global presence. We look at the various geographic regions and major countries in which the company conducts business with both a sales and marketing presence as well as development and support functions.
Ecosystem
In this category, we evaluate the extended ecosystem in which the vendor participates. This includes business partner networks, hardware or cloud infrastructure providers, consulting firms and systems integrators, and other technology alliances.
Customer Satisfaction
In this BARC Score we included the ‘Customer Satisfaction’ KPI from BARC’s The BI Survey. This combined metric comprises product satisfaction, vendor support and implementer support ratings reported by customers.
BARC Score Data Discovery – Data Preparation, Visual Analysis and Guided Advanced Analytics for Business Analysts 9
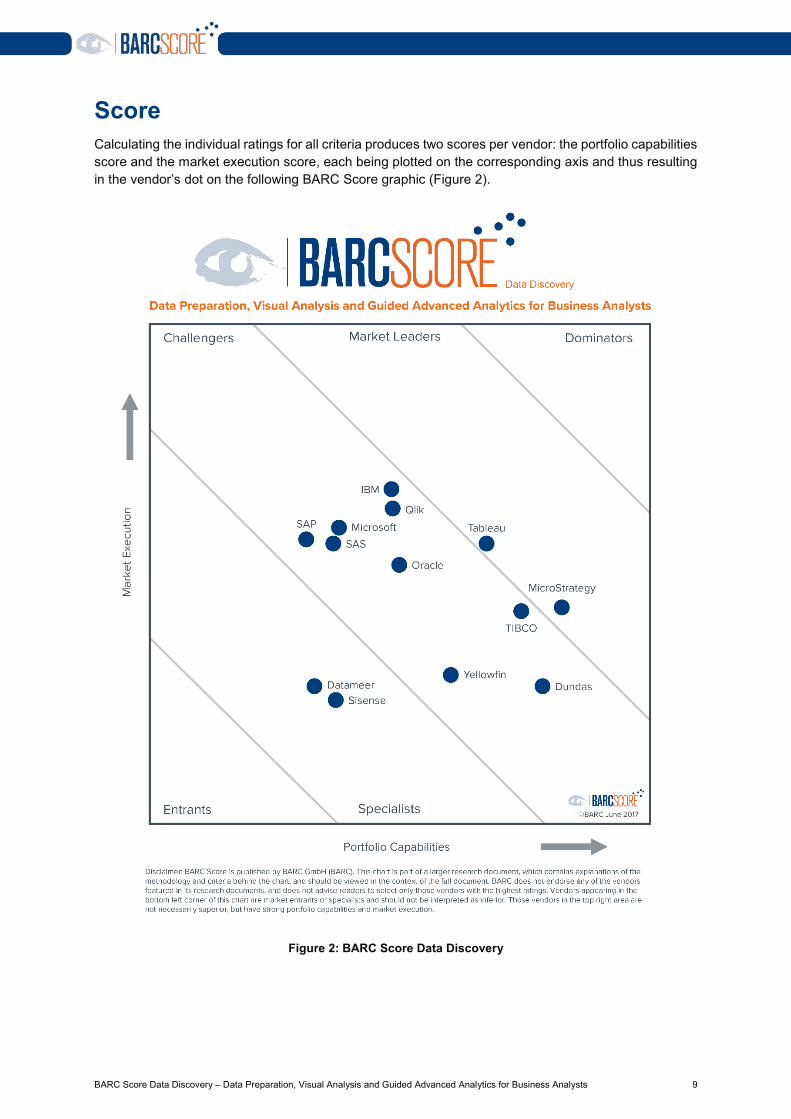
Score Calculating the individual ratings for all criteria produces two scores per vendor: the portfolio capabilities score and the market execution score, each being plotted on the corresponding axis and thus resulting in the vendor’s dot on the following BARC Score graphic (Figure 2).
Figure 2: BARC Score Data Discovery
BARC Score Data Discovery – Data Preparation, Visual Analysis and Guided Advanced Analytics for Business Analysts 10
Score Regions Vendors can be positioned in one of five regions, depending on their total score on each of the two axes.
Dominators
Dominators are vendors that drive both technology and market adoption in a highly influential manner. They possess both a broad portfolio of market-leading and dominating products with a strong brand as well as a robust commercial prowess through best-in-class sales and marketing programs, an extensive ecosystem of business partners and alliances, and a rock-solid financial position. Dominators are considered a contender in virtually every planned implementation.
Market Leaders
Market Leaders are well established vendors that drive strong market adoption, supported by technology innovation and strategic acquisitions and by leveraging robust account management and a solid track record. Their portfolio enjoys high brand awareness in the market and covers an extensive range of technologies and services with only few gaps. Market Leaders typically have a large market share, making them a viable contender in almost all implementation scenarios.
Challengers
Challengers come in various shapes and sizes. They can be large vendors tapping into a new market by acquisition and pushing their way in with force, small innovative companies with a promising portfolio but limited sales and marketing resources, or vendors that attempt to disrupt the market with innovative technology approaches or distinct business models.
Specialists
Specialists are smaller vendors with a portfolio focused on a specific market segment. Vendors can be either limited in their technical capabilities by concentrating on certain features and functions, or the company isn’t a global enterprise and focuses on select geographic regions.
Entrants
Entrants are usually startups that have limited reach and visibility in the market. Their product capabilities are incomplete when compared to competitors, and the vendor’s long-term market potential is still unproven.
BARC Score Data Discovery – Data Preparation, Visual Analysis and Guided Advanced Analytics for Business Analysts 11
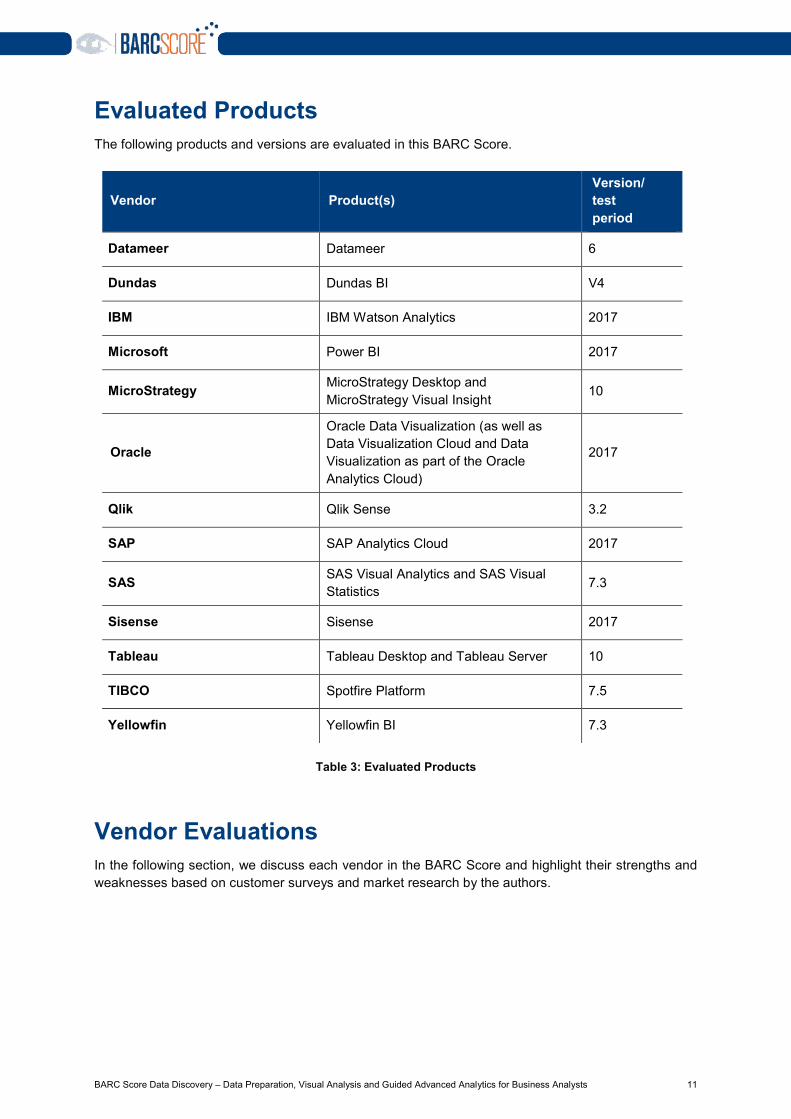
Evaluated Products The following products and versions are evaluated in this BARC Score.
Vendor Product(s) Version/ test period
Datameer Datameer 6
Dundas Dundas BI V4
IBM IBM Watson Analytics 2017
Microsoft Power BI 2017
MicroStrategy MicroStrategy Desktop and MicroStrategy Visual Insight
10
Oracle
Oracle Data Visualization (as well as Data Visualization Cloud and Data Visualization as part of the Oracle Analytics Cloud)
2017
Qlik Qlik Sense 3.2
SAP SAP Analytics Cloud 2017
SAS SAS Visual Analytics and SAS Visual Statistics 7.3
Sisense Sisense 2017
Tableau Tableau Desktop and Tableau Server 10
TIBCO Spotfire Platform 7.5
Yellowfin Yellowfin BI 7.3
Table 3: Evaluated Products
Vendor Evaluations In the following section, we discuss each vendor in the BARC Score and highlight their strengths and weaknesses based on customer surveys and market research by the authors.
BARC Score Data Discovery – Data Preparation, Visual Analysis and Guided Advanced Analytics for Business Analysts 12
Datameer San Francisco, CA, USA
www.datameer.com
Datameer was incorporated in 2009 with the clear mission to make big data analytics easy for everyone. The company released a self-service big data analytics tool based on Hadoop and mainly targeted at large companies that require business departments to prepare and analyze high volumes of structured and unstructured data. This focus often results in Datameer extending existing BI suites or visualization tools to provide sophisticated big data analytics functionality.
Datameer offers mature and feature-rich data preparation capabilities allowing tech-savvy users to successfully access and utilize numerous complex data sources of any type. Preparation and analytics are both done in a spreadsheet-like environment, using dedicated formulas ranging from data cleansing functions to advanced analytics functionality. Because data visualization is not done directly in the same environment as data preparation, there is a potential slowdown on the iterative process of analyzing and refining to get the best out of available corporate data assets. However, Datameer has removed workflow barriers existing in most pure data preparation tools by offering the possibility to work on visualizations and data preparation within the same tool.
Datameer offers a broad scope of built-in advanced analytics functions allowing users to analyze data unsuitable for visual analysis approaches due to the sheer amount or the complexity of data structures. Compared to other big data analytics solutions, Datameer is easy to use. When compared to general purpose solutions for data discovery and business user friendly data preparation, ease of use is not as strong due to the more formula-based, less guided and visual approach. Datameer’s Infographics capability offers some interactive visualizations and supports the D3 library. However, the solution currently does not focus on iterative visual analysis. The vendor partners with vendors such as Tableau and Microsoft for this purpose.
Datameer’s clear focus on big data discovery with a greater emphasis on scalability than usability results in a lower than average rating. User advisory and guidance throughout the data discovery process will appeal to more casual business users and enhance Datameer’s scoring on the product capabilities axis.
Strengths
• Connectivity options for big data sources including complex data types
• Ability to handle very large data volumes and native integration with Hadoop
• Text mining functionality built in
• Broad statistical and advanced analytics functionality
Weaknesses
• Moderate usability during data preparation (e.g. having to use and type functions instead of leveraging context sensitive menus)
• Separate screens for data preparation and data visualization
• Application of advanced analytics functions is geared towards tech-savvy users and lacks a guided user experience

BARC Score Data Discovery – Data Preparation, Visual Analysis and Guided Advanced Analytics for Business Analysts 13
Dundas Toronto, ON, Canada
www.dundas.com
Founded in 1992, Dundas began building its reputation as an innovator in visualization software with its Chart product based on Microsoft technology. In 2007, Dundas sold its Chart franchise to Microsoft to embark on the expanded mission of building a dashboard product, which was launched in 2009. Further expanding its mission, Dundas released Dundas BI in 2014, a full-featured and modern BI platform that launched the vendor into the market for all-in-one BI platforms.
Today, the Dundas BI Platform enables users to discover insights and create dashboards with distinctively intuitive and clean interfaces. With Dundas BI Platform, the company is gaining momentum with customers who are eager to deliver self-service analytics and data discovery that are equally attractive on desktops, tablets and smart phones, often embedded into other applications. Dundas BI offers a broad set of data connectors as well as sophisticated features for live and cached data access, making it attractive for numerous data discovery and analytics use cases.
In Dundas BI the steps for data preparation and visualization are tightly integrated, making it feasible to iteratively analyze and enhance data to gain as much insight as possible. Visualizations are automatically created upon adding data to the canvas. Users can even automatically change visualization types when additional data is being added to a data visualization. Calculations and set analyses can be created quickly and directly from within visualizations.
Advanced analytics with guidance and user advisory for business analysts is the only area where Dundas BI scores lower than competing data discovery vendors.
Strengths
• Good and easy-to-use data preparation solution with broad functionality
• Easy deployment through fully browser-based functionality with a uniform user experience throughout all discovery process steps
• Clean and intuitive modern interfaces enabling efficient discovery workflows
• Common and optional semantic model is available and can be easily extended for flexible discovery
Weaknesses
• Advanced analytics functions mostly available through integrated external libraries
• Dundas is a rather small vendor with limited geographical presence and a restricted partner network
• Market attention for Dundas BI as a viable data discovery product is quite low
BARC Score Data Discovery – Data Preparation, Visual Analysis and Guided Advanced Analytics for Business Analysts 14
IBM Armonk, NY, USA
www.ibm.com
As one of the world’s largest vendors of IT hardware, software and services, IBM has a comprehensive portfolio of business intelligence and analytics solutions including offerings for data discovery. For this BARC Score, we evaluated IBM Watson Analytics.
Watson Analytics is a cloud-based product focused on NLP-assisted, search-oriented visual analysis and guided advanced analytics. The solution is targeted towards business users and offers self-service data preparation and user advisory through encapsulated cognitive capabilities. With Watson Analytics, IBM aims to make analytics available to a broad audience by using “smarts” to automate behind the scenes and guide the user through preparing and analyzing data. The solution simplifies analysis and the generation of visualizations by applying natural language queries. Based on these questions, interactive visualizations are created and can be adjusted and assembled as dashboards or storybooks.
Watson Analytics not only tries to answer the questions the user raises, but also identifies potentially relevant findings around the current analysis in its “Discoveries panel”, pointing at patterns and outliers to enable users to quickly answer their business questions.
Guided advanced analytics is made available via simple to apply but feature-rich on-click predictive modeling powered by machine learning. Drivers for measures can quickly be identified without requiring users to write code or select and parameterize the desired algorithms.
Strengths
• “Cognitive” capabilities used throughout the solution to simplify usage (e.g. for automated discovery)
• Natural language queries as a quick way to explore data, with the search results providing users with recommended starting points
• Guidance throughout the solutions (e.g. data profiling, data quality indicator, additional starting points for analysis on the “Discoveries panel”)
• “One-click predictive modeling” in Watson Analytics automatically generates a model by running a series of algorithms against the data and ranking the results
Weaknesses
• Data has to be loaded to cloud for analysis (causes problems with e.g. latency)
• Limited integration with other IBM analytics products (e.g. IBM Cognos, Planning Analytics)
• No integration for external statistical libraries (e.g. R) offered
• Lower adoption of Watson Analytics (besides the free version) compared to competing products, although Watson Analytics has been on the market for a shorter time
BARC Score Data Discovery – Data Preparation, Visual Analysis and Guided Advanced Analytics for Business Analysts 15
Microsoft Redmond, WA, USA
www.microsoft.com
Microsoft, the world’s largest software company, was founded in 1975 and has become a household name primarily due to its Windows operating system and Office suite. The vendor also offers its own database management system, collaboration tools, servers and the Dynamics ERP and CRM solutions. In recent years Microsoft has spread its BI capabilities across the Office, SharePoint and SQL Server product lines.
Recently Microsoft focused its data discovery and analytics efforts on the Power BI product line, which is evaluated in this BARC Score. It is a cloud-based analytics product consisting of Microsoft Power BI Desktop (a full client for ad hoc reporting, dashboards and analysis) and Power BI Service (a Web client for publishing and sharing content). Power BI is currently only generally available as a cloud service. A pure on-premise solution is currently in beta, with the first release expected to provide less functionality than the cloud version.
Power BI is marketed as an interactive tool for data visualization geared at enabling the business user to analyze data and share insights predominantly via dashboards. Its pricing and the dominance of Microsoft products on office computers give Power BI huge traction in the market.
Data preparation relies on DAX for advanced functions, making it harder to use for casual users. All preparation steps are tracked and can be undone or altered at any time, making the process not only more flexible but also a lot more transparent. Data visualization is the strong point of Power BI, offering rich visualizations and flexible dashboard functions. Natural language query (NLQ) in Power BI service makes it easy for users to retrieve relevant visualizations.
Guided advanced analytics is mostly covered by “Quick Insights”, a feature that automatically analyzes data sets for patterns and outliers and provides the user with suggestions about relevant findings. This feature is available in the cloud only. The “Insight” feature can also be used to receive information about interesting patterns in the data a specific visualization is based on. While R integration is available, advanced analytics is not a main focus of Power BI.
One unique advantage of Microsoft BI is that customers can leverage the vast knowledge of Microsoft technologies present in most enterprises throughout the world. However, customer satisfaction with Power BI is currently quite low.
Strengths
• “Quick Insights” offers efficient guidance to analyze unknown data sets
• Natural language query functions for visualizations
• Integration into ubiquitous MS Office and especially MS SQL Server and Azure
• Tracking of all data preparation steps and possibility to track changes to data or undo and alter specific steps
• Extensive business partner network provides Microsoft competencies around the world
Weaknesses
• Data sets for imported data are restricted to 2 GB in size and live access is available only for selected data sources
• Data preparation and modeling only available in desktop client
• Power BI service currently only available in the cloud

BARC Score Data Discovery – Data Preparation, Visual Analysis and Guided Advanced Analytics for Business Analysts 16
MicroStrategy McLean, VA, USA
www.microstrategy.com
MicroStrategy, founded in 1989, is one of the best known vendors in the analytics market worldwide. The vendor offers both a Web (MicroStrategy Visual Insight) and a desktop (MicroStrategy Desktop) solution for data discovery to provide flexibility for business users. MicroStrategy’s unified data discovery solution extends and can make use of the fully integrated analytics suite that provides formatted reports, dashboards and interactive analysis in a single solution using the same infrastructure.
By extending its proven architecture, MicroStrategy allows the user to take advantage of existing semantic models while not confining the user to them. This combination provides a high level of flexibility but still enables collaboration by using shared and common definitions and by making use of already completed cleansing and transformation efforts.
The way MicroStrategy supports the user during data preparation is the sweet spot of the solution. The user is presented with relevant functions based on the current context, and the possible outcome of available options (e.g. when splitting data) is shown immediately alongside the existing data. No functions have to be used and the history script created in the background provides the necessary transparency.
MicroStrategy provides solid visual analysis functions on top of in-memory cached or live access data from a huge number of different data sources. A comprehensive library of built-in statistical functions is available, allowing users to go beyond visual analysis.
Strengths
• Data discovery solution tightly integrated in the BI and analytics platform for collaboration, governance and dissemination of insight
• Intuitive, comprehensive data manipulation capabilities including generation of change script
• Live access and cached via in-memory
• Comprehensive library of statistical functions for guided advanced analytics
• Identical capabilities on desktop and Web client
Weaknesses
• Weak guidance and user advisory for suggesting appropriate advanced analytics functions for selected data
• Commenting currently limited, no association of comments to data points
• Visual analysis is dashboard-oriented instead of focusing on ad hoc navigation through data, resulting in longer time to insight
• Complex solution if deployed with MicroStrategy Server, not easy to maintain for smaller customers

BARC Score Data Discovery – Data Preparation, Visual Analysis and Guided Advanced Analytics for Business Analysts 17
Oracle Redwood Shores, CA, USA
www.oracle.com
Oracle is one of the world’s largest software and cloud companies, and has long been the largest RDBMS vendor in the world. Oracle currently focuses its business on its cloud offering, providing a broad stack of cloud applications and platform services. In the BI and analytics area, Oracle offers various solutions addressing the needs of different user types in smaller and large companies. In the enterprise market, its flagship product is Oracle Analytics Cloud. Data discovery is covered by the Oracle Data Visualization product (DV), which is available in the cloud as well as on-premises and as a standalone desktop tool. In the cloud, DV can be obtained as part of Oracle Analytics Cloud, as part of Oracle BI Cloud Service, or through a dedicated Oracle Data Visualization Cloud Service.
Oracle Data Visualization provides the user with a modern and intuitive user interface, allowing users to become familiar with the tool quickly. Data profiling, usually the first step of data preparation, is supported by the “Inspect” feature, which provides a quick insight into the nature of a data source to allow for efficient data preparation. The number of connectors for Oracle Data Visualization, besides files and relational databases, is limited at present.
Visual explorations are as quick to build as they are flexible. Suitable visualizations are created based on the type of data drawn on the canvas. Faster time to insight is provided through “BI Ask” (Oracle’s solution for natural language querying), which is available on multiple devices.
Trends and forecasts as well as clustering and outlier identification are available as built-in guided advanced analysis features. The upcoming “Explain” feature will bring easy access to more advanced analytics functionality (e.g. decision trees) to identify relevant drivers in a data set.
Strengths
• Data discovery solution integrated in the BI and analytics platform
• Integration with broad Oracle BI suite and semantic layer possible
• Natural language queries for quick insights available via BI Ask
Weaknesses
• Connectivity limited to basic connection types and Oracle products
• Standalone version lacks features for governed data discovery
• Young product with little market traction and awareness compared to competitive offerings
• Varying feature set between different versions (cloud, desktop, etc.)

BARC Score Data Discovery – Data Preparation, Visual Analysis and Guided Advanced Analytics for Business Analysts 18
Qlik Radnor, PA, USA
www.qlik.com
Qlik, founded in 1993 in Sweden, moved its headquarters to the United States in 2005 after raising funds from several venture capital firms. QlikView, at that time the company’s sole product, had been promoted aggressively after the VC investment. This created enormous attention and traction, and in 2010 Qlik went public on NASDAQ. In 2016 Qlik was acquired by the private equity company Thoma Bravo and got unlisted from the stock exchange.
Until the general availability of Qlik Sense in 2014, Qlik was a one-product company. Today, the vendor provides a portfolio of visual analytics offerings: Qlik Sense Enterprise and Qlik Sense Cloud, as well as the Qlik Analytics Platform for developers, QlikView and Qlik NPrinting. Qlik DataMarket was introduced some time ago as a market providing external data for analyses such as weather or currency information. In 2017 Qlik acquired its Swedish partner Idevio to provide advanced features in the area of spatial analysis. This solution is being sold as Qlik GeoAnalytics.
Qlik Sense is positioned as a self-service data visualization and data discovery solution providing immediate analysis results. It also offers features for collaboration and interactive storytelling to communicate insight gleaned from data. In the upcoming June 2017 release, Qlik Sense will facilitate data preparation by providing visual data profiling and enhancing usability and productivity by offering a comprehensive user interface to reduce the need to write scripts.
To facilitate joining data sets (or “associating” as Qlik calls it), Qlik Sense suggests possible join candidates, not only based on column names, data types and foreign keys in databases, but also on the analyzed content of tables. This feature noticeably speeds up the often difficult step of joining data sets with unknown content or data quality. Only limited advanced analytics functionality is available.
Strengths
• Good ‘associative’ and set-based navigation in data with search in content available
• Good formatting and charting features
• Performance of data loading and querying was satisfactory during all steps of test case demonstration
• Suggesting of join candidates based on contents of tables and columns
• Data market to augment analysis with curated and ready-to-use external data
Weaknesses
• Data preparation usually requires scripting and lacks profiling. Significant improvements will be made with the June 2017 release
• Data manipulation often has to be implemented via functions instead of context
• Limited governance features to align separate data sets
• Limited advanced analytics functionality besides R integration

BARC Score Data Discovery – Data Preparation, Visual Analysis and Guided Advanced Analytics for Business Analysts 19
SAP Walldorf, Germany
www.sap.com
SAP was founded in 1972 as a business applications company. It prominently entered the business intelligence market with the large acquisition of Business Objects in 2007. SAP’s portfolio of BI and analytics solutions (now called SAP BusinessObjects Business Intelligence Platform) is one of the broadest on the market.
Data discovery capabilities in the SAP BusinessObjects portfolio are available via the SAP Analytics Cloud offering and in SAP BusinessObjects Lumira. As its name suggests, Analytics Cloud is designed specifically for the cloud and combines capabilities for data preparation and modeling, planning, reporting, visualization and advanced analytics into one integrated solution aimed at business users. For this BARC Score, we only evaluated the Analytics Cloud offering as Lumira is currently undergoing a major redesign towards its convergence with Design Studio to build Lumira 2.0, which is scheduled for general availability in Q3 2017. The focus of Lumira 2.0 will be the promotion of visualizations created by business users into professionally authored dashboards.
Analytics Cloud provides a complete vision of data discovery including data preparation, visual analysis and advanced analytics as well as planning and budgeting. Vital aspects of user guidance and automated discovery features are present in all modules. Even so, Analytics Cloud is not as mature and feature-rich in certain areas as competing products, resulting in a rather low rating on the portfolio capabilities axis.
Connectors are available only for basic connection types (i.e. files and relational databases). Analytics Cloud does not offer connectors to as many diverse data sources as competitive products and falls short in transformation capabilities as well. Visual explorations are created in a dashboard-like style that does not offer the level of user advisory and flexibility needed for quick, iterative and efficient data analysis.
Advanced analytics is the strongest pillar in Analytics Cloud for data discovery. The Smart Discovery feature set allows business users to leverage advanced analytics without coding, enabling deep insight into data.
Strengths
• Broad BI and analytics functionality integrated in a single cloud offering
• Possibility to create ad hoc data models as well as governed central data models to be used throughout the solution
• Above average guided advanced and predictive analytics capabilities including automated discovery
• Guidance for advanced analytics through the Smart Discovery feature
Weaknesses
• SAP Analytics Cloud is available in the cloud only
• Still a young solution with limited features in various areas
• Connectors currently focused on SAP data sources and only a limited but growing number of connectors available today
• Little awareness and traction outside SAP customer base

BARC Score Data Discovery – Data Preparation, Visual Analysis and Guided Advanced Analytics for Business Analysts 20
SAS Cary, NC, USA
www.sas.com
SAS, founded in 1976, is a privately held company and a well known brand in the business intelligence and analytics market. The vendor has specialized in business intelligence, statistics, industry-specific analytic applications, data mining and data management for decades.
In 2012, SAS released SAS Visual Analytics (VA), a new product line that provides an integrated platform for data discovery, dashboarding and analysis. It was complemented with a statistical add-on for business analysts called Visual Statistics (VS). SAS’s greatest strength lies in advanced analytics, predictive modeling and statistics solutions that are increasingly targeted at skilled business users. In 2016, the vendor introduced SAS Viya, a new open platform for analytics. SAS Visual Analytics is available as an early version on this platform starting from March 2017, promising better integration. For this BARC Score we reviewed the more mature offering for SAS VA/VS.
Data preparation can either be done with SAS Enterprise Guide or SAS Visual Data Builder (part of SAS Visual Analytics). Both are used to load data sets into the in-memory engine LASR for fast analysis. SAS Visual Data Builder aims to enable business analysts to prepare data and is therefore more suitable for data discovery in business units.
SAS really shines when advanced analytics is required. A huge library of functions ready to use without scripting and equipped with self-optimizing features provides business analysts with a mighty tool to dig deep for nuggets in corporate data.
Visual analysis in SAS is optimized for visualizing advanced analytics results. Finding and filtering on outliers and accessing detailed data is addressed exceptionally well. The interface is rather cluttered for general purpose visualizations.
Strengths
• Leading analytics and data mining capabilities for data discovery
• User advisory and guidance for advanced analytics functions is good
• Proven architecture for substantial amounts of data with LASR in-memory engine
• Well known, established vendor with a strong presence in the analytics market
Weaknesses
• Limited user friendly data preparation capabilities and limited connectivity in SAS Visual Data Builder
• Integration of components and ease-of-use not on a par with competing data discovery solutions
• User advisory and guidance during data preparation and visual analysis rather limited
• Not a “lightweight” solution compared to competitors as LASR Server needs no be installed and maintained
BARC Score Data Discovery – Data Preparation, Visual Analysis and Guided Advanced Analytics for Business Analysts 21
Sisense New York, NY, USA
www.sisense.com
Headquartered in New York City, Sisense is a growing BI and analytics vendor offering a modern analytics product suitable for explorative use cases as well as for reporting on a single platform. The company sells to medium and large enterprises across the globe.
Marketed as a “single-stack” product that tries to simplify analytics for complex data, Sisense provides an easy-to-use dashboard environment where users have the option to start with predefined dashboards for selected data sources, data modeling and integration tools for querying disparate data sources. Sisense can consume data from spreadsheets, Hadoop, Web applications and relational databases and loads it into ElastiCube data stores without pre-aggregation or pre-calculation. ElastiCube is based on MonetDB and, despite its name, is not a cube engine. Query performance is enhanced by Sisense’s proprietary In-Chip technology, which uses CPU-based memory banks to store data and further scale performance.
Although mandatory, upfront modeling for building ElastiCubes is simple and very flexible. Business users are offered broad connectivity options and most data transformations can be made while visually analyzing data. Compared to other data discovery tools, the ElastiCube modeling environment is a full client varying in its UI compared to the Web client. Intuitiveness during data preparation is limited by the lack of user guidance (i.e. suggesting functions for shaping data in a context aware manner). Visual analysis unfolds the heritage of a dashboard based approach with slightly more effort required to produce informative visualizations to reveal insight in data. Sisense offers only weak advanced analytics capabilities beyond an obligatory R integration.
The introduction of natural language queries in the BI Bot shows Sisense’s aspiration to be recognized as an innovative vendor in the BI and analytics market.
Strengths
• Single integrated product for data discovery and reporting use cases targeted at business users
• High customer satisfaction in latest BARC BI Survey for self-service and visual discovery oriented tools
• Internal columnar data store is mature and fast, combined with proprietary In-Chip technology for performance acceleration
• A broad range of connectors is available
Weaknesses
• The cube builder for creating ElastiCubes is a separate client with a different user experience compared to the Web suite, but a Web-based ElastiCube manager is expected in a couple of months
• The appeal to casual business users is modest due a lack of context sensitive actions available during data preparation and visual analysis
• Local presence limited outside the US and Israel, although the vendor is currently expanding into other territories
• Limited functions for guided advanced analysis
BARC Score Data Discovery – Data Preparation, Visual Analysis and Guided Advanced Analytics for Business Analysts 22
Tableau Seattle, WA, USA
www.tableau.com
Tableau Software (Tableau) emerged from scientific research at Stanford University. Since its foundation in 2003, Tableau has enjoyed substantial growth. The vendor follows a strategy of delivering software that requires little training and allows business users to interpret their own data mostly by means of interactive visualization. Today, Tableau offers four core products: Tableau Desktop, Tableau Server (on-premises), Tableau Online (cloud) and Tableau Public (cloud, free but limited), which are based on one common technology.
Tableau is a user-friendly visual analysis and data discovery tool. Its core comprises a full client with connectors to a wide variety of data sources ranging from files to cloud applications. The intuitive user interface, built-in intelligence and memory utilization to optimize performance contribute to the popularity of this solution for data discovery scenarios. Tableau provides a lean architecture consisting of a desktop client used for central development and authoring. Workbooks are usually distributed by the Tableau Server for easy consumption on the Web and on mobile devices.
Tableau’s openness to different data sources is one of its focus areas. The solution allows users to combine and analyze data from over 50 different data sources. Data preparation in Tableau can be quick as many manipulations (except e.g. joining data sets) can be made directly while analyzing data, enabling a true iterative approach to data discovery. This not only applies to basic calculations but also to advanced functions like binning.
The user advisory available during visual analysis is an important reason for Tableau’s ongoing popularity, as it allows users to produce meaningful, interactive visualizations in very little time and with little product training. Visualizations can be annotated and compiled in dashboards or storyboards for content distribution. Basis analytics functions can be applied to visualizations by dragging relevant functions on the canvas. Clustering is available in many visualizations but is most helpful when used in scatter plots.
Strengths
• Easy-to-use user interface leading to good user acceptance
• Visual analysis with built-in intelligence and high interactivity suitable for business users
• Data preparation mostly during visual analysis for iterative discovery
• Good annotation and storytelling functions
• Broad knowledge available in the market due to Tableau Public and low price offers for education
Weaknesses
• Certain data preparation steps are only available in the thick client (e.g. establishing connections and joins)
• Lack of data profiling functions during data preparation
• Limited user advisory besides visual analysis (e.g. in data preparation and advanced analytics)
• Risk of report “explosion” when using the solution without proper governance concepts

BARC Score Data Discovery – Data Preparation, Visual Analysis and Guided Advanced Analytics for Business Analysts 23
TIBCO Palo Alto, CA, USA
www.tibco.com
TIBCO is a software vendor best known for its infrastructure offerings. However, in 2007, it decided to enter the business intelligence market with the acquisition of Spotfire, a Swedish software vendor specializing in interactive visual analysis. In 2014 TIBCO invested again and purchased the open source vendor Jaspersoft with its solution for formatted and ad hoc reporting, dashboarding and OLAP analysis.
TIBCO Spotfire Platform, which is evaluated in this BARC Score, is a comprehensive business intelligence and analytics solution strongly focused on data discovery through visual analysis and advanced statistical methods. Spotfire applications are optimized to deliver high performance through integrated in-memory data storage or by using in-database options in combination with third-party storage technologies. Aside from a full-featured desktop client primarily targeted at trained analysts and statisticians, TIBCO also offers Web and mobile clients for Spotfire content consumers.
Data Preparation in TIBCO is quite mature, feature-rich and easy to use but the product lacks a modern and intuitive design, especially in the full client. Visual analysis capabilities have been a sweet spot of TIBCO Spotfire for a long time. The introduction of a recommendation engine for visualizations aims to put the power of Spotfire into the hands of less tech-savvy business users.
Advanced analytics in Spotfire is not only targeted at data scientists. By delivering a broad range of predefined analytical functions, business analysts can easily extend their visual analysis by diving even deeper into the available data.
Strengths
• Combination of live data access with in-database analytics and mature in-memory storage, enabling a broad range of use cases
• TIBCO offers many built-in advanced analytical functions consumable without coding and is open to several external statistical libraries
• Common definitions can be enforced by metadata models spanning various data sets
• Connectivity is available for a large number of data sources
Weaknesses
• The Spotfire full client interface is a bit overloaded, making it hard for less experienced users to use the tool efficiently
• Web client has significantly less functionality than the thick client
• Visualizations are hard to read by default and don’t offer a modern and clean design
• Different data access types between thick client and server
BARC Score Data Discovery – Data Preparation, Visual Analysis and Guided Advanced Analytics for Business Analysts 24
Yellowfin Melbourne, Vic, Australia
www.yellowfinbi.com
Yellowfin, founded in Melbourne in 2003, is a BI software company that set out to change the general BI approach because the founders felt that traditional BI had become too complex and too expensive. Yellowfin’s strength lies in selling its software to OEM organizations, where its BI functionality is integrated into other vendors’ products and applications. The vendor boasts more than 600 partners today, which is a considerable number for a mid-sized company. Yellowfin also sells directly to end-user organizations and while the company only has a small direct sales force, it has been able to sign up some impressive names as customers through its extensive reseller network.
Yellowfin is a mature, user-friendly BI and analytics platform that has evolved from a successful reporting and dashboard product to support an emerging style of BI characterized by governed data discovery and collaboration. Besides engaging visualization, and the company’s focus on making BI content consumption as easy as possible, the vendor has put particular emphasis on providing collaboration features. Its breadth of features in this area is a major differentiator as collaboration is the glue that can stick together insight from different areas. Yellowfin has added features such as Timeline, to track content and collaboration in a social networking manner, as well as workflow functionality to support content creation and collaboration between different user types – such as IT and business.
In Yellowfin users are provided with thorough guidance throughout the data preparation process. Data profiling information is presented to the user, showing the distribution and outliers in columns as well as alerts about possible errors in the data and steps to rectify these.
The flexibility of data visualizations is reduced by the need to define data areas to be analyzed before plotting data on the canvas, showing Yellowfin’s heritage as a user-friendly but still an enterprise BI platform. Advanced analytics is only available via R integration.
Strengths
• Governance framework supporting governed data discovery
• Broad data preparation functionality with good guidance and profiling features
• Already broad usage of innovative features such as collaboration and storyboarding
• Set analysis has seen significant improvements in the latest releases
• Complete functionality available via browser
Weaknesses
• Focus on live access can cause problems with performance during interactive analysis
• Yellowfin offers only limited advanced analytics capabilities compared to some competitors
• Yellowfin’s capabilities in the area of visual analysis could be improved
• Data preparation UI is a separate module. Although it can be accessed quickly from visual analysis.
BARC Score Data Discovery – Data Preparation, Visual Analysis and Guided Advanced Analytics for Business Analysts 25
Other Vendors There are many other relevant vendors in the business intelligence market that provide solutions for data discovery. However, due to the inclusion criteria applied in this report, those vendors are not evaluated in detail. To provide a broader market overview, we list some of those providers here.
Adaptive Insights
Palo Alto, CA, USA
www.adaptiveinsights.com
Adaptive Insights offers a cloud-based business intelligence and corporate performance management suite called Adaptive Suite for planning, consolidation, analytics and reporting.
Alteryx
Irvine, CA, USA
www.alteryx.com
Alteryx Analytics provides analysts with a workflow-based approach to data integration, modeling and advanced analytics that leads to deeper insights into data. Alteryx is especially geared to supporting users in the area of data preparation as one of the important steps in a data discovery process.
BOARD International
Chiasso, Switzerland
www.board.com
BOARD’s product strategy is based on an “all-in-one” philosophy. The goal is to deliver an easy to use and technically homogeneous environment in support of BI and CPM.
Bissantz
Nuremberg, Germany
www.bissantz.de
Bissantz’s DeltaMaster software enables users to create custom solutions for analysis, planning and reporting, featuring patented visualization capabilities.
ClearStory Data
Menlo Park, CA, USA
www.clearstorydata.com
Fast data access, iterative analysis and active collaboration based on an integrated Spark-based data processing platform.
BARC Score Data Discovery – Data Preparation, Visual Analysis and Guided Advanced Analytics for Business Analysts 26
Comma Soft
Bonn, Germany
www.comma-soft.com
In-memory based BI solution targeted towards business users. Includes advanced analytics and data science functionality as well as capabilities for dashboading, ad hoc analysis, reporting, set-oriented analysis and visual navigation in data.
Cubeware
Rosenheim, Germany
www.cubeware.de
BI front end for reporting, analysis, dashboarding and planning with a data integration offering for various multidimensional databases.
Datawatch
Chelmsford, MA, USA
www.datawatch.com
Datawatch offers data preparation and visual analysis products for accessing structured and unstructured data and exploring it with visual analytics to identify trends, spot outliers and identify opportunities.
Dimensional Insight
Burlington, MA, USA
www.dimins.com
Diver focuses on providing the ability to empower users with fast access to critical measures and the ability to allow users to “dive” deep into their organization’s data in any direction to get the answers to their business-critical questions.
Domo
American Fork, UT, USA
www.domo.com
Fast-growing American business intelligence vendor focused on data visualization, dashboards and reporting while offering the ability to discover, mash up, visualize and present data.
GoodData
San Francisco, CA, USA
www.gooddata.com
GoodData offers a cloud analytics platform to help organizations creating and distributing data products. The product offers analytics functionality such as dashboards, data discovery and visualization.
BARC Score Data Discovery – Data Preparation, Visual Analysis and Guided Advanced Analytics for Business Analysts 27
Infor (including Birst)
New York, NY, USA
www.infor.com
Infor provides a broad and flexible solution for reporting, analysis and planning based on a multidimensional in-memory database. Birst was acquired by Infor in April 2017. It offers a cloud-native BI suite including analytics and data visualization capabilities.
Information Builders
New York, NY, USA
www.informationbuilders.com
Based on a strong and proven BI suite, Information Builders addresses explorative BI and analytics for the line of business with easy-to-use interfaces complementing the BI platform.
Jedox
Freiburg, Germany
www.jedox.de
A flexible BI solution for planning, reporting and analysis that runs on the company’s own multidimensional database. The underlying philosophy of Jedox Suite is to extend the familiar Excel environment with specific BI functionality and bring solutions to the Web.
Lavastorm Analytics
Boston, MA, USA
www.lavastorm.com
Agile analytic environment that combines ETL and data integration, data analysis and data visualization capabilities based on the Lavastorm Analytics Engine.
Logi Analytics
McLean, VA, USA
www.logianalytics.com
Strongly focused on offering BI solutions that are easily embeddable into operational systems. Logi’s BI platform also offers self-service analytics for ad hoc reporting and visual analytics.
Longview (including arcplan)
Markham, Canada
www.longview.com
Longview Solutions is a Canadian CPM specialist that merged with arcplan, a German BI specialist, in 2015. Longview Analytics (formerly arcplan) is a versatile platform for tailor-made BI applications that offers mobile reporting, dashboarding and analytics.
BARC Score Data Discovery – Data Preparation, Visual Analysis and Guided Advanced Analytics for Business Analysts 28
Looker
Santa Cruz, CA, USA
www.looker.com
Web-based data discovery platform accessible on any browser as well as on mobile devices. Looker operates inside underlying databases, such as Amazon Redshift, Greenplum and Teradata Aster.
OpenText (including BIRT Analytics)
Waterloo, Canada
www.opentext.com
OpenText Big Data Analytics is focused on data scientists from business departments and offers predefined data mining algorithms and analysis methods with an integrated data preparation solution.
Panorama Software
Toronto, ON, Canada
www.panorama.com
Collaborative business intelligence tool focused on dashboarding and analysis and based on visual infographics.
Pentaho (a Hitachi Group Company)
Orlando, FL, USA
www.pentaho.com
Pentaho Business Analytics is an embeddable BI platform with a commercial open source business model that comes with data integration and front-end tools for dashboarding, reporting, OLAP analysis and advanced analytics.
Prevero (a Unit4 company)
Munich, Germany
www.prevero.com
Prevero offers a flexible development environment for building individual BI applications for planning, reporting and analysis with the help of wizards targeted at business users.
Pyramid Analytics
Amsterdam, Netherlands
www.pyramidanalytics.com
BI Office is an integrated BI platform for dashboarding, visual discovery, reporting and integration support for traditional and API data sources.

BARC Score Data Discovery – Data Preparation, Visual Analysis and Guided Advanced Analytics for Business Analysts 29
Salesforce (including BeyondCore)
San Francisco, CA, USA
www.salesforce.com
Salesforce, already well known for its CRM solution, has entered the BI market with an internally developed product called Wave Analytics. In 2016, Salesforce also acquired BeyondCore, a data discovery solution targeted at business users.
SpagoBI
Padua, Italy
www.spagobi.org
An open source business intelligence suite for ad hoc reporting, interactive cockpits, multidimensional (OLAP) analysis and data mining.
TARGIT
Hjørring, Denmark
www.targit.com
TARGIT Decision Suite offers self-service analysis, ad hoc reporting and dashboards with capabilities for storyboards and data mashups. Recent releases support a range of innovative features including speech recognition for natural language queries, alerting and notification.

BARC Score Data Discovery – Data Preparation, Visual Analysis and Guided Advanced Analytics for Business Analysts 30
Related Research Documents The following BARC and CXP Group documents complement the BARC Score Data Discovery:
• The BI Survey 17
The world’s largest vendor-independent survey of BI end-users analyzes the latest trends and reveals how real-world end users currently rate their BI vendors and products.
http://www.bi-survey.com/
• Vendor Performance Summaries
Product reviews with detailed insights into more than 30 business intelligence solutions, covering all the major players in the BI space.
http://www.barc-research.com/bi-survey-16/the-bi-survey-16-vendor-performance-summaries/
• BI Trend Monitor 2017
Examines the trends currently shaping the business intelligence and data management market.
http://www.barc-research.com/research/bi-trend-monitor/
• The PAC SITSI Research Platform
Market and vendor analyses for analytics and many other topics.
https://www.pac-online.com/sitsi
Copyright © BARC GmbH 2017. All rights reserved. Business Application Research Center – BARC GmbH
Germany BARC GmbH Berliner Platz 7 D-97080 Würzburg +49 931 880651-0 www.barc.de
Austria BARC GmbH Goldschlagstr. 172 / Stiege 4 / 2.OG A-1140 Wien +43 1 8901203-451
Switzerland BARC Schweiz GmbH Täfernstr. 22a CH-5405 Baden-Dättwil +41 76 3403516
France BARC France (Le CXP) 8 Ave. des Ternes FR-75017 Paris +33 1 530505 53
Rest of the World +44 1536 772 451 www.barc-research.com