barclays capital financial services conference€¦ · barclays capital financial services...
TRANSCRIPT

This slide is part of a presentation by Morgan Stanley and is intended to be viewed as part of that presentation. The presentation is based on information generally available to the public and does not contain any material, non-public information. The presentation has not been updated since it was originally presented.
Barclays Capital Financial Services Conference
Ruth Porat, Executive Vice President andChief Financial Officer
September 10, 2013

This slide is part of a presentation by Morgan Stanley and is intended to be viewed as part of that presentation. The presentation is based on information generally available to the public and does not contain any material, non-public information. The presentation has not been updated since it was originally presented.
2
Notice
The information provided herein may include certain non-GAAP financial measures. The reconciliation of such measures to the comparable GAAP figures are included in the Company’s Annual Report on Form 10-K, Quarterly Reports on Form 10-Q and the Company’s Current Reports on Form 8-K, as applicable, including any amendments thereto, which are available on www.morganstanley.com.
This presentation may contain forward-looking statements. You are cautioned not to place undue reliance on forward-looking statements, which speak only as of the date on which they are made, which reflect management’s current estimates, projections, expectations or beliefs and which are subject to risks and uncertainties that may cause actual results to differ materially. For a discussion of risks and uncertainties that may affect the future results of the Company, please see the Company’s Annual Report on Form 10-K, the Company’s Quarterly Reports on Form 10-Q and the Company’s Current Reports on Form 8-K, as applicable, including any amendments thereto. This presentation is not an offer to buy or sell any security.
Please note this presentation is available at www.morganstanley.com.

This slide is part of a presentation by Morgan Stanley and is intended to be viewed as part of that presentation. The presentation is based on information generally available to the public and does not contain any material, non-public information. The presentation has not been updated since it was originally presented.
50%
20%
12%
16%
2%
1H 2013
13%
17%
33%
37%
2Q13
3
Strategic Moves Continue to Enhance Revenue Stability and Funding Durability
3
WM & IM
Fixed Income S&T
Equity S&T
Revenue Split • Wealth Management & Investment Management
− Revenue stability: ~50% of revenues in 1H13 vs. ~28% in 2006
− Efficient, stable deposit funding: growing to 25% of funding stack by 2015 YE
− Contractual earnings upside from 100% ownership of wealth management JV beginning July 1, 2013
• Equity Sales & Trading
− Top 1-2 globally with strength across geographies and products, including cash, derivatives and prime brokerage
• Investment Banking
− Leadership positions in M&A, Equity Underwriting and Debt Underwriting
• Fixed Income Sales & Trading
− Enhancing consistency and increasing capital efficiency
• Strategic partnership with MUFG
– Top broker on Tokyo Stock Exchange
– Leading Investment Banking franchise in Japan
• Durable funding, strong capital and liquidity
Key Drivers
(1) Revenues exclude the negative impact of $142 million from DVA in 1H13. Revenue ex-DVA is a non-GAAP measure the Company considers useful for investors to allow comparability of period to period operating performance.
(2) Assumes total deposits of $138 billion at year-end 2015, pro-forma for completed transfer of Citi deposits associated with former wealth management joint venture. Assumes no changes to other balance sheet items versus 2Q13.
(3) Figures may not sum due to rounding.
Secured Funding
Shareholders’ Equity
Long-Term Debt
Deposits
Funding Stack(1)
Other
IBD
(2)

This slide is part of a presentation by Morgan Stanley and is intended to be viewed as part of that presentation. The presentation is based on information generally available to the public and does not contain any material, non-public information. The presentation has not been updated since it was originally presented.
(1) Morgan Stanley deposits include both MSBNA and MSPBNA deposits and reflects the contractual transfer of deposits from Citi to Morgan Stanley after the closing of the acquisition. Organic account balance growth is assumed to be flat.
(2) Excludes U.S. subsidiaries of foreign based banks. Based on company SEC Filings as of 2Q13. 4
Morgan Stanley Today
Leading global franchises increasingly benefitting from two Morgan Stanley-specific differentiators
• We Will Be the Tenth Largest Bank in the United States (1),(2)
• Stable, cost-efficient deposits
• Deposits support lending growth in:
– Institutional Securities: Building on pre-existing client franchise and domain expertise
– Wealth Management: Leveraging existing clients and product set
• Leading with risk management; sizable investment and conservative philosophy
• Our Banks have strong capital and governance
• We Have a Powerful Technology Platform
• Award winning technology platform contributes to global leadership of Institutional Equities
– Trading / Analytics / Prime Brokerage suite
• Technology investments position Morgan Stanley Fixed Income well for market structure change and evolving regulatory requirements
– Trading / Analytics / Clearing
1
2

This slide is part of a presentation by Morgan Stanley and is intended to be viewed as part of that presentation. The presentation is based on information generally available to the public and does not contain any material, non-public information. The presentation has not been updated since it was originally presented.
5
Top US-Based Depositories (1),(2)
(1) Excludes U.S. subsidiaries of foreign based banks.(2) Source: SNL Financial as of 2Q13. Based on company SEC Filings as of 2Q13.(3) Firmwide pro-forma deposit growth reflects the contractual transfer of deposits from Citi to Morgan Stanley after the closing of the acquisition.
Organic account balance growth is assumed to be flat.
($Bn)
Morgan Stanley Is A Top 10 US-Based Depository Institution – Pro-forma
1
1. JP Morgan Chase & Co. $1,2032. Bank of America Corporation 1,0813. Wells Fargo & Company 1,0224. Citigroup Inc. 9385. U.S. Bancorp 2526. Bank of New York Mellon Corporation 2457. PNC Financial Services Group, Inc. 2128. Capital One Financial Corporation 2109. State Street Corporation 167
10. Pro-forma Morgan Stanley (3) 13810. BB&T Corporation 13111. SunTrust Banks, Inc. 12812. Fifth Third Bancorp 9313. Regions Financial Corporation 9214. Charles Schwab Corporation 8415. Morgan Stanley 8216. Northern Trust Corporation 7717. Goldman Sachs Group, Inc. 6918. KeyCorp 6819. M&T Bank Corporation 6620. Comerica Incorporated 5121. Huntington Bancshares Incorporated 4622. Zions Bancorporation 4523. Discover Financial Services 4324. American Express Company 4125. First Republic Bank 28
This slide is part of a presentation by Morgan Stanley and is intended to be viewed as part of that presentation. The presentation is based on information generally available to the public and does not contain any material, non-public information. The presentation has not been updated since it was originally presented.
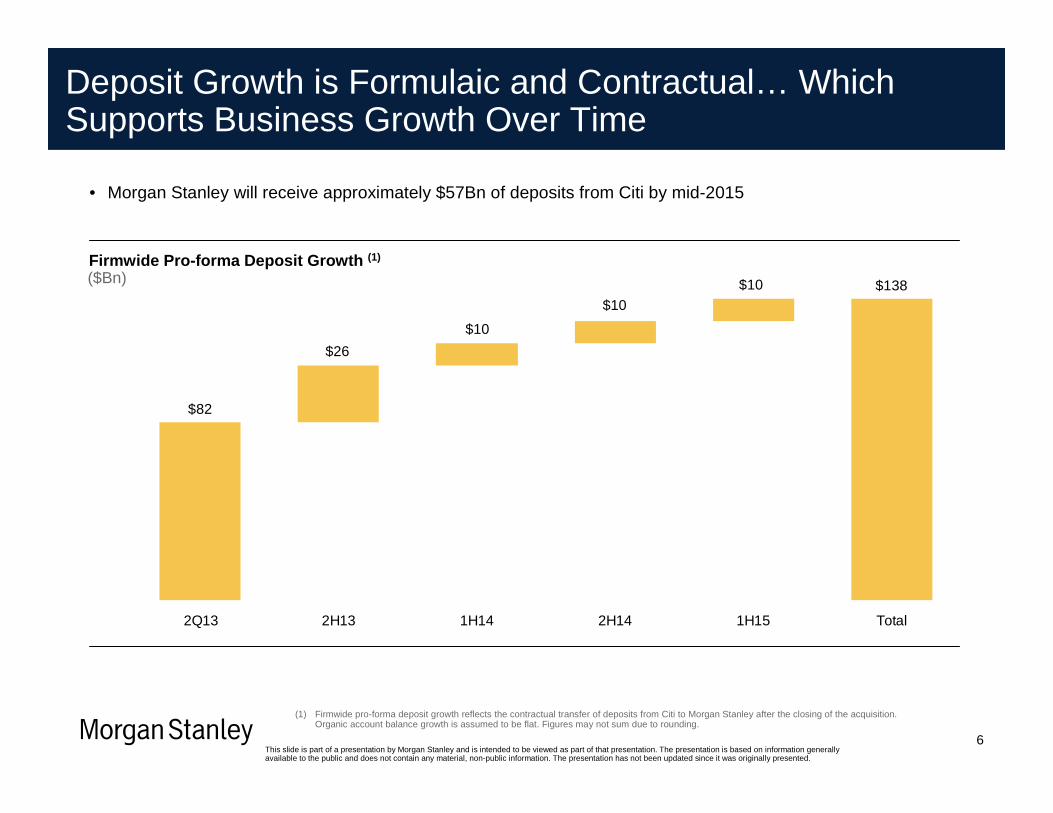
$138$10$10
$10
$26
$82
2Q13 2H13 1H14 2H14 1H15 Total
Firmwide Pro-forma Deposit Growth (1)
($Bn)
(1) Firmwide pro-forma deposit growth reflects the contractual transfer of deposits from Citi to Morgan Stanley after the closing of the acquisition. Organic account balance growth is assumed to be flat. Figures may not sum due to rounding.
6
Deposit Growth is Formulaic and Contractual… Which Supports Business Growth Over Time
• Morgan Stanley will receive approximately $57Bn of deposits from Citi by mid-2015

This slide is part of a presentation by Morgan Stanley and is intended to be viewed as part of that presentation. The presentation is based on information generally available to the public and does not contain any material, non-public information. The presentation has not been updated since it was originally presented.
• Sourced from our retail customers, our deposits are sticky and stable
– Default sweep for clients’ excess cash – effectively working capital in client accounts – rooted in deep and broad franchise relationships anchored in investment advice; highly tenured client based
– Stable over economic cycles and observed periods of both market and idiosyncratic stress
• Bank Deposit Program (BDP) total balances of $127Bn as of June 30, 2013
– Comprised of ~7% of Wealth Management total client assets, sourced from ~3MM households with ~$1.8Tr of assets
7
Morgan Stanley Wealth Management Deposits Are a Stable Source of Funding
Morgan Stanley Deposit Stability Over Time
$20
$40
$60
$80
Jan-08 Jul-08 Jan-09 Jul-09 Jan-10 Jul-10 Jan-11 Jul-11 Jan-12 Jul-12 Jan-13 Jul-13
50
150
250
350
450
Weekly BDP Balance (LHS; $Bn) S&P Financials Sector Index (RHS)
(1)
(1) As of June 30, 2013 approximately $70 billion was held at Morgan Stanley banks and $57 billion was held at former joint venture partner.

This slide is part of a presentation by Morgan Stanley and is intended to be viewed as part of that presentation. The presentation is based on information generally available to the public and does not contain any material, non-public information. The presentation has not been updated since it was originally presented.
0
30
60
90
120
150
2012 2015 PF
Rates Institutional Lending Initiatives AFS Excess Liquidity
Retail
($Bn)
Total Combined Bank Assets with Allocated Liquidity
PLA(1) Mortgages Senior Loans FX Other Loans
(2)
Institutional
Loan-to-Deposit Ratio: ~55%
Loan-to-Deposit Ratio: ~70%
AFS & Liquidity
8
Additional Deposits Support Retail and Institutional Business Growth Over Time
(1) PLA (Portfolio Loan Account) represents non-purpose securities-based lending.(2) Institutional Lending initiatives include Project Finance Lending, SPG Warehouse Lending and Equity Margin Lending.
Slowly and Prudently Building Bank Assets; Targetin g Core Client Franchise –Leading with Risk Management

This slide is part of a presentation by Morgan Stanley and is intended to be viewed as part of that presentation. The presentation is based on information generally available to the public and does not contain any material, non-public information. The presentation has not been updated since it was originally presented.
9
Retail Product Overview – Addressing Client Needs
Strategy: Prudent build of retail bank assets to address requirements of existing Wealth Management clients
• Since 2009, built team of ~200 private bankers to collaborate with and support Financial Advisors
• Mortgage loans and home equity products to
high credit-quality clients
• Average LTV ~60%
• Average FICO > 750
• Predominantly floating rate
• Virtually no delinquencies to date
Residential Mortgages
• Credit lines to clients secured by brokerage
account assets
• More flexible product than margin lending
• Provides liquidity to clients while leaving client
portfolio strategies intact
• Average loan size of ~$1.2MM
• Significantly over-collateralized
• Virtually no credit losses to date
Securities Based Loans (e.g. PLA)
Primary Retail Bank Assets(1)
(1) In addition to primary retail bank assets, Bank assets include an AFS portfolio.
Result: Increase client penetration from ~5% current state to ~10% industry average over several years
• Lending products deepen Financial Advisor & client relationship
• In addition to retail products, Bank assets include AFS portfolio

This slide is part of a presentation by Morgan Stanley and is intended to be viewed as part of that presentation. The presentation is based on information generally available to the public and does not contain any material, non-public information. The presentation has not been updated since it was originally presented.
12%
23%
35%
0%
10%
20%
30%
40%
MorganStanley
WellsFargo
Bank ofAmerica
10
Retail Bank Asset Growth Drives Upside in Net Interest Income
Net Interest Income as a Percentage of Wealth Management Revenue (1),(2)
(1) Based on full-year 2012 results.(2) Wells Fargo represents Wells Fargo Wealth, Brokerage and Retirement and Bank of America represents Bank of America Global
Wealth Management.
• Net interest income (NII) as a percentage of total revenues in Wealth Management is lower than peers due to relative penetration of retail product suite
• NII growth has and will continue to be driven by an increase in retail lending products, as well as AFS portfolio
• Growth in NII is highly accretive to pre-tax margin
1,000
1,100
1,200
1,300
1,400
1,500
1,600
1,700
1,800
2011 2012 1H13Annualized
Morgan Stanley Wealth Management Net Interest Income($MM)
+20%

This slide is part of a presentation by Morgan Stanley and is intended to be viewed as part of that presentation. The presentation is based on information generally available to the public and does not contain any material, non-public information. The presentation has not been updated since it was originally presented.
11
Institutional Product Overview – Leveraging Existing Capabilities
• Predominately syndicated, undrawn
corporate loan commitments
• More mature book with modest
growth anticipated
Relationship and Event Lending
• Source transactions from existing
flows and relationships
• Complementary product set to
existing securitization business
• Expected ROE of 20%+
Commercial Real Estate Lending
• Expansion and deepening of existing
relationships
• Expansion of assets accepted for
financing
• Expected ROE of 15%+
Warehouse Lending
• Operational leverage from existing
infrastructure
• Ability to monetize relationships and
flows
• Expected ROE of 15%+
Corporate Lending
Strategy: Leverage our leading Institutional Securities franchise
• Product growth strategy benefits from areas where Firm has deep domain expertise, strong embedded client base, and robust risk management and governance infrastructure

This slide is part of a presentation by Morgan Stanley and is intended to be viewed as part of that presentation. The presentation is based on information generally available to the public and does not contain any material, non-public information. The presentation has not been updated since it was originally presented.
12
• Institutional Securities products are extensions of existing businesses
• Wealth Management products include deposit accounts, lending and trust services
(1) As of June 30, 2013.
Two Banks Support Client Activity
Retail
Securities Based Lending (PLA)
Institutional
Senior Lending
Foreign Exchange Derivatives
Prime Brokerage Custody
Project Finance Lending
Tailored Lending
Trust Services
Commercial Real Estate Lending
Equity Margin Lending
MSBNA($66Bn of Deposits) (1)
MSPBNA($14Bn of Deposits) (1)
Residential Mortgages

This slide is part of a presentation by Morgan Stanley and is intended to be viewed as part of that presentation. The presentation is based on information generally available to the public and does not contain any material, non-public information. The presentation has not been updated since it was originally presented.
13
Banks Well Capitalized to Support Growth
10
13
14
15
15
27
16
Reg Min
JPM, NA
BAC, NA
Citi, NA
GS Bank
MSBNA
MSPBNA
Total Capital Ratio (1)
(%)
5
6
9
9
17
11
13
Reg Min
JPM, NA
BAC, NA
Citi, NA
GS Bank
MSBNA
MSPBNA
Leverage Ratio (1)
(%)
(1) Morgan Stanley and peer capital ratios as of June 30, 2013 and based on Call Reports from the Federal Financial Institutions Examination Council.(2) Regulatory minimum for a well-capitalized bank.
6
10
12
13
15
14
26
Reg Min
JPM, NA
BAC, NA
Citi, NA
GS Bank
MSBNA
MSPBNA
Tier 1 Capital Ratio (1)
(%)
(2)
MSPBNA
GS Bank
MSBNA
Citi, NA
BAC, NA
JPM, NA
Reg Min.(2)
Citi, NA
BAC, NA
JPM, NA
Reg Min.(2)
Citi, NA
BAC, NA
JPM, NA
Reg Min.
MSPBNA
GS Bank
MSBNA
MSPBNA
GS Bank
MSBNA

This slide is part of a presentation by Morgan Stanley and is intended to be viewed as part of that presentation. The presentation is based on information generally available to the public and does not contain any material, non-public information. The presentation has not been updated since it was originally presented.
14
Bank Governance and Oversight Functions: Investments, Infrastructure and Experience
Compliance RiskManagement
Credit RiskManagement
Liquidity Management
Asset-LiabilityManagement
Market RiskManagement
BankGovernance
New ProductApproval
A
B
C
D
E
F

This slide is part of a presentation by Morgan Stanley and is intended to be viewed as part of that presentation. The presentation is based on information generally available to the public and does not contain any material, non-public information. The presentation has not been updated since it was originally presented.
15
• Morgan Stanley’s Banks have independent, comprehensive, multi-tiered, and well-defined risk governance
• Bank-level governance is aligned with Firmwide risk management framework
• MSBNA and MSPBNA have separate Boards of Directors and Management Committees − Each Management Committee is authorized to implement or recommend appropriate risk limits for
its area of oversight
• Our Banks are conservatively managed: − Significant investments by the Firm in the platforms, infrastructure, risk management, compliance
and controls of the banks since each converted to a national charter in 2008− Decision-making regarding clients and credit risk has a particular focus on bank compliance
standards and size restrictions given the uniqueness of the two banks• Conservative in our approach to interest rate, credit, and market risk
− Transparent and measurable risk; relatively low complexity of product mix, asset mix, and the liability structure
− Rigorous new business approval process− Built on a foundation of operational excellence
Strong Governance Ensures Prudent and Well-Managed Growth

This slide is part of a presentation by Morgan Stanley and is intended to be viewed as part of that presentation. The presentation is based on information generally available to the public and does not contain any material, non-public information. The presentation has not been updated since it was originally presented.
Market Risk Management
• MSBNA and MSPBNA employ bank-appropriate risk limits consistent with the Firm’s market risk management framework
• Market risk limits are determined by each Bank’s size and are governed by each Bank Board’s risk appetite
• Transparency and measurability of risk in the Banks is increased by the relatively low complexity of:
– Product mix
– Asset mix
– Liability structure
• Levels and types of risk differ between MSBNA and MSPBNA given differences in product and asset mix
Credit Risk Management
• Bank-specific Credit Limits Framework (CLF) ensures limits are sized to reflect respective capital levels at each bank
− Firm-level CLF vs. Bank-specific CLFs
• Separate Firm vs. Bank credit approval authorities
• Bank Board-level underwriting criteria reflect specific or unique risk tolerance of each bank
• Separate Firm vs. Bank Credit Policies
− Credit Policy and Governance Subcommittees at both Firm and Bank level
• Firm-level Oversight Committee for Credit Risk Metrics – includes representatives from each Bank
• Firm and Bank level ALLL assessments and reporting
• Multiple levels of regulatory oversight of Credit Risk Management at Firm and Bank levels
16
Credit Risk and Market Risk ManagementA B

This slide is part of a presentation by Morgan Stanley and is intended to be viewed as part of that presentation. The presentation is based on information generally available to the public and does not contain any material, non-public information. The presentation has not been updated since it was originally presented.
• Maintains detailed delegated authority single name limits by obligor
• Tailored to the specific risk attributes of a given obligor and typically established within Bank Board, Management Committee, and Credit Committee limits
• Approved by Bank Credit professionals in accordance with established credit approval authorities
17
• Approves and oversees the development and maintenance of Credit Limits Framework
• Establishes Management Committee level Limits including single name and product limits
• Management Committee limits established within the Board limits
• Defines each Bank’s credit risk tolerance in relation to total capital
• Authorizes development of the Credit Limits Framework to management
• Establishes Board-level Limits, including product and regulatory limits
• Establishes Credit Committee-level Limits, including single name and product limits
• Credit Committee limits are more granular than Board and Management Committee limits and support risk management activities performed by Credit Risk Management
• Credit Committee limits established within the Management Committee limits
In-Depth Example – Credit Risk Management
Credit Risk Management (CRM)
Credit Committee (CC)
ManagementCommittee (MC)
Board
This slide is part of a presentation by Morgan Stanley and is intended to be viewed as part of that presentation. The presentation is based on information generally available to the public and does not contain any material, non-public information. The presentation has not been updated since it was originally presented.
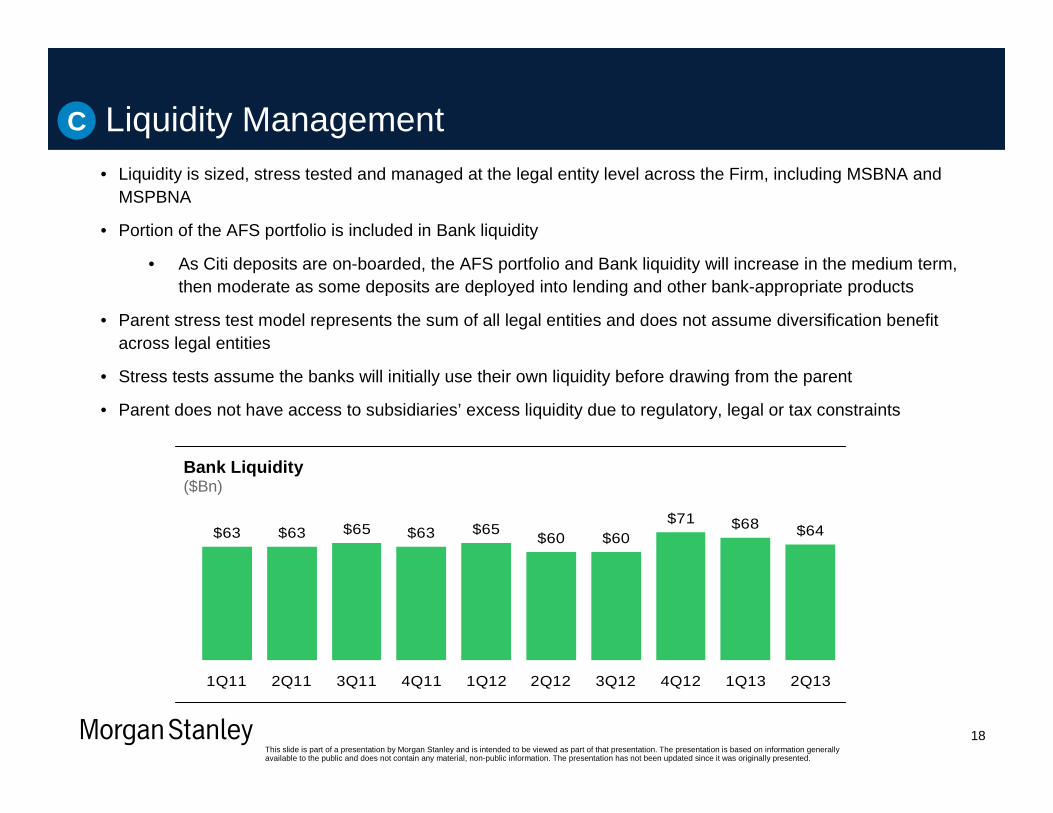
• Liquidity is sized, stress tested and managed at the legal entity level across the Firm, including MSBNA and MSPBNA
• Portion of the AFS portfolio is included in Bank liquidity
• As Citi deposits are on-boarded, the AFS portfolio and Bank liquidity will increase in the medium term, then moderate as some deposits are deployed into lending and other bank-appropriate products
• Parent stress test model represents the sum of all legal entities and does not assume diversification benefit across legal entities
• Stress tests assume the banks will initially use their own liquidity before drawing from the parent
• Parent does not have access to subsidiaries’ excess liquidity due to regulatory, legal or tax constraints
18
Liquidity Management
$63 $65 $63 $65$60 $60
$71 $68 $64$63
1Q11 2Q11 3Q11 4Q11 1Q12 2Q12 3Q12 4Q12 1Q13 2Q13
Bank Liquidity($Bn)
C

This slide is part of a presentation by Morgan Stanley and is intended to be viewed as part of that presentation. The presentation is based on information generally available to the public and does not contain any material, non-public information. The presentation has not been updated since it was originally presented.
19
Compliance Risk and Asset-Liability Management
• Both Banks have well established Asset-Liability management processes with Asset-Liability Committees that are charged with overseeing:
− Liquidity risk under normal and stressed operating environments, including maintenance of Contingency Funding and Liquidity Crisis Plans
− Capital planning and adequacy on a spot and forward looking basis
− Structural interest rate risk of each Bank
• Asset-Liability Management Metrics include:
– Liquidity gaps and liquidity ratios
– Capital levels and ratios
– Net interest income variability
– Investment portfolio size and composition
Asset-Liability Management
• Bank Compliance Committee oversees a compliance risk management program for identifying, assessing, measuring, monitoring, testing, mitigating and reporting on regulatory compliance risks
• Specific Committee responsibilities include:
– Promoting a strong “culture of compliance”
– Maintaining a risk-based compliance monitoring and testing program
– Overseeing the Bank Secrecy Act / Anti-Money Laundering Program
– Providing management with advice, guidance and training concerning laws, regulations and policies
– Maintaining an independent and effective compliance function
Compliance Risk Management
D E

This slide is part of a presentation by Morgan Stanley and is intended to be viewed as part of that presentation. The presentation is based on information generally available to the public and does not contain any material, non-public information. The presentation has not been updated since it was originally presented.
20
• NPA process is an essential control that helps ensure new products are properly evaluated before launch
• NPA process provides that:
– Adequate infrastructure is in place to support execution
– Risks are well understood, appropriate in size, and able to be monitored effectively
– Products under consideration conform with both regulatory and Bank control guidelines
– Products are suitable for intended client base
• Regular meetings between Bank Management Committees and their primary regulator to review existing and new businesses
• New products or material growth in pre-existing products must receive approval prior to launch
• The process considers:
– Product structure
– Control environment
– Governance
– Financial impact
• Bank Management Committees review and amend strategic plans
• Plans are reviewed by the Banks’ Board of Directors and primary regulator
• Plans examine current and forecasted financial results, product mix as well as associated capital and liquidity metrics
• Additionally, the Banks also participate in the Dodd-Frank Asset Stress Test (“DFAST”)
− DFAST is an annual stress test to ensure the Banks remain sustainable through hypothetical adverse economic scenarios
• Morgan Stanley continues to invest significantly in infrastructure to ensure appropriate controls
• These investments strengthen:
– Booking models
– Regulatory and operational support
– Anti-money laundering processes
– Model management
– Counterparty and credit risk processes
– Finance processing and improved valuation controls to produce required regulatory reporting
– Transfer pricing processes
Unanimous consent required from functional control areas, with no flexibility for business
unit override
The process is to help ensure new products do not
jeopardize the Banks’ safety or soundness
These planning activities help to ensure the Banks’ product
mix and financial performance are continuously
monitored and evaluated
These enhancements to controls and infrastructure at both the bank and Firm level
directly benefit the bank
New Product Approval (“NPA”)
Senior Management Review
Planning and Review Significant Investment
New Product ApprovalF

This slide is part of a presentation by Morgan Stanley and is intended to be viewed as part of that presentation. The presentation is based on information generally available to the public and does not contain any material, non-public information. The presentation has not been updated since it was originally presented.
Investment Banking• Leading Global Investment Banking practice• Leading M&A and Equity Underwriting franchises• Leveraging partnership with MUFG around the world• Building synergies and opportunities with Wealth
Management
Institutional Equities• Top 1-2 Equity Sales & Trading franchise globally• Leader in Cash Equities, strong position in
Derivatives, and leading player in Prime Brokerage• Significant investments in technology
– Hybrid voice and electronic model: client-centric, market-leading offering
– Market-leading content/insights, technology-enabledcustomized delivery
– Market access, service excellence and innovative solutions
We Benefit from Leading Franchises Across Institutional Securities Businesses: Technology is a Differentiator
21
Fixed Income & Commodities• Leading credit and mortgages franchises• Improved position in macro products, with upside
potential• Ongoing market share gains in electronic trading • Successfully building and investing in clearing • Executing on RWA reduction plan• Focus on ROE improvement and consistency
2
This slide is part of a presentation by Morgan Stanley and is intended to be viewed as part of that presentation. The presentation is based on information generally available to the public and does not contain any material, non-public information. The presentation has not been updated since it was originally presented.
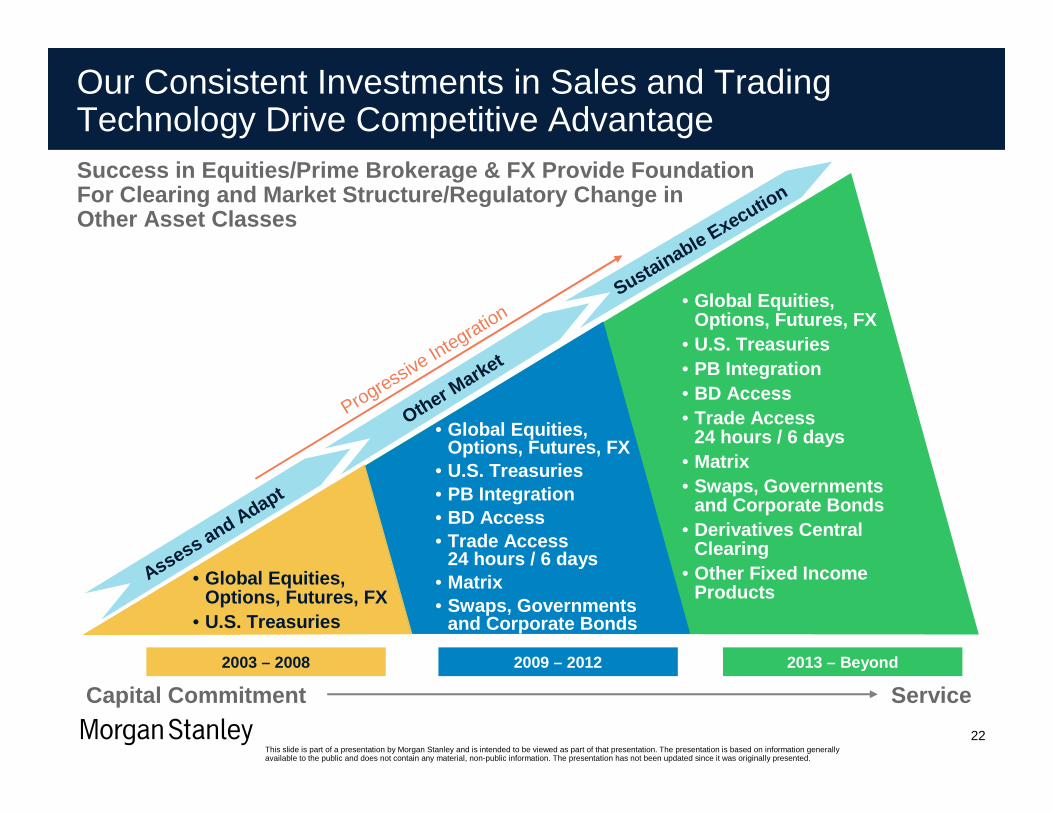
Our Consistent Investments in Sales and Trading Technology Drive Competitive AdvantageSuccess in Equities/Prime Brokerage & FX Provide Fo undationFor Clearing and Market Structure/Regulatory Change in Other Asset Classes
• Global Equities, Options, Futures, FX
• U.S. Treasuries• PB Integration• BD Access• Trade Access
24 hours / 6 days• Matrix• Swaps, Governments
and Corporate Bonds
• Global Equities, Options, Futures, FX
• U.S. Treasuries
• Global Equities, Options, Futures, FX
• U.S. Treasuries• PB Integration• BD Access• Trade Access
24 hours / 6 days• Matrix• Swaps, Governments
and Corporate Bonds• Derivatives Central
Clearing• Other Fixed Income
Products
Sustainable Execution
Other Market
Assess and Adapt
2003 – 2008 2009 – 2012 2013 – Beyond
22
Capital Commitment Service
Progressive Integration

This slide is part of a presentation by Morgan Stanley and is intended to be viewed as part of that presentation. The presentation is based on information generally available to the public and does not contain any material, non-public information. The presentation has not been updated since it was originally presented.
Our Technology Investments Well Recognized by 3rd Parties
23
(1) Euromoney magazine’s 2013 Awards for Excellence (July 2013)(2) WatersTechnology Rankings 2012(3) Absolute Return (February 2013)(4) Eurohedge (April 2013)(5) ISF Synthetic Survey (August 2012)(6) The Trade Asia
• Best Global Equity House for the 2nd time in three years (1)
• 2012 Best Full Service Brokerage with Matrix cited as a factor (2)
Overall
• 2012 Best Service to Leading and Large Clients (6)
• #1 Algorithmic Quality / #1 Client Service / #1 Dark Pools Strategy / #1 Liquidity Access/Smart Order Routing (7)
• 2012 Best Algo Product / Service category for NightOwl (8)
• 2012 #1 Algorithmic Provider for U.S. Clients (9)
• Top Broker for Cash Equity Trading in Europe in 1H13 (10)
Electronic Trading & Liquidity Sourcing
• 2011 & 2012 Sellside IT Dept of the Year; 2012 Best Broker for Market Structure/Execution Consulting (8)
• 2012 #1 in Anonymity / #1 in Execution Consistency (9)
• Matrix was the winner of the ‘Market Mover’award (11)
• Matrix ranked Best Research Platform (11)
Content Provider & Service
• #1 Prime Brokerage with the biggest share of business from new launches in the US (3)
• #1 sole new European Prime Brokerage mandates (4)
• #1 non-cash Prime Brokerage – most innovative synthetics provider (5)
Prime Brokerage & Clearing
(7) Thomson/Extel Europe 2013 Survey(8) Financial News(9) Global Algorithmic Trading Survey(10) Markit (July 2013)(11) Profit & Loss Magazine (May 2013)

This slide is part of a presentation by Morgan Stanley and is intended to be viewed as part of that presentation. The presentation is based on information generally available to the public and does not contain any material, non-public information. The presentation has not been updated since it was originally presented.
Morgan Stanley Electronic Trading: Benefitting From Long-Term Investments and Adaptation
24
Early StageEvolvingEvolved
FIDFXEquity Futures
Electronic Trading Evolution – Different Stages for Different Business Lines
• Clients transact directly via MS trading tools
• Cutting edge infrastructure
• Low latency market access
• Industry leading web portals
• 24 x 6 trading
• Real-time risk management
Morgan Stanley Electronic Trading Client Offerings
• Research / Ideas / Market Commentary
• Execution consultancy
• Real-time / Post-trade analytics
• Straight-through processing
• Optimized liquidity
• Trusted partner
Governments
• Commissions• Maker / Taker• Spread extraction / Market making
Revenue Opportunities
• Leveraging scale and flow• Integration with clients / Consulting / Service
This slide is part of a presentation by Morgan Stanley and is intended to be viewed as part of that presentation. The presentation is based on information generally available to the public and does not contain any material, non-public information. The presentation has not been updated since it was originally presented.
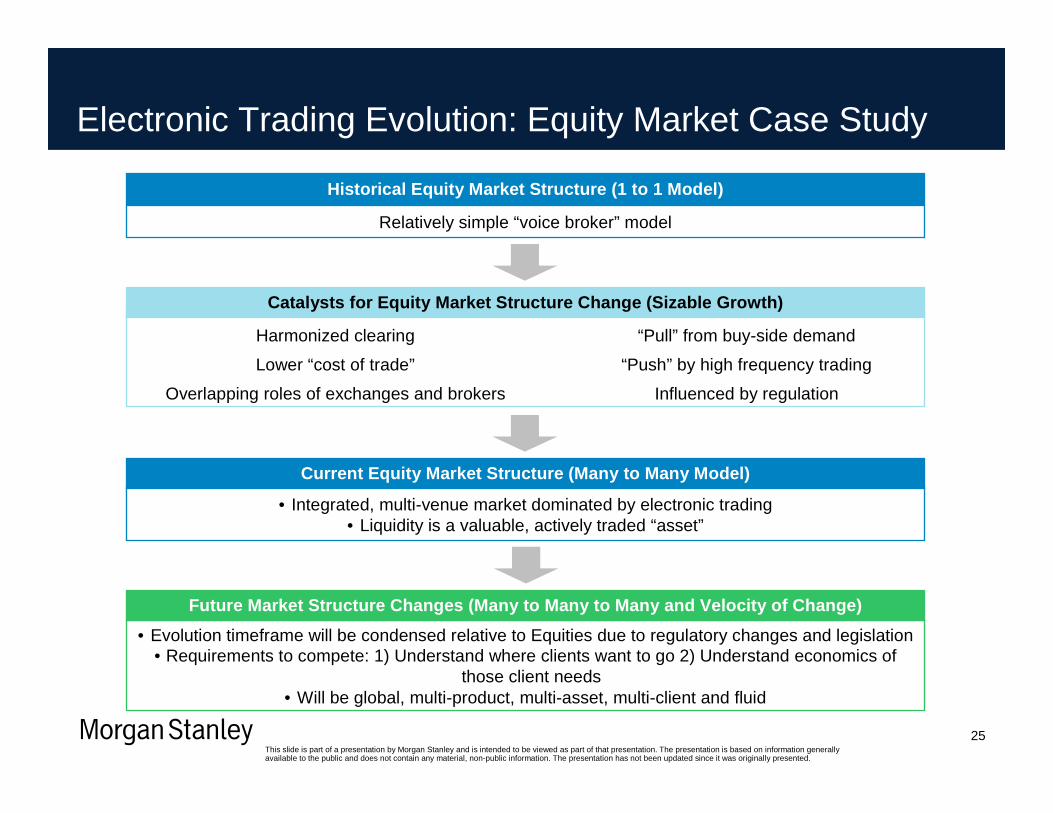
Electronic Trading Evolution: Equity Market Case Study
25
• Evolution timeframe will be condensed relative to Equities due to regulatory changes and legislation• Requirements to compete: 1) Understand where clients want to go 2) Understand economics of
those client needs • Will be global, multi-product, multi-asset, multi-client and fluid
Future Market Structure Changes (Many to Many to Ma ny and Velocity of Change)
• Integrated, multi-venue market dominated by electronic trading • Liquidity is a valuable, actively traded “asset”
Current Equity Market Structure (Many to Many Model )
Relatively simple “voice broker” model
Historical Equity Market Structure (1 to 1 Model)
Harmonized clearing
Lower “cost of trade”
Overlapping roles of exchanges and brokers
“Pull” from buy-side demand
“Push” by high frequency trading
Influenced by regulation
Catalysts for Equity Market Structure Change (Sizab le Growth)

This slide is part of a presentation by Morgan Stanley and is intended to be viewed as part of that presentation. The presentation is based on information generally available to the public and does not contain any material, non-public information. The presentation has not been updated since it was originally presented.
Building Blocks of an Electronic Trading Offering –Where are the Market Leaders?
26
Connectivity • Voice and e-mail information to clients
• Direct connection to clients own trading systems
• Connecting via multiple market platforms to satisfy client demand
Liquidity• Largely single sources (NYSE,
London Stock Exchange, etc.), screens and brokers own liquidity
• Multiple exchanges/sources of liquidity (ECN’s, dark pools, derivatives exchanges, etc.)
• Emerging market makers and rapid migrations of liquidity
Reach • OTC by nature, restricted
• Touching dozens of markets & over 100 venues with algorithmic capabilities
• Insight and partnership with clients in complex markets
Trust / Stability / Resiliency
• Voice based relationship
• Our infrastructure effectively becomes our clients’ infrastructure and must be reliable
• New market structures create new market dynamics and the platform must perform
Service Provision
• Confirms and paper reports• Clean, timely reporting, platform resiliency,
cross margining, cross connected businesses, embedded and trusted advisors
Research• Classic research report
distribution and client interaction by phone
• Fundamental logic and recommendation via predictive analytics
• More sophisticated interactive analytical tools
Old Paradigm Present / Future ParadigmEquities /
Fixed Income
Where are Market
Leaders?
Eq
Eq
Eq
Eq
Eq
Eq
FI
FI
FI
FI
FI
FI
We Believe We Lead or Are a Leader in All Categorie s
This slide is part of a presentation by Morgan Stanley and is intended to be viewed as part of that presentation. The presentation is based on information generally available to the public and does not contain any material, non-public information. The presentation has not been updated since it was originally presented.
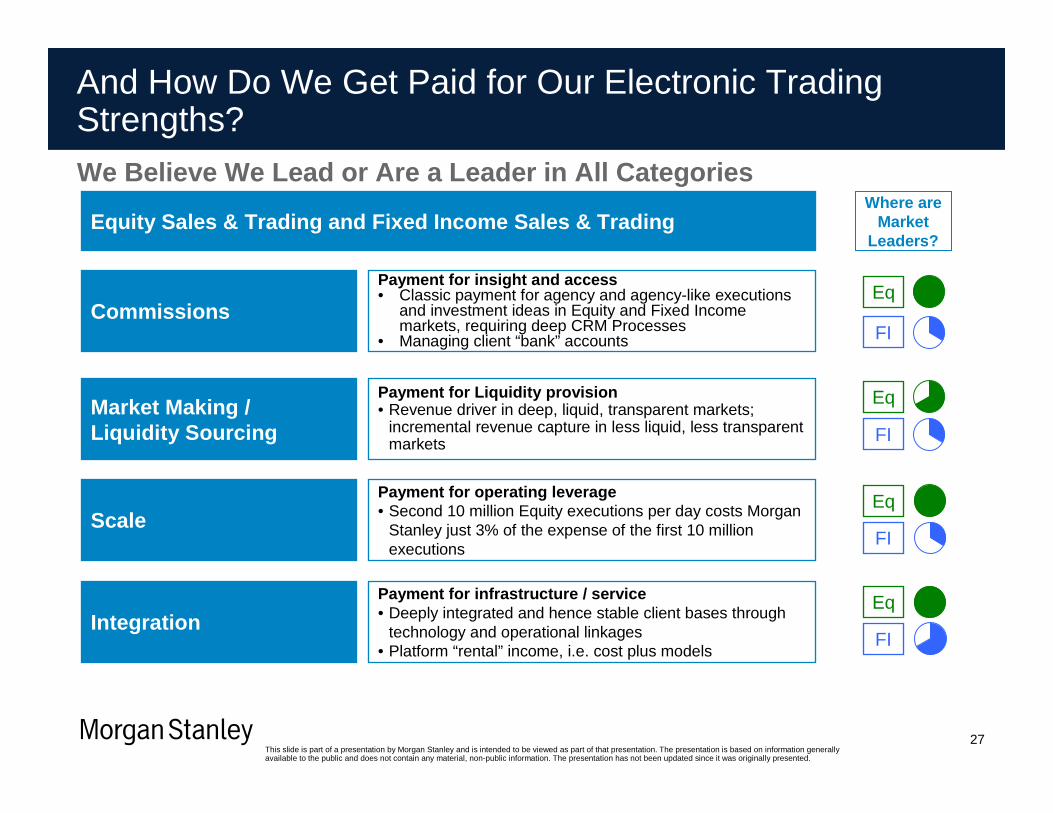
And How Do We Get Paid for Our Electronic Trading Strengths?
27
Equity Sales & Trading and Fixed Income Sales & Tra dingWhere are
Market Leaders?
Commissions
Payment for insight and access• Classic payment for agency and agency-like executions
and investment ideas in Equity and Fixed Income markets, requiring deep CRM Processes
• Managing client “bank” accounts
Eq
FI
Market Making / Liquidity Sourcing
Payment for Liquidity provision• Revenue driver in deep, liquid, transparent markets;
incremental revenue capture in less liquid, less transparent markets
Eq
FI
ScalePayment for operating leverage• Second 10 million Equity executions per day costs Morgan
Stanley just 3% of the expense of the first 10 million executions
Eq
FI
IntegrationPayment for infrastructure / service• Deeply integrated and hence stable client bases through
technology and operational linkages• Platform “rental” income, i.e. cost plus models
Eq
FI
We Believe We Lead or Are a Leader in All Categorie s

This slide is part of a presentation by Morgan Stanley and is intended to be viewed as part of that presentation. The presentation is based on information generally available to the public and does not contain any material, non-public information. The presentation has not been updated since it was originally presented.
Morgan Stanley OTC Clearing: Foundation of Over 15 Years of Clearing and Technology Investments
28
• Offering is logical progression of years of investments in all areas of sales & trading technology
• With the phase-in of mandatory clearing in 2013, there has been a significant increase in activity
• Three categories of mandatory clearing phase-in for certain interest rate swaps and CDX indices
− First two categories in March and June executed smoothly without disrupting market activity
Morgan Stanley embraced Central Clearing early and m ade a significant investment in our offering: client activity began in 2009 with a gradual increase throughout 2012
Category 1 Mandate
March 11, 2013
Category 2 Mandate
June 10, 2013
Sept. 9, 2013
Clearing Determination Rule Published
December 13, 2012
New Settlement Platform basis for Stock Settlement
Platform
~2000
Listed Derivatives Clearing & Settlement
Investment
~2001
Continuing Prime Brokerage Investment
Pre - 2000
Matrix Investment
~2008
Category 3 MandateSignificant Reinvestment in Prime
Brokerage Platform
~2009
Select Technology Investments

This slide is part of a presentation by Morgan Stanley and is intended to be viewed as part of that presentation. The presentation is based on information generally available to the public and does not contain any material, non-public information. The presentation has not been updated since it was originally presented.
Our leading Prime Brokerage platform provides the f oundation for the client service and technology required by our OTC C learing clients
29
Our Leading Prime Brokerage Offering Provides Foundation for OTC Clearing
Prime Brokerage Clearing
Robust post-trade infrastructure for settling and clearing high volume trades
Global reach of access to clearinghouses across regions and products
Integrated client-service for all cleared products
Cross-asset and cross-product portfolio margining capabilities
Deep value-added client consulting expertise
Best-in-class proprietary technology for client reporting and reconciliation
Fixed Income Markets evolving like Equities: Across execution, clearing and settlement –different clients will have different needs but bei ng able to manage across the entire
service and technology spectrum will be a critical differentiator
This slide is part of a presentation by Morgan Stanley and is intended to be viewed as part of that presentation. The presentation is based on information generally available to the public and does not contain any material, non-public information. The presentation has not been updated since it was originally presented.
30
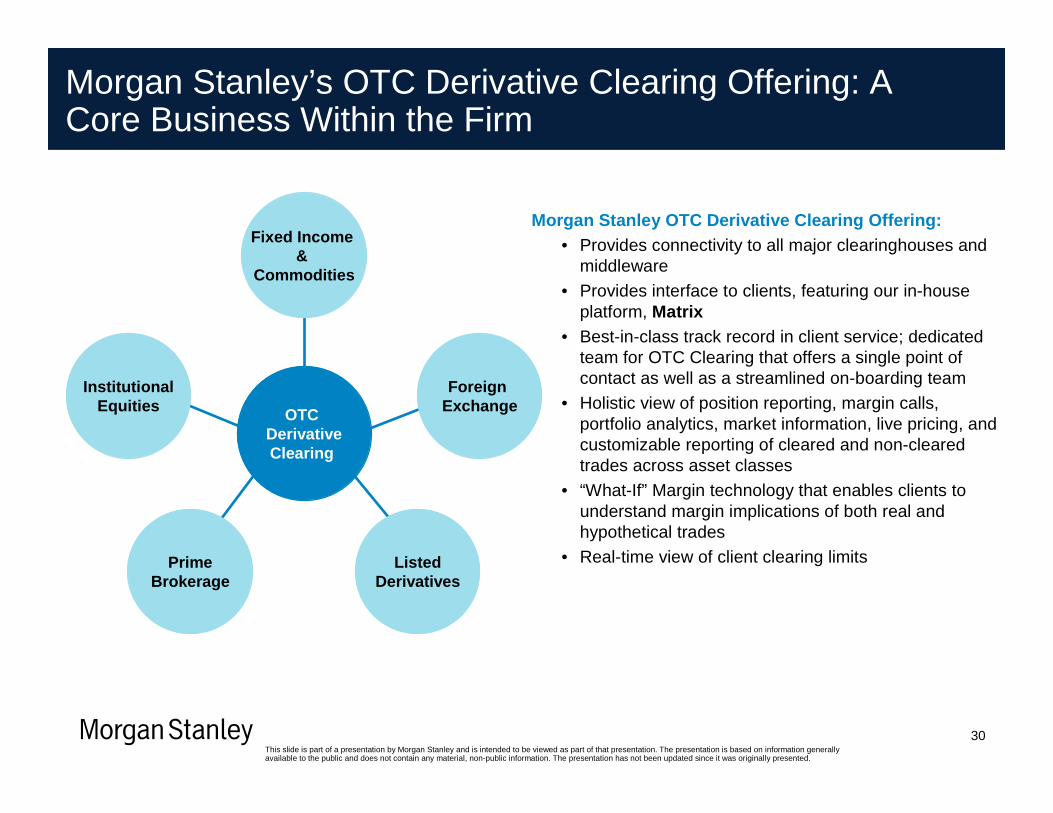
Morgan Stanley’s OTC Derivative Clearing Offering: A Core Business Within the Firm
Morgan Stanley OTC Derivative Clearing Offering:• Provides connectivity to all major clearinghouses and
middleware• Provides interface to clients, featuring our in-house
platform, Matrix• Best-in-class track record in client service; dedicated
team for OTC Clearing that offers a single point of contact as well as a streamlined on-boarding team
• Holistic view of position reporting, margin calls, portfolio analytics, market information, live pricing, and customizable reporting of cleared and non-cleared trades across asset classes
• “What-If” Margin technology that enables clients to understand margin implications of both real and hypothetical trades
• Real-time view of client clearing limits
OTC DerivativeClearing
Fixed Income &
Commodities
ListedDerivatives
PrimeBrokerage
InstitutionalEquities
Foreign Exchange

This slide is part of a presentation by Morgan Stanley and is intended to be viewed as part of that presentation. The presentation is based on information generally available to the public and does not contain any material, non-public information. The presentation has not been updated since it was originally presented.
31
Conclusion
Strong Capital and Liquidity
Differentiated Bank with Clear and Prudent Growth Strategy
Technology Investments Accretive to Firm and Important Contributor to the Upside in Fixed Income
Leading Global Franchises with Greater Revenue Stability

This slide is part of a presentation by Morgan Stanley and is intended to be viewed as part of that presentation. The presentation is based on information generally available to the public and does not contain any material, non-public information. The presentation has not been updated since it was originally presented.
Barclays Capital Financial Services Conference
Ruth Porat, Executive Vice President andChief Financial Officer
September 10, 2013