barclays capital 2012 global healthcare conference
TRANSCRIPT

March 14, 2012
Miami Beach, FL
Barclays Capital 2012
Global Healthcare Conference

2
This slide presentation contains forward-looking
statements which are subject to change based on
various important factors, including without limitation,
competitive actions in the marketplace and adverse
actions of governmental and other third-party payors.
Actual results could differ materially from those
suggested by these forward-looking statements.
Further information on potential factors that could
affect the Company’s financial results is included in the
Company’s Form 10-K for the year ended December
31, 2011, and subsequent SEC filings.
Forward Looking Statement

Introduction
Leading National Lab Provider • Fastest growing national lab
• $55 billion market
• Clinical, Anatomic and Genomic Testing
• Serving clients in all 50 states and Canada
• Foremost worldwide clinical trials testing business
3

Introduction
4

Valuable Service • Small component of total cost
influences large percentage
of clinical decisions
• Screening, early detection,
and monitoring reduce
downstream costs
• Companion diagnostics
improve drug efficacy and
safety
Attractive Market
5

Attractive Market
Growth Drivers • Aging population
• Industry consolidation
• Advances in genomics
• Pharmacogenomics/
companion diagnostics
• Cost pressures will reward
lower cost and more
efficient labs
Source: CDC National Ambulatory Medical Care Survey and Company Estimates
6

55%
12%
10%
4%
19%
Hosiptal Affiliated
Quest
LabCorp
Physician Office
Other Independent
Hospital Affiliated
Attractive Market
Opportunity to Take Share • Approximately 5,000
independent labs
• Less efficient, higher cost
competitors
Source: Washington G-2 Reports and Company estimates
$55 Billion US Lab Market
7

Attractive Market
Diversified Payor Mix • No customer > 10% of revenue
• Limited government exposure
8
LabCorp U.S. Payor
Mix % of revenue, 2011

Attractive Market
Diversified Test Mix With acquisition of former
Genzyme GeneticsSM* business,
esoteric testing comprises
approximately 40% of revenue
*GENZYME GENETICSSM and its logo are trademarks of Genzyme Corporation and used by Esoterix Genetic Laboratories, LLC, a
wholly-owned subsidiary of LabCorp, under license. Esoterix Genetic Laboratories and LabCorp are operated independently from
Genzyme Corporation.
9
LabCorp U.S. Test Mix
% of revenue, 2011
Mission StatementFive Pillar Strategy
We Will Offer The Highest Quality Laboratory Testing and Most Compelling Value to Our Customers
We Will Execute This Mission Through
Our Five Pillar Strategy
10

Five Pillar Strategy
Pillar One
Deploy Cash to Enhance
Footprint and Test Menu
and to Buy Shares
11

$445
$564 $538 $574
$632
$710
$781
$862 $884 $905
$371
$481 $443
$481 $516
$567 $624
$748 $758 $759
$-
$200
$400
$600
$800
$1,000
2002 2003 2004 2005 2006 2007 2008 2009 2010 2011
$ M
illio
ns
Operating Cash Flow Free Cash Flow
Five Pillar Strategy—Pillar One
Strong Cash Generation
Cash Flow• FCF CAGR of 12.8% from 2001 - 2011
• Strategic acquisitions
• $3.9 B share repurchase since 2004 at an average price of approximately $65 per share
Note: 2011 Operating Cash Flow and Free Cash Flow figures above do not include the $49.5 million Hunter Labs settlement
Free Cash Flow is a non-GAAP metric (see reconciliation of non-GAAP Financial Measures included herein)
Free Cash Flow CAGR calculation uses 2001 data (Operating Cash Flow of $316 million and Free Cash Flow of $228 million)
$ in millions12

Five Pillar Strategy—Pillar One
Impressive FCF Per Share Trend
Free Cash Flow Per Share• FCF Per Share CAGR of 16.8% from 2001 – 2011
13
$2.40
$3.11 $2.94
$3.32
$3.83
$4.68
$5.58
$6.85 $7.19
$7.46
$0.00
$1.00
$2.00
$3.00
$4.00
$5.00
$6.00
$7.00
$8.00
2002 2003 2004 2005 2006 2007 2008 2009 2010 2011
Note: 2011 Free Cash Flow Per Share calculation above does not include the $49.5 million Hunter Labs settlement
Free Cash Flow Per Share is a non-GAAP metric (see reconciliation of non-GAAP Financial Measures included herein)
Free Cash Flow Per Share CAGR calculation uses 2001 data (2001 Free Cash Flow Per Share was $1.58)
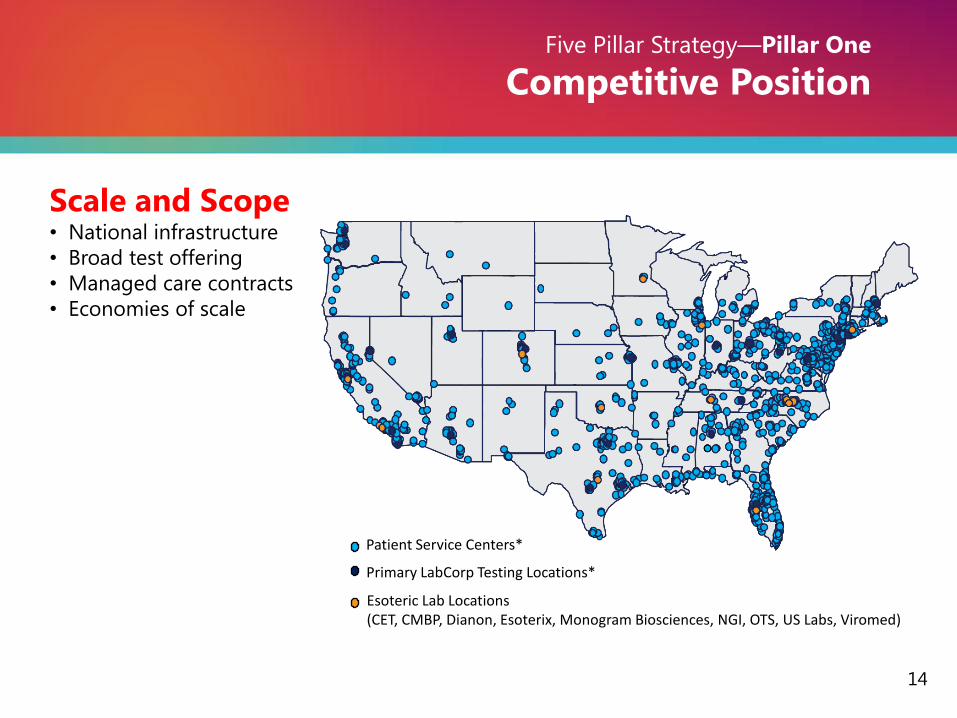
Five Pillar Strategy—Pillar One
Competitive Position
Scale and Scope • National infrastructure
• Broad test offering
• Managed care contracts
• Economies of scale
Primary LabCorp Testing Locations*
Esoteric Lab Locations(CET, CMBP, Dianon, Esoterix, Monogram Biosciences, NGI, OTS, US Labs, Viromed)
Patient Service Centers*
14

Five Pillar Strategy—Pillar One
Key Uses of Cash
Key Uses of Cash • Acquisitions
• Genzyme Genetics
• Westcliff (LabWest, Inc)
• DCL
• Orchid Cellmark
• Share Repurchase
• $337 million in 2010
• $650 million in 2011
15

Five Pillar Strategy—Pillar One
Genzyme Genetics Rebranding
Two new names in specialized testing• As part of a broad rebranding of LabCorp’s specialty testing capabilities, we
adopted the name Integrated Genetics for the reproductive portion of the
Genzyme Genetics business and LabCorp’s legacy genetics business.
• We adopted the name Integrated Oncology for the oncology portion of the
Genzyme Genetics business and LabCorp’s legacy oncology business.
16

Five Pillar Strategy—Pillar One
Importance of Genetics
17
• Preconception
• Pre- and post-natal
• Identification of disease carriers
• Identification of disease predisposition
• Diagnosis of genetically caused or
influenced conditions
(e.g., developmental delay)
• Disease prognosis and treatment
(especially cancer)

• More sophisticated methods of cancer
testing complement traditional biopsies
• Value of diagnostics for disease
prognosis, and monitoring of
progression and recurrence
• Critical role of testing in therapy
selection
Five Pillar Strategy—Pillar One
Importance of Oncology
18

Five Pillar Strategy
Pillar Two
Enhance IT Capabilities
To Improve Physician
and Patient Experience
19

Five Pillar Strategy—Pillar Two
LabCorp Beacon™ | Physician Experience
Intuitive Order Entry• Streamlined ordering
Provider, Diagnosis, Test and
Collection information are all
displayed in a single screen
• Requisition and account logic
Automatically generates requisitions
with appropriate account numbers
• Key time-saving features
• Send to PSC
• Standing orders
• Electronic add-on testing
• User-defined pick lists
20

Unified Results• Centralizes lab connectivity
View lab reports from DIANON
Systems, Esoterix, LabCorp,
Litholink, US Labs, and CMBP
• Share results
Email, fax, print and annotations
make it easy to share critical
information
• Visual cues
Supports physician decision
making, enhances the timeliness
of patient care and facilitates
follow-up with abnormal results in
red and unread reports in bold
Five Pillar Strategy—Pillar Two
LabCorp Beacon™ | Physician Experience
21

Trends & Analytics• One-click trending
Physicians and staff can quickly
view a single test or analyte for
one patient and the trended
history for that patient
• Sort and filter results
Providers can filter their entire
patient population on
demographics and test results to
identify trends and patients at risk
• View lab history
Five Pillar Strategy—Pillar Two
LabCorp Beacon™ | Physician Experience
22

AccuDraw Integration• Reduce errors
• Reduce training time
• Proven results
Success in LabCorp Patient Service
Centers will be extended to
customers
Online Appointment
Scheduling• Patient convenience
• Improved service experience
• 2011 enhancements improve the
collection of payment at the time
of scheduling
Five Pillar Strategy—Pillar Two
LabCorp Beacon™ | Patient Experience
23
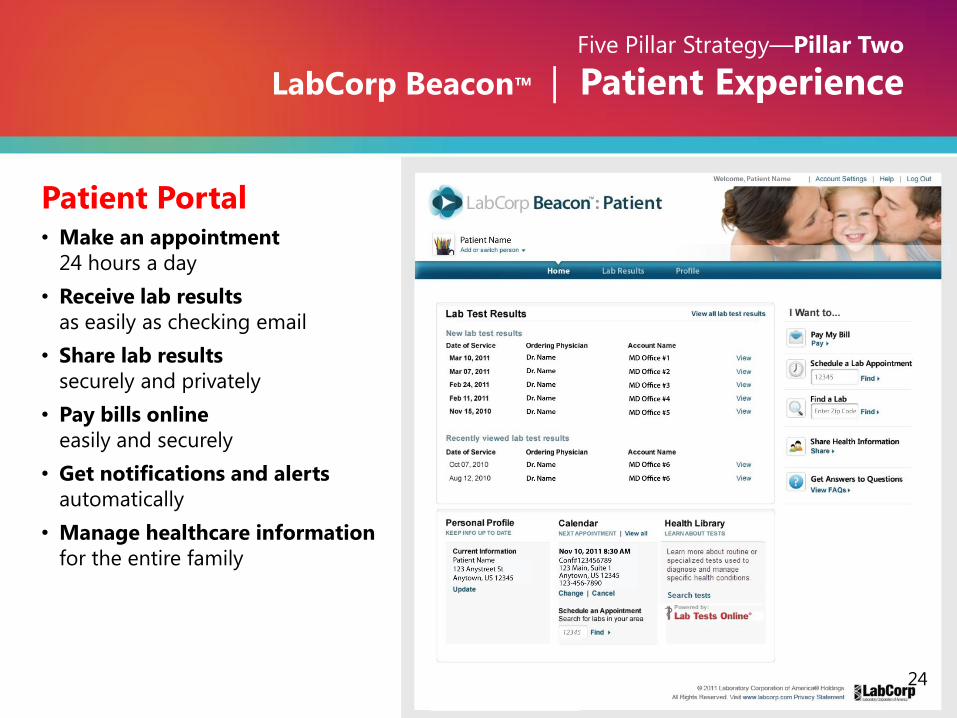
Patient Portal• Make an appointment
24 hours a day
• Receive lab results
as easily as checking email
• Share lab results
securely and privately
• Pay bills online
easily and securely
• Get notifications and alerts
automatically
• Manage healthcare information
for the entire family
Five Pillar Strategy—Pillar Two
LabCorp Beacon™ | Patient Experience
24

Five Pillar Strategy
Pillar Three
Continue to Improve Efficiency to
Offer the Most Compelling Value in
Laboratory Services
25
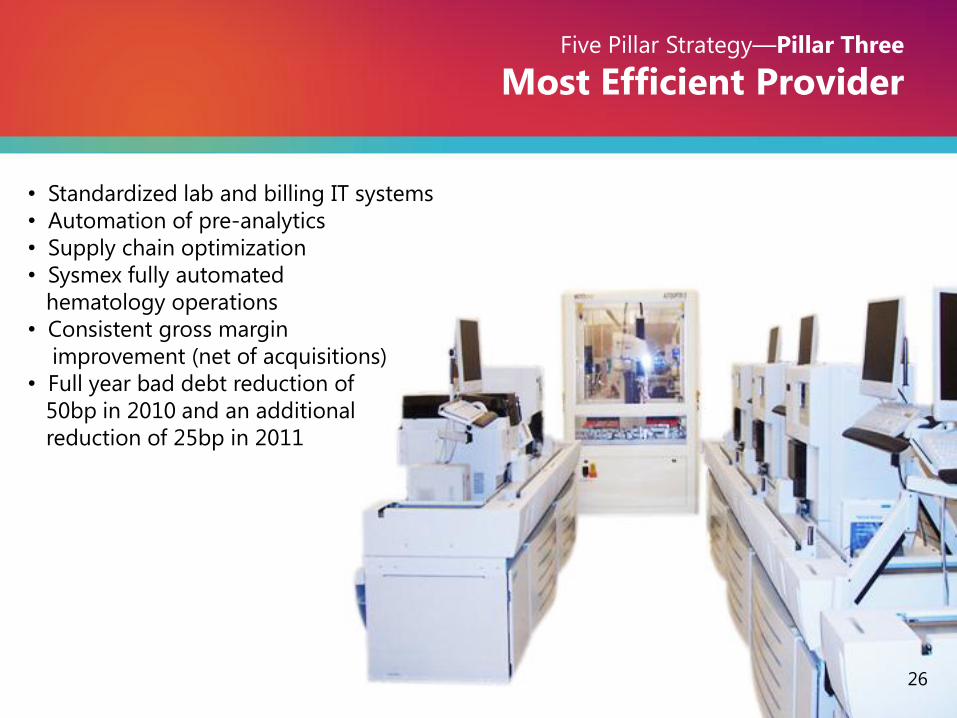
• Standardized lab and billing IT systems
• Automation of pre-analytics
• Supply chain optimization
• Sysmex fully automated
hematology operations
• Consistent gross margin
improvement (net of acquisitions)
• Full year bad debt reduction of
50bp in 2010 and an additional
reduction of 25bp in 2011
Five Pillar Strategy—Pillar Three
Most Efficient Provider
26

Five Pillar Strategy
Pillar Four
Scientific Innovation
At Appropriate Pricing
27

Partner Clinical Area
Abbott Lung Cancer (XALKORI)
ARCA biopharma Companion Diagnostics (Cardiovascular Disease)
BG Medicine Cardiovascular Disease
Duke University Joint Venture in biomarker development
Duke University Lung Cancer
Fujirebio and Abbott Ovarian Cancer (ROMA)
Intema Ltd. Prenatal Testing
Johns Hopkins Melanoma
MDxHealth Companion Diagnostics (Oncology)
Medco Health Solutions Companion Diagnostics (Research)
Merck Companion Diagnostics (Infectious Disease)
Roche Melanoma (Zelboraf)
University of Minnesota Lupus
Veridex Prostate Cancer
Yale University Ovarian Cancer (exclusive)
Five Pillar Strategy—Pillar Four
Scientific Innovation
• Introduction of new tests
• Acquisitions and licensing
• Collaborations with leading
companies and academic
institutions
28

FDA approves Zelboraf and companion diagnostic
test for late-stage skin cancer“This has been an important year for patients with late-stage melanoma. Zelboraf is the
second new cancer drug approved that demonstrates an improvement in overall survival,”
Richard Pazdur, M.D., director of the Office of Oncology Drug Products in the FDA’s
Center for Drug Evaluation and Research.
FDA approves Xalkori with companion diagnostic
for a type of late-stage lung cancer“The approval of Xalkori with a specific test allows the selection of patients who are
more likely to respond to the drug. Targeted therapies such as Xalkori are important
options for treating patients with this disease and may ultimately result in fewer side
effects.”
Richard Pazdur, M.D., director of the Office of Oncology Drug Products in the FDA’s
Center for Drug Evaluation and Research.
FDA clears HE4 test in ROMA for ovarian
malignancy risk"Using ROMA with HE4 and CA 125 significantly improves our ability to identify women
who are at high or low likelihood of ovarian cancer when they present with an ovarian cyst
or mass,"
Richard Moore, MD, associate professor of Obstetrics and Gynecology at the Alpert
School of Medicine at Brown University and director of the Center for Biomarkers and
Emerging Technologies in the Program for Women's Oncology at Women and Infants'
Hospital (Providence, Rhode Island).
Five Pillar Strategy—Pillar Four
Scientific Innovation
• Companion diagnostics and
personalized medicine• IL-28B
• BRAF V600E metastatic melanoma (Zelboraf)
• Vysis ALK Break Apart FISH probe (XALKORI)
• K-RAS
• HLA-B* 5701
• EGFR Mutation Analysis
• HCV GenoSure® NS3/4A
• PhenoSense®, PhenoSense GT®
• HERmark®
• CYP 450 2C19
• Women’s health• ROMA
• Nuswab STD testing on a single swab
• Expanded Vaginosis and Candida testing
• Expanded options for HPV DNA testing
• Outcome improvement programs• CKD and CVD programs
• Litholink kidney stone program
• Bone (osteoporosis) program
• Clearstone acquisition• Global clinical trials capability
• Presence in China29

Five Pillar Strategy
Pillar Five
Alternative Delivery Models
30

$4,068
$4,513 $4,695
$5,004
$5,542
$4.45
$4.91
$5.24
$5.98
$6.37
2007 2008 2009 2010 2011
Revenue ($mil) Adjusted EPS Excluding Amortization
(1) Excluding the $0.25 per diluted share impact of restructuring and other special charges and the $0.27 per diluted share impact from amortization in 2007;
excluding the $0.44 per diluted share impact of restructuring and other special charges and the $0.31 per diluted share impact from amortization in 2008;
excluding the ($0.09) per diluted share impact of restructuring and other special charges and the $0.35 per diluted share impact from amortization in 2009;
excluding the $0.26 per diluted share impact of restructuring and other special charges and the $0.43 per diluted share impact from amortization in 2010;
excluding the $.72 per diluted share impact of restructuring and other special charges, the $0.03 per diluted share impact from a loss on the divestiture of assets
and the $0.51 per diluted share impact from amortization in 2011
(2) EPS, as presented represents adjusted, non-GAAP financial measures. Diluted EPS, as reported in the Company’s Annual Report were: $2.45 in 2004; $2.71 in
2005; $3.24 in 2006; $3.93 in 2007; $4.16 in 2008; $4.98 in 2009; $5.29 in 2010; and $5.11 in 2011
(3) 2008 revenue includes a $7.5 million adjustment related to the Company’s acquisition of U.S. Labs
Excellent Performance
31
Revenue and Adjusted EPS Excluding Amortization Growth: 2007 – 2011 (1) (2) (3)

Recent Accomplishments
Our Results • Profitable growth and capital deployment
• Esoteric growth
• Maintained price
• Acquisitions
• Improved IT and client connectivity
• Beacon order entry rollout
• Introduced LabCorp Patient Portal
• Enhanced physician and patient experience
• Continued efficiency programs
• Increased throughput
(specimens per employee up 40% since 2007)
• Call center consolidation
• Lowered bad debt
• Furthered scientific leadership
• Clearstone acquisition
• IL-28B
• New offerings in Women’s Health
and companion diagnostics
• Extended UnitedHealthcare contract through
the end of 201832

2012 Priorities
Our Focus • Pillar One – Cash Deployment
• Genzyme Genetics integration
• Accretive acquisitions
• Repurchase shares
• Pillar Two – Enhance IT Capabilities
• Expand Beacon functionality
• Deploy Patient Portal nationally
• Pillar Three – Improve Efficiency
• Complete Touch/Accudraw implementation
• Complete Burlington lab expansion
• Facility rationalization
• Pillar Four – Scientific Leadership
• Enhance scientific leadership
• Introduce new companion diagnostics and
personalized medicine offerings
• Grow clinical trials business
• Pillar Five – Alternative Models
• Explore alternative delivery models
• Broaden relationships with managed care
33

Note: During both the first quarter of 2010 and the first quarter of 2011, inclement weather reduced Adjusted EPS Excluding Amortization by
approximately eight cents
Fourth Quarter And Full Year 2011 Results
34
Three Months Ended Dec 31, Twelve Months Ended Dec 31,
2011 2010 +/(-) 2011 2010 +/(-)
Revenue $ 1,366.1 $ 1,295.4 5.5% $ 5,542.3 $ 5,003.9 10.8%
Adjusted Operating Income (1) $ 258.0 $ 252.4 2.2% $ 1,064.9 $ 1,016.5 4.8%
Adjusted Operating Income Margin (1) 18.9% 19.5% -60 bp 19.2% 20.3% -110 bp
Adjusted EPS Excluding Amortization (1) $ 1.56 $ 1.46 6.8% $ 6.37 $ 5.98 6.5%
Operating Cash Flow $ 278.6 $ 259.2 7.5% $ 855.6 $ 883.6 -3.2%
Less: Capital Expenditures $ (30.1) $ (32.8) -8.2% $ (145.7) $ (126.1) 15.5%
Free Cash Flow $ 248.5 $ 226.4 9.8% $ 709.9 $ 757.5 -6.3%
(1) See Reconciliation of non-GAAP Financial Measures (included herein)
(2) Operating Cash Flow was reduced by $49.5 million as a result of the Hunter Labs settlement
Operating Cash Flow $ 855.6
Hunter Labs settlement $ 49.5
Adjusted Operating Cash Flow $ 905.1

Key Points• Critical position in health care delivery system
• Attractive market
• Consistent strategy
• Excellent cash flow deployed to enhance
strong competitive position
• IT innovation to improve physician and
patient experience
• Most efficient provider delivering greatest
value
• Scientific leadership
• Alternative delivery models
• Track record of execution and success
Conclusion
35

36
Reconciliation of non-GAAP Financial Measures
Reconciliation of non-GAAP Financial Measures
(In millions, except per share data)
Three Months Ended Dec 31,
Adjusted Operating Income 2011 2010
Operating income $ 247.4 $ 238.8
Restructuring and other special charges (1) (3) 10.6 13.6
Adjusted operating income $ 258.0 $ 252.4
Adjusted EPS Excluding Amortization
Diluted earnings per common share $ 1.34 $ 1.26
Impact of restructuring and other special charges (1) (3) 0.06 0.08
Loss on divestiture of assets (2) 0.03 -
Amortization expense 0.13 0.12
Adjusted EPS Excluding Amortization (4) $ 1.56 $ 1.46
Note: Please see footnotes for this reconciliation on slide 10

37
Reconciliation of non-GAAP Financial Measures
Reconciliation of non-GAAP Financial Measures
(In millions, except per share data)
Twelve Months Ended Dec 31,
Adjusted Operating Income 2011 2010
Operating income $ 948.4 $ 978.8
Restructuring and other special charges (1) (3) 116.5 37.7
Adjusted operating income $ 1,064.9 $ 1,016.5
Adjusted EPS Excluding Amortization
Diluted earnings per common share $ 5.11 $ 5.29
Impact of restructuring and other special charges (1) (3) 0.72 0.26
Loss on divestiture of assets (2) 0.03 -
Amortization expense 0.51 0.43
Adjusted EPS Excluding Amortization (4) $ 6.37 $ 5.98
Note: Please see footnotes for this reconciliation on slide 10

38
Reconciliation of non-GAAP Financial Measures - Footnotes
Note: GENZYME GENETICS and its logo are trademarks of Genzyme Corporation and used by Esoterix Genetic Laboratories, LLC, a wholly-owned subsidiary of LabCorp, under license. Esoterix
Genetic Laboratories and LabCorp are operated independently from Genzyme Corporation.
1) During the fourth quarter of 2011, the Company recorded net restructuring and other special charges of $10.6 million, consisting of $6.3 million in severance related
liabilities and $1.7 million in net facility-related costs primarily associated with integration of the Orchid Cellmark and Genzyme Genetics acquisitions as well as
internal cost reduction initiatives. The charges also included a $2.6 million write-off of an uncollectible receivable from a past installment sale of one of the
Company’s lab operations. The after tax impact of these charges decreased net earnings for the three months ended December 31, 2011, by $6.5 million and diluted
earnings per share by $0.06 ($6.5 million divided by 101.0 million shares).
During the first nine months of 2011, the Company recorded restructuring and other special charges of $105.9 million ($66.3 million after tax). The restructuring
charges included $18.8 million in net severance and other personnel costs along with $36.7 million in net facility-related costs primarily associated with the ongoing
integration of the Clearstone, Genzyme Genetics and Westcliff acquisitions. The special charges also included $34.5 million ($49.5 million, net of previously
recorded reserves of $15.0 million) relating to the settlement of the Hunter Labs litigation in California, along with $1.1 million for legal costs associated with the
planned acquisition of Orchid Cellmark incurred during the second quarter of 2011, both of which were recorded in Selling, General and Administrative Expenses in
the Company’s Consolidated Statements of Operations. The charges also included a $14.8 million write-off of an investment made in a prior year.
For the year ended December 31, 2011, the after tax impact of these combined charges of $116.5 million decreased net earnings by $73.3 million and diluted
earnings per share by $0.72 ($73.3 million divided by 101.8 million shares).
2) Following the closing of its acquisition of Orchid Cellmark Inc. (“Orchid”) in mid-December, the Company recorded a net $2.8 million loss on its divestiture of
certain assets of Orchid’s U.S. government paternity business, under the terms of the agreement reached with the U.S. Federal Trade Commission. This non-
deductible loss on disposal was recorded in Other Income and Expense in the Company’s Consolidated Statements of Operations and decreased net earnings for the
three and twelve months ended December 31, 2011, by $2.8 million and diluted earnings per share by $0.03 ($2.8 million divided by 101.0 million shares and $2.8
million divided by 101.8 million shares, respectively).
3) During the fourth quarter of 2010, the Company recorded restructuring and other special charges of $13.6 million, consisting of $14.8 million in professional fees
and expenses associated with acquisitions, which are recorded in Selling, General and Administrative Expenses in the Company’s Consolidated Statements of
Operations; offset by a net restructuring credit of $1.2 million, resulting from the reversal of unused severance and facility closure liabilities. The after tax impact of
these charges decreased net earnings for the three months ended December 31, 2010, by $8.3 million and diluted earnings per share by $0.08 ($8.3 mill ion divided
by 104.5 million shares).
During the first nine months of 2010, the Company recorded restructuring and other special charges of $31.1 million ($19.1 million after tax), consisting of $10.9
million in professional fees and expenses associated with acquisitions; $7.0 million bridge financing fees (recorded as interest expense) associated with the signing of
an asset purchase agreement for Genzyme Genetics; and $13.2 million severance related liabilities associated with workforce reduction initiatives
For the year ended December 31, 2010, the after tax impact of these combined charges of $44.7 million decreased net earnings by $27.4 million and diluted earnings
per share by $0.26 ($27.4 million divided by 105.4 million shares).
4) The Company continues to grow its business through acquisitions and uses Adjusted EPS Excluding Amortization as a measure of operational performance, growth
and shareholder returns. The Company believes adjusting EPS for amortization will provide investors with better insight into the operating performance of the
business. For the quarters ended December 31, 2011 and 2010, intangible amortization was $21.2 million and $19.6 million, respectively ($12.9 million and $12.0
million net of tax, respectively) and decreased EPS by $0.13 ($12.9 million divided by 101.0 million shares) and $0.12 ($12.0 million divided by 104.5 million
shares), respectively. For the years ended December 31, 2011 and 2010, intangible amortization was $85.8 million and $72.7 million respectively ($52.4 million and
$44.5 million net of tax, respectively) and decreased EPS by $0.51 ($52.4 million divided by 101.8 million shares) and $0.43 ($44.5 million divided by 105.4 million
shares), respectively.

39
Reconciliation of Free Cash Flow and Free Cash Flow Per Share
(1) 2011 cash flows from operations excludes the $49.5 million Hunter Labs settlement payment
(2) Free cash flow represents cash flows from operations less capital expenditures
(3) Free cash flow per share represents free cash flow divided by the weighted average diluted shares outstanding at the end of each period presented
Reconciliation of non-GAAP Financial Measures
(In millions, except per share data)
2011 2010 2009 2008 2007 2006 2005 2004 2003 2002
Cash flows from operations1 $ 905.1 $ 883.6 $ 862.4 $ 780.9 $ 709.7 $ 632.3 $ 574.2 $ 538.1 $ 564.3 $ 444.9
Capital expenditures (145.7) (126.1) (114.7) (156.7) (142.6) (115.9) (93.6) (95.0) (83.6) (74.3)
Free cash flow2 759.4 757.5 747.7 624.2 567.1 516.4 480.6 443.1 480.7 370.6
Weighted average diluted shares outstanding 101.8 105.4 109.1 111.8 121.3 134.7 144.9 150.7 154.7 154.2
Free cash flow per share3 $ 7.46 $ 7.19 $ 6.85 $ 5.58 $ 4.68 $ 3.83 $ 3.32 $ 2.94 $ 3.11 $ 2.40

Supplemental Financial Information
40
Laboratory Corporation of America
Other Financial Information
FY 2009 - FY 2011
Q1 09 Q2 09 Q3 09 Q4 09 Q1 10 Q2 10 Q3 10 Q4 10 Q1 11 Q2 11 Q3 11 Q4 11
Bad debt as a percentage of sales 5.3% 5.3% 5.3% 5.3% 5.0% 4.8% 4.8% 4.7% 4.7% 4.7% 4.5% 4.5%
Days sales outstanding1 52 50 48 44 46 45 44 46 47 46 46 46
A/R coverage (Allow. for Doubtful Accts. / A/R)2 19.5% 20.6% 21.9% 23.2% 21.7% 20.7% 20.4% 18.5% 19.4% 20.6% 21.1% 22.0%
(1) Excluding the impact from Genzyme Genetics, DSO was 43 days in Q4 of 2010, 45 days in Q1 of 2011, 43 days in Q2 of 2011. We did not track Genzyme Genetics’ impact on DSO after Q2 of 2011.
(2) Excluding the impact from Genzyme Genetics, A/R Coverage was 19.9% in Q4 of 2010, 20.4% in Q1 of 2011, 21.1% in Q2 of 2011, 20.0% in Q3 of 2011, and 20.8% in Q4 of 2011

41©2012 Laboratory Corporation of America® Holdings. All rights reserved. 8026-0112