barclays ceo energy-power conference · barclays ceo energy-power conference premier operator of...
TRANSCRIPT

1
Barclays CEO Energy-Power Conference
PREMIER OPERATOR OF TOP TIER ASSETS
SEPTEMBER 6, 2017

Please Read This presentation makes reference to:
Forward-looking statements
This presentation contains forward-looking statements within the meaning of securities laws. The words “anticipate,” “assume,” “believe,”
“budget,” “estimate,” “expect,” “forecast,” “guidance,” “intend,” “plan,” “project,” “will” and similar expressions are intended to identify forward-
looking statements. These statements involve known and unknown risks, which may cause SM Energy's actual results to differ materially from
results expressed or implied by the forward-looking statements. Forward-looking statements in this presentation include, among other things,
2017 guidance, expectations regarding growth strategy, anticipated drilling plans and capital expenditures, and anticipated growth in cash flows.
General risk factors include the uncertain nature of acquisition, divestiture, joint venture, farm down or similar efforts and the ability to complete
any such transactions; the uncertain nature of expected benefits from the actual or expected acquisition, divestiture, joint venture, farm down or
similar efforts; the uncertainty of negotiations to result in an agreement or a completed transaction; the availability of and access to capital
markets; the availability, proximity and capacity of gathering, processing and transportation facilities; the volatility and level of oil, natural gas,
and natural gas liquids prices, including any impact on the Company’s asset carrying values or reserves arising from price declines;
uncertainties inherent in projecting future rates of production or other results from drilling and completion activities; the imprecise nature of
estimating oil and gas reserves; uncertainties inherent in projecting future drilling and completion activities, costs or results, including from pilot
tests; the availability of additional economically attractive exploration, development, and acquisition opportunities for future growth and any
necessary financings; unexpected drilling conditions and results; unsuccessful exploration and development drilling results; the availability of
drilling, completion, and operating equipment and services; the risks associated with the Company's commodity price risk management
strategy; uncertainty regarding the ultimate impact of potentially dilutive securities; and other such matters discussed in the “Risk Factors”
section of SM Energy's 2016 Annual Report on Form 10-K, as such risk factors may be updated from time to time in the Company's other
periodic reports filed with the Securities and Exchange Commission. In addition, production forecasts and expectations for future periods are
dependent upon many assumptions, including estimates of production decline rates from existing wells and the undertaking and outcome of
future drilling activity, which may be affected by significant commodity price declines or drilling cost increases. The forward-looking statements
contained herein speak as of the date of this announcement. Although SM Energy may from time to time voluntarily update its prior forward-
looking statements, it disclaims any commitment to do so except as required by securities laws.
2
Non-GAAP financial measures: See appendix for reconciliations

3
SM Energy Focused 3-Year Plan
3
Top tier oil in Midland Basin + top tier NGLs and gas in Eagle Ford
Midland Basin> ~89,000 net acres
> 7 Rigs / 3 Frac Crews
Eagle Ford> ~167,500 net acres
> 1 Rig / 1 Frac Crew

4
SM Energy Premier Operator of Top Tier Assets
Value
proposition
Drilling
catalysts
Capital efficiency driving value
►Well results and production continue
to exceed expectations
►Permian and Eagle Ford results
demonstrate top tier asset quality
►Continue to add inventory in
Permian and Eagle Ford while
working to enhance value in other
areas

First Half of 2017 Financial Highlights
5
Outstanding execution – 2017 plan on track or better
EBITDAX ahead of plan despite notably lower
commodity prices
CAPEX less than plan despite more lateral feet
completed
The balance sheet remains in good shape: $560 MM
cash and total liquidity of $1.5 B(1)
(1) As of June 30, 2017.

41
42
43
44
45
46
Original Guidance(includes Divide
County for full year)
1Q17 Revision(predominantly
outperformance)
2Q17 Eagle FordAcceleration
2Q17Outperformance
Pro
du
cti
on
(M
MB
oe)
► Raising full year production guidance by 0.8 MMBoe (midpoint)
► Pace of Permian completions expected to approximately double in second
half, significantly increasing oil mix in 2H17
► Raising 3Q17 production guidance from 10.8 to 11.2 MMBoe (29-30% oil)
2017 Guidance(1) Significant Permian Growth in Second Half
6
Note: Midpoint of production guidance shown.
6%
increase
Facilities
6%
Operated Eagle
Ford
20%
(1)
Capital & Production FY 2017
Total Capital Spend ($MM)(2) (before acquisitions) ~$875
Total Production (MMBoe)
– oil percent in commodity mix
approaches 30% average44.5 – 46.5
Costs
LOE, including Ad Valorem ($/Boe) $4.30 - 4.60
Transportation ($/Boe) $5.40 - 5.65
Production taxes (% of pre-hedge revenue) 4.0 – 4.5%
G&A ($MM) – incl. $20 MM non-cash compensation
$115 – 125
Capitalized Overhead/Exploration ($MM)– before dry hole expense, all of which is
included in capital expenditure guidance
$65 - 70
DD&A ($/Boe) $12.00 - $14.00
(1) As of August 3, 2017.
(2) Total Capital Spend is a non-GAAP financial measure. Please see the reconciliation of this measure in the Appendix.
2017 Production Guidance

Well Hedged Through 2018
7
►~70% of expected 2H17 production volumes hedged(1)
►~50% of expected 2018 volumes hedged(2)
►Credit Agreement allows hedging of up to 85% of projected production for the first
three years
Note: The hedged volumes on this slide do not include any volumes related to basis swaps.
(1) At mid-point of revised guidance.
(2) Based on February 2017 3-year plan revised to include Divide County production.
60% 75% 80%
Oil 2H17
Natural Gas 2H17
NGLs2H17

Balance Sheet Financial Position
8
Liquidity of $1.5 billion, including $560MM cash on hand(1)
Other
86% 8%
Drilling and
Completion
86%
Facilities
6%
Other
8%
(1)
$500$500$500$395
$562
$345
$172.5
$0
$250
$500
$750
$1,000
2026202520242023202220212020201920182017
Debt Maturities(1)
(in millions)
~$0 drawn
Commitments and Borrowing base: $925 million
Corporate ratings: S&P BB-, Moody’s B1
(1) As of June 30, 2017
Balance Sheet offers financial flexibility(1)
> Senior Secured Debt:TTM Adjusted EBITDAX at ~0.0 times; max ratio allowed 2.75 times
> TTM Adjusted EBITDAX:Interest at ~3.9 times; minimum ratio required 2.0 times

9
Premier Operator of
Top-Tier Assets
Premier Operator Midland Basin
10
Sweetie
Peck
RockStar
Halff East
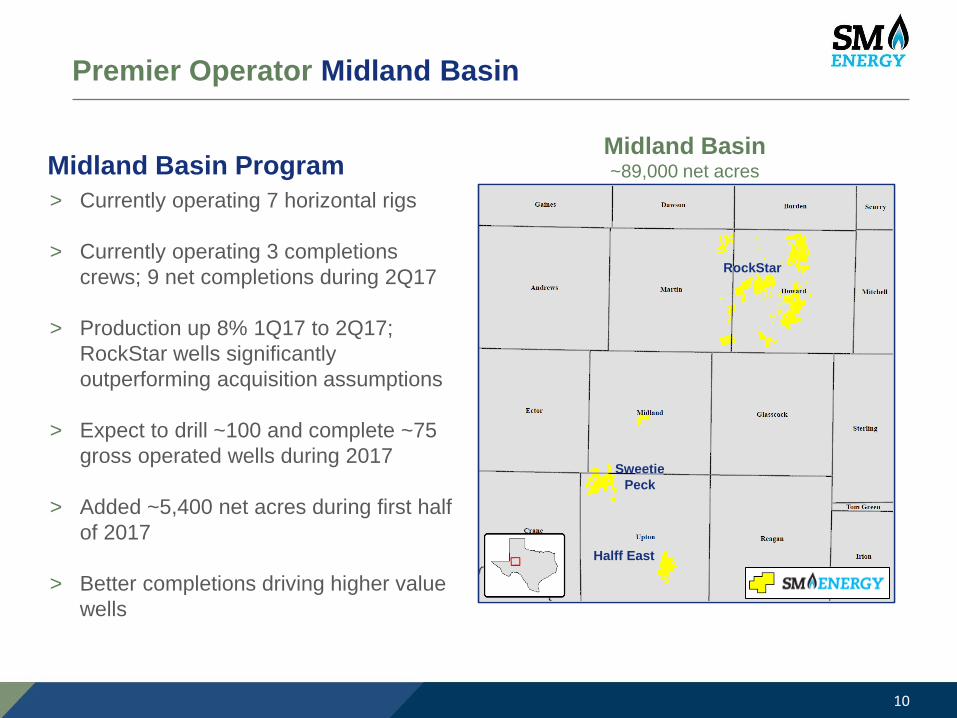
> Currently operating 7 horizontal rigs
> Currently operating 3 completions
crews; 9 net completions during 2Q17
> Production up 8% 1Q17 to 2Q17;
RockStar wells significantly
outperforming acquisition assumptions
> Expect to drill ~100 and complete ~75
gross operated wells during 2017
> Added ~5,400 net acres during first half
of 2017
> Better completions driving higher value
wells
Midland Basin ProgramMidland Basin~89,000 net acres
Premier Operator Midland Basin
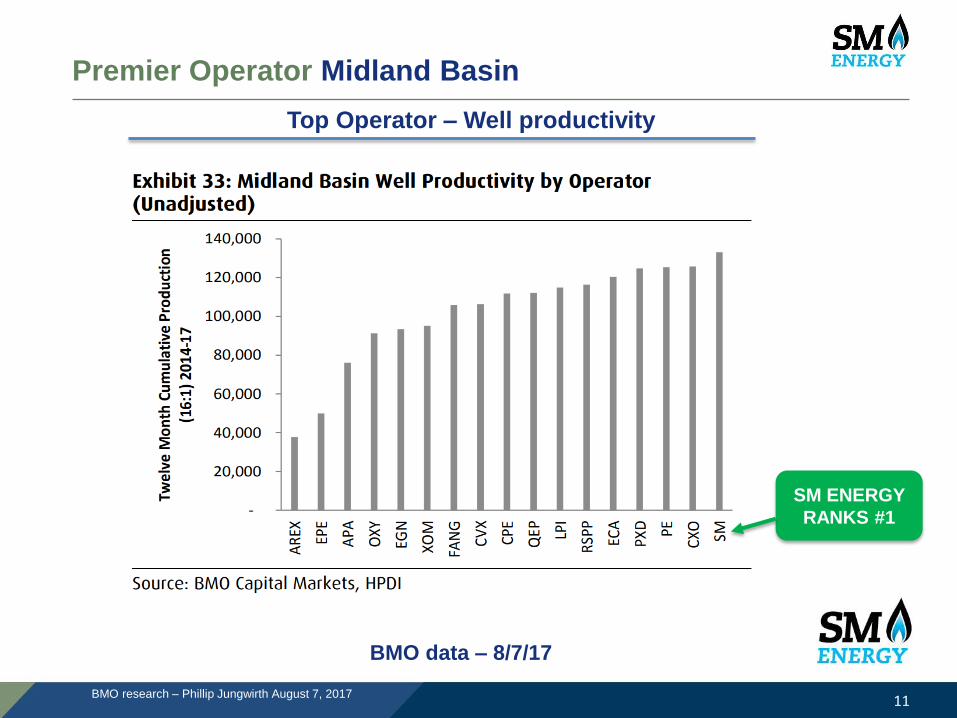
11BMO research – Phillip Jungwirth August 7, 2017
BMO data – 8/7/17
Top Operator – Well productivity
SM ENERGY
RANKS #1

12
Outstanding Well Results
“Based on our in-depth analysis of historic well data – we see Howard County
as one of the most valuable parts of the Midland Basin given higher oil cuts that
decline slower than other areas”-Credit Suisse(1)
(1) Source: Credit Suisse Equity Research, Nitin Kumar, CFA, June 1, 2017; “Relaunching US E&P Coverage: Sticking with Asset Quality and Balance Sheet”
(2) Source: FBR, Joseph Allman, CFA, June 9, 2017; “Midland Basin: Operator Productivity and Location Analysis – June 2017”
“SM Energy best based on operator revenue ranking…SM ranks no 1 generating
54% more revenue on an absolute basis than the median peer operator”
-FBR(2)
“SM Energy best on revenues per lateral foot…SM is the top operator for the
most recent year’s worth of wells with at least three full months of production
data, with revenues per lateral foot 65% better than the median Midland
Operator.”
-FBR(2)

Premier Operator Midland Basin
13
Applying seismic, core, and geo-chem data to optimize development
Modern 3-D
Seismic Grid
Planned 3-D
Seismic
Acquisition

Premier Operator Midland Basin
14BMO research – Phillip Jungwirth August 7, 2017
BMO data – 8/7/17
Top assets – Howard County
Highest oil content, flattest curve
HOWARD
COUNTY
RANKS #1

Howard County New Well Results – Additional Details
15
Well Name IntervalLateral
Length
Peak IP
Rate
(BOE/d)
IP DaysIP per
1,000’
24 Hour
Peak IP
Rate
Stages
Clusters
per
Stage
Proppant
(lbs./ft)
Oil
%
Tackleberry 43-42 A 1LS LS 7,873’ 1,286 30-day 163 1,426 50 5 1,912 89
Tackleberry 43-42 A 1WA WCA 7,861’ 2,262 30-day 288 2,639 49 5 1,883 90
Tackleberry 43-42 A 2WB WCB 7,885’ 1,412 30-day 179 1,655 50 5 1,728 86
Rambo 3846WA(4) WCA 7,546’ 1,130 30-day 150 1,253 48 5 1,946 89
Rambo 3848WA(5) WCA 7,590’ 1,118 30-day 147 1,228 48 5 1,935 88
Venkman 26-35 B 1WA WCA 7,700’ 1,274 30-day 165 1,529 49 5 1,935 91
Top Gun 1632LS(6) LS 7,711’ 1,270 30-day 165 1,308 44 6 2,018 88
Top Gun 1652WA(7) WCA 7,595’ 1,655 30-day 218 1,839 43 9 2,380 90
Guitar North 2722LS(1) LS 9,692’ 1,497 30-day 154 1,516 59 8 1,958 87
Guitar North 2742WA(2) WCA 9,698’ 1,949 30-day 201 2,542 59 8 1,997 90
Guitar North 2762WB(3) WCB 9,693’ 1,639 30-day 169 1,981 59 8 1,994 87
Papagiorgio 33-40 B 1WA WCA 10,369 1,275 30-day 123 1,606 62 8 1,866 92
Zissou 32-41 A 15WA WCA 10,315 1,351 30-day 131 1,736 62 8 1,861 92
Viper 14-09 1WA WCA 10,422 1,266 30-day 121 1,316 84 8 1,960 91
Average 1,456 89
(1) Name changed from Corinne Elizabeth 26-27 A 1H (4) Name changed from Rambo 38-47 7WA (7) Name changed from Top Gun 1H
(2) Name changed from Corinne Elizabeth 26-27 A 2H (5) Name changed from Rambo 38-47 9WA
(3) Name changed from Corinne Elizabeth 26-27 A 3H (6) Name changed from Top Gun 2H

Outstanding Results Howard County
16(1) Iceman 6-well pad includes three Wolfcamp A wells and three Lower Spraberry wells.
Howard CountyMartin County
Guitar North 2742WA
IP30: 1,949 BOE/d (90% oil)
Interval: Wolfcamp A
Lateral Length: 9,698’
Guitar North 2722LS
IP30: 1,497 BOE/d (87%oil)
Interval: Lower Spraberry
Lateral Length: 9,692’
Guitar North 2762WB
IP30: 1,639 BOE/d (87% oil)
Interval: Wolfcamp B
Lateral Length: 9,693’
Viper 14-09 1WA
24hr IP: 1,316 BOE/d (91% oil)
IP30: 1,266 BOE/d (91% oil)
Interval: Wolfcamp A
Lateral Length: 10,422’
Great results in multiple intervals across acreage position
Zissou 32-41 A 15WA
IP30: 1,351 BOE/d (92% oil)
Interval: Wolfcamp A
Lateral Length: 10,315’
Papagiorgio 33-40 B 1WA
IP30: 1,275 BOE/d (92% oil)
Interval: Wolfcamp A
Lateral Length: 10,369’
Thumper 14-23
(Sabalo)
Mr. Phillips 11-2 #1SH
(Sabalo)
Peer wells
SM wells flowing back
Iceman 6-well pad(1)
Griswold 3-well pad
Papagiorgio 33-40 B 1LS
Tubb A 1HA
(CrownQuest)
Eastland 15 2WH
(Apache)

17
Outstanding Results Viper 14-9 WA
Viper results to date exceeding expectations
10
100
1,000
10,000
0 50 100 150 200
Pro
du
cti
on
Ra
te (
BO
EP
D)
Days on Production
Viper 14-09 1WA
Western Howard County
Well Average

Premier Operator Eagle Ford
18
> Currently operating 1 horizontal rig
and plan to add a second rig in
August
> Currently operating 1 completions
crew
> Production up 9.5% 1Q17 to 2Q17
(retained properties)
> 14 wells completed during 2Q17
> Expect to drill approximately 30
gross wells and complete 39 gross
wells during 2017
Eagle Ford ProgramEagle Ford Operated
~167,500 net acres
South
Area
East
Area
North
Area

19
Premier Operator Eagle Ford
-
1,000
2,000
3,000
4,000
5,000
6,000
7,000
8,000
9,000
-
50
100
150
200
250
300
350
400
450
500
2012 2013 2014 2015 2016 2017
Av
era
ge L
ate
ral
Len
gth
(ft
)
Dri
llin
g C
ost
Per
Fo
ot
($/f
t)
-
500
1,000
1,500
2,000
2,500
-
100
200
300
400
500
600
700
800
900
1,000
2012 2013 2014 2015 2016 2017
Pro
pp
an
t P
er
Late
ral
Fo
ot
(lb
/ft)
Co
mp
leti
on
Co
st
Per
Fo
ot
($/f
t)
► Drilling longer laterals at faster pace, while achieving lower costs
> Drilling Cost per foot improved ~30% since 2015
► Pumping more sand and fluid into more stages while managing costs
> Improving frac designs leads to better wells
Drilling Costs Completion Costs
Capital efficiency - better wells and lower costs

0
5
10
15
20
25
30
0 30 60 90 120 150 180 210
No
rma
lize
d G
ross C
um
ula
tive
Pro
du
ction
(B
OE
/ft)
Days on Production
Outstanding Results Eagle Ford North
20
Outperformance: new generation completion includes tighter stage and cluster
spacing with increased fluid per foot
6 Wells (A)
Operated Eagle Ford – Recent Well Results
2Q17 North Area co-development (B)
1Q17 North Area co-development (A)
South
Area
North
Area
East
Area
3 Wells (B)
1Q17
Completions
2Q17
Completions
North Type Curve
BOE/FT
Note: 2-stream data; does not reflect ~95-140
Bbls/MMcf NGL yield for type curve shown.
Initial flowback data omitted.
Co-development UEF/LEF
2Q17 Completions

PRB Creating Value Through Successful JV Tests
21
> Utilizing partner services
and capital in current
development activity(1)
> ~156,000 total net acres
(~114,000 contiguous net
acres)
> Positive early well results
> Frontier and Shannon
intervals being tested
> Evaluating Niobrara test for
early 2018 – sizeable
inventory potential
Well
NameLL Reservoir
IP Rate
(Boe/d)
IP
DaysOil
%
Cannon 9,462’ Frontier 1,449 30 83
Buttermilk 9,199’ Frontier 2,237 30 80
Biscuit 9,639’ Frontier 2,387 30 80
Gneiss 9,669’ Shannon 1,657 30 93
Sussex
~10,100’ TVD
Shannon
~10,750’ TVD
Niobrara
~12,000’ TVD
Frontier
~12,500’ TVD
Mowry
~13,500’ TVD
~4,0
00’
Tight sand reservoirs
Source rock reservoirs
New completion technology driving 40% improvement in wells
(1) Third party carry to test multiple intervals and newer completion technologies. Initially, SM will realize nominal production and cash flow from these tests.
Powder River Basin

22
SM Energy Why Invest in SM
Value
proposition
Drilling
catalysts
Premier operator of top tier assets
Drilling
catalysts
Doubling cash flow
over two years
Liquidity –
cash on hand;
zero bank debt
Hedging
provides
stability
RockStar wells
outperforming
Rapid,
high-margin
growth

23
Appendix

2nd Quarter and YTD 2017 Performance Solid Execution
24
Production 2Q17 2017 YTD
Total Production (MMBoe) 11.3 23.4
Average Daily Production (MBoe/d) 124.6 129.5
Pre-Hedge Realized Price ($/Boe) $25.13 $26.38
Post-Hedge Realized Price ($/Boe) $26.57 $27.08
Costs
LOE ($/Boe) $4.11 $3.96
Ad Valorem ($/Boe) $0.16 $0.36
LOE including Ad Valorem ($/Boe) $4.27 $4.32
Transportation ($/Boe) $5.71 $5.79
Production Taxes (% of pre-derivative oil, gas & NGL
revenue)
4.0% 4.1%
Total Cash Production Expenses ($/Boe) $10.98 $11.20
Production Margin (pre-hedge) ($/Boe) $14.15 $15.18
G&A – Cash ($/Boe) $2.21 $2.15
G&A – Non Cash ($/Boe) $0.30 $0.31
Total G&A ($/Boe) $2.51 $2.46
DD&A ($/Boe) $13.52 $12.42
2Q17 Regional Realizations
25
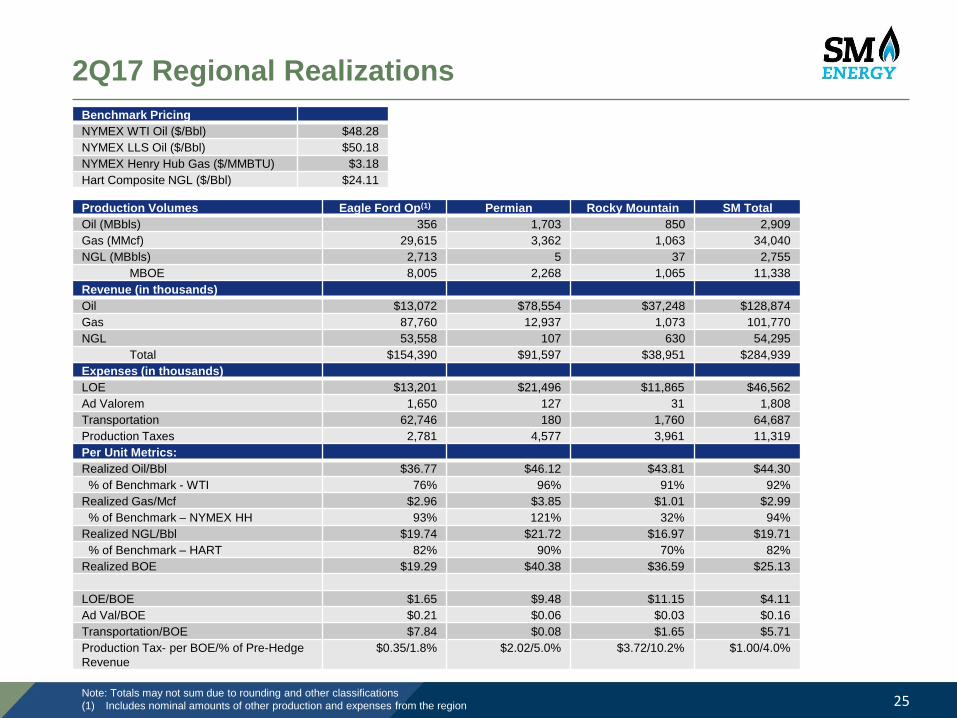
Benchmark Pricing
NYMEX WTI Oil ($/Bbl) $48.28
NYMEX LLS Oil ($/Bbl) $50.18
NYMEX Henry Hub Gas ($/MMBTU) $3.18
Hart Composite NGL ($/Bbl) $24.11
Production Volumes Eagle Ford Op(1) Permian Rocky Mountain SM Total
Oil (MBbls) 356 1,703 850 2,909
Gas (MMcf) 29,615 3,362 1,063 34,040
NGL (MBbls) 2,713 5 37 2,755
MBOE 8,005 2,268 1,065 11,338
Expenses (in thousands)
LOE $13,201 $21,496 $11,865 $46,562
Ad Valorem 1,650 127 31 1,808
Transportation 62,746 180 1,760 64,687
Production Taxes 2,781 4,577 3,961 11,319
Revenue (in thousands)
Oil $13,072 $78,554 $37,248 $128,874
Gas 87,760 12,937 1,073 101,770
NGL 53,558 107 630 54,295
Total $154,390 $91,597 $38,951 $284,939
Note: Totals may not sum due to rounding and other classifications
(1) Includes nominal amounts of other production and expenses from the region
Per Unit Metrics:
Realized Oil/Bbl $36.77 $46.12 $43.81 $44.30
% of Benchmark - WTI 76% 96% 91% 92%
Realized Gas/Mcf $2.96 $3.85 $1.01 $2.99
% of Benchmark – NYMEX HH 93% 121% 32% 94%
Realized NGL/Bbl $19.74 $21.72 $16.97 $19.71
% of Benchmark – HART 82% 90% 70% 82%
Realized BOE $19.29 $40.38 $36.59 $25.13
LOE/BOE $1.65 $9.48 $11.15 $4.11
Ad Val/BOE $0.21 $0.06 $0.03 $0.16
Transportation/BOE $7.84 $0.08 $1.65 $5.71
Production Tax- per BOE/% of Pre-Hedge
Revenue
$0.35/1.8% $2.02/5.0% $3.72/10.2% $1.00/4.0%
2017 Activity Wells Drilled, Flowing Completions & DUC Count
26
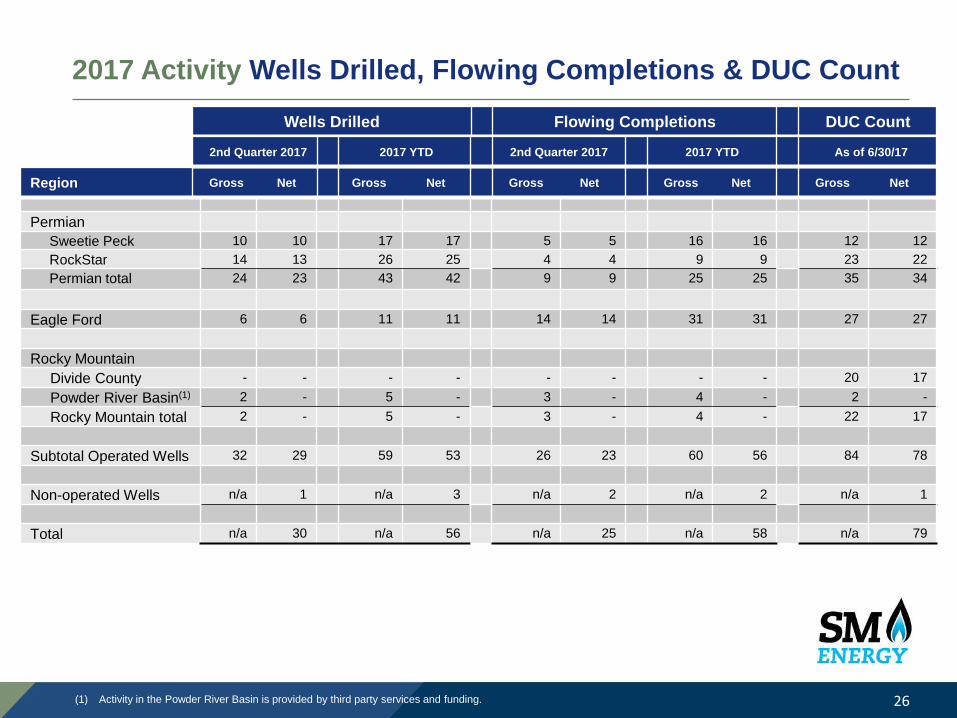
Wells Drilled Flowing Completions DUC Count
Permian
Sweetie Peck 10 10 17 17 5 5 16 16 12 12
RockStar 14 13 26 25 4 4 9 9 23 22
Permian total 24 23 43 42 9 9 25 25 35 34
Eagle Ford 6 6 11 11 14 14 31 31 27 27
Rocky Mountain
Divide County - - - - - - - - 20 17
Powder River Basin(1) 2 - 5 - 3 - 4 - 2 -
Rocky Mountain total 2 - 5 - 3 - 4 - 22 17
Subtotal Operated Wells 32 29 59 53 26 23 60 56 84 78
Non-operated Wells n/a 1 n/a 3 n/a 2 n/a 2 n/a 1
Total n/a 30 n/a 56 n/a 25 n/a 58 n/a 79
Region Gross Net Gross Net Gross Net Gross Net Gross Net
2nd Quarter 2017 2017 YTD 2nd Quarter 2017 2017 YTD As of 6/30/17
(1) Activity in the Powder River Basin is provided by third party services and funding.

Leasehold Summary
27
As of June 30, 2017
Net Acres(1)
6/30/17
Midland Basin
Sweetie Peck 17,255
RockStar(2) 65,950
Halff East (Upton County) 5,985
Midland Basin Total 89,190
Eagle Ford
Operated 167,465
Rocky Mountain
Divide 121,520
Powder River Basin 156,550
Rocky Mountain Other(3) 187,155
Other Areas/Exploration 24,915
Total 746,795
(1) Includes developed and undeveloped oil and gas leasehold, fee properties, and mineral servitudes held as of June 30, 2017. Sweetie Peck
acreage includes 2,650 net acres of drill-to-earn acreage.
(2) Includes correction from previously reported acreage total.
(3) Rocky Mountain Other includes non-core acreage located in North Dakota, Montana, Wyoming, and Utah.
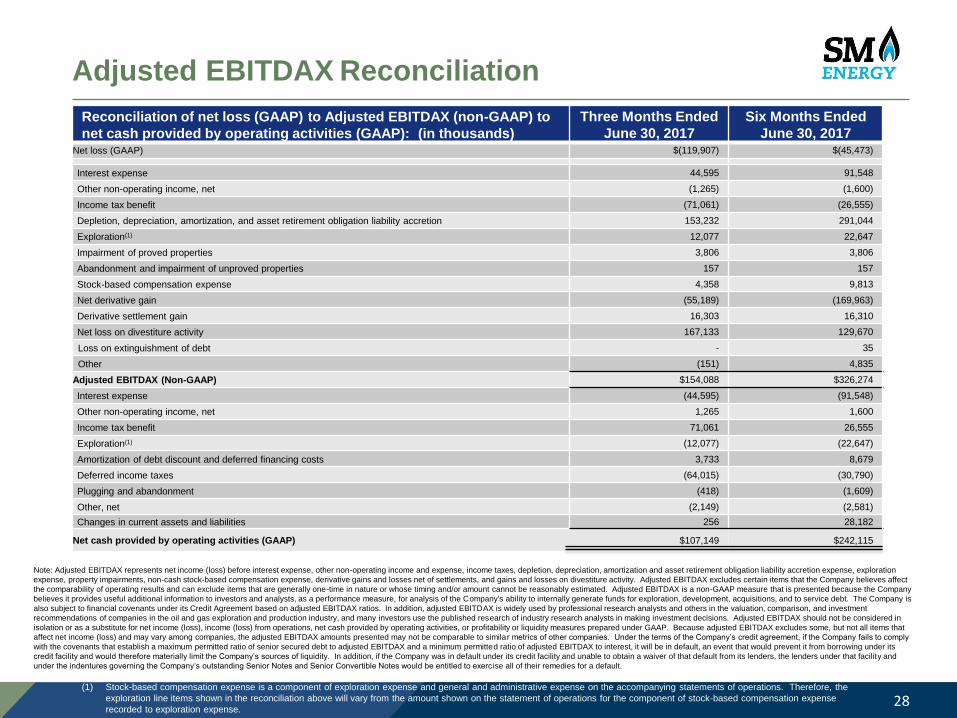
Adjusted EBITDAX Reconciliation
28
Reconciliation of net loss (GAAP) to Adjusted EBITDAX (non-GAAP) to
net cash provided by operating activities (GAAP): (in thousands)
Three Months Ended
June 30, 2017
Six Months Ended
June 30, 2017Net loss (GAAP) $(119,907) $(45,473)
Interest expense 44,595 91,548
Other non-operating income, net (1,265) (1,600)
Income tax benefit (71,061) (26,555)
Depletion, depreciation, amortization, and asset retirement obligation liability accretion 153,232 291,044
Exploration(1) 12,077 22,647
Impairment of proved properties 3,806 3,806
Abandonment and impairment of unproved properties 157 157
Stock-based compensation expense 4,358 9,813
Net derivative gain (55,189) (169,963)
Derivative settlement gain 16,303 16,310
Net loss on divestiture activity 167,133 129,670
Loss on extinguishment of debt - 35
Other (151) 4,835
Adjusted EBITDAX (Non-GAAP) $154,088 $326,274
Interest expense (44,595) (91,548)
Other non-operating income, net 1,265 1,600
Income tax benefit 71,061 26,555
Exploration(1) (12,077) (22,647)
Amortization of debt discount and deferred financing costs 3,733 8,679
Deferred income taxes (64,015) (30,790)
Plugging and abandonment (418) (1,609)
Other, net (2,149) (2,581)
Changes in current assets and liabilities 256 28,182
Net cash provided by operating activities (GAAP) $107,149 $242,115
Note: Adjusted EBITDAX represents net income (loss) before interest expense, other non-operating income and expense, income taxes, depletion, depreciation, amortization and asset retirement obligation liability accretion expense, exploration
expense, property impairments, non-cash stock-based compensation expense, derivative gains and losses net of settlements, and gains and losses on divestiture activity. Adjusted EBITDAX excludes certain items that the Company believes affect
the comparability of operating results and can exclude items that are generally one-time in nature or whose timing and/or amount cannot be reasonably estimated. Adjusted EBITDAX is a non-GAAP measure that is presented because the Company
believes it provides useful additional information to investors and analysts, as a performance measure, for analysis of the Company's ability to internally generate funds for exploration, development, acquisitions, and to service debt. The Company is
also subject to financial covenants under its Credit Agreement based on adjusted EBITDAX ratios. In addition, adjusted EBITDAX is widely used by professional research analysts and others in the valuation, comparison, and investment
recommendations of companies in the oil and gas exploration and production industry, and many investors use the published research of industry research analysts in making investment decisions. Adjusted EBITDAX should not be considered in
isolation or as a substitute for net income (loss), income (loss) from operations, net cash provided by operating activities, or profitability or liquidity measures prepared under GAAP. Because adjusted EBITDAX excludes some, but not all items that
affect net income (loss) and may vary among companies, the adjusted EBITDAX amounts presented may not be comparable to similar metrics of other companies. Under the terms of the Company’s credit agreement, if the Company fails to comply
with the covenants that establish a maximum permitted ratio of senior secured debt to adjusted EBITDAX and a minimum permitted ratio of adjusted EBITDAX to interest, it will be in default, an event that would prevent it from borrowing under its
credit facility and would therefore materially limit the Company’s sources of liquidity. In addition, if the Company was in default under its credit facility and unable to obtain a waiver of that default from its lenders, the lenders under that facility and
under the indentures governing the Company’s outstanding Senior Notes and Senior Convertible Notes would be entitled to exerc ise all of their remedies for a default.
(1) Stock-based compensation expense is a component of exploration expense and general and administrative expense on the accompanying statements of operations. Therefore, the
exploration line items shown in the reconciliation above will vary from the amount shown on the statement of operations for the component of stock-based compensation expense
recorded to exploration expense.
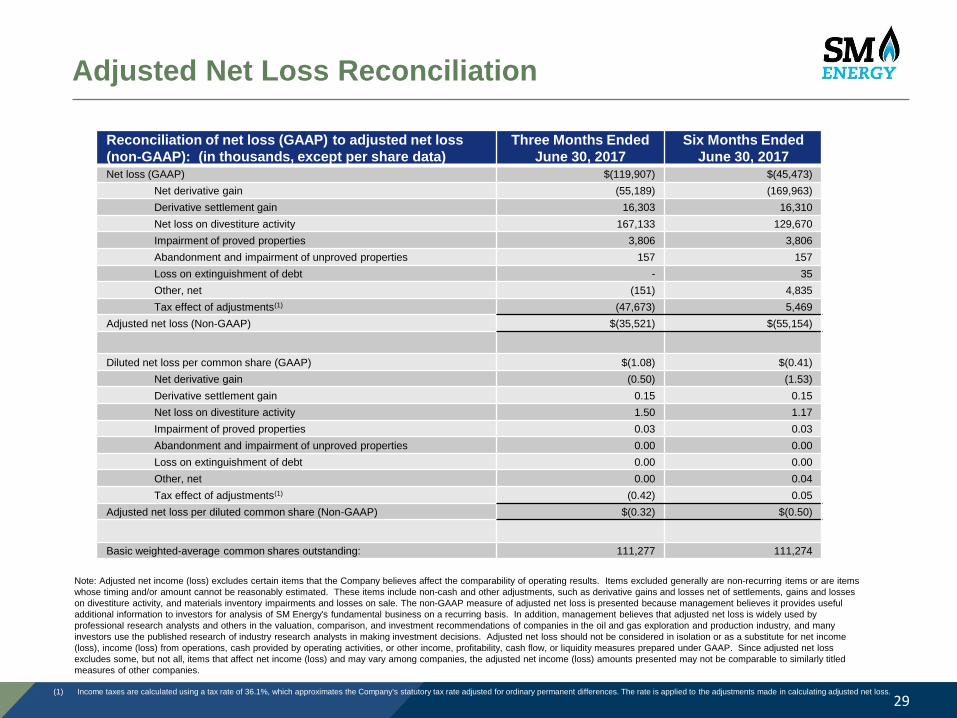
Adjusted Net Loss Reconciliation
29
Note: Adjusted net income (loss) excludes certain items that the Company believes affect the comparability of operating results. Items excluded generally are non-recurring items or are items
whose timing and/or amount cannot be reasonably estimated. These items include non-cash and other adjustments, such as derivative gains and losses net of settlements, gains and losses
on divestiture activity, and materials inventory impairments and losses on sale. The non-GAAP measure of adjusted net loss is presented because management believes it provides useful
additional information to investors for analysis of SM Energy's fundamental business on a recurring basis. In addition, management believes that adjusted net loss is widely used by
professional research analysts and others in the valuation, comparison, and investment recommendations of companies in the oil and gas exploration and production industry, and many
investors use the published research of industry research analysts in making investment decisions. Adjusted net loss should not be considered in isolation or as a substitute for net income
(loss), income (loss) from operations, cash provided by operating activities, or other income, profitability, cash flow, or liquidity measures prepared under GAAP. Since adjusted net loss
excludes some, but not all, items that affect net income (loss) and may vary among companies, the adjusted net income (loss) amounts presented may not be comparable to similarly titled
measures of other companies.
(1) Income taxes are calculated using a tax rate of 36.1%, which approximates the Company's statutory tax rate adjusted for ordinary permanent differences. The rate is applied to the adjustments made in calculating adjusted net loss.
Reconciliation of net loss (GAAP) to adjusted net loss
(non-GAAP): (in thousands, except per share data)
Three Months Ended
June 30, 2017
Six Months Ended
June 30, 2017Net loss (GAAP) $(119,907) $(45,473)
Net derivative gain (55,189) (169,963)
Derivative settlement gain 16,303 16,310
Net loss on divestiture activity 167,133 129,670
Impairment of proved properties 3,806 3,806
Abandonment and impairment of unproved properties 157 157
Loss on extinguishment of debt - 35
Other, net (151) 4,835
Tax effect of adjustments(1) (47,673) 5,469
Adjusted net loss (Non-GAAP) $(35,521) $(55,154)
Diluted net loss per common share (GAAP) $(1.08) $(0.41)
Net derivative gain (0.50) (1.53)
Derivative settlement gain 0.15 0.15
Net loss on divestiture activity 1.50 1.17
Impairment of proved properties 0.03 0.03
Abandonment and impairment of unproved properties 0.00 0.00
Loss on extinguishment of debt 0.00 0.00
Other, net 0.00 0.04
Tax effect of adjustments(1) (0.42) 0.05
Adjusted net loss per diluted common share (Non-GAAP) $(0.32) $(0.50)
Basic weighted-average common shares outstanding: 111,277 111,274
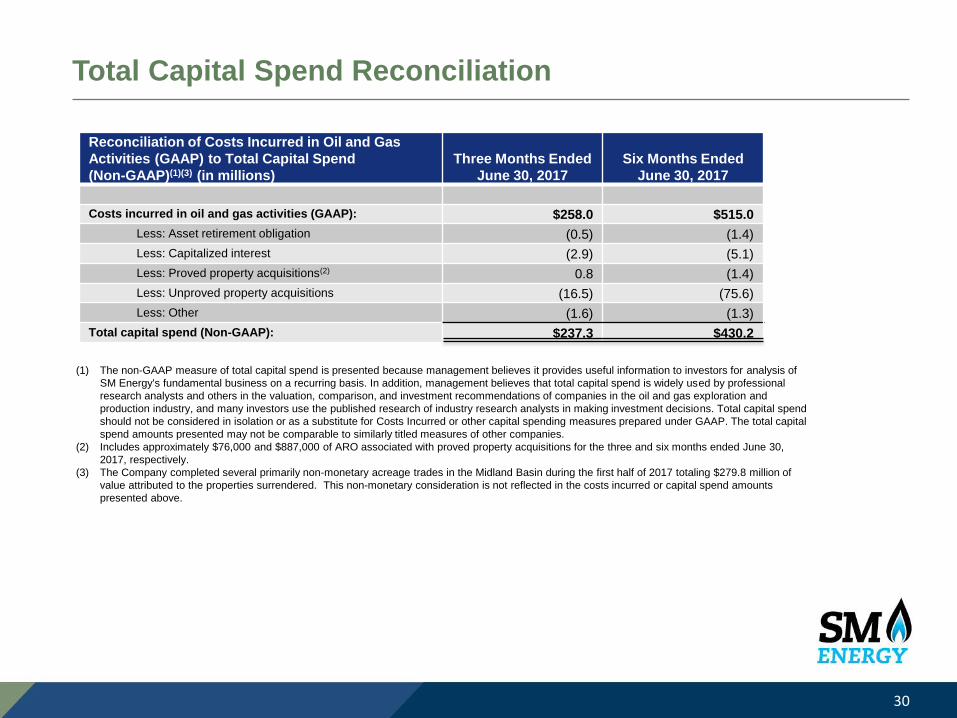
Total Capital Spend Reconciliation
30
Reconciliation of Costs Incurred in Oil and Gas
Activities (GAAP) to Total Capital Spend
(Non-GAAP)(1)(3) (in millions)
Three Months Ended
June 30, 2017
Six Months Ended
June 30, 2017
Costs incurred in oil and gas activities (GAAP): $258.0 $515.0
Less: Asset retirement obligation (0.5) (1.4)
Less: Capitalized interest (2.9) (5.1)
Less: Proved property acquisitions(2) 0.8 (1.4)
Less: Unproved property acquisitions (16.5) (75.6)
Less: Other (1.6) (1.3)
Total capital spend (Non-GAAP): $237.3 $430.2
(1) The non-GAAP measure of total capital spend is presented because management believes it provides useful information to investors for analysis of
SM Energy's fundamental business on a recurring basis. In addition, management believes that total capital spend is widely used by professional
research analysts and others in the valuation, comparison, and investment recommendations of companies in the oil and gas exploration and
production industry, and many investors use the published research of industry research analysts in making investment decisions. Total capital spend
should not be considered in isolation or as a substitute for Costs Incurred or other capital spending measures prepared under GAAP. The total capital
spend amounts presented may not be comparable to similarly titled measures of other companies.
(2) Includes approximately $76,000 and $887,000 of ARO associated with proved property acquisitions for the three and six months ended June 30,
2017, respectively.
(3) The Company completed several primarily non-monetary acreage trades in the Midland Basin during the first half of 2017 totaling $279.8 million of
value attributed to the properties surrendered. This non-monetary consideration is not reflected in the costs incurred or capital spend amounts
presented above.
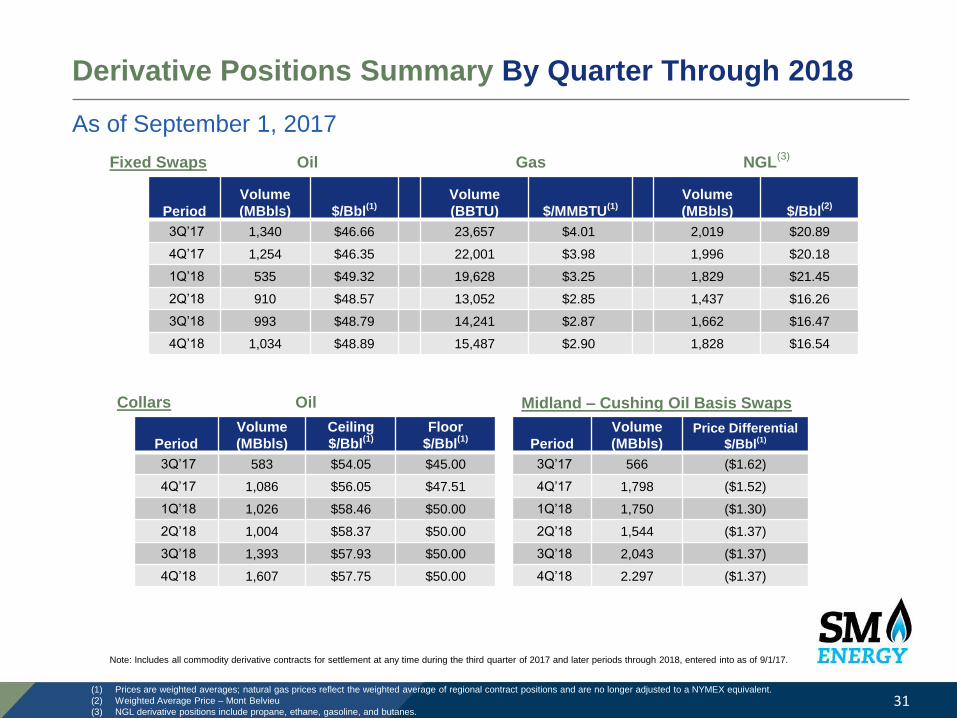
Derivative Positions Summary By Quarter Through 2018
31
As of September 1, 2017
Period
Volume
(MBbls) $/Bbl(1)
Volume
(BBTU) $/MMBTU(1)
Volume
(MBbls) $/Bbl(2)
3Q’17 1,340 $46.66 23,657 $4.01 2,019 $20.89
4Q’17 1,254 $46.35 22,001 $3.98 1,996 $20.18
1Q’18 535 $49.32 19,628 $3.25 1,829 $21.45
2Q’18 910 $48.57 13,052 $2.85 1,437 $16.26
3Q’18 993 $48.79 14,241 $2.87 1,662 $16.47
4Q’18 1,034 $48.89 15,487 $2.90 1,828 $16.54
Period
Volume
(MBbls)
Ceiling
$/Bbl(1)
Floor
$/Bbl(1)
3Q’17 583 $54.05 $45.00
4Q’17 1,086 $56.05 $47.51
1Q’18 1,026 $58.46 $50.00
2Q’18 1,004 $58.37 $50.00
3Q’18 1,393 $57.93 $50.00
4Q’18 1,607 $57.75 $50.00
Fixed Swaps
Collars
Oil
Oil
Gas NGL(3)
(1) Prices are weighted averages; natural gas prices reflect the weighted average of regional contract positions and are no longer adjusted to a NYMEX equivalent.
(2) Weighted Average Price – Mont Belvieu
(3) NGL derivative positions include propane, ethane, gasoline, and butanes.
Note: Includes all commodity derivative contracts for settlement at any time during the third quarter of 2017 and later periods through 2018, entered into as of 9/1/17.
Period
Volume
(MBbls)Price Differential
$/Bbl(1)
3Q’17 566 ($1.62)
4Q’17 1,798 ($1.52)
1Q’18 1,750 ($1.30)
2Q’18 1,544 ($1.37)
3Q’18 2,043 ($1.37)
4Q’18 2.297 ($1.37)
Midland – Cushing Oil Basis Swaps

NGL Derivative Position Detail(1)
32
Period
Volume
(MBbls) $/Bbl(2)
3Q’17 906 $9.48
4Q’17 966 $9.65
2017 Total 1,872
1Q’18 923 $10.90
2Q’18 915 $10.87
3Q’18 1,033 $10.99
4Q’18 1,146 $11.18
2018 Total 4,017
NGL Swaps OPIS Eth Purity Mt Belv NGL Swaps OPIS Propane Mt Belv Non-TET NGL Swaps Natural Gasoline Mt Belv Non TET
NGL Swaps OPIS IsoButane Mt Belv Non TETNGL Swaps OPIS NButane Mt Belv Non TET
(1) Includes all commodity derivative contracts for settlement at any time during the third quarter of 2017 and later periods through 2018 entered into as of September 1, 2017.
(2) Weighted-Average Contract Price
Note: Totals may not sum due to rounding; reference 10-Q for future period detail
Period
Volume
(MBbls) $/Bbl(2)
3Q’17 222 $48.43
4Q’17 203 $48.41
2017 Total 425
1Q’18 189 $49.40
2Q’18 35 $47.36
3Q’18 39 $47.36
4Q’18 42 $47.36
2018 Total 305
Period
Volume
(MBbls) $/Bbl(2)
3Q’17 163 $32.42
4Q’17 149 $32.34
2017 Total 312
1Q’18 138 $35.41
2Q’18 26 $31.71
3Q’18 29 $31.71
4Q’18 32 $31.71
2018 Total 225
Period
Volume
(MBbls) $/Bbl(2)
3Q’17 588 $21.91
4Q’17 550 $21.91
2017 Total 1,138
1Q’18 460 $23.35
2Q’18 440 $23.38
3Q’18 538 $23.36
4Q’18 583 $23.41
2018 Total 2,021
Period
Volume
(MBbls) $/Bbl(2)
3Q’17 140 $33.28
4Q’17 128 $33.23
2017 Total 268
1Q’18 119 $35.44
2Q’18 21 $30.35
3Q’18 23 $30.35
4Q’18 25 $30.35
2018 Total 188

NGL Realizations
33
• 22% increase in realized price (before hedges) from 2Q16 to 2Q17
• SM NGL price realizations are predominately tied to Mont Belvieu, fee based contracts
• Differential reflects NGL barrel product mix and transportation and fractionation fees
2Q16 3Q16 4Q16 1Q17 2Q17
Mt. Belvieu ($/Bbl) $20.04 $19.74 $24.11 $26.74 $24.11
SM Realization
($/Bbl)$16.12 $16.58 $20.02 $22.06 $19.71
% Differential to
Mt. Belvieu80% 84% 83% 82% 82%
42%
28%
9%
9%
12%
SM Typical NGL Bbl(1)
Ethane PropaneIso Butane Normal ButanePentane
(1) Includes the effects of ethane rejection.

0%
20%
40%
60%
80%
100%
$0.55 $0.60 $0.65
IRR
Mt. Belvieu $/Gal
0%
20%
40%
60%
80%
100%
120%
$40 $45 $50 $55 $60
IRR
NYMEX WTI
7,600' 10,000'
0%
20%
40%
60%
80%
100%
120%
$40 $45 $50 $55 $60
IRR
NYMEX WTI
7,600' 10,000'
Top-Tier Assets Regional Well Projected Economics
34
2017 capital program focusing on areas with top tier returns
RockStar – Wolfcamp A
Well Cost: $5.6MM
Well Spacing: 660’Well Cost: $6.8MM
Well Spacing: 660’Well Cost: $5.9MM
Well Spacing: 660’
Well Cost: $7.0MM
Well Spacing: 660’
Sweetie Peck – Lower Spraberry
Note: well costs include drill, complete, and equip; sensitivities at $3.00/MMBtu NYMEX; Eagle Ford East oil flat at $50/Bbl
WTI. Well economics are not updated to reflect most recent well performance and completion enhancements at 8/1/17.
Eagle Ford East
Well Cost: $5.2MM, Lateral Length: 8,000’, Well Spacing: 625’, Sand Loading: 2,000 lbs/ft, Stage Spacing: 150’
Sand loading: 1,900 lbs/ft; Stage Spacing: 167’ Sand loading: 1,900 lbs/ft; Stage Spacing: 167’
Eagle Ford East
~35% NGLs1H17 Average
Mt. Belvieu ($/Gal)

Howard County Operators
35
SM Energy
Callon
Encana
Surge/Yantai Xinchao
Diamondback
Oxy
Energen
Breitburn
Sabalo

Sweetie Peck Operators
36
SM Energy
Apache
Chevron
Concho
Devon
Diamondback
Discovery
Endeavor
Exxon
Legacy
Oxy
Pioneer
Summit
Miscellaneous

Eagle Ford Operators
37
Fasken
AreaNorth
AreaEast
AreaSouth
DimmitWebb
Dim
mit
Maverick
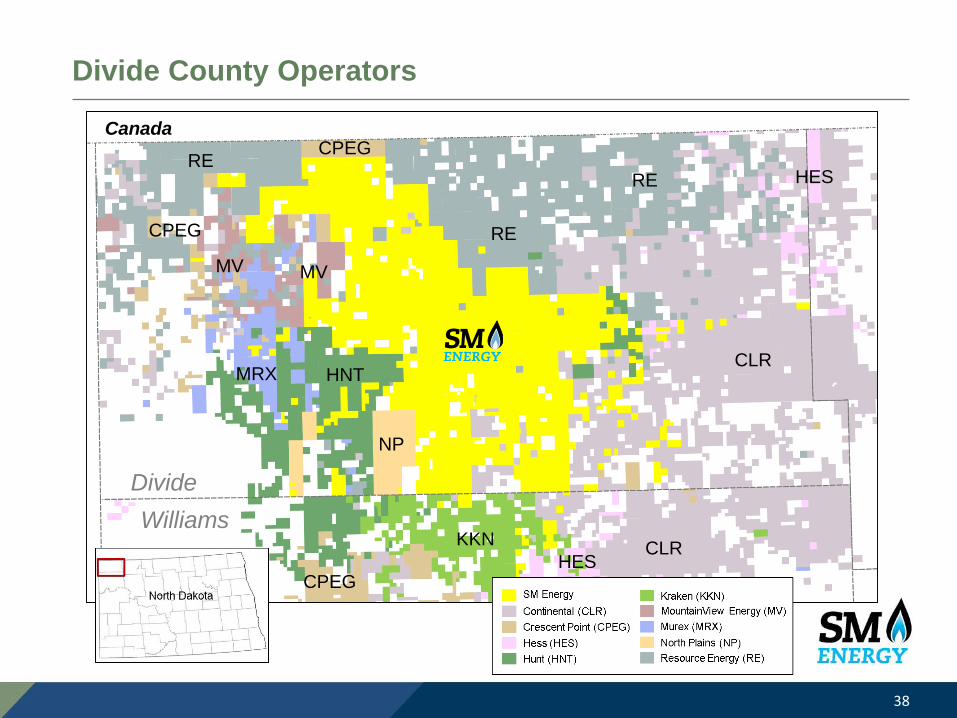
Divide County Operators
38
Canada
Divide
Williams
RECPEG
RE
HES
CLR
CLR
RE
HES
KKN
CPEG
HNT
NP
MRX
MV MV
CPEG

Powder River Basin Operators
39
SM ENERGY (SME)
ANSCHUTZ (ANS)
CHESAPEAKE (SHK)
DENBURY (DEN)
DEVON (DEV)
EOG
FLEUR DE LIS (FDL)
HELIS (HEL)
LIBERTY RESOURCES (LIB)
SAMSON (SSN)
WOLD (WLD)
OTHERS
Campbell
ConverseNatrona
Johnson
