barclays plc q3 2017 results announcement · · 2017-10-26barclays plc q3 2017 results...
TRANSCRIPT

Barclays PLC
Barclays PLC
Q3 2017 Results Announcement
30 September 2017

Performance Highlights
Barclays PLC 1
Transatlantic Consumer and Wholesale Bank with Global Reach
Improved Group profit before tax, reduced cost: income ratio and strong CET1 ratio accretion
in the nine months ended 30 September 2017
Key strategic milestones achieved with the closure of Non-Core and sell down in Africa
Returns: Group Return on Tangible Equity (RoTE) of (1.4%) for Q317 YTD (Q316 YTD: 4.4%)
Group RoTE was 7.1% excluding a loss on the sale of 33.7% of Barclays Africa Group
Limited‟s (BAGL) issued share capital of £1.4bn, an impairment of Barclays‟ holding in
BAGL of £1.1bn and charges for Payment Protection Insurance (PPI) of £700m
Targeting Group RoTE, excluding litigation and conduct, above 10% in 2020 and above
9% in 2019, based on a Group Common Equity Tier 1 (CET1) ratio of c.13%
Cost efficiency: Group cost: income ratio of 69% (Q316 YTD: 73%), included charges for PPI of £700m
(Q316 YTD: £1,000m)
Guidance for Group operating expenses, excluding litigation and conduct, of £14.2bn-
£14.3bn in 2017 and £13.6bn-£13.9bn in 2019
Common Equity Tier 1
ratio:
CET1 ratio was 13.1% (December 2016: 12.4%), within the end-state target range,
driven by organic capital generation from continuing operations and the benefit of the
proportional consolidation of BAGL, partially offset by adverse movements in reserves
Group profit before tax increased 19% to £3,448m driven by a £932m reduction in operating expenses, primarily
reflecting lower litigation and conduct and Non-Core costs. Income reduced £405m due to the non-recurrence of the
£615m gain on disposal of Barclays‟ share of Visa Europe Limited in 2016
- Barclays UK RoTE of 9.4% (Q316 YTD: 6.9%), with a 12% increase in profit before tax to £1,295m driven by
reduced impairment and a lower cost: income ratio of 66% (Q316 YTD: 67%), including lower charges for PPI of
£700m (Q316 YTD: £1,000m). Net interest income remained in line at £4,546m (Q316 YTD: £4,546m)
- Barclays International RoTE of 10.0% (Q316 YTD: 12.9%) on profit before tax of £3,269m (Q316 YTD: £3,838m).
Income decreased 3%, with an increase in Consumer, Cards and Payments more than offset by a decrease in the
Corporate and Investment Bank (CIB), largely as a result of weak market conditions in Q317, while operating
expenses increased 4% and credit impairment increased 21%
Group attributable loss of £628m (Q316 YTD: profit of £1,524m) included a loss after tax in respect of the
discontinued operation of £2,195m reflecting an impairment of Barclays‟ holding in BAGL of £1,090m and a loss on
the sale of 33.7% of BAGL‟s issued share capital of £1,435m, primarily due to recycling of currency translation reserve
losses to the income statement
Group basic loss per share of 3.0p (Q316 YTD: earnings per share of 9.6p). Excluding the loss on the sale of 33.7%
of BAGL‟s issued share capital, the impairment of Barclays‟ holding in BAGL and charges for PPI of £700m, earnings
per share was 15.5p
Tangible net asset value per share decreased to 281p (December 2016: 290p) as profit from continuing operations
was offset by decreases across reserves

Performance Highlights
Barclays PLC 2
James E Staley, Group Chief Executive Officer, said:
“The third quarter of 2017 was particularly significant for Barclays as it was the first for many years in which we
have not been in some state of restructuring.
Having closed the Non-Core unit, and sold our controlling interest in Barclays Africa in June, we now have the
end state Transatlantic Consumer and Wholesale Bank - in Barclays UK and Barclays International - which we
set out to build in March of 2016.
With Returns on Tangible Equity of 9.4% and 10.0% respectively, both Barclays UK and Barclays International
have contributed to a Group profit before tax for the first nine months of the year which is up 19% to £3,448m.
The Group’s RoTE, excluding the impact of the sale of our stake in Barclays Africa Group, as well as charges
taken for Payment Protection Insurance earlier in the year, was 7.1%.
The third quarter was clearly a difficult one for our Markets business within BI. A lack of volume and volatility in
FICC hit Markets revenues hard across the industry, and we were no exception to this trend. We did however
see an improvement in profitability in BUK, and a good underlying return from our Consumer, Cards and
Payments business, which partially offset the under-performance in Markets.
The completion of our restructuring, and the strength of our capital base today - with our CET1 ratio standing
at 13.3% pro forma after BAGL regulatory deconsolidation - means we can now turn our full attention towards
what matters most to our shareholders: improving Group returns.
We now have high confidence in our capacity to assert when Barclays will start to deliver the economic
performance which we know this Group is capable of, and therefore today we are announcing new targets for
2019 and 2020 for Barclays.
First, we have set a target of achieving a Group RoTE of greater than 9% in 2019.
Second, we have stated that we will improve that Group RoTE again in 2020, to be greater than 10%.
Third, we have set a firm target range for costs in 2019 to be between 13.6 and 13.9 billion pounds, excluding
litigation and conduct charges, and depending on proactive investment choices we make in that year.
The returns targets are based on an assumption of running the business within our end state capital range of
around 13% CET1.
Our experience over the past couple of years, and the multiple opportunities for revenue growth within our
diversified Group, confirms for us that these targets are attainable. We have strong plans in place to achieve
them, including self-funded investment to realise further efficiencies and to grow revenue.
Whilst working to put our remaining conduct issues behind us, we remain focused as a management team on
being in a position to distribute the returns that these plans will generate, on a sustainable basis, to
shareholders. Accordingly, at the full year results announcement early next year we will provide an updated
capital management policy for the Group.”
James E Staley
Group Chief Executive Officer

Performance Highlights
Barclays PLC 3
Barclays Group results
for the nine months ended 30.09.17 30.09.16
£m £m % Change
Total income 16,054 16,459 (2)
Credit impairment charges and other provisions (1,763) (1,720) (3)
Net operating income 14,291 14,739 (3)
Operating expenses excluding litigation and conduct (10,263) (10,753) 5
Litigation and conduct (824) (1,266) 35
Operating expenses (11,087) (12,019) 8
Other net income 244 180 36
Profit before tax 3,448 2,900 19
Tax charge (1,102) (1,043) (6)
Profit after tax in respect of continuing operations 2,346 1,857 26
(Loss)/profit after tax in respect of discontinued operation (2,195) 520
Non-controlling interests in respect of continuing operations (181) (255) 29
Non-controlling interests in respect of discontinued operation (140) (280) 50
Other equity holders1 (458) (318) (44)
Attributable (loss)/profit (628) 1,524
Performance measures
Return on average tangible shareholders' equity1 (1.4%) 4.4%
Average tangible shareholders' equity (£bn) 49 49
Cost: income ratio 69% 73%
Loan loss rate (bps) 55 48
Basic (loss)/earnings per share1 (3.0p) 9.6p
Basic earnings per share in respect of continuing operations1 10.8p 8.1p
Dividend per share 1.0p 1.0p
As at As at As at
Balance sheet and capital management 30.09.17 30.06.17 31.12.16
Tangible net asset value per share 281p 284p 290p
Common equity tier 1 ratio 13.1% 13.1% 12.4%
Common equity tier 1 capital (£bn) 42.3 42.8 45.2
Risk weighted assets (£bn) 324 327 366
UK leverage ratio (quarterly month end average)2 4.9% 4.8% 4.5%
Fully loaded tier 1 capital (quarterly month end average)2 (£bn) 51.2 52.1 51.6
UK leverage exposure (quarterly month end average)2 (£bn) 1,035 1,092 1,137
Funding and liquidity
Group liquidity pool (£bn) 216 201 165
CRD IV liquidity coverage ratio 157% 149% 131%
Loan: deposit ratio3 82% 85% 89%
1 The profit after tax attributable to other equity holders of £458m (Q316 YTD: £318m) is offset by a tax credit recorded in reserves of £125m (Q316 YTD:
£89m). The net amount of £333m (Q316 YTD: £229m), along with non-controlling interests (NCI) is deducted from profit after tax in order to calculate
earnings per share and return on average tangible shareholders’ equity.
2 The UK leverage ratio uses capital and exposure measures based on the average of the last day of each month in the quarter; additionally the average
exposure measure excludes qualifying central bank claims.
3 Loan: deposit ratio excludes Head Office and investment banking balances other than interest earning lending. Comparatives have been restated to include
interest earning lending balances within the investment banking business.

Group Finance Director’s Review
Barclays PLC 4
Performance in the nine months ended 30 September 2017 was encouraging, with increased profit before tax, a reduced
cost: income ratio and strong capital progression. Significant progress was made on strategic objectives with the closure of
Non-Core and the sale of a stake in, and consequent accounting deconsolidation of, BAGL. Given the closure of Non-Core
on 1 July 2017, Group results for the nine months ended 30 September 2017 include a Non-Core loss before tax for the six
months ended 30 June 2017 of £647m, with residual Non-Core assets and liabilities reintegrated into, and associated
financial performance subsequently reported in, Barclays UK, Barclays International and Head Office. Focus on our core
businesses provides a firm platform on which to build, as we progress towards delivering the Group‟s financial targets.
Group performance Profit before tax increased 19% to £3,448m driven by an 8% reduction in operating expenses, partially offset by a 2%
decrease in income. Group results for the nine months ended 30 September 2017 were impacted by the 8%
appreciation of average USD and EUR against GBP compared to the prior year, which positively impacted income and
adversely affected impairment and operating expenses
Total income decreased £405m to £16,054m, impacted by the non-recurrence of the £615m gain on disposal of
Barclays‟ share of Visa Europe Limited in 2016. A 3% reduction in total income in both Barclays UK and Barclays
International, and lower income in Head Office was partially offset by lower Non-Core negative income
Credit impairment charges increased £43m to £1,763m as lower impairment in Barclays UK was more than offset by
increased impairment in Barclays International. Results included a charge of £168m in Q317 relating to deferred
consideration from a Q117 asset sale in US Cards, and the non-recurrence of a £320m charge in 2016 following the
management review of the UK and US cards portfolio impairment modelling. The Group loan loss rate increased 7bps to
55bps
Operating expenses decreased 8% to £11,087m reflecting lower Non-Core costs and a 5% reduction in Barclays UK,
partially offset by a 4% increase in Barclays International. The Group‟s cost: income ratio of 69% (Q316 YTD: 73%)
included charges for PPI of £700m (Q316 YTD: £1,000m)
Loss after tax in respect of the Africa Banking discontinued operation of £2,195m in H117 included a £1,090m
impairment of Barclays‟ holding in BAGL and a £1,435m loss on the sale of 33.7% of BAGL‟s issued share capital,
primarily due to recycling of currency translation reserve losses to the income statement on accounting deconsolidation
RoTE was (1.4%) (Q316 YTD: 4.4%) and basic loss per share was 3.0p (Q316 YTD: earnings per share of 9.6p).
Excluding the impact of the loss on the sale of 33.7% of BAGL‟s issued share capital, the impairment of Barclays‟ holding
in BAGL and charges for PPI, RoTE was 7.1% and earnings per share was 15.5p
Barclays UK RoTE improved to 9.4% (Q316 YTD: 6.9%) with a 12% increase in profit before tax to £1,295m
Total income decreased 3% to £5,513m, of which £151m reflected the non-recurrence of the gain on disposal of
Barclays‟ share of Visa Europe Limited in 2016
- Personal Banking income decreased 5% to £2,803m due to the non-recurrence of the gain on disposal of Barclays‟
share of Visa Europe Limited and the impact of the UK base rate reduction in 2016, partially offset by deposit pricing
initiatives and balance growth
- Barclaycard Consumer UK income increased 1% to £1,532m reflecting improved margins
- Wealth, Entrepreneurs & Business Banking (WEBB) income decreased 3% to £1,178m due to the non-recurrence of
the gain on disposal of Barclays‟ share of Visa Europe Limited, partially offset by deposit pricing initiatives and
balance growth
- Net interest income remained in line at £4,546m (Q316 YTD: £4,546m) due to deposit pricing initiatives and balance
growth, offset by the impact of the UK base rate reduction in 2016. Net interest margin decreased 8bps to 3.55%
reflecting the integration of the Education, Social Housing and Local Authority (ESHLA) portfolio from Non-Core in
Q317
Credit impairment charges decreased 16% to £599m principally reflecting the non-recurrence of a £200m charge in
2016 following the management review of the cards portfolio impairment modelling, partially offset by higher charges
in Personal Banking. Underlying delinquency trends improved with 30 day and 90 day arrears rates in UK cards of 1.8%
(Q316: 2.0%) and 0.9% (Q316: 1.0%) respectively
Total operating expenses decreased 5% to £3,619m due to lower charges for PPI of £700m (Q316 YTD: £1,000m) and
cost efficiencies, partially offset by the costs of setting up the ring-fenced bank and increased investment in cyber
resilience and technology Total assets increased to £230.4bn (December 2016: £209.6bn) reflecting the integration of the ESHLA portfolio of
c.£18bn from Non-Core on 1 July 2017 and growth in mortgages

Group Finance Director’s Review
Barclays PLC 5
Barclays International RoTE decreased to 10.0% (Q316 YTD: 12.9%) as profit before tax decreased 15% to £3,269m reflecting a 3% decrease
in income and a 4% increase in total operating expenses. Consumer, Cards and Payments RoTE was 19.3% (Q316 YTD:
38.3%) and CIB RoTE was 8.4% (Q316 YTD: 8.7%). Results were impacted by the appreciation of average USD and EUR
against GBP compared to the prior year, which positively impacted income and adversely affected impairment and
operating expenses
Total income decreased 3% to £11,063m as CIB income reduced 5% to £7,626m, largely as a result of weak market
conditions in Q317 and the non-recurrence of treasury gains in the prior year, while Consumer, Cards and Payments
income increased 1% to £3,437m
- Markets income decreased 14% to £3,535m reflecting a 27% reduction in Macro income to £1,314m, due to lower
market volatility and the impact of exiting energy-related commodities, as well as an 8% reduction in Equities
income to £1,267m driven by lower equity derivatives revenue, partially offset by improved performance in cash
equities and equity financing. Continued momentum in Credit income resulted in a 3% increase to £954m
- Banking income increased 4% to £4,052 driven by a 15% increase in Banking fees to £2,007m, due to higher debt
underwriting, equity underwriting and advisory fees, with increased fee share in debt and equity underwriting.
Corporate lending reduced 8% to £824m primarily due to lower balances and work-out gains. Transactional
banking declined 3% to £1,221m as margin compression, due to the low base rate environment, and the non-
recurrence of treasury gains in the prior year were partially offset by higher deposit balances
- Consumer, Cards and Payments income increased 1% to £3,437m driven by continued business growth, a gain of
£192m relating to an asset sale in US Cards and a valuation gain on Barclays‟ preference shares in Visa Inc. of £74m,
partially offset by the non-recurrence of the £464m gain on the disposal of Barclays‟ share of Visa Europe Limited in
2016
Credit impairment charges increased 21% to £1,120m
- CIB impairment charges decreased 49% to £86m primarily due to the non-recurrence of oil and gas single name
charges
- Consumer, Cards and Payments credit impairment charges increased 36% to £1,034m due to a £168m charge in
Q317 relating to deferred consideration from the Q117 asset sale in US Cards, an increase in underlying delinquency
trends in US Cards and business growth. This was partially offset by the non-recurrence of a £120m charge in 2016
following the management review of the cards portfolio impairment modelling. 30 day and 90 day arrears rates
within US Cards were broadly stable at 2.4% (Q316: 2.4%) and 1.2% (Q316: 1.1%) respectively, including a benefit
from a change in portfolio mix following the Q117 asset sale
Operating expenses increased 4% to £6,907m
- CIB operating expenses were in line at £5,358m (Q316 YTD: £5,337m) as the impact of the change in compensation
awards introduced in Q416 and higher structural reform programme costs were offset by a reduction in
restructuring charges and cost efficiencies
- Consumer, Cards and Payments operating expenses increased 17% to £1,549m reflecting continued business
growth and investment, primarily within the US Cards and merchant acquiring businesses
Total assets increased to £867.1bn (December 2016: £648.5bn) driven by the integration of c.£200bn of assets, and
c.£9bn of associated risk weighted assets (RWAs), from Non-Core on 1 July 2017, principally relating to derivatives. In
addition, increases in financial assets designated at fair value and trading portfolio assets were partially offset by a
reduction in derivative mark-to-market as a result of increased forward rates
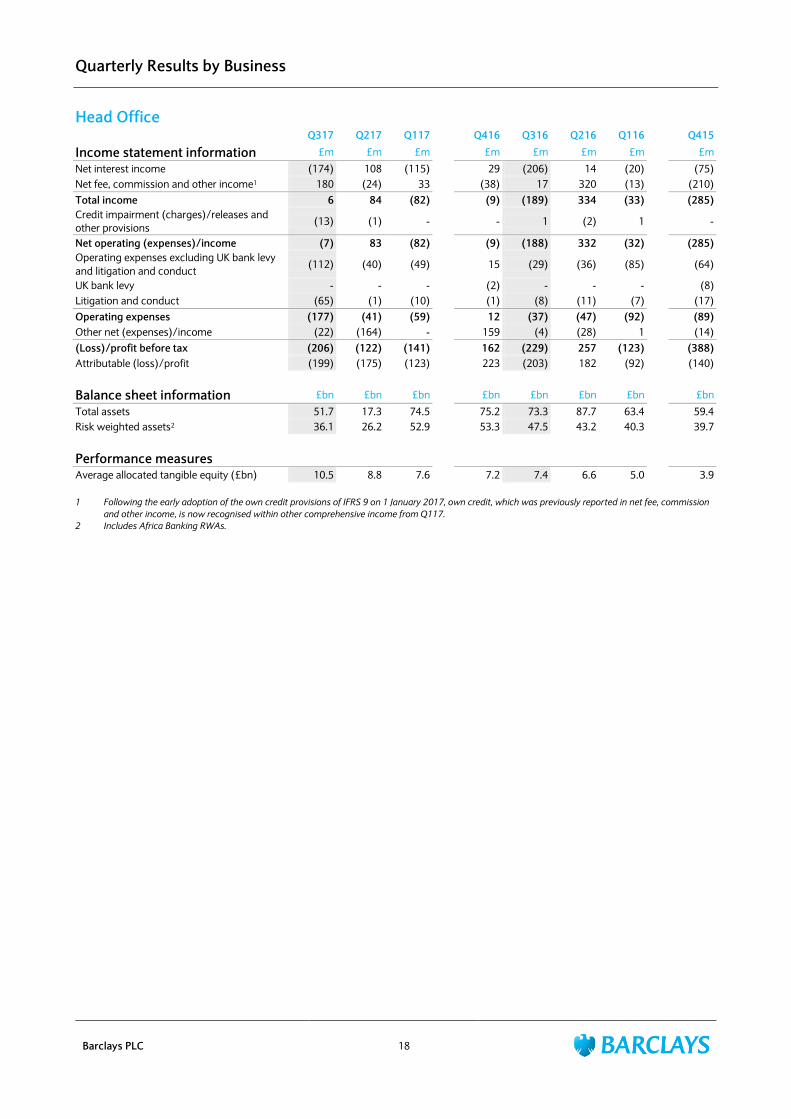
Head Office Loss before tax increased to £469m (Q316 YTD: £95m)
Income reduced £104m to £8m primarily reflecting lower net income from treasury operations, partially offset by the
impact of the early adoption of the own credit provisions of IFRS 9. Own credit, which was previously recorded in the
income statement (Q316 YTD: £80m expense), is now recognised within other comprehensive income
Total operating expenses of £277m (Q316 YTD: £176m) included costs in Q317 associated with reintegrated Non-Core
assets and businesses
Other net expenses increased to £186m (Q316 YTD: £31m) driven by an expense of £180m on the recycling of the
currency translation reserve to the income statement on the sale of Barclays Bank Egypt
Total assets reduced to £51.7bn (December 2016: £75.2bn) primarily due to the accounting deconsolidation of BAGL,
which accounted for £65bn of total assets on deconsolidation from the Barclays Group. This was partially offset by an
increase in the liquidity pool and the integration of Non-Core assets on 1 July 2017, of which c.£9bn related to Italian
mortgages

Group Finance Director’s Review
Barclays PLC 6
Barclays Non-Core Non-Core was closed on 1 July 2017, with the residual assets and liabilities reintegrated into Barclays UK, Barclays
International and Head Office
Reflected in the Group‟s results for the nine months ended 30 September 2017 was a Non-Core loss before tax for the
six months ended 30 June 2017 of £647m (Q316 YTD: £1,998m)
Group capital and leverage The fully loaded CET1 ratio increased to 13.1% (December 2016: 12.4%) driven by organic capital generation and the
benefit of the proportional consolidation of BAGL, partially offset by adverse movements in reserves. RWAs decreased
£41.4bn to £324.3bn and CET1 capital decreased £2.9bn to £42.3bn
– Profits relating to continuing operations were more than offset by decreases in other qualifying reserves as a result
of the redemption of USD preference shares, the payment of pension deficit reduction contributions and dividends
paid and foreseen
– CET1 capital further decreased by £1.8bn as a result of BAGL minority interest no longer being included as a result of
the proportional consolidation of BAGL following the sell down of the Barclays‟ holding. Losses in respect of the
discontinued operation due to the impairment of Barclays‟ holding in BAGL allocated to goodwill and the recycling
of the BAGL currency translation reserve losses to the income statement had no impact on CET1 capital
– The decrease in RWAs principally reflected the £28.5bn reduction as a result of the proportional consolidation of
BAGL, as well as reductions in Non-Core
The average UK leverage ratio increased to 4.9% (December 2016: 4.5%) driven by a decrease in the average UK
leverage exposure to £1,035bn (December 2016: £1,137bn) primarily as a result of the proportional consolidation of
BAGL, offset by a decrease in the average fully loaded Tier 1 capital to £51.2bn (December 2016: £51.6bn)
Tangible net asset value per share decreased to 281p (December 2016: 290p) primarily due to profit after tax from
continuing operations being more than offset by the reduction in the cash flow hedging reserve, dividends paid and the
redemption of USD preference shares
Group funding and liquidity The Group continued to maintain surpluses to its internal and regulatory requirements as at 30 September 2017. The
liquidity pool increased to £216bn (December 2016: £165bn). The increase in the liquidity pool was driven by deposit
growth, higher money market balances, drawdown from the Bank of England Term Funding Scheme and a net increase
in the minimum requirement for own funds and eligible liabilities (MREL) issuance. The liquidity coverage ratio (LCR)
increased to 157% (December 2016: 131%), equivalent to a surplus of £78bn (December 2016: £39bn) to 100%
Wholesale funding outstanding excluding repurchase agreements was £172bn (December 2016: £158bn). The Group
balance sheet included £10bn equivalent of capital and term senior unsecured debt from Barclays PLC (HoldCo) issued
and settled as at 30 September 2017 of which £4.7bn was in public senior unsecured debt, and £5.3bn in capital
instruments. In the same period, £4.7bn of Barclays Bank PLC (OpCo) capital and senior public term instruments either
matured or were redeemed, including the $1.375bn 7.1% Series 3 USD preference shares

Group Finance Director’s Review
Barclays PLC 7
Other matters On 1 June 2017, Barclays sold 286 million ordinary shares of BAGL, representing 33.7% of BAGL‟s issued share capital.
The sale resulted in the accounting deconsolidation of BAGL from the Barclays Group. Following the sale, BAGL is
accounted for as an Available for Sale (AFS) asset in Barclays‟ financial statements and is no longer reported as a
discontinued operation. The contribution of a further 1.5% of BAGL‟s ordinary shares to a Black Economic
Empowerment scheme in Q317 resulted in Barclays accounting for 126 million ordinary shares in BAGL at 30
September 2017, representing 14.9% of BAGL‟s issued share capital. For regulatory reporting purposes, BAGL is treated
on a proportional consolidated basis
Additional charges of £700m (Q316 YTD: £1,000m) relating to PPI were recognised in Q217. The remaining PPI
provision as at 30 September 2017 was £1.9bn (December 2016: £2.0bn)
Barclays Bank PLC has reached an agreement in principle with the US Federal Energy Regulatory Commission‟s
(Commission) Office of Enforcement, subject to approval by the Commission, to resolve the civil action brought by the
Commission relating to the electricity markets in the Western US. The proposed settlement, fully provisioned as at
Q317, is for a total of $105m, which is comprised of a civil penalty of $70m and a disgorgement amount of $35m
Certain other legal proceedings and investigations relating to legacy issues remain outstanding. Resolving outstanding
legacy issues in an appropriate timeframe will continue to be a priority
IFRS 9 Financial Instruments1 IFRS 9 Financial Instruments is effective for periods beginning on or after 1 January 2018. Barclays‟ estimated IFRS 9
impact, based on the portfolio as at 30 September 2017, is a decrease in shareholders‟ equity of approximately £2.0bn
post tax. This estimated reduction in shareholders‟ equity equates to a decrease in tangible net asset value of 10 to 12
pence per share
The Group‟s CET1 ratio will be impacted by IFRS 9 primarily from an increase in credit impairment provisions net of tax
and any deduction of deferred tax assets arising from temporary differences being in excess of the regulatory allowable
threshold. This is partially offset by a reduction in the regulatory expected loss over impairment deduction and reduced
RWAs
Based on figures as at 30 September 2017, the expected CET1 impact without transitional arrangements would be an
estimated reduction of approximately 40bps. Barclays expects to implement transitional arrangements for capital
purposes, currently being finalised by European regulators, which would result in only a proportion of the estimated
reduction impacting the CET1 ratio during 2018. The final impact of IFRS 9 is estimated to be approximately 20bps
lower than the point in time impact as deferred tax assets are expected to fall below the allowable threshold over time
Barclays plans to publish transitional disclosures during the first quarter of 2018 describing the 1 January 2018 impact
of adoption of IFRS 9
Outlook and financial targets The Group is targeting a RoTE, excluding litigation and conduct, above 10% in 2020 and above 9% in 2019, based on a
Group CET1 ratio of c.13%
Guidance for Group operating expenses, excluding litigation and conduct, is £14.2bn-£14.3bn in 2017 and £13.6bn-
£13.9bn in 2019
Tushar Morzaria, Group Finance Director
1 Note:
- The estimated decrease in shareholders’ equity includes the impact of both balance sheet classification and measurement changes and the increase to
credit impairment provisions compared to those applied at 30 September 2017 under IAS 39. The adoption of certain classification and measurement
accounting changes remain subject to endorsement by the European Union.
- The assessment above is a point in time estimate and is not a forecast. The actual effect of the implementation of IFRS 9 on Barclays PLC could vary
significantly from this estimate.
- Barclays continues to refine models, methodologies and controls, and monitor developments in regulatory rule-making in advance of IFRS 9 adoption on
1 January 2018. All estimates are based on Barclays’ current interpretation of the requirements of IFRS 9, reflecting industry guidance and discussions to
date.

Results by Business
Barclays PLC 8
Barclays UK Nine months ended Nine months ended 30.09.17 30.09.16
Income statement information £m £m % Change
Net interest income 4,546 4,546 -
Net fee, commission and other income 967 1,143 (15)
Total income 5,513 5,689 (3)
Credit impairment charges and other provisions (599) (716) 16
Net operating income 4,914 4,973 (1)
Operating expenses excluding litigation and conduct (2,913) (2,803) (4)
Litigation and conduct (706) (1,014) 30
Operating expenses (3,619) (3,817) 5
Other net expenses - (1)
Profit before tax 1,295 1,155 12
Attributable profit 608 445 37
As at As at As at
30.09.17 30.06.17 31.12.16
Balance sheet information £bn £bn £bn
Loans and advances to customers at amortised cost 182.2 166.6 166.4
Total assets 230.4 203.4 209.6
Customer deposits 189.3 187.4 189.0
Loan: deposit ratio 96% 89% 88%
Risk weighted assets 70.0 66.1 67.5
Period end allocated tangible equity 9.5 8.6 8.5
Nine months ended Nine months ended
Performance measures 30.09.17 30.09.16
Return on average allocated tangible equity 9.4% 6.9%
Average allocated tangible equity (£bn) 9.0 9.0
Cost: income ratio 66% 67%
Loan loss rate (bps) 43 56
Net interest margin 3.55% 3.63%

Results by Business
Barclays PLC 9
Analysis of Barclays UK Nine months ended Nine months ended 30.09.17 30.09.16 Analysis of total income £m £m % Change
Personal Banking 2,803 2,957 (5)
Barclaycard Consumer UK 1,532 1,515 1
Wealth, Entrepreneurs & Business Banking 1,178 1,217 (3)
Total income 5,513 5,689 (3)
Analysis of credit impairment charges and other provisions
Personal Banking (166) (133) (25)
Barclaycard Consumer UK (417) (565) 26
Wealth, Entrepreneurs & Business Banking (16) (18) 11
Total credit impairment charges and other provisions (599) (716) 16
As at As at As at
30.09.17 30.06.17 31.12.16
Analysis of loans and advances to customers at amortised cost £bn £bn £bn
Personal Banking 138.4 136.5 135.0
Barclaycard Consumer UK 16.3 16.2 16.5
Wealth, Entrepreneurs & Business Banking1 27.5 13.9 14.9
Total loans and advances to customers at amortised cost 182.2 166.6 166.4
Analysis of customer deposits
Personal Banking 140.1 138.5 139.3
Barclaycard Consumer UK - - -
Wealth, Entrepreneurs & Business Banking 49.2 48.9 49.7
Total customer deposits 189.3 187.4 189.0
1 Includes the integration of the ESHLA portfolio at amortised cost from Non-Core.

Results by Business
Barclays PLC 10
Barclays International Nine months ended Nine months ended
30.09.17 30.09.16
Income statement information £m £m % Change
Net interest income 3,320 3,466 (4)
Net trading income 3,036 3,449 (12)
Net fee, commission and other income 4,707 4,488 5
Total income 11,063 11,403 (3)
Credit impairment charges and other provisions (1,120) (929) (21)
Net operating income 9,943 10,474 (5)
Operating expenses excluding litigation and conduct (6,893) (6,632) (4)
Litigation and conduct (14) (31) 55
Operating expenses (6,907) (6,663) (4)
Other net income 233 27
Profit before tax 3,269 3,838 (15)
Attributable profit 2,015 2,369 (15)
As at As at As at
30.09.17 30.06.17 31.12.16
Balance sheet information £bn £bn £bn
Loans and advances to banks and customers at amortised cost1 220.7 204.8 211.3
Trading portfolio assets 91.2 83.3 73.2
Derivative financial instrument assets 242.8 108.4 156.2
Derivative financial instrument liabilities 242.9 116.8 160.6
Reverse repurchase agreements and other similar secured lending 15.5 17.2 13.4
Financial assets designated at fair value 103.7 94.1 62.3
Total assets 867.1 681.6 648.5
Customer deposits2 241.0 230.3 216.2
Loan: deposit ratio3 65% 69% 78%
Risk weighted assets 218.2 212.2 212.7
Period end allocated tangible equity 28.0 26.8 25.6
Nine months ended Nine months ended
Performance measures 30.09.17 30.09.16
Return on average allocated tangible equity 10.0% 12.9%
Average allocated tangible equity (£bn) 28.0 25.2
Cost: income ratio 62% 58%
Loan loss rate (bps) 67 52
Net interest margin 4.10% 4.01%
1 As at 30 September 2017 loans and advances included £190.5bn (June 2017: £183.9bn) of loans and advances to customers (including settlement
balances of £28.0bn (June 2017: £31.6bn) and cash collateral of £38.2bn (June 2017: £26.9bn)), and £30.2bn (June 2017: £20.9bn) of loans and advances
to banks (including settlement balances of £4.9bn (June 2017: £5.7bn) and cash collateral of £15.2bn (June 2017: £5.4bn)). Loans and advances to banks
and customers in respect of Consumer, Cards and Payments were £39.0bn (June 2017: £38.5bn).
2 As at 30 September 2017 customer deposits included settlement balances of £29.1bn (June 2017: £29.4bn) and cash collateral of £25.9bn (June 2017:
£16.2bn).
3 Loan: deposit ratio excludes investment banking balances other than interest earning lending. Comparatives have been restated to include interest
earning lending balances within the investment banking business.

Results by Business
Barclays PLC 11
Analysis of Barclays International
Corporate and Investment Bank Nine months ended Nine months ended
30.09.17 30.09.16
Income statement information £m £m % Change
Analysis of total income
Credit 954 924 3
Equities 1,267 1,380 (8)
Macro 1,314 1,799 (27)
Markets 3,535 4,103 (14)
Banking fees 2,007 1,747 15
Corporate lending 824 892 (8)
Transactional banking 1,221 1,256 (3)
Banking 4,052 3,895 4
Other 39 4
Total income 7,626 8,002 (5)
Credit impairment charges and other provisions (86) (170) 49
Operating expenses (5,358) (5,337) -
Other net income 126 -
Profit before tax 2,308 2,495 (7)
As at As at As at
30.09.17 30.06.17 31.12.16
Balance sheet information £bn £bn £bn
Loans and advances to banks and customers at amortised cost 181.7 166.3 171.6
Customer deposits 182.7 173.0 166.2
Risk weighted assets 185.2 178.9 178.6
Nine months ended Nine months ended
Performance measures 30.09.17 30.09.16
Return on average allocated tangible equity 8.4% 8.7%
Average allocated tangible equity (£bn) 23.8 21.6
Consumer, Cards and Payments Nine months ended Nine months ended
30.09.17 30.09.16
Income statement information £m £m % Change
Total income 3,437 3,401 1
Credit impairment charges and other provisions (1,034) (759) (36)
Total operating expenses (1,549) (1,326) (17)
Other net income 107 27
Profit before tax 961 1,343 (28)
As at As at As at
30.09.17 30.06.17 31.12.16
Balance sheet information £bn £bn £bn
Loans and advances to banks and customers at amortised cost 39.0 38.5 39.7
Customer deposits 58.3 57.3 50.0
Risk weighted assets 33.0 33.3 34.1
Nine months ended Nine months ended
Performance measures 30.09.17 30.09.16
Return on average allocated tangible equity 19.3% 38.3%
Average allocated tangible equity (£bn) 4.2 3.6

Results by Business
Barclays PLC 12
Head Office Nine months ended Nine months ended 30.09.17 30.09.16
Income statement information £m £m % Change
Net interest income (181) (212) 15
Net fee, commission and other income 189 324 (42)
Total income 8 112 (93)
Credit impairment charges and other provisions (14) -
Net operating (expenses)/income (6) 112
Operating expenses excluding litigation and conduct (201) (150) (34)
Litigation and conduct (76) (26)
Operating expenses (277) (176) (57)
Other net expenses (186) (31)
Loss before tax (469) (95)
Attributable loss (497) (113)
As at As at As at
30.09.17 30.06.17 31.12.16
Balance sheet information £bn £bn £bn
Total assets 51.7 17.3 75.2
Risk weighted assets1 36.1 26.2 53.3
Period end allocated tangible equity 10.4 9.0 9.7
Nine months ended Nine months ended
Performance measures 30.09.17 30.09.16
Average allocated tangible equity (£bn) 9.0 6.3
1 Includes Africa Banking RWAs of £8.6bn (June 2017: £9.8bn; December 2016 £42.3bn).

Quarterly Results Summary
Barclays PLC 13
Barclays Group
Q317 Q217 Q117 Q416 Q316 Q216 Q116 Q415
Income statement information £m £m £m £m £m £m £m £m
Net interest income 2,475 2,579 2,519 2,523 2,796 2,530 2,688 2,726
Net fee, commission and other income 2,698 2,479 3,304 2,469 2,650 3,442 2,353 1,722
Total income 5,173 5,058 5,823 4,992 5,446 5,972 5,041 4,448
Credit impairment charges and other
provisions (709) (527) (527) (653) (789) (488) (443) (554)
Net operating income 4,464 4,531 5,296 4,339 4,657 5,484 4,598 3,894
Operating expenses excluding UK bank levy
and litigation and conduct (3,274) (3,398) (3,591) (3,812) (3,581) (3,425) (3,747) (3,547)
UK bank levy - - - (410) - - - (426)
Litigation and conduct (81) (715) (28) (97) (741) (447) (78) (1,722)
Operating expenses (3,355) (4,113) (3,619) (4,319) (4,322) (3,872) (3,825) (5,695)
Other net (expenses)/income (2) 241 5 310 502 (342) 20 (274)
Profit/(loss) before tax 1,107 659 1,682 330 837 1,270 793 (2,075)
Tax (charge)/credit (324) (305) (473) 50 (328) (467) (248) (164)
Profit/(loss) after tax in respect of
continuing operations 783 354 1,209 380 509 803 545 (2,239)
(Loss)/profit after tax in respect of
discontinued operation - (1,537) (658) 71 209 145 166 101
Attributable to:
Ordinary equity holders of the parent 583 (1,401) 190 99 414 677 433 (2,422)
Other equity holders 157 162 139 139 110 104 104 107
Non-controlling interests 43 56 222 213 194 167 174 177
Balance sheet information £bn £bn £bn £bn £bn £bn £bn £bn
Total assets 1,149.3 1,135.3 1,203.8 1,213.1 1,324.0 1,351.3 1,248.9 1,120.0
Risk weighted assets 324.3 327.4 360.9 365.6 373.4 366.3 363.0 358.4
CRR leverage exposure 1,150.6 1,122.1 1,196.9 1,125.5 1,185.1 1,155.4 1,082.0 1,027.8
Performance measures
Return on average tangible shareholders'
equity 5.1% (11.0%) 1.8% 1.1% 3.6% 5.8% 3.8% (20.1%)
Average tangible shareholders' equity (£bn) 48.9 49.3 49.4 48.9 49.4 48.3 48.3 47.8
Cost: income ratio 65% 81% 62% 87% 79% 65% 76% 128%
Loan loss rate (bps) 66 49 47 58 66 41 40 53
Basic earnings/(loss) per share 3.7p (8.0p) 1.3p 0.8p 2.6p 4.2p 2.7p (14.4p)
Basic earnings/(loss) per share in respect of
continuing operations 3.7p 1.0p 6.1p 1.1p 2.1p 3.8p 2.2p (14.4p)

Quarterly Results by Business
Barclays PLC 14
Barclays UK
Q317 Q217 Q117 Q416 Q316 Q216 Q116 Q415
Income statement information £m £m £m £m £m £m £m £m
Net interest income 1,501 1,534 1,511 1,502 1,569 1,476 1,501 1,509
Net fee, commission and other income 351 286 330 326 374 467 302 325
Total income 1,852 1,820 1,841 1,828 1,943 1,943 1,803 1,834
Credit impairment charges and other
provisions (201) (220) (178)
(180) (350) (220) (146) (219)
Net operating income 1,651 1,600 1,663 1,648 1,593 1,723 1,657 1,615
Operating expenses excluding UK bank levy
and litigation and conduct (980) (974) (959)
(989) (904) (947) (952) (920)
UK bank levy - - - (48) - - - (77)
Litigation and conduct (11) (699) 4 (28) (614) (399) (1) (1,466)
Operating expenses (991) (1,673) (955) (1,065) (1,518) (1,346) (953) (2,463)
Other net income/(expenses) 1 (1) - - - (1) - 1
Profit/(loss) before tax 661 (74) 708 583 75 376 704 (847)
Attributable profit/(loss) 423 (285) 470 383 (163) 141 467 (1,078)
Balance sheet information £bn £bn £bn £bn £bn £bn £bn £bn
Loans and advances to customers at
amortised cost 182.2 166.6 164.5
166.4 166.6 166.0 166.2 166.1
Total assets 230.4 203.4 203.0 209.6 209.1 204.6 201.7 202.5
Customer deposits 189.3 187.4 184.4 189.0 185.5 181.7 179.1 176.8
Risk weighted assets 70.0 66.1 66.3 67.5 67.4 67.1 69.7 69.5
Performance measures
Return on average allocated tangible equity 18.4% (12.7%) 21.6% 18.2% (7.1%) 6.6% 20.5% (46.5%)
Average allocated tangible equity (£bn) 9.4 8.7 8.9 8.6 8.7 9.0 9.3 9.2
Cost: income ratio 54% 92% 52% 58% 78% 69% 53% 134%
Loan loss rate (bps) 43 52 43 42 82 52 34 51
Net interest margin 3.28% 3.70% 3.69% 3.56% 3.72% 3.56% 3.62% 3.58%

Quarterly Results by Business
Barclays PLC 15
Analysis of Barclays UK
Q317 Q217 Q117 Q416 Q316 Q216 Q116 Q415
Analysis of total income £m £m £m £m £m £m £m £m
Personal Banking 926 933 944 934 970 1,068 919 945
Barclaycard Consumer UK 539 495 498 507 561 463 491 505
Wealth, Entrepreneurs & Business Banking 387 392 399 387 412 412 393 384
Total income 1,852 1,820 1,841 1,828 1,943 1,943 1,803 1,834
Analysis of credit impairment charges and
other provisions
Personal Banking (60) (56) (50) (50) (47) (44) (42) (39)
Barclaycard Consumer UK (145) (149) (123) (118) (291) (169) (105) (176)
Wealth, Entrepreneurs & Business Banking 4 (15) (5) (12) (12) (7) 1 (4)
Total credit impairment charges and other
provisions (201) (220) (178)
(180) (350) (220) (146)
(219)
Analysis of loans and advances to
customers at amortised cost £bn £bn £bn £bn £bn £bn £bn £bn
Personal Banking 138.4 136.5 134.4 135.0 135.3 134.7 134.7 134.0
Barclaycard Consumer UK 16.3 16.2 16.1 16.5 16.2 16.2 16.0 16.2
Wealth, Entrepreneurs & Business Banking 27.5 13.9 14.0 14.9 15.1 15.1 15.5 15.9
Total loans and advances to customers at
amortised cost 182.2 166.6 164.5
166.4 166.6 166.0 166.2
166.1
Analysis of customer deposits
Personal Banking 140.1 138.5 137.3 139.3 137.2 134.8 132.9 131.0
Barclaycard Consumer UK - - - - - - - -
Wealth, Entrepreneurs & Business Banking 49.2 48.9 47.1 49.7 48.3 46.9 46.2 45.8
Total customer deposits 189.3 187.4 184.4 189.0 185.5 181.7 179.1 176.8

Quarterly Results by Business
Barclays PLC 16
Barclays International
Q317 Q217 Q117 Q416 Q316 Q216 Q116 Q415
Income statement information £m £m £m £m £m £m £m £m
Net interest income 1,148 1,060 1,112 1,046 1,355 1,001 1,110 1,121
Net trading income 815 1,039 1,182 1,131 1,074 1,130 1,245 593
Net fee, commission and other income 1,352 1,511 1,844 1,415 1,422 1,908 1,158 1,254
Total income 3,315 3,610 4,138 3,592 3,851 4,039 3,513 2,968
Credit impairment charges and other provisions (495) (279) (346) (426) (420) (240) (269) (303)
Net operating income 2,820 3,331 3,792 3,166 3,431 3,799 3,244 2,665
Operating expenses excluding UK bank levy and
litigation and conduct (2,182) (2,276) (2,435)
(2,497) (2,337) (2,074) (2,221)
(2,007)
UK bank levy - - - (284) - - - (253)
Litigation and conduct (5) 4 (13) (17) (17) (10) (4) (151)
Operating expenses (2,187) (2,272) (2,448) (2,798) (2,354) (2,084) (2,225) (2,411)
Other net income 19 202 12 5 8 11 8 8
Profit before tax 652 1,261 1,356 373 1,085 1,726 1,027 262
Attributable profit/(loss) 359 819 837 43 623 1,171 575 (24)
Balance sheet information £bn £bn £bn £bn £bn £bn £bn £bn
Loans and advances to banks and customers at
amortised cost 220.7 204.8 226.1
211.3 233.7 230.6 215.9
184.1
Trading portfolio assets 91.2 83.3 83.0 73.2 73.8 68.1 64.3 61.9
Derivative financial instrument assets 242.8 108.4 105.3 156.2 155.6 181.4 150.1 111.5
Derivative financial instrument liabilities 242.9 116.8 112.8 160.6 160.5 187.5 155.4 119.0
Reverse repurchase agreements and other
similar secured lending 15.5 17.2 17.6
13.4 17.3 19.7 19.1
24.7
Financial assets designated at fair value 103.7 94.1 81.3 62.3 72.0 68.3 59.6 46.8
Total assets 867.1 681.6 677.2 648.5 681.9 679.9 618.4 532.2
Customer deposits 241.0 230.3 241.0 216.2 224.1 226.5 213.1 185.6
Risk weighted assets 218.2 212.2 214.3 212.7 214.6 209.3 202.2 194.8
Performance measures
Return on average allocated tangible equity 5.4% 12.4% 12.5% 1.0% 10.0% 19.2% 9.5% (0.2%)
Average allocated tangible equity (£bn) 28.9 27.4 27.7 26.6 25.7 24.8 25.1 24.9
Cost: income ratio 66% 63% 59% 78% 61% 52% 63% 81%
Loan loss rate (bps) 88 54 62 78 71 41 50 65
Net interest margin 4.21% 4.07% 4.06% 3.91% 4.21% 3.92% 3.78% 3.79%

Quarterly Results by Business
Barclays PLC 17
Analysis of Barclays International
Corporate and Investment Bank Q317 Q217 Q117 Q416 Q316 Q216 Q116 Q415
Income statement information £m £m £m £m £m £m £m £m
Analysis of total income
Credit 259 296 399 261 333 269 322 195
Equities 350 455 462 410 461 406 513 319
Macro 368 456 490 505 614 612 573 382
Markets 977 1,207 1,351 1,176 1,408 1,287 1,408 896
Banking fees 607 674 726 650 644 622 481 458
Corporate lending 277 278 269 303 284 312 296 312
Transactional banking 419 404 398 401 458 390 408 415
Banking 1,303 1,356 1,393 1,354 1,386 1,324 1,185 1,185
Other - 1 38 1 1 - 3 16
Total income 2,280 2,564 2,782 2,531 2,795 2,611 2,596 2,097
Credit impairment (charges)/releases and other
provisions (36) 1 (51)
(90) (38) (37) (95)
(83)
Operating expenses (1,661) (1,756) (1,941) (2,287) (1,872) (1,665) (1,800) (1,962)
Other net income 10 116 - 1 - - - -
Profit before tax 593 925 790 155 885 909 701 52
Balance sheet information £bn £bn £bn £bn £bn £bn £bn £bn
Loans and advances to banks and customers at
amortised cost 181.7 166.3 187.4
171.6 196.9 195.2 183.0 152.0
Customer deposits 182.7 173.0 183.4 166.2 175.8 179.6 168.9 143.8
Risk weighted assets 185.2 178.9 180.6 178.6 182.5 178.4 172.6 167.3
Performance measures
Return on average allocated tangible equity 5.9% 11.1% 8.2% (1.2%) 9.2% 9.5% 7.3% (2.5%)
Average allocated tangible equity (£bn) 24.8 23.3 23.5 22.6 21.9 21.3 21.6 21.8
Consumer, Cards and Payments
Income statement information £m £m £m £m £m £m £m £m
Total income 1,035 1,046 1,356 1,061 1,056 1,428 917 871
Credit impairment charges and other provisions (459) (280) (295) (336) (382) (203) (174) (219)
Operating expenses (526) (516) (507) (511) (482) (419) (425) (449)
Other net income 9 86 12 4 8 11 8 8
Profit before tax 59 336 566 218 200 817 326 210
Balance sheet information £bn £bn £bn £bn £bn £bn £bn £bn
Loans and advances to banks and customers at
amortised cost 39.0 38.5 38.7
39.7 36.8 35.4 32.9
32.1
Customer deposits 58.3 57.3 57.6 50.0 48.3 46.9 44.2 41.8
Risk weighted assets 33.0 33.3 33.7 34.1 32.1 30.9 29.6 27.5
Performance measures
Return on average allocated tangible equity 2.2% 19.4% 36.4% 13.2% 14.8% 77.9% 23.4% 15.3%
Average allocated tangible equity (£bn) 4.2 4.1 4.2 4.0 3.7 3.5 3.4 3.2
Quarterly Results by Business
Barclays PLC 18
Head Office
Q317 Q217 Q117 Q416 Q316 Q216 Q116 Q415
Income statement information £m £m £m £m £m £m £m £m
Net interest income (174) 108 (115) 29 (206) 14 (20) (75)
Net fee, commission and other income1 180 (24) 33 (38) 17 320 (13) (210)
Total income 6 84 (82) (9) (189) 334 (33) (285)
Credit impairment (charges)/releases and
other provisions (13) (1) -
- 1 (2) 1
-
Net operating (expenses)/income (7) 83 (82) (9) (188) 332 (32) (285)
Operating expenses excluding UK bank levy
and litigation and conduct (112) (40) (49)
15 (29) (36) (85)
(64)
UK bank levy - - - (2) - - - (8)
Litigation and conduct (65) (1) (10) (1) (8) (11) (7) (17)
Operating expenses (177) (41) (59) 12 (37) (47) (92) (89)
Other net (expenses)/income (22) (164) - 159 (4) (28) 1 (14)
(Loss)/profit before tax (206) (122) (141) 162 (229) 257 (123) (388)
Attributable (loss)/profit (199) (175) (123) 223 (203) 182 (92) (140)
Balance sheet information £bn £bn £bn £bn £bn £bn £bn £bn
Total assets 51.7 17.3 74.5 75.2 73.3 87.7 63.4 59.4
Risk weighted assets2 36.1 26.2 52.9 53.3 47.5 43.2 40.3 39.7
Performance measures
Average allocated tangible equity (£bn) 10.5 8.8 7.6 7.2 7.4 6.6 5.0 3.9
1 Following the early adoption of the own credit provisions of IFRS 9 on 1 January 2017, own credit, which was previously reported in net fee, commission
and other income, is now recognised within other comprehensive income from Q117.
2 Includes Africa Banking RWAs.

Barclays Non-Core Results
Barclays PLC 19
The Non-Core segment was closed on 1 July 2017 with the residual assets and liabilities reintegrated into, and associated
financial performance subsequently reported in, Barclays UK, Barclays International and Head Office. Financial results up
until 30 June 2017 are reflected in the Non-Core segment within the Group‟s results for the nine months ended 30
September 2017.
Barclays Non-Core Six months ended Nine months ended
30.06.17 30.09.16
Income statement information £m £m
Net interest income (112) 214
Net trading income (488) (1,241)
Net fee, commission and other income 70 282
Total income (530) (745)
Credit impairment charges and other provisions (30) (75)
Net operating expenses (560) (820)
Operating expenses excluding litigation and conduct (256) (1,168)
Litigation and conduct (28) (195)
Operating expenses (284) (1,363)
Other net income 197 185
Loss before tax (647) (1,998)
Attributable loss (419) (1,418)
Q317 Q217 Q117 Q416 Q316 Q216 Q116 Q415
Income statement information £m £m £m £m £m £m £m £m
Net interest income - (123) 11 (54) 78 40 96 171
Net trading income - (411) (77) (462) (288) (463) (490) (398)
Net fee, commission and other income - 78 (8) 97 51 79 152 159
Total income - (456) (74) (419) (159) (344) (242) (68)
Credit impairment charges and other
provisions - (27) (3) (47) (20) (26) (29) (32)
Net operating expenses - (483) (77) (466) (179) (370) (271) (100)
Operating expenses excluding UK bank levy
and litigation and conduct - (108) (148) (341) (311) (368) (489) (555)
UK bank levy - - - (76) - - - (88)
Litigation and conduct - (19) (9) (51) (102) (27) (66) (89)
Operating expenses - (127) (157) (468) (413) (395) (555) (732)
Other net income/(expenses) - 204 (7) 146 498 (324) 11 (268)
Loss before tax - (406) (241) (788) (94) (1,089) (815) (1,100)
Tax credit/(charge) - 207 75 322 194 229 237 (72)
(Loss)/profit after tax - (199) (166) (466) 100 (860) (578) (1,172)
Non-controlling interests - (8) (9) (14) (13) (12) (10) (19)
Other equity holders - (19) (18) (18) (15) (15) (15) (17)
Attributable (loss)/profit - (226) (193) (498) 72 (887) (603) (1,208)
Balance sheet information £bn £bn £bn £bn £bn £bn £bn £bn
Loans and advances to banks and customers
at amortised cost - 48.3 49.5 51.1 58.7 68.5 55.4 51.8
Derivative financial instrument assets - 150.3 164.2 188.7 253.2 262.8 249.7 213.7
Derivative financial instrument liabilities - 143.0 155.3 178.6 243.0 253.4 239.1 202.1
Reverse repurchase agreements and other
similar secured lending - - - 0.1 0.1 0.1 0.7 3.1
Financial assets designated at fair value - 12.1 13.4 14.5 15.5 15.4 23.4 21.4
Total assets - 233.0 249.1 279.7 359.8 379.1 365.4 325.8
Customer deposits - 11.8 12.9 12.5 16.0 17.4 19.3 20.9
Risk weighted assets - 22.8 27.4 32.1 43.9 46.7 50.9 54.3

Discontinued Operation Results
Barclays PLC 20
On 1 March 2016, Barclays announced its intention to reduce the Group‟s 62.3% interest in BAGL to a level which would
permit Barclays to deconsolidate BAGL from a regulatory perspective and, prior to that, from an accounting perspective.
From this date, BAGL was treated as a discontinued operation. On 5 May 2016, Barclays sold 12.2% of the Group‟s interest
in BAGL and on 1 June 2017 Barclays sold a further 33.7% of BAGL‟s issued share capital, resulting in the accounting
deconsolidation of BAGL from the Barclays Group. As a result, as of 1 June 2017 BAGL was consequently no longer reported
as a discontinued operation. The retained investment is reported in the Head Office segment, with Barclays‟ share of BAGL‟s
dividend recognised in the Head Office income statement.
In Q317 Barclays contributed 1.5% of BAGL‟s ordinary shares to a Black Economic Empowerment scheme, resulting in
Barclays accounting for 126 million ordinary shares in BAGL, representing 14.9% of BAGL‟s issued share capital, at 30
September 2017.
For regulatory reporting purposes, BAGL is treated on a proportional consolidated basis based on a holding of 21.9%.
Barclays expects to proportionally consolidate BAGL based on a holding of 14.9% by 31 December 2017, following the
expected delivery of 7.0% of BAGL‟s issued share capital as previously contracted. Subject to regulatory approval, Barclays
expects to fully deconsolidate BAGL from a regulatory perspective by the end of 2018.
Africa Banking Nine months ended Nine months ended
30.09.171 30.09.16
Income statement information £m £m
Net interest income 1,024 1,543
Net fee, commission and other income 762 1,136
Total income 1,786 2,679
Credit impairment charges and other provisions (177) (340)
Net operating income 1,609 2,339
Operating expenses excluding impairment of Barclays' holding in BAGL (1,130) (1,618)
Other net income excluding loss on sale of BAGL 5 4
Profit before tax excluding impairment of Barclays' holding in BAGL and loss on
sale of BAGL 484 725
Impairment of Barclays' holding in BAGL (1,090) -
Loss on sale of BAGL (1,435) -
(Loss)/profit before tax (2,041) 725
Tax charge (154) (205)
(Loss)/profit after tax (2,195) 520
Attributable (loss)/profit (2,335) 240
1 The Africa Banking income statement represents five months of results as a discontinued operation to 31 May 2017.
Q317 Q2171 Q117 Q416 Q316 Q216 Q116 Q415
Income statement information £m £m £m £m £m £m £m £m
Net interest income - 407 617 626 561 502 480 468
Net fee, commission and other income - 297 465 441 421 377 338 346
Total income - 704 1,082 1,067 982 879 818 814
Credit impairment charges and other provisions - (71) (106) (105) (96) (133) (111) (93)
Net operating income - 633 976 962 886 746 707 721
Operating expenses excluding UK bank levy and
impairment of Barclays' holding in BAGL - (477) (653) (727) (598) (543) (477) (501)
UK bank levy - - - (65) - - - (50)
Other net income excluding loss on sale of BAGL - 3 2 2 2 1 1 3
Profit before tax excluding impairment of
Barclays' holding in BAGL and loss on sale of
BAGL
- 159 325 172 290 204 231 173
Impairment of Barclays' holding in BAGL - (206) (884) - - - - -
Loss on sale of BAGL - (1,435) - - - - - -
(Loss)/profit before tax - (1,482) (559) 172 290 204 231 173
(Loss)/profit after tax - (1,537) (658) 71 209 145 166 101
Attributable (loss)/profit - (1,534) (801) (52) 85 70 86 25
Balance sheet information £bn £bn £bn £bn £bn £bn £bn £bn
Total assets - - 66.0 65.1 61.1 56.0 52.7 47.9
Risk weighted assets2 - 9.8 41.3 42.3 39.9 36.1 33.9 31.7
1 The Q217 Africa Banking income statement represents two months of results as a discontinued operation to 31 May 2017.
2 RWAs are reported in Head Office.

Performance Management
Barclays PLC 21
Margins and balances Nine months ended 30.09.17 Nine months ended 30.09.16
Net interest
income
Average
customer
assets
Net interest
margin
Net interest
income
Average
customer
assets
Net interest
margin
£m £m % £m £m %
Barclays UK 4,546 171,279 3.55 4,546 167,306 3.63
Barclays International1 3,255 106,183 4.10 3,165 105,507 4.01
Total Barclays UK and Barclays International 7,801 277,462 3.76 7,711 272,813 3.78
Other2 (228) 303
Total net interest income3 7,573 8,014
1 Barclays International margins include interest earning lending balances within the investment banking business.
2 Other includes Head Office and non-lending related investment banking balances. Barclays Non-Core is included for the full comparative period and the
first six months of the current period.
3 Group net interest income includes net structural hedge contributions of £1.1bn (Q316 YTD: £1.0bn).
Quarterly analysis for Barclays UK and Barclays International Three months ended 30.09.17
Net interest
income
Average
customer
assets
Net interest
margin
£m £m %
Barclays UK 1,501 181,419 3.28
Barclays International1 1,070 100,828 4.21
Total Barclays UK and Barclays International 2,571 282,247 3.61
Three months ended 30.06.17
Barclays UK 1,534 166,345 3.70
Barclays International1 1,064 104,899 4.07
Total Barclays UK and Barclays International 2,598 271,244 3.84
Three months ended 31.03.17
Barclays UK 1,511 166,065 3.69
Barclays International1 1,121 112,060 4.06
Total Barclays UK and Barclays International 2,632 278,125 3.84
Three months ended 31.12.16
Barclays UK 1,502 167,935 3.56
Barclays International1 1,110 112,936 3.91
Total Barclays UK and Barclays International 2,612 280,871 3.70
Three months ended 30.09.16
Barclays UK 1,569 167,713 3.72
Barclays International1 1,149 108,571 4.21
Total Barclays UK and Barclays International 2,718 276,284 3.91
1 Barclays International margins include interest earning lending balances within the investment banking business.

Credit Risk
Barclays PLC 22
Analysis of retail and wholesale loans and advances and impairment
Gross
loans and
advances
Impairment
allowance
Loans and
advances
net of
impairment
Credit
risk loans
CRLs % of
gross
loans and
advances
Loan
impairment
charges1
Loan loss
rates
As at 30.09.17 £m £m £m £m % £m bps
Barclays UK 157,171 1,638 155,533 1,854 1.2 584 50
Barclays International 31,561 1,713 29,848 1,231 3.9 1,048 444
Head Office 9,537 291 9,246 713 7.5 11 15
Barclays Non-Core2 - - - - - 30 -
Total Group retail 198,269 3,642 194,627 3,798 1.9 1,673 113
Barclays UK 28,740 261 28,479 576 2.0 15 7
Barclays International 191,566 742 190,824 1,609 0.8 69 5
Head Office 7,595 118 7,477 210 2.8 4 7
Barclays Non-Core2 - - - - - (1) -
Total Group wholesale 227,901 1,121 226,780 2,395 1.1 87 5
Group total 426,170 4,763 421,407 6,193 1.5 1,760 55
Traded loans 3,856 n/a 3,856 n/a
Loans and advances designated at fair
value 11,013 n/a 11,013 n/a
Loans and advances held at fair value 14,869 n/a 14,869 n/a
Total loans and advances 441,039 4,763 436,276 6,193
As at 31.12.16
Barclays UK 155,729 1,519 154,210 2,044 1.3 866 56
Barclays International 33,485 1,492 31,993 1,249 3.7 1,085 324
Barclays Non-Core 10,319 385 9,934 838 8.1 102 99
Total Group retail 199,533 3,396 196,137 4,131 2.1 2,053 103
Barclays UK 15,204 282 14,922 591 3.9 30 20
Barclays International 180,102 748 179,354 1,470 0.8 258 14
Head Office 4,410 - 4,410 - - - -
Barclays Non-Core 41,406 194 41,212 299 0.7 11 3
Total Group wholesale 241,122 1,224 239,898 2,360 1.0 299 12
Group total 440,655 4,620 436,035 6,491 1.5 2,352 53
Traded loans 2,975 n/a 2,975 n/a
Loans and advances designated at fair
value 10,519 n/a 10,519 n/a
Loans and advances held at fair value 13,494 n/a 13,494 n/a
Total loans and advances 454,149 4,620 449,529 6,491
1 Excludes impairment charges on available for sale investments and reverse repurchase agreements. Q317 impairment charges represent nine months
charge; December 2016 impairment charges represent twelve months charge.
2 Barclays Non-Core represents charges for the six months ended 30 June 2017, primarily relating to Italian mortgages transferred into Head Office on 1 July
2017.

Condensed Consolidated Financial Statements
Barclays PLC 23
Consolidated summary income statement
Nine months ended Nine months ended
30.09.17 30.09.16
£m £m
Total income 16,054 16,459
Credit impairment charges and other provisions (1,763) (1,720)
Net operating income 14,291 14,739
Operating expenses (10,263) (10,753)
Litigation and conduct (824) (1,266)
Operating expenses (11,087) (12,019)
Other net income 244 180
Profit before tax 3,448 2,900
Tax charge (1,102) (1,043)
Profit after tax in respect of continuing operations 2,346 1,857
(Loss)/profit after tax in respect of discontinued operation (2,195) 520
Profit after tax 151 2,377
Attributable to:
Ordinary equity holders of the parent (628) 1,524
Other equity holders1 458 318
Total equity holders (170) 1,842
Non-controlling interests in respect of continuing operations 181 255
Non-controlling interests in respect of discontinued operation 140 280
Profit after tax 151 2,377
Earnings per share
Basic (loss)/earnings per ordinary share1 (3.0p) 9.6p
Basic earnings per ordinary share in respect of continuing operations1 10.8p 8.1p
Basic (loss)/earnings per ordinary share in respect of discontinued operation (13.8p) 1.5p
1 The profit after tax attributable to other equity holders of £458m (Q316 YTD: £318m) is offset by a tax credit recorded in reserves of £125m (Q316 YTD:
£89m). The net amount of £333m (Q316 YTD: £229m), along with non-controlling interests (NCI) is deducted from profit after tax in order to calculate
earnings per share and return on average tangible shareholders’ equity.

Condensed Consolidated Financial Statements
Barclays PLC 24
Consolidated summary balance sheet
As at As at
30.09.17 31.12.16
Assets £m £m
Cash and balances at central banks 175,826 102,353
Items in the course of collection from other banks 1,923 1,467
Trading portfolio assets 92,456 80,240
Financial assets designated at fair value 115,504 78,608
Derivative financial instruments 244,457 346,626
Financial investments 61,879 63,317
Loans and advances to banks 37,890 43,251
Loans and advances to customers 383,517 392,784
Reverse repurchase agreements and other similar secured lending 15,464 13,454
Goodwill and intangible assets 7,759 7,726
Current tax assets 913 561
Deferred tax assets 4,460 4,869
Assets included in disposal groups classified as held for sale 378 71,454
Other assets 6,829 6,416
Total assets 1,149,255 1,213,126
Liabilities
Deposits from banks 51,026 48,214
Items in the course of collection due to other banks 793 636
Customer accounts 445,148 423,178
Repurchase agreements and other similar secured borrowing 34,207 19,760
Trading portfolio liabilities 41,626 34,687
Financial liabilities designated at fair value 150,453 96,031
Derivative financial instruments 243,668 340,487
Debt securities in issue 77,762 75,932
Subordinated liabilities 25,085 23,383
Current tax liabilities 1,033 737
Deferred tax liabilities 30 29
Liabilities included in disposal groups classified as held for sale 326 65,292
Other liabilities 11,053 13,395
Total liabilities 1,082,210 1,141,761
Equity
Called up share capital and share premium 22,017 21,842
Other reserves 5,074 6,051
Retained earnings 28,618 30,531
Shareholders' equity attributable to ordinary shareholders of the parent 55,709 58,424
Other equity instruments 8,940 6,449
Total equity excluding non-controlling interests 64,649 64,873
Non-controlling interests 2,396 6,492
Total equity 67,045 71,365
Total liabilities and equity 1,149,255 1,213,126

Condensed Consolidated Financial Statements
Barclays PLC 25
Consolidated statement of changes in equity
Called up
share
capital
and share
premium
Other equity
instruments
Other
reserves
Retained
earnings Total
Non-
controlling
interests
Total
equity
Nine months ended 30.09.17 £m £m £m £m £m £m £m
Balance as at 31 December 2016 21,842 6,449 6,051 30,531 64,873 6,492 71,365
Effects of changes in accounting policies1 - - (175) 175 - - -
Balance as at 1 January 2017 21,842 6,449 5,876 30,706 64,873 6,492 71,365
Profit after tax - 458 - 1,707 2,165 181 2,346
Other comprehensive profit after tax for the period - - (2,155) 18 (2,137) (1) (2,138)
Total comprehensive income net of tax from
continuing operations - 458 (2,155) 1,725 28 180 208
Total comprehensive income net of tax from
discontinued operation - - 1,332 (2,335) (1,003) 109 (894)
Total comprehensive income for the period - 458 (823) (610) (975) 289 (686)
Issue of shares 117 - - - 117 - 117
Issue of shares under employee share schemes 58 - - 381 439 - 439
Issue and exchange of equity instruments - 2,490 - - 2,490 - 2,490
Coupons paid on other equity instruments - (458) - 125 (333) - (333)
Redemption and buy back of capital instruments - - - (473) (473) (657) (1,130)
Treasury shares - - 15 (618) (603) - (603)
Dividends - - - (509) (509) (348) (857)
Net equity impact of partial BAGL disposal - - - (359) (359) (3,443) (3,802)
Other movements - 1 6 (25) (18) 63 45
Balance as at 30 September 2017 22,017 8,940 5,074 28,618 64,649 2,396 67,045
Three months ended 30.09.17
Balance as at 30 June 2017 21,998 7,694 6,148 28,026 63,866 2,397 66,263
Effects of changes in accounting policies1 - - - - - - -
Balance as at 1 July 2017 21,998 7,694 6,148 28,026 63,866 2,397 66,263
Profit after tax - 157 - 583 740 43 783
Other comprehensive profit after tax for the period - - (1,081) 32 (1,049) - (1,049)
Total comprehensive income net of tax from
continuing operations - 157 (1,081) 615 (309) 43 (266)
Total comprehensive income net of tax from
discontinued operation - - - - - - -
Total comprehensive income for the period - 157 (1,081) 615 (309) 43 (266)
Issue of shares 10 - - - 10 - 10
Issue of shares under employee share schemes 9 - - 97 106 - 106
Issue and exchange of equity instruments - 1,245 - - 1,245 - 1,245
Coupons paid on other equity instruments - (157) - 43 (114) - (114)
Redemption and buy back of capital instruments - - - - - - -
Treasury shares - - 1 (1) - - -
Dividends - - - (170) (170) (41) (211)
Net equity impact of partial BAGL disposal - - - - - - -
Other movements - 1 6 8 15 (3) 12
Balance as at 30 September 2017 22,017 8,940 5,074 28,618 64,649 2,396 67,045
As at As at As at 30.09.17 30.06.17 31.12.16
Other reserves £m £m £m
Currency translation reserve 3,140 3,756 3,051 Available for sale reserve (113) (16) (74) Cash flow hedging reserve 1,196 1,578 2,105
Own credit reserve (133) (153) - Other2 984 983 969
Total 5,074 6,148 6,051
1 As a result of the early adoption of the own credit provisions of IFRS 9 on 1 January 2017, own credit which was previously recorded in the income
statement is now recognised within other comprehensive income. The cumulative unrealised own credit net loss of £175m has therefore been reclassified
from retained earnings to a separate own credit reserve, within other reserves. During Q317 YTD a £42m gain on own credit has been booked in the
reserve.
2 As at 30 September 2017, there was a credit balance of £1,011m (June 2017: £1,011m credit; December 2016: £1,011m credit) in other reserves relating
to the excess repurchase price paid over nominal of redeemed ordinary and preference shares issued by the group and a debit balance of £27m (June
2017: £28m debit; December 2016: £42m debit) in other reserves relating to treasury shares.

Barclays PLC Parent Company
Barclays PLC 26
Summary balance sheet
As at As at
30.09.17 31.12.16
Assets £m £m
Investments in subsidiaries 39,353 36,553
Loans and advances to subsidiaries 22,451 19,421
Financial investments 4,746 1,218
Derivative financial instruments 137 268
Other assets 114 105
Total assets 66,801 57,565
Liabilities
Deposits from banks 511 547
Subordinated liabilities 6,442 3,789
Debt securities in issue 20,643 16,893
Other liabilities 59 14
Total liabilities 27,655 21,243
Equity
Called up share capital and share premium 22,017 21,842
Other equity instruments 8,942 6,453
Other reserves 458 420
Retained earnings 7,729 7,607
Total equity 39,146 36,322
Total liabilities and equity 66,801 57,565
Investments in subsidiaries
The investment in subsidiaries of £39,353m (December 2016: £36,553m) mainly represents investments made into
Barclays Bank PLC, including £8,986m (December 2016: £6,486m) of Additional Tier 1 (AT1) securities. The increase of
£2,800m was driven by AT1 issuances of £2,500m during the period, as well as a £300m investment in the Group Service
Company.
Loans and advances to subsidiaries, subordinated liabilities and debt securities in issue
For the nine months ended 30 September 2017, Barclays PLC issued $2bn of Fixed Rate Subordinated Notes and €1.5bn of
Fixed Rate Subordinated Notes included within the subordinated liabilities balance of £6,442m (December 2016: £3,789m),
$5bn of Fixed and Floating Rate Senior Notes and £950m of Fixed Rate Senior Notes included within the debt securities in
issue balance of £20,643m (December 2016: £16,893m). The proceeds raised through these transactions were used to
invest in Barclays Bank PLC in each case with a ranking corresponding to the notes issued by Barclays PLC and included
within the loans and advances to subsidiary balance of £22,451m (December 2016: £19,421m).
Management of internal investments, loans and advances
Barclays PLC retains the discretion to manage the nature of its internal investments in subsidiaries according to their
regulatory and business needs. As we implement our structural reform programme, Barclays PLC will invest capital and
funding to Barclays Bank PLC, the Group Service Company and other Group subsidiaries such as the US Intermediate
Holding Company (IHC) and the UK ring-fenced bank.
Structural reform Barclays‟ plans for UK ring-fencing remain on track. The relevant court processes are scheduled to begin in November 2017,
and we intend to complete the restructure and fully establish the UK ring-fenced bank in April 2018, ahead of the 1 January
2019 legislative deadline for implementation.
Barclays Services Limited (the “Group Service Company”) has been established as a direct subsidiary of Barclays PLC to
deliver operational continuity and to drive operational efficiencies across the Group. In September 2017, Barclays
transferred c.£3.8bn of assets and liabilities from Barclays Bank PLC and its subsidiaries to the Group Service Company.

Treasury and Capital Risk
Barclays PLC 27
CRD IV capital
Barclays‟ current regulatory requirement is to meet a fully loaded CET1 ratio comprising the required 4.5% Pillar 1 minimum
CET1 requirement and, phased in from 2016, a Combined Buffer Requirement. This currently comprises a Capital
Conservation Buffer (CCB) and a Global Systemically Important Institution (G-SII) buffer determined by the PRA in line with
guidance from the Financial Stability Board (FSB). Both buffers are subject to phased implementation at 25% per annum
from 2016 with full effect from 2019. The CCB has been set at 2.5% with 1.25% applicable for 2017. The G-SII buffer for
2017 has been set at 2% with 1% applicable for 2017. On 21 November 2016 the FSB confirmed that the G-SII buffer for
2018 will be 1.5% with 1.1% applicable for 2018.
The Combined Buffer Requirement also includes a Counter-Cyclical Capital Buffer (CCyB) and a Systemic Risk Buffer (SRB).
On 27 June 2017 the Financial Policy Committee (FPC) increased the UK CCyB rate from 0% to 0.5% applicable from 27
June 2018. Other national authorities also determine the appropriate CCyBs that should be applied to exposures in their
jurisdiction. CCyBs have started to apply for Barclays‟ exposures to other jurisdictions; however based on current exposures
these are not material. No SRB has been set to date.
In addition, Barclays‟ Pillar 2A requirement as per the PRA‟s Individual Capital Guidance (ICG) for 2017 based on a point in
time assessment is 4.2% of which 56% needs to be met in CET1 form, equating to approximately 2.3% of RWAs. The Pillar
2A requirement is subject to at least annual review.
For regulatory reporting purposes, BAGL is treated on a proportional consolidated basis based on Barclays‟ holding in BAGL
of 21.9%.
As at 30 September 2017, Barclays‟ CET1 ratio was 13.1% which exceeds the 2017 transitional minimum requirement of
9.1% including the minimum 4.5% CET1 ratio requirement, 2.3% of Pillar 2A, a 1.25% CCB buffer, a 1% G-SII buffer and a
0% CCyB.

Treasury and Capital Risk
Barclays PLC 28
Capital ratios As at As at As at
30.09.17 30.06.17 31.12.16
Fully loaded CET11,2 13.1% 13.1% 12.4%
PRA Transitional Tier 13,4 16.9% 16.6% 15.6%
PRA Transitional Total Capital3,4 21.2% 20.7% 19.6%
Capital resources £m £m £m
Shareholders' equity (excluding non-controlling interests) per the balance sheet 64,649 63,866 64,873
Less: other equity instruments (recognised as AT1 capital) (8,940) (7,694) (6,449)
Adjustment to retained earnings for foreseeable dividends (284) (303) (388)
Minority Interests (amount allowed in consolidated CET1) - - 1,825
Other regulatory adjustments and deductions:
Additional value adjustments (PVA) (1,462) (1,494) (1,571)
Goodwill and intangible assets (7,787) (7,756) (9,054)
Deferred tax assets that rely on future profitability excluding temporary differences (482) (346) (494)
Fair value reserves related to gains or losses on cash flow hedges (1,195) (1,576) (2,104)
Excess of expected losses over impairment (1,423) (1,179) (1,294)
Gains or losses on liabilities at fair value resulting from own credit 28 58 86
Defined-benefit pension fund assets (683) (542) (38)
Direct and indirect holdings by an institution of own CET1 instruments (50) (50) (50)
Deferred tax assets arising from temporary differences (amount above 10% threshold) - (115) (183)
Other regulatory adjustments (42) (35) 45
Fully loaded CET1 capital 42,329 42,834 45,204
Additional Tier 1 (AT1) capital
Capital instruments and related share premium accounts 8,940 7,694 6,449
Qualifying AT1 capital (including minority interests) issued by subsidiaries 3,802 3,843 5,445
Other regulatory adjustments and deductions (130) (130) (130)
Transitional AT1 capital5 12,612 11,407 11,764
PRA Transitional Tier 1 capital 54,941 54,241 56,968
Tier 2 (T2) capital
Capital instruments and related share premium accounts 6,371 5,198 3,769
Qualifying T2 capital (including minority interests) issued by subsidiaries 7,839 8,486 11,366
Other regulatory adjustments and deductions (251) (252) (257)
PRA Transitional total regulatory capital 68,900 67,673 71,846
1 The transitional regulatory adjustments to CET1 capital are no longer applicable resulting in CET1 capital on a fully loaded basis being equal to that on a
transitional basis.
2 The CRD IV CET1 ratio (FSA October 2012 transitional statement) as applicable to Barclays’ Tier 2 Contingent Capital Notes was 13.7% based on £44.3bn
of transitional CRD IV CET1 capital and £324bn of RWAs.
3 The PRA transitional capital is based on the PRA Rulebook and accompanying supervisory statements.
4 As at 30 September 2017, Barclays’ fully loaded Tier 1 capital was £51,139m, and the fully loaded Tier 1 ratio was 15.8%. Fully loaded total regulatory
capital was £65,936m and the fully loaded total capital ratio was 20.3%. The fully loaded Tier 1 capital and total capital measures are calculated without
applying the transitional provisions set out in CRD IV and assessing compliance of AT1 and T2 instruments against the relevant criteria in CRD IV.
5 Of the £12.6bn transitional AT1 capital, fully loaded AT1 capital comprises the £8.9bn of contingent convertible instruments issued by Barclays PLC (the
holding company) and related share premium accounts, and £0.1bn capital deductions. It excludes £3.8bn legacy tier 1capital instruments issued by
subsidiaries and subject to grandfathering. For the leverage ratio, only the AT1 capital on a fully loaded basis is applicable.

Treasury and Capital Risk
Barclays PLC 29
Movement in CET1 capital
Three
months
Nine
months
ended ended
30.09.17 30.09.17
£m £m
Opening CET1 capital 42,834 45,204
Profit/(loss) for the period attributable to equity holders 740 (170)
Own credit relating to derivative liabilities (10) 69
Dividends paid and foreseen (265) (738)
Increase/(decrease) in retained regulatory capital generated from earnings 465 (839)
Net impact of share schemes 116 (47)
Available for sale reserves (97) (39)
Currency translation reserves (616) 89
Other reserves (13) (947)
Decrease in other qualifying reserves (610) (944)
Retirement benefit reserve 52 23
Defined-benefit pension fund asset deduction (141) (645)
Net impact of pensions (89) (622)
Minority interests - (1,825)
Additional value adjustments (PVA) 32 109
Goodwill and intangible assets (31) 1,267
Deferred tax assets that rely on future profitability excluding those arising from temporary differences (136) 12
Excess of expected loss over impairment (244) (129)
Deferred tax assets arising from temporary differences (amount above 10% threshold) 115 183
Other regulatory adjustments (7) (87)
Decrease in regulatory capital due to adjustments and deductions (271) (470)
Closing CET1 capital 42,329 42,329
CET1 capital decreased to £42.3bn (December 2016: £45.2bn) due to the following:
A £0.2bn loss for the period attributable to equity holders as £2.2bn profit after tax in respect of continuing operations
was more than offset by losses in respect of the discontinued operation of £2.3bn. These losses, resulting from the
impairment of Barclays‟ holding in BAGL allocated to goodwill and the recycling of BAGL currency translation reserve
losses to the income statement, had no impact on CET1 capital with offsetting movements in the goodwill and
intangible assets deduction and other qualifying reserves
A £0.7bn decrease for dividends paid and foreseen
A £0.1bn increase in the currency translation reserve largely due to the £1.4bn recycling of BAGL losses to the income
statement which were offset by a £1.3bn decrease driven by the appreciation of GBP against USD
A £0.9bn decrease in other qualifying reserves which included a £0.5bn decrease as a result of USD preference share
redemptions and £0.4bn of separation payments in relation to the sale of Barclays‟ holding in BAGL
A £0.6bn decrease net of tax as a result of movements relating to pensions. The pension asset capital deduction
increase relates to the UK Retirement Fund scheme, which is the Group‟s main pension scheme, moving from a small
deficit in December 2016 to a £0.9bn surplus largely due to contributions in the period
A £1.8bn decrease due to BAGL minority interests which are no longer eligible as a result of proportional consolidation
of BAGL
A £1.3bn increase due to a reduced goodwill and intangible assets deduction largely as a result of the impairment of
Barclays‟ holding in BAGL allocated to goodwill

Treasury and Capital Risk
Barclays PLC 30
Risk weighted assets (RWAs) by risk type and business
Credit risk Counterparty credit risk Market risk
Operational
risk
Total
RWAs
Std IRB Std IRB
Settle-
ment
Risk CVA Std IMA
As at 30.09.17 £m £m £m £m £m £m £m £m £m £m
Barclays UK 4,278 53,364 3 - - 31 - - 12,338 70,014
Barclays International 47,775 79,013 17,830 17,387 68 2,847 12,985 12,774 27,537 218,216
Head Office1 4,241 12,274 89 585 - 151 114 1,827 16,785 36,066
Barclays Group 56,294 144,651 17,922 17,972 68 3,029 13,099 14,601 56,660 324,296
As at 30.06.17
Barclays UK 3,768 49,979 3 - - 31 - - 12,338 66,119
Barclays International 49,382 81,109 15,456 13,962 32 2,205 11,100 11,460 27,538 212,244
Head Office1 2,612 7,891 68 535 - 207 146 1,876 12,871 26,206
Barclays Non-Core 2,627 9,102 874 4,072 - 590 294 1,373 3,913 22,845
Barclays Group 58,389 148,081 16,401 18,569 32 3,033 11,540 14,709 56,660 327,414
As at 31.12.16
Barclays UK 5,592 49,591 47 - - - - - 12,293 67,523
Barclays International 53,201 82,327 13,515 13,706 30 3,581 9,343 9,460 27,538 212,701
Head Office1 9,048 27,122 77 1,157 - 927 482 2,323 12,156 53,292
Barclays Non-Core 4,714 9,945 1,043 6,081 37 2,235 477 2,928 4,673 32,133
Barclays Group 72,555 168,985 14,682 20,944 67 6,743 10,302 14,711 56,660 365,649
1 Includes Africa Banking RWAs.
Movement analysis of RWAs
Credit risk
Counterparty
credit risk Market risk
Operational
risk Total RWAs
£bn £bn £bn £bn £bn
As at 01.01.17 241.5 42.4 25.0 56.7 365.6
Book size (3.3) (1.6) 4.3 - (0.6)
Acquisitions and disposals (28.7) (1.4) (1.5) - (31.6)
Book quality (2.3) 0.1 0.1 - (2.1)
Model updates (1.3) - - - (1.3)
Methodology and policy (0.2) (0.5) (0.2) - (0.9)
Foreign exchange movements1 (4.8) - - - (4.8)
As at 30.09.17 200.9 39.0 27.7 56.7 324.3
1 Foreign exchange movement does not include FX for modelled counterparty risk or modelled market risk.
RWAs decreased £41.4bn to £324.3bn, due to:
Acquisitions and disposals decreased RWAs £31.6bn primarily as a result of the proportional consolidation of BAGL
Book quality decreased RWAs £2.1bn primarily due to changes in risk profile in Barclays International
Model updates decreased RWAs £1.3bn primarily due to model changes in Africa Banking prior to the sell down of
Barclays‟ holding in BAGL
Foreign exchange movements decreased RWAs £4.8bn primarily due to the depreciation of USD against GBP

Treasury and Capital Risk
Barclays PLC 31
Leverage ratio and exposures
Barclays is subject to a leverage ratio requirement that is implemented on a phased basis, with a transitional requirement of
3.4% as at 30 September 2017; this comprises the 3% minimum requirement, a transitional G-SII additional leverage ratio
buffer (G-SII ALRB) and a countercyclical leverage ratio buffer (CCLB). Based on both future and proposed requirements,
the expected end point leverage requirement is 4.0%. Additionally, the CRR fully loaded leverage requirement is currently
expected to be 3%, although this may be impacted by the Basel Consultation on the Leverage Framework.
Barclays is required to disclose an average UK leverage ratio which is based on capital and exposure measures on the last
day of each month in the quarter; as well as a UK leverage ratio which is based on the last day of the quarter. Both
approaches exclude qualifying cash at central banks from the calculation of leverage exposures. There is also a CRR
leverage ratio disclosure requirement, which is based on the end point CRR definition of Tier 1 capital and the CRR
definition of leverage exposure.
As at 30 September 2017, Barclays‟ average UK leverage ratio was 4.9% (December 2016: 4.5%) and the UK leverage ratio
was 5.1% (December 2016: 5.0%), which exceeds the transitional leverage requirement for Barclays of 3.4%, and expected
end point leverage requirement of 4.0%. The CRR leverage ratio was 4.4% (December 2016: 4.6%).
UK leverage ratio
As at
30.09.17
As at
30.06.17
As at
31.12.16
£bn £bn £bn
Average UK leverage ratio 4.9% 4.8% 4.5%
UK leverage ratio 5.1% 5.0% 5.0%
Average UK leverage exposure 1,035 1,092 1,137
UK leverage exposure 1,002 999 1,050
Fully loaded Tier 1 capital (quarterly month end average) 51.2 52.1 51.6
CRR leverage ratio
Accounting assets
Derivative financial instruments 244 260 347
Cash collateral 56 58 67
Reverse repurchase agreements and other similar secured lending 15 17 13
Financial assets designated at fair value1 116 107 79
Loans and advances and other assets 718 693 707
Total IFRS assets 1,149 1,135 1,213
Regulatory consolidation adjustments 13 10 (6)
Derivatives adjustments
Derivatives netting (222) (235) (313)
Adjustments to cash collateral (42) (47) (50)
Net written credit protection 15 12 12
Potential Future Exposure (PFE) on derivatives 124 127 136
Total derivatives adjustments (125) (143) (215)
Securities financing transactions (SFTs) adjustments 23 24 29
Regulatory deductions and other adjustments (13) (13) (15)
Weighted off-balance sheet commitments 104 109 119
CRR leverage exposure 1,151 1,122 1,125
Fully loaded CET 1 capital 42.3 42.8 45.2
Fully loaded AT1 capital 8.8 7.6 6.8
Fully loaded Tier 1 capital 51.1 50.4 52.0
CRR Leverage ratio 4.4% 4.5% 4.6%
1 Included within financial assets designated at fair value are reverse repurchase agreements designated at fair value of £99bn (December 2016: £63bn).

Treasury and Capital Risk
Barclays PLC 32
The average UK leverage exposure as at 30 September 2017, which excludes qualifying central bank claims, was £1,035bn
(December 2016: £1,137bn), resulting in an average UK leverage ratio of 4.9% (December 2016: 4.5%). The CET1 capital
held against the 0.35% transitional G-SII ALRB was £3.5bn. The impact of the CCLB is currently nil.
The CRR leverage ratio decreased to 4.4% (December 2016: 4.6%) primarily driven by a £0.9bn decrease in fully loaded Tier
1 capital to £51.1bn as well as a £26bn increase in leverage exposure to £1,151bn.
Loans and advances and other assets increased by £11bn to £718bn. This was driven primarily by a £73bn
increase in cash and balances at central banks mainly due to an increase in the cash contribution to the Group
liquidity pool, a £71bn decrease in assets held for sale mainly due to the sell down of Barclays‟ holding in BAGL, a
£13bn increase in settlement balances and a £12bn increase in trading portfolio assets due to client activity
Reverse repurchase agreements increased £38bn to £114bn, primarily due to an increase in matched book trading
Net derivative leverage exposures, excluding net written credit protection and PFE on derivatives, decreased £15bn
to £36bn due to a reduction in IFRS derivatives mainly due to a decrease in interest rate and foreign exchange
derivatives, the rundown of Non-Core assets and a decrease in cash collateral
Regulatory consolidation adjustments increased £19bn to £13bn primarily as a result of the proportional
consolidation of BAGL following the sell down of Barclays‟ holding
Potential future exposure on derivatives decreased £12bn to £124bn primarily due to the rundown in Non-Core
assets and the appreciation of GBP against major currencies
Weighted off-balance sheet commitments decreased £15bn to £104bn primarily as a result of the proportional
consolidation of BAGL following the sell down of Barclays‟ holding
The difference between the average UK leverage ratio and the CRR leverage ratio was driven by the exemption of qualifying
central bank claims, partially offset by higher positions for July and August within trading portfolio assets and settlement
balances.
Additional Barclays regulatory disclosures prepared in accordance with the EBA Guidelines on disclosure requirements
under Part Eight of Regulation (EU) No 575/2013 will be disclosed on 26 October 2017, available at home.barclays/results.

Appendix: Non-IFRS Performance Measures
Barclays PLC 33
Barclays‟ management believes that the non-IFRS performance measures included in this document provide valuable
information to the readers of the financial statements as they enable the reader to identify a more consistent basis for
comparing the business‟ performance between financial periods, and provide more detail concerning the elements of
performance which the managers of these businesses are most directly able to influence or are relevant for an assessment
of Barclays PLC and its subsidiaries (the Group). They also reflect an important aspect of the way in which operating targets
are defined and performance is monitored by Barclays‟ management.
Any non-IFRS performance measures in this document are not a substitute for IFRS measures and readers should consider
the IFRS measures as well.
Non-IFRS performance measures glossary
Measure Definition
Return on average
tangible shareholders‟
equity
Statutory profit after tax attributable to ordinary shareholders, including an adjustment for the
tax credit in reserves in respect of other equity instruments, as a proportion of average
shareholders‟ equity excluding non-controlling interests and other equity instruments adjusted
for the deduction of intangible assets and goodwill. The components of the calculation have
been included on pages 34-35.
Return on average
allocated tangible
shareholders‟ equity
Statutory profit after tax attributable to ordinary shareholders, including an adjustment for the
tax credit in reserves in respect of other equity instruments, as a proportion of average
allocated tangible shareholders‟ equity. The components of the calculation have been included
on pages 34-35.
Period end allocated
tangible equity
Allocated tangible equity is calculated as 12.0% (2016: 11.5%) of CRD IV fully loaded RWAs
for each business, adjusted for CRD IV fully loaded capital deductions, excluding goodwill and
intangible assets, reflecting the assumptions the Group uses for capital planning purposes.
Head Office allocated tangible equity represents the difference between the Group's tangible
equity and the amounts allocated to businesses.
Average tangible
shareholders‟ equity
Calculated as the average of the previous month‟s period end tangible equity and the current
month‟s period end tangible equity. The average tangible shareholders‟ equity for the period is
the average of the monthly averages within that period.
Average allocated
tangible shareholders‟
equity
Calculated as the average of the previous month‟s period end allocated tangible equity and the
current month‟s period end allocated tangible equity. The average allocated tangible
shareholders‟ equity for the period is the average of the monthly averages within that period.
Cost: income ratio Total operating expenses divided by total income.
Loan loss rate
Quoted in basis points and represents total annualised loan impairment divided by gross loans
and advances to customers and banks held at amortised cost at the balance sheet date.
Loan: deposit ratio
Loans and advances divided by customer accounts calculated for Barclays UK and Barclays
International, excluding investment banking balances other than interest earning lending. This
excludes particular liabilities issued by the retail businesses that have characteristics
comparable to retail deposits (for example structured Certificates of Deposit and retail bonds),
which are included within debt securities in issue.
Net interest margin
Annualised net interest income divided by the sum of average customer assets. The
components of the calculation have been included on page 21.
Tangible net asset value
per share
Calculated by dividing shareholders‟ equity, excluding non-controlling interests and other
equity instruments, less goodwill and intangible assets, by the number of issued ordinary
shares. The components of the calculation have been included on page 35.

Appendix: Non-IFRS Performance Measures
Barclays PLC 34
Returns
Return on average allocated tangible equity is calculated as profit for the period attributable to ordinary equity holders of
the parent (adjusted for the tax credit recorded in reserves in respect of interest payments on other equity instruments)
divided by average allocated tangible equity for the period, excluding non-controlling and other equity interests for
businesses. Allocated tangible equity has been calculated as 12.0% (2016: 11.5%) of CRD IV fully loaded RWAs for each
business, adjusted for CRD IV fully loaded capital deductions, excluding goodwill and intangible assets, reflecting the
assumptions the Group uses for capital planning purposes. Head Office average allocated tangible equity represents the
difference between the Group's average tangible equity and the amounts allocated to businesses.
Nine months ended Nine months ended
30.09.17 30.09.16
Attributable profit/(loss) £m £m
Barclays UK 608 445
Corporate and Investment Bank 1,423 1,356
Consumer, Cards and Payments 592 1,013
Barclays International 2,015 2,369
Head Office (497) (113)
Barclays Non-Core (419) (1,418)
Africa Banking discontinued operation (2,335) 240
Barclays Group (628) 1,524
Tax credit in respect of interest payments on other equity instruments
Barclays UK 27 21
Corporate and Investment Bank 73 52
Consumer, Cards and Payments 13 8
Barclays International 86 60
Head Office 2 (4)
Barclays Non-Core 10 13
Africa Banking discontinued operation - -
Barclays Group 125 89
Profit/(loss) attributable to ordinary equity holders of the parent
Barclays UK 635 466
Corporate and Investment Bank 1,496 1,408
Consumer, Cards and Payments 605 1,021
Barclays International 2,101 2,429
Head Office (495) (117)
Barclays Non-Core (409) (1,405)
Africa Banking discontinued operation (2,335) 240
Barclays Group (503) 1,613
Average allocated tangible equity £bn £bn
Barclays UK 9.0 9.0
Corporate and Investment Bank 23.8 21.6
Consumer, Cards and Payments 4.2 3.6
Barclays International 28.0 25.2
Head Office1 9.0 6.3
Barclays Non-Core 3.2 8.2
Barclays Group 49.2 48.7
Return on average allocated tangible equity
Barclays UK 9.4% 6.9%
Corporate and Investment Bank 8.4% 8.7%
Consumer, Cards and Payments 19.3% 38.3%
Barclays International 10.0% 12.9%
Barclays Group (1.4%) 4.4%
1 Includes Africa Banking.

Appendix: Non-IFRS Performance Measures
Barclays PLC 35
Returns excluding charges for PPI, impairment of Barclays' holding in BAGL and loss on
the sale of BAGL Nine months ended
Profit attributable to ordinary equity holders of the parent excluding charges for PPI, impairment of Barclays' 30.09.17
holding in BAGL and loss on the sale of BAGL1 £m
Barclays Group profit attributable to ordinary equity holders (503)
Impact of charges for PPI2 692
Impact of impairment of Barclays' holding in BAGL 1,008
Impact of loss on the sale of BAGL 1,435
Barclays Group profit attributable to ordinary equity holders of the parent excluding charges for PPI, impairment
of Barclays' holding in BAGL and loss on the sale of BAGL 2,632
Average allocated tangible equity £bn
Barclays Group 49.2
Return on average allocated tangible equity excluding charges for PPI, impairment of Barclays' holding in BAGL and loss on the sale of
BAGL
Barclays Group 7.1%
Earnings per share excluding charges for PPI, impairment of Barclays' holding in BAGL
and loss on the sale of BAGL
Nine months ended
Profit attributable to ordinary equity holders of the parent excluding charges for PPI, impairment of Barclays' 30.09.17
holding in BAGL and loss on the sale of BAGL1 £m
Barclays Group profit attributable to ordinary equity holders (503)
Impact of charges for PPI2 692
Impact of impairment of Barclays' holding in BAGL 1,008
Impact of loss on the sale of BAGL 1,435
Barclays Group profit attributable to ordinary equity holders of the parent excluding charges for PPI, impairment
of Barclays' holding in BAGL and loss on the sale of BAGL 2,632
m
Basic weighted average number of shares 16,994
Basic earnings per ordinary share excluding charges for PPI, impairment of Barclays' holding in BAGL and loss
on the sale of BAGL p
Barclays Group 15.5
1 The profit after tax attributable to other equity holders of £458m (Q316 YTD: £318m) is offset by a tax credit recorded in reserves of £125m (Q316 YTD:
£89m). The net amount of £333m (Q316 YTD: £229m), along with non-controlling interests (NCI) is deducted from profit after tax in order to calculate
earnings per share and return on average tangible shareholders’ equity.
2 Represents the post-tax impact.
Tangible net asset value As at As at As at
30.09.17 30.06.17 31.12.16
£m £m £m
Total equity excluding non-controlling interests 64,649 63,866 64,873
Other equity instruments (8,940) (7,694) (6,449)
Goodwill and intangibles1 (7,759) (7,724) (9,245)
Tangible shareholders' equity attributable to ordinary shareholders of the parent 47,950 48,448 49,179
m m m
Shares in issue 17,043 17,034 16,963
p p p
Tangible net asset value per share 281 284 290
1 Comparative figures for 2016 include goodwill and intangibles in relation to Africa Banking.

Shareholder Information
Barclays PLC 36
Results timetable1 Date
2017 Full Year Results and Audited Annual Report 22 February 2018
% Change3
Exchange rates2 30.09.17 30.06.17 30.09.16 30.06.17 30.09.16
Period end - US$/£ 1.34 1.30 1.30 3% 3%
YTD average - US$/£ 1.28 1.26 1.39 2% (8%)
3 month average - US$/£ 1.31 1.28 1.31 2% -
Period end - €/£ 1.14 1.14 1.16 - (2%)
YTD average - €/£ 1.15 1.16 1.25 (1%) (8%)
3 Month average - €/£ 1.11 1.16 1.18 (4%) (6%)
Share price data 30.09.17 30.06.17 30.09.16
Barclays PLC (p) 193.35 202.75 167.80
Barclays PLC number of shares (m) 17,043 17,034 16,943
For further information please contact
Investor relations Media relations
Kathryn McLeland +44 (0) 20 7116 4943 Thomas Hoskin +44 (0) 20 7116 4755
More information on Barclays can be found on our website: home.barclays
Registered office
1 Churchill Place, London, E14 5HP, United Kingdom. Tel: +44 (0) 20 7116 1000. Company number: 48839
Registrar
Equiniti, Aspect House, Spencer Road, Lancing, West Sussex, BN99 6DA, United Kingdom.
Tel: 0371 384 20554 from the UK or +44 (0) 121 415 7004 from overseas.
1 Note that this announcement date is provisional and subject to change.
2 The average rates shown above are derived from daily spot rates during the year.
3 The change is the impact to GBP reported information.
4 Lines open 8.30am to 5.30pm UK time, Monday to Friday, excluding UK public holidays in England and Wales.

Notes
Barclays PLC 37
The term Barclays or Group refers to Barclays PLC together with its subsidiaries. Unless otherwise stated, the income statement analysis compares
the nine months ended 30 September 2017 to the corresponding nine months of 2016 and balance sheet analysis as at 30 September 2017 with
comparatives relating to 30 June 2017 and 31 December 2016. The abbreviations „£m‟ and „£bn‟ represent millions and thousands of millions of
Pounds Sterling respectively; the abbreviations „$m‟ and „$bn‟ represent millions and thousands of millions of US Dollars respectively; the
abbreviations „€m‟ and „€bn‟ represent millions and thousands of millions of Euros respectively.
There are a number of key judgement areas, for example impairment calculations, which are based on models and which are subject to ongoing
adjustment and modifications. Reported numbers reflect best estimates and judgements at the given point in time.
Relevant terms that are used in this document but are not defined under applicable regulatory guidance or International Financial Reporting
Standards (IFRS) are explained in the results glossary that can be accessed at home.barclays/results.
The information in this announcement, which was approved by the Board of Directors on 25 October 2017, does not comprise statutory accounts
within the meaning of Section 434 of the Companies Act 2006. Statutory accounts for the year ended 31 December 2016, which included certain
information required for the Joint Annual Report on Form 20-F of Barclays PLC and Barclays Bank PLC to the US Securities and Exchange
Commission (SEC) and which contained an unqualified audit report under Section 495 of the Companies Act 2006 (which did not make any
statements under Section 498 of the Companies Act 2006) have been delivered to the Registrar of Companies in accordance with Section 441 of the
Companies Act 2006.
These results will be furnished as a Form 6-K to the SEC as soon as practicable following their publication. Once furnished with the SEC, copies of the
Form 6-K will also be available from the Barclays Investor Relations website home.barclays/results and from the SEC‟s website at www.sec.gov.
Barclays is a frequent issuer in the debt capital markets and regularly meets with investors via formal road-shows and other ad hoc meetings.
Consistent with its usual practice, Barclays expects that from time to time over the coming quarter it will meet with investors globally to discuss
these results and other matters relating to the Group.
Non-IFRS performance measures
Barclays‟ management believes that the non-IFRS performance measures included in this document provide valuable information to the readers of
the financial statements as they enable the reader to identify a more consistent basis for comparing the business‟ performance between financial
periods, and provide more detail concerning the elements of performance which the managers of these businesses are most directly able to
influence or are relevant for an assessment of the Group. They also reflect an important aspect of the way in which operating targets are defined and
performance is monitored by Barclays‟ management. However, any non-IFRS performance measures in this document are not a substitute for IFRS
measures and readers should consider the IFRS measures as well. Refer to the appendix on pages 33-35 for further information and calculations of
non-IFRS performance measures included throughout this document, and the most directly comparable IFRS measures.
Forward-looking statements
This document contains certain forward-looking statements within the meaning of Section 21E of the US Securities Exchange Act of 1934, as
amended, and Section 27A of the US Securities Act of 1933, as amended, with respect to the Group. Barclays cautions readers that no forward-
looking statement is a guarantee of future performance and that actual results or other financial condition or performance measures could differ
materially from those contained in the forward-looking statements. These forward-looking statements can be identified by the fact that they do not
relate only to historical or current facts. Forward-looking statements sometimes use words such as „may‟, „will‟, „seek‟, „continue‟, „aim‟, „anticipate‟,
„target‟, „projected‟, „expect‟, „estimate‟, „intend‟, „plan‟, „goal‟, „believe‟, „achieve‟ or other words of similar meaning. Examples of forward-looking
statements include, among others, statements or guidance regarding or relating to the Group‟s future financial position, income growth, assets,
impairment charges, provisions, notable items, business strategy, structural reform, capital, leverage and other regulatory ratios, payment of
dividends (including dividend pay-out ratios and expected payment strategies), projected levels of growth in the banking and financial markets,
projected costs or savings, any commitments and targets and the impact of any regulatory deconsolidation resulting from the sell down of the
Group‟s interest in Barclays Africa Group Limited, estimates of capital expenditures and plans and objectives for future operations, projected
employee numbers and other statements that are not historical fact. By their nature, forward-looking statements involve risk and uncertainty
because they relate to future events and circumstances. These may be affected by changes in legislation, the development of standards and
interpretations under International Financial Reporting Standards, evolving practices with regard to the interpretation and application of accounting
and regulatory standards, the outcome of current and future legal proceedings and regulatory investigations, future levels of conduct provisions,
future levels of notable items, the policies and actions of governmental and regulatory authorities, geopolitical risks and the impact of competition.
In addition, factors including (but not limited to) the following may have an effect: capital, leverage and other regulatory rules (including with regard
to the future structure of the Group) applicable to past, current and future periods; UK, US, Africa, Eurozone and global macroeconomic and
business conditions; the effects of continued volatility in credit markets; market related risks such as changes in interest rates and foreign exchange
rates; effects of changes in valuation of credit market exposures; changes in valuation of issued securities; volatility in capital markets; changes in
credit ratings of any entities within the Group or any securities issued by such entities; the potential for one or more countries exiting the Eurozone;
the implications of the exercise by the United Kingdom of Article 50 of the Treaty of Lisbon and the disruption that may result in the UK and globally
from the withdrawal of the United Kingdom from the European Union and the success of future acquisitions, disposals and other strategic
transactions. A number of these influences and factors are beyond the Group‟s control. As a result, the Group‟s actual future results, dividend
payments, and capital and leverage ratios may differ materially from the plans, goals, expectations and guidance set forth in the Group‟s forward-
looking statements. Additional risks and factors which may impact the Group‟s future financial condition and performance are identified in our
filings with the SEC (including, without limitation, our annual report on form 20-F for the fiscal year ended 31 December 2016), which are available
on the SEC‟s website at www.sec.gov.
Subject to our obligations under the applicable laws and regulations of the United Kingdom and the United States in relation to disclosure and
ongoing information, we undertake no obligation to update publicly or revise any forward-looking statements, whether as a result of new
information, future events or otherwise.