barge grain movements › sites › default › files › media › ... · during october, robust...
TRANSCRIPT

A weekly publication of the Agricultural Marketing Service www.ams.usda.gov/GTR
February 14, 2019
Contents
Article/ Calendar
Grain
Transportation Indicators
Rail
Barge
Truck
Exports
Ocean
Brazil
Mexico
Grain Truck/Ocean Rate Advisory
Datasets
Specialists
Subscription Information
--------------
The next release is
February 21, 2019
Preferred citation: U.S. Dept. of Agriculture, Agricultural Marketing Service. Grain Transportation Report. February 14, 2019. Web: http://dx.doi.org/10.9752/TS056.02-14-2019
Grain Transportation Report
WEEKLY HIGHLIGHTS
USDA to Release Complete Set of Tables for Agricultural Projections to 2028
On February 14, USDA will release the complete set of tables prepared for the upcoming USDA Agricultural Projections to 2028 report.
The new tables will include projections for farm income, U.S. fruits, nuts, vegetables supply and use, and global commodity trade. On
November 2, 2018, tables containing long-term supply, use, and price projections to 2028, for major U.S. crops and livestock products as
well as supporting U.S. and international macroeconomic assumptions, were released. USDA's long-term agricultural projections are
developed through a consensus of departmental agencies and provide a long-term representative scenario of the agricultural sector, over
the next decade. The projections can be useful to agricultural shippers in anticipating future transportation demand patterns for
agricultural products. The tables will be in MS Excel format and posted to the USDA Office of the Chief Economist’s website.
Grain Inspections Down but Wheat Inspections Rebound
For the week ending February 7, total inspections of grain (corn, wheat, and soybeans) for export from all major U.S. export regions
reached 2.44 million metric tons (mmt), which is down 2 percent from the previous week, down 12 percent from last year, and 8 percent
below the 3-year average. Although corn and soybean inspections dropped 17 and 3 percent, respectively from week-to-week, inspections
of wheat increased 27 percent. Wheat inspections increased primarily due to increased shipments to Asia, the highest since late December
of last year. Inspections of grain in the Mississippi Gulf decreased 8 percent from the previous week, but Pacific Northwest (PNW)
inspections increased 9 percent for the same period.
2019 Grain Barge Shipments Lower Than Usual
Since the beginning of 2019, down-bound grain barge shipments on the Mississippi, Ohio, and Arkansas Rivers have been hampered by
severe cold weather and difficult navigation conditions. For the week ending February 9, total year-to-date (YTD) grain barge shipments
were 2.7 million tons, 7 percent less than the same time last year and 27 percent less than the 3-year-average. Corn shipments YTD were
1.2 million tons, which is 2 percent higher than last year but 28 percent less than the 3-year average. Soybean shipments YTD were 1.3
million tons, 19 percent less than last year and 32 percent less than the 3-year average. The total number of empty up-bound barges that
traveled through Mississippi Locks 27, Arkansas Lock 1, and Ohio Olmsted Locks YTD was 3,410, 17 percent lower than last year and
23 percent lower than 3-year average. The total number of grain barges unloaded in the New Orleans Port Region YTD was 4,392, 4
percent lower than last year and 6 percent less than the 3-year average.
Snapshots by Sector
Rail
U.S. Class I railroads originated 21,508 grain carloads for the week ending February 2, unchanged from the previous week, down 13
percent from last year, and down 12 percent from the 3-year average.
Average February shuttle secondary railcar bids/offers per car were $467 above tariff for the week ending February 7, up $237 from last
week, and up $67 from last year. Average non-shuttle secondary railcar bids/offers per car were $69 above tariff, up $119 from last week.
There were no non-shuttle bids/offers this week last year.
Barge
For the week ending February 9, barge grain movements totaled 410,462 tons, 16 percent higher than the previous week and down 46
percent from the same period last year.
For the week ending February 9, 253 grain barges moved down river, 33 barges more than the previous week. There were 617 grain
barges unloaded in New Orleans, 29 percent lower than the previous week.
Ocean
For the week ending February 7, 26 ocean-going grain vessels were loaded in the Gulf, 28 percent less than the same period last year.
Sixty-nine vessels are expected to be loaded within the next 10 days, 17 percent more than the same period last year.
For the week ending February 7, the ocean freight rate for shipping bulk grain, from the Gulf to Japan, was $38.00 per metric ton, 3
percent less than the previous week. The cost of shipping, from the PNW to Japan, was $21.50 per metric ton, 2 percent less than the
previous week.
Fuel
For the week ending February 11, the U.S. average diesel fuel price was unchanged from the previous week at $2.966 per gallon, 9.7
cents below the same week last year.
Contact Us

February 14, 2019
Grain Transportation Report 2
Feature Article/Calendar
Fourth Quarter Ocean Freight Rates Up in 2018, Pushing Rates the Highest Since 2014
Ocean freight rates for shipping bulk commodities, including grains, increased from 2017 to 2018, which is the
highest since 2014. In 2018, average ocean freight rates for shipping bulk grain from the U.S. Gulf and Pacific
Northwest (PNW) to Japan were $45.39 and $25.07 per metric ton (mt), which respectively is 15 and 19 percent
higher than the previous year. The cost of shipping grain from the U.S. Gulf to Europe was $19.85 per mt, 28
percent more than the previous year. However, the rates were still lower than the historic highs recorded in 2008, as
there was still an excess supply of vessels in the market.
A General Look at 2018 Ocean Rates:
Following is a brief summary of the year by quarter.
First Quarter - Ocean freight rates for shipping bulk commodities, including grains, were mixed during the first
quarter of 2018. The rates for shipping bulk grains from the U.S. Gulf to Japan averaged $44.27 per metric ton (mt)
during the quarter, which is 2 percent higher than the previous quarter, 21 percent higher than the same period a year
earlier, and 22 percent higher than the 4-year average. The cost of shipping from the Pacific Northwest (PNW) to
Japan averaged $24.25 per mt, which is 1 percent less than the previous quarter, 27 percent more than the same
period a year ago, and 24 percent more than the 4-year average. It cost $16.82 per mt to ship grain from the U.S.
Gulf to Europe during the quarter—4 percent below the previous quarter, but 14 percent above the same period a
year earlier, and 5 percent above the 4-year average. The year began with slightly declining ocean freight rates
caused by a temporary lull in economic activity due to various holidays. In addition to the cuts in steel production in
China, unfavorable weather conditions, including heavy snow and winds, slowed construction activity. Low steel
production dampened the demand for iron ore imports. The rates continued to fall during February, as industrial
activity slowed down in China, amid the Chinese New Year celebrations. High coal prices also affected the demand
from countries that were not facing peak demand season. The rates bounced back in March, as shipments of grain,
other minor bulks, and concentrates increased (April 19, 2018 Grain Transportation Report (GTR)).
Second Quarter – Regarding bulk grains, changes in second quarter ocean freight rates from the previous quarter
were mixed, however, were above the same period last year and the 4-year average. The rates for shipping a metric
ton (mt) of grain from the U.S. Gulf to Japan averaged $43.68 during the quarter, which is 1 percent below the
previous quarter but 15 and 23 percent above last year and the 4-year average, respectively. The rates from the
Pacific Northwest (PNW) to Japan averaged $24.37 per mt, which is almost unchanged from the previous quarter,
22 percent more than the same period last year, and 25 percent higher than the 4-year average. It cost $20.67 per mt
to ship grain from the U.S. Gulf to Rotterdam, Germany—23, 43 and 34 percent more than the previous quarter, the
same period last year, and the 4-year average, respectively. The second quarter began with declining rates for both
the U.S. Gulf-to-Japan and PNW-to-Japan routes. The decrease in rates was likely related to restrictions on coal
imports in China, which put downward pressure on the rates for Panamax vessels. In addition, the fleet continued to
expand, as demolition activity reached its lowest levels in the last two decades. Strikes by iron workers in Canada,
and by truck drivers in Brazil, impacted the iron supply in the global market, thereby decreasing the number of
Panamax vessels needed to move the smaller supply (July 26, 2018 GTR).
Third Quarter - Strong iron ore trade and firm coal demand pushed up ocean freight rates during the third quarter.
The ocean freight rates for shipping a metric ton (mt) of grain from the U.S. Gulf to Japan averaged $45.13 during
the quarter. The cost of shipping averaged $24.97 per mt from the Pacific Northwest (PNW) to Japan; and $21.06
from the U.S Gulf to Europe. These rates were above the previous quarter, the same period last year, and the 4-year
average. Rates started to climb in July due to strengthening iron ore trade in China and firm coal demand in Europe.
Further, the Chinese government was pursuing expansionary policies by boosting investment in infrastructure and
driving up steel and aluminum production (October 28, 2018 GTR). In addition, the hot summer drove up the
demand for coal in Europe. The activity in the bulk shipping market was mixed in September. However, the market
for the Panamax vessels was buoyant, as the U.S. Gulf-to-Japan and PNW-to-Japan rates increased and the U.S.
Gulf-to-Europe rate declined. While there was a lull in coal demand in Europe ahead of restocking, coal trade
strengthened in the Pacific-Australia-Far East route. Strong grain trade also supported the long-haul route between
the United States and Japan, which pushed up the ocean freight rates for that route. The Baltic Panamax Index

February 14, 2019
Grain Transportation Report 3
reached 1,689 points at the end of September–the highest level, so far in 2018. This indicates the Panamax vessels
normally used to haul grains were in high demand during September, which consequently led to rate increases in
some of the major grain routes.
Fourth Quarter – Average ocean freight rates continued to increase during the 4th quarter, with the biggest monthly
rate in October, and marginally decreases thereafter (see table and graph below). U.S. Gulf-to-Japan and PNW-to-
Japan rates were above the previous quarter, the same period last year, and the 4-year average. The U.S. Gulf-to-
Europe rate was also above the same period last year, as well as the 4-year average.
During October, robust steel production in India drove
up the importation of iron ore to the country and the
demand for Panamax vessels. According to Drewry
Maritime Research, rising coal trade on log-haul routes
and improved minor bulk trades (steel, iron-ore, wood
chips, logs and bauxite) as a result of Chinese
accommodative fiscal policy also boosted the demand
for Panamax, which consequently increased the ocean
freight rates. Strong dry bulk trades continued until
December.
Current Market Situation and Outlook
Bulk ocean freight rates have been falling since the
beginning of this year. The rates from the U.S. Gulf to
Japan averaged $43 per mt—10 percent less than December. The rates from the PNW to Japan averaged $23.50 per
mt—9 percent less than December. As of January 31, the rate for shipping grain from the U.S. Gulf to Japan was
$39 per mt, 17 percent higher than the beginning of the year (January 3). The rate from the PNW to Japan was $22
per mt, 12 percent lower than the beginning of the year. The rates were also lower than last year. However, it is not
certain if the rates will remain low or for how long. With the introduction of International Maritime Organization
Ballast Water Management System (BWMS) on September 8, 2017, demolitions of older vessels are expected to
increase in 2019. BWMS mandates that ships must manage their ballast water to remove aquatic organisms, or
render them harmless, before the water is released into a new location. Older vessels are likely to be scrapped or
taken out of operation and sent to ship repair yards for retrofitting jobs. This may temporarily reduce the supply of
vessels and put upward pressure on the ocean freight rates.
According to Drewry Maritime Research, India steel consumption is expected to grow as it starts investing heavily
on railway infrastructure. The Indian government has planned to double track all routes for smooth passage of trains
and increased timeliness. This may encourage India to import more iron ore and coking coal, which may boost the
demand for Panamax vessels and rates. China’s increased use of aluminum has led to large imports of bauxite.
China imported 22 percent more bauxite during the first 11 months of 2018. If this trend continues, the demand for
Panamax vessels will increase as will the rates. Finally, another factor affecting bulk vessel demand is spodumene
production for lithium batteries. A rapid increase in renewable sources of energy is creating the demand for lithium
used in producing batteries for storing energy. Consequently, an increase in lithium production is creating a demand
for spodumene, which is used in producing lithium. An increase in this minor bulk production has boosted the
demand for bulk vessels and put upward pressure on the rates. [email protected]
Ocean freight rates for grain routes during the fourth quarter 2018
4th quarter
2018 3rd qtr '18 4th qtr '17 4-yr avg
--$/mt-- --$/mt--
U.S. Gulf to Japan 49.00 48.38 48.00 48.46 7 11 29
PNW to Japan 27.44 26.81 25.83 26.69 7 4 29
Spread 21.56 21.57 22.17 21.77 8 15 29
U.S. Gulf to Europe 21.31 20.44 20.75 20.83 -1 18 28
Source: O'Neil Commodity Consulting
Change from
Percent
Route Oct. Nov. Dec.
$0
$10
$20
$30
$40
$50
$60
4Q_1
4
1Q_1
5
2Q_1
5
3Q_1
5
4Q_1
5
1Q_1
6
2Q_1
6
3Q_1
6
4Q_1
6
1Q_1
7
2Q_1
7
3Q_1
7
4Q_1
7
1Q_1
8
2Q_1
8
3Q_1
8
4Q_1
8
Grain vessel rates and spread (per mt), U.S. to Japan, 2014 - 2018
Gulf to Japan 4-yr avg Gulf to Japan
PNW to Japan 4-yr avg PNW to Japan
Spread 4-yr avg Spread
PNW to Japan rate
Spread
Gulf to Japan rate
S Source: O'Neil Commodity Consulting

February 14, 2019
Grain Transportation Report 4
Grain Transportation Indicators
The grain bid summary illustrates the market relationships for commodities. Positive and negative adjustments in differential
between terminal and futures markets, and the relationship to inland market points, are indicators of changes in fundamental mar-
ket supply and demand. The map may be used to monitor market and time differentials.
Table 1
Grain Transport Cost Indicators1
Truck Barge Ocean
For the week ending Unit Train Shuttle Gulf Pacific
02/13/19 199 285 240 299 170 1520 % - 2 3 8 % 2 0 % - 3 % - 2 %
02/06/19 199 278 230 250 174 156
Source: Transportation & Marketing Program/AMS/USDA
Rail
1Indicator: Base year 2000 = 100; Weekly updates include truck = diesel ($/gallon); rail = near-month secondary rail market bid and
monthly tariff rate with fuel surcharge ($/car); barge = Illinois River barge rate (index = percent of tariff rate); and ocean = routes to Japan ($/metric ton)
Table 2
Market Update: U.S. Origins to Export Position Price Spreads ($/bushel)
Commodity Origin--Destination 2/8/2019 2/1/2019
Corn IL--Gulf -0.79 -0.76
Corn NE--Gulf -0.89 -0.85
Soybean IA--Gulf -1.18 -1.15
HRW KS--Gulf -1.57 -1.57
HRS ND--Portland -1.74 -1.75
Note: nq = no quote; n/a = not available
Source: Transportation & Marketing Program/AMS/USDA
Figure 1 Grain Bid Summary
February 14, 2019
Grain Transportation Report 5
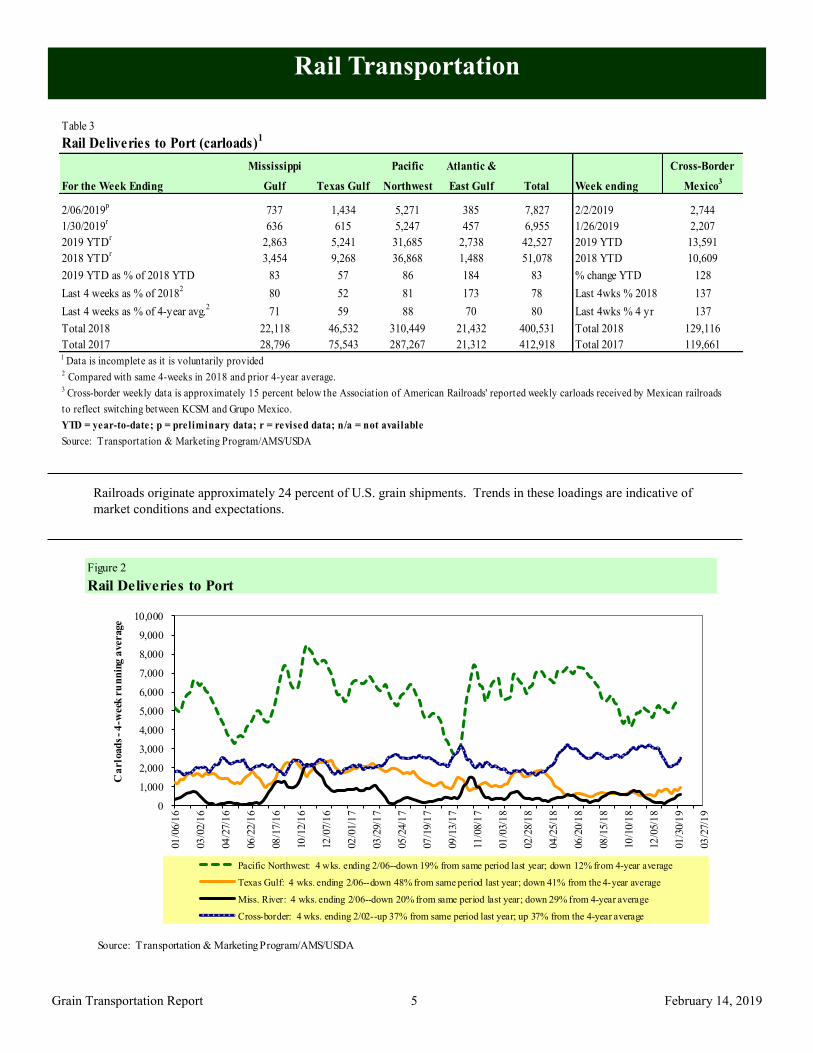
Rail Transportation
Railroads originate approximately 24 percent of U.S. grain shipments. Trends in these loadings are indicative of
market conditions and expectations.
Table 3
Rail Deliveries to Port (carloads)1
Mississippi Pacific Atlantic & Cross-Border
For the Week Ending Gulf Texas Gulf Northwest East Gulf Total Week ending Mexico3
2/06/2019p
737 1,434 5,271 385 7,827 2/2/2019 2,744
1/30/2019r
636 615 5,247 457 6,955 1/26/2019 2,207
2019 YTDr
2,863 5,241 31,685 2,738 42,527 2019 YTD 13,591
2018 YTDr
3,454 9,268 36,868 1,488 51,078 2018 YTD 10,609
2019 YTD as % of 2018 YTD 83 57 86 184 83 % change YTD 128
Last 4 weeks as % of 20182
80 52 81 173 78 Last 4wks % 2018 137
Last 4 weeks as % of 4-year avg.2
71 59 88 70 80 Last 4wks % 4 yr 137
Total 2018 22,118 46,532 310,449 21,432 400,531 Total 2018 129,116
Total 2017 28,796 75,543 287,267 21,312 412,918 Total 2017 119,6611 Data is incomplete as it is voluntarily provided2 Compared with same 4-weeks in 2018 and prior 4-year average.
3 Cross-border weekly data is approximately 15 percent below the Association of American Railroads' reported weekly carloads received by Mexican railroads
to reflect switching between KCSM and Grupo Mexico.
YTD = year-to-date; p = preliminary data; r = revised data; n/a = not available
Source: Transportation & Marketing Program/AMS/USDA
Figure 2
Rail Deliveries to Port
0
1,000
2,000
3,000
4,000
5,000
6,000
7,000
8,000
9,000
10,000
01/0
6/1
6
03/0
2/1
6
04/2
7/1
6
06/2
2/1
6
08/1
7/1
6
10/1
2/1
6
12/0
7/1
6
02/0
1/1
7
03/2
9/1
7
05/2
4/1
7
07/1
9/1
7
09/1
3/1
7
11/0
8/1
7
01/0
3/1
8
02/2
8/1
8
04/2
5/1
8
06/2
0/1
8
08/1
5/1
8
10/1
0/1
8
12/0
5/1
8
01/3
0/1
9
03/2
7/1
9
Ca
rlo
ad
s -
4-w
eek
ru
nn
ing
average
Pacific Northwest: 4 wks. ending 2/06--down 19% from same period last year; down 12% from 4-year average
Texas Gulf: 4 wks. ending 2/06--down 48% from same period last year; down 41% from the 4-year average
Miss. River: 4 wks. ending 2/06--down 20% from same period last year; down 29% from 4-year average
Cross-border: 4 wks. ending 2/02--up 37% from same period last year; up 37% from the 4-year average
Source: Transportation & Marketing Program/AMS/USDA

February 14, 2019
Grain Transportation Report 6
Table 5
Railcar Auction Offerings1
($/car)2
Feb-19 Feb-18 Mar-19 Mar-18 Apr-19 Apr-18 May-19 May-18
CO T grain units no offer no bids no bids no bids no bids no bids no bids no bids
CO T grain single-car5 no offer 0 0 0 0 no bids 0 no bids
GCAS/Region 1 no offer no offer 10 no bids no bid no bids n/a n/a
GCAS/Region 2 no offer no offer 10 no bids no bid no bids n/a n/a
1Auctio n o fferings a re fo r s ingle-car and unit tra in s hipments o nly.2Average premium/dis co unt to ta riff, las t auc tio n
3BNSF - COT = Certifica te o f Trans po rta tio n; no rth gra in and s o uth gra in bids were co mbined effec tive the week ending 6/24/06.
4UP - GCAS = Grain Car Allo ca tio n Sys tem
Regio n 1 inc ludes : AR, IL, LA, MO, NM, OK, TX, WI, and Duluth, MN.
Regio n 2 inc ludes : CO, IA, KS, MN, NE, WY, and Kans as City and St. J o s eph, MO.
5Range is s ho wn becaus e average is no t ava ilable . No t ava ilable = n/a .
So urce : Trans po rta tio n & Marketing P ro gram/AMS/USDA.
UP4
Delivery period
BNSF3
For the week ending:
2/7/2019
Figure 3
Total Weekly U.S. Class I Railroad Grain Car Loadings
15,000
17,000
19,000
21,000
23,000
25,000
27,000
29,000
Car
lo
ads
Prior 3-year, 4-week average Current 4-week average
For the 4 weeks ending February 2, grain carloadings were up 1 percent from the previous week, down 2 percent from last year, and down 2 percent from the 3-year average.
Source: Association of American Railroads
Table 4
Class I Rail Carrier Grain Car Bulletin (grain carloads originated)
For the week ending:
2/2/2019 CSXT NS BNSF KCS UP CN CP
This week 1,818 2,103 11,924 1,021 4,642 21,508 4,145 3,446
This week last year 2,125 2,367 13,814 1,150 5,241 24,697 3,751 4,625
2019 YTD 9,328 13,305 57,366 5,234 25,811 111,044 19,136 20,678
2018 YTD 9,655 12,186 59,250 5,237 25,837 112,165 17,720 21,089
2019 YTD as % of 2018 YTD 97 109 97 100 100 99 108 98
Last 4 weeks as % of 2018* 95 104 95 104 101 98 105 97
Last 4 weeks as % of 3-yr avg.** 92 94 100 104 96 98 106 99
Total 2018 98,978 133,146 635,458 48,638 267,713 1,183,933 212,018 244,697
*The past 4 weeks of this year as a percent of the same 4 weeks last year.
**The past 4 weeks as a percent of the same period from the prior 3-year average. YTD = year-to-date.
Source: Association of American Railroads (www.aar.org)
East WestU.S. total
Canada

February 14, 2019
Grain Transportation Report 7
The secondary rail market information reflects trade values for service that was originally purchased from the railroad carrier as some form of guaranteed freight. The auction and secondary rail values are indicators of rail service quality and demand/supply.
Figure 4
Bids/Offers for Railcars to be Delivered in February 2019, Secondary Market
-200
-100
0
100
200
300
400
500
600
700
800
7/5
/201
8
7/1
9/20
18
8/2
/201
8
8/1
6/20
18
8/3
0/20
18
9/1
3/20
18
9/2
7/20
18
10/1
1/2
018
10/2
5/2
018
11/8
/20
18
11/2
2/2
018
12/6
/20
18
12/2
0/2
018
1/3
/201
9
1/1
7/20
19
1/3
1/20
19
2/1
4/20
19
Aver
age
pre
miu
m/d
isco
unt
to t
arif
f
($/c
ar)
Shuttle Non-Shuttle
Shuttle prior 3-yr avg. (same week) Non-Shuttle prior 3-yr avg. (same week)2/7/2019
Non-shuttle bids include unit-train and single-car bids. n/a = not available.Source: Transportation & Marketing Program/AMS/USDA
$38
UPBNSF
$750
$100
$183Shuttle
Non-Shuttle
Average Non-shuttle bids/offers rose $119 this week, and are $31 below the peak.
Average Shuttle bids/offers rose $237 this week and are at the peak.
Figure 5
Bids/Offers for Railcars to be Delivered in March 2019, Secondary Market
-400
-200
0
200
400
600
800
1000
8/2
/201
8
8/1
6/20
18
8/3
0/20
18
9/1
3/20
18
9/2
7/20
18
10/1
1/2
018
10/2
5/2
018
11/8
/20
18
11/2
2/2
018
12/6
/20
18
12/2
0/2
018
1/3
/201
9
1/1
7/20
19
1/3
1/20
19
2/1
4/20
19
2/2
8/20
19
3/1
4/20
19
Av
erag
e p
rem
ium
/dis
cou
nt
to tar
iff
($/c
ar)
Shuttle Non-Shuttle
Shuttle prior 3-yr avg. (same week) Non-Shuttle prior 3-yr avg. (same week)2/7/2019
Non-shuttle bids include unit-train and single-car bids. n/a = not available.Source: Transportation & Marketing Program/AMS/USDA
$0
UPBNSF
$533
$125
$75Shuttle
Non-Shuttle
Average Non-shuttle bids/offers fell $88 this week, and are $250 below the peak.
Average Shuttle bids/offers rose $267 this week and are at the peak.

February 14, 2019
Grain Transportation Report 8
Figure 6
Bids/Offers for Railcars to be Delivered in April 2019, Secondary Market
-300
-200
-100
0
100
200
300
400
500
600
8/3
0/20
18
9/1
3/20
18
9/2
7/20
18
10/1
1/2
018
10/2
5/2
018
11/8
/20
18
11/2
2/2
018
12/6
/20
18
12/2
0/2
018
1/3
/201
9
1/1
7/20
19
1/3
1/20
19
2/1
4/20
19
2/2
8/20
19
3/1
4/20
19
3/2
8/20
19
4/1
1/20
19
Av
erag
e p
rem
ium
/dis
cou
nt
to tar
iff
($/c
ar)
Shuttle Non-Shuttle
Shuttle prior 3-yr avg. (same week) Non-Shuttle prior 3-yr avg. (same week)2/7/2019
Non-shuttle bids include unit-train and single-car bids. n/a = not available.Source: Transportation & Marketing Program/AMS/USDA
n/a
UPBNSF
n/a
n/a
n/aShuttle
Non-Shuttle
There were no Non-Shuttle bids/offers this week.
There were no Shuttle bids/offers this week.
Table 6
Weekly Secondary Railcar Market ($/car)1
Feb-19 Mar-19 Apr-19 May-19 Jun-19 Jul-19
BNSF-GF 38 0 n/a n/a n/a n/a
Change from last week 88 n/a n/a n/a n/a n/a
Change from same week 2018 n/a n/a n/a n/a n/a n/a
UP-Pool 100 125 n/a n/a n/a n/a
Change from last week n/a (25) n/a n/a n/a n/a
Change from same week 2018 n/a n/a n/a n/a n/a n/a
BNSF-GF 750 533 n/a n/a n/a n/a
Change from last week 322 408 n/a n/a n/a n/a
Change from same week 2018 250 100 n/a n/a n/a n/a
UP-Pool 183 75 n/a n/a n/a n/a
Change from last week 152 125 n/a n/a n/a n/a
Change from same week 2018 (117) 75 n/a n/a n/a n/a
1Average premium/dis co unt to ta riff, $ /car-las t week
No te : Bids lis ted are market INDICATORS o nly & are NOT guaranteed prices ,
n/a = no t ava ilable ; GF = guaranteed fre ight; P o o l = guaranteed po o l
Data fro m J ames B. J o iner Co ., Tradewes t Bro kerage Co .
So urce : Trans po rta tio n and Marketing P ro gram/AMS/USDA
No
n-s
hu
ttle
For the week ending:
2/7/2019
Sh
utt
le
Delivery period
February 14, 2019
Grain Transportation Report 9
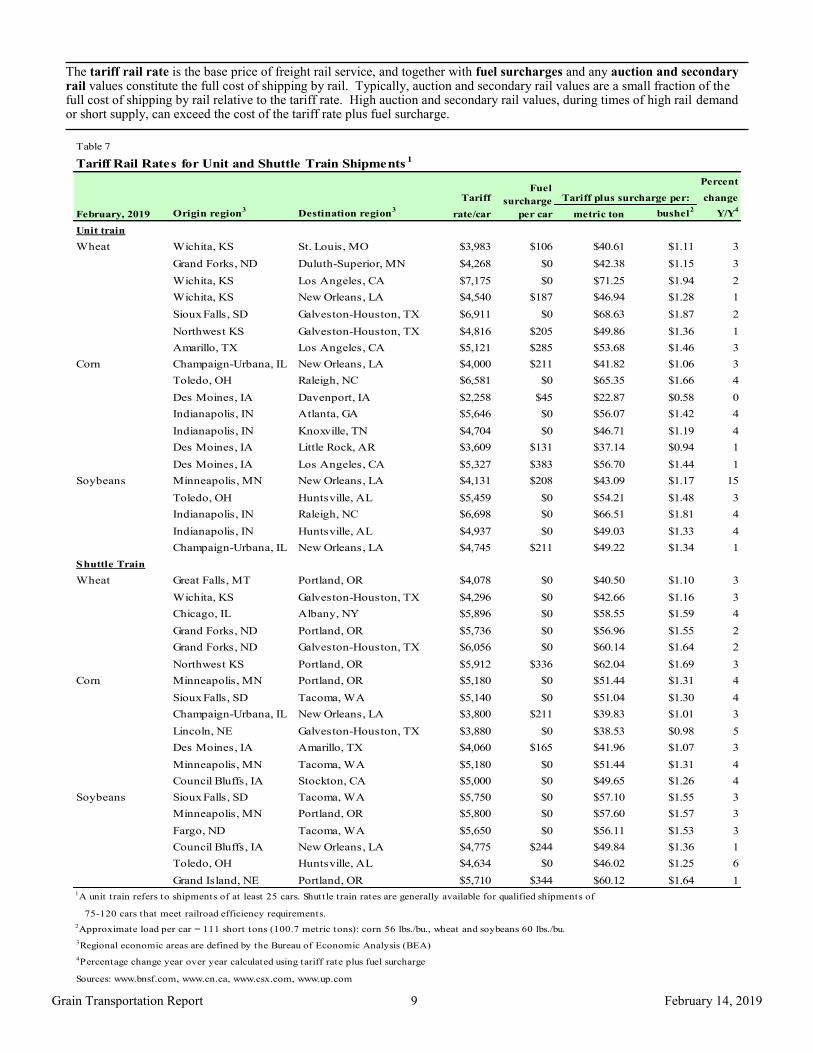
The tariff rail rate is the base price of freight rail service, and together with fuel surcharges and any auction and secondary rail values constitute the full cost of shipping by rail. Typically, auction and secondary rail values are a small fraction of the full cost of shipping by rail relative to the tariff rate. High auction and secondary rail values, during times of high rail demand or short supply, can exceed the cost of the tariff rate plus fuel surcharge.
Table 7
Tariff Rail Rates for Unit and Shuttle Train Shipments1
Percent
Tariff change
February, 2019 Origin region3
Destination region3
rate/car metric ton bushel2
Y/Y4
Unit train
Wheat Wichita, KS St. Louis, MO $3,983 $106 $40.61 $1.11 3
Grand Forks, ND Duluth-Superior, MN $4,268 $0 $42.38 $1.15 3
Wichita, KS Los Angeles, CA $7,175 $0 $71.25 $1.94 2
Wichita, KS New Orleans, LA $4,540 $187 $46.94 $1.28 1
Sioux Falls, SD Galveston-Houston, TX $6,911 $0 $68.63 $1.87 2
Northwest KS Galveston-Houston, TX $4,816 $205 $49.86 $1.36 1
Amarillo, TX Los Angeles, CA $5,121 $285 $53.68 $1.46 3
Corn Champaign-Urbana, IL New Orleans, LA $4,000 $211 $41.82 $1.06 3
Toledo, OH Raleigh, NC $6,581 $0 $65.35 $1.66 4
Des Moines, IA Davenport, IA $2,258 $45 $22.87 $0.58 0
Indianapolis, IN Atlanta, GA $5,646 $0 $56.07 $1.42 4
Indianapolis, IN Knoxville, TN $4,704 $0 $46.71 $1.19 4
Des Moines, IA Little Rock, AR $3,609 $131 $37.14 $0.94 1
Des Moines, IA Los Angeles, CA $5,327 $383 $56.70 $1.44 1
Soybeans Minneapolis, MN New Orleans, LA $4,131 $208 $43.09 $1.17 15
Toledo, OH Huntsville, AL $5,459 $0 $54.21 $1.48 3
Indianapolis, IN Raleigh, NC $6,698 $0 $66.51 $1.81 4
Indianapolis, IN Huntsville, AL $4,937 $0 $49.03 $1.33 4
Champaign-Urbana, IL New Orleans, LA $4,745 $211 $49.22 $1.34 1
Shuttle Train
Wheat Great Falls, MT Portland, OR $4,078 $0 $40.50 $1.10 3
Wichita, KS Galveston-Houston, TX $4,296 $0 $42.66 $1.16 3
Chicago, IL Albany, NY $5,896 $0 $58.55 $1.59 4
Grand Forks, ND Portland, OR $5,736 $0 $56.96 $1.55 2
Grand Forks, ND Galveston-Houston, TX $6,056 $0 $60.14 $1.64 2
Northwest KS Portland, OR $5,912 $336 $62.04 $1.69 3
Corn Minneapolis, MN Portland, OR $5,180 $0 $51.44 $1.31 4
Sioux Falls, SD Tacoma, WA $5,140 $0 $51.04 $1.30 4
Champaign-Urbana, IL New Orleans, LA $3,800 $211 $39.83 $1.01 3
Lincoln, NE Galveston-Houston, TX $3,880 $0 $38.53 $0.98 5
Des Moines, IA Amarillo, TX $4,060 $165 $41.96 $1.07 3
Minneapolis, MN Tacoma, WA $5,180 $0 $51.44 $1.31 4
Council Bluffs, IA Stockton, CA $5,000 $0 $49.65 $1.26 4
Soybeans Sioux Falls, SD Tacoma, WA $5,750 $0 $57.10 $1.55 3
Minneapolis, MN Portland, OR $5,800 $0 $57.60 $1.57 3
Fargo, ND Tacoma, WA $5,650 $0 $56.11 $1.53 3
Council Bluffs, IA New Orleans, LA $4,775 $244 $49.84 $1.36 1
Toledo, OH Huntsville, AL $4,634 $0 $46.02 $1.25 6
Grand Island, NE Portland, OR $5,710 $344 $60.12 $1.64 11A unit train refers to shipments of at least 25 cars. Shuttle train rates are generally available for qualified shipments of
75-120 cars that meet railroad efficiency requirements.
2Approximate load per car = 111 short tons (100.7 metric tons): corn 56 lbs./bu., wheat and soybeans 60 lbs./bu.
3Regional economic areas are defined by the Bureau of Economic Analysis (BEA)
4Percentage change year over year calculated using tariff rate plus fuel surcharge
Sources: www.bnsf.com, www.cn.ca, www.csx.com, www.up.com
Tariff plus surcharge per:Fuel
surcharge
per car
February 14, 2019
Grain Transportation Report 10
Figure 7
Railroad Fuel Surcharges, North American Weighted Average1
$0.00
$0.10
$0.20
$0.30
$0.40
$0.50
$0.60
$0.70
Dollar
s p
er r
ailc
ar m
ile
3-Year Monthly Average
Fuel Surcharge* ($/mile/railcar)
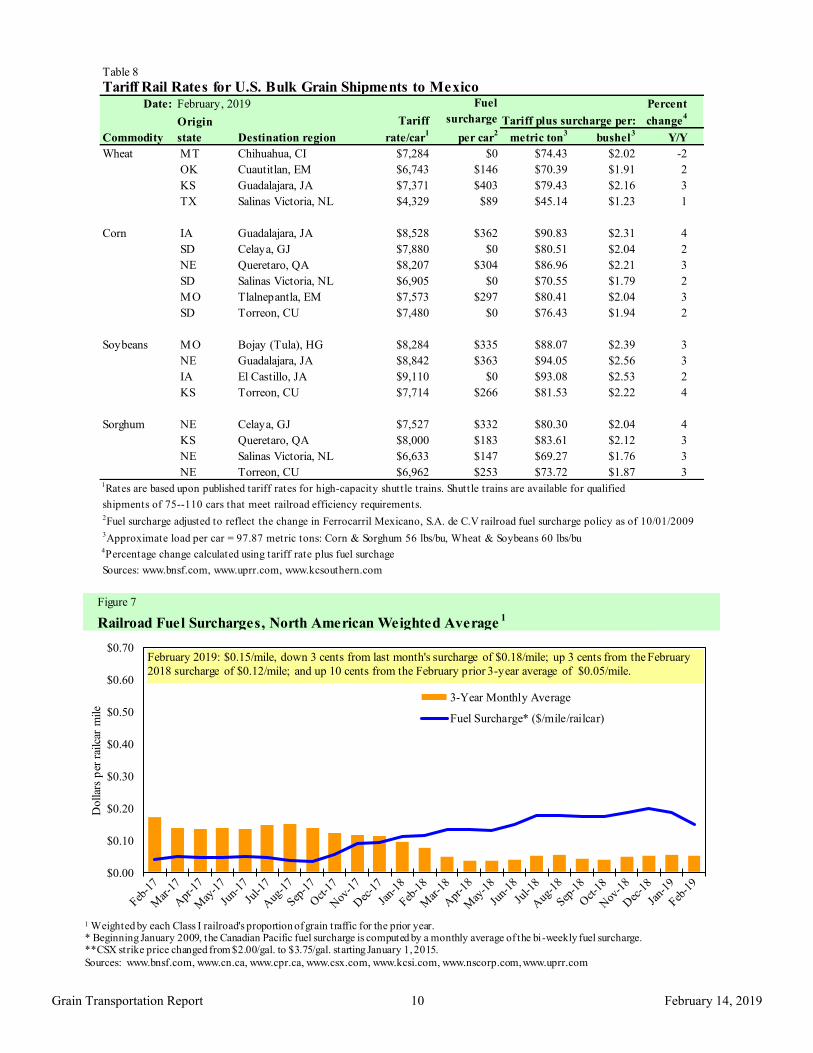
February 2019: $0.15/mile, down 3 cents from last month's surcharge of $0.18/mile; up 3 cents from the February
2018 surcharge of $0.12/mile; and up 10 cents from the February prior 3-year average of $0.05/mile.
1 Weighted by each Class I railroad's proportion of grain traffic for the prior year. * Beginning January 2009, the Canadian Pacific fuel surcharge is computed by a monthly average of the bi-weekly fuel surcharge.**CSX strike price changed from $2.00/gal. to $3.75/gal. starting January 1, 2015.
Sources: www.bnsf.com, www.cn.ca, www.cpr.ca, www.csx.com, www.kcsi.com, www.nscorp.com, www.uprr.com
Table 8
Tariff Rail Rates for U.S. Bulk Grain Shipments to MexicoDate: Percent
Tariff change4
Commodity Destination region rate/car1
metric ton3 bushel
3Y/Y
Wheat MT Chihuahua, CI $7,284 $0 $74.43 $2.02 -2
OK Cuautitlan, EM $6,743 $146 $70.39 $1.91 2
KS Guadalajara, JA $7,371 $403 $79.43 $2.16 3
TX Salinas Victoria, NL $4,329 $89 $45.14 $1.23 1
Corn IA Guadalajara, JA $8,528 $362 $90.83 $2.31 4
SD Celaya, GJ $7,880 $0 $80.51 $2.04 2
NE Queretaro, QA $8,207 $304 $86.96 $2.21 3
SD Salinas Victoria, NL $6,905 $0 $70.55 $1.79 2
MO Tlalnepantla, EM $7,573 $297 $80.41 $2.04 3
SD Torreon, CU $7,480 $0 $76.43 $1.94 2
Soybeans MO Bojay (Tula), HG $8,284 $335 $88.07 $2.39 3
NE Guadalajara, JA $8,842 $363 $94.05 $2.56 3
IA El Castillo, JA $9,110 $0 $93.08 $2.53 2
KS Torreon, CU $7,714 $266 $81.53 $2.22 4
Sorghum NE Celaya, GJ $7,527 $332 $80.30 $2.04 4
KS Queretaro, QA $8,000 $183 $83.61 $2.12 3
NE Salinas Victoria, NL $6,633 $147 $69.27 $1.76 3
NE Torreon, CU $6,962 $253 $73.72 $1.87 31Rates are based upon published tariff rates for high-capacity shuttle trains. Shuttle trains are available for qualified
shipments of 75--110 cars that meet railroad efficiency requirements.2Fuel surcharge adjusted to reflect the change in Ferrocarril Mexicano, S.A. de C.V railroad fuel surcharge policy as of 10/01/20093Approximate load per car = 97.87 metric tons: Corn & Sorghum 56 lbs/bu, Wheat & Soybeans 60 lbs/bu4Percentage change calculated using tariff rate plus fuel surchage
Sources: www.bnsf.com, www.uprr.com, www.kcsouthern.com
Fuel
surcharge
per car2
Tariff plus surcharge per:Origin
state
February, 2019

February 14, 2019
Grain Transportation Report 11
Barge Transportation
Figure 9 Benchmark tariff rates Calculating barge rate per ton: (Rate * 1976 tariff benchmark rate per ton)/100
Select applicable index from market quotes included in tables on this page. The 1976 benchmark rates per ton are provided in map.
Twin Cities 6.19
Mid-Mississippi 5.32
St. Louis 3.99
Cairo-Memphis 3.14
Illinois 4.64 Cincinnati 4.69
Lower Ohio 4.04
Figure 8
Illinois River Barge Freight Rate1,2
1Rate = percent of 1976 tariff benchmark index (1976 = 100 percent); 24-week moving average of the 3-year average.
Source: Transportation & Marketing Program/AMS/USDA
0
200
400
600
800
1000
120002/1
3/1
8
02/2
7/1
8
03/1
3/1
8
03/2
7/1
8
04/1
0/1
8
04/2
4/1
8
05/0
8/1
8
05/2
2/1
8
06/0
5/1
8
06/1
9/1
8
07/0
3/1
8
07/1
7/1
8
07/3
1/1
8
08/1
4/1
8
08/2
8/1
8
09/1
1/1
8
09/2
5/1
8
10/0
9/1
8
10/2
3/1
8
11/0
6/1
8
11/2
0/1
8
12/0
4/1
8
12/1
8/1
8
01/0
1/1
9
01/1
5/1
9
01/2
9/1
9
02/1
2/1
9
Per
cen
t of
tar
iff Weekly rate
3-year avg. for
the week
For the week ending February12: 19 percent higher than last week , 44 percent higher than last year, and 65 percent higher than the 3-year average.
Table 9
Weekly Barge Freight Rates: Southbound Only
Twin
Cities
Mid-
Mississippi
Lower
Illinois
River St. Louis Cincinnati
Lower
Ohio
Cairo-
Memphis
Rate1
2/12/2019 - - 538 438 538 538 400
2/5/2019 - - 450 343 383 383 350
$/ton 2/12/2019 - - 24.96 17.48 25.23 21.74 12.56
2/5/2019 - - 20.88 13.69 17.96 15.47 10.99
Current week % change from the same week:
Last year - - 44 61 78 78 83
3-year avg. 2
- - 65 85 103 102 103-2 6 6
Rate1
March - 525 513 400 450 450 363
May 463 438 430 338 388 388 313
Source: Transportation & Marketing Programs/AMS/USDA
1Rate = percent of 1976 tariff benchmark index (1976 = 100 percent); 24-week moving average; ton = 2,000 pounds; "-" n/a due to closure

February 14, 2019
Grain Transportation Report 12
Figure 10
Barge Movements on the Mississippi River1 (Locks 27 - Granite City, IL)
1 The 3-year average is a 4-week moving average.
Source: U.S. Army Corps of Engineers
0
200
400
600
800
1,000
1,20002
/10/1
8
02
/24/1
8
03
/10/1
8
03
/24/1
8
04
/07/1
8
04
/21/1
8
05
/05/1
8
05
/19/1
8
06
/02/1
8
06
/16/1
8
06
/30/1
8
07
/14/1
8
07
/28/1
8
08
/11/1
8
08
/25/1
8
09
/08/1
8
09
/22/1
8
10
/06/1
8
10
/20/1
8
11
/03/1
8
11
/17/1
8
12
/01/1
8
12
/15/1
8
12
/29/1
8
01
/12/1
9
01
/26/1
9
02
/09/1
9
02
/23/1
9
03
/09/1
9
1,0
00
to
ns
Soybeans
Wheat
Corn
3-Year Average
For the week ending February 9: 72 percent lower thanlast year, and 69 percent less than the3-yr avg.
Table 10
Barge Grain Movements (1,000 tons)
For the week ending 02/09/2019 Corn Wheat Soybeans Other Total
Mississippi River
Rock Island, IL (L15) 0 0 0 0 0
Winfield, MO (L25) 0 0 0 0 0
Alton, IL (L26) 69 0 33 0 101
Granite City, IL (L27) 64 0 31 2 96
Illinois River (L8) 54 0 25 0 79
Ohio River (OLMSTED) 85 29 136 0 250
Arkansas River (L1) 0 18 46 0 65
Weekly total - 2019 148 47 214 2 410
Weekly total - 2018 362 34 358 11 764
2019 YTD1
1,195 235 1,299 9 2,738
2018 YTD1
1,177 144 1,613 19 2,953
2019 as % of 2018 YTD 102 163 81 45 93
Last 4 weeks as % of 20182
70 142 71 45 74
Total 2018 23,349 1,674 12,819 133 37,975
2 As a percent of same period in 2018.
2. Starting from 11/24/2018, weekly movement through Ohio 52 is replaced by Olmsted.
Source: U.S. Army Corps of Engineers
Note: 1. Total may not add exactly, due to rounding.
1 Weekly total, YTD (year-to-date) and calendar year total includes Miss/27, Ohio/OLMSTED, and Ark/1; "Other" refers to oats,
barley, sorghum, and rye.

February 14, 2019
Grain Transportation Report 13
Figure 11
Source: U.S. Army Corps of Engineers
Upbound Empty Barges Transiting Mississippi River Locks 27, Arkansas River
Lock and Dam 1, and Ohio River Olmsted Locks and Dam
0
100
200
300
400
500
600
700
8003
/24
/18
3/3
1/1
8
4/7
/18
4/1
4/1
8
4/2
1/1
8
4/2
8/1
8
5/5
/18
5/1
2/1
8
5/1
9/1
8
5/2
6/1
8
6/2
/18
6/9
/18
6/1
6/1
8
6/2
3/1
8
6/3
0/1
8
7/7
/18
7/1
4/1
8
7/2
1/1
8
7/2
8/1
8
8/4
/18
8/1
1/1
8
8/1
8/1
8
8/2
5/1
8
9/1
/18
9/8
/18
9/1
5/1
8
9/2
2/1
8
9/2
9/1
8
10/
6/1
8
10/
13/
18
10/
20/
18
10/
27/
18
11/
3/1
8
11/
10/
18
11/
17/
18
11/
24/
18
12/
1/1
8
12/
8/1
8
12/
15/
18
12/
22/
18
12/
29/
18
1/5
/19
1/1
2/1
9
1/1
9/1
9
1/2
6/1
9
2/2
/19
2/9
/19
Nu
mb
er o
f B
arg
es
Miss. Locks 27 Ark Lock 1 Ohio Olmsted Locks
For the week ending February 9: 372 barges transited the locks, 120 barges more than the previous week, and 33 percent lower than the 3-year avg.
Figure 12
Grain Barges for Export in New Orleans Region
Source: U.S. Army Corps of Engineers and GIPSA
0
200
400
600
800
1000
1200
1400
10
/21
/17
11
/4/1
7
11
/18
/17
12
/2/1
7
12
/16
/17
12
/30
/17
1/1
3/1
8
1/2
7/1
8
2/1
0/1
8
2/2
4/1
8
3/1
0/1
8
3/2
4/1
8
4/7
/18
4/2
1/1
8
5/5
/18
5/1
9/1
8
6/2
/18
6/1
6/1
8
6/3
0/1
8
7/1
4/1
8
7/2
8/1
8
8/1
1/1
8
8/2
5/1
8
9/8
/18
9/2
2/1
8
10
/6/1
8
10
/20
/18
11
/3/1
8
11
/17
/18
12
/1/1
8
12
/15
/18
12
/29
/18
1/1
2/1
9
1/2
6/1
9
2/9
/19
Downbound Grain Barges Locks 27, 1, and Olmsted
Grain Barges Unloaded in New Orleans
Nu
mb
er o
f b
arges
For the week ending February 9: 253 grain barges moved down river, 33 barges more than last week; 617 grain barges were unloaded in New Orleans, 29 percent lower than the previous week.

February 14, 2019
Grain Transportation Report 14
The weekly diesel price provides a proxy for trends in U.S. truck rates as diesel fuel is a significant expense for truck grain move-
ments.
Truck Transportation
Table 11
Change from
Region Location Price Week ago Year ago
I East Coast 3.031 -0.007 -0.080
New England 3.161 -0.015 0.007
Central Atlantic 3.225 -0.002 -0.081
Lower Atlantic 2.872 -0.007 -0.094
II Midwest 2.849 0.010 -0.171
III Gulf Coast 2.776 -0.003 -0.075
IV Rocky Mountain 2.870 -0.013 -0.102
V West Coast 3.435 0.000 0.003
West Coast less California 3.084 -0.003 -0.023
California 3.714 0.003 0.025
Total U.S. 2.966 0.000 -0.097
1Diesel fuel prices include all taxes. Prices represent an average of all types of diesel fuel.
Source: Energy Information Administration/U.S. Department of Energy (www.eia.doe.gov)
Retail on-Highway Diesel Prices, Week Ending 2/11/2019 (US $/gallon)
Figure 13
Weekly Diesel Fuel Prices, U.S. Average
Source: Retail On-Highway Diesel Prices, Energy Information Administration, Dept. of Energy
$2.966$3.063
$2.000
$2.100
$2.200
$2.300
$2.400
$2.500
$2.600
$2.700
$2.800
$2.900
$3.000
$3.100
$3.200
$3.300
$3.400
$3.500
8/13
/201
8
8/20
/201
8
8/27
/201
8
9/3/
2018
9/10
/201
8
9/17
/201
8
9/24
/201
8
10/1
/201
8
10/8
/201
8
10/1
5/20
18
10/2
2/20
18
10/2
9/20
18
11/5
/201
8
11/1
2/20
18
11/1
9/20
18
11/2
6/20
18
12/3
/201
8
12/1
0/20
18
12/1
7/20
18
12/2
4/20
18
12/3
1/20
18
1/7/
2019
1/14
/201
9
1/21
/201
9
1/28
/201
9
2/4/
2019
2/11
/201
9
$ pe
r gal
lon
Last Year Current YearFor the week ending February 11, the U.S. average diesel fuel price was unchanged from
the previous week at $2.966 per gallon, 9.7 cents below the same week last year.

February 14, 2019
Grain Transportation Report 15
Grain Exports
Table 12
U.S. Export Balances and Cumulative Exports (1,000 metric tons)
Wheat Corn Soybeans Total
For the week ending HRW SRW HRS SWW DUR All wheat
Export Balances1
1/31/2019* N/A N/A N/A N/A N/A N/A N/A N/A N/A
This week year ago 1,925 701 1,455 938 57 5,076 19,249 9,508 33,833
Cumulative exports-marketing year 2
2018/19 YTD N/A N/A N/A N/A N/A N/A N/A N/A N/A
2017/18 YTD 6,477 1,397 3,956 3,625 272 15,727 14,772 34,754 65,253
YTD 2018/19 as % of 2017/18 N/A N/A N/A N/A N/A N/A N/A N/A N/A
Last 4 wks as % of same period 2017/18 N/A N/A N/A N/A N/A N/A N/A N/A N/A
2017/18 Total 9,150 2,343 5,689 4,854 384 22,419 57,209 56,214 135,842
2016/17 Total 11,096 2,285 7,923 4,254 484 26,042 41,864 51,156 119,0621 Current unshipped (outstanding) export sales to date
2 Shipped export sales to date; new marketing year now in effect for corn, soybeans, and wheat
* Please note tha "N/A" notates that the data for this table is not current for this week due to the federal shutdown in December
Note: YTD = year-to-date. Marketing Year: wheat = 6/01-5/31, corn & soybeans = 9/01-8/31
Source: Foreign Agricultural Service/USDA (www.fas.usda.gov)
Table 13
Top 5 Importers 1 of U.S. Corn
For the week ending 1/31/2019 % change Exports3
2018/19 2017/18 current MY 3-year avg
Current MY Last MY from last MY 2015-2017
Mexico n/a* 10,338 n/a 13,691
Japan n/a 5,501 n/a 11,247
Korea n/a 1,954 n/a 4,754
Colombia n/a 2,485 n/a 4,678
Peru n/a 1,905 n/a 2,975
Top 5 Importers n/a 22,183 n/a 37,344
Total US corn export sales n/a 34,022 n/a 53,184
% of Projected n/a 65%
Change from prior week2
n/a 1,770
Top 5 importers' share of U.S. corn
export sales n/a 65% 70%
USDA forecast, January 2019 n/a 52,163 n/a
Corn Use for Ethanol USDA forecast,
January 2019 n/a 140,335 n/a
1Based on FAS Marketing Year Ranking Reports for 2017/18 - www.fas.usda.gov; Marketing year (MY) = Sep 1 - Aug 31.
*n/a indicates a missing value due to the recent partial federal government shutdown
Total Commitments2
- 1,000 mt -
3FAS Marketing Year Ranking Reports - http://apps.fas.usda.gov/export-sales/myrkaug.htm; 3-yr average
2Cumulative Exports (shipped) + Outstanding Sales (unshipped), FAS Weekly Export Sales Report, or Export Sales Query--
http://www.fas.usda.gov/esrquery/. Total commitments change (net sales) from prior week could include revisions from previous week's
outstanding sales or accumulated sales.
(n) indicates negative number.

February 14, 2019
Grain Transportation Report 16
Table 14
Top 5 Importers1 of U.S. Soybeans
For the week ending 1/31/2019 % change
Exports3
2018/19 2017/18 current MY 3-yr avg.
Current MY Last MY from last MY 2015-2017
- 1,000 mt - - 1,000 mt -
China n/a* 26,406 n/a 31,228
Mexico n/a 2,658 n/a 3,716
Indonesia n/a 1,197 n/a 2,250
Japan n/a 1,411 n/a 2,145
Netherlands n/a 911 n/a 2,209
Top 5 importers n/a 32,583 n/a 41,549
Total US soybean export sales n/a 44,263 n/a 55,113
% of Projected n/a 77%
Change from prior week2
n/a 743
Top 5 importers' share of U.S.
soybean export sales n/a 74% 75%
USDA forecast, January, 2019 n/a 57,221 n/a
1Bas ed o n FAS Marketing Year Ranking Repo rts fo r 2017/18 - www.fas .us da .go v; Marketing year (MY) = Sep 1 - Aug 31.
*n/a indicates a missing value due to the recent partial federal government shutdown
3 FAS Marketing Year Fina l Repo rts - www.fas .us da .go v/expo rt-s a les /myfi_rpt.htm. (Carryo ver plus Accumula ted Expo rts )
(n) indicates negative number.
2Cumula tive Expo rts (s hipped) + Outs tanding Sales (uns hipped), FAS Weekly Expo rt Sa les Repo rt, o r Expo rt Sa les Query--
http://www.fas .us da .go v/es rquery/. The to ta l co mmitments change (ne t s a les ) fro m prio r week co uld inc lude re ivis io ns fro m previo us week's
o uts tanding s a les and/o r accumula ted s a les
Total Commitments2
Table 15
Top 10 Importers1 of All U.S. Wheat
For the week ending 1/31/2019 % change Exports3
2018/19 2017/18 current MY 3-yr avg
Current MY Last MY from last MY 2015-2017
- 1,000 mt -
Mexico n/a* 2,602 n/a 2,781
Japan n/a 2,409 n/a 2,649
Philippines n/a 2,258 n/a 2,441
Korea n/a 1,396 n/a 1,257
Nigeria n/a 1,050 n/a 1,254
Indonesia n/a 1,080 n/a 1,076
Taiwan n/a 930 n/a 1,066
China n/a 857 n/a 944
Colombia n/a 539 n/a 714
Thailand n/a 630 n/a 618
Top 10 importers n/a 13,751 n/a 14,800
Total US wheat export sales n/a 20,804 n/a 22,869
% of Projected n/a 80%
Change from prior week2
n/a 394
Top 10 importers' share of U.S.
wheat export sales n/a 66% 65%
USDA forecast, January 2019 n/a 25,886 n/a
1 Based on FAS Marketing Year Ranking Reports for 2017/18 - www.fas.usda.gov; Marketing year = Jun 1 - May 31.
outstanding and/or accumulated sales.
Total Commitments2
3 FAS Marketing Year Final Reports - www.fas.usda.gov/export-sales/myfi_rpt.htm.
(n) indicates negative number.
2 Cumulative Exports (shipped) + Outstanding Sales (unshipped), FAS Weekly Export Sales Report, or Export Sales Query--
http://www.fas.usda.gov/esrquery/. Total commitments change (net sales) from prior week could include revisions from the previous week's
- 1,000 mt -
* n/a indicates a missing value due to the recent partial federal government shutdown
February 14, 2019
Grain Transportation Report 17
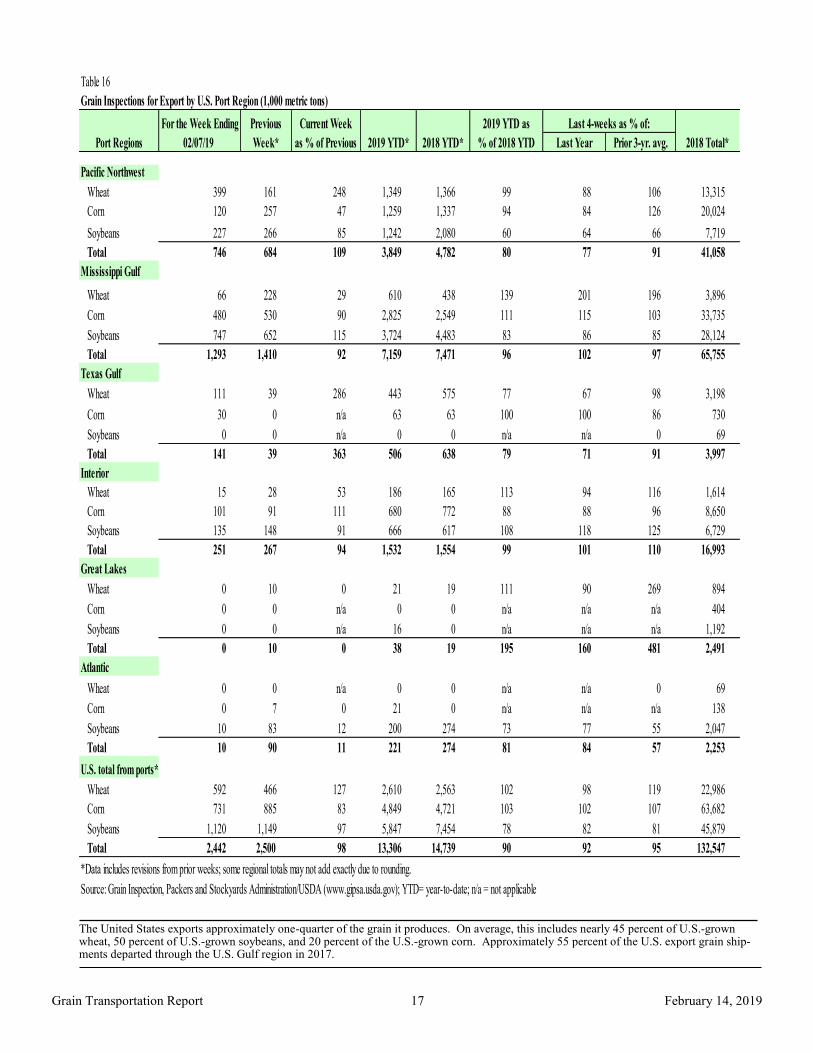
The United States exports approximately one-quarter of the grain it produces. On average, this includes nearly 45 percent of U.S.-grown wheat, 50 percent of U.S.-grown soybeans, and 20 percent of the U.S.-grown corn. Approximately 55 percent of the U.S. export grain ship-ments departed through the U.S. Gulf region in 2017.
Table 16
Grain Inspections for Export by U.S. Port Region (1,000 metric tons)
For the Week Ending Previous Current Week 2019 YTD as
02/07/19 Week* as % of Previous 2018 YTD* % of 2018 YTD Last Year Prior 3-yr. avg.
Pacific Northwest
Wheat 399 161 248 1,349 1,366 99 88 106 13,315
Corn 120 257 47 1,259 1,337 94 84 126 20,024
Soybeans 227 266 85 1,242 2,080 60 64 66 7,719
Total 746 684 109 3,849 4,782 80 77 91 41,058
Mississippi Gulf
Wheat 66 228 29 610 438 139 201 196 3,896
Corn 480 530 90 2,825 2,549 111 115 103 33,735
Soybeans 747 652 115 3,724 4,483 83 86 85 28,124
Total 1,293 1,410 92 7,159 7,471 96 102 97 65,755
Texas Gulf
Wheat 111 39 286 443 575 77 67 98 3,198
Corn 30 0 n/a 63 63 100 100 86 730
Soybeans 0 0 n/a 0 0 n/a n/a 0 69
Total 141 39 363 506 638 79 71 91 3,997
Interior
Wheat 15 28 53 186 165 113 94 116 1,614
Corn 101 91 111 680 772 88 88 96 8,650
Soybeans 135 148 91 666 617 108 118 125 6,729
Total 251 267 94 1,532 1,554 99 101 110 16,993
Great Lakes
Wheat 0 10 0 21 19 111 90 269 894
Corn 0 0 n/a 0 0 n/a n/a n/a 404
Soybeans 0 0 n/a 16 0 n/a n/a n/a 1,192
Total 0 10 0 38 19 195 160 481 2,491
Atlantic
Wheat 0 0 n/a 0 0 n/a n/a 0 69
Corn 0 7 0 21 0 n/a n/a n/a 138
Soybeans 10 83 12 200 274 73 77 55 2,047
Total 10 90 11 221 274 81 84 57 2,253
U.S. total from ports*
Wheat 592 466 127 2,610 2,563 102 98 119 22,986
Corn 731 885 83 4,849 4,721 103 102 107 63,682
Soybeans 1,120 1,149 97 5,847 7,454 78 82 81 45,879
Total 2,442 2,500 98 13,306 14,739 90 92 95 132,547
*Data includes revisions from prior weeks; some regional totals may not add exactly due to rounding.
Source: Grain Inspection, Packers and Stockyards Administration/USDA (www.gipsa.usda.gov); YTD= year-to-date; n/a = not applicable
Last 4-weeks as % of:
Port Regions 2018 Total*2019 YTD*

February 14, 2019
Grain Transportation Report 18
Figure 14
U.S. grain inspected for export (wheat, corn, and soybeans)
Source: Grain Inspection, Packers and Stockyards Administration/USDA (www.gipsa.usda.gov)
Note: 3-year average consists of 4-week running average
0
20
40
60
80
100
120
140
160
180
2007/1
3/2
017
8/1
0/2
017
9/7
/201
7
10
/5/2
017
11
/2/2
017
11
/30/2
017
12
/28/2
017
1/2
5/2
018
2/2
2/2
018
3/2
2/2
018
4/1
9/2
018
5/1
7/2
018
6/1
4/2
018
7/1
2/2
018
8/9
/201
8
9/6
/201
8
10
/4/2
018
11
/1/2
018
11
/29/2
018
12
/27/2
018
1/2
4/2
019
2/2
1/2
019
3/2
1/2
019
4/1
8/2
019
5/1
6/2
019
6/1
3/2
019
Mil
lion
bu
shels
(m
bu
)
Current week 3-year average
For the week ending Feb. 07: 91.6 mbu, down 3 percent from the previous week, down 12 percent from same week last year, and down 8 percent from the 3-year average.
Figure 15
U.S. Grain Inspections: U.S. Gulf and PNW1 (wheat, corn, and soybeans)
-
10
20
30
40
50
60
70
80
90
100
6/2
2/1
7
7/2
2/1
7
8/2
2/1
7
9/2
2/1
7
10
/22/1
7
11
/22/1
7
12
/22/1
7
1/2
2/1
8
2/2
2/1
8
3/2
2/1
8
4/2
2/1
8
5/2
2/1
8
6/2
2/1
8
7/2
2/1
8
8/2
2/1
8
9/2
2/1
8
10
/22/1
8
11
/22/1
8
12
/22/1
8
1/2
2/1
9
2/2
2/1
9
3/2
2/1
9
4/2
2/1
9
5/2
2/1
9
Mil
lion
bu
shels
(m
bu
)
Miss. Gulf 3-Year avg - Miss. Gulf
PNW 3-Year avg - PNW
Texas Gulf 3-Year avg - TX Gulf
Source: Grain Inspection, Packers and Stockyards Administration/USDA (www.gipsa.usda.gov)
Last Week:
Last Year (same week):
3-yr avg. (4-wk. mov. Avg):
MS Gulf TX Gulf U.S. Gulf PNW
down 8
down 6
down 8
up 269
unchanged
up 29
down 1
down 5
down 5
up 7
down 14
down 8
Percent change from:Week ending 02/07/19 inspections (mbu):
Mississippi Gulf:
PNW:
Texas Gulf:
48.8
27.7
5.3

February 14, 2019
Grain Transportation Report 19
Ocean Transportation
Table 17
Weekly Port Region Grain Ocean Vessel Activity (number of vessels)
Pacific
Gulf Northwest
Loaded Due next
Date In port 7-days 10-days In port
2/7/2019 46 26 69 20
1/31/2019 49 34 52 17
2018 range (23..88) (24..41) (38..67) (4..30)
2018 avg. 40 34 54 17
Source: Transportation & Marketing Programs/AMS/USDA
Figure 16
U.S. Gulf Vessel Loading Activity
0
10
20
30
40
50
60
70
80
09/2
0/2
018
09/2
7/2
018
10/0
4/2
018
10/1
1/2
018
10/1
8/2
018
10/2
5/2
018
11/0
1/2
018
11
/08
/20
18
11
/15
/20
18
11
/22
/20
18
11
/29
/20
18
12
/06
/20
18
12
/13
/20
18
12/2
0/2
018
12/2
7/2
018
01/0
3/2
019
01/1
0/2
019
01/1
7/2
019
01/2
4/2
019
01/3
1/2
019
02/0
7/2
019
Nu
mb
er
of
ve
ssel
s
Loaded Last 7 Days Due Next 10 days Loaded 4 Year Average
Source:Transportation & Marketing Program/AMS/USDA1U.S. Gulf includes Mississippi, Texas, and East Gulf.
For the week ending February 7 Loaded Due Change from last year -27.8% 16.9%
Change from 4-year avg. -39.9% 11.7%

February 14, 2019
Grain Transportation Report 20
Figure 17
Grain Vessel Rates, U.S. to Japan
Data Source: O'Neil Commodity Consulting
0
10
20
30
40
50
60
Jan.
17
Mar
. 17
May
17
July
17
Sept
. 17
Nov
. 17
Jan.
18
Mar
. 18
May
18
July
18
Sept
. 18
Nov
. 18
Jan.
19
US
$/m
etri
c to
n
Spread Gulf vs. PNW to Japan Rate Gulf to Japan Rate PNW to Japan
Gulf PNW Spread Ocean rates January '19 $43.00 $23.50 $19.50 Change from January '18 -2.3% 4.1% -1.3%
Change from 4-year avg. 24.7% 25.9% 23.4%
Table 18
Ocean Freight Rates For Selected Shipments, Week Ending 02/09/2019
Export Import Grain Loading Volume loads Freight rate
region region types date (metric tons) (US$/metric ton)
U.S. Gulf Djibouti Wheat Dec 27/Jan 7 9,800 113.11*
U.S. Gulf Pt. Sudan Sorghum Dec 7/17 30,430 71.88*
U.S. Gulf Djibouti Wheat Nov 2/12 21,470 85.44*
PNW Taiwan Heavy Grain Sep 15/Oct 31 63,000 25.00
Brazil China Heavy Grain Mar 3/11 63,000 27.50
Brazil China Heavy Grain Feb 26/Mar 4 66,000 24.75
Brazil China Heavy Grain Feb 20/25 65,000 26.00
Brazil China Heavy Grain Jan 22/30 60,000 29.50
Brazil China Heavy Grain Dec 15/20 60,000 37.50
Brazil China Heavy Grain Dec 1/10 60,000 36.25
Brazil China Heavy Grain Nov 20/30 60,000 38.00
Brazil China Heavy Grain Nov 1/10 60,000 34.00
Brazil S.Korea Heavy Grain Nov 5/10 66,000 43.00
Rates shown are per metric ton (2,204.62 lbs. = 1 metric ton), F.O.B., except where otherwise indicated; op = option *50 percent of food aid from the United States is required to be shipped on U.S.-flag vessels.
Source: Maritime Research Inc. (www.maritime-research.com)

February 14, 2019
Grain Transportation Report 21
In 2017, containers were used to transport 7 percent of total U.S. waterborne grain exports. Approximately 62 percent of U.S. wa-terborne grain exports in 2017 went to Asia, of which 10 percent were moved in containers. Approximately 93 percent of U.S. wa-terborne containerized grain exports were destined for Asia.
Figure 18
Top 10 Destination Markets for U.S. Containerized Grain Exports, January-May 2018
Source: USDA/Agricultural Marketing Service/Transportation Services Division analysis of Port Import Export Reporting
Service (PIERS) data
Note: The following Harmonized Tariff Codes are used to calculate containerized grains movements: 100190, 100200,
100300, 100400, 100590, 100700, 110100, 230310, 110220, 110290, 120100, 230210, 230990, 230330, and 120810.
Taiwan19%
Vietnam
17%
Thailand13%
Indonesia11%
China8%
Korea7%
Japan4%
Malaysia4%
Philipplines2%
Sri Lanka2%
Other13%
Figure 19
Monthly Shipments of Containerized Grain to Asia
Source: USDA/Agricultural Marketing Service/Transportation Services Division analysis of Port Import Export Reporting Service (PIERS) data.
Note: The following Harmonized Tariff Codes are used to calculate containerized grains movements: 100190, 100200, 100300, 100400, 100590,
100700, 110100, 110220, 110290, 120100, 120810, 230210, 230310, 230330, and 230990.
0
5
10
15
20
25
30
35
40
45
50
55
60
65
70
75
80
Jan.
Feb
.
Mar
.
Ap
r.
May
Jun
.
Jul.
Aug.
Sep
.
Oct
.
No
v.
Dec
.
Th
ou
san
d
20
-ft
equ
ivale
nt
un
its
2017
2018
5-year avg
May 2018: Down 63% from last year and 68% lower than
the 5-year average

February 14, 2019
Grain Transportation Report 22
Coordinators Surajudeen (Deen) Olowolayemo [email protected] (202) 720 - 0119 Kuo-Liang (Matt) Chang [email protected] (202) 690 - 0992 Weekly Highlight Editors Surajudeen (Deen) Olowolayemo [email protected] (202) 720 - 0119 April Taylor [email protected] (202) 720 - 7880 Nicholas Marathon [email protected] (202) 690 - 4430
Grain Transportation Indicators Surajudeen (Deen) Olowolayemo [email protected] (202) 720 - 0119
Rail Transportation Johnny Hill [email protected] (202) 690 - 3295 Jesse Gastelle [email protected] (202) 690 - 1144 Peter Caffarelli [email protected] (202) 690 - 3244
Barge Transportation Nicholas Marathon [email protected] (202) 690 - 4430 April Taylor [email protected] (202) 720 - 7880 Kuo-Liang (Matt) Chang [email protected] (202) 720 - 0299
Truck Transportation April Taylor [email protected] (202) 720 - 7880
Grain Exports Johnny Hill [email protected] (202) 690 - 3295 Ocean Transportation Surajudeen (Deen) Olowolayemo [email protected] (202) 720 - 0119 (Freight rates and vessels) April Taylor [email protected] (202) 720 - 7880 (Container movements)
Subscription Information: Send relevant information to [email protected] for an electronic copy (printed copies are also available upon request).
Preferred citation: U.S. Dept. of Agriculture, Agricultural Marketing Service. Grain Transportation Report. February 14, 2019. Web: http://dx.doi.org/10.9752/TS056.02-14-2019
Contacts and Links
In accordance with Federal civil rights law and U.S. Department of Agriculture (USDA) civil rights regulations and policies, the USDA, its Agencies, offices, and employees, and institutions participating in or administering USDA programs are prohibited from discriminating based on race, color, national origin, religion, sex, gender identity (including gender expression), sexual orientation, disability, age, marital status, family/parental status, income derived from a public assistance program, political beliefs, or reprisal or retaliation for prior civil rights activity, in any program or activity conducted or funded by USDA (not all bases apply to all programs). Remedies and complaint filing deadlines vary by pro-gram or incident. Persons with disabilities who require alternative means of communication for program information (e.g., Braille, large print, audiotape, American Sign Language, etc.) should contact the responsible Agency or USDA's TARGET Center at (202) 720-2600 (voice and TTY) or contact USDA through the Federal Relay Service at (800) 877-8339. Additionally, program information may be made available in languages other than English. To file a program discrimination complaint, complete the USDA Program Discrimination Complaint Form, AD-3027, found online at How to File a Program Discrimination Complaint and at any USDA office or write a letter addressed to USDA and provide in the letter all of the infor-mation requested in the form. To request a copy of the complaint form, call (866) 632-9992. Submit your completed form or letter to USDA by: (1) mail: U.S. Department of Agriculture, Office of the Assistant Secretary for Civil Rights, 1400 Independence Avenue, SW, Washington, D.C. 20250-9410; (2) fax: (202) 690-7442; or (3) email: [email protected]. USDA is an equal opportunity provider, employer, and lender.