barking & dagenham : economic development study plan 2
TRANSCRIPT

Barking & Dagenham : Economic Development Study
6788302v3 P25
Plan 2: Existing Retail Provision

Barking & Dagenham : Economic Development Study
P26 6788302v3P26
Retail Capacity Assessment – Methodology and Data
Price Base
All monetary values expressed in this study are at 2011 prices, consistent with
Experian’s base year expenditure figures for 2011 which is the most up to date
information available.
Study Area
The quantitative analysis is based on a defined study area that covers the
catchment areas of the main shopping destinations in London Borough of
Barking & Dagenham (LBBD). The study area is sub-divided into six zones
based on ward boundaries as shown above. The survey zones take into
consideration the extent of the catchment area of the main centres in LBBD.
Retail Expenditure
The level of available expenditure to support retailers is based on first
establishing per capita levels of spending for the study area population.
Experian’s local consumer expenditure estimates for comparison and
convenience goods for each of the study area zones for the year 2011 have
been obtained.
Experian’s EBS national expenditure information (Experian Retail Planner
Briefing Note 11, October 2013) has been used to forecast expenditure within
the study area. Experian’s forecasts are based on an econometric model of
disaggregated consumer spending. This model takes a number of macro-
economic forecasts (chiefly consumer spending, incomes and inflation) and
uses them to produce forecasts of consumer spending volumes, prices and
value, broken down into separate categories of goods. The model incorporates
assumptions about income and price elasticities.
Experian’s EBS growth forecast rates for 2011 to 2014 reflect the current
economic circumstances and provide an appropriate growth rate for the short
term (for convenience goods: -0.6% for 2011-2013, -0.3% for 2013-2014 and
0.1% for 2014 to 2015; for comparison goods: 3.1% for 2011-2012, 3.2% for
2012-2013, 2.3% for 2013-2014 and 2.8% for 2014-2015).
In the longer term it is more difficult to forecast year on year changes in
expenditure. Experian’s longer term growth average forecasts have been
adopted i.e. 0.8% per annum for convenience goods from 2015, and 2.9% per
annum growth for comparison goods from 2015. These growth rates are
relatively cautious when compared with past growth rates, but in our view
represent realistic forecast for future growth. These growth figures relate to real
growth and exclude inflation.
Special Forms of Trading (SFT) or non-store activity is included within
Experian’s Goods Based Expenditure (GBE) estimates. SFT includes other

Barking & Dagenham : Economic Development Study
6788302v3 P27
forms of retail expenditure not spent in shops e.g. mail order sales, some
internet sales, vending machines, party plan selling, market stalls and door to
door selling. SFT needs to be excluded from retail assessments because it
relates to expenditure not spent in shops and does not have a direct
relationship with the demand for retail floorspace. The growth in home
computing, Internet connections and interactive TV may lead to a growth in
home shopping and may have effects on retailing in the high street. Experian
provides projections for special forms of trading and e-tailing. This Experian
information suggests that non-store retail sales in 2011 is:
• 6.2% of convenience goods expenditure; and
• 13.0% of comparison goods expenditure.
Experian predicts that these figures will increase in the future, up to over 20%
by the end of the 2020s. However, Experian recognises that not all of this SFT
expenditure should be excluded from a retail capacity analysis, because some
of it relates to internet sales through traditional retail businesses, rather than
internet companies. The turnover attributable to e-tail through retail businesses
is included in the company average turnovers, and therefore expenditure
figures should not exclude this expenditure. Experian has provided adjusted
deductions for SFT and projections. These projections have been used to
exclude only e-tail expenditure attributed to non-retail businesses, which will
not directly impact on the demand for retail floorspace. The adjusted figures
suggest that SFT sales in 2011 are:
• 1.9% of convenience goods expenditure; and
• 9.7% of comparison goods expenditure.
The projections provided by Experian suggest that these percentages could
increase to 3.5% and 13.8% by 2017, and estimated at 5.2% and 16.0% by
2027. These figures have been adopted in this assessment.
Home/electronic shopping has also emerged with the increasing growth in the
use of personal computers and the Internet. This study makes an allowance for
future growth in e-tailing based on Experian projections. It will be necessary to
monitor the amount of sales attributed to home shopping in the future in order
to review future policies and development allocations.
On-line shopping has experienced rapid growth since the late 1990s but in
proportional terms the latest available data suggests it remains an insignificant
percentage of total retail expenditure. Recent trends suggest continued strong
growth in this sector, but Experian’s projections suggest this growth will level
off by 2016/17.
The implications on the demand for retail space are unclear. For example,
some retailers operate on-line sales from their traditional retail premises eg.
food store operators. Therefore, growth in on-line sales may not always mean
there is a reduction in the need for retail floorspace. Given the uncertainties
relating to internet shopping and the likelihood that it will increase in

Barking & Dagenham : Economic Development Study
P28 6788302v3P28
proportional terms, this assessment has adopted relatively cautious growth
projections for retail expenditure.
Market Shares/Penetration Rates
To assess the capacity for new retail floorspace, penetration rates are
estimated for shopping facilities within the study area. The assessment of
penetration rates are based on a range of factors but primarily information
gathered through the 2013 household survey.
The total turnover of shops within the District is estimated based on penetration
rates. For convenience goods shopping turnover estimates are then compared
to average company benchmark or average sales floorspace densities derived
from Verdict (UK Food and Grocery Retailers 2013) and Mintel (Retail
Rankings 2013) information, which provide an indication of how individual retail
stores and centres are performing against expected turnover averages. This
allows the identification of potential surplus or deficit capacity for retail sales
floorspace.
Benchmark Turnover Levels
Company average turnover to sales floorspace densities are available for
major food store operators and are compiled by Verdict. Company average
sales densities (adjusted to exclude petrol and comparison sales and include
VAT) have been applied to the sales area of the large food stores, and a
benchmark turnover for each store has been calculated. This benchmark
turnover is not necessarily the actual turnover of the food store, but it does
provide a useful benchmark for assessing existing shopping patterns and the
adequacy of current floorspace in quantitative terms.
The estimated convenience goods sales areas have been derived from a
combination of the Institute of Grocery Distribution (IGD), Goad plans and NLP
estimates based on site visits. Estimates for comparison sales floorspace
within large food stores has been deducted, for consistency with the use of
goods based expenditure figures.
Average sales densities are not widely available for small convenience shops,
particularly independent retailers. Based on the mix of shops present in each
centre within the Borough and our experience of trading levels of small
independent shops informed by household shopper surveys elsewhere, we
have adopted an average sales density of £5,000 per sq.m net for convenience
shops/stores in the study area. This is consistent with NLP’s experience of
retail studies across the South and East of England. The total benchmark
turnover of identified convenience sales floorspace within LBBD is £259.62
million (Table 13, Appendix 13).
Mintel’s Retail Rankings provides company average sales density information
for a selection of national comparison retailers. This data suggests a notional
average sales density for national high street comparison retailers of around
£5,000 per sq.m.

Barking & Dagenham : Economic Development Study
6788302v3 P29
Appendix 9 Household Survey Results


Barking & Dagenham : Economic Development Study
6788302v3 P31
Household Survey Results
Survey structure
NEMS Market Research carried out a telephone survey of 1,200 households
across the Barking and Dagenham Borough study area in October 2013. The
study area was split into six zones based on ward boundaries.
The number of interviews undertaken in each zone reflects the relative
population in order to produce statistically reliable sub-samples. The main aims
of the survey were to establish consumer patterns for the following:
• Main food shopping and small scale ‘top up’ shopping;
• Non- food shopping, including:
- Clothes and shoes;
- Domestic electrical appliances and other electric goods;
- Furniture, soft furnishings and flooring;
- DIY/Hardware and garden items;
- Health, Beauty and chemist items; and
- Other comparison goods such as books, CDs, toys and gifts.
Main food shopping
The primary destination for main food shopping are large supermarket stores
(Q.1), Table HS.1 shows the top ten food stores in terms of the percentage of
respondents that visited each.
Table HS.1 Main Food Shopping Destinations
Food Store Percentage
Asda, Merrielands Crescent, Dagenham 14.5%
Asda, Vicarage Field, Barking 5.6%
Morrisons, Beacontree Heath, Wood Lane 5.3%
Tesco Extra, Rainham, Essex 5.0%
Tesco Barking Superstore 5.0%
Tesco Extra, Romford, Essex 5.0%
Sainsbury's Claps Gate Lane, Beckton 4.5%
Tesco Extra Gallions Reach 4.3%
Asda, Tollgate Road, Beckton 3.6%
Sainsbury's High Street, Chadwell Heath 3.6%
Source: NEMS Household Survey, October 2013
Barking and Dagenham Heathway both have a high market share of main food
shopping; 14.5% of respondents visited major food stores in Dagenham
Heathway and 10.6% of respondents visited major food stores in Barking. Out

Barking & Dagenham : Economic Development Study
P32 6788302v3P32
of the 10 most popular food stores however a relatively high proportion of main
food shopping (totalling 18.1%) was carried out outside the Borough.
Mode of travel for main food shopping
16 Figure HS.1 showos that in the study area 65.6% of respondents travel to
do their main shopping by car. This is lower than the NLP average of
74.6% which has been derived from similar surveys (around 40 surveys
conducted in city and rural local authorities across the UK over the past 8
years). The second most popular way to travel to do food shopping was
by bus (17%) this is significantly higher than the NLP average of 8.6%.
The third most popular way to travel to food stores was walking (11.9%)
this figure is similar to the NLP average of 11.7%.
Figure HS.1. Mode of travel in study area
Source: NEMS Household Survey, October 2013
Top-Up Food shopping
Top-up food shopping trips are normally made to supplement main food trips to
larger stores and are undertaken on a more frequent basis for staples such as
bread and milk. Approximately 65% of households stated that they undertake
top-up food shopping in addition to their main food shopping. The market share
of top up food shopping for each major centre and district centre is shown in
Figure HS.2 below. Only 0.2% of respondents did top-up food shopping online
compared to 2.1% who did their main food shopping online.
65.6%
17.0%
0.9% 0.3% 1.1%11.9%
1.2% 2.0%

Barking & Dagenham : Economic Development Study
6788302v3 P33
Figure HS.2. Most popular destinations for top-up food shopping
Source: NEMS Household Survey, October 2013
Non-food shopping
Respondents were asked where they did the most of their non-food household
shopping, the most popular destinations and the proportion of respondents
who visited the centre is shown in Figure HS.3 below. For the study area as a
whole, Romford was the most popular destination with 27.1% of all
respondents shopping there, followed by Ilford and Lakeside (13.2% each),
Barking (6.8%) and Dagenham Heathway (6.5%). This demonstrates that the
majority of non-food shopping is carried out outside the Borough.
Figure HS.3 Top 10 most popular destinations for non-food shopping
Source: NEMS Household Survey, October 2013
Overall, 2.8% of respondents buy most of their non-food shopping on the
internet. The Dagenham zone has the highest proportion of respondents who
buy most of their non-food shopping on the internet (4.5%), followed by the
18.8%
10.2%
4.8%6.7%
3.0% 3.1% 2.8%
6.4%
27.1%
13.2% 13.2%
6.8% 6.5%5.1% 4.5%
2.8% 2.7% 2.2%

Barking & Dagenham : Economic Development Study
P34 6788302v3P34
Barking zone (3.9%). The Havering West zone undertakes the lowest
proportion of non-food shopping on the internet (0.8%).
Mode of travel for non-food shopping
The predominant mode of travel for non-food shopping was the car (both driver
and passenger) with 56.6% of respondents indicating that they use this form of
transport. The second most popular mode of transport for non-food shopping
was bus/coach (27.6%) followed by walking (7.2%).
Figure HS.4 Mode of travel for non-food shopping
Source: NEMS Household Survey, October 2013
Non-food Shopping Destinations
Respondents were also asked at which locations they last did various
categories of non-food shopping. The top 10 retail destinations for each
category are shown in Figures HS.5 – HS.11 below.
56.6%
1.7%3.9%
27.6%
0.7%7.2% 2.2%
Car
Tube
Train
Bus/ Coach
Taxi
Walk
Goods delivered

Barking & Dagenham : Economic Development Study
6788302v3 P35
Figure HS.5 Clothes and Shoes
Source: NEMS Household Survey, October 2013
Figure HS.6 Domestic electrical appliances
Source: NEMS Household Survey, October 2013
28.7%
16.4%
11.9%
6.8%5.1% 3.7% 3.4% 2.9% 2.8% 2.4%
14.5%
7.8%7.0% 6.6% 6.2%
5.1% 4.7% 4.2%3.4% 3.3%

Barking & Dagenham : Economic Development Study
P36 6788302v3P36
Figure HS.7 Non-domestic electric goods
Source: NEMS Household Survey, October 2013
Figure HS.8 Furniture, Soft furnishings and floor covering
Source: NEMS Household Survey, October 2013
11.2% 11.1%
8.7%
7.0% 6.6%
5.3%
4.0% 3.9%2.8% 2.5%
12.3%
10.2%
6.1%5.3%
4.6% 4.6% 4.2%
2.3% 2.0% 1.5%

Barking & Dagenham : Economic Development Study
6788302v3 P37
Figure HS.9 DIY, hardware and garden items
Source: NEMS Household Survey, October 2013
Figure HS.10 Health, beauty and chemist items
Source: NEMS Household Survey, October 2013
17.1%
10.7%8.9%
5.9% 5.6% 4.9%3.3% 2.9%
2.0% 2.0%
12.5%11.4%
10.4% 10.1% 9.9%
3.2% 3.0% 3.0% 2.7% 2.7%

Barking & Dagenham : Economic Development Study
P38 6788302v3P38
Figure HS.11 Books, CDs, toys and gifts
Source: NEMS Household Survey, October 2013
Internet Shopping
Respondents were asked what goods they regularly buy on the internet.
48.5% of respondents stated that they did not regularly buy items on the
internet. The most popular response was “other” goods including books, CDs
and toys (31.7%), followed by clothes and shoes (18.8%) and electrical goods
including TV, Hi-Fi and computers (10.8%). Only 3.7% stated that they
regularly buy groceries on the internet.
Community Facilities
Respondents were asked where their household normally visits to use
community facilities such as libraries and community halls. The most popular
destination was Dagenham Heathway (11.8%), followed by Barking (11.5%)
and Ilford (10.6%).
Leisure Activities
Cinema
Respondents were asked which cinema they or their family last visited. 63% of
respondents said they visited the cinema, which was the second most popular
leisure activity after visiting restaurants. This response rate is higher than NLPs
average of 51% (derived from similar studies from across the country). The
most popular cinema destinations visited by respondents from across the study
area were Vue Romford (13%), Vue Dagenham (12.9%), Showcase
Dagenham (9.0%) and Cineworld Ilford (6.3%).
23.1%
13.3%
6.9% 6.0%3.9% 3.4% 2.9% 2.3% 2.1% 1.9%

Barking & Dagenham : Economic Development Study
6788302v3 P39
Theatre
55% of respondents said that they had visited the theatre, and this was the
third most popular leisure activity overall. Again, this figure is higher than the
NLP average which is 42.5%. The high level of theatre visits is probably due to
the high number of facilities in close proximity in Central London. When asked
where they had visited the theatre, Central London was the most popular
destination (33.3%). Respondents also visited theatres in Hornchurch (5.2%),
Ilford (4.7%) and Barking (2.9%).
Pub/Bar
45% of respondents from across the Borough indicated that they visited pubs
and bars. This is slightly lower than the NLP average from other surveys which
is 47.5%. When asked where they had most recently visited pubs or bars,
6.5% of respondents answered Central London. The most popular local
destinations included Romford (5.1%), Hornchurch (4.2%), Dagenham
Heathway (3.4%) and Chadwell Heath (3.2%).
Restaurant
Visiting restaurants was the most popular leisure activity across the study area
with 78% of respondents indicating that they has recently visited a restaurant.
This is higher than the NLP average for other surveys which is 67.9%. When
asked where they had most recently visited a restaurant, 10.7% of respondents
answered Romford. Central London was the second most popular destination
(8.6%), followed by Hornchurch (7.6%), Dagenham Heathway (4.8%),
Chadwell Heath (4.3%) and finally Barking Town Centre (3.4%).
Nightclubs
Only 11% of respondents said that they had visited nightclubs, and this was
the least popular leisure activity across the study area. This participation rate
is higher than the NLP average of 9.9% derived from similar surveys. The
sample of visitors in each zone was relatively small, however the most popular
location for respondents who had last visited a nightclub was Central London
(3.7%) followed by Romford (2.7%).
Bingo
Bingo facilities were visited by 13% of respondents making this the second
least popular leisure activity across the Borough. This figure is however
significantly higher than the NLP average of 5.1% derived from similar studies.
The most popular destinations respondents went to play bingo were Mecca
Bingo at Dagenham Leisure Park (5.6%), Mecca Bingo Chadwell Heath (1.4%)
and Mecca Bingo Romford (1.2%).

Barking & Dagenham : Economic Development Study
P40 6788302v3P40
Tenpin bowling
28% of respondents indicated that their household visited tenpin bowling
facilities, and this is significantly higher than the NLP average of 18.1% derived
from similar surveys. The most popular destinations for bowling are Dagenham
bowling (10%), Namco Romford (4.2%) and The City Pavilion Romford (3.9%).
Health club/gym
28% of respondents from across the study area also indicated that they visited
health clubs/gyms. This is slightly higher than the NLP average of 25.6%
derived from similar surveys. Figure HS.12 below shows the most popular
destinations for respondents using health club/gym facilities.
Figure HS.12 Health and gym facility destinations
Source: NEMS Household Survey, October 2013
3.0%
2.7%
2.4%
1.6%1.5%
1.3%
1.0%
Beacontree Dagenham East Ham Barking Ilford Newham Central
London

Barking & Dagenham : Economic Development Study
6788302v3 P41
Appendix 10 Audit of Centres


Barking & Dagenham : Economic Development Study
6788302v3 P43
Barking Town Centre
Barking is defined as a major centre and is located to the west of the Borough.
It is the largest town centre in the Borough as such it has a stronger
comparison offer and more national retailers than any other centre surveyed
for this study. The main retail areas in the centre include Vicarage Fields
Shopping Centre, East Street, Ripple Road and the Station Quarter which is
located around Barking train and underground station. The recently
redeveloped Town Square comprises several modern retail units and a new
community learning centre.
Barking Town Centre’s key roles include:
• Comparison shopping: a good selection of national multiple retailers
and independent shops selling a range of both low and high order
comparison goods.
• Convenience shopping: Asda located within the Vicarage Fields
Shopping Centre, Lidl on Ripple Road and Iceland on East Street provide
the main convenience offer within the centre. These are complimented by
a diverse range of independent food stores.
• Services: good selection of retail services including restaurants, cafes,
banks, post office, dry cleaners, internet café and bureau de change.
• Leisure: snooker club, theatre, and leisure centre.
• Community uses: community halls, health centre, learning centre, local
Council offices, dental surgery and places of worship.
Mix of Uses and Occupier Representation
Barking has a total of 266 retail/service uses. The diversity measured by
number of units is set out against the national average in Table B.1.
Table B.1 Barking Use Class Mix by Unit
Type of Unit Units
% of Total Number of Units
% National Average (1)
Comparison Retail 97 36.5 36.0
Convenience Retail 33 12.4 8.1
A1 Services (2)
33 12.4 14.1
A2 Services 30 11.3 12.1
A3/A5 41 15.4 14.7
A4 Pubs/bars 5 1.9 2.9
Vacant 27 10.1 12.1
Total 266 100.0 100.0
Source: Goad Plans, updated by NLP November 2013
Notes: (1) UK average for all town centres surveyed by Goad Plans (March 2014) (2) incl. hairdressers, travel agents and other Class A1 uses not selling comparison/convenience goods

Barking & Dagenham : Economic Development Study
P44 6788302v3P44
Figure B.1 Goad Plan of Barking Town Centre (Ground Floor Only)
The composition of Barking town centre is very similar to the national average
in the majority of categories. The greatest deviation from the national average
is the proportion of convenience goods retail units which is 4.3 percentage
points higher. The vacancy rate is marginally lower than the national average.

Barking & Dagenham : Economic Development Study
6788302v3 P45
Retailer Representation
Table B.2 Barking Breakdown of Comparison Units
Type of Unit Barking % UK Average*
Units %
Clothing and footwear 29 29.9 25.6
Furniture, carpets and textiles 5 5.2 8.3
Booksellers, arts, crafts and stationers 4 4.1 10.9
Electrical, gas, music and photography 16 16.5 9.5
DIY, hardware and homewares 9 9.3 6.2
China, glass, gifts and fancy goods 0 0.0 3.9
Cars, motorcycles and motor access 0 0.0 2.9
Chemists, drug stores and opticians 16 16.5 9.4
Variety, department and catalogue 1 1.0 1.4
Florists, nurserymen and seedsmen 1 1.0 2.2
Toys, hobby, cycle and sport 3 3.1 5.1
Jewellers 4 4.1 4.9
Other comparison retailers 9 9.3 9.7
Total 97 100.0 100.0
Source: Goad Plans, updated by NLP November 2013 *UK average for all town centres surveyed by Goad Plans (March 2014)
Overall the selection of comparison retail stores in Barking is reasonable. Of
the 97 comparison retailers 21 are national multiples (excluding six charity
shops). Key multiple stores include Argos, Boots, QS, Peacocks, Superdrug,
Wilkinson, WH Smith and fashion stores include Evans, Dorothy Perkins, New
Look and Burton, which in terms of market position are lower middle. There are
70 independent comparison shops selling a range of products. There are a
number of gaps in the general clothing sector i.e. middle/mass market level
and upper market/luxury sectors e.g. Next, Clarkes, Topshop and Monsoon.
Table B2 indicates that most of the key Goad goods categories are
represented in Barking, however the centre does not have any shops which fall
within two categories i.e. china/glass/gifts/fancy goods and
cars/motorcycles/motor accessories. The choice of shops in other categories is
poor with less than 5 shops in five other categories. Barking does not contain
a department store such as Debenhams or Marks & Spencer.
The choice of shops within the clothing/footwear, electrical/music/
photography, DIY/hardware/homewares and chemists/drug stores/opticians is
reasonable.
Barking comparison shopping provides a mix of lower order comparison goods
purchased on a day to day basis and higher order comparison goods bought
on a more occasional basis where customers generally shop around/window
shop e.g. adult clothes and footwear. The town centre has a duel higher and
lower order comparison shopping role, but the higher order comparison
shopping role is focused on lower middle and discount sectors of the market.

Barking & Dagenham : Economic Development Study
P46 6788302v3P46
The Barking Town Centre Study 2012 undertook a detailed gap analysis of
missing retailers. This benchmarked Barking town centre against other
comparable centres. The list of missing retailers included Clinton cards, British
Heart Foundation, Cancer Research UK, Clarks, Mothercare, Oxfam, Ryman,
the Body Shop, Marks & Spencer, Millets, Poundstretcher, Robert Dyas,
Savers, Waterstone’s, Age UK, Early Learning Centre, F Hinds, H Samuel,
Monsson, Next, The Works, Babygap, Dreams, M&Co, Primark, Store Twenty
One and Topshop.
These retailers are predominantly charity, discount or lower middle sector
retailers with some middle sector retailers. However the gap analysis suggests
there is future scope for Barking town centre to expand without a step change
in its market position, which is unlikely based on the town centre’s position in
the shopping hierarchy.
The gap analysis also identified Sainsbury’s who are now proposing a store at
Abbey Retail Park on the edge of the town centre.
Barking Street Market
The Council operates a street market in Barking Town Centre in partnership
with Charfleets Limited. It is held every week on Saturdays, Tuesdays and
Thursdays and Fridays. It is a traditional East London general market with a
multi-cultural theme. The market has up to 180 stalls which provide a good
range of products including clothing, household products, foods and hardware.
The market appears to be busy and vibrant. It is an important part of the town
centre’s attraction, and gives Barking added local distinctiveness. There is a
strong community feel within most parts of the market and it serves as a
focal/meeting point, as well as growing as attraction to many shoppers from
outside the local area.
Retail Rents
Prime Zone A retail rents in Barking declined between 2008 and 2009, from
£861 per sq.m to £700 per sq.m. Rents remained the same, at £700 per sq.m
in 2010 (source: Colliers International Retail Rents, 2010).
Service Uses
Barking has a good range of service uses with all the Goad categories being
present and well represented, and the split of service uses by category
generally reflects the national averages. The proportion of takeaways and
betting shops are higher than the national averages.
The gap analysis within the 2012 Barking Town Centre study identified 30 non-
comparison goods operators. Many of these were cafés, coffee shops or fast
food outlets (e.g. Costa, Burger King and Pizza), travel agents (Thomas Cook)
and Co-op travel), opticians and betting shops.

Barking & Dagenham : Economic Development Study
6788302v3 P47
Table B.3 Barking Analysis of Selected Service Uses
Type of Unit Barking % UK Average*
Units %
Restaurants/cafés 22 24.2 25.2
Takeaways 19 20.9 16.4
Banks/other financial services 13 14.3 14.0
Betting Shops/Casinos 7 7.7 4.3
Estate agents/valuers 6 6.6 10.3
Travel agents 2 2.2 2.7
Hairdressers/beauty parlours 21 23.1 24.8
Laundries/dry cleaners 1 1.0 2.4
Total 91 100.0 100.0
Source: Goad Plans, updated by NLP November 2013 *UK average for all town centres surveyed by Goad Plans (March 2014)
Vacant Units
The vacancy rate in Barking is lower than the national average at 10.1%
compared to 12.1%. It should be noted that the vacant units includes shop
units on London Road that are part of the redevelopment proposals. A
significant proportion of the vacant units are located within the Vicarage Field
Shopping Centre, including the upper floor. The number of vacant units within
the pedestrianised section of East Street is relatively low. The overall vacancy
rate has returned to near pre-recession levels. The 10.1% vacancy rate is
probably not a true reflection of the health of the town centre.
Other Non-Retail Uses
Barking town centre has an excellent provision of non-retail uses including
leisure and community uses. These uses include: a library/learning centre,
council offices, health centres, sports/leisure centre, theatre, places of worship,
Travelodge hotel, nightclubs, snooker hall, kindergarten and citizens advice
bureau.
Shopper Views
When asked ‘what if anything would make you shop in Barking Town Centre
more often’ 68.4% of respondents made no suggestions of improvements
which could be made to the centre. 13.3% of respondents said a better choice
of shops in general and 3.8% responded better quality shops. 6.1% of
respondents replied more or better parking and 3.95% replied free parking.
The following comments; more food supermarkets, more large shops and
better maintenance/cleanliness were each suggested by 2.2% of respondents.
Accessibility
Barking town centre has excellent public transport accessibility. The station is
located in the heart of the town centre and is served by the District,

Barking & Dagenham : Economic Development Study
P48 6788302v3P48
Hammersmith & City lines), overland rail and 10 bus routes. The town centre
is also well connected to the road network with easy access to the A12, A13,
M25 and north circular. Less than 1% of household survey respondents
indicated that better bus or transport links would make them shop more often in
Barking town centre.
The town centre has a number of car parks, including London Road multi-
storey (650 spaces), Asda car park (330 spaces), Vicarage Field (200 spaces)
and Axe Street car park (200 spaces). Only 6% of household survey
respondents said more car parking would make them shop more often in
Barking town centre, and only 4% suggested cheaper car parking.
Environmental Quality
The environmental quality in the centre is mixed. Station Parade a linear route
with fairly heavy traffic flow, with HGVs regularly passing through the street.
As a result this shopping street has reduced pedestrian accessibility and safety
and reduced overall environmental quality due to noise and air pollution
associated with traffic.
Ripple Road, East Street and the Vicarage Field shopping centre are all highly
accessible for pedestrians. East Street is fully pedestrianized and hosts a
weekly street market selling a range of convenience and comparison goods.
The paving, street furniture and upkeep of some shop fronts in this part of the
centre however is poor which detracts from the quality of public realm.
Pedestrian access and safety has been improved along Ripple Road as a
result of recent traffic calming measures such as new pedestrian crossings and
on-road parking. The quality of public realm has been significantly upgraded as
a result of the development of new high quality, well designed modern
buildings and the implementation of street scene improvements including
planting, paving and seating. The Vicarage Field shopping centre offers a safe
and highly accessible shopping environment for pedestrians. The centre has a
number of vacancies and is occupied by many low quality retailers, this,
together with the aged internal fixtures and fittings in the centre significantly
reduces quality of the public realm.
The centre contains a wide range of buildings in terms of use and architectural
design. The most historic buildings are located along East Street and all
contain A1, A2, A3 and A5 uses. A number of new and retrofitted modern
buildings contain a wider range of uses including a new Travelodge hotel,
community learning centre, residential flats with ground floor commercial units,
a religious centre and theatre.
The centre has fully integrated and linked CCTV coverage and the
environment is safe and comfortable.

Barking & Dagenham : Economic Development Study
6788302v3 P49
Dagenham Heathway
Dagenham Heathway is a linear shopping centre which extends north to south
along the main shopping street ‘The Heathway’. It is defined as a district centre
which is centrally located to the South of the Borough surrounded by
residential areas. The centre has a good offer of retail and service uses as well
as complimentary community uses. Recently it has received a significant
amount of investment in new buildings such as the library and improvements to
landscaping and paving. The centre also functions as a transport hub;
Dagenham Heathway Station is located at the mid-point of the shopping
parade which is well served by local bus routes.
Dagenham Heathway’s key roles include:
• Convenience shopping: Lidl and Iceland provide the main supermarket
offer, located along the main shopping street the Heathway. The main
supermarket offer is supplemented by a broad range of small
independent food stores, butchers, bakers and fishmongers.
• Comparison shopping: a small number of national multiple retailers
selling a range of high and low order goods are located in the centre. The
comparison shopping offer is mainly made up of smaller independent
shops.
• Retail services: a fairly good selection of retail service units including a
national high street bank, estate agents, travel agents, cafes,
restaurants, beauticians and hairdressers.
• Community facilities: limited to the new library and a community police
unit.
Mix of Uses and Occupier Representation
Dagenham Heathway has a total of 113 retail/service uses. The diversity
measured by number of units is set out against the national average in Table
D.1.
Table D.1 Dagenham Heathway Use Class Mix by Unit
Type of Unit Units
% of Total Number of Units
% National Average (1)
Comparison Retail 34 30.0 36.0
Convenience Retail 16 14.2 8.1
A1 Services (2)
14 12.4 14.1
A2 Services 25 22.1 12.1
A3/A5 13 11.5 14.7
A4 Pubs/bars 1 0.9 2.9
Vacant 10 8.8 12.1
Total 113 100.0 100.0
Source: Goad Plans, updated by NLP November 2013
Notes: (1) UK average for all town centres surveyed by Goad Plans (March 2014) (2) incl. hairdressers, travel agents and other Class A1 uses not selling comparison/convenience goods

Barking & Dagenham : Economic Development Study
P50 6788302v3P50
Figure D.1 Goad Plan of Dagenham Heathway
Dagenham Heathway has a high proportion of Class A2 services, particularly
betting shops, estate agents and banks. Dagenham Heathway’s proportion of
comparison retail is significantly lower than the national average, whilst the
proportion of convenience shops is higher than average. The proportion of
vacant units is lower than average, which suggests that the health of the centre
is satisfactory in this respect.
Retailer Representation
Dagenham Heathway has a relatively small selection of comparison shops (34)
reflecting the centre’s primary role as a local shopping destination. There are

Barking & Dagenham : Economic Development Study
6788302v3 P51
five charity shops and eight main comparison multiples including Peacocks,
Wilkinson, Boots, JD Sports and Shoe Zone. Table D.2 provides a breakdown
of comparison shop uses by Goad categories.
The centre provides all of the main Goad comparison categories apart from
variety, department and catalogue, however the choice of shops within each
category is very limited with five or less in most categories. The centre has a
good provision of chemists and opticians.
Dagenham Heathway’s comparison shopping provides a mix of lower order
comparison goods purchased on a day to day basis and higher order
comparison goods, but the choice of shops is relatively limited.
Table D.2 Dagenham Heathway Breakdown of Comparison Units
Type of Unit Dagenham Heathway % UK Average*
Units %
Clothing and footwear 5 14.7 25.6
Furniture, carpets and textiles 2 5.9 8.3
Booksellers, arts, crafts and stationers 1 2.9 10.9
Electrical, gas, music and photography 2 5.9 9.5
DIY, hardware and homewares 3 8.8 6.2
China, glass, gifts and fancy goods 1 2.9 3.9
Cars, motorcycles and motor access 1 2.9 2.9
Chemists, drug stores and opticians 8 23.5 9.4
Variety, department and catalogue 0 0.0 1.4
Florists, nurserymen and seedsmen 1 2.9 2.2
Toys, hobby, cycle and sport 3 8.8 5.1
Jewellers 2 5.9 4.9
Other comparison retailers 5 14.7 9.7
Total 34 100.0 100.0
Source: Goad Plans, updated by NLP November 2013 *UK average for all town centres surveyed by Goad Plans (March 2014)
The proportion of clothing and footwear and booksellers, arts, crafts and
stationers units are all significantly lower than the national average.
Conversely the proportion of chemists, drug stores and opticians and ‘other’
comparison retailers including charity shops is higher than the national
average. This reflects the fact that the centre’s main role is for convenience
shopping and services. The centre does not perform well compared to national
averages in terms of variety of comparison units.
Service Uses
Dagenham Heathway has a good range of service uses with all the Goad
categories being present and well represented. The centre has low provision
of restaurants/cafés but a higher provision of takeaways. The proportion of
betting shops is nearly double the national average. Banks/other financial
services and estate agents is notably higher than the national average and
reflects Dagenham Heathway’s role as a local service centre.

Barking & Dagenham : Economic Development Study
P52 6788302v3P52
Table D.3 Dagenham Heathway Analysis of Selected Service Uses
Type of Unit Dagenham Heathway % UK Average*
Units %
Restaurants/cafés 5 10.2 25.2
Takeaways 8 16.3 16.4
Banks/other financial services 11 22.4 14.0
Betting Shops/Casinos 4 8.2 4.3
Estate agents/valuers 9 18.4 10.3
Travel agents 2 4.1 2.7
Hairdressers/beauty parlours 9 18.4 24.8
Laundries/dry cleaners 1 2.0 2.4
Total 49 100.0 100.0
Source: Goad Plans, updated by NLP November 2013 *UK average for all town centres surveyed by Goad Plans (March 2014)
Vacant Units
There were 10 vacant units in Dagenham Heathway when NLP surveyed the
centre in November 2013. This gives the centre a vacancy rate of 8.8% which
is much lower than the national average at 12.1%.
Other Non-Retail Uses
Dagenham Heathway has a limited range of non-retail uses, including a library,
health and fitness club and post office. The library is an important asset in
terms of attracting customers to the centre.
Shopper Views
When asked what would make them shop more often in Dagenham Heathway,
63% of residents responded ‘nothing’ and 14.6% responded ‘don’t know’,
therefore overall 77.6% of residents did not suggest any improvements to the
centre. The most common suggestion was ‘a better choice of shops’ (10.5%)
and the second most common ‘a better choice of clothing shops’. No other
suggestion achieved more that 5%.
Accessibility
Dagenham Heathway has good public transport accessibility. The underground
station is located in the heart of the centre and provides east-west linkages via
the District line. The centre is served by 5 bus routes i.e. 3 north-south routes
and two east-west routes. The centre has excellent road connections to the
A13, M25 and north circular. Less than 1% of household survey respondents
indicated that better bus links would make them shop more often in Dagenham
Heathway. Less than 5% of household survey respondents said more car
parking would make them shop more often in the centre, and only 1%
suggested free or cheaper car parking.

Barking & Dagenham : Economic Development Study
6788302v3 P53
Environmental Quality
The majority of retail units along Dagenham Heathway occupy the ground floor
of post-war terraced properties. Some retail units to the north of the station
however occupy purpose built single storey built retail units. The recently
developed modern library building with residential units above located at the
junction at the southern end of the Heathway with associated public realm
improvements create an impressive gateway entrance to the shopping street.
Overall however quality of the built environment along the Heathway is poor
and many of the shop unit buildings appear to require maintenance.
Substantial public realm improvements extend along the Heathway to the north
and along adjoining streets: Parsoles Avenue to the west and Reede Road to
the east. These improvements, which include new planters, high quality
paving, lighting and cycle storage facilities, all significantly add to the quality of
the public realm. Recent traffic calming measures such as road narrowing have
improved pedestrian safety and accessibility although the roads still have
heavy traffic flows.


Barking & Dagenham : Economic Development Study
6788302v3 P55
Chadwell Heath
Chadwell Heath district centre is predominantly a linear shopping street
extending approximately 1 kilometre west to east along High Road. The centre
also incorporates the northern ends of Station Road and Wangey Road, where
they both join High Road. It is defined as a district centre and is located in the
far north of the Borough. The far western end of the centre overlaps into the
neighbouring LB of Redbridge.
The key roles of Chadwell Heath include:
• Convenience shopping: Sainsbury’s provides the main convenience
supermarket offer, in addition to Tesco Express. Convenience provision
is supported by a number of independent grocery stores, newsagents,
off-licences, bakeries and food specialists.
• Comparison shopping: Only one of the national multiple retailers is
present in the centre – Peacocks. The majority of comparison provision is
made up of small, independent businesses.
• Services: Provides a good range and choice of services including high
street banks, estate agents, hairdressers, cafes, restaurants, takeaways,
dry cleaners, launderettes and beauty parlours.
• Entertainment: Mecca Bingo hall in an old cinema building.
• Community facilities: Chadwell Heath Community Centre and a place
of worship.
Mix of Uses and Occupier Representation
Chadwell Heath has a total of 119 retail/service units. Table CH.1 sets out the
mix of uses in Chadwell Heath district centre, compared with the Goad national
average.
Table CH.1 Chadwell Heath Use Class Mix by Unit
Type of Unit Units
% of Total Number of Units
% National Average (1)
Comparison Retail 31 26.1 36.0
Convenience Retail 13 10.9 8.1
A1 Services (2)
23 19.3 14.1
A2 Services 18 15.1 12.1
A3/A5 23 19.3 14.7
A4 Pubs/Bars 4 3.4 2.9
Vacant 7 5.9 12.1
Total 119 100.0 100.0
Source: Goad Plans, updated by NLP November 2013
Notes: (1) UK average for all town centres surveyed by Goad Plans (March 2014) (2) incl. hairdressers, travel agents and other Class A1 uses not selling comparison/convenience goods

Barking & Dagenham : Economic Development Study
P56 6788302v3P56
Figure CH.1 Goad Plan of Chadwell Heath
The centre has a much lower proportion of comparison retail units when
compared against the national average, whilst the proportion of convenience
retail units is above the UK average. The proportion of retail service units is

Barking & Dagenham : Economic Development Study
6788302v3 P57
higher than the national average for all use types, due in part to the much
lower vacancy rate.
Retailer Representation
Chadwell Heath has a relatively small selection of comparison shops (31)
reflecting the centre’s primary role as a local shopping destination. A part from
four charity shops nearly all these shops are small independent traders.
Peacocks is the only major national comparison multiple. Table CH.2 provides
a breakdown of comparison shop uses by Goad categories.
The centre provides all of the main Goad comparison categories apart from
variety, department and catalogue, however the choice of shops within each
category is very limited with five or less in each.
Chadwell Heath’s comparison shopping offer is focuses on lower order
comparison goods purchased on a day to day basis e.g. pharmaceutical
products, cards, flowers, children’s clothes and small household items, rather
than higher order comparison goods bought on a more occasional basis where
customers generally shop around/window shop.
Table CH.2 Chadwell Heath Breakdown of Comparison Units
Type of Unit Chadwell Heath % UK Average*
Units %
Clothing and footwear 4 12.9 25.6
Furniture, carpets and textiles 2 6.5 8.3
Booksellers, arts, crafts and stationers 2 6.5 10.9
Electrical, gas, music and photography 2 6.5 9.5
DIY, hardware and homewares 2 6.5 6.2
China, glass, gifts and fancy goods 1 3.2 3.9
Cars, motorcycles and motor access 1 3.2 2.9
Chemists, drug stores and opticians 4 12.9 9.4
Variety, department and catalogue 0 0.0 1.4
Florists, nurserymen and seedsmen 1 3.2 2.2
Toys, hobby, cycle and sport 5 16.1 5.1
Jewellers 2 6.5 4.9
Other comparison retailers 5 16.1 9.7
Total 31 100.0 100.0
Source: Goad Plans, updated by NLP November 2013 *UK average for all town centres surveyed by Goad Plans (March 2014)
Service Uses
Chadwell Heath has a very good range of service uses, with all but one of the
Goad categories (Travel agents) represented, as shown in Table CH.3. The
centre has a relatively high proportion of hairdressers/beauty parlours, estate
agents and launderettes/dry cleaners. The proportion of units within the banks/
other financial services, and restaurants/cafes/takeways categories is lower
than the UK average.

Barking & Dagenham : Economic Development Study
P58 6788302v3P58
Three high street banks (HSBC, Barclays and Natwest) are represented, but
none of the national restaurant and café operators are present.
Table CH.3 Analysis of Selected Service Uses
Type of Unit Chadwell Heath % UK Average*
Units %
Restaurants/cafés 9 15.8 25.2
Takeaways 14 24.6 16.4
Banks/other financial services 4 7.0 14.0
Betting Shops/Casinos 3 5.3 4.3
Estate agents/valuers 8 14.0 10.3
Travel agents 0 0.0 2.7
Hairdressers/beauty parlours 16 28.1 24.8
Laundries/dry cleaners 3 5.2 2.4
Total 57 100.0 100.0
Source: Goad Plans, updated by NLP November 2013 *UK average for all town centres surveyed by Goad Plans (March 2014)
Vacant Units
The vacancy rate of Chadwell Heath is less than half the national average
which suggests the health of the centre in this respect is good. The main
cluster of vacant units is towards the extreme eastern end of the district centre,
near the junction with Whalebone Lane North.
Other Non-Retail Uses
Chadwell Heath a reasonable provision of non-retail uses, including a bingo
hall (in LB Redbridge), community centre, dentist, places of worship, post office
and educational institutions.
Shopper views
Respondents to the household survey were asked what, if anything would
make them shop more often in Chadwell Heath district centre. In the study
area as a whole 66.9% said ‘nothing’ would make them shop more often in
Chadwell Heath and a further 19.4% did not know, therefore 86.3% did not
suggest any improvements. Just under 6% stated a better choice of shops in
general, followed by 3.9% who would like to see more car parking. No other
answer achieved more than 2%.
Accessibility
Chadwell Heath has reasonable public transport accessibility. The over-ground
railway station is within a short walking distance of the High Road and provides
east-west linkages. The centre is served by 5 bus routes. The centre has good
road connections to the A12 and M25.
Chadwell Heath Station is on the Cross Rail route now under construction,
which will provide improved linkages and capacity to Central and West London,

Barking & Dagenham : Economic Development Study
6788302v3 P59
with completion expected in 2018. The Cross Rail will enhance the attraction of
the Chadwell Heath Station as a place to live and commute, which in turn
should have economic benefits for Chadwell Heath Centre. In total it is
estimated that Crossrail could help create £5.5 billion in added value to
residential and commercial real estate along its route between 2012 and 2021
(source: research for Crossrail by GVA).
Less than 1% of household survey respondents indicated that better
bus/transport links would make them shop more often in Chadwell Heath. Only
4% of household survey respondents said more car parking would make them
shop more often in the centre, and only 1% suggested free or cheaper car
parking.
Environmental Quality
The buildings to the east of Sainsbury’s in general were of a poorer quality to
those to the west. This could be down to the fact that the highest concentration
of vacant units was found at the eastern end. The majority of buildings are pre-
Second World War terraces, interspersed with semi-detached and terraced
housing. Towards the eastern end there have been a couple of very large
residential developments over the last decade, which has helped to improve
the environmental quality.
There is unique street lighting throughout the centre which improves the
environmental quality, as do the pavement benches. The centre is mainly
linear along the High Road, focused along the A118. This results in heavy
traffic flows through the centre which can impede pedestrian movements and
reduces the overall attractiveness of the centre. However, there are a number
of pedestrian crossings throughout the centre.

Barking & Dagenham : Economic Development Study
P60 6788302v3P60
Green Lane
Green Lane is a linear shopping street extending west to east. It is defined as a
district centre and is located in the north of the borough, straddling the
boundary with the LB of Redbridge. The centre has a variety of retail and
service uses and fulfils a local shopping role for shoppers from the surrounding
residential areas.
The key roles of Green Lane include:
• Convenience shopping: Tesco Express and The Co-operative Food are
the two main food store destinations. Convenience provision is supported
by a number of grocery stores, newsagents, an off-licence, bakery and a
food specialist;
• Comparison shopping: Only one of the national multiple retailers are
present on the street - Superdrug. The comparison provision is
overwhelmingly made up of small independent businesses that are
spread throughout the centre;
• Services: provides a good range and choice of services including high
street banks, estate agents, hairdressers, cafes, restaurants, takeaways,
dry cleaners, launderette and beauty parlours;
• Entertainment: amusement arcade;
• Community facilities: including a health club and a place of worship.
Mix of Uses and Occupier Representation
Green Lane has a total of 121 retail/service units. Table GL.1 sets out the mix
of uses in Green Lane district centre, compared with the Goad national
average.
Table GL.1 Green Lane Use Class Mix by Unit
Type of Unit Units
% of Total Number of Units
% National Average (1)
Comparison Retail 38 31.4 36.0
Convenience Retail 18 14.9 8.1
A1 Services (2)
18 14.9 14.1
A2 Services 12 9.9 12.1
A3/A5 17 14.0 14.7
A4 Pubs/Bar 1 0.8 2.9
Vacant 17 14.0 12.1
Total 121 100.0 100.0
Source: Goad Plans, updated by NLP November 2013
Notes: (1) UK average for all town centres surveyed by Goad Plans (March 2014) (2) incl. hairdressers, travel agents and other Class A1 uses not selling comparison/convenience goods
The centre has a significantly lower proportion of comparison retail units when
compared against the national average, whilst the proportion of convenience

Barking & Dagenham : Economic Development Study
6788302v3 P61
units is higher than average. The proportion of other non-retail service units is
broadly similar to the national average.
Green Lane is the only main centre in LBBD with a vacancy rate higher than
the national average.
Figure GL.1 Goad Plan of Green Lane

Barking & Dagenham : Economic Development Study
P62 6788302v3P62
Retailer Representation
Green Lane has a relatively small selection of comparison shops (38) reflecting
the centre’s primary role as a local shopping destination. Table GL.2 provides
a breakdown of comparison shop uses by Goad categories.
The centre has three charity shops and only two comparison multiples i.e.
Lloyds Pharmacy and Superdrug.
The centre provides all of the main Goad comparison categories apart from
variety/department/catalogue and China/glass/gifts/fancy goods, however the
choice of shops within each category is very limited with five or less in most
categories. The centre has a good provision of electrical shops.
The proportion of units in a large number of categories is notably different from
the UK averages. Furniture, carpets and textiles; electrical, gas, music and
photography; chemists, drug stores and opticians; toys, hobby, cycle and sport;
and ‘other’ comparison retailers are all above the national average. Similarly,
there are a number of categories in which the proportion of units within Green
Lane district centre is significantly lower than the national average, including
clothing and footwear; and booksellers, arts, crafts and stationers. Two
categories (china, glass, gifts and fancy goods; and variety, department and
catalogue) are not represented at all within the centre.
Table GL.2 Green Lane Breakdown of Comparison Units
Type of Unit Green Lane % UK Average*
Units %
Clothing and footwear 3 7.9 25.6
Furniture, carpets and textiles 5 13.2 8.3
Booksellers, arts, crafts and stationers 2 5.3 10.9
Electrical, gas, music and photography 7 18.4 9.5
DIY, hardware and homewares 2 5.3 6.2
China, glass, gifts and fancy goods 0 0.0 3.9
Cars, motorcycles and motor access 1 2.6 2.9
Chemists, drug stores and opticians 5 13.2 9.4
Variety, department and catalogue 0 0.0 1.4
Florists, nurserymen and seedsmen 2 5.3 2.2
Toys, hobby, cycle and sport 4 10.5 5.1
Jewellers 1 2.6 4.9
Other comparison retailers 6 15.8 9.7
Total 38 100.0 100.0
Source: Goad Plans, updated by NLP November 2013 *UK average for all town centres surveyed by Goad Plans (March 2014)
Service Uses
Green Lane has a good range of service uses, with all but one category (travel
agents) represented, as shown in Table GL.3. The centre has a relatively low
proportion of banks and financial services; and a relatively high proportion of
hairdressers/beauty parlours, estate agents and laundries/dry cleaners.

Barking & Dagenham : Economic Development Study
6788302v3 P63
Two high street banks (Santander and Barclays) are represented, but none of
the national restaurant and café operators are present.
Table GL.3 Analysis of Selected Service Uses
Type of Unit Green Lane % UK Average*
Units %
Restaurants/cafés 5 11.4 25.2
Takeaways 12 27.3 16.4
Banks/other financial services 4 9.1 14.0
Betting Shops/Casinos 3 6.8 4.3
Estate agents/valuers 6 13.6 10.3
Travel agents 0 0.0 2.7
Hairdressers/beauty parlours 12 27.2 24.8
Laundries/dry cleaners 2 4.5 2.4
Total 44 100.0 100.0
Source: Goad Plans, updated by NLP November 2013 *UK average for all town centres surveyed by Goad Plans (March 2014)
Vacant Units
Green Lane district centre has 17 vacant units, a vacancy rate of 14%, which is
higher than the national average (12.1%). The main cluster is on both sides of
the road in the middle of the district centre between the junctions with Mayfield
Road and Dunkeld Road.
Other Non-Retail Uses
Green Lane has a limit range of non-retail uses. Facilities present include a
post office, dentist, Islamic Society hall, place of worship and a primary school.
Shopper Views
Respondents to the household survey were asked what, if anything would
make them shop more often in Green Lane district centre. In the study area as
a whole, 67.3% indicted nothing would make them shop more often in Green
Lane and 21% did not know, therefore 88% did not suggest any improvements.
A better choice of shops in general was mentioned by 4.7% of respondents,
followed by 4% indicating they would like to see more car parking. No other
answer achieved more than 2%.
Accessibility
Green Lane is less accessible by rail/underground than the other three main
centres, although Goodmayes and Chadwell Heath railway stations are within
walking distance. The centre is served by 4 bus routes. The centre has good
road connections to the A12 and M25.
Green Lane will be within walking distance of the Cross Rail route now under
construction, which will provide improved linkages to Central and West
London. Cross Rail will enhance the attraction of the Green Lane area as a

Barking & Dagenham : Economic Development Study
P64 6788302v3P64
place to live and commute, which in turn should have economic benefits for
Green Lane.
Less than 1% of household survey respondents indicated that better bus/ links
would make them shop more often in Green Lane. Only 4% of household
survey respondents said more car parking would make them shop more often
in the centre, and only 1% suggested free or cheaper car parking.
Environmental Quality
The buildings within the centre are mostly in a good and well maintained
condition. The buildings on either side of the road form a terrace of similar
design to most London High Streets. There are a few newer infill buildings,
scattered throughout. The most striking building on the street is the Church of
Pentecost-UK which is a completely different style to the rest of the buildings.
The centre is linear in nature, focused along the A1083. This means traffic
through the centre is moderate-heavy which can impede pedestrian
movements and reduces the overall attractiveness of the centre. However,
there are a number of pedestrian crossing which help to encourage
pedestrians to use both sides of the street.
The northern end of Goodmayes Park abuts the centre towards the western
end. This helps to improve the environment and reduce the congested feel of
the street.
Retail Warehouse and Leisure Parks
There are three retail warehouse parks and one leisure park within the
Borough. The role of these parks is set out below.
Abbey Retail Park
Abbey Retail Park is located on the edge of Barking town centre. It has
declined in recent years, due to company failures (e.g. Comet and MFI) and
the growth of retail warehouse operators at Beckton. Retail Parks at Beckton
Triangle, Galleons Reach, and Gateway Retail Parks in Newham have an
extensive provision of bulky goods retail warehouse operators, which serve the
Borough, particularly the south west and west of the Borough. Their
accessibility from Barking restricts retail warehouse operator demand for
premises in Barking.
The retail park is currently occupied by a large Dreams Clearance store and
Halfords. There are current proposals to redevelop the retail park to
accommodate a large Sainsbury’s food superstore.
Whalebone Lane Retail Park
This Retail Park is located in the north of the Borough to the east of Chadwell
Heath. It has also declined in recent years, due to company failures (e.g.

Barking & Dagenham : Economic Development Study
6788302v3 P65
Comet) and the closure of B&Q. A McDonald drive-thru remains on the site. An
Asda food superstore now has planning permission on the site.
Merrielands Crescent
Merrielands Crescent is located in the south the Borough on the A1306. This
park provides a good mix of bulky comparison goods retailing (totalling around
6,600 sq.m gross, including Homebase (DIY), Dreams (beds), Carpetright,
Topps Tiles and Halfords (motor accessories parts and cycles).
There are Asda and Aldi stores which attracts main and bulk food shopping
trips. The Dagenham Leisure Park is nearby, with leisure centre, bingo hall and
cinema. Together these uses provide a significant cluster of facilities that have
a wide draw. In addition to residents within the Borough, this location’s
excellent access via the A13 and A1306 enables these facilities to serve
residents within Tower Hamlets, Newham and Havering.
This retail park is relatively dated and there may be redevelopment potential in
the future to provide a higher quality shopping environment and more modern
accommodation for operators.
Dagenham Leisure Park
Dagenham Leisure is located in the south the Borough to the west of
Merrielands Crescent on the A13.The area provides a cluster of leisure and
entertainment uses anchored by a Vue multiplex cinema, Mecca bingo hall and
tenpin bowling (20 lanes) facility. These uses are supported by ancillary uses
including a drive thru McDonalds, two Class A3 uses and a nightclub. Sports
facilities are provided nearby at the Goresbrook Leisure Centre, sports pitches
and Goals football centre.
The leisure park is accessed via the A1306 but is poorly integrated with nearby
retail stores and public transport nodes in terms of pedestrian access. The
leisure park is predominantly a car borne destination.
Together these uses provide a significant cluster of facilities that have a wide
draw. In addition to residents within the Borough, this location’s excellent
access via the A13 and A1306 enables these facilities to serve residents within
Tower Hamlets, Newham and Havering.
Local Centres
The existing provision of local shopping centres within the Borough
(neighbourhood centres and parades) offers a balanced distribution of local
facilities serving local communities. These facilities complement the four main
centres and have an important role in serving the day-to-day needs in their
local areas.
In addition to the audit of the main centres in LBBD, we have undertaken a
local needs index of the neighbourhood centres and parades within the
Borough. Our analysis splits the centres into “large” (more than 45 commercial

Barking & Dagenham : Economic Development Study
P66 6788302v3P66
units), “medium” (between 16 and 44 commercial units) or “small” (15
commercial units or less).
The shopping centres, parades and clusters vary in size, from only four
commercial units (Movers Lane) to as large as 261 (Barking town centre). In
summary, LBBD contains:
• 14 centres classified as small;
• 16 centres classified as medium; and
• 6 centres classified as large.
The key focus in auditing local centres has been in assessing the “needs” of
local residents and to what extent each is meeting these “needs”. There is no
clear definition of need, but it is considered that residents could expect to find
some or all of the following shops, services and community uses within easy
walking distance of their home:
1 food or convenience store suitable for top-up shopping;
2 bank;
3 post office;
4 newsagent;
5 off licence;
6 chemist;
7 takeaway, café or restaurant;
8 public house;
9 bookmakers;
10 laundrette/dry cleaners;
11 hairdressers/beauty salon;
12 florist;
13 estate agents;
14 community hall;
15 doctor’s surgery; and
16 library.
Each local centre has been allocated a score out of 16, based on the number
of categories of shops and services listed above (one point per category
represented) that are available in the centre.
There is a wide range of scores across the centres. These scores are based
on the representation of key retail/service provision within the centre. The
larger town centres have the highest scores (10 or more on the local needs
index).
In addition to this it is important to consider the ability of these centres in
meeting top-up shopping needs. Therefore, the number of convenience stores

Barking & Dagenham : Economic Development Study
6788302v3 P67
with the ability to provide local top-up shopping (e.g. a grocers, local corner
shop or small supermarket) in the parade is also considered.
Barking town centre provides all of the identified categories of shops and
services, scoring 16 on the local needs index, which would suggest the local
residents of the this area are relatively well served by their local shopping
centre. By contrast, Winifred Parade, Reede Road, East Road, Althorne Way
and Movers Lane only attract a score of 3 or less on the local needs index,
which would suggest a very limited level of local needs being met.
Local Needs Index Summary
Centre Name Size of Centre
Total No. of units
Local Needs Index
No of conv. stores
No. of vacant units
Barking Large 261 16 15 27
Chadwell Heath Large 115 14 7 7
Green Lane Large 120 14 10 17
Dagenham Heathway Large 112 13 5 10
Owlow Road/Hunters Hall Medium 36 11 8 4
Faircross Parade Medium 35 11 10 2
Robin Hood NC Large 45 9 7 4
Martin’s Corner Medium 38 9 8 3
Five Elms Small 22 9 4 2
Whalebone Lane South Medium 36 8 3 4
Merry Fiddlers Medium 28 8 4 2
Broad Street Large 45 7 12 4
St. Andrews Corner Medium 30 7 7 2
Ripple Road Medium 27 7 4 3
Gale Street Medium 25 7 5 0
Lodge Avenue Medium 31 6 6 7
Dagenham East Medium 21 6 3 5
Rainham Road South Medium 18 6 3 5
Rose Lane Small 14 6 3 4
Goresbrook Road Medium 32 5 5 4
Fanshawe Avenue Medium 18 5 2 4
Farr Avenue Medium 17 5 5 7
Ripple Road Medium 16 5 4 1
Eastbrook NC Small 14 5 3 0
Upney Lane Small 10 5 2 1
Rush Green Small 7 5 1 0
Church Street Medium 25 4 3 8
Lodge Avenue Small 14 4 2 3
New Road Small 12 4 1 1
Stansgate Road Small 8 4 2 3
Gascoigne Road Small 8 4 2 4
Winifred Parade Small 12 3 2 2
Reede Road Small 11 3 2 3
East Road Small 7 3 1 3
Althorne Way Small 7 2 1 3
Movers Lane Small 4 1 1 2

Barking & Dagenham : Economic Development Study
P68 6788302v3P68
The local needs index is not a precise measure of whether a local shopping
centre is meeting the needs of local residents, as there are many other factors
to consider:
i the relative size a local parade will dictate the range of shops and
services each centre can offer;
ii the close proximity of other town centres, local centres and ‘stand alone’
shops means that local need may be met at an alternative location within
walking distance and local needs are therefore still being met;
iii the quality of the shopping centre or parade, in terms of its environment,
type and range of retailers will affect how it is perceived and used by
local residents; and
iv the relative accessibility of each centre will be an important factor in how
local people use the local shops and services. For example, a major
traffic route, which is difficult for pedestrians to cross, may influence
shopping patterns in the area.
It is considered that the local needs index provides a useful indicator of
whether a local centre or important local parade is meeting some or all the
needs of local residents.
The local centres and their respective scores are plotted on a plan overleaf. A
500 metres and 800 metres radius from each centre is also shown, which
represents what should be considered to be a reasonable and maximum
walking distance.

Barking & Dagenham : Economic Development Study
6788302v3 P69
Local Needs Index


Barking & Dagenham : Economic Development Study
6788302v3 P71
Appendix 11 Business Survey Results


Barking & Dagenham : Economic Development Study
6788302v3 P73
Business Occupier Perceptions
A survey of business occupiers was undertaken by NEMS in October 2013. In
total 152 businesses were interviewed in the London Borough of Barking and
Dagenham, and the number of interviews were broadly proportional to the size
of each centre. These were broken down as follows:
• Barking Town Centre 61 interviews;
• Chadwell Heath District Centre 31 interviews;
• Green Lane District Centre 30 interviews;
• Dagenham Heathway District Centre 30 interviews.
The occupiers were asked to give their views on a number of issues, including:
a Current and future trading performance;
b Future plans to improve or rationalise their premises;
c Which aspects of the town centre benefited businesses;
d What issues constrain the operation and performance of their business
and how these could be addressed;
e How important affordable rents and premises/business rates are to their
business;
f How the town centres were rated against a number of aspects, and;
g Opinions on town centre shopping and service mix.
Length of Trading in Current Location
Figure BS.1 shows the number of years businesses surveyed have been
trading in the borough. Just over half of businesses have been trading in
Barking and Dagenham for over ten years (51.4%), with the average length of
time 17 years, indicating that there are a substantial proportion of well
established businesses in the borough. This is typical of long established
shopping centres across the country.

Barking & Dagenham : Economic Development Study
P74 6788302v3P74
Figure BS.1: Length of Trading in Borough
Source: NEMS Barking Business Survey October 2013
Legal Status of Businesses
The legal status of the businesses surveyed is summarised in Figure BS.2.
The highest proportion of occupiers in LBBD were private limited companies
(49%). 27% of businesses are sole proprietorships and 16% are public limited
companies.
Figure BS.2: Legal Status of Businesses
Source: NEMS Barking Business Survey October 2013
Future Property Requirements
Businesses were asked what current plans, if any, they had to change their
business premises. The majority of occupiers in all the centres appeared to be
content with their existing premises, with an average of 80.9% having no plans
to change. A low number of businesses (4.6%) are intending to close or
7.2%
27.0%
13.2%
31.6%
14.5%
5.3%
1.3%
0%
5%
10%
15%
20%
25%
30%
35%
Less than
1 year
1 to 5
years
6 to 10
years
Over 10
years
Over 25
years
Over 50
years
Don’t
know
27%
4%
49%
16%
1%
3%
A sole Proprietorship
A Partnership
A private limited company
A public limited company
A co-operative/social
enterprise
Don’t know/no answer

Barking & Dagenham : Economic Development Study
6788302v3 P75
relocate to new premises outside the local area. There was a big variation
across the borough in the numbers of businesses looking to re-fit, extend or
improve their premises. 13.3% in Green Lane intend to improve premises,
whereas only 3.2 and 3.3% intend to do the same in Chadwell Heath and
Barking.
Trading Performance
Businesses were asked to describe their current trading performance and
performance over the last 12 months, as shown in Table BS.1. A scoring
system of 3 points for ‘good’ trading, 2 points for ‘stay the same’ and 1 point for
a ‘decline’ in trading is used to calculate an average.
Table BS.1: Last 12 Month Trading Period
Centre
Performance (% of respondents in each centre) Average
Score
(3 to 1) Good (3)
Stayed the
same (2) Declined (1)
Don’t know /
Refused
Barking 39.3 24.6 32.8 4.0 2.07
Chadwell
Heath 32.3 25.8 38.7 3.2 1.93
Green Lane 33.3 36.7 23.3 6.6 2.11
Dagenham
Heathway 23.3 30.0 43.3 3.3 1.79
Source: NEMS Barking Business Survey October 2013
(Average score based on 3 for good, 2 for stayed the same and 1 for declined)
The highest proportion of the occupiers in Chadwell Heath and Dagenham
Heathway felt that trading had declined over the last 12 months. In Green Lane
the highest proportion considered performance had stayed the same, while in
Barking almost 40% of businesses considered business had improved over the
12 month period to October 2013.
Opinions on expected future trading performance are summarised in Table
BS.2. The majority of businesses expected trading to improve over the next 12
months, and all centres received an average score above 2. 70% of
respondents in Barking expect trading to improve, and under 10% expect it to
decline. Very similar margins are recorded in Chadwell Heath and Green Lane.
Dagenham Heathway is the only centre where less than 50% of business
expected trading performance to improve.

Barking & Dagenham : Economic Development Study
P76 6788302v3P76
Table BS.2: Expected 12 Month Future Trading Period
Centre
Performance (% of respondents in each centre) Average
Score (3 to
1) Improve (3) Stay the
same (2) Decline (1)
Don’t know /
Refused
Barking 70.5 13.1 9.8 6.6 2.65
Chadwell
Heath 64.5 12.9 12.9 9.7 2.57
Green Lane 66.7 16.7 10 6.6 2.61
Dagenham
Heathway 46.7 20 26.7 6.6 2.21
Source: NEMS Barking Business Survey October 2013
(Average score based on 3 for good, 2 for stayed the same and 1 for declined)
Businesses were also asked whether in general, they considered over the last
year the centre had improved, stayed the same or declined. Barking had the
highest positive score, with almost 50% of respondents considering the centre
had improved, while Dagenham Heathway achieved the lowest overall score,
with almost 47% considering the centre had declined.
Table BS.3: Performance of Centres over the last 12 months
Centre
Performance (% of respondents in each centre) Average
Score (3 to
1) Improve (3) Stay the
same (2) Decline (1)
Don’t know /
Refused
Barking 49.2 27.9 19.7 3.3 2.31
Chadwell
Heath 25.8 32.3 29.0 12.9 1.96
Green Lane 26.7 33.3 26.7 13.3 2.00
Dagenham
Heathway 30.0 20.0 46.7 3.3 1.83
Source: NEMS Barking Business Survey October 2013
(Average score based on 3 for good, 2 for stayed the same and 1 for declined)
On balance, taking into account the above three questions, Barking and Green
Lane are the best performing centres, achieving ‘good’ average scores for all
categories.
Factors Constraining Businesses
Businesses were asked the most important issues believed to constrain their
operation and performance. In general the most popular responses were the
availability of business/customer car parking (20.4%) and the level of trade/lack
of visitors/customers (16.4%).

Barking & Dagenham : Economic Development Study
6788302v3 P77
Figure BS.3: Factors constraining business
Source: NEMS Barking Business Survey October 2013. (*Other includes: Problems associated with anti-social behaviour; staff recruitment/retention; Competition from other businesses in the shopping parade; Quality/size of premises; Rent/overheads; Security issues (Crime/vandalism); Relationship with local authority; Advice on how to improve the operation of the business; Attitude of local planning authority. These all received 0.7% each)
Figure BS.4: Means to address constraints on business
Source: NEMS Barking Business Survey October 2013
Businesses were asked how to most important constraining issues could be
addressed. The most popular response was more parking bays for customers
(13%), followed by a reduction or freeze in business rates (10.9%) and better
promotion of the area (9.8%).
39.5
6.3
1.3
1.3
2.0
2.0
2.6
3.3
5.3
16.4
20.4
0 5 10 15 20 25 30 35 40 45
Don’t know/nothing
Other*
Lack of time to develop the business
Too much cultural diversity
Poor location of premises
Lack of high street/quality retailers
Too many vacant units
Poor accessibility
Business rates
Level of trade/lack of visitors/customers
Availability of business/customer parking
% of respondents
10.9
19.8
4.3
4.3
4.3
5.4
5.4
5.4
6.5
9.8
10.9
13
0 5 10 15 20 25
Don't Know
Other
Introduce business permits for parking
Relax parking restrictions
Change the decision makers
Introduce better/larger retailers
Relocate within local area
More support from the council
Short-stay/free parking
Better promotion of the area
Reduce/freeze business rates
More Parking bays
% of Respondents

Barking & Dagenham : Economic Development Study
P78 6788302v3P78
Factors affecting choice of location
Businesses were asked to rank in terms of importance the factors that
contributed to the choice of location when the business started up. A scoring
system of 1 point for ‘main reason’, 0.5 points for ‘partly a reason’ and 0 points
for ‘not a reason’ is used to calculate an average.
Table BS.4: Factors contributing to choice of location
Factor
Performance (% of respondents overall) Average score
(0 to 1) Very Important (1) Partly a
reason (0.5)
Not a reason
(0)
Serves local market 23.7 37.5 38.8 0.42
Business already set
up when I took over 28.9 11.2 59.9 0.35
To be within the town
centre 18.4 28.3 53.3 0.33
Good accessibility 12.5 40.1 47.4 0.33
Source: NEMS Barking Business Survey October 2013
Overall, ‘serves local market’ was the most important factor contributing to the
choice of location. ‘Business already set up when I took over’ had the highest
number of ‘very important’ responses, but overall came in second due to the
higher number of people citing it as not being a reason.
Aspects of Centres Benefiting Businesses
Occupiers were asked if a number of aspects within the centres benefited their
business. Table 5 shows the percentage of responses that believe the aspect
did benefit their business.
In general, over 50% of businesses felt that the majority of the aspects listed
benefited their business. ‘Room to expand’ was the aspect considered to least
benefit businesses.
Over 90% of businesses in Barking and Green Lane felt that the ease at which
customers could get to the centre was a benefit for their business. A high
proportion of businesses in all centres felt that local demand for
products/services and good bus services were significant benefits.
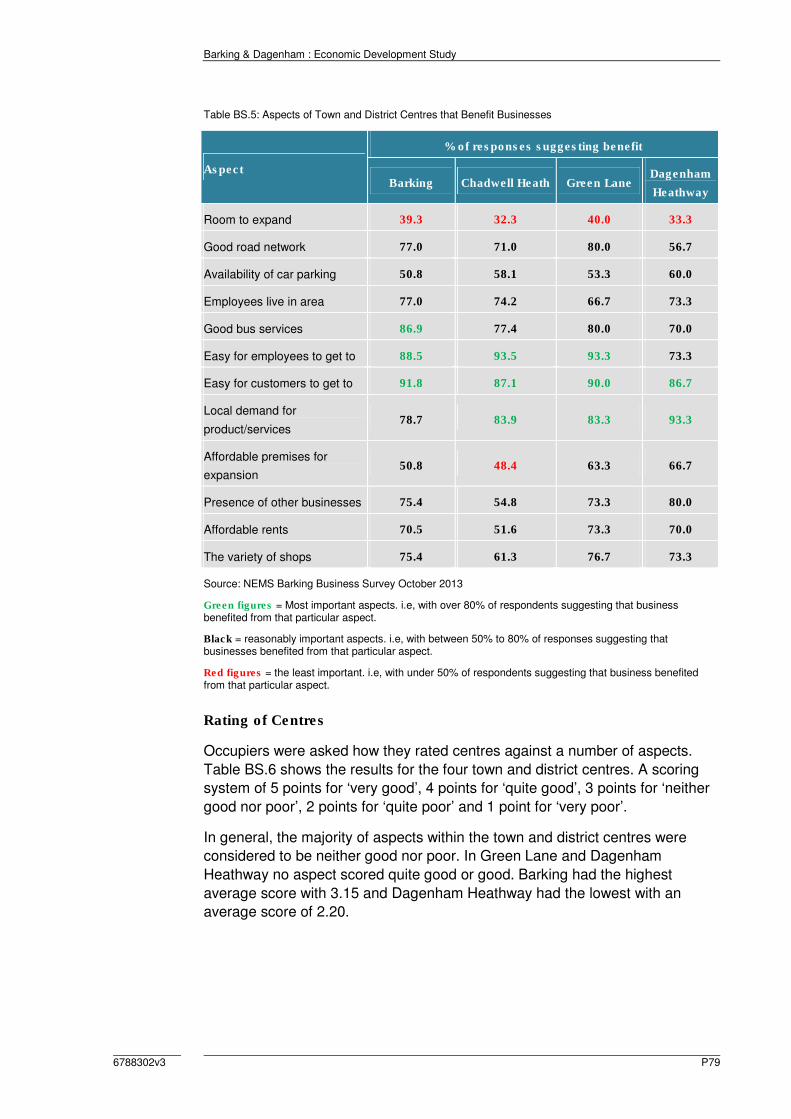
Barking & Dagenham : Economic Development Study
6788302v3 P79
Table BS.5: Aspects of Town and District Centres that Benefit Businesses
Aspect
% of responses suggesting benefit
Barking Chadwell Heath Green Lane Dagenham
Heathway
Room to expand 39.3 32.3 40.0 33.3
Good road network 77.0 71.0 80.0 56.7
Availability of car parking 50.8 58.1 53.3 60.0
Employees live in area 77.0 74.2 66.7 73.3
Good bus services 86.9 77.4 80.0 70.0
Easy for employees to get to 88.5 93.5 93.3 73.3
Easy for customers to get to 91.8 87.1 90.0 86.7
Local demand for
product/services 78.7 83.9 83.3 93.3
Affordable premises for
expansion 50.8 48.4 63.3 66.7
Presence of other businesses 75.4 54.8 73.3 80.0
Affordable rents 70.5 51.6 73.3 70.0
The variety of shops 75.4 61.3 76.7 73.3
Source: NEMS Barking Business Survey October 2013
Green figures = Most important aspects. i.e, with over 80% of respondents suggesting that business benefited from that particular aspect.
Black = reasonably important aspects. i.e, with between 50% to 80% of responses suggesting that businesses benefited from that particular aspect.
Red figures = the least important. i.e, with under 50% of respondents suggesting that business benefited from that particular aspect.
Rating of Centres
Occupiers were asked how they rated centres against a number of aspects.
Table BS.6 shows the results for the four town and district centres. A scoring
system of 5 points for ‘very good’, 4 points for ‘quite good’, 3 points for ‘neither
good nor poor’, 2 points for ‘quite poor’ and 1 point for ‘very poor’.
In general, the majority of aspects within the town and district centres were
considered to be neither good nor poor. In Green Lane and Dagenham
Heathway no aspect scored quite good or good. Barking had the highest
average score with 3.15 and Dagenham Heathway had the lowest with an
average score of 2.20.

Barking & Dagenham : Economic Development Study
P80 6788302v3P80
Table BS.6: Rating of Town and District Centres
Aspect
Score
Barking Chadwell
Heath
Green
Lane
Dagenham
Heathway
Rents 3.30 3.12 2.85 3.13
Business rates 2.90 2.41 2.48 2.24
Availability of business/customer parking 2.28 2.11 1.88 1.97
Traffic circulation 3.02 3.21 2.68 3.14
Safety during day 3.67 3.78 3.36 3.43
Safety during evening/nights 2.74 3.12 2.76 2.63
Crime and security 2.85 2.64 3.07 2.76
Range of shops & services available 3.17 2.63 2.97 2.76
Quality of shops & services available 3.02 2.74 3.03 2.57
Leisure & entertainment facilities 2.88 2.36 2.04 2.29
Street furniture & landscaping 3.35 2.85 2.41 2.93
Liveliness/street life/character 3.14 2.96 2.76 2.79
Level of street cleaning and litter 3.48 3.22 3.07 2.87
Town centre management & maintenance 3.66 3.17 2.50 2.93
Condition/appearance of older buildings 3.27 3.22 2.82 2.77
General shopping environment 3.25 3.15 2.86 2.68
Interest shown by the Council/local
authorities 3.23 2.48 2.79 2.64
Marketing/promotion 3.12 2.12 2.48 2.18
Interest shown by land owners 2.87 2.63 2.67 2.05
The way businesses work together 3.25 2.90 2.58 2.61
The quality of parks & open space 3.47 3.43 2.93 3.29
Town centre events 3.15 2.62 2.58 2.20
Total Average 3.14 2.86 2.71 2.68
Source: NEMS Barking Business Survey October 2013
Green figures = Quite good to very good (3.5 – 5.0); Black = neutral (2.5 – 3.5); Red figures = Quite poor to very poor (2.5 – 1).

Barking & Dagenham : Economic Development Study
6788302v3 P81
Measures to Help Businesses
Occupiers were asked to rate a set of measures in terms of how they would be
perceived to help their businesses (Table BS.7). A scoring system of 5 points
for ‘a lot’ of help to 1 point for ‘a little’ is used to calculate an average.
Table BS.7: Measures to Help Businesses – Town and District Centres
Measure
Score
Barking Chadwell
Heath
Green
Lane
Dagenham
Heathway
Streetscape improvements 2.98 3.52 3.16 2.59
Street cleaning & environmental services 3.58 4.04 3.46 3.41
Shop front improvements 3.45 3.42 3.92 3.24
Security measures such as CCTV and
policing 3.83 3.92 3.85 3.80
Pedestrianisation 3.32 3.36 3.26 3.20
Better arrangements for receiving deliveries 3.66 3.54 3.69 3.20
Improved customer parking 4.13 4.07 4.26 4.03
Events and special promotions 3.59 4.18 3.67 3.40
Better marketing & promotion of the centre in
general 3.81 3.65 4.33 3.67
An effective town centre forum where
businesses can be heard 3.78 4.28 4.13 3.63
Business support/advice 3.40 3.72 3.70 3.27
Assistance in the recruitment & retention of
staff 2.61 3.70 3.04 2.73
Improved staff / employee parking 3.86 3.85 4.11 3.60
Total 3.54 3.79 3.74 3.37
Source: NEMS Barking Business Survey October 2013
Green figures = quite a lot of help (above 4); Black = neutral (3 - 4); Red figures = a little help (below 3).
The measure rated most likely to help businesses was ‘improved customer car
parking’. This measure received a score above 4 in all centres. The measure
least likely to help businesses was assistance in the recruitment and retention
of staff (average score across all centres of 3.02).
In Chadwell Heath and Green Lane, four of the 13 measures were rated above
4 and none were rated below 3. All centres apart from Barking rated
‘streetscape improvements’ the least likely to help business.
After improved customer parking, measures that were believed to be of most
help to businesses were: street cleaning and environmental services; events

Barking & Dagenham : Economic Development Study
P82 6788302v3P82
BarkingChadwell
HeathGreen Lane
Dagenham
Heathway
Too up market 2% 3% 0% 0%
Fine as it is 39% 32% 30% 27%
Too down market 56% 58% 57% 67%
Don’t Know 3% 7% 13% 7%
0%
10%
20%
30%
40%
50%
60%
70%
80%
% o
f re
spo
nd
en
ts
and special promotions; better marketing and promotion of the centre in
general; an effective town centre forum where businesses can be heard; and
improved staff/employee parking.
Opinions of the Centres
Figure BS.5 summarises occupier’s opinions on the town and district centres in
shopping terms. Over 50% of respondents in all centres considered the centres
were ‘too down market’. This was highest in Dagenham Heathway with 67%
agreeing it was too down market, and 27% saying it is ‘fine as it is’.
Figure BS.5: Opinions on Centres in Shopping Terms
Source: NEMS Barking Business Survey October 2013
Occupiers’ opinions on the town centres shopping and service mix can be seen
in Figure BS.6. Respondents in Barking Town Centre and Dagenham
Heathway District Centre overwhelmingly considered the centres to have too
few large chain stores (66% and 63% respectively).
Chadwell Heath had the highest number of respondents saying that there was
‘about the right mix between small and large shops’ (39%), however, it also
had the highest number of respondents suggesting there is ‘not enough small
independent shops’ (23%).

Barking & Dagenham : Economic Development Study
6788302v3 P83
BarkingChadwell
Heath
Green
Lane
Dagenham
Heathway
Not enough large chain
stores66% 26% 30% 63%
About the right mix
between small & large
shops
23% 39% 23% 13%
Not enough small
independent shops7% 23% 17% 13%
Don’t Know 5% 13% 30% 10%
0%
10%
20%
30%
40%
50%
60%
70%
% o
f re
spo
nd
en
ts
Figure BS.6: Opinions on Current Shopping and Service Mix
Source: NEMS Barking Business Survey October 2013


Barking & Dagenham : Economic Development Study
6788302v3 P85
Appendix 12 Business Survey Quotes


Barking & Dagenham : Economic Development Study
6788302v3 P87
Business Survey Quotes
An online business survey was undertaken as part of the study with a sample
of 67 businesses across a range of sectors and locations within Barking &
Dagenham. A selection of quotes is presented below by theme.
Current Business Premises
“I’m satisfied with my current premise as I have loved to have a business site in
a strategic location.”
“We have owned the site and occupied it since 1947. Ideally as a textile
manufacturer we should be in Yorkshire or Lancashire, nearer to our suppliers
and markets, but we have a pool of skilled labour that we would lose by
moving.”
“Our business relies on HGV’s being able to access our site… we are close to
the A13 and M25 so our customers do not have to re-route drastically to get to
us.”
“Our premises are ideal; it’s the dirty environment around the premises that is
the problem.”
“Ideally we require a proper yard so that we can manage and recycle larger
amounts of waste. Our current office space and sorting room is very small.”
Difficulties in Finding Suitable Premises
“Finding a suitable premise is difficult as there is a very small pool of properties
available, and rents and conditions of these properties are very poor.”
“There is pretty well nothing that is suitable for my business. I only need about
500 to 1,000 sq ft, but even if there was something of that size, I very much
doubt I could manage the overhead.”
“We would prefer to move to a slightly better location but are unable to afford
the rents and hence are in a secondary location.”
“I believe the current rental/freehold/leasehold rates do not accommodate start-
up businesses like ours.”
“Nearly all available sites in Creekmouth are owned by home builders, and
they won’t sell. Looks like domestic use is the agenda for our historic
commercial area!”
Supply of Business Premises in Barking & Dagenham
“Barking is woefully short of quality office accommodation, and as a result it
does not attract businesses (or employees) that will bring spending power to
the town.”

Barking & Dagenham : Economic Development Study
P88 P88 6788302v3P88
“If the availability of new and well maintained medium-sized premises (2,000 to
3,000 sq ft) does not improve over the next five years, then we will have to look
elsewhere.”
“There is a lack of modern, clean premises. Dagenham hasn’t invested in new
small premises (1,500 to 2,000 sq ft) for many years so we were faced with
moving out of the Borough. Luckily, Dagenham Business Centre was finally
built… and we are now ideally located to grow our business within the
Borough.”
“More small footprint combined warehouse and office units must be built to
ensure that new start-up businesses are accommodated in the Borough,
otherwise they will look elsewhere and B2B possibilities will be lost.”
“At present there are a lot of vacant premises, however most of them are old
and run down.”
“There is an abundance of empty office space in Barking, but most of it is of
very poor quality.”
“Large spaces could be reduced to accommodate two or more small
businesses that only require small spaces to operate.”
“Barking must do more to promote itself as a prime office location… we have
just recently decided to let out the ground floor of our building and before the
flyers were even printed, we had two offers from blue chip companies wishing
to find good office space in this general area.”
“Barking & Dagenham is a very large area with a variety of spots to meet
everyone’s needs.”
Barking & Dagenham as a Business Location
“No investment in either roads or general décor has been made in the last few
years, and it shows.”
“The lack of street care and maintenance, policing in the Creekmouth area,
and overall under investment in local infrastructure for the A13 area… has
resulted in a loss of earnings.”
“The surrounding environment is not ideal for office workers given the limited
choice and quality of restaurants and coffee shops in the town centre.”
“We might need to relocate to another Borough because many of our clients
visit us after normal office hours… and clients prefer to go to other service
providers in different Boroughs where parking is free after 5:30 or 6:00 pm.”
“Barking & Dagenham is undergoing regeneration, so this is improving the
quality of the environment.”

Barking & Dagenham : Economic Development Study
6788302v3 P89
Appendix 13 Employment Site Plans

FreshwaterRoad - Site 2
FreshwaterRoad - Site 5
FreshwaterRoad - Site 4
FreshwaterRoad - Site 3
FreshwaterRoad
- Site 6
FreshwaterRoad
- Site 7
1
2
Key
Employment Sites
Barking &Dagenham
Local AuthorityContext
Wharves Sites
GIS Reference: S:\CL13613 - Barking & Dagenham\CL13613-02 - Barking& Dagenham - Economic Development Study - Sites (01) - 25.11.2013.mxd
Barking & Dagenham EconomicDevelopment Study
Employment Sites
London Borough of Barking & Dagenham
25.11.2013-MARGIS13613/02-01
NorthgateIndustrial
Park
1.
2.