barnes, matthew gavin (2008) development of a single … · cane and juice losses during: ......
TRANSCRIPT

This file is part of the following reference:
Barnes, Matthew Gavin (2008) Development of a single drum chopper concept for a sugarcane harvester.
Masters (Research) thesis, James Cook University.
Access to this file is available from:
http://eprints.jcu.edu.au/17529

INTRODUCTION
Abstract: This chapter presents the background and 7notivation for this study. The potential
significance ofthis research is discussed along with the aiJns and objectives ofthe study.

2
1.1 Background and Dlotivation
Australia is currently one of the world's largest exporters of raw sugar and a nUl11ber of rural
areas in North Queensland and NOlthern NSW are dependent on the industry for survival.
Presently, the sugarcane crop is harvested by lnechanicallneans, after which, it is processed
in lnilling facilities for the production of raw sugar. However, a global push towards
renewable energy has seen increased interest in the use of the sugarcane crop for energy
production. This process, terlned cogeneration, requires a higher proportion of the total
bioluass to be sent to the IniU in order for it to be econolnically viable. The adverse affect of
this is a significant reduction in bulk density of the harvested Inaterial, and therefore
transport costs to harvester owners and Inillers significantly increase due to the volunle
dependent transpoltation Inethods. The bulk density of the harvested lnaterial is strongly
affected by the lnanner in which it is billeted in the harvester chopper systeln. Current
chopper systelTIS are linlited in their capability to vary billet lengths and therefore bulk
density. Hence, if cogeneration is going to be successful in the sugar industry, there is a
strong need to develop a chopper systelu which is capable of Inaintaining material bulk
density as the propoltion of retained biolTIass is increased.
Despite the perceived benefits, relatively little- research has been devoted to designing new,
luore effective chopper systellls. Most changes to the systelTI have involved slllall
lTIodifications to existing systelus, ultiJnately only providing a 'quick fix' to the problelTI. As
luore lTIodifications are lnade to the existing system, there is a belief within the industly that
chopper efficiencies are decreasing, resulting in luore losses in the harvesting process.
Losses in the chopping process are a well knowl} side-effect of billeting cane during
harvesting, yet current systenls far fron1 lninilnise the losses associated with this process.
Billet quality and losses during billeting are issues fundalnental to the lnaxiluisation of sugar
quality and sugar recovely. Cane and juice losses during: billeting in current harvesters have
been estilnated to be costing the Australian industry over $35 lnillion a year. Hence, there is
a strong case for developlnent of a lnore efficient chopper systeln.
The inability of current chopper systen1s to produce l1igh quality billets of desired length at
increased pour rates has provided inspiration for the research and developluent of alternative
chopper systelns.

3
1.2 Research context
Mechanical harvesters have been universally adopted in the Australian sugarcane industry
since the 1960s. Over this tilne, a nUlllber of different chopper systetns have been developed
and trialled. The fundatTIental problem relnains that past and present systeills l1ave struggled
to keep pace with requiretnents of a changing and expanding industry. The stalting point for
the developlnent of a new chopper systeln Blust therefore begin with a review of existing
designs and design theories. This research is not litnited to the sugar industry, as there are
benefits to be gained frotn in an investigation into chopper concepts utilised in similar
agricultural industries.
In light of this, the current study focuses on developing a new chopper systeln for a
sugarcane harvester. The performance of the cOllcept will be initially analysed ustng
laboratoty experitnents and nutllerical nlethods. Positive results frOtll this patt of the study
will give confidence for the construction of a prototype for experilnental testing. The
prototype will be tested under 'real harvesting' conditions, ultitTIately providing insight into
the expected perfortTIance of the concept. The prototype will be assessed on its ability to
handle full scale feed rates, it's ability to provide COl1sistent preset billet lengths and also on
it's billet quality and cane and juice losses. At the end of this study, a new chopper concept
for a sugarcane harvester will have been developed and thorough]y tested.
1.3 Aim
The aitTI of this thesis is to develop and exatnine a new chopper concept for a sugarcane
harvester. A review of existing research on. chopper systetTIs in the sugarcane and sitnilar
industries will provide the basis for the concept developnlent. The perfot1TIance criteria for
the developed systetll will be based on the current and predicted future industty requirelnents
including variable billet length and systetll efficiencies. The concept will be evaluated using
experitnental and conlputational tnethods. The project also aims to construct and
experinlentally test a prototype of the developed ,cbncept. Finally, the project ailTIS to
provide an understanding into the defortTIation behaviour and resulting stalk danlage present
during the billeting of sugarcane.
1.4 Scope
The scope of this study includes:
a) Conducting a review of literature on billeting system designs and sugarcane stalk
tnaterial propetties and behaviour when cut.

4
b) Perforlning a set of laboratory experitnents to gain an understanding into the stalk
defornlation behaviour when cut in by a single knife against a stationary anvil.
c) An investigation into a new chopper systenl for a sugarcane harvester.
d) The creation and application of a dynatnic finite elelnent lnodel of billet trajectoty
through the proposed chopper systeln.
e) The developInent and construction of a prototype of the proposed chopper concept.
t) A set of experitnental tests evaluating the perfot1nance of the prototype chopper
systeln.
1.5 Thesis outline
Chapter T\vo is a literature review of published works relevant to the developlnent of a
novel chopper concept. The pettinent literature on past and present sugarcane harvester
chopper concepts, including published works on chopping systelns in similar industries is
reviewed. All relevant infornlation affecting the chopping process including the physiology
and tnechanical properties of cane is presented.
Chapter Three describes a set of laboratory experinlents on the single knife slicing of
sugarcane against a stationaty anvil. The affect of a nUlnber of paranleters on the quality of
the cut and the behaviour of the stalk are tested. The deforlnation behaviour and resulting
stalk end dalnage is discussed, ulthnately giving insight into the cutting process which Inay
be expected froln a single drunl chopper systetTI.
Chapter Four details the process undergone in the developlnent of the single druln chopper
concept. The conceptual design of each conlponent and the theoly followed is detailed
throughout this chapter.
Chapter Five describes the developlnent and testing of a dynalnic Inodel of the proposed
chopper systetll. The affect of a nUlnber of design and operating paranleters on the billet
trajectory is discussed, and based on these results COl1clusions are lnade as to the suitability
of the concept for use in a harvester.
Chapter Six describes the developlnent and experitnentaI testing of a prototype of the
proposed chopper systetn. The affect of a nutnber of operational and design paratTIeters on
the efficiency and quality of the cut is assessed under full capacity conditions. A clear
-explanation of the causes of billet dalnage during the single drum chopping process is

5
presented and conclusions on the effectiveness of the proposed single drum chopper systetn
for use in a sugarcane harvester are tnade.
Chapter Seven gives conclusions drawn froln the study. ReC0111Inendations for the fluther
developlnel1t of the concept are also detailed.

6
LITERATURE REVIEW
Abstract: This chapter reViel1JS pel~tinej1t literature on past andpresent sugarcane harvester
chopper concepts, including published works on chopping syste111S in siJnilar industries. All
relevant infornlation affecting the chopping process including the physiology and
111echanical properties ofcane is presented.

7
2.1 The mechanic:al sugarcane harvesterhe first conln1erc 0 aI luechanical sugarcane harvesters were inv nted and trialled in the early
1940- s after th ind lstrywa struggling to expand due to the labour lutel sive process 0
111anu.ally cutting tll \;rup t=v~r y~ar. With l-l~ pot udal to deliver a mu h higher output
with he us ofnl°ninlal wages he mechanical harvester as quick] adoped hr ughout the
Allstraran sugar indu try. Tl ere ar no appro~7inlately 1200 lechal leal harvesters in use
arolllld Australia. John Deere and Case IH are th two COJllpanies which constr ct 1 odern
ugarcane harvesters and both macJline operate o.n the same basic principles.
Figure J Most recent 1110del John Deere track dri en sugarcane choP1Jei' harvester
The prirnar function of the sugarcane harvesteri~ to r 1110V th. cftne sf::. lks fronl the field
and d Ii er hel to tl e haul-out bin. This i done by removing the leafy top of the pla.n and
cutting the stalk i-to Hlanag abl lengths ca. led b·))etso 'The 111achine 1 ust also cu the crop
wit, Olut causing significant danlage to the stalk during 'he proce
T lC Il-:Lcchanical sugarcane lJarveslc;r j . a UlltJ-pa:s~ lnalihint: aud as il ravt:.ls down ~ach -ow
the cane is fed into he front mach One- is processed and e rits through the "ear. The
fnn(l::ll ent~l con pOllents of a 11lechal1ical har- ester are S110 n in Figure 2.

8
Secondary Extractor
Primary Extroclor
\
Base Cutters
Figure 2 - Fundalnental C07J1pOnents ofa 7nodern 7nechanical sugarcane harvester (BSES,
2002)
The Topper is the first part of the ll1achine to CaIne into contact with the cane and it has the
purpose of cutting off the leafy top of the cane. TIle height of the toppers can be adjusted by
the operator when cutting cane of variable height. An effol1 lnnst be lnade to relnove as
lnnch of the leafy top as possible as this reduces the cleaning load on systelns fUl1her on in
the process.
The Crop Dividers (Spirals) direct the cane stalks illto the Inouth.ofthe harvester. These are
pal1icularly useful in lodged cane, where the stalks have collapsed into neighbouring rows.
Once the leafless stalks have been knocked down by the Knockdown Roller and Finned
Roller, they are severed off at ground level by the Basecutters. The basecutters are two
discs with replaceable blades that rotate parallel to the,..ground. The secondary objective of
the basecutters is to feed the cane butt first into the roller train.
The Feed Rollers (or Roller Train) pick the cane up from the basecutters and feed it
longitudinally into the choppers. The top roller of each pair is lnounted on a pivot and can
travel up and down to account for surges in the feed. Each roller has uniquely shaped fins
which playa vital role in straightening the stalks before they are fed into the choppers.
The Chopper System accepts the straightened mat of stalks and trashfroln the feed rollers
and cuts it into billets of unifornl length. The choppers also propel the chopped cane/trash
into the extraction chalnber.

9
The Primary and Secondary Extractor fans create a strong upward air strean1 which
separates the lighter trash fron1 the cane billets. These systems have proven to be
responsible for the lnajority of the cane loss in a ll1echallical harvester.
The Elevator cOllveys the cane and ren1aining trasIl froln the chopper box into the haul-out
using a fljght systeln.
All of the components on a sugarcane harvester are hydraulically driven by a l1lunber of
pumps connected to the 300 to 350 horsepower diesel engine. Note lnust be taken that the
choppers are driven by their own hydraulic pUlnp due to their high power usage.
2.1.1. The history of chopper systems in sugarcane harvesters
The following background all the developlnent of the chopper systen1 in cane harvesters is as
described by Hockings and Davis (1999).
The concept of billeting cane and il1corporating cutting and loading into one operation was
developed as early as the Faulkiner harvester in the 1920s. It was not until Massey Ferguson
developed the low cost 515 chopper harvester in the 1950s that the adv~ntages of this
harvesting systelll were sufficiently< tangible to be accepted by the industry in the 1960s.
To billet the cane, the 515 chopper harvester incorporated a systeln known as the rotary
pinch chop. The systelTI was conceptualised, desiglled and developed by engineering staff at
Massey Ferguson, and appropriate patents protected the design. The success of the chopper
harvester concept spawned the developIllent of alteIl1ative concepts for billeting cane such as
the 'swing-knife', 'chop-throw' and alternative di~um designs. Since the expiry of the patents
on the rotary pillCh chop in the early 1980's, it has been the preferred systeITI throughout the
world.
There has, however, been considerable evolution and developIllent in the concept, which i~
delnonstrated by the cllange froln the original two knife c·hopper druITIs to the lTIOSt recent six
knife drUITIs. The original rotary chop was developed as an over centre chop concept where
the interacting blades cOlnpleted their engagenlent as they aligned between the centreline of
the choppers. An alternative approach was the hoe chop where the chopper blades cOlnplete
the cut well before they align between the centreline of the choppers. This design essentially
superseded the over centre chop as it offered lower power consulnption, lower cut losses,
lower juice losses and lower billet dalTIage.
With the exhaustion of Massey Ferguson patents on the pinch chop concept, Versatile-Toft
adopted this systeln in their 7000/7700 series harvesters. This systeln was based on designs

10
developed by Massey Ferguson during the evolution froln the original 515 to the 305
harvester, and was silnilar to tlleir hoe chop design. This relnained the 'industry standard
design', over the following 15 years, and was installed in both Austoft and Calneco
Inachines.
Perceived problelns with this design led to the developlnent of alternative designs by third
party harvester cOlnponent suppliers such as 'Grieves Enterprises', 'WesthillEngineering'
and 'Trail Brothers', with a range of other alternative designs being developed by innovative
farlners. Although many of these design's 're-invented the wheel', the level of activity
indicated a high level of dissatisfaction with the standard design. One after Inarket
conversion introduced by a third party supplier in 1995 included a redesign of tIle knife
clanlps and the fitting of rubber rather than steel thrower bars. This Ineant the systeln
offered a dralnatic reduction in chopper operating pressure and reduced susceptibility to
overload, effectively giving a significant increase in lnachine capacity over the stalldard
choppers.
After liJnited field trials in 1995, both harvester Inanufacturers (Austoft and Calneco)
introduced choppers of new design and of larger diameter into their Inachines in 1996.
Whilst both designs appeared to reduce power consumption at high pour rates, effectively
increasing ll1achine capacity, both Inanufacturers encountered billet quality as a major
problem with their 1996 lTIodellnachines. Data froln Inillers and various BSES asseSSlnents
repol1ed very high levels of damaged and nlutilated billets being produced by the 1996
lnachines. This continued to drive a frenzy of fUlther developlnent and a heightened
awareness of other factors impacting on the probleln. An additional entl")' to the Inarket
lnade available during 1996 was a chopper utilising unequal drunl dialneters. This gave a
blade entI")' configuration initially approxiJnating a blade/anvil configuration. As the cutting
cycle progressed, the blade configuration took on an action similar to that of the how chop
systenl. This concept, tenned the differential chop, has beCOlne the 'industl")' standard'
design 011 the basis of field observations which have indicated reduced billet dalnage and
extended tilne between knife changes. The differential chop systeIll is the current systeln
installed in both the CASE IH (forIllerly Austoft) and the John Deere (fornlerly Calneco)
harvesters. The Inost recent changes in chopper systelns have been driven by the desire to
cut shorter billets (to increase bin weights). This has seen the increase in the nUlnber of
knives on the chopper drullls, where up to six knives per drunl are available in SaIne current
systeITIs. The three rotal")' pinch chop systelTIS described above are illustrated in Figure 3 and
a photograph of a 1998 Calneco cllopper systeITI is shown in Figure 4.

1 I
0"'.- e· _entre ~op Hoe cll
FigUJ e 3 - ROlar pinch chop s steIn configuration~ (Hockin sand Dm i 1999)
Figure 4 ChoP1Jer s ste111 in a 1998 nlodel anleco hal ester
2. __ ,Z. Chopper losses
Bille uahty and losses during billeting are i sues fundanlental to the lnaximisatioll of sugar
quality and su a1' recovelY. The move froIn, holestalk to billeted cane had not beell without
problel11s,. Dete' ioration of th cane because of the nunlber of cut urfaces was exacerbat d
by daI ag to the bill ts.
With ery little consIstent accu ~ate data publis ed on tlloder cJl0pper systenl losses and
effici ] e , BSES undertook a 11lajor project in 1998 to JlleaS ire chopper loss sand

12
dete11nin,e the optil rlUll1 chopper setup and operating conditions. The results weI' publi, h d
b Hockings and Davis (1999). The specIfic objectives of the study Included:
1) QuantifyiIIg the relation hips betw en the cane feed train n01111nal velocity chappel
perIpheral elocity billet lengh bille le 19th distr"bution and billet quality of
ni fferent choppel~ sy teoll1S at differel1t pour rates. Povver conSlunpt'on and
instantaneous torque loadings ere also asse sed.
2) Quantifying the inhe ~en juice and fibre losses and bille daluage in the cutting
process \vi h h different d,es· gns and under clIff; rent harvesting conditions (po r
·ate feed train speed and cane type).
l~he test rig used for he r search was a sta ionary rep icate of a sta ldard 1998 ITIodeI CASE
IH" Austoft 7000 can· harvester feed train and chopper systen1_ The cho.pper Jnodule on th.e
rig was inerchangeabl 0 a different chopper systen s co lld be t sted TI e fi e chopper
systenlS tes ed were" a 121nch Austoft systeln (standard UlltiI 1995) a current 1998)Ausoft
15 inch system a custom 12 inch Aus oft syS" eIll, a W,esthillngineering 15 inch syst III
and a Massey Ferguson 12 'inch systenl. Cane stalks and tTash were fed into the rig via a
COil eyor. The rig used 11} this tud is s lown i,n Figure 5.
Figure 5 - Chopper test rig used in the B E) trials (Hocking' and Davis 1999)

13
The results found [r01TI the trials include:
1) The Austoft 15 inch differential chopper systelll provided the lowest losses (in the
range of 1.9 to 3.1 percent).
2) Losses were increased in brittle varieties.
3) A roller peripheral speed of 60 to 700/0 of the chopper peripheral speed resulted in
the lowest losses.
4) All chopper systelTIS showed a lower degree of loss for a pour rate of 120 tlhr (2.8-
3.3 percent) than at 240 tlhr (4-5.9 percent).
5) Three tilnes lTIOre losses were found when blunt knives were used cOITIpared to new
knives.
6) Mean billet length is independent of pour rate and variety and dependent on feed
train roller speed.
7) A lnaxitnum cutting force of 14 kN applied to the cane bundle was recorded for the
15 inch Austoft differential chopper cutting at a pour rate of 240 t/hr.
8) A InaxilTIUlTI chopper power of 13.4 kW was recorded for the 15 inch Austoft
differential chopper cutting at a pour rate of 240 t/hr.
9) Cutting forces and chopper power increased with pour rate, toughness of variety and
lTIis111atcil of peripheral speed between cl).opper and feed train rollers.
2.2 Chopper systems used in siInilar industries
There are a nunlber of other agricultural crops which are harvested in a situilar 'chopping'
process. The widest spread of these being the crops in the forage industry. Across the world
forage plants are grown for silage which is fern1el!ted to provide feed for livestock.
C0l11lTIOn plants used for silage include grass crops such as lnaize and,_ sorghun1. In order for
the lnaterial to ferlTIent and dry, the crop is chopped into lengths of between 2 and 50
lnillilnetres during the harvesting process. The following section describes a current chopper
systelTI used in-a forage harvester.
2.2.1. The forage harvester chopper system
The forage harvester inspected was a 2002 lllodel Claas Jaguar 830. The choppers in this
harvester are used to cut forage Inaterial into lengths of between 4 and 19 lUln. Each
cOlnponent of the chopper systeln is described in this section.
Chopper Drum
The chopper druln has a 700 n1ln dialneter Ineasured fro.lTI knife tip to tip. There are 24
knives on the drUlTI, yet a systeln with 20 blades can be installed if longer pieces of lTIaterial

14
are desired. The speed of the druIll is constant at 1200rpIll and is driven lllechanically froln
the engine. A schelnatic of the druln is shown in Figure 6.
Shear Bar / Anvil
The shear bar in the systeln is lnade out of heat treated tungsten carbide and is reversible and
replaceable. It is l1lounted all a Inovable pivot, which is adjusted to lnove relative to the
drUIn so as the distance between itself and the knives is kept at a mininlum for the life of the
knives. Contact sensors control the adjusttnent, whereby the shear bar is moved in until the
sensors detect contact, upon which time the shear bar is nloved back out a fraction and set at
that position. The adjustInent process is initiated by an operator in the cab, after which a
cOlnputer controls an electric IllataI' which Inoves the pivot on either end of the shear bar
pivot asselnbly. A schenlatic of the shear bar and pivot assembly is shown in Figure 7.
Sharpening System
The knives on the chopper druln require sharpening to both retain the sharp edge on the
knives as well as ensure even wear of the knives. During sharpening, a sharpening stone
passes across the outer face of the knives. The drum continues to spin forwards at the saIne
speed as operation. The sharpening stone is gradually lowered with every pass to acCOUt1t
for wear in both the blades and the stone. The Claas Jaguar 830 has a lowering systelTI
which utilises a ratchet InechaniSlTI, whereby the' stone is fitted to a thread and when the
stone gets to one end, the ratchet turns the thread, in turn slightly lowering the stone. The
stone is passed along the length of the drUITI using a hydraulic ram that is connected to a 2: 1
chain systeln. This ratio forined by the chain and pulleys allows the stone to travel the entire
length of the drum whilst the ranl only travels half. A schelnatic of the stone holder
asselllbly including the thread and ratchet is shown in Figure 8.
Knives
The knives used in the Claas Jaguar 830 forage harve-ster chopper systeln are lnade out of
heat treated tungsten carbide. The cutting edge of the knives has a slight helical shape,
which results in one side of the edge passing the anvil slightly earlier or later tllan the other,
depending which side it is. This results in a slight shearing effect, silnilar to the cutting
tnechanisnl of a pair of scissors.
The inside face of the outer portion of the knife is coated with a spray 011 hardening Inaterial
to prevent wear and help retain a sharp edge on the knife as it \vears. The geoll1etry of the
knife is shown in Figure 9.

15
Figure 6 - ScheJnatic ofa Claas Jaguar 830 forage harvester chopper drUlJl (Claas, 2002)
£1.11115 74
o5092t03JAGUAR 900-830
Figure 7- SCheJl1atic ofa Claas Jaguar 830 forage harvester shear bar andpivot asseJnbly
(Claas, 2002)

16
00094z00JAGU 900~O
Figur? 8 - Shen1atic ofa Claas Jaguar 830forage harvester shalpening stone and holder
ass f?111bI (Claa.~ . .002
(a.) Top Vie\\l
(c) En.d View
(b) Unders"de V"ew
d) Angled View·
Figure 9 - laas tJaguar 830 forage harl estel chopper knife

17
2.2.2. The use of forage harvesters for cutting sugarcane
Recent interest in co-generation at the Inills has seen slnall scale adoption of wilole-crop
harvesting, where the total biolnass product is recovered during harvesting. As the current
chopper harvester is designed to provide a high quality cleaned product for sugar production,
there are unnecessary costs and inefficiencies when using it for harvesting a crop for biolnass
fuel recovely. In an attelTIpt to find a faster, lTIOre econolnical way to harvest the whole crop
for fuel production, forage harvesting equiplnent has been trialled.
Jakeway (2003) conducted trials cOlnparing the efficiencies of a standard chopper harvester
against a forage harvester for whole-crop harvesting and data was collected on equiplTIent
productivity, paliicle size, Inaterial bulk density, and actual biolnass recovery. The
sugarcane harvester used in the trials was a CLAAS 2000. Although this is slightly different
froln the Austoft and John Deere harvesters seen in Australia, it relies on the saIne principals
to harvest the cane. The forage harvester tested by Jakeway (2003) was a CLAAS Jaguar
880 (sinlilar to the 830 lTIodel described in section 2.2.1). Key production data found froln
the trials is shown in Table 1.
Table 1 - Harvester production data (Jakeway, 2003)
Parameter ,/ ", 'Carie HarVester Forage Harvester..",
Avg. effective productivity (t/hr)
Avg. harvested lnaterial particle size (InlTI)
Transpo11 bulk density (kghn3)
RecovelY yield, t/ha
Avg. residue left after harvest (t/ha)
9.1
355.6
132.9
93.7
18.2
11.6
15.2
219.4
67.0
62.6
The effective productivity was defined as the cane harvested during actual working hours. It
is repo11ed that the conventional cane harvester perforIned Blore reliably, with the forage
harvester having a nUlnber of breakdowns. The increased productivity of the forage
harvester is a result of having a Illore powerful engine, and a wider cutting width.
The average harvested Inaterial size (billet length) was significantly different between the
two lnachines, which resulted in a significantly higher bulk density of the Inaterial froln the
forage harvester.

18
he recovery yield was reported to have been influenced by he quali( of he crop being cut.
The crop used in this set of trials was lodged and not in a neat stat ding arrangelnent The
result of which was a sIgnificantly lowTer recovery yield of the forage harvester due to its
inability to collect fallen callie off the ground.. The aITIOunt of residue left by the forage
harvester was a r suIt of the header cutting the cane above g't ound level. However th
ba ecutters on tl e calle harvester cut the stalk of at or below ground level luiniJnising the
resid ~1.1'e left in th,e field.
t is obvious froln thi se _of trials that tiler are advantages to be seen in productivity rates
and an increase in bulk density if SOlne pr"'nciples froln forage harves ing equipment were
adopted in cane harvesters. Howevel- a s andard forage harvestervvithout cane harvesting
ITIodifications is not quite capable of collecting the sprawted cane crop into the lnachine
without significant losses.
2.3 The physical ,s,tru1cture ofs,ugarca'oe
Sugarcane grows froln billets planted beneath the soil during tl e plantil g process", Shoots
stelll fronl each billet an,d at 111aturlty a sta k is between 2 and 3 lneres tall and btween 12
and 50 111illinletres in dial11eter depending on val iety and gro ing conditions. Stalks gro\\r in
bundles and share a COlTIlnOn root system which steIns franl the pare'l1t billet. Figure 10
shows a picture of a 111ature crop of sugarcane.
Figure 10 ~Mature crop ofsugarcane'prior to harvest
Th,e sugarcane plan consists of leaves up to 1 5 Inetres in length a (lched to the top of the
stalk. The chlorophyll in the lea.ves absorbs energy frolD the sun and combines with carbon
dioxide and watet" to produce the sugars stored as juice in the stalk. The stalk is defined as

19
the portion of the plan above th gro ]nd whIch bear· tle leaves and flo 'er A nlature stal
is lnad up of between 30 and 40 joint which are seglnented by hard disc shaped lode
located at approxhnately equal intervals. The g ometry of the cross section of a sl,garcan
stalk -aries ith dif£ rent varieties but in general it Inaintains a relative y circuar shape.
The sugarcall stalk has a nUlnbel of func ions, hich 111clude:
suppolii g the leave and flo er parts·
conducting \¥ater and soil t .. ·ents to th leaves'
1110ving the nlanufactured foods to othel parts of the plant
storing sugar in the form of s crose.
The ugarcane salk has a fibrous ll1atri frOIU ""'hich tlle plant gain its strength and ability to
prodllc ugars i 1 the forln of UClose. Th int l"llOde section f tIle stalk is l1lade up of a
hard outer kin and a soft inner pith region re"nforced b fibrovascular bundles as can b
see jn ig" re 11.
Figure 11 - C~ros . section through a sugarcane stalk inter-node. J Epiderlnis' 2, thick-
vralled cells jornling the rind" 3&4 1ascular bundles ofdiffeJ ent 'izes t' 5, clerenchY171a' 6;
pith tissue. (Van Dillewijn 1952)
.! he stalk's outer skin '110'''711 as the ep'de:rmi i lnade up of tl i.e. -~a' led elongated ce ls_
Located beneath the pidennis lie everal layers of rigid, I. woody sclerenchYl11a c lIs, also
kno n as th cOlte'. These c-ells contail t- e p'. gnJe.nt of Jle cane and when. co l1bined \ ith

20
the epiderlnis are terlned the rind of the cane. The rind serves to provide strength and protect
the inner tissues, which consist of vascular bUlldles and storage cells.
The vascular bundles cOlnpris~ the bulk of the stalk interior and increase in density along the
radius. The vascular bundles run in a parallel direction wllilst in the internode, and as they
lTIOVe into the node region, luany of thelTI branch or bend to the leaves or buds. This
convergence in the nodal region results in the node being harder and luore brittle than the
internode.
Inside the vascular bundles are the fibro-vascular bundles. A fibro-vascular bundle consists
of a sclerenchylnatous sheath which encloses an outer layer of xylelTI and inner layer of
phloelTI. The xyleln is vascular tissue which conducts water and lTIineral salts throughout the
plant, whilst the phloeln tissue conducts Inixed food. Making up the remainder of the cross
section are parenchYlna cells that are filled with high sucrose concentrated juice.
The physical structure of a green sugarcane stalk can be divided into three Inain categories of
engineering interest:
1) Insoluble solids, which include the rind and fibrovascular bundles (8 - 18%)
2) Soluble solids, including sucrose and iInpurities (10 - 16%)
3) Water (73 - 76%)
Whilst the stalk is the part of the plant of Inain interest when lnilling for sugar, the recent
interest in using the leaf and trash for .power generation has Inade it a valuable part of the
crop. Depending on variety and growing conditions, between 10 and 20 percent of the total
Inass of a lnature crop of green sugarcane is leaf or trash'lnaterial.
2.4 The mechanical properties of sugarcane
During the billeting process, the cane stalks are exposed to various Inechanical effects. It is
a requirenlent of this process that an applied force be '·accoll1panied by a deforlnation either
great enough. or slight enough to avoid dalnage to the stalk. For this reason, the nlechanical
propelties of the cane stalk are iInportant. These Inaterial prope11ies will essentially affect
the material's sensitivity to injury and dalnage. The Inechanical propelties of the sugarcane
stalk are conlplex as they:
1) Vary within an individual stalk due to the different structures such as the rind and
the nodes
2) Are influenced by external factors such as Inaturity and growing conditions
3) Depend upon varietal characteristics

21
It is well known that agricultural Inaterials exhibit different behaviour under static and
dynalnic loads. The stress-deforlnation relationship for these biological Inaterials depends
greatly on the rate at which they are deforlned. This ilnplies that a tinle dependent
relationship exists between stress and deforlnation. ComlTIonly, lnaterials exhibiting such
tilne dependent effects are terlned viscoelastic, and have partly solid, partly liquid properties.
The action of the knife cuttillg the stalks in the chopper systeln can be represented by an
ilnpact load. Keenliside (1985) investigated the bending strength of sugarcane under inlpact
loading. A halTIlTIer nl0ved veliically downwards at a speed of 0.762 ln/s to strike nlidway
along a cane saJnple placed on two anvils 76 lnm apali. Hamnler depression, applied force
and total energy were recorded to allow plotting of the stress-strain and energy-strain curves,
delnonstrated in Figure 12. FrOln the infol1TIation provided in the curves, Keenliside
calculated the specific energy to fracture, the Young's lnodulus, the nlodulus of rupture and
le toughness of the cane. The average results of these Inaterial propeliies of nine repetitions
r five varieties of cane are shown in Table 2.
elastic limit
proportionalstress limit(load)
upper yield orrupture point
lower'yieldpoint
fracture
energy
strain(depression)
Figure 12 - Typical stress-strain curve for sugarcane in bending (Keenliside, 1985)
Table 2 - Mechanical properties ofsugaPcane (Keenliside, 1985)
Cane varietyEnergy of Young's Modulus of Toughness
fracture (J/m2) lTIodulus (MPa) rupture (MPa) (kPa)
CP65-357 5530 76.2 13.0 302
NCo-3IO 5200 58.4 10.8 346
L60-25 5760 63.7 12.2 263
CP70-321 4990 59.6 12.0 409
L79-1003 7110 105.6 16.5 401

22
The high fibre cane L69-1003 had lnuch greater stiffness and strength than the other
varieties, while the Young's lnodulus of the low fibre variety CP65-357 was higher than the
relnaining three. Keenliside therefore concluded that the tnechanical properties of cane are
related to fibre content.
2.5 Cutting sugarcane
Cutting force and cutting quality are the Inost ilnportant factors when considering the
tnechanical properties of the cane stalk for the billeting process. Research published by
Kroes (1997) investigated the behaviour and tnechanical propelties of sugarcane when it is
cut by the basecutters of a harvester. However, this cutting regitne differs froln the billeting
systelTI as the cut is not lnade against an anvil and the l(nife geolnetry is different.
Persson (1987) studied the single knife and counter-shear cutting process of timothy grass.
A cOlnpression stage of the nlaterial is described before the penetration of the blade edge into
the stem as shown in Figure 13. During this cOlnpression stage, the stenl section lnay
collapse and split in the high stress regions. A typical force-displacelnent curve for this type
of cut would look sitnilar to that shown in Figure 13.
originalsection
pre-co~pression
phase,of cutafter the cut
cut section
stem sectionprior bladepenetration
countershear
o
~~ ..
blade
force
blade displacement
Figure 13 - Behaviour oftil11-othy gra~s during cutting with knife and counter-shear
(Persson, 1987)

23
Whilst the work of Persson (1987) describes a cutting regiIne siInilar to that of a single drUlTI
chopper systenl as seen in a forage harvester, the lTIaterial prop'elties of tilTIothy grass display
a lnarked difference froln those of sugarcane. Hence, results froln this study can not be
directly applied to this research, however such previous research gives insight into' what can
be expected when cutting sugarcane.
2.6 Predicting the bulk density of a cane and trash ntixture
With rising fuel prices and increases in labour costs, transportation of the cane tnaterial [rOlTI
the field to the IniU nlust be optiInised to reduce costs to harvester operators and lnillers.
Increasing the bulk density of the cane billet and trash lnixture results in a decrease in
VOlU111e for a given tnass, and therefore volutne dependent transpol1ation costs are reduced.
Hence, it is beneficial to the industry to be handling a lnaterial with the highest practical bulk
density that does not result in a significant decrease in harvesting efficiency. Calculation of
the bulk density has historically been done by in-field trials, but recently a model has been
developed for predicting the bulk density for an arbitrary cane billet and trash lnixture.
TIle algorithtn developed by Lewis (2006) implelnents a layered approach to calculate trash
bulk density through the height of the bin as well as an empirical lnodel to predict the bulk
density of the cane billet sections. The outputs [raIn the algorithlTI include total bulk density
of the cane billet and trash Inixture and also the predicted bin weight for a specified bin
geolnetry. A prograln was developed which .harboured the algorithIn and a screen shot of the
user interface is shown in Figure 14
This progratn was run for the set of cane atld trash parameters correlated to this study.
Billets lengths of·200, 150 and 100 tnnl with a dialneter of 25 Innl were entered into the
progranl and the resulting predicted bin weights for a stand'ard five tonne bin were
calculated. The results are shown in Figures 15 to 17.

24
RE.... _TS
-1 lets"Bets
3 .5
15 ..
2. _2.~~
2.54
a
Figure 14 -Screenshol o..l'(a) inputpanel anef (b) results panelfor trash la, er calculator
(Lewis 2006)
_0_0
--000
2 0
o
Figlll e 15 - Pr dieted bin eight for 200 mm billet

0000
,000
6;000
~"OOO ~
CD 4 00
, SOOO
2 00
1000
oo 0.2 0.. -
a s rralctll'on
J - i - 9-55
0 .. ;
25
Figure 16·~Predicted bin weights for 150 I1UI1 billets
9000
8000
000
~ ,1000
~"OOO
I 1000
000
2000
000
oo 0.2
Figure 17 - Predicted bin 111elghtsfor 100 111m billets
A,na)ysis of Figures 15-1 7 shows the advantages of cutting sJ10rter billets throughou the
lnass fraction of trash lange. For a lnass fraction of trash of ]0 percellt, the bin weight is
increased by 20 percent wl1en the billet Jel1gth i~ reduced from 200 nlnl to 100 film All three
figQres show a reduction in bin weight as the lnass fi~actjon of tras.h increases. Hence in
order to maintain bin weights as the luass fi~action of trash is increased the bIllets IUllst be
cut into sllolter lengths once again providing motivatiol] for a study into billeting systelTIS
that are capable of doing such a thing.

26
2.7 Conclusions from the literature review
The review of current and past chopper systelns in sugarcane and forage harvesters has
provided a solid foundation fronl which to begin the present study. It was found that a
nlunber of different billeting systeln designs have been ilnplelnented in the sugar industty
over the years and each has had their advantages and disadvantages. Literature on the
lnechanical properties of a sugarcane stalk and the linlited published works on its
deforlnation behaviour when cut are presented. A review of a recent publication on
predicting cane and trash lnixture bulk densities has reinforced the possible advantages to be
gained froln a new chopper systeln that is capable of cutting shorter, luore COllsistent billet
lengths. Attention is now turned to developing and testing a new chopper systeln.

27
LABORATORY BILLETINGEXPERIMENTS
Abstract: This chapter describes a set of laboratory experilnents on the single knife slicing
ofsugarcane against a stationaly anvil. The affect ofa nUJl1ber ofparal11eters on the qualif)J
of the cut and the behcrviour of the stalk are tested. An understanding of the defor111atiol1
behaviour and resulting stalk end dalnage is gained, ultbnately giving insight into the cutting
process lvhich 1nay be expected11"0111 a single drUJ11 chopper systen1.

28
3.1 Aims
The objective is to gain an understanding into the Inechanislns present during the siIlgle
knife slicing of sugarcane stalks. The specific ailns of this chapter are as follows:
1) Design and construct a siITIple single knife slicing apparatus which provides
repeatable and accurate data during the laboratory experimental testing.
2) Develop an experiInental plan that provides objective results and valid conclusions
froln the set of experinlents.
3) Deterlnine the effect of a nUlnher of parameters on the quality of cut and resulting
stalk end danlage.
4) Gain an understanding into the Inechanislns present during the single knife cutting
process and ultiInately the causes of billet dalnage.
3.2 Apparatus
The apparatus used was a specifically constructed rig of which a single knife travelled past a
stationaly anvil to cOlnplete the desired single knife cut affect. The basis for the design and
construction of the rig was" one of silnplicity and safety, where funds for a larger and ITIOre
conlplex apparatus for testing were saved for the prototype rig discussed in Chapter 6.
In an effolt to reduce apparatus cost and construction tilne, the knife velocity was obtained
using a sliding fralne on guide wires that was raised to a predeterlnined height and allowed
to fall under gravity. Relying on gravity alone.to energise the knife linlited the Illation of the
knife to the veliical diInension for the ability to provide the Inost repeatable velocity and
action.
The Inain cOlnponents of the testing apparatus are shown in Figure 18. The guide wires were
pulled tight using an overhead gantly so as there was reduced chance of lateral movenlent of
the sliding fralne.:The tolerances of the holes in the fralne where the wires passed through
were also low to reduce unwanted sideways Inovelnel1t of the fralne. The knives used were
standard 95 InlTI Austoft differential chopper knives, and were replaceable via bolts on the
underside of the sliding fralne. The anvil on the rig had three angle settings so as cutting
stalks at various angles was possible. TIle fraine which allowed for the three different anvil
angle settings is shown in Figure 19.

Figure 18 - Laboratory cutting experilnent apparatus
FigUl e J9 - AnY;l frallle 'hOl1 ing the 1110unts for the different angle settings
29

30
The a lvil franle was adju ·abl relative 0 the guide ires 0 as the dis ance bet e 11 the
knife and an' i co ld e adjusted. H·gh den it polyethylene (HDPE) wa used as the an i
Inaterial in the rig due to its treIlgth and ability to absorb the cOIllpressive load seen by t1 e
at vi] "n this op ration. t J w'a no used for the anv'l edge lnateriaI as contac 111ad b the
kn' e on t e stee anvil would compro111ise the integrity of the apparatus. Yet such COl tact
111ad on the edge on the HDP anvil \ auld lnuch less drarnaticall Ie u]t in chipping of the
HD E and 111uch less fotce on the apparatu . A schelnatic of the cutting process produced
by the apparatus is shown In Figur 20.
Anv,il angle
I
Front View Side Vie,,,
Figure 20 - chell1atic afthe cuttingl)roce~ studied in thi set qf' xperiJnents
3.2.1. strumentation and recording devices
HIgh peed ideo footage of t le cutting process ¥as i lperative in t analysis of the cutting
process. A Redlake Motion Extra HG-IOOKhigh speed calnera and acconlpanying cOlnputer
software were us d to record the process at 2000 fi4 anles per s condo h llna.ges produced
by the calnera were in black and white and fer downloaded to the conI ected computer in
digita fOllTI.
,3.3 Description of the exper,-ment
3.3.1. Var-ables
Thi e, peri- ental investigation as carried au . to determine th,e factors affectjng th qua it
of cut produc d by the sing e nife slicing of a sugarcane stalk. The outputs frOJll the
e periJnent were lnass loss data and high speed footage of the cutting proce s. The
quantitativ,e mas loss data for each est is the dependent quantitativ variable. The
controllable ind'ep ndent variables that contri uted to the variabe mass los dataw -e; anvil

31
angle, knife condition, knife speed and calle variety. The levels selected and the units of
each independent variable are shown in Table 3.
Table 3 - Levels selectedfor each independent variable
Anvil angle, e
Knife condition, K f
Knife speed, Ks
Cane variety, V
Anvil Angle
Degree
"ln/s
30,60,90
Sharp, Blunt
2,4
Q208, Q117
Changing the anvil angle results in a change of the angle between the longitudinal direction
of the stalk and the direction of the knife travel. An understanding of the affects of changing
such a cutting paralneter assists in deternlining the dalnage lnechanisnls present during the
cutting process. The three levels chosen for this 'variable are 30, 60 and 90 degrees. These
levels provide a Ininin1uln, Inaximuln and in between value for the range of angles interested
in for the chopper design.
Knife condition
Two levels of knife condition were used in this set of experilnents to deterlnine the effect of
knife sharpness on the quality of cut. The sharp knife was a brand new blade as supplied
fron1 the nlanufacturer for installation in a harvester. The blunt knife had a one n1illilnetre
flat surface on the cutting edge. This flat edge was achieved by grinding the edge of a new
blade. Figure 21 shows the Ineasurelnent of the thickness of the cutting edge on the new and
blunt knife.

32
Figure 21 - Cutting edge 1'Fidth ofthe new and blunt knife
Knife speed
The lnaxilnuln knife speeds used in this experitnent were litnited by the capabilities of the
apparatus. It was deterlnined froll1 prelitninalY testing that the Inaximu]n safe and repeatable
speed achievable by the apparatus is 4 In/s. Although this is significantly lower than the
Inaxilnuln knife speed of 18.3 In/s seen in the proposed chopper system, it is sufficient for
the ainls of this palticular set of laboratory experilnents. A lower level of 2]n/s was also
chosen for the testing so as a comparison betwe~n speeds could be 111ade.
Cane variety
Two cane varieties were chosen for this set of expert111ents. A predolninantly hard cane,
Q2,08 (16-17 % fibre) and a COlnlnon soft cane Ql17 (11-12 % fibre) were used. Varieties
with such different physical propel1ies were chosen in- -an attelTIpt to quantify the effect of
natural cane propelties on the cutting process.
3.3.2. Experimental procedure
Rig calibration
The speed of the knife was calibrated using the high-speed calnera footage. A rule was
placed in the shot for one recording so as the length of each pixel at the position of the knife
on the high-speed inlages could be quantified. The fralne was released fro]n different
heights until an average speed of the knife over the distance of the cut corresponded to the
required knife speeds declared in the experimental plan. The two heights which
corresponded to the speeds of 2 nl/s and 4 In/s were lnarked on the guide \vires for
repeatability of the experilnents.

33
Sample preparation
Pieces of the stripped sugarcane stalk were cut into lellgths of 350 millitnetres. Each sample
was Inarked with its respective nutnber and the tnass of the stalk recorded.
Rig preparation
The required anvil plate and knife were fitted to the apparatus for the test nUlnber being
conducted. All tnaterial froll1 the previous test was cleaned froln the rig including juice and
pieces of fibre. The gap between the knife atld anvil was checked and the anvil fraine was
adjusted if necessary.
Rig operation
Once the test speCllnen was positioned on the anvil, the frall1e was raised to the
predeterInined height for the desired knife speed. The high-speed camera was set to record.
The fralne was released and allowed to fall, nlaking the cut. The high-speed camera was
then triggered to stop recording.
Data collection
The footage froln the high-speed canlera was downloaded to the connected cOlnputer
between tests due to the large size and therefore increased transfer tilne of the high speed
video files. The chopped material was collected from.-the apparatus and lnass recordings
were taken inllnediately so as to elilninate any further deterioration of the fibres.
Photographs were then taken of the freshly cut billet ends.
3.3.3. Experimental design
The following experilnental design was selected to obtain a plan which can provide objective
results and valid conclusions with Inininlal expenditure oftilne and resources. The Inodel
which describes the nUlnber of experilnental conditio'ns required is;
Eqn. 1
where
Ns == IluInber of tests required for the experinlent
k == number of levels of a factor
n == total nurnber of factors in the experitnent, and

34
R = nUluber of repeats for each test configuration
Therefore, the nluuber of tests required for the experinlent is:
38 x' 2Kf x 2Ks x 2V x 2Repeats = 483
Therefore, there are 48 experiluental conditions required to deterlnine the effect of the four
independent variables on the Inass loss produced by the single knife chopping apparatus.
Table 3 illustrates the experilnental plan for the experilnent. Each cOlnbination of variables
is allocated a test nUlnber for reference throughout this section of the study.
Table 4 - ExperiJnental plan for the laboratory experiJl1ents
Test Anvil Knife Knife
No. angle condition speed Variety(degrees) (m/s)
1 90 Sharp 2 0208
2 90 Sharp 2 0208
3 90 Sharp 2 0117
4 90 Sharp 2 0117
5 90 Sharp 4 Q208
6 90 :Sharp 4 0208
7 90 Sharp 4 0117
8 90 Sharp 4 0117
9 90 Blunt 2 0208
10 .... 90 Blunt 2 Q208,·
11 90 Blunt 2 0117
12 90 Blunt 2 0117
13 90 Blunt 4 0208
14 90 Blunt 4 Q208
15 90 Blunt 4 0117
16 90 Blunt 4 0117
17 60 Sharp 2 0208
18 6.0 Sharp 2 0208
19 60 Sharp 2 0117
20 60 Sharp 2 0117
21 60 Sharp 4 0208
22 I···· 60 Sharp '4 ...... Q208
23 60 Sharp 4 0117
24 60 Sharp 4 Q117
Test Anvil Knife Knife
No. angle condition speed Variety(degrees) (m/s)
25 60 Blunt 2 0208
26 60 Blunt 2 Q208
27 60 Blunt 2 0117
28 60 Blunt 2 0117
29 60 Blunt 4, 0208
3Qj. 60 Blunt 4 Q208
31 60 Blunt 4 0117
32 60 Blunt 4 0117
33 30 Sharp 2 0208~.:'=' "h
34 30 .Sharp 2 0208
'35 30 Sharp 2 0117
36 ,-3D Sharp 2 0117.-,.
37 30 Sharp.i")/ 4 0208//</'.;~'
38 30 Sharp 4 0208
39 30 Sharp 4 0117
40 30 Sharp 4 0117
41 / 30 Blunt 2 0208
42 30 Blunt 2 0208
43 30 Blunt 2 0117
44 30 Blunt 2 0117.. '
45 30 Blunt 4 Q208
46 30 Blunt 4 Q208
47 30 Blunt 4 0117
48 30 Blunt 4 0117

35
3.3.4. Quantitative experimental outputs
Cane and Juice Losses
The anlount of lnaterial lost during the cutting process is one of the 1110st iluportant factors
\\Then considering the quality of the cut. Material lost during the cut includes cane (fibre and
rind) and juice. Reducing these losses sees the efficiency of the harvesting operation
increase and therefore Inore of the cane in the field Iuakes it to the luill, providing
advantages to all involved in the growing, harvesting and lnilling processes.
To quantify the losses associated with the chopping process, nlass balance techniques were
used, where the lost mass is deternlined as the initial lnass of cane lninus the final Inass of
the chopped billets.
Eqn.2
3.4 Results
3.4.1. Cane and juice losses
A sUlnnlary of the quantitative Blass loss results recorded during the testing is shown in
Figure 23(a). Each factor in the experinlent is displayed along the horizontal axis. For each
of these factors, the lnean lnass loss per stalk is presented for each level tested. In addition,
the overall lnean value of lnass loss for all tests is shown as a horizontal liIle. The lnass loss
results are also conve11ed into a percentage Inass los.s pet cut per nletre of stalk as shown in
Figure 22(b). This experilnent was very repeatable with the vari,abilit)r between repeats not
exceeding 80/0 of the recorded lnass loss for all of the tests. Analysis of the presented data
gives insight into how varying each of the tested factors influenced the lnass loss found frOlTI
a single cut.
A l1ulnber of trends cane be drawn froln the data lneans of cane and juice loss shown in
Figure 23. These trends ilnply that a higher lnass loss is caused by the single knife cut wIlen:
The anvil angle is increased
The knife speed is decreased
The thickness of the leading edge of the knife is increased
The hardlless of the cane is decreased
Statistical analysis of the results is required to determine the significance of the above
ll1entioned trends. In order to conduct the statistical analysis, norlnality of the results is

36
assurned. I -is assumption is required as tlle cotegorical nature of the illdependen variables
and the levv nUlnber of lev 1s tested for each conlb,'l1ation J11eanS that 1 Oftnality of the res 11t8
can not be accura ely tested for. An analysis of variance (ANOVA) \vas conducted to
de elmtf e whic 1 varIables and cOlnbination of ariable have a ignificant affect on cane and
ju'ce loss. The reul 's oft! e t o-wa bewen groups AOVA are shown in Tabl 5.
For each variable or cOlnbina ion of variable to be deternlin d a Sigl ifi ant to\vards the
cane and 'uice mass loss au COl11e the hypothesis lllade in the ANOVA lUllS! be rej,ecte.d.
That is tJe p- alue must be less han the probability associated wIth th,e hypothesis. The
nn 1 hypotheslS in this set of tests is a p-value of 0.05. Anvil angle, anvil angl x knife
condition anvil ang e x knifl speed 3.1 d knife COl ditiOl x life speed ar t ,e variables
which detnonstrate a p-value less than 0.05 and are therefore dUled to have a significan
effec on the lnass loss Qutconl .
Table 6 exhibits a c0111parison aI ongst l Ie s for allv"l angle. he Tukey's lnethod vvas used
'0 detennine;yhich levels of anvil angle caused a significan increas,e in mass 10' s. A
, slgnifi'cant affect (p-value < 0.05) was found between the 90 degree level alld both the 60
and 30 degree levels \\lhereas the·e was not a significant difference be een th 30 a d 60
degre level. TITIS means t1 at a ignifican increase in lllass loss i seen when the anvil
angle IS iner a ed fr01TI .)0 o· 60 d aree up to 90 degrees. All other changes in variables
were de 1 ed ·0 be statistically ill inificant to ards the l1IaS of cane and juice 10 during
the Gut.
Effe,ct of v' riable levels (da· a means) on cane and jui e105_
: : 90°,1.37
~ .60°,0.76; , 30:0,0.73
Anvil angle Knie speed
~_ 8lunt) 1.~U
>< Shat'p 0.91
K i -e ondltion
,;''\ Q117 1.04
,/ Q208, 0.87
Va( y
Figw'*e 22a - The effect ofeach variable on the ll1ean value Of111ClS:i loss

37
Effect of variable levels (data n1eans) on percentagecane and juice loss per metre of stalk
0.35 -?f(-(}) 0.3 ~< SOo ,0.301-.......(])
E............ O.JS0&-'
X 2n1/5, 0.23 >(~ Q117. 0.23::J X Blunt: 0.22u........... 0.2 >:. 4n1/~ 0.20 >< Sharp,O.20 XQ208.0,19It)
L") .. 60° ,0.170 *30°,0.16l".') 0.15I....')roEOJ 0.1b.Oro-a,...J
.c0.05<lJ
u"'-QJD....
0Anvil angle Knife speed Knife condition Variety
Figure 23b - The effect ofeach variable on the percentage ofcane andjuice loss per cutper
l11etre ofstalk
Table 5 - Analysis ofvariance for lnass loss under the independent input variables
Source DF SS MS F p-value Ho
Anvil angle 2 4.078 2.039 16.484 0.000 rejectedKnife condition 1 0.088 0.088 0.715 0.406 acceptedKnife speed 1 0.219 0.219 1.768 0.196 acceptedCane variety 1 0.375 0.375 3.028 0.095 acceptedAnvil angle *Knife condition 2 1.094 0.547 4.421 0.023 rejectedAnvil angle * I<.nife speed 2 0.986 0.. 493 3.984 0.032 rejectedKnife condition *Knife speed ] 1.267 ].267 10.24.~ 0.004 rejectedAnvil angle *Knife condition * 2 0.188 0.094 0.76 0.479 acceptedKnife speed
Anvil angle *Cane variety 2 0.57 0.285 2.305 0.121 acceptedKnife condition * Cane variety 1 0.006 0.096. 0.046 0.833 acceptedAnvil angle *Knife condition *
2 0.731 0.365 2.954 0.071 acceptedCane variety
Knife speed * Cane variety 1 0.020 0.020 0.162 0.691 acceptedAnvil angle *Knife speed *
2 0.254 0.127 1.027 0.373 acceptedCane varietyKnife condition *Knife speed 1 0.180 0.180 1.456 0.239 accepted* Cane varietyAnvil angle *Knife condition *
2 0.345 0.] 73 1.395 0.267 acceptedKnife speed * Cane variety
En·or 2.969 0.124
Total 57.031
Table 6 - COlnparison a1110ngst anvil angle levels which significantly affected 111ass loss

Factors
ANVltANGLE
900 respect to:
60
30
600 espect to:
30
Diffe·rence of means Standard error p-value
0.6037 0.12434 <0 001
0,6319 0.12434 <0.001
0.0281 0,12434 0.972
38
3.4.2. High spiced photographr
Th avera' qual"ty of he cut ca 1110t be judged so y on the ll1a ofjlice al d fibr lost
during the ell" The fre hly cut sllrfac as well as the bordering sections of the stal were
anal s d for danlage such as sphttjng and sq lashing. A split tal tha has inner fibre
region e rposed to --he atmo phere is JUOI' susc ptible to dr ing ou and det rioratlOl1
betV\'een t e: fnle it i cut and ll1ill d thus a clean dan age free bille 's d sir d. Inspectlo
of the dalnage caused to the billet during the cutting process was done v'a analysis of the
high speed photography ta'en tor each tes. 'I'he affect that SOIne ot the ar-ables had on the
damage prove slight] coun er-·ntultlve as they did .ot neces- ari y follo~' the trends found
in he lnass 10s3 data. An example of thIS ~8 he c fcc_ that changulgtle an- il an Ie had on
billet dmnage. he mass balance da a sho ed a clear trer d to ard h 'gher nass loss a th
anvil angle aproached 90 degre s yet the damage done by such an orthogona cut as
significantly less than that when tIle angle be een the knife and ca e stal as decreased.
Such a variatIon iJ billet end damage for he three tested anvil angle is high ighted in FIgure
24.
(a) Anvl1 angle = 30° (b) llviJ angle = 60° (c Anvil angle = 90°
Figure 24 Hiuh ~p(Jedphotograph}' in1ages hotving billet end danlage caused b- the
cutti 19process
Signlfical1t splitting and tearing of.th·e stalk can be seen 'n Figure 24 for the lesser aJlvil
angles.. Such a trend was also fOll d l1en inspecting th'e b·llet nds after the cut as

39
cOlnplete. Splits extending along the stalk to the nearest node were a COlnlnon occurrence in
the billets cut on the 30 degree angle.
Analysis of the cutting process also showed a slight increase in squashing and tearing when
the blunt knife was used. Although the affect was not as noticeable as that of the anvil angle,
it was visible that the sharper knife fractured the outer skin and inner fibres lTIuch earlier and
with less cOlTIpression required than that of the blunt knife. The blunt knife effect was lnost
noticeable in the 90 degree anvil angle cut, where there was more force required to deforlTI
and fracture the fibres olthogonal to their direction.
The affect of the renlaining factors on the visible dalTIage done to the stalk was Ininin1al,
with little difference seen in the inspection both during and after the cut, thus these factors
were identified as insignificant on the dalnage seen during these specific tests. Analysis of
the high speed photography showed that for each test, the knife lateral path did not differ
lnore than 1.0 nllTI, thus giving confidence in the repeatability of the eXperilTIent.
3.5 Discussion
3.5.1. Descriptive model of the mechanisms present during the cut
It) order for the knife to pass through the stalk, of cane, the longitudinal fibres that nlake up
the stalk lnust be fractured around the tip of the knife. For the fibres to be fractured, force
lnust be applied to thelTI via either the knife tip or neighbouring fibres that are relaying force
fron1 the knife. The high speed photography shows that most of the juice expressed froln the
stalk is the result of a reduction in volume, or deforlnation, of the stalk. Such a reduction in
volulne on the already saturated structure forces the inner juice to expel through cracks in the
outer shell. As the outer shell is the stiffest pali of the structure, and" therefore would require
lTIOre force to fracture it, lTIOst of the stalk deformation occurs between the first contact and
the tilne that the knife tip pierces the rind. Hence, reducing juice expulsion fron1 the stalk
would require less initial deforlnation of the stalk befote the knife penetrates the outer rind.
This theory is backed up by analysis of the lTIaSS loss results for changing anvil angle. A 90
degree angle between the stalk and knife resulted in the fibres being cut olihogonally,
exposing the knife to a larger surface area which is expected to result in a higher cutting
force and therefore higher defornlation and juice loss. However, cutting at an angle such as
30 degrees allows the knife to pass lTIOre between the fibres instead of fracturing th.eln,
resulting in less fracturing force and therefore less deforlnation and juice loss.
A theory can also be nlade on the saUle basis on the cause of splitting of the stalk durillg the
cutting process. Although passing a knife through a stalk at low anvil angles would result in

40
less deforIllation of the stalk, the path of the knife sOlnewhat along the fibres forces the fibres
apart and increases the chance of splitting between the fibres. Such observations are backed
by the significant increase in dalnage found for the lower anvil angle tests.
3.5.2. Implications to the design of the chopper system
This set of experilnents has given SaIne insight into the cutting process and dalnage
Inechanislns which can be expected during single knife chopping of cane. Although anvil
angle was found to be the JllOSt influencing factor toward lllass loss and daJllage, this is a
design eleJllent which is restricted on a COInlnercial systeln due to geolnetric and operational
constraints. The drum geometry and positioning of the shear bar influences the range over
which the angle of the cut takes place. This set of experilnents implies that the range of the
angle between the knife and stalks (anvil angle) in the single drUlli cl~opper systenl sllould be
centred around 60 degrees, as this provides a low Inass loss whilst not resulting in significant
damage to the stalk. Whilst the Inass loss and high speed photography results have provided
such a conclusion, it Inust be considered that this experiJnent only studied a one dilnensional
cut, with the velocity of the kl~ife in the horizontal direction ignored. The introduction of the
second diIllension in the Illation of the knife is predicted to be influential toward the affect of
the anvil angle on both Inass loss and danlage. Hence, the results of the affect of anvil angle
found froln this set of experiJnents can not be .directly extrapolated to tho.se expected froln a
single knife chopper system without further testing. Although the knife speed, knife
condition and variety characteristics were found to be insignificant toward mass loss, the
limitations of the experilnent and the difference between the action of the rig and a real
systenl inlplies that such a lack of influence nl3:Y not be seen in a real chopper.
3.6 Conclusions froID the laboratory billeting experiments
This set of trials has provided insight into the mechanisITIS present during the single knife
slicing of sugarcane stalks. An understanding of the affect of a llulnber of paralneters on
defornlatioll behaviour and resulting daIllage to the" stalk has been gained. The following
conclusions can be drawn froln this set of experinlents:
1) There is a strong positive trend between atlvil angle and Inass loss. That is, a
significant increase in mass loss is seen for an increase in anvil allgle up to 90
degrees.
2) Knife speed, knife sharpness and variety characteristics were found to slightly affect
the Inass loss, yet this affect was found to be statistically insignificant.
3) A significant increase in stalk end dalnage is seen when the anvil angle is reduced.

41
DEVELOPMENT OF THESINGLE DRUM CHOPPER
CONCEPT
Abstract: This chapter describes the process undergone in the developnlent of the single
drU111 chopper concept. The conceptual design ofeach c0111ponent and the theolY followed is
detailed throughout the chapter.

42
4.1 Aints
The objective of this section of the study is to develop the new sugarcane harvester chopper
concept. The specific ain1 of this chapter is:
To develop a chopper concept that will be effective in a sugarcane harvester. This
concept will fOfill the basis for the experitnental and cOinputational testing
cOlTIpleted throughout the rest of the study.
4.2 System requirentents
The chopper systelTI in a sugarcane harvester ll1ust Ineet celiain criteria if it is going to be
effective. A set of guidelines was developed for the basis of the single drUID system
functional design. This criterion involves a chopper systeln which:
1) Is capable of processing a cane stalk and trash Inat of diiTIensions up to 900 lTIlTI
wide and 300 111In high at a lTIaxilTIUm (glut) feed rate of 500 t/hr.
2) Is able to be driven by a hydraulic motor.
3) Does not require over 50 kW of power to drive the drUITI.
4) Is capable of cutting billets of preset length between 100 and 300 ll1n1.
5) Is able to be retro-fit into a standard chopper harvester without Inajor ITIodifications
to the Inachine.
6) Has replaceable cutting knives.
7) Has an autolnatic knife sharpening. systeIll.
8) Does not recycle billets after they are cut (the billets clear from the drUITI).
9) Provides an acceptable quality cut that results,. ill n1iniinal losses and high quality
billets.
4.3 Component conceptualisation
In an atten1pt to reduce the risks associated with the developlTIent of a new concept, and also
to gain advantages froln some proven concepts, the proposed systeln has been based around
the adoption of a forage harvester chopper systeiTI for use in a sugarcane harvester. Whilst a
nUlTIber of the accessories in the systenl could be easily adopted, a cOlnpletely new druin had
to be designed as cane is required to be cut into lTIuch longer sections (up to 300 Ium) than
that of forage Inaterial which is lTIOst often chopped into lengths of 2 to 50 lTIIll. The
following sections in this chapter describe the functional design process that was followed in
the developlnent of what is believed to be the most suitable concept for a sugarcane harvester
single drUlTI chopper systelTI.

43
The ClOpper drU1TI j the Ino critlcaJ asp ct of the ys elll, a i has an affect on a I '.tages of
the ehopping proc.ess ineluding· how the feed ll1aterial flows into the systelTI the cutting
proces and the trajectory of the lllaterial out of the systelll.
The dialneter of tl' e dr 111 is lilnited b the ge metric re raints 0 a eu ~~ent harvester, wh re
the s stelll has to be ITIounted between th feed train and he e Ttrac ion chalnber. Alterin
the shape of tltti fed traiJJ \iva~ Hut a viablt; upt"un as llus . -]ap~ is Lh~ r~suJt of xLensive
research into the forward feeding of a harvester 0 reduce any choking effect. Allowing tie
chopper drU111 to protrude into the e traction chanlb r is also not practical as this ould
affec I the cleaning a d deliv ly system 0 he elevator. Figure 25 5J 0 s the boundary of
which the chopper s stem Inust fit ·nside on the haresero
Figur I 25 - G olnetri restra;'1ts on a sugarCGn _harl e fer
aking thl on 0 account~ it was found tha the lna --in1 nl siz chopper druB1 hat could be tit
into a I arvester IS 800 111111. The Ina iInUln poss·b e sIzed drUUl IS preferred as it is lllore
capable of handling higher capacities of feed and the chopping of longer b"Bets. Therefore a
drUlTI of 800 lTItTI dialllet r (knife tip to tip) ill be used.
The nUlnber of illV s position d around the drUlTI is alsoe pected 0 pIa. a criti aJ role ·11
the quali of cut and materia c earing perforlnanc. he nlore kniv s posi ianed around the
eireu ferenc of he drlun resul sin·
1) Lower drutu speeds
2) R duced clearing perfoltnance

44
3) R duced ab·lity to cut lon er billet
4) Longevit)r of knives
Therefore a happy lned ~u n"i n~ ds tu b~ rUt Ill!, as tht:rti ar !JuLl- advant' ges and
disadvantag s for includiJ g L ore or le S li 'es. T le lTIOst crifcal of he above luelltioll -d
cr·teria are the clearing perfonl1anee and ability to cut ~peclfie length hlnet~L Havina:1 drulll
ith four or lllore kniv is e pected to begin inhibiting the cl aring performance a ell as
litnit th bill.t J llgth to less than 300 lTIJTI. Therefore to ,ensure the chopper drunl has th
1108t chance of clearing a 3 b, aded drU1TI ill be used as S'10wn in FiguT 26.
Figure 26 - ChOlJpel druln geolnefr dell1011sfrating replaceable inner curves
t is expected that the geolnetry of the inner Cln~ve of-each arBl will play vital role in the
trajec OIY 0 he 11laterial out of the dru and tlat each cOll1blnatio of feed speed drlUTI
sped and pour rate will have an optiJnulll inner curv geol rletf" tha results in the desired
mater ·al trajectory Therefore the prototype concept will ha e replac able inner cu~ve hat
can be tested for each op .ratrng condition a ho 11 in Figur 26.
The drUln speed required to produce predeternlined hi) t lengtls IS deterlnined b
,exanlining the cut frequency to feed speed relationship. Assuming no slippage in the feed
rollers drum speed is ca culated by the followIng equat"Ol1.
Whele:
1t roller Drollerdrum - X L
drum billet
Ndrum = Rotationa.l speed of the chopper drulu (rpnl)
Nrolter = Rotatlona speed 0 t e feed rollers ( lJrn)
Eqn. 3

45
Droll']' - D'alneter of the feed rollers::::: 0.22 Ine.res
Lbillel = Bill t length (n1)
Xlrllm = NUlllber of knives on the drulll = 3
4.3.2. Knife
The knifl d sign is 1110st c ~ifcal in the quarty of the ell produced. hilst needino to be able
to be ] arpened and also replaceable, the knit needs 0 be rigid enough to withstand the
cutting of the thic 111at of Inateria. A weigh up etween required rigidity and a "eduction i 1
profile to allow· a good quality of cut is the 111ajor factor in the kl1ife design.
Due to the atu ~e of the s'ngle ru] en1 req iring very Sllla 1 to1erance ben een kn ifl
and shear bar an deflection of th lalifi, that leads to cont~c1" 1th the . he~r h~.r woulcl he
catastrophic. Therefore rIgidity of tl· e Foife as considered as highest priorit in .he knife
desIO-no An 8nlm thick kl ife lllade froln Bisallo 80 steel as ho ,e 1 as this is v ry sin ilar
to W.", at i currentl,Y being used in roary pinch chop systen1s.
T ·Ie; s]lape of the taper 011 the knife is r stri'cte:d by the operat·on of the shallJenlng syste 1.
As "he shallJening stan is passed along the taper 0 the ' ife th, taper 111U t lie along the tip
path hlch is the circumference of the drU1TI& Figure 27 sl 0 s the geolnetl. of the kni~ ..
Figure 27 - Knife endprofile
The angle at hich the life's Inonted on the drU1TI l11Ust be sufficient ha the trailitlg edge
of the knife doe' not ilterfere" ith the £ ed material after the cut has beet 111ade. FIgure 28
illu ttates he Ineasurenlent that describes knife rake.

46
Figure 28 - Knife rake
~tudy 'ng the 110 _01 of the drum and feed the knIfe rake can b ca ell ated u ing the
folIo ing equation.
Eqn. 4
Where:
Droll>}' = Dialneter of the feed roller (n1)
roller == Speed of the feed rollers 'tp )
(}knilewidrh = Angle of he arc tha the jfe takes up (degrees)
N lrllJ1t = Speed of the chopper drulll (rpnl)
Insetting the known ariables into this equation it was found that he knife rake' Blust exceed
18 lTIrl1 for a 200 lllin target b'Ilet length (roller speed == 1901pln).
4.3,.3., Shear bar
The nlain purpose of the shear bar is to provlde a stationary anvil for he kniv s on the
chopper drU111 to cut again . As the knife is sharpened and wears the shear bar ]11~lSt be able
to be 1110ved back ~ t close to thekr ife to ensure ll1inilnal gap behveen knIfe tip and shear baT
edge.
Forage hal" esters enlploy an autotnatic shear ba' re-alignnlent s steIn wher afte ~
sharpening the shear bar is lTIoved into the knife path via lectric -motors on the pivot arnl.,
Cont ct sensors 011 the hear bar sense ~fhen the knifi is slightly touching the at vii edge and
the sh.ca bar is backed off a touch and locke-d in place. A similar systen1 i proposed for the
sugarcane harvester systetn.

47
4.3.4. Deflectnr' plate
he d flectar plate is essential in guiding the bIllet.s fronl the shear bar into the extraction
Ch:llnber \\lith the desired trajectol)'_ Figure 29 shows the shape of the deflector plate froln
"the proposed design.
Figure 29 - De./lec{orjJlate geol1Ze17)'
A 51nlTI clearance between knife tip and deflector plate in the lower stages of the plat ensure
all billets are cleared fronl the shear bar a ld behind. The top edge of thehea . bar is aligned
with the position of the sill plate on a harvester. Positioning this ,edge any lower vv'ould
r,eqlllre]o 'ering the elevator basket upon fetro-fit. A slTIooth transItion froll1 the lovvel arc
shape 'ofthe plate to t]le upper straight edge will also ensure ease of clearitlg of the Inaterial
4.3 ..5. Sharpening system
The proposed sharpening, ystenl is, an adoption of the forage l1arvester sharpen'ing systenl
de .cribed in section 2.2.1. A stone is passed along the length of the drum and the knife
edges are finished a the drUTI1 rotates at hIgh speed. During cuttIng the sharpening stone is
positioned out to the side of the druln to ,ensure no interference with the cutting and elearing
processes.
4.4 Conclusions from the concept design
'This chapter has detailed the theol}' foHowed in the creation of the sitlgle drU111 chopper
concept. The ren1ainder of this study ,"rill aitn to nUlnerically and experinlentally test the
perforll1ance of this concept.

48
DYNAMIC MODELLING
Abstract: This chapter details the develop111ent and testing of a dynanlic l110del of the
proposed chopper syste111. The affect ofa nU1Jlber ofdesign and operatingparanleters on the
billet trajectolJl is discussed, and based on these p'esults conclusions are l11ade as to the
suitability of the concept for use in a harvester.

49
5.1 AiInS
The objective of this section of the study involves analysing the predicted path of the cane
billets through the proposed single drum chopper systeln. The specific ailTIs of the chapter
are as follows:
1) To develop a finite elelnent model of the chopping and throwing process.
2) To use the finite elelnent model to deterJ11ine the effect of certain geolnetric and
operating paralneters on the billet trajectory.
3) To use the findings froln the Inodels to confirln the suitability of the previously
suggested set of geolnetric and operating paralneters for the single drUlTI chopper
systenl.
5.2 Finite elentent modelling
Finite elelnent Inethods provide significant advantages over analytical and experilnental
techniques when calculating the dynalnic trajectory of objects that have been influenced by
applied velocities and forces. Such Inethods allow the influence of various velocities, forces
and contact between geolnetric bodies to be calculated in detertnining the dynalnics of
cOlnponents in cOlnplex systelns. This is the reason that finite elenlent Inethods have been
chosen as the research tnethod for the billet trajectory study.
ELFEN was the chosen finite eleUlent code due to its capabilities In dynalnic explicit
Inodelling. ELFEN is a general purpose finite elelnent / discrete elelnent systeln for solving
2D/3D problelns. It incorporates pre-processitlg facilities for J110del generation,
itnplicit/explicit analysis capabilities and post processing facilities for assessnlent of results.
5.3 Description of the experiInent
5.3.1. Variables
An understanding ofthe factors affecting the billet trajectory is required when designing the
single druln chopper systeln. The controllable independent variables that are thought to
contribute to the billet trajectory are the drunl geolnetry and druln speed. The levels selected
and the units of each independent input variable are sllown in Table 7.

50
Table 7 - Levels selectedfor each independent variable
Independent Variables Unit Level
DrUITI geOlTIetIy, Dgeol11 - D1, D2, D3
Drunl speed, NdnUll rpIn 219,292,438
Drum Curve Geometry
As discussed in section 4.3.1, the geOlTIetry of the arIn inner curve on the druITI is expected to
influence the trajectory of the billets out of the chopper. Three inner druln curves will be
ITIodelIed and tested and referred to as D1, D2 and D3. Where D 1 is the lllost protruding
(flatter) curve, D3 is the least protruding (ITIOst curved) curve and D2 is the curve whose
shape is between D1 and D3. Each curve will be run for an equal nUlnber of tests.
Drum Speed / Billet Length
The feed train has been set at a constant speed of 190rplTI for the lllodelling, as this is the
higher end value for the speeds at which current chopper harvesters are operating. The target
billet length for each test is deterlnined by varying the drum speed as expressed in Equation
3 in section 4.3.1. The three billet lengths tested lTIatch those tested in the prototype
experilnents in chapter 6, these being 200 1111ll, 150 lTIIU ~nd 100 lnlll.
Table 8 - Target billet lengths and corresponding chopper drull1 speeds used in the
1110delling
Target billet length (mm)
100
150
200
5.3.2. Experimental design
>--0"
Chopper drum sp~~d (rpm)
438
292
219
The following experitnental design was selected to obtain data which can provide objective
results and valid conclusions with the Jnininlal nUlnber of finite elelnent lllodels required.
The JTIodel which describes the nUlnber of experinlental conditions required is;

51
Eqn. 1
The number of tests required for the experilnent is:
H_ence, there are 9 cOlnbinations required to deterlnine the effect of the two independent
variables on the predicted billet trajectory of the prototype chopper system.
Table 9 - Finite elenlent lnodelling plan
Test No. Drum Curve Billet Length (m) Drum Speed (rpm)
1 1 0.2 2192 1 0.15 2923 1 0.1 4384 2 0.2 2195 2 O~15 2926 2 0.1 4387 3 0.2. 2198 3 0.15 2929; 3 0.1 438
5.4 Model design
As earlier stated, the dynalnic model was constructed and exercised in the finite elelnent
code ELFEN-. Solving explicit (tinle dependent) problelns using finite elenlent Inethods is
laborious, thus the required cOlnputer power and solving tilne is significant. ASSU111ptions
were Inade to sinlplify the pro.blelTI and therefore reduce solving time. Each step of the
lTIodel design and the assuInptions Inade in each is detailed in the following sub-sections.
5.4.1. Geometry
The model was constructed as a l1lechanical, two dilnen.sional plane strain probleln, with the
dhnension in the axis of the drUIll (the Z axis) neglected. This assulnption significantly
reduces the cOlnplexity of the Inodel. The assulnption that there is no effect of forces or
contact in the Z direction is reasonable when exalnining the Inost pali of the feed train except
for either end, where Ininor end effects l11ay be present
During the building of the geolnetry, only one of the three drunl cutting arn1S was lTIodelled.
Modelling only one ann and therefore studying only Olle cut and throw was done once again
in an attempt to Ininiluise lllodel cOlTIplexity and solving tiIne. Not Inodelling the other two
cutting all11S had no effect on the results.

S2
rash a neglect d in the lnodel due to the difficulty of lTIodelJlng a lnaterial ith such a
thir profile and fie ible propelties. It was decIded that this rould not have a detrin1ental
affec on the resu ts due to the majority of the lnass of the feed 111,aterial being cane' alks.
h geolnetry built in the ELFEN prog "allis sho 11 in Figure 30.
Extraction chamber/ bal:k waH IChappel drUl
I Shear bal
I Cane salk
';
Figure 30 - Geonletr· ofthe dynanlic lnodel built in ELFEN
The three drUlll profiles built in the ELFEN plogralTI are shown in Figure 31.
II
/,I
-~------_.......
/Ij
,I, ()
_.-:-~
/'.;- /----
/ ./
/-/
/I //•
II, (i )I I
\ ~~•\/ (2)-----_.......-~
/('
)/I
(3)
Figure 31 - Three drun1 cutting arT11 profiles: (l)-DI" (2)-D2' (3)-D3.
The' ip 0 th knife was lTIodif'ied so as there were no acu.e angles in the TIl0delw ich result
iJ sllla] eletnents and therefore increased solving tilDe, A blunt tip a added to the knife as
shown inigure 33.

53
Three 30 Inn1 thick rectangular shapes were used to represent the cane stalks being fed into
the systeln. Three stalks were used as this is the expected thickness of the feed Inaterial mat
when a cross section of the feed train is taken.
5.4.2. Material properties
Two Inaterials were used in the model, one represel1ting the cane stalks and the other the
steel cOl11ponents including the druln, shear bar, deflector plate and extraction chalnber. The
linear elastic properties and density of the cane stalks are in accordance with those found in
previous studies into the Inechanical properties of sugarcane stalks (Keenliside, 1985) and
are illustrated in Table 10. The steel cOlnponellt Inaterial propeliies are those for standard
.lnild steel; however the Young's Modulus for the steel cOlnponents was scaled frolll 200GPa
to 2GPa in order to reduce the explicit critical tiIne step and therefore reduce solving tiIne.
This is not critically ilnpoliant to the solution as the stresses within the steel components of
the l110del are not being studied.
Table 10 - Material properties: linear elastic para:,neters and density
ElernentGroup E(GPa) p{kg/m3)
... ...
Cane stalks 0.075 0.35 1100
Steel components 2* 0.32 7860
*This value has been scaled down to increase the tilne step and decrease solution tiIne
5.4.3. Mesh
An unstructured Inesh of linear rectangular elenlents was used throughout the Inodel. The
unstructured Inesh was required as there are shapes in the geolnetry which do not allow for a
structured 111esh. The size of the Inesh in each cOlllponent was varied'·jn accordance with the
iInportance of each section being 111eshed. The nlesh used in the nlode! is shown in Figure
32.
The nlesh applied to the surfaces of the deflector plate and extraction chalnber were a
constant size 8(nlIn) and the shear bar a constant size 5. The cane billets were a constant size
3. The drunl was assigned with an overall size IOta the surface, however a size 2 was
assigned to the inside edge of the knife and a size 3 was assigned to the inside edge of the
inner druln curve. Figure 33 shows the detailed pictures of the nlesh of the drulll cutting arm
and a close-up of the knife tip.

54
Figure 32 - Mesh uplJlied tv lhe Irludel.geurnelry .
Figure 33 - Mesh applied to the drU111 cutting arnl and close-up oj'knife lnesh
A nU111ber of loads were applied to the o10del to replicate the dynarnics of the chopper
systen_l~ A global gravity w-as applied and designa oed as 9810 lTI1111s2 in the negative Y
direction. A direct constant velocity of 2190 1111n/s at a direction of 135 degrees all1i
clockwise froln the positive x direction was applied to the ·end of the cane bill~ts to represent
to velocity applied by the feed rollers The speed of 2190 Jnnl/s is equivalent to a feed roller
speed of 190 rplTI., A constant angular velocity with a celltre at x=O, y;:=O (the centre of th
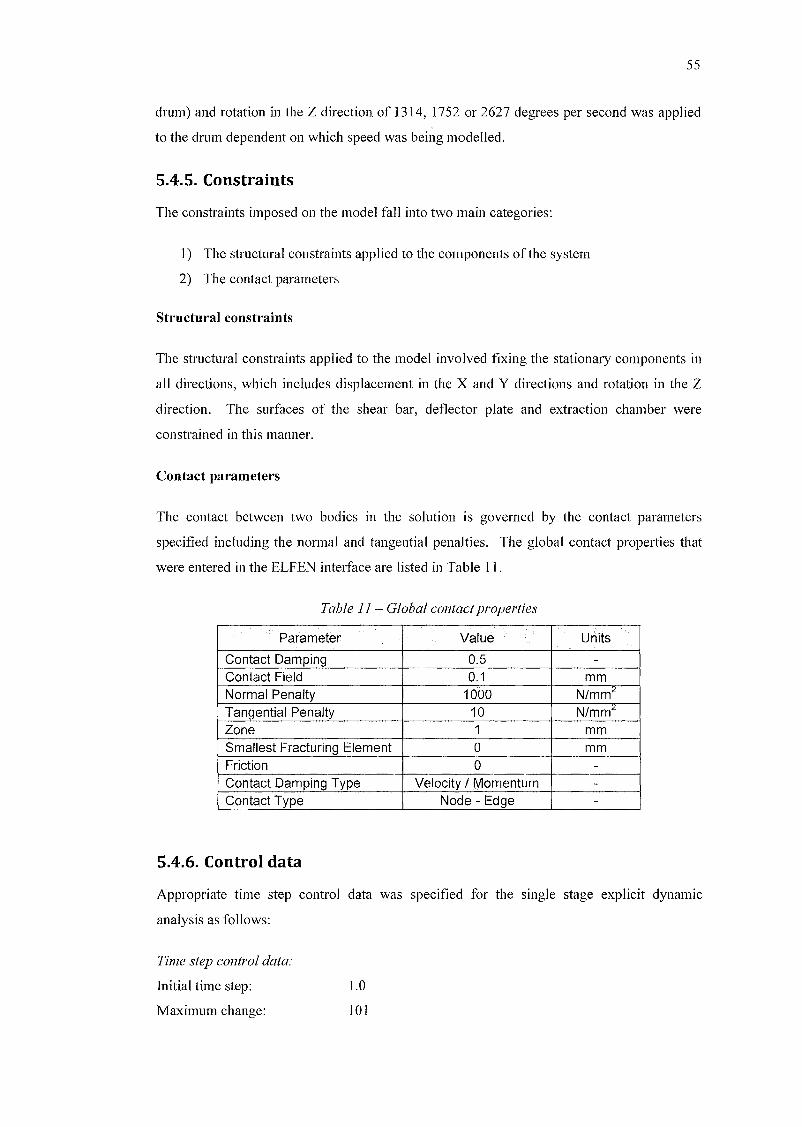
55
drunl) and rotation in the Z direction of 1314,1752 or 2627 degrees per second was applied
to the druln dependent on which speed was being nlodelled.
5.4.5. Constraints
The constraints ilnposed on the lnodel fall into two lnain categories:
1) The structural constraints applied to the cOlnponents of the systelTI
2) The contact parameters
Structural constraints
The structural constraints applied to the lTIodel involved fixing the stationary components in
all directions, which includes displacelnent in the X and Y directions and rotation in the Z
direction. The surfaces of the shear bar, deflector plate and extraction chalnber were
constrained in this lnanner.
Contact parameters
The contact between two bodies in the solution is governed by the contact paralneters
specified including the nornlal and tangential penalties. The global contact propel1ies that
were entered in the ELFEN interface are listed in 'fable 11.
Table 11 - Global contact properties""
Parameter .... Value Units
Contact Damping 0.5 -Contact Field 0.1 mmNormal Penalty 1000 N/mm2
Tangential Penalty 10 N/mm2
Zone 1 mmSmallest Fracturing Element 0 mmFriction 0 -,Contact Damping Type Velocity I JYlomentum -Contact Type Node - Edge -
5.4.6. Control data
Appropriate titne step control data was specified for the single stage explicit dynalnic
analysis as follows:
Tinle step control data:
Initial tilne step:
MaximulTI change:
1.0
101

56
Factor of critical tinle step: 0.2
Ternlination Data:
Maxitnuln no. Time Steps:
Tertnination Tilne (s):
Output Control Data:
SxlOE
(0.3 for tests 1, 4 and 7) (0.25 for tests 2, 5 and 9)
(0.2 for tests 3, 6 and 9)
Result Data:
Plotting Data:
Screen Output:
Step
oo10000
Tilne
0.001 (output result data every tllousandth of a second)
0.001 (output plot file every thousandth of a second)
o (screen output every 10,000 steps)
5.4.7. Element deactivation
The cutting of the cane stalks is extrenlely difficult to accurately lnodel due to the nature of
the cane Inaterial, and the unknowns about the underlying forces in the cane fibres which
influence the cut. It is due to this that area based elelnent deactivation was einployed to
represent the cut in the ELFEN Inodel. This theory was based on the deactivation of cane
stalk eleinents residing in a specified area ,at' a cettain tilne. A set of deactivation areas and
corresponding tiines were developed 'for each druln speed, where the cane stalk eleinents in
front of the knife tip were deactivated as the drlun rotates. Once a set of eleinents across the
entire width of each stalk were deactivated, the ,cut of that stalk is essentially conlplete, and
the cut off billet is free froin the reinaining stalk in the feed train.
5.4.8. Analysis
The finite element Inesh was generated, along with the data (.dat) and neutral (.neu) files that
contain all the relevant infoflnation concerning the tnodel. The explicit silnulation was then
activated froin the conllnand prompt, beginning the solving of the lnodel. The solution tinles
of the models ranged froin 24 hours for the fast druln speed to 48 hours for the slow druln
speed.
5.4.9. Post-processor
Once the solution was cOinplete, the post-processor was used to exainine the results obtained
at the explicit tilne intervals. The result of lnain interest was a silnple view of the position of
each cotnponent at each tilne interval. An anilnation of the cOlnponent paths was produced
to give a dynatnic picture of the billet trajectory. Also of interest was a plot of node
velocities over the tilne intervals.

57
5 .. 5 Results an d·sc ssion
At 9 ITIodels run successfully producing result files which were ana ysed at each e plicit
time intervaL The pi °nlary objective of the fi lite elelnent 1110dellir g was to predict the
trajecto y of he billets throughout the systelTIo Figure 34 34 and 35 show the bille
tlajectories at sleeted fme 'intelvals for th three drum curves runni g at the fast lnediu111
and slow drutn peed respectiv ly. It is clear frOJIl the billet trajectorie seen in these three
figur s that there i no recycrng of bIllet around h cllopper druJTI and a bilets are
clear _d frOlTI the drun travellino in close proxin1ity to each other. This is a positive res It as
it aligl1s with the trajectory desired for the single druln chopper systeln.
Th ard r at w ich the bille a1" projected 0 t of tlIe c]lopper folIo a patt I for all 9
odes \vhere -he bottOlTI billet in feed leads the other tV\I'O billets it to the e traction
chanlber~ Analysis of the cutting process reveals that the top two bill ts are not prbject d out
of t1 e chopper un jlhe bOtt01TI bil et i cut. I-Ience th upper billets are S0111ewhat pushed
do\ n onto the bottoln bIllet during tIle final stages of the knife's approach to ard the sl~ear
bar. Sue 1 eOll1preSSJon of billets is luore prominent for drlUTI curve 1 where th top billet is
COlltacted by t le druln curve earlier due to Its flatter, Jllore protruding shape.
Drul1J CurV', Dru111 Curve 2 Drunl Cur e 3
I,"
Figure 34 - Billet trajectol resultsfor thefaSl drlnn speed (43 rpfn)

Drlun Curve I DrUlll Curve 2 Drum Curve 3
58
'/
I,,;'I/
Figure 35 - Billet h'"ajecto.1)) resultsfor the lnediU111 drurn speed (292 rpJn)
Drunl CUIve 1 DrUIn Curve 2 DrUITI Curve 3
/ I
Figure 36 - Billet trajectf?}J) result· for the SIOM) clruJ11speed (219 71,1111)

59
A desired t "ajectory 's judged by the location at \~/hjch the billets ilnpac th back wa I of the
extrac ion chatnber. The desired JocatioJ-of i ~lpact is il ustrat d i igure 37. At alysis of
the r suIts shows that an Increase in drtnn speed results' in a higher ilnpact point on the back
wa 1., Them,ediul11 and slow drUTIl speed provide desirabl trajectorie, w-ith 'he billets
conta til g the bac wall well wi hin the H) i s of th contact ZOJ e. How v T, t e bIllets
projected b the high drun1 peed tall nal1·owly into tl e upper lin1it of tJ e impact zone on he
back wal. The requirement of ariabJe d "lun spee S Ineans that a sillgJe etting of design
a Id operational variables vvhich provid he desired billet trajectory is no acllievable. The
fact that a successful traJectory a found for the t11edjulTI and slo\ drUIll speed tneanshat
the slightly high trajectory of the fast drum peed can be accepted for the des·gn.
A higher trajectory and inlpact point wa seen for drU1l1 CIfve 3 o111pared to that of drUlTI
curves 1 and 2. Whit t the difference as not significant enough 0 caus any of the billets
to travel out 0 he desired ZOlle its influence lnay prove critical in the fine lUling of the
concc,pt for ariablc operatIonal paralnc_,crs.
De ired billetinlpact zone
Figure 37- Desired location ofbillet contact on extJ action chanlber back 11 all
he veloc.ity of eac.h billet prior to ltllpact on the b~ck wall W:l. c1eterlnlned fronl the lTIodel
a d the I u]ts are illu trated in Table 12. A e rpected the velocity 0 ~ he bill t5 incre-ased
as the dr ]111 speed increased. The bottOlTI billet wi ich is p '"ojected out of tl e chopper first
calTled the hOgIest speed for all 9 lnodels. TI e top billet was nleasured to have the lowest
speed Seh a feed position depelldant trend in billet v ocitie can be att ibuted to the ,vay

60
in which the billets are thrown out of the druln. As previously discussed, the nlotion of the
upper two billets is stalled until the bOttOlU billet is cOlnpletely cut. Hence, their velocity is
reduced during this tinle, unlike the bottom billet which is thrown out iJnnlediately after it is
cut. This has ilTIplications toward the affect of pour rate, or feed thickness, on the trajectolY.
There is a thought that the increased impact velocity of the billets on the back wall luay
result in daluage to the billets, yet the exact affect of this is unknown. Prototype testing is
required to quantify t11is affect.
Table 12 - Billet velocities upon contact with extraction chanlber 1vall (Jl1/S)
Drum speed Fast Medium SlowDrum curve 1 2 3 1 2 3 1 2 3Top billet 14.5 15.1 15.5 9.8 13.5 9.7 5.7 6.1 5.2
Middle billet 17.8 16.4 16.1 11.9 14.0 12.8 8.2 9.7 6.9
Bottom billet 19.5 17.3 16.5 15.6 15.0 13.4 10.7 11.8 11.9
5.6 Conclusions froID the dynalDic Inodelling
An explicit finite eleluent nl0del of the chopping and throwing process of a single druln
chopper system has been developed in this chapter. Although the finite elelnent ~nodels have
provided a set of trajectory results for the single drum chopper, it IUUst be considered that a
large nUluber of assulnptions were luade in the lnodelling and the cutting process was highly
idealised. Whilst experilnental validation is required before the results froln the lTIodels can
be cOlnpletely accepted, the results are positive toward the proposed single druln chopper
concept, giving confidence to construct a prototype. The following conclusions can be
drawn fronl this chapter:
1) No recycling of billets was seen for the set of geonletric and operational paralueters
tested.
2) An acceptable trajectolY was displayed fro91'aIi 9 nl0dels, with the billets itnpacting
the back-wall of the extraction cllalnber in the desired zone.
3) The billets are projected in close proxilnity to each other, essentially resulting in the
lnaterial being thrown into the extraction chalnber in 'bundles'.
4) Increased billet velocities were seen for higher drum speeds.
5) The lnotion of the upper billets in the feed is stalled lTIOlnentarily during the final
stages of the cut until the bottoln billet is cOlnpletely cut.

61
PROTOTYPE TESTING
Abstract: This chapter describes the develop1nent and experilnental testing ofa prototype
of the proposed chopper systenl. The affect of a nU1nber of operational and design
para1neters on the efficiency and quality ofthe cut is assessed under full capacity conditions.
A clear explanation of the causes ofbillet dall1age during the single dru111 chopping process
is presented and conclusions on the effectiveness of the proposed single drull1 chopper
syste111 for use in a sugarcane harvester are 111ade.

62
6.1 Aims
The objective of this chapter involves the developlTIent and experitnental testing of a
prototype single druln chopper systeln. The specific aitns of this chapter are as follows:
1) To provide the functional design for an operational prototype of the proposed single
drulli chopper systelTI to be constructed.
2) To develop an experitnental plan that provides objective results and valid
conclusions froln the testing of the prototype.
3) To deterlnine the effect of a number of design and operating paralTIeters on the
performance of the chopper system. This includes validation of the billet trajectory
results found using the finite elelTIent InodeL
4) To gain an understanding into the InecllanislTIS present during the single knife
cutting process and ultimately the causes of billet dalnage.
5) To quantitatively and qualitatively COlnpare the performance of the single drulTI
chopper systenl against that of current dual drulli chopper systelTIs.
6.2 Apparatus
The apparatus used in this set of experilnents was a specifically designed and constructed
operational prototype of the single drum chopper systeln detailed in chapter 4. The
functional design of the prototype was conducted as part, of this study and the detailed design
and construction was cOlnpleted by external consultants. The full scale prototype was
required for accurate silTIulation of the real systelTI, as a change to any of the lnain
operational paralTIeters or cOlnponent geolnetries of the design would give results that would
not resetnble those produced by the reco111mended concept. On this note, although lnost
design specifications are required to be full scale, a reduction in width of the chopper druln
and feed is expected to have lninitnal itnpact on results. Reducing the width of the systeln
lnakes for a lunch luore controllable experiment that requires less cane and labour and also
reduces the cost of lnanufacture of the prototype.
The prototype chopper system was mounted in a stationary fraIne, of which whole stalks of
cane were fed into. This stationaly test rig (shown in Figure 38) allowed for a ll1uch 1110re
controllable experiJnent c0111pared to that if the prototype was fitted to a harvester.

63
Chopper DruB]
Figure 38 - Ge0J11etri'c nl0del andphutograph ufth ~ jJrulul pe chuJ}per ::J)I~,.'eJn le~t ri~
Chopper sys em
The chopper systelTI lsed in the test l'g was a reduced id h full scale prototype of he
propos d chopper drum for "nstallatiol1 in a harvester. The r,educed ,v"dth of300 J111TI instead
of the industrial systeJl width of 900 tUtTI is the only change to the proposed chopper druln
detai ,ed in chaper 4. iigure 39 shows the chopper druITI in th, test rig.
Figwlfe 39- Prototype chopper dl ton

he dy lamlC ITIodelling r suIts suggested hat a change in geornetry of h· dr 111 inn r curve
has an affect on the traje tory of the ll1aterial into tle separation chamber. herefore, three
replaceable sets of inner CIfve p ates~ eacl1 having different geometries were COlstructed for
tlle e perunents.
Figure 40 Replaceable inner drun1 CUI1 e plates (three different geolnet1"ies)
Tl s11ear ar will be pivoted as specified in th design of the systel' inc lapter 4, yet a 1
adjustlnents \\rill be Inanua] \ i Jl no need for t le autolnatic system at his stage of concept
esting. Sl111i1arly the sharpening systeln'- ill not be required for this stage of testing and Jlas
therefore not been includ d on the tes r g.
Figule 41 - Te t rig 'hear bar andpi ot
The choppe· drUlTI i pow'er d by a 18.5 kW e ectric Inotor \v"th ac<colnpany'ng variable
sp ed control. This allows for eas accurate adjustlnents of chopper drlilnpeed. A
reduct.jon gearbox of ratio 5 4: 1 reduces the electr'c lTIotor speed to the range 'of req .Ired
ru TI. speed of 0-500rpln. A spidel coupli 19joins the gearbox output shaft 0 the druJTI shaft
to account for an'y StnalllTIlsal"gntnens and sudden applications of torque.

65
FigUl e 42 - Te t J ig electric 1110101"; gearbu piller coupling and variable speed control
Feed systenl
The feed systetTI of the test rig 'was required t~ closely represent the feed tra-"n in a harvester
and a cons ant rate oflna_erial being forced into the chappel as essenti8L To 1110, t clos Iy
rep ~esent the harvester feed tlain, harvester feed 4 0lIer and Hlotors inelud'ng orad] sand
tTIounting 1 echanislllS were used on he -est rOg. The lniddle section of he origi laIty 900
111m wIde rollers alld cradles \vas cut 01 t to rnake 300 mIn ide components as sho\ n in
F gure 43.
Figure 43 Test rig reduced 11 idth.feed roller and cradle

66
The top rollers are positioned with respect 0 the drum a they would be if the prototype was
nl0u]]ted in a harvester. The angle of the feed train also represent the 45 degree angle of the
top of the feed traj 1 ir a tTIodern sugarcane harvester. In order to accelerate the bundle of
stalks up to a constant speed before the enter tl e drum all0ther pair of rollers is positiol1ed
two lneres in front of the top pai~.
op pair ofroll rs
Botto]]] pai ofro lers
Figzlre 44 - Test rigfeed train
All rollers are driven b~ standard har e ter Char... ynn h~ draulic rnotors. These _motor~ ar
powered by a stand alone lydraulic power pack. _he· po\¥er pac· ha a COllstant speed 18.5
I W electric Inotor po"v ring it and the amount of flo\v to the hydt aultc. motors roller speed)
IS chaged ia a ecyc,Je adjustment lever on the power pack. A cent'·o] leer 011 the po er
pac,k activates the rollers in eithe forward or rever e

67
Controllever
Figure 45 - Test rig hydJ aulic roller n1otol sandpo1tverpack
Se ara ion chamber
An e trac lor / cleaning systelTI as no used In the prototype t ·ia s a i ]s not necessary for
.his stage of syste 1 efficiency t sting. owe er the s] ape of the xtraction I separation
chaIn.ber was replicated so as the trajectory of the bIllets into the ara could be recorded.
TJle pan oft e challlber that wa replicated and t It; t~~l rig (;]](1 llber are -'hown in Figure 46.
The test rig replicate chanlber as not cUl\l,ed like that on a har ester due to the narro
id h of the p: ototype drunl and the negligible effect a cnrverl hRck plAte ,"'ould ther fore
have.
"Figure 46 - Horvp.slp.r /;;PjJOratinl1 chanlher and te..~t rif! replicate
6.2.111 Instr mentation and recording devices
High Speed Photogra by
An ullderstand.ing of hat is pI ys ·cally happening to the stalks as they arc cut by the chopper
is essential in the analysis of the chopper systelTI. To gain a clear view of the cutting

68
proc 55 high speed pho graph. is required as ,h hip-h rotational sp. eds of the drUl11 result
In up to 22 cuts per second for the astest drU1TI speed.
A specialis high speed colour calnera (Pi otro Fastcanl SA .1) was llsl?d dUling th~ Lestillg
and footage wa recorded a 2000 f 4 atnes per second. High po J red halogen lighting \IVa
used to iI1u1l1inate the recorded area and after eac 1 run he c.aptl red video _as dOV\/n lo3dec1
directly to a COlllputer with Pho Ton software installed. A cut out in the side wall of th ATR
as shown in "igure 47 a110 ed viewll g of the CJ ing proce s.
Figure -7- uf out in the side ofthe ATR 11 all and high speed calnera and halo en light
setup
High peed photograplly was taken of the cutti 19 area for each 0 he tests. xtra runs \vere
cOlnpleted for high speed faotag ofthe billet traj ctory to be recorded.
Nor a speed )hotography
A conv ntional 'nonnal sp ed ideo catnera ;vas U ed to record the lna erial trajectory into
he extraction chamber for each of the 36 tests. The cal1era lsed ;vas a NC digital
caITIcorder.
6.3 Description of tIle experilllent
6.3.1. Variables
This exp rll11ental inve tigaion was catried out to determine ho effei e the si gle drUlTI
chopper concept 1. at hilleting L ugarcane. he outputs lOin the experinlent \¥ere _nass loss
billet qua ity and bi let length data as w II as high peed footage of he cutt'ng process and
trajectory. The lnass loss billet quality and billet lengtl distribu ion data obtained fro n eacI
test are the dependen qual ti atlve ariabl s~

69
An ul1derstanding of the factors affecting the quality of cut produced by the single druIll
chopper prototype is vital in assessing the root causes of losses froln the systeln. The
controllable independent variables that contribute to the variable ITIaSS loss data were drUID
setup (drun1 inner curve geolnetly), druln speed and Inaterial pour rate. The levels selected
and the units of each independent input variable are shown in Table 13.
Table 13 - Levels selectedfor each independent variable
Independent Variables Unit Level
Druln setup, Dgeom - D1, D2, D3
Material pour rate, PR t/hr 150,300
DrUln speed, Ndrum rpIll 219,292,438
Drum Curve Geometry
As previously discussed, the geolnetry of the arIll inner curve on the drllln is expected to
influence the trajectory of the billets out of the chopper. The prototype drUITI has been
designed with three different shaped replace,~ble curves, and each of these will be tested.
The three curves will be referred to as D 1, :p2 and D3. Where D1 is the lnost protruding
(flatter) curve, D3 is the least protruding (lnost curved) curve and D2 is the curve whose
shape is between D1 and D3. Each curve will he run fa£' an equal nUlnher of tests.
Pour Rate
Pour rate can he described as the mean material processing rateiof the harvester. In Inore
specific tellns, pour rate indicates the rate that gross n1aterial that travels ~p the feed train
and into the chopper. This rate is higher than that Ineasured at the output froll1 the harvester
elevator due to significant Inaterial being expelled out the extractors during green cane
harvesting.
A constant feed roller speed of 190rplTI was used throughout the trials as this speed
represents the upper range of the speed 1110st CUITent harvesters are running their feed rollers
at. A rotational speed of 190rpITI on the feed rollers equates to a peripheral speed of 7.9
kln/hr, which exceeds the harvester ground speed during cutting (usually around 5-6 kn1/hr).
Knowing that a standard harvester delivers on average' 100 tonne / harvester engine hour' of
cane to the siding, an estimate of the gross Inaterial pour rate can be found by extrapolation.

70
ASSUlTIing a harvester is cutting around 80% of the tilne that it is runnIng, and that
approximately 20% of the gross lTIaterial is being relTIoved by the cleaning systelTI, the
average pour rate equates to around 150 t/hr. The maxitTIUlTI potential pour rate that can be
fed through the harvester can be detertTIined by calculating the maXimUlTI lTIaSS flow rate
along the feed train. This is achieved by deterlnining the volume feed rate with the rollers
fully open and assunling a constant feed roller speed and bulk density of the cane and trash
mat. Using a bulk density of 450 kghTI3, a set roller speed of 190rplTI, and a lTIaxilTIUlTI
roller opening of 150 lTIlTI, a theoretical capacity ill green cane of the harvester feed train is
calculated to be apprOXilTIately 400 1Ihr.
The lilTIitation of power delivered to the rollers and slippage between feed train and tnaterial
tnat indicate that this lnaxitnuln theoretical capacity would not be sustained in a harvester
without stalling or choking. Previous BSES findings llave shown that the starve-glut nature
of the harvester feeding pattern resulted in a maxitnUlTI sustainable pour rate of
apprOXilTIately 130 t/hr. As this research was done over 10 years ago, and with the
advancelnent of harvester power, it can be assulned that a current day harvester could handle
a sustainable pour rate of 150 t/hr.
The pour rates to be used in this testing progranl had to represellt realistic values of what a
chopper systeln in a harvester is seeing. Therefore 150 t/hr was chosen as a lnean harvesting
rate, and 300 t/hr was chosen as an increased rate that could be caused by 'gluts' in the feed.
Achieving each pour rate in the test rig trials required feedillg bundles of a calculated nlass
into the systenl. The stalks used for the testing were 2 Inetres long, and by calculating the
nlass rate of lnaterial through the 200 mIn wide feed,.chanuel (reduced [roln 300 lTIlTI to
elinlinate stalks travelling around the chopper druln), target bundle.-sizes of 8.46 kg and
16.92 kg were chosen as they equate to pour rates of 150 t/hr and 300 t/hr respectively.
Table 14 - Pour Rates and Corresponding Target Bundle Weights
P()urrateeqtiivalent(t/hr)
150
300
.JI.
Target buridle\veight (strippea stalk) (kg)
8.46
16.92

71
Drum Speed / Billet Length
As the feed train has been set at a constant speed, the target billet length for each test is
determined by varying the drum speed. With a recent push within the industry for sholier
billets and higher bin weights, billet lengths at the shorter end of the scale will be tested.
Three billet lengths will be tested, these being 200 lTIlTI, 150 tUlTI and 100 111tU.
The 200 tUtTI billets are a representative of what InGst cotnlnercial harvesters are currently
running at when cutting and cleaning green cane. The 150 lUtTI and 100 mIn billets are the
billet lengths which luay be aitTIed for in the near future with the introduction of whole-crop
harvesting requiring the shorter billets to lTIaintain bin weight. The target billet length for
each test is determined by varying the druln speed as expressed in Equation 3 in section
4.3.1. The chopper druln speeds that correspond to the target billet lengths are listed in
Table 15.
Table 15 - Target billet lengths and corre~pondingchopper drulJ1 speeds used in the testing
Variety
100
150
200
438
292
219
18.35
12.23
9.17
The physical characteristics of the variety used for the testing will have an affect on the
results due to the cutting procedure having such a harsh interaction with each stalk.
Propel1ies such as fibre and juice content, stalk size (diameter) and brittleness / toughness
will all affect the-chopping process. Due to the restricted tilne line for the experin1ents to be
cOlTIpleted in, a single variety was used for all the tests. Q 183 was chosen as it is a COtTIlTIOn
green cane variety, with standard stalk size, lTIoderate toughness and standard fibre content
(14-16%). The cane used was grown at the BSES in the Burdekin and alltnaterial used for
the tests was cut [rotn the same section of the block.

72
6 .. 3.2. Experimental procedure
Sam, Ie p.·epara· ·on
Th,e bundles ere created by firs strippingth stal ,a d placing th ·ITI Olle aftet anotller onto
a set of scales until th closest value to the target, eight was reached. Although t is
repr s nt a pour rate of pu -ely stripped cane i as 11 cessary t record this 11)aSS for the
quantitative tnas 10 s calculations, Onc the staIrs were eighed trash was tecombined
anlongsl th slalks and th undlt tit:d up wit baling lW'llC;; a~ shown in Figure 48,
Figure 8 Large Bundle 300 t/hr equi1 alent)
igpreparation
TIl fIg and SUlTOUl ding area as slept cl an of allY trace of billet or stalk fragnlent fron1
th . previous test. The chopper's elll op rational var'able inclu.ding th dIU]}1 eu ~ve feed
roller peed and drum speed W Te set as 'equired for each test. General 111aintenancewas
done on the rig benve n tests to ensut,e each est was COl sistent and ran afe] : Bolts on tl e
chopper drulu an,d shear bar were tensioned bet\veen each fun and the elearance bet\veen the
1I1IVeS and the Slear ba . was regularly 1'n.on'tored, The edg on the 11i es as maintain d
by regular filing betw en tests,
The bundle ,as Jlaced a, ually into .he bottoln set of ~ollers while the rig was tUlllt:.d u r., he nonl1al speed canlera was tUll1ed on and set to record. The hydraulic powel pack wa
then stal1ed 11sur l1g the control le ler ' as ill the off position. The chopper dru wa then
turned on and alIo,· ed to ind up to the desired speed as set all the electric 111otor variable
peed control. Ttl high speed calnera as set to r cord and the feed con rollever was then
activated, Once he whole bund had bee fed through the chopper both catneras ere
trIggered to stop recording and the rig was s1 ut down and locked out.

73
Data collection
The footage from both calneras was downloaded to the connected cOlnputer between tests
due to the large 'size and therefore increased transfer tin1e of the high speed video files. The
chopped lnaterial was collected froln the output of the chopper and all billets and stalk
fraglnents were collected froln the rig and surrounding area. All lnaterial froln each test was
placed into a sorting tray, froln where the billet quality analysis took place. Once sOlted,
photographs were taken of selected billets and lnass recordings and billet length data was
collected [raIn the sample.
6.3.3. Experimental design
The following experilnental design was selected to obtain data which can provide objective
results and valid conclusions with lninilnal expel1diture of tin1e and resources. The lnodel
which describes the nU111ber of experitnental conditions required is;
Eqn. 1
Therefore, the nUlnber of tests required for the experiInent is:
3Dgg,om x 3Nd1-'U:1tl X 2PR x 2Repeats = 36
Therefore, there are 36 experilnental conditions required to deterlnine the effect of the three
independent variables on the lnass loss and billet quality produced by the prototype chopper
system. Table 16 details each experitnental test and the cOITesponding variables.

74
Table 16 - Prototype testing experinlental plan
Test Drum Feed Billet Feed Roller Target Bundle Drum SpeedNo. Curve Rate-(t/hr) Length (m) Speed (rpm) Weight (kg) (rpm)1 1 150 0~2 190 < 8.46 2192 1 150 0;2 190 8.46, 2193 1 300 0.2 190 16.92 2194 1 300 0.2 190 16.92 2195 1 150' 0.15 190
,<
8.46 2926 1 150 0.15 190 8.46 2927 1 300 0.15 190 16.92 2928 1 300 0".15 190 16.92 2929 1 150 0.1 190 8.46 43810 1 150 O.
','190 8.46 438
11 1 300 0.1 190 16.92 43812 1 300 0.1 190 16.92 438
:13 2 150 0.2-".'"
~190 8.46 21914 2 150 0.2 190 8.46 21915 2 300 0.2 190 16.92 21916 2 300 0.2 190 16.92 21917 2 150 0.15 190 8.46 292
:',
>' I,
18 2 150 0.15 190 ::' 8.46 29219 2 300 0.15 190 16.92 29220 2 300 0.15 190 16.92 292
': 21 2 150 0.1 :190< ':, 8~46 438'22 2
':'
150 0.1' 190 8.46 ,43823 2 300 0.1 190 16.92 43824 2 300 0.1 190 16.92 43825 :,,:,3 150 0.2 190: 8.46 21926 3 150 0.2 ~' 190-
' ~,
8.46 21927 3 300 0.2 190 16.92 21928 3 300 0.2 - " 190 ,16.92 21929' 3 150 0.15 190~
,;,:<,<':,~,.":, :':"8.46 292
30 3 150 0.15 190 8.46«<':"' 29231 3 300 0.15 190 1<6.92 29232 3 300 0.15 190 16.92 29233 3 150 0.1 190 8.46 438
",34 3 150 0.1 190 8.46 43835 3 300 0.1 190
,',
16.92 43836 3 300 0.1 190 16.92 438
6.3.4. Quantitative experimental outputs
Cane and Juice Losses
The alnount of Inaterial lost through the chopper systeln is one of the lnost ilnpoliant factors
when considering the efficiency of the systeln. Material lost through the systeln includes
predolninately calle (fibre and rind) and juice. Reducing these losses sees the efficiency of

75
the harvesting operation increase and therefore nlore of the cane in the field lnakes it to the
lnill, providing advantages to all involved in the growing, harvesting and lnilling processes.
To quantify the losses associated with the chopping process, mass balance techniques were
used, where the lost tnass is deternlined as the initial nlass of cane lnillus the final lnass of
billets and large billet pieces.
Eqn.5
Billet Quality
The quality of the billets exiting the chopper is ilnpo11ant when assessing the effectiveness of
allY chopper systeln. Billets that are dalnaged (squashed, split or broken) are lnore
susceptible to deterioration in the tilne between harvesting and lnilling and therefore dalnage
to the billet is not desirable.
In order to gain a representation of the amount and extent of dalnaged billets, the guidelines
used in previous chopper research (Backings and Davis, 1999) were adopted and slightly
tnodified for the sholter billet lengths. These guidelines require the chopped Inaterial to be
collected and sOlted into three categories based- on how datnaged each billet is. These
categories and their respective guidelines are listed below.
Sound billets
LOllger than 50% of target length
No splits longer than 80 lUlU (other than grovvth 'ctacks)
No large sections of rind relnoved
Minitnal squashed ends
Daluaged billets
Moderate splits
Slightly squashed ends
SOlne sections of rind retnoved (not longer tllan 25% of billet length)
Mutilated billets
Broken billets
Badly squashed ends
Pieces of stalk / fibre no longer in solid stalk forln

76
Once the salnpl had be"en sOlted Into the three categol"ie's t11e "lnass of each was recorded.
The asseSSlnen ofbiUe quality was undet1aken by the sanle personneJ for all tests to ensure
the interpretation of the qualitative ass·eSSlnent criteria was I epeatable and consistent Figure
49 sho\vs a salnple after being sorted using th,e above lnentioned billet qualIty criteria.
Figure 49 - San pIe after being sorted into billet quality categories
Billet length distribution
A quantitative representation Qfbillet length distribution is va.luable in assessing the feeding
characteristics of the chopper system and al.o fot prediction of bulk density of the chopped
nlatel ial. To provide a detailed understanding and analysis of billet length the sound billet
were sort.d into length dep ndent categories of: 0-25 mln 25-50 [TIm 50-75 n1111 75-100
nlm~ 100-125 Innl, 125-]50 Jnnl 150-175 111111 175-200 lnn1 200-225 ffilTI and ]ollger than
225 ]nln~ The biUets in each category were then weighed. A weighted tnean billet length
was calculated as weI. as a weighted bIllet length distribution.

6.4 Results
The quantitative results for each of the 36 experilnental conditions are shown in Table 17.
Table 17 - Quantitative experilnental results
77
DrUIIlDrUlTI Feed rate
Mass lossMass
Mass % Mass.% Mass %curve
speed equivalent Replication(total %)
lossper Sound Dalnaged Mutilated(rpm) (t/hr) cut (%)
1 5.98 1.20 49.28 27.27 17.46150
2 1.21 0.24 68.93 19.42 10.44219
1 2.67 0.53 59.65 19.04 18.64300
2 0.85 0.17 70.28 13.59 15.29
1 0.48 0.07 58.57 23.33 17.62150
2 3.11 0.47 63.70 24.89 8.301 292
1 11.64 1.75 49.46 18.44 20.46300
2 3.73 0.56 54.30 16.84 25.14
1 7.40 0.74 32.65 18.37 41.58150
2 5.01 0.50 31.03 20.05 43.91438
1 10.30 1.03 31.34 25.59 32.77300
2 6.39 0.64 29.81 25.58 38.12
1 4.18 0.84 58.97 16.46 20.39150
2 3.34 0.67 62.21 18.77 15.68219
1 3.37 0.67 59.59 20.36 16.69300
2 5.47 1.09 54.65 22.37 17.51
1 4.73 0.71 67.13 9.92 18.22150
2 4.93 0.74 61.86 16.72 16.492 292
1 11.49 1.72 31.57 34.97 21.97300
2 7.96 1..19 30.50 40.54 21.00
1 14.40 1.44 14.40 ·22.51 48.69150
14:6'92 13.59 1.36 31.09 40.64438
1 14.62 1.46 14.43 36.85 34.10300
2 17.04 1.70 16.92 28.61 37.44
1 4.82 .p.96 33.13 51.67 10.38150
2 3.50 0.70 28.27 58.64 9.58219
1 8.02 1.60 61.06 8.45 22.48300
2 5.34 1.07 28.76 53.16 12.74
1 8.85 1.33 26.78 37.35 27.03150
2 7.04 1.06 17.16 42.00 33.803 292
1 10.55 1.58 30.34 24.27 34.83300
2 8.55 1.28 36.27 26.94 28.24
1 18.15 1.82 10.76 31.29 39.80150
2 18.72 1.87 7.88 32.76 40.64438
1 22.12 L.21 9.70 23.42 44.76300
2 16.95 1.70 13.34 22.19 47.52

78
6.4.1. Tota cane and juice 10 ses
The cal e and j'Jice loss s responded in a ell defined luanner at every level tested and every
c0111binat" n alTIOngs variab es, The a erage totalma loss of the 36 ests was COl puted to
be 8.24%. Aid ough here i SOlne difference in losses bet\i\feen replicated tests'J trends \ ere
observed bet\\/ee 1 inp 11 I v Is. One of these rends ·s delTIonstrated in Figure 50 11'er,e the
Illean total Blass is Sl10Vvll for .he hree 1 v Is of drurn speed tested
Effec of rum ,speed (daa m:ea--' :s' -ota'imass Iloss
16 -
14
12-Q~ 10V1r,n0 8.......VIVi 6~:
4
2
0
4.06
100/438 50/292 200/219
Target '"net Le g h (mm) I Choplper 0 1,.1 Spee ( m)
Figure 50 - Th~ effect oj'chopper drU111 5peed on the lnean value oftotal 111QSS loss
Eacl1 POil t in Figure 50 repr sell t le ll1ean otal 111a loss for eac chopper drUBl spe~d
level. The do ed lin . 's the overall Inean of all the tests. A 111ar ed d·fference in ass loss
can be seen etweet the tueans of the three Ie 'eIs of dru n speed. A peak 1.. a- s loss of
13"720/0 was found f01 he high st e ted drulll speed an tninilnu1l1 1 as loss of 4.06% was
r corded for the 810 I st drUJll peed With the middle drum peed resulting in a lnas loss
recordIng bet\~e,en he upper aLd 10 er extren1es it can b concluded' .hat a positive trend
e Fists bet een chopper drU1TI speed and lnea otal lnass loss. Hence, aalys s of the 11leas
has indicated that the amount of cane and juic lost throuo-h the sy ten1 i dependent on
chopper d Lun speed. As drUJ11 peed is inversely rela ed to target billet leI gth it can be
cone] uded that a tlegativ trend exists between target bill t length and tota nlas los.
As with the cl app r drun1 speed the effect of pour rat 0 total Inass loss can be determined·
by studying the Ineal1 of each tested Ie. el. Figure 51 ShO~lS the Inean _otal 111ass loss fo
each po rate leve "

79
ect of· au rate eq Yva e t (a mea ·s) 0 a al mass ·oss
109
876 5
43
2
1a
7.19
9.28
150
Po rate nt ·(t! r)
300
Figure 51 - The effect qf"poUJ 1ate on the 111ean 1alue of fotal111as loss
A positie trend bet 'een pour rate and mean to.a] lnass 10 s can be seen in F ure 51. A
111ean 11lass loss increase of 2.090/0 was seen when the pour rate equivalent was increased
fronl 150 t/ I to 300 Vhl.
Analys S 'of he Ineans does not Pl11]'t the accep ance of the above s aed th ories~ thus
statIstical analysis ofth results is requited. As with the results in Chapter 4 tl e assutnp ion
of nOll]lality of the re ult is once again lllade to pernlit th statistical analysis. Tabl 18
shows an analysi of ariance ANOYA for otal mass loss wth respect to chopper drtnn
speed and pour rate.
Table 18 - Anal)) is of1ariance for total111GS ' loss under drznn speed andpour rate factors
or a atiable or a combinatIon of ariabl s to be deelned as significant toward the to al
Inass loss 0 Jtcollle,. the hypothesis n1ade in the ANOYA In 1st be reJected. That is, the p
valu ust be les than the probability a sociated wit 1 the 1.ypothesis (p...val = 0 05). As
both the p- alue~s for pour rate and druB] speed * pour rate ha e a p-va ue > 0.05 the are

80
deenled to be insignificant towards the total Illass loss. The ANOVA indicates that drUIll
speed has a p-value < 0.05, therefore the llypothesis is rejected for druID speed,
delnonstrating that it is a factor which significantly affects the total Inass loss. The Tukey's
Inethod was used to detel111ine which levels of druID speed caused a significant increase in
lTIaSS loss. Table 19 details a cOlTIparison of lTIeanS alld significance aIllongst levels for drU111
speed. A significant affect (p-value < 0.05) was found between the 438 rpIn level and both
the 219 rpIll and 292 rpIn levels, whereas, there was not a significant difference between the
219 rplTI and 292 rpIll levels. This Ineans that a significant increase in mass loss is seen
when the drUIn speed is increased [rolll 219 rpIll or 292 rpIll up to 438 rplll.
Table 19 - C0111parisons all10ngst levels for chopper drU111 speed on 111aSS loss
Factors
DRUM SPEED219rpm respect to:
292rpm438rpm
292rpm respect to:438rpm
Difference of means
-2.8592
-9.6617
-6.8025
Standard error
1.56843
1.56843
1.56843
p-value
0.179
0.000
0.000
6.4.2. Cane and juice loss per cut per metre
A measurelnent of total lnass loss through the systeln is useful in assessing the concept for
overall industrial efficiencies. However, when assessing the losses in the process at a single
cut level, lnass losses per cut lnust be deterInined. This qata is useful in deterInining the root
causes of losses and dalnage. The tnass loss per cut per lnetre was calc~ulatedusing Equation
5.
M ass loss / cut / fll-etre = -.-}\(uml
Eqn. 6.
The assulnptiol1 in this equation is that all billets are cut at exactly the calculated target billet
length. This assulnption, although not entirely accurate, is the only practical way to
deterlnine the Inass loss per cut per metre. As with the total Inass loss, the luean values for
each level of the variables was calculated. The plots of the Inean values of Inass loss per cut
per nletre for each of the levels of drUln speed and pour rate are shown in Figure 52 and 52
respectively.

81
, ffect 0 ru sp e _ (ata eans 0 mass loss leu 1m
0.81
1.37
0.8
1.6
~ 1.4o
1.2
U'\
8 0.6 -
~ 0.4:2
o~ J----J.-----+----...L...-.-----+-~---L---______l100/438 :SO/292 200/219
T getBii e )Ie oppe 0_ m -peed (r
Fivure 52 - The effect ofchoppel drun1 speed on n1eal1111GSS loss jJer cut
Effec 0_ --0-' r rae e iva :,e t (data mea', s) 0 massIo:ssjcutlm
1.40
0 1.20e-E 1.00....,
0.80~ -u
V\ 0.60Vt0
V\ 0.40V)n3
0.20~
0.00
1.22
0.93
150 300
Figure 53 - The ~ffect OflJOUr rate on Inean 111aSS 10 'sper cut per lnetre
Analysis of Figure 52 indicates a po itive trend between Inass loss per c t per 111 tre and
c.hopper drutn speed. The ]ne::tll nl~~~ lo~s l1er cnt per tnetre increaL es b 0.,56% 'Nhen the
chopper drulll speed is increased fl~oln 2 9 rpIll to 438 rplTI. ·ilnilarl a po ]tlve rend is
also seen in Figure 53 betwee our rate and lnass loss per cut per lnetre. An increas in
pour ra e equival 11t fl'·oi11 150 t/hr to 300 t/hr sees a O~29% increase 1n I11aSS loss p r cut per
lnetr. An ANOVA was conducted to detern1ine if the trends seen in the mean pIc are
s·gnificant

82
Table 20 - Analysis ofvariance for 111ass loss per cut under drUJ11 speed andpour rate
factors
Source OF SS MS F p-value Ho
Drum speed 2 1.910 0.955 4.171 0.025 rejectedPour rate 1 0.760 0.760 3.318 0.079 acceptedDrum speed * Pour rate 2 0.489 0.244 1.067 0.357 accepted
Error 30 6.870 0.229Total 36 51.567
A sitnilar result was found fronl the ANOVA for the tnass loss per cut per tnetre as was
found for the total tnass loss. That is, the hypothesis was accepted for pour rate and drutn
speed * pour rate as the respective p-values were greater than the assutnption of 0.05.
Therefore, these two variables are deterlnined to have an insignificant affect on Inass loss per
cut per tnetre. DrU111 speed was deterlnined to be significant on tnass loss per cut per tTIetre
for any p-value :s 0.025. Once again, the Tukey's tnethod was used to deterlnine which
levels of drutTI speed caused a significant increase in Inass loss per cut per nletre. Table 21
details a cOlnparison of tneans and significance aI)10ngst levels for drun1 speed. A significant
affect (p-value < 0.05) was found only between the 438 rplTI level and the 219 rpln level.
This lneans that a significant increase in Inass loss is only seen when the drutTI speed is
increased [rotn 219 rptTI to 438 rpIn. Any other change in variables was deetned to be
statistically insignificant towards tnass ··loss per cut per tnetre.
Table 21 - COll1parisons al110ngst levels for chopper d;"U111 speed on 111ass loss per cut per
l11etre
Factors
DRUM SPEED219rpm respect to:
292rpm438rpm
292rpm respect to:438rpm
Difference of means
-0.2267-0.5608
-0.3342
Standard error
0.195370.19537
0.19537
p-value
0.4860.020
0.218

83
6 4.3. Bit et quality
S1111iJar trends to hose observed for the tnass loss data were s en in tlle billet quality JesuIts.
That is an "ncrease 111 choppef~ nnnn speed resulted in increased dalnage and deterioration ·n
billet quality This trend is illu trated in the data ll1ean pots (a) (c) and ( ) il Figure 54.
The most affected 0 th bJ11e qualtty conditio 18 are the perc ntage of sou d and lTIutilat d
hi lets where an increase in drulll speed results in a decrease inound billets and increase in
lutila ed illets. The alTIOunt of sound bi let decreas d by 34%, (oftotaltna ) as the drUlTI
speed is incr,ea ed froID 219 rpnl to 438 rp111. This decrease in sound billets is replesented in
tle lTIutilated billets data llere an increase in 35% ofillutilated billets was seen between h
219 rpnl alld 438 rpm 1 vel. HO\NeVer the alTIOunt of dalnaged bill ts relnain~d relativ ly
con tant over the range of dr 1111 peeds ,vith less than 2% separatIng the Jna Tin1 III and
minilTIU1TI data ll1cnns., The I11ean pe.rcentage over all 36 te t of sound~ dalnaged Hlld
Inutilated bints are 38.59% 26.77% and 26.40% respectively.
:: ~o
1 .91
1--'- ----t
3.....
:3 _ 9
10U/438 ISO, 9 2 0{219 1S0 00
'out
150
150
27.92:
5.5
so
30
.... 5
~ 1S
~ 10
(b
(d)
(t)
2-. 3
3. 3
20
ltI
15L~ 5
'---1---
~·OD 1
_. ---.L--- ~
(a
(c)
(e)
Figure 54 ~ The effect 0.1dl'''U1J1 speed andpour rate on billet quality (data 111eans)

84
Analysis of the data lnean plots (b), (d) and (f) in Figure 54 show that pour rate has little
affect on the quality of billets produced. This theory can be lnade from the observation that
the data llleans of sound, dalnaged and nlutilated billets did not differ nl0re than 3% as the
pour rate was raised froll1 150 tlhr to 300 tlhr. The data Ineans over all 36 tests for the
percentage of sound, dalnaged and lTIutilated billets were 38.59%, 26.77% and 26.40%.
An analysis of variance for the three dependent billet quality conditions was conducted to
statistically define the significant factors influencing billet quality. The ANOVA's for the
percent of sound, danlaged and lllutilated billets are shown in Table 22, Table 23 and Table
24 respectively.
Table 22 - ANOVAfor percentage ofsound billets under druJn speed andpour rate factors
Source OF SS MS F p-value He
Drum speed 2 7450.521 3725.261 18.085 0.000 rejectedPour rate 1 17.963 17.963 0.087 0.770 acceptedDrum speed * Pour rate 2 403.546 201.773 0.980 0.387 accepted
Error 30 6179.705 205.990Total 36 67672.541
Table 23 -ANOVAfor percentage ofdanlaged billets under druln speed andpour rate
factors
Source. OF S5 MS F p-value He
Drum speed 2 8.104 4.052 0.027 0.973 acceptedPour rate 1 47.380 47.380 0.320 0.576 acceptedDrum speed * Pour rate 2 215".321 107.661 0.728 0.491 accepted
Error 30 4439.584 147.986Total 36 30509.174
Table 24 -ANOVAfor percentage of111utilated billets under dru111 speed andpour rate
factors
Source OF SS MS F p-value He
Drum speed 2 4056.081 2028.040 65.288 0.000 rejectedPour rate 1 23.442 23.442 0.755 0.392 acceptedDrum speed * Pour rate 2 119.081 59.540 1.917 0.165 accepted
Error 30 931.886 31.063Total 36 30218.409
The trends observed [rOlTI the data mean plots are cOllfirlned in the ANOVA for each billet
quality condition. That is, drulll speed is deterlnined to be significant towards the alnount of
sound and lnutilated billets produced, and all other factors and conlbinations of factors are

85
deenled to be insignificant toward billet quality. The Tukey's method was used to determine
which levels of drUITI speed caused a significant increase in the percentage of sound and
lTIutilated billets. Table 25 and Table 26 detail a cOInparison of Ineans and significance
alnongst levels for druln speed. A significant affect (p-value < 0.05) was found between the
438 rpIn level and the 219 rpm and 292 rpIn levels for the percentage of sound billets. This
Ineans that a significant decrease in the percentage of sound billets is seen when the drUlTI
speed is increased froln 219 rpIll or 292 rpIn to 438 rpin. A significant affect was found only
between the 438 rpin level and the 219 rpITI level for the percentage of Inutilated billets.
Therefore a significant increase in the percentage of Illutilated billets is only seen when the
druln speed is increased froln 219 rpIn to 438 rpm. All other changes in variables were
deelned to be statistically insignificant towards the billet quality.
Table 25 - C0111parisons anl0ngst levels for chopper drull1 speed on percentage ofsound
billets
Factors
DRUM SPEED219rpm respect to:
292rpm438rpm
292rpm respect to:438rpm
Difference of means
8.928333.9858
25.0575
Standard error
5.859335.85933
5.85933
p-value
0.2940.000
0.001
Table 26 - C0111parisons alnongst levels for chopper drU111 speed ,on percentage of111utilated
billets
Factors
DRUM SPEED219rpm respect to:
292rpm438rpm
292rpm respect to:438rpm
Difference of means
-7.1517-25.2242
-18.0725
Standard error
2.275332.27533
2.27533
p-value
0.0100.000
0.000

86
6.4.4. Billet lengt d stribution
Analysis of the high sp ed footage r v aled a significal t anlount of slipping etween th top
pair of feed ro'llers and the cane and trash Inat. This lack of feed ha a direct affec on the
len,gth of the b'I ets thu he, desired COl sistency alTIOl gst biI e lengths was not achieved °
The reason for the slippa e \vas put do 11 to only having one pai ,0 of feed rollers in th
icinity of t1 e dnllll. Hence this is a probleln 1110r i olated to he prototyp t st rig than tLe
chopper concept as a harvester has nume- ~ous pair of roll rs fe ding Onto the chopper 0
assist ith the f erling. 1erefote he billet length data gained froln t is e 'pel;lll nt· not
epected to be a true representation of that to be e .pected frOlTI he chopper ystenl if it were
installed in a harvester. The tests where lippage Occul1'ed a·e represented by the
distributiol1S \\f ere a la~ge percenage of the hi] s are sllolter than the targ. billet length
Th mean billet lengths were calculated for all te t8 of the thr taruet billet length
categorie and are iIlu trated in .h llistograIlls 111 Figure 55
(a) Bil e let1~1 (n IT )
CE'0c: l'u 10~c. 5
o
(b)
'!
- -
- :~
- •E • ~i •
40
~ 352
30..c'JI 5CJ
;:s 0C 1~ 10
!i..
(c)
-~
I
- -
...• E w 11
~~ $ ~ ~ ~ ~ ~ ~ ~0,,;, '),J 4Y ,,\('li;:)~' "y-9~ ~ti -;.",-x. 'l,.()r::i"'-'
lllet ,ength t, '
Figure 55 - Histogral17S' ofthe average billet lCJ1gth distribution }01 each tarcrct billet length
Larger varIability in the bOI t ength distribu ion is seen for the longer b'I ets ,he~e the
drulll speed 'as reduced. Bite~ ess than 25 111111 of the target length account fo nearl
70% of the total billet lllass for the 219 rpnl druln speed .ests. However, those les han 25
mr oj the targe' ength for the 438 rplTI drutn speed t s s accou· t fo on y 200/0 of the total

87
billet Inass. The reason for such a dranlatic increase in billet length variability as the drUlTI
speed is reduced is thought to be due to the presence of stalling of the feed at lower drutTI
speeds. Such stalling is caused by the stalks in the feed train contacting the back face of the
knife as it passes through the nlaterial, resulting in a resistance to ITIotion of the feed. The
result of this resistance to tTIotion of the stalks is slipping between the feed nlaterial and the
feed rollers, hence shorter billets are produced.
The billet length distribution and nlean billet length was found to be independent of pour
rate. The lTIean billet lengths for the drUlTI speeds of 438 rpnl, 292 rpITI and 219 rpnl were
calculated to be 85 nl1TI, 125 lTIm and 162 tTItn respectively.
6.4.5. High speed footage of the cutting process
The cutting process was captured by the high speed catnera as described in section 6.2.1.
The quality of photography and the ability to analyse each recording [ralne by franle was
extretnely valuable in analysing the cutting process and billet trajectory. The observations
Blade froln these videos are discussed in section 6.6.1. Figure 56 shows a sequence of
[raITIeS froln the cutting process of test nun1ber 11.

88

89
Figure 56- Still iJnages ofthe high 5peedfootage taken for test nUlnber 11
6.4.6. Material trajectory
Analysis of both the high speed and norlllal speed footage of the billet trajectory showed that
there was no sign of recycling, with all the nlaterial being projected into the separation
chalnber. Although the desired trajectory was achieved, the speed of the 111aterial exiting the
chopper is very high due to the high knife speeds of the chopper drum. Such high speeds do
not allow l11uch tinle for the cleaning systelll to be effective, yet when looking at the syste111
for adoption in \vhole crop harvesting this issue becomes obsolete.
Changing the drllln curves CD1,02 and 03) did not seelll to affect the n1aterial trajectory at
all. The speed of the drU111 had a slight affect on the billet trajectory, with higher druln
speeds resulting in a slightly higher trajectory of the billets. The difference in height of the
contact point of the billets on the back wall of the extraction chamber bet\veen the 219 rpnl
and 438 rplll dru111 speeds was deter111ined to be approxiIllately 150 111111. Figure 57 shows a
sequence offralnes of the billet trajectory for a 200 1111n (438 rpIn) billet length test.
A still ilnage of the ll1aterial trajectory for test nUInber 2 as recorded by the l1or111al speed
call1era is shown in Figure 58. It was observed that the billeted cane left the chopper in
bundles, each bUl1dle being a set of billets cut off by an arn1 of the chopper. This resenlbles
the findings of Hockings and Davis (1999), where the rotary chopper drUl11S \vere seen to
produce billets in bundles to the extraction chall1ber.
The billet trajectory findings frol11 the prototype testing very closely resenlble those found in
the finite elenlent nlodelling. The location of billet il11pact on the back wall of the extraction
chaI11ber is very sin1ilar to that produced by the nl0dels. The observation of the upper billet
in the feed being l11on1entarily stalled and cOl11pressed against the bottonl billet during the
final stages of the cut is clearly visible upon analysis of the high speed footage. These
results therefore validate the finite eJelnent findings to\vard billet trajectory.

90
Figure 57- Still i111.GJ!.es qf'the- hi}!,h speed.footafJ,e Qfthe billet trajectoly for a target billet
length of200 l1un (Ndrum = 438 rp111)

91
Figure 58 - Still in'lage ofthe lnaterial trajector recorded by the norl'nal sJJeed canlera
6,.5 Experimental errors
Having a lilIljt~d I~Hglh of r~~d rnat.erial iIltrouuces signifh;anl ~nd effects which corrupt the
f,esults. As the stalks enter the chopper, they rely on the feed rollers to provide then1 with a
positive elocity so the desired len.gth of stalk is eut off by the knife. However a tl e
trailing end of the stalk travels past the feed rollers it loses this applied velocity in the
direction of the feed and is suspend,ed 'n the a.rea bet\veen the feed rollers and the shear bal.
TIle result of this is that the end p011ion of the stalk is eu into fine pieces as there IS no
longel an applied vlocity pushing it tllrough the chopper. TJlis occurrenC.e is seen in the
high speed footage for the tnajority ofth,e tests.
CUtll11g the end: pieces ·of stHlk into sm~ll fragnTellts lncreases the lnH~S los~ recorc11ngs~ as the
s.l11alJ shavings are considered pieces that would b·e lost through the extractIon systelll. and
thefefore not included as recovered Blass. Therefore the lnass loss resul s are .greater than
they would be if a ~ontiJ1uous feed was b,eing applied, such as seen in industrY6 A
conti' .uous feed would act to pu h the relnaluing lengths of stalk into th·e chopper.
The distance in the feed directiol b,etween the exit of the foUers and the shear bar was
111easured to be 250 mIn. The stalks used in the experilnents were 2 n1.etres)ong. hence the

92
percentage of stalk that lacked positive feed and therefore ,va not cut in the desired nlanner
as 12.50/0. In an attelnpt to identify he piece of stalk affect d by this errOf- the ends of the
bundles were paintd orange as shown in Figure 48. This allo\ved the high speed footage to
be properly analysed as the tinle at ,vhich the positive feed ends could be identified.
6.6 Discuss·on
6.6,.1. Causes of stalk damage
Before the causes of stalk danlage can be id'entified a full understanding of the cutting
process I11US be achieved. TIlis involves understanding the relationship between the
dynamics of the drUI11 and the defoflnation behavIour of the stalk. The dynanlics of the drU1TI
incll des- the knife tip path and speed. Figure 59 highlights the key velocities present during
th cutting process+
.---------'plodty
Figure 59 - Ke}! velocitie~ ]Jl.tesenl du-ring the cuttingpi 0 e s
In order to deform tI e least anl0un1 of the stalk during the cutting process the knife nlust
travel p-erpendicular through the stalk that is there is no lonoitudinal Jll0Venlent of the knife
along the stall. If the tip velocity in the direction of the feed (longitudinal direction of the
stalk) is studied for the range of drUln speeds an understanding Into the resulting
defofluation of the stalk which is ultimate-Iy linked to billet danlage and lnass loss can be
obtained. ASSU1l1ing that the veloc-ity of the feed is constant (10 stalling) the knife tip
velocities in tlle feed direction over the range of the cut can b,e plotted a i lustrated in Figure
60.

9~
Knife til) \'elo ities ill tIle fee<.1 clirecti')1 for 11e rr llge of tIle C It
12 -.----~-----~-----~-~-------~------.
11
10 ~-------------------~~--------l~
CJj 9~
'-"' 8 -+--------------:::iII".::;....--------------_____=____!0-·u 7 -i--------~~-----------____=~i::.....-----___IoCD 6 -+---------:::;;~---------____:::~=.........---~-----_____::::~>,
;-..,£ 5 -t-~~----~~-_;:;;;;;;dA~--~----__=.._-=::-----~_l
Q)~ 4 ~---___=~~----___==___~--------------______l~
:::G 3 -+-----~~~--~~--_~----~~-------___1
2 .,.............----------------------------~--------------j
1
O~___;_____;__r__,__r_______r______.-"....__.___._______.________._________._____.________._______r_______.____,r_.,,________,_______.__.___r_____r___r____T
25 20 15 10 5
RotatiollaJ angle 01 tl e k' life tip fl0111 tIle shearbar) s~' iOll
(deare:es)
o
-438rpnl ( 00111 1)
- 219rplu (200 Ulll)
-292'
Figure 60 - Knife tip l elocities in the feed direction for the range ofdrUl11 peed
As can be seen ill F'igure 60, higher drum speeds signIficantly increase the·e!ative velocity
benveen knife and stalk in the feed direction.' To understand the consequences of thi
relatlve oeity increase the defornlation b,ehaviour of the stalk during the cutting proc ss
lTIU t be understood.
Tl e defol illatIon b aviour of tl e stalk fo' a cut nlade at l1igh speed wi ] si nificantly d"ffet
·0111 that _nade at slowe· speeds. Ana ysing the high drUlTI peed (fast kn °fe) first te
d,eforlnat.ion and resulting splitting of the stalk a the knife- passe thlOUgh is shown ill the
sequence ofpictures in Figure 61.,

94
Figure 61 - talk de.for1J1ation and resulting splitting caused by the action ofa~fa 'lla1ife
A fa, t knif- results in high relative velocities betw'een_ tip a d sta k in the feed direc ion and
therefore most of the deformation is caused by the leading edge of the knife. Such
deforlnation results in bod cOlnp_cssion and shearing of the cxi ing billc. Figure 62 sl 0 S
the stress state of a sma J eleul nt of the stalk at t1 e knIfe fp. The shearing of the e]enlen is
caused by the differential velocity of the tip in he feed direct·on_ and it is this shearing that
is thought to be the cause of a significan anlount of longitudinal splits in th stalks.
COlnpression of the salk is also seen an d to h sahirat d s rue ure of the cane stalk it
can be assumed to be incoJnpressible a- the speeds seen in this process.. There -Ore,
C0l11press"on in one or two directions eults in xpansion in the other d"rection causingj ice

95
expression and splitting of he stalk. Th" e 'plains the hicrher cane and juice losses and
increased bI] et da lage seen for the high drUlTI speeds.
Figure 62 - L)tress state ofan elelnent at the knife tip for high drun1 speeds
h danlag caused by a slower ife speed is sligh ly different and is ilJustrated 111 tgure
63. At these lower speed the) elati e velocity between kllife and stal in the feed direc ion
IS In eh Ie a d ]lerefore the feed velocIty plays a pal1 in the t esulting defollnation.n t ·s
case splitting of the stalk is seen on both sides' of the lalife. However the sllea" affect i
I uc11 Jess resulting in less seriol S splittitlg of the stalk. T is is illu t·ated in he quantitative
resu] s where s10 er knife spe ds are responsible for Jess cane and juice loss and inlproved
bill l qualily.

9G
Figure f53 - 5;tolk de;!nrJnatiol1 and resulting splitting _aused b.ll the action o/'a slo knife
Most of the Ul1_ ··eceSSaI)' deforl11ation of the stalk .. s caused by either the large geonletry of
the knife or the high knife elocit)r in the teed direction. '!'he e can be asHy 'lnpro ed b
changing he knIfe to a thinn r geometry and repositio11ing the drUlTI so the veloci I of th .
knife in the feed direcion is minin1.al. Obtaining this rlinitnal In,,vanted velocity requires
ra! gl ing the position of the druID relative to the feed 'fain so a the cut is as elo e ·0
perpendicular througl the stal as possible. This ho\\rever~ would requir a larger kni£ rak
due to the e tended perpelldicular Illotion of the knife t lrough the ll1ateriaI mat.

'7
An h. rbvious cauS'· ofunn ) damage i d,l 1
n in
In. tr of the
f)·e h
kl·ffe 1110unting pIal.}
f the stalks on th
th
.::ad.
01 head
I counteIsinkiu'_an be easil·· 0
on the back of1l
d
6.6- -, C:omparis ntcho "pe
lOU· chopp " Irese'al;tl1 Ul
111g laram
. IIIbles the chan . 111du try sine th
I-Iowever in an at .In 't to draw a. cOll1pali n b-twe,en the propo
u'"rent of le.ul·s
found £0 eJ gt
Ing
111. ~. hough the t. ·sti - p. ranl 'ers were silnilar sanlples .he r r pinch

98
chopper tests were cutting billet lengths of approxin1ately 250 n1n1 (con1pared to the single
drllln chopper 200 n1n1) and the pour rates tested for the rotary pinch chopper systelTI were
120 and 240 t/hr (con1pared to 150 and 300 tlhr used in single drUIn chopper tests). An
average of '0.6 to 0.7 % ITIaSS loss I cut I lTIetre' was found using the rotary pinch chopper
test rig (with sharp knives) cOlnpared to the 0.8% found in the prototype single drUITI
chopper trials. When considering this data on an industry scale, the losses of the rotary
pinch systen1 would severely escalate as the knife condition deteriorates, however the
sharpening systeITI on the proposed single drull1 chopper systeln ensures the quality of cut is
Inaintained over the life of the knives. Therefore it can be assulned that the single drunl
systeITI may result in fevver losses than the average of the rotary pinch chopper systell1 over
the life of the knives. SaIne obvious ilnprOVelTIents as described throughout section 6.6.1
can also be made to the proposed single drun1 chopper that was used in these trials, and these
Inodifications are expected to significantly reduce systetTI losses and ilTIprOVe billet quality.
The proposed systeITI has been proven to be capable of providing variable billet lengths via a
sinlple change of the drutll speed, one accoITIplishnlent current rotary chopper systeITIS can
not achieve. The result of this is the capability of the proposed systeln to produce pre-set bin
weights, a Inajor advantage over current systeITIs.
6.7 Conclusions froID the prototype testing
This set of trials has provided insight into the effectiveness of the proposed single drutTI
chopper systetTI for use in a sugarcane harvester. A clear understanding of the causes of
billet dan1age during the single drUITI chopping process has been gained, sOlnething which no
previous research has reported. The following observations vvere tTIade:
1) There is a strong positive trend between drunl speed and Inass loss through the
chopper systenl.
2) Increased drU1TI speeds are responsible for significantly higher billet dalnage.
This can be explained by studying the relationship between the defornlation of
the stalk and the dynanlics of the knife.
3) Pour rate does not significantly affect the losses through the systell1.
4) No recycling of nlaterial arou11d the chopper drU111 was seen.
5) The billet trajectories predicted by the dynanlic tTIodelswere validated. A very
close silTIilarity was seen between the n10tion of the billets in the prototype the
1110tion predicted by the finite elenlent 111odels.
6) The losses were found to be c0111parable to previous research on current chopper
systellls. However, as the industry evolves toward co-generation, the advantages
of the proposed single drull1 concept will beCOlne nlore apparent.

99
CONCLUSIONS
Abstract: In this final chapter the conclusions .found fron1 the investigation into the
developlJ1ent of the single dru111 chopper s)lstenl are presented. Reco111lnendations for' the
further developnlent ofthe concept are also detailed.

100
This study has covered the research and developtnent of a single drum chopper systenl for a
sugarcane harvester. The pertinent literature in the field of agricultural billeting systetTIs was
studied and a set of laboratory experiments into the single knife slicing of cane were
conducted. Based on the previous literature and laboratory experilTIental findings, a single
drutn chopper concept for a sugarcane harvester was developed. A dynanlic finite elenlent
tTIodel of the concept was developed to analyse the kinetnatics of the billets through the
proposed systelTI. A full scale prototype \vas designed and constructed for experiInental
testing of the concept.
7.1 Outcomes
The objectives of the study have been achieved, and the specific outcomes of the project are
sunltnarised below.
1) An apparatus was constructed for a laboratory investigation into the defonnation
behaviour of a cane stalk when cut by a single knife against a stationary anvil. It
was seen that anvil angle was the nl0st significant variable on nlass loss and stalk
datnage. Whilst a larger angle resulted in a higher tTIass loss, it produced
significantly less splitting of the stalk. Knife speed and cane variety were seen to
have an insignificant affect on the process. Although knife condition was also seen
to have a negligible affect, it is predicted that if a blunter knife Vlere used in the
testing a Inore noticeable affect would have been seen.
2) Design aspects \vere taken froln the proven forage harvester single drUlll chopper
systeln in the developlTIent of the concept for a cane harvester. All geonletric and
operational paralneters \;yere suggested for the systenl to run at predicted peak
efficiency in a cane harvester.
3) A dynalnic finite elelTIent ITIodel of the proposed concept was constructed in the
ELFEN code. This nlodel \vas used to deternline the affect of geotnetric and
operational paratlleters on the billet trajectory through the systetn. It was found that
the proposed concept provided acceptable trajectories for all cOlnbinations of drum
geonletty and drunl speed levels tested. The drutn speeds tested aligned with target
billet lengths of 100 I11t11, 150 nl111 and 200 Inn1.
4) The laboratoty experitnents and dynalnic tnodel provided confidence for the
construction of a full scale prototype chopper. The chopper was built into a CUstOlll
test rig that replicated the back end of a harvester, including the feed train and
extraction chanlber. The prototype rig was installed at Jalnes Cook University in

101
Townsville, where the perforlllance of the chopper systelll was analysed via a set of
experilnents aiIned at replicating harvesting conditions.
5) The effect of increasing the pour rate of lllaterial into the chopper and the drutll
speed of the chopper were tested. The efficiency of the systelll was nleasured by
deternlining the nlass loss of cane and juice through the systenl as well as visual
inspection of the danlage inlposed on the billets. There was no significant difference
in either efficiency or datnage seen between the nvo tested pour rate equivalent
values of 150 t/hr and 300 t/hr.Drunl speed, and in turn, billet length, however was
seen to affect both tllaSS loss and datTIage. As druIll speed was increased between
the tested levels of 219 rpIll, 292 rpIn and 438 rpnl, significantly increased lTIaSS loss
and danlage were seen. Hence, when ainling to increase bin weights by decreasing
billet lengths, it 111Ust be considered that there will be nl0st likely a significant
decrease in harvesting efficiency.
6) The billet lengths produced by the prototype \vere inconsistent due to slippage in the
feed rollers of the test rig. Therefore, a true representation of the billet lengths
which 111ay be expected fronl a conl1nercialised systeln is was not detennined.
7) There was no sign of recycling of billets around the chopper drunl and the trajectory
of billets into the extraction chanlber seen in the prototype testing validated that
predicted by the finite elelllent tTIodel.
8) The high speed photography provided a clear view of the cutting process and gave
insight into the dalllaged caused to the billet by the knife. The increased 111ass loss
seen for the high drunl speed is explained by the increased relative velocity between
the knife and stalk in the direction of the feed. Such a nlisnlatch in velocities
essentially causes increased defortnation and therefore increased dalnage to the stalk.
FUIiher analysis of the defonnation behaviour of the stalk nlakes a case for a thinner
knife and realignlnent of the drUITI relative to the feed in order for decreased dalnage.
9) The nlost conlparable data between this study and previous research on cane
harvester chopper efficiencies shows that the proposed single druIll systenl produces
efficiencies in the saIne order as current systeITIs. The proposed systelll however
offers a nUlnber of advantages over current systelTIS apalt fron1 efficiencies.
7.2 Recommendations for further developlDent of the chopper
concept
This study has proven through a ntuTIber of techniques that the single drUITI concept
developed \vould be suitable for installation in a sugarcane harvester. However, testing of
the prototype has given light to a llulnber of n1inor changes that could be Inade to the design.

102
These changes are predicted to significantly enhance the perfornlance and efficiency of the
concept. These design lTIodifications include:
1) Redesigning the knife geolnetry to have a thinner profile.
2) Utilising countersunk knife bolts.
3) Modifying Jhe geotnetry of the knife nl0unt so as there is a sInooth transition fronl
knife edge to drunl inner curve.
4) Lowering the position of the drunl relative to the feed. This will allow for a nlore
perpendicular cut through the stalks.
5) Increasing knife rake due to the lnore perpendicular cut.
6) Modifying deflector plate to provide ideal trajectory for the ne\v drunl position.
7) Adding another set of rollers to the feed train of the test rig or redesigning the roller
profile to elinlinate slippage.
With a push towards harvesting a higher propo11ion of total bionlass and therefore shorter
billet lengths, the single drLlln chopper systenl has ever increasing advantages over
conventional differential chop systenls. It is expected that the efficiencies of the single druln
chopper systenl can be significantly ilnproved if the above nlentioned Inodifications are
inlpletnented. Once the changes are Inade to the prototype rig, is it suggested that a silnilar
set of trials to those conducted in this research are run. The results fronl these trials are
expected to show enhanced perfonnance and increased efficiency which \vould tnake a
strong case for the conlnlercialisation of the concept.

103
References
BSES. 2002. The Harvesting Best Practice Manual for Chopper-extractor Harvesters.BSESPublication.
CLAAS. 2002. Claas Jaguar 830 Alaintenance Handbook. Claas Inc.
HOCKINGS, P.R. andDAVlS,R.J. 1999. Inlproving the Pe110rlnance ofChoPlJer S)Jstenlsin ("ane Harvesters. BSES Repol1.
JAKEWAY,L.A. 2003. Application of Cane and Forage Harvesters for BiOJlIGSS FuelRecovery. Proceedings of the International Conference on Crop Harvesting andProcessing. ASAE Pub #701Pll 03e.
KEENLISIDE, B. 1985. 1111pact fracture properties of cane varieties. Joulnal AlnericanSociety of Sugar Cane Technologists. Vol. 5, pp. 85-89.
KROES, S. 1997. The Cutting o.f Sugarcane. PhD thesis, University of SouthernQueensland.
LEWIS, M. 2006. Packing ofRando/nly Orientated Beanls into a Rectangular 3D Do/nain.Honours thesis, Jan1es Cook University.
PERSSON, S. 1987. Mechanics o.fcutting plant Ina/erial. Alnerican Society of AgriculturalEngineers.
VAN DILLEWIJN, C. 1952. Botany 0.[ Sugarcane. Walthan1,Mass. USA. The ChronicaBook Co.