barnet, enfield and haringey mental health nhs trust us/clinical quality/london tru… · barnet,...
TRANSCRIPT

Trust level data for: Barnet, Enfield and Haringey Mental Health
NHS Trust
Commissioned by
Report of the second round of the National Audit of Schizophrenia (NAS2) 2014
This report contains a summary of the national findings from the second round of the National Audit of Schizophrenia for your Trust/Health Board. Please refer to the full national report for more information. www.rcpsych.ac.uk/quality/NAS/reports This report may be of interest to a wide variety of staff in the Trust as well as to Trust Board members and others and we would encourage its circulation. At the end is a template to assist the appropriate staff in developing an Action Plan to address areas where improvement is required.

©2014 HQIP and The Royal College of Psychiatrists Page 1 of 13
All Trusts/Health Boards were asked to return 100 returns for the audit of practice. Trusts were also asked to send out 200 service user surveys to get 50 returns (expected return rate of 25%). The number of returns received for your Trust are listed below:
Audit of practice: 100
Service user survey: 56
Carer survey: 19 (surveys passed to carer via service user)
Notable findings from your Trust:
This summary report contains:
Page 1: Summary comments for your Trust
Pages 2-4: Tables with key comparisons between total sample and your Trust
Page 5-6: Local action planning toolkit template
Please refer to the full national report to benchmark the performance of your Trust/Health Board against other organisations. Figure and page numbers of relevant charts in the full report have been included in the summary tables for this purpose.
Further breakdown of data for your Trust for local interpretation:
Pages 7: Demographics
Pages 8-13: Service user responses
A below average proportion of your service users reported knowing how to get help in a crisis (Table1, Standard 16).
Monitoring of Physical Health risk factors was below average in your Trust, and thus well below what should be provided. It was particularly poor for monitoring of glucose control and lipids (Table 2, Standard 4).
Though availability and uptake of Psychological Therapies was about average for your Trust for Family Interventions, and above average for CBT, it was still well below what should be provided (Table 1, Standards 14a and b).

©2014 HQIP and The Royal College of Psychiatrists Page 2 of 13
Table 1: Service provision and experience
Standard / Indicator Total sample
(%)
Your Trust (NAS025)
(%)
Reference in main report
Standard 1 – service users’ experience of care has been positive Proportion of service users reporting that they were satisfied with the care they received over the last 12 months (very satisfied and fairly satisfied combined)
88% 86% Figure 2 page 62
Standard 2 – service users report positive outcomes Proportion of service users reporting that services had helped them to achieve good mental health in the last year (a lot and a little combined)
86% 85% Figure 4 page 64
Standard 3 – carers’ satisfaction Proportion of carers reporting satisfaction with the support and information they have been provided within the past 12 months (somewhat satisfied and very satisfied combined)
80% 77% Figure 7 page 69
Standard 14a – CBT offered Proportion of service users offered CBT
39% 53% Figure 25page 108
Proportion of service users who took up CBT
19% 28%
Proportion of services users reporting they had received CBT
18% 27% Figure 26 page 109
Standard 14b – Family Intervention offered Proportion of service users offered family intervention 19% 19% Figure 27
page 110 Proportion of service users who took up family intervention
8% 5%
Proportion of services users reporting they had received family intervention
12% 16% Figure 28 page 111
Standards 15 & 16 – care planning and crisis planning Proportion of service users with a current care plan 95% 95% Figure 11
page 72 Proportion of service users reporting they have a care plan
75% 69% Figure 12 page 73
Proportion of service users reporting they know how to get help from mental health services in a crisis
74% 59% Figure 13 page 74

©2014 HQIP and The Royal College of Psychiatrists Page 3 of 13
Table 2: Physical Health
Standard / Indicator Total sample
(%)
Your Trust (NAS025)
(%)
Reference in main report
Standard 4 – monitoring of physical health risk factors Monitoring of five risk factors (family history excluded) 33% 25% Figure 32
page 117 Monitoring of smoking 89% 94% Figure 33
page 120 Monitoring of BMI 52% 54% Figure 35
page 121 Monitoring of glucose control 57% 43% Figure 38
page 124 Monitoring of lipids 57% 40% Figure 39
page 124 Monitoring of blood pressure 61% 57% Figure 41
page 126 Monitoring of alcohol consumption 70% 69% Figure 44
page 135 Monitoring of substance misuse 89% 91% Figure 45
page 135 Standard 5 – intervention offered for identified physical health risks Intervention for smoking 59% 74% Table 33
page 131 Intervention for BMI > or = 25kg/m2 71% 83% Figure 43
page 132 Intervention for abnormal glucose control
36% 36% Table 33 page 131
Intervention for elevated blood pressure
25% 50%
Intervention for alcohol misuse
74% 100% Table 35 page 136
Intervention for substance misuse
73% 89%
©2014 HQIP and The Royal College of Psychiatrists Page 4 of 13
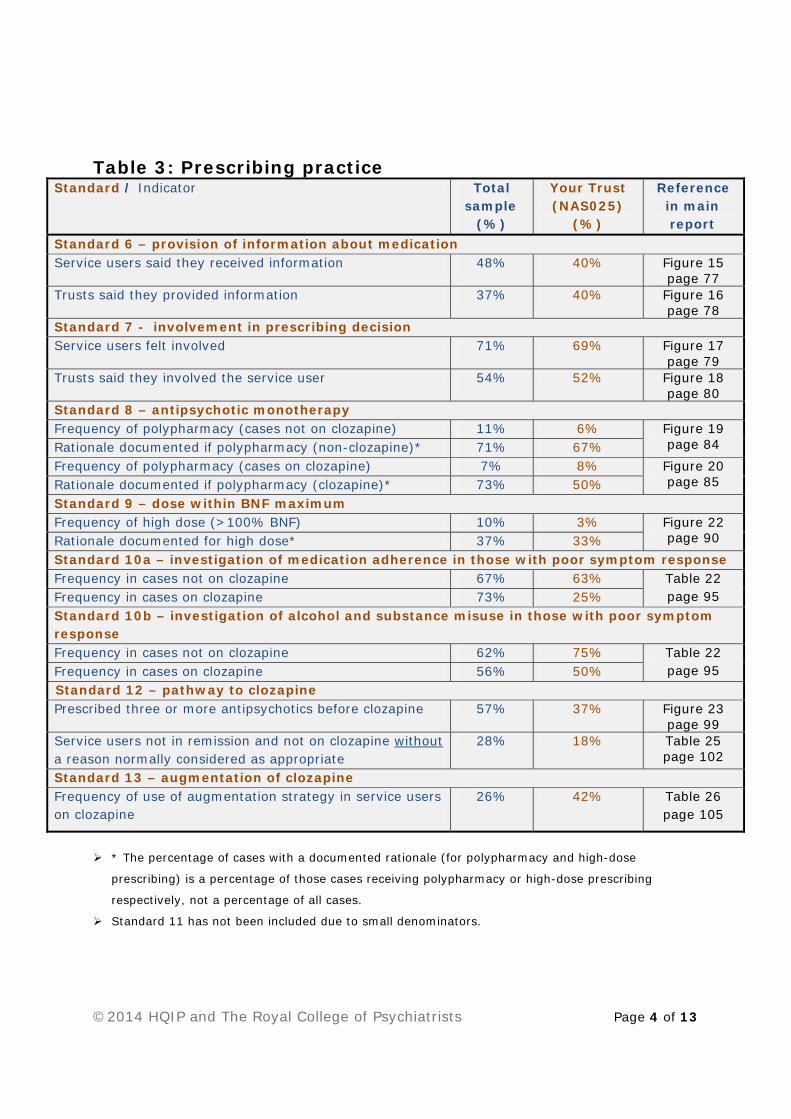
Table 3: Prescribing practice
Standard / Indicator Total sample
(%)
Your Trust (NAS025)
(%)
Reference in main report
Standard 6 – provision of information about medication Service users said they received information 48% 40% Figure 15
page 77 Trusts said they provided information 37% 40% Figure 16
page 78 Standard 7 - involvement in prescribing decision Service users felt involved 71% 69% Figure 17
page 79 Trusts said they involved the service user 54% 52% Figure 18
page 80 Standard 8 – antipsychotic monotherapy Frequency of polypharmacy (cases not on clozapine) 11% 6% Figure 19
page 84 Rationale documented if polypharmacy (non-clozapine)* 71% 67% Frequency of polypharmacy (cases on clozapine) 7% 8% Figure 20
page 85 Rationale documented if polypharmacy (clozapine)* 73% 50% Standard 9 – dose within BNF maximum Frequency of high dose (>100% BNF) 10% 3% Figure 22
page 90 Rationale documented for high dose* 37% 33% Standard 10a – investigation of medication adherence in those with poor symptom response Frequency in cases not on clozapine 67% 63% Table 22
page 95 Frequency in cases on clozapine 73% 25% Standard 10b – investigation of alcohol and substance misuse in those with poor symptom response Frequency in cases not on clozapine 62% 75% Table 22
page 95 Frequency in cases on clozapine 56% 50% Standard 12 – pathway to clozapine Prescribed three or more antipsychotics before clozapine 57% 37% Figure 23
page 99 Service users not in remission and not on clozapine without a reason normally considered as appropriate
28% 18% Table 25 page 102
Standard 13 – augmentation of clozapine Frequency of use of augmentation strategy in service users on clozapine
26% 42% Table 26 page 105
* The percentage of cases with a documented rationale (for polypharmacy and high-dose
prescribing) is a percentage of those cases receiving polypharmacy or high-dose prescribing
respectively, not a percentage of all cases.
Standard 11 has not been included due to small denominators.
©2014 HQIP and The Royal College of Psychiatrists Page 5 of 13
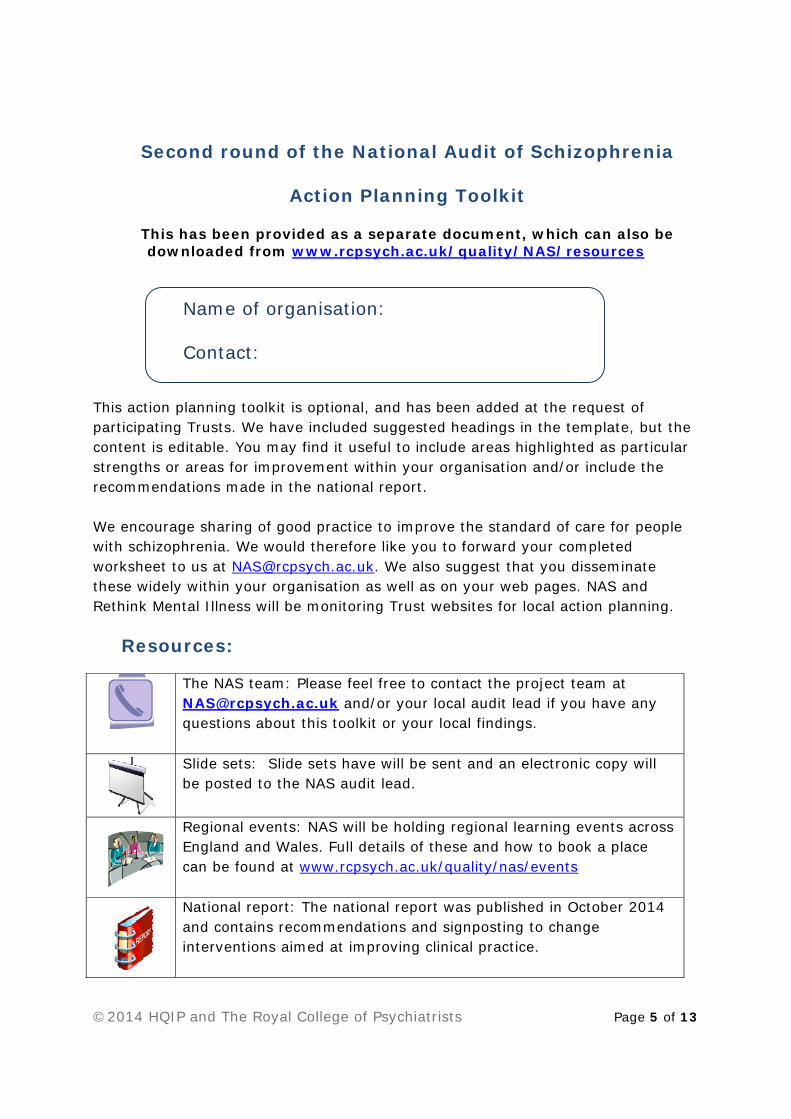
Second round of the National Audit of Schizophrenia
Action Planning Toolkit
This has been provided as a separate document, which can also be downloaded from www.rcpsych.ac.uk/quality/NAS/resources
This action planning toolkit is optional, and has been added at the request of participating Trusts. We have included suggested headings in the template, but the content is editable. You may find it useful to include areas highlighted as particular strengths or areas for improvement within your organisation and/or include the recommendations made in the national report. We encourage sharing of good practice to improve the standard of care for people with schizophrenia. We would therefore like you to forward your completed worksheet to us at [email protected]. We also suggest that you disseminate these widely within your organisation as well as on your web pages. NAS and Rethink Mental Illness will be monitoring Trust websites for local action planning.
Resources:
The NAS team: Please feel free to contact the project team at [email protected] and/or your local audit lead if you have any questions about this toolkit or your local findings.
Slide sets: Slide sets have will be sent and an electronic copy will be posted to the NAS audit lead.
Regional events: NAS will be holding regional learning events across England and Wales. Full details of these and how to book a place can be found at www.rcpsych.ac.uk/quality/nas/events
National report: The national report was published in October 2014 and contains recommendations and signposting to change interventions aimed at improving clinical practice.
Name of organisation: Contact:

©2014 HQIP and The Royal College of Psychiatrists Page 6 of 13
Action planning template
Dissemination
Who does the report or the summary need to be sent to
e.g. medical staff, nursing staff, governors, primary care leads, pharmacists
Service user and carer involvement Priorities for improvement
Actions taken Action/s agreed By whom? By when?
e.g. provision of information, involvement in decisions, carer support
Physical Health Care Priorities for improvement
Actions taken Action/s agreed By whom? By when?
e.g. screening, smoking cessation, measuring BMI, liaison with primary care
Prescribing practice Priorities for improvement
Actions taken Action/s agreed By whom? By when?
e.g. high dose prescribing, polypharmacy, use of clozapine
Improving access to psychological and psychosocial interventions Priorities for improvement
Actions taken Action/s agreed By whom? By when?
e.g. access to CBT, family therapy, employment support
Date for meeting to review progress: ________________
©2014 HQIP and The Royal College of Psychiatrists Page 7 of 13
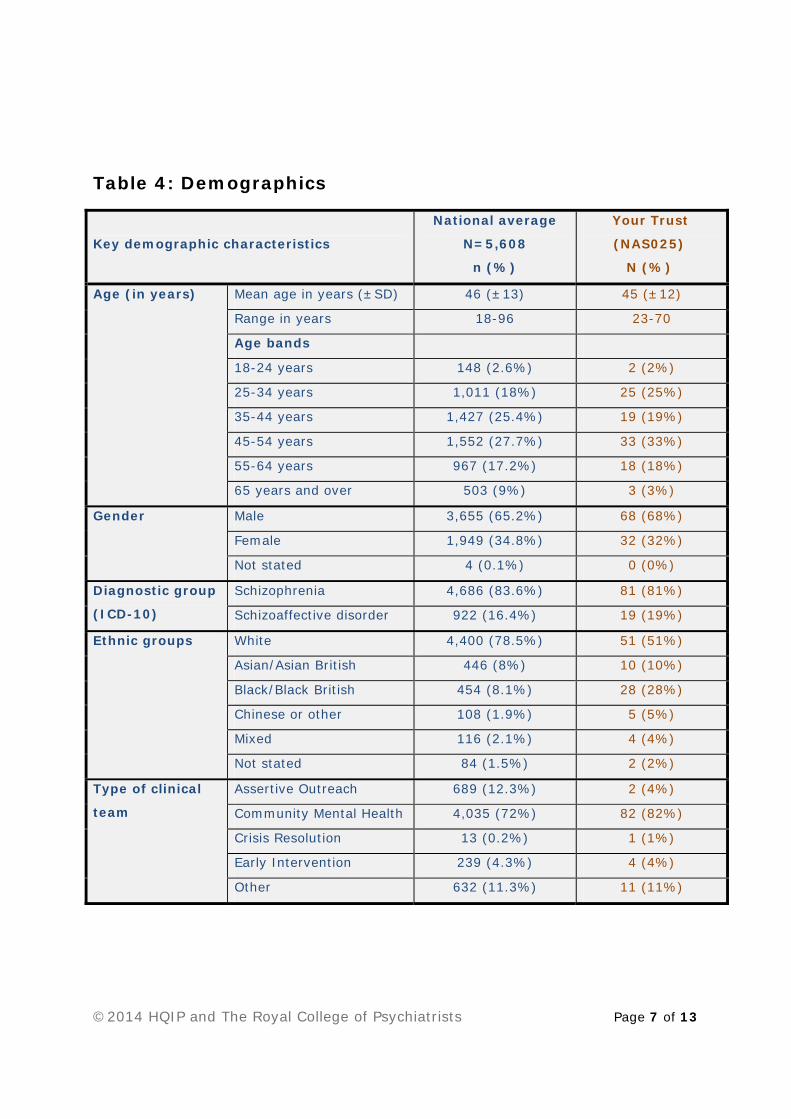
Table 4: Demographics
Key demographic characteristics
National average
N=5,608
n (%)
Your Trust
(NAS025)
N (%)
Age (in years) Mean age in years (±SD) 46 (±13) 45 (±12)
Range in years 18-96 23-70
Age bands
18-24 years 148 (2.6%) 2 (2%)
25-34 years 1,011 (18%) 25 (25%)
35-44 years 1,427 (25.4%) 19 (19%)
45-54 years 1,552 (27.7%) 33 (33%)
55-64 years 967 (17.2%) 18 (18%)
65 years and over 503 (9%) 3 (3%)
Gender Male 3,655 (65.2%) 68 (68%)
Female 1,949 (34.8%) 32 (32%)
Not stated 4 (0.1%) 0 (0%)
Diagnostic group
(ICD-10)
Schizophrenia 4,686 (83.6%) 81 (81%)
Schizoaffective disorder 922 (16.4%) 19 (19%)
Ethnic groups White 4,400 (78.5%) 51 (51%)
Asian/Asian British 446 (8%) 10 (10%)
Black/Black British 454 (8.1%) 28 (28%)
Chinese or other 108 (1.9%) 5 (5%)
Mixed 116 (2.1%) 4 (4%)
Not stated 84 (1.5%) 2 (2%)
Type of clinical
team
Assertive Outreach 689 (12.3%) 2 (4%)
Community Mental Health 4,035 (72%) 82 (82%)
Crisis Resolution 13 (0.2%) 1 (1%)
Early Intervention 239 (4.3%) 4 (4%)
Other 632 (11.3%) 11 (11%)
©2014 HQIP and The Royal College of Psychiatrists Page 8 of 13
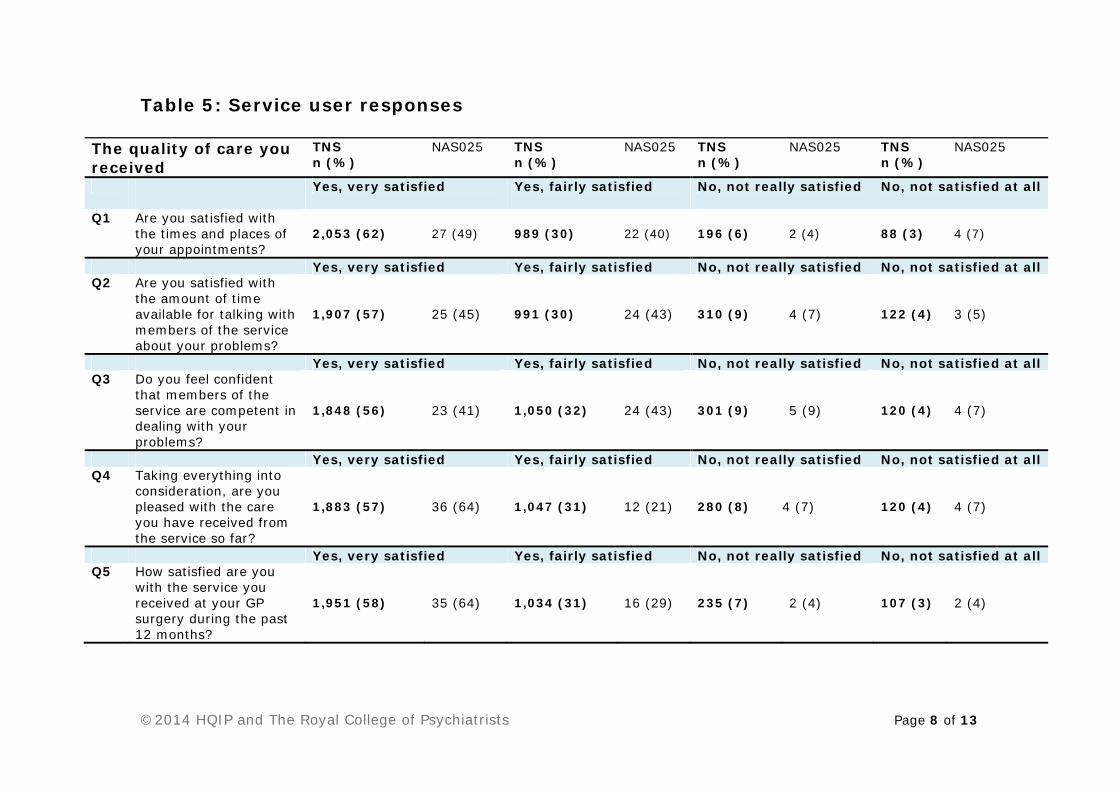
Table 5: Service user responses
The quality of care you received
TNS n (%)
NAS025 TNS n (%)
NAS025 TNS n (%)
NAS025 TNS n (%)
NAS025
Yes, very satisfied Yes, fairly satisfied No, not really satisfied No, not satisfied at all
Q1 Are you satisfied with the times and places of your appointments?
2,053 (62) 27 (49) 989 (30) 22 (40) 196 (6) 2 (4) 88 (3) 4 (7)
Yes, very satisfied Yes, fairly satisfied No, not really satisfied No, not satisfied at all Q2 Are you satisfied with
the amount of time available for talking with members of the service about your problems?
1,907 (57) 25 (45) 991 (30) 24 (43) 310 (9) 4 (7) 122 (4) 3 (5)
Yes, very satisfied Yes, fairly satisfied No, not really satisfied No, not satisfied at all Q3 Do you feel confident
that members of the service are competent in dealing with your problems?
1,848 (56) 23 (41) 1,050 (32) 24 (43) 301 (9) 5 (9) 120 (4) 4 (7)
Yes, very satisfied Yes, fairly satisfied No, not really satisfied No, not satisfied at all Q4 Taking everything into
consideration, are you pleased with the care you have received from the service so far?
1,883 (57) 36 (64) 1,047 (31) 12 (21) 280 (8) 4 (7) 120 (4) 4 (7)
Yes, very satisfied Yes, fairly satisfied No, not really satisfied No, not satisfied at all Q5 How satisfied are you
with the service you received at your GP surgery during the past 12 months?
1,951 (58) 35 (64) 1,034 (31) 16 (29) 235 (7) 2 (4) 107 (3) 2 (4)

©2014 HQIP and The Royal College of Psychiatrists Page 9 of 13
Getting help from people you know when you need it
TNS n (%)
NAS025 TNS n (%)
NAS025 TNS n (%)
NAS025 TNS n (%)
NAS025
Yes, I know their name Yes, but I do not know or I am unsure of their name
No, I do not have a key worker or a care coordinator
Q6 Do you have a key worker or a care coordinator? 2,474 (75) 43 (77) 278 (8) 3 (5) 566 (17) 10 (18)
Yes No Q7 Do you know how to contact
you key worker? 2,429 (93) 39 (89) 174 (7) 5 (11)
Very satisfied Fairly satisfied Not really satisfied Not satisfied at all Q8 How satisfied are you with
your access to your key worker or care coordinator within the last 12 month?
1,630 (61) 21 (47) 774 (29) 20 (44) 185 (7) 3 (7) 76 (3) 1 (2)
Yes, there has been one change
Yes, there has been more than one change
No, there has been no change
Q9 Has there been a change in your key worker or care coordinator in the last year?
829 (31) 20 (43) 278 (11) 8 (17) 1,535 (58) 18 (39)
Yes, there has been one change
Yes, there has been more than one change
No, there has been no change
Q10 Has there been a change in your psychiatrist in the last year?
902 (27) 20 (36) 310 (9) 8 (15) 2,084 (63) 27 (49)
Yes, I have a number for mental health services I can ring in an emergency
Yes, I would go to the Accident and Emergency department
No, I do not know how I can get help in an emergency
Q11 Do you know how to get help for your mental health if there is a crisis or emergency and you need help right away?
2,381 (74) 32 (59) 354 (11) 8 (15) 485 (15) 14 (26)

©2014 HQIP and The Royal College of Psychiatrists Page 10 of 13
Getting help from people you know when you need it
TNS n (%)
NAS025 TNS n (%)
NAS025 TNS n (%)
NAS025 TNS n (%)
NAS025
Yes, I have a copy and know where it is
Yes, I have a care plan but do not know where it is
No, I do not have a care plan
Q12 Do you have a care plan that provides you and other people with information about what your main health issues are and what help you are getting with these?
1,656 (51) 27 (52) 818 (25) 9 (17) 799 (24) 16 (31)
Yes, I have a copy and know where it is
Yes, I have an advance directive but do not know where it is
No, I do not have an advance directive
Q13 Do you have an advance directive that provides you and other people with information about what you would like to happen should you become unwell?
706 (22) 13 (26) 307 (10) 5 (10) 2,229 (69) 32 (64)
©2014 HQIP and The Royal College of Psychiatrists Page 11 of 13
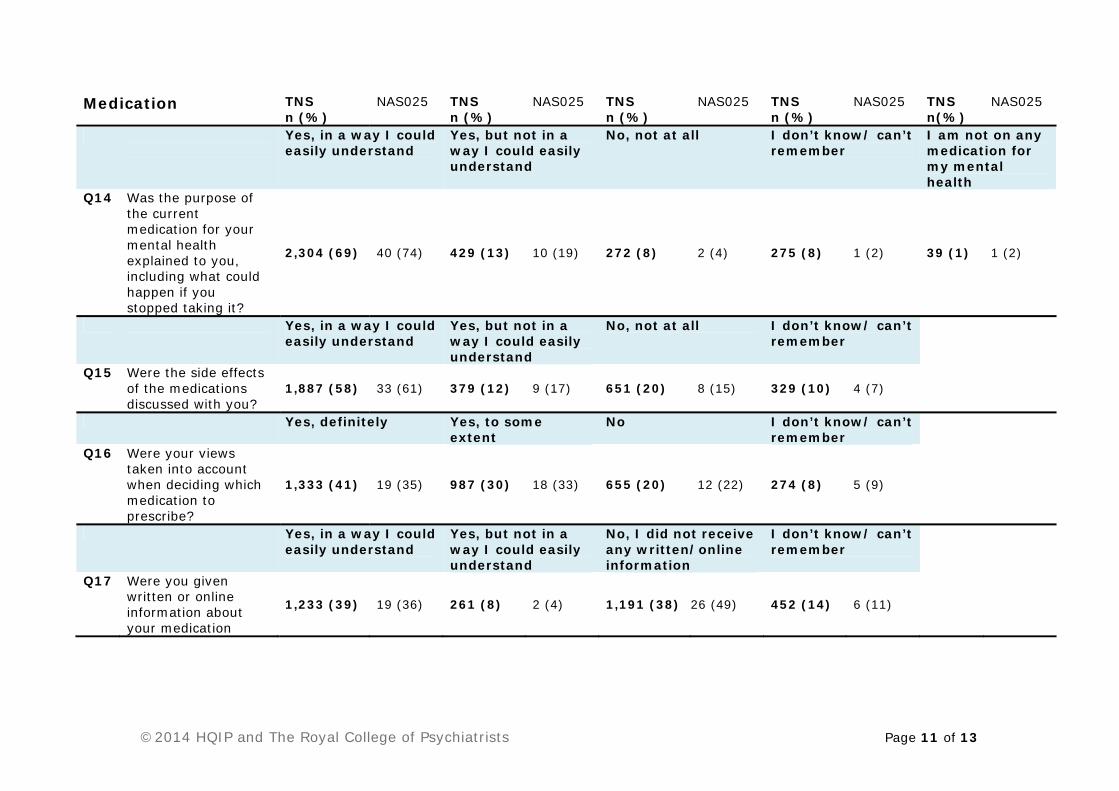
Medication TNS n (%)
NAS025 TNS n (%)
NAS025 TNS n (%)
NAS025 TNS n (%)
NAS025 TNS n(%)
NAS025
Yes, in a way I could easily understand
Yes, but not in a way I could easily understand
No, not at all I don’t know/ can’t remember
I am not on any medication for my mental health
Q14 Was the purpose of the current medication for your mental health explained to you, including what could happen if you stopped taking it?
2,304 (69) 40 (74) 429 (13) 10 (19) 272 (8) 2 (4) 275 (8) 1 (2) 39 (1) 1 (2)
Yes, in a way I could easily understand
Yes, but not in a way I could easily understand
No, not at all I don’t know/ can’t remember
Q15 Were the side effects of the medications discussed with you?
1,887 (58) 33 (61) 379 (12) 9 (17) 651 (20) 8 (15) 329 (10) 4 (7)
Yes, definitely Yes, to some extent
No I don’t know/ can’t remember
Q16 Were your views taken into account when deciding which medication to prescribe?
1,333 (41) 19 (35) 987 (30) 18 (33) 655 (20) 12 (22) 274 (8) 5 (9)
Yes, in a way I could easily understand
Yes, but not in a way I could easily understand
No, I did not receive any written/online information
I don’t know/ can’t remember
Q17 Were you given written or online information about your medication
1,233 (39) 19 (36) 261 (8) 2 (4) 1,191 (38) 26 (49) 452 (14) 6 (11)
©2014 HQIP and The Royal College of Psychiatrists Page 12 of 13
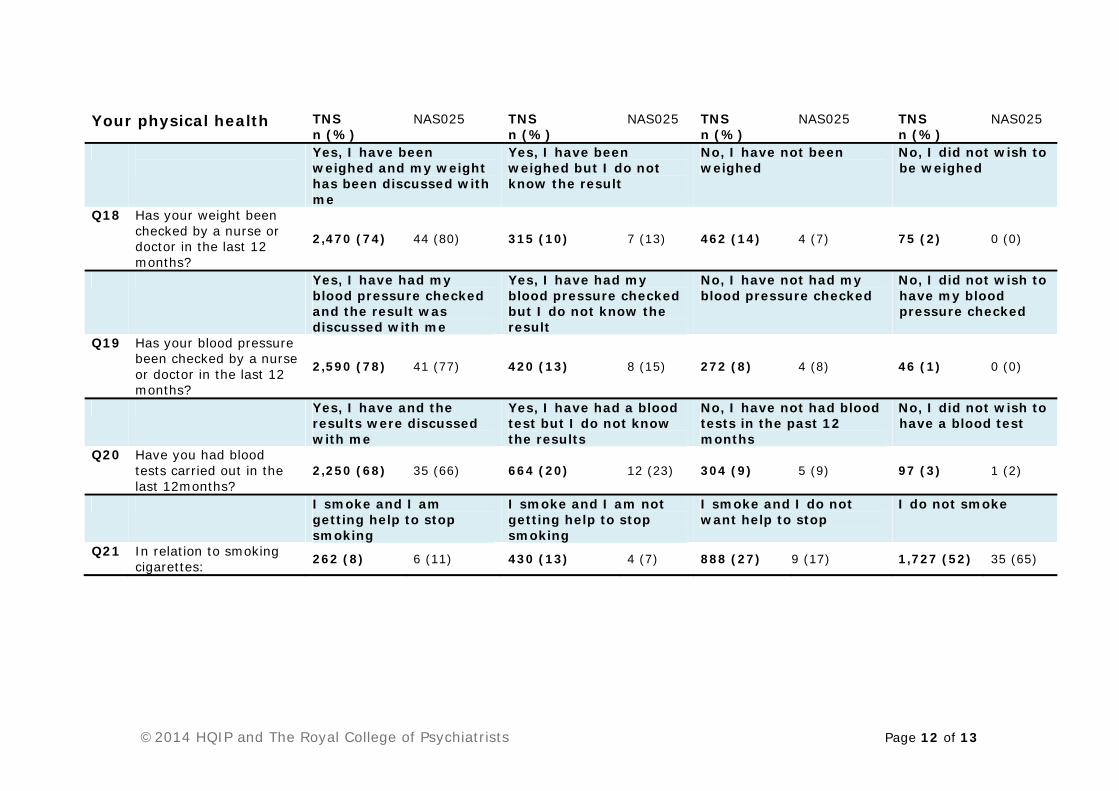
Your physical health TNS n (%)
NAS025 TNS n (%)
NAS025 TNS n (%)
NAS025 TNS n (%)
NAS025
Yes, I have been weighed and my weight has been discussed with me
Yes, I have been weighed but I do not know the result
No, I have not been weighed
No, I did not wish to be weighed
Q18 Has your weight been checked by a nurse or doctor in the last 12 months?
2,470 (74) 44 (80) 315 (10) 7 (13) 462 (14) 4 (7) 75 (2) 0 (0)
Yes, I have had my blood pressure checked and the result was discussed with me
Yes, I have had my blood pressure checked but I do not know the result
No, I have not had my blood pressure checked
No, I did not wish to have my blood pressure checked
Q19 Has your blood pressure been checked by a nurse or doctor in the last 12 months?
2,590 (78) 41 (77) 420 (13) 8 (15) 272 (8) 4 (8) 46 (1) 0 (0)
Yes, I have and the results were discussed with me
Yes, I have had a blood test but I do not know the results
No, I have not had blood tests in the past 12 months
No, I did not wish to have a blood test
Q20 Have you had blood tests carried out in the last 12months?
2,250 (68) 35 (66) 664 (20) 12 (23) 304 (9) 5 (9) 97 (3) 1 (2)
I smoke and I am getting help to stop smoking
I smoke and I am not getting help to stop smoking
I smoke and I do not want help to stop
I do not smoke
Q21 In relation to smoking cigarettes: 262 (8) 6 (11) 430 (13) 4 (7) 888 (27) 9 (17) 1,727 (52) 35 (65)

©2014 HQIP and The Royal College of Psychiatrists Page 13 of 13
Other types of treatment and help
TNS n (%)
NAS025 TNS n (%)
NAS025 TNS n (%)
NAS025 TNS n (%)
NAS025
I do not have a job and I am getting help to find one
I do not have a job and I am not getting help to find one
I do not have a job and I am not looking for one at this time
I have a job
Q22 In relation to work and employment: 330 (10) 8 (16) 355 (11) 7 (14) 2,158 (68) 29 (58) 331 (10) 6 (12)
I am involved in activities during my day (e.g. education/ volunteering/ drop-in group)
I am not involved in activities but I am getting help with this
I am not involved in activities and I am not getting help with this
I am not involved in activities but I’m ok with that for the moment
Q23 In relation to other activities: 1,158 (36) 25 (49) 380 (12) 7 (14) 241 (8) 1 (2) 1,440 (45) 18 (35)
I have had or I am having this treatment
I have not received this treatment
I do not want to receive this treatment
Q24 In relation to Cognitive Behavioural Therapy (CBT):
567 (19) 14 (27) 1,413 (46) 25 (49) 1,092 (36) 12 (24)
I have had or I am having this treatment
I have not received this treatment
I do not want to receive this treatment
Q25 In relation to family intervention (also called family therapy):
366 (12) 8 (16) 1,372 (45) 25 (49) 1,324 (43) 18 (35)
Overall
Helped a lot Helped a little Made little difference Made me worse
Q26 To what extent have services helped you to achieve good mental health in the last year?
2,013 (61) 28 (51) 816 (25) 19 (35) 355 (11) 7 (13) 112 (3) 1 (2)