barriers to tur - mass.gov prevention, and resource conservation. a survey of turps on their...
TRANSCRIPT

The Assessment of Barriers to Toxics Use Reduction, Pollution Prevention, and Resource Conservation A Report by the MA Office of Technical Assistance and Technology, Massachusetts Executive Office of Energy and Environmental Affairs July 2008 Summary The MA Toxics Use Reduction Act promotes the implementation of toxics use reduction, pollution prevention, and resource conservation. The MA Office of Technical Assistance, through surveys and meetings, researched why some companies have not adopted these practices, while others have. The primary reasons appear to be that companies not adopting these practices were concerned about costs and possible negative impacts on the quality of their product (for example, that environmentally preferable cleaners might be more expensive to use, or might not perform as well as more toxic chemicals). However, there are indications that many companies chose not to implement environmentally preferable alternatives on the basis of perception, without necessarily substantiating assumptions about the alternative practices. The research also found that when specific examples of actual projects were considered, as opposed to consideration of barriers in general, costs were ranked as less important. Technical issues increased in importance when specific examples were considered, than when barriers (and actions to overcome them) were discussed in the abstract. Actions that may be effective in increasing adoption of the practices the Toxics Use Reduction Act promotes include: trials and demonstrations coupled with cost-benefit information, correcting perceptions, stronger incentives, tax breaks, and better regulatory drivers. Introduction The Massachusetts Toxics Use Reduction Act, as revised in 2006, charges the Office of Technical Assistance (OTA) with assessing barriers to “business implementation of toxics use reduction, pollution prevention and resource conservation.”1 Assessing barriers to implementation of these desirable activities is a necessary feature of efforts to optimize the work of the Toxics Use Reduction program, and OTA’s work in particular. Because OTA is a voluntary program, it is essential to continuously improve its understanding of the constraints and motivational issues that prevent the fullest
1 The 2006 amendments to TURA expanded OTA’s mandate. Whereas since 1990 it has provided assistance with toxics use reduction (TUR), it is now charged with providing assistance with pollution prevention (P2) and resource conservation as well. TUR is a subset of P2, which can include prevention of any pollutant, not just toxics. Resource Conservation includes energy and water use reductions as well as the reduction of the consumption of any material or the generation of any waste. Since OTA has only recently begun operating under this expanded mandate, this report primarily concerns its efforts with toxics use reduction.

2
utilization of its services. Understanding the barriers to these practices can also serve as a useful guide for any other party interested in increasing adoption of such practices. In order to meet this goal, OTA issued a contract for the conduct of a public dialogue and the development of a strategy for performing this assessment. OTA also conducted a survey of Toxics Use Reduction Planners and an analysis of survey results. This report summarizes the outcome of the contract and the survey, and draws conclusions pertaining to actions to address barriers to business implementation of toxics use, pollution prevention, and resource conservation. The report also includes recommendations for future work. Results of the Contract Previous Related Findings SAK Environmental, LLC, performed the contract for OTA, conducting two public dialogues and submitting a report containing observations and suggestions for accurately identifying barriers. SAK had previously conducted a study on barriers to eliminating chlorinated solvent use in cleaning operations, and built upon this experience in designing its public dialogues. This study, conducted in 2005, surveyed 56 companies (30 responded), on their use of chlorinated solvents in cleaning operations, to identify barriers to reducing the use of these solvents. The top three motivations for reducing chlorinated solvent use were regulations, cost efficiency, and improved environmental health and safety. The primary barriers to making changes in production were as follows:
• maintaining the quality of output • concerns that a change would involve extra process time • cost
It is important to note that the survey also found that those companies that had reduced or eliminated solvent use often reported significant savings in purchasing and costs, and that their capital expenditures for needed new equipment were quickly offset. Other cited barriers were:
the lack of proven alternatives ineffective cleaning (alternatives failed to fully remove soiling) residues of the cleaner itself remained on the part increased drying time customer requirements space limitations
Frequently the ineffective cleaning involved parts with deep, small, or hard-to-reach holes, that the alternative cleaner could not sufficiently penetrate or evacuate. The space

3
limitations were often factors when the alternative was not a complete replacement, requiring that a company continue using the original chemical to some extent. Customer requirements generally refers to meeting cleaning standards. New equipment for the alternative would be needed but the old equipment could not be removed. Sometimes, more than one alternative was necessary to substitute for a toxic chemical. In either the case of an incomplete replacement or lack of a single alternative, having two cleaning systems was typically cost-prohibitive. It was found that companies that had significant quantities of chlorinated solvents were more likely to make the transition, as the amount of use made the work of elimination cost-effective. Those using the largest amounts also faced the highest regulatory costs. At companies with lower levels of use, the projected savings from eliminating the chlorinated solvents were not high enough to justify the investments in new equipment and other transition costs. An important insight of this earlier work by SAK was that “Not all barriers reported by participants were actually experienced by the company.”2 Many barriers were assessed as perceptual in nature, consisting of assumptions rather than facts based on actual evaluation. Consistent with this was a related finding that different personnel reported different barriers, suggesting that roles influence perspective. “The EH&S manager may have limited access to cost information because of their specific responsibility in the company. Conversely, a manufacturing manager commonly considers costs as the barrier presumably from the pressure to be cost competitive in production.3” SAK pointed out that it is necessary to distinguish perceived barriers from actual barriers, because perceived barriers may be addressed through effective outreach and education, while addressing actual barriers may require other actions such as technological development or subsidies. Inadequate internal technical expertise could exacerbate the issue of perceived barriers. The report also noted that a lack of regulatory incentives and a lack of interest could be termed barriers to change. According to the report, OTA was the primary source of “unbiased information” relating to alternatives, the Toxics Use Reduction Institutes’s surface cleaning laboratory was the primary venue where trial tests of alternatives was performed, and virtually all participants expressed interest in grants or low interest loans to finance investigations into greener alternatives. The report also noted that auto, defense, and aerospace customer groups specified the use of chlorinated solvents, and that these requirements could be “arcane specifications from
2 Report of Findings, Barriers to Eliminating Chlorinated Solvent Use in Cleaning Operations at Massachusetts Manufacturers, RFR # EVN05 OTA 06, October 2005, SAK Environmental, LLC, North Andover, MA. Page 14. 3 Report of Findings Identifying and Evaluating Barriers to Toxics Use Reduction, SAK Project Number 4.00.07, p. 6.
4
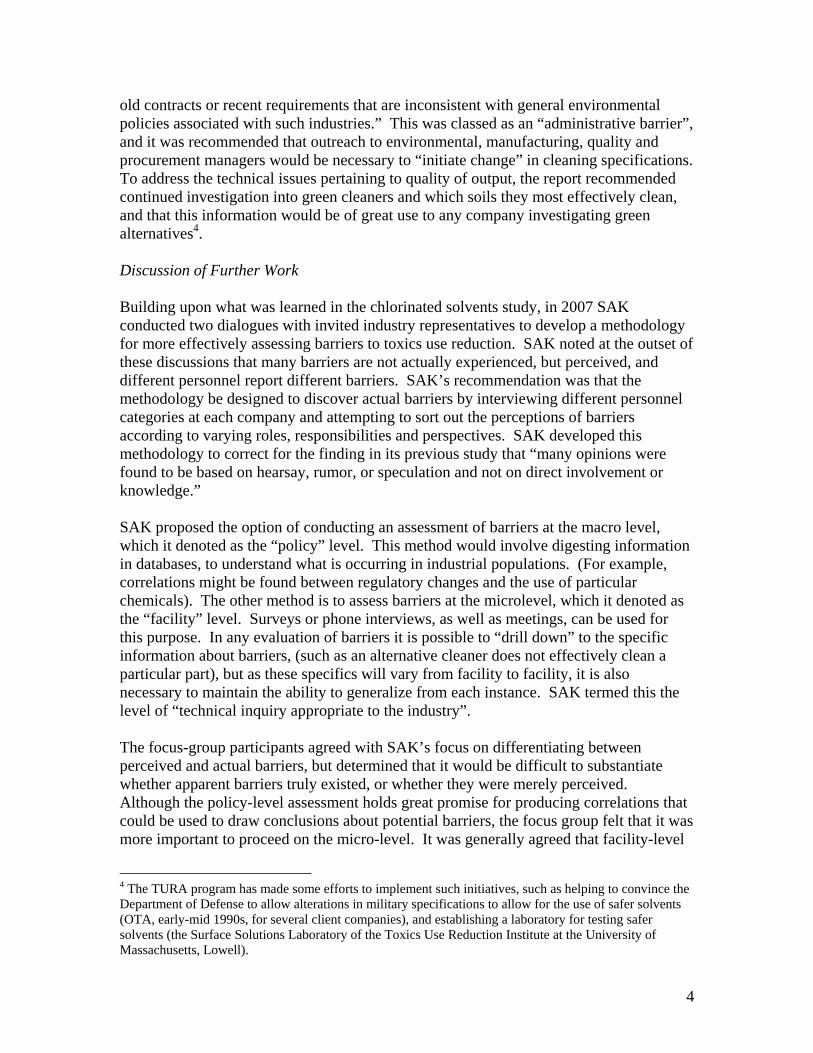
old contracts or recent requirements that are inconsistent with general environmental policies associated with such industries.” This was classed as an “administrative barrier”, and it was recommended that outreach to environmental, manufacturing, quality and procurement managers would be necessary to “initiate change” in cleaning specifications. To address the technical issues pertaining to quality of output, the report recommended continued investigation into green cleaners and which soils they most effectively clean, and that this information would be of great use to any company investigating green alternatives4. Discussion of Further Work Building upon what was learned in the chlorinated solvents study, in 2007 SAK conducted two dialogues with invited industry representatives to develop a methodology for more effectively assessing barriers to toxics use reduction. SAK noted at the outset of these discussions that many barriers are not actually experienced, but perceived, and different personnel report different barriers. SAK’s recommendation was that the methodology be designed to discover actual barriers by interviewing different personnel categories at each company and attempting to sort out the perceptions of barriers according to varying roles, responsibilities and perspectives. SAK developed this methodology to correct for the finding in its previous study that “many opinions were found to be based on hearsay, rumor, or speculation and not on direct involvement or knowledge.” SAK proposed the option of conducting an assessment of barriers at the macro level, which it denoted as the “policy” level. This method would involve digesting information in databases, to understand what is occurring in industrial populations. (For example, correlations might be found between regulatory changes and the use of particular chemicals). The other method is to assess barriers at the microlevel, which it denoted as the “facility” level. Surveys or phone interviews, as well as meetings, can be used for this purpose. In any evaluation of barriers it is possible to “drill down” to the specific information about barriers, (such as an alternative cleaner does not effectively clean a particular part), but as these specifics will vary from facility to facility, it is also necessary to maintain the ability to generalize from each instance. SAK termed this the level of “technical inquiry appropriate to the industry”. The focus-group participants agreed with SAK’s focus on differentiating between perceived and actual barriers, but determined that it would be difficult to substantiate whether apparent barriers truly existed, or whether they were merely perceived. Although the policy-level assessment holds great promise for producing correlations that could be used to draw conclusions about potential barriers, the focus group felt that it was more important to proceed on the micro-level. It was generally agreed that facility-level
4 The TURA program has made some efforts to implement such initiatives, such as helping to convince the Department of Defense to allow alterations in military specifications to allow for the use of safer solvents (OTA, early-mid 1990s, for several client companies), and establishing a laboratory for testing safer solvents (the Surface Solutions Laboratory of the Toxics Use Reduction Institute at the University of Massachusetts, Lowell).

5
assessment had greater power to identify barriers, and to distinguish actual from perceived barriers. To form an accurate picture of barriers facing toxics use reduction changes, SAK noted that the following department members could have very different perspectives at a facility: Environmental Health and Safety Manufacturing supervisors Facilities Quality Sales and Marketing Purchasing Vendors and Suppliers Union Officers Toxics Use Reduction Planners Customers Regulatory Affairs Managers Legal Owners CEOs In addition to interviewing a broad range of personnel with different roles and responsibilities, SAK suggested asking if their opinions were based on direct involvement or knowledge. In cases where opinions were not based on direct experience, SAK recommended categorizing them as second-hand information or speculation. Responses based on experience would be distinguished from unsupported expectations. When one party substantiated a barrier and another substantiated that a barrier did not exist, it would be necessary to follow up and attempt to reconcile the disparity in “substantiated” views. The list of barriers identified would then be presented back to the same interviewees, who would be asked to review and prioritize the substantiated barriers at the facility. SAK strongly recommended that the methodology of obtaining varied perspectives at a facility, asking for substantiation, and then reviewing results with interviewees would be far superior to the previous methodology employed for assessing barriers to switching from chlorinated solvents. In the prior methodology at some facilities only one person was interviewed, substantiation was not carefully reviewed, and there was no second review by interviewees. OTA and the focus group agreed with SAK’s recommendations concerning the methodology for assessing barriers, but OTA has not moved forward to implement them due to a lack of resources. OTA did move forward in conducting a low-cost survey that did not require significant financial or time resources and could be conducted as an in-house project. One outcome of SAK’s work as well as OTA’s internal discussions was a list of potential barriers and potential responses (actions to overcome the barriers). OTA

6
used this list in its subsequent efforts to understand barriers to toxics use reduction, pollution prevention, and resource conservation. Survey of Toxics Use Reduction Planners In Massachusetts, companies that use over certain threshold amounts of chemicals must perform toxics use reduction planning, and their plans must be certified by a Toxics Use Reduction Planner (TURP). TURPs must be qualified to do this work, and must take continuing education courses to maintain those qualifications. Some TURPs are qualified to certify that their own company’s effort was performed in good faith, and some TURPs are consultants who certify the planning efforts of several companies. In many cases the TURP becomes very involved in the examination of TUR opportunities and also well informed about how the company decides whether or not the opportunities are worth pursuing. Because companies that have performed three cycles of TUR planning are now also permitted to choose to implement Resource Conservation plans, TURPs are now concerned with energy efficiency, water conservation, and waste and pollution prevention other than TUR). At the annual conference of Toxics Use Reduction Planners (TURPs) hosted by the MA Toxics Use Reduction Institute in the winter of 2008, OTA conducted a survey of TURPs on their experiences with barriers to TUR, pollution prevention or resource conservation5. Two surveys were presented to forty-one workshop attendees. The first survey asked participates to respond in general to factors which act as or overcome barriers to implementing sustainable practices at their facilities. Participants were asked to rank the potential barriers as more or less important, and then to do the same for the potential actions that might overcome the barriers. The second survey requested participants to answer the same set of questions, but to apply them to a specific sustainability option with which they had direct experience. This option was to be one that they themselves felt was worth doing, that the company in question should have implemented, in their opinion6. The group was asked whether the survey was an effective way to solicit useful information. Participants felt that the question was important, and that it was very effective to conduct the survey in person, rather than taking the survey individually, by mail or online. There was fairly universal agreement that the “general” survey was very difficult to answer. The “specific” survey, they felt, was very easy, because it was focused on a very particular instance.
5 Participants were informed that for the purposes of the survey, the term “sustainable practices” was being used as shorthand for these three classes of activities. 6 We assume that practices identified by TURPs are more likely to be doable than those identified by a varied population, as TURPs are trained and in most cases very experienced in identifying implementable options. The formal TUR planning process includes assessing economic as well as technical feasibility, and they present their proposals to top management and must perform an adequate job of assessment in order to meet the legal standard for good faith TUR planning. That these options were probably on the whole more feasible and attractive meant that the barriers to the implementation of their selected options could be the most important ones to identify.

7
There were 38 responses to both surveys. The results are summarized below. Further detail is provided in Appendices A and B. Results of the General Survey Identifying Barriers Participants were asked to rank barriers in terms of importance (Most important, Important, Less Important, and Not Important). OTA has analyzed the results in two ways: firstly by averaging the responses for an overall ranking, and secondly by noting the responses most frequently rated as “most important” or “important”. The first method tells you in general how the entire population thinks about the whole range of choices. The second method is an important complement to the overall averaging, because it reveals factors that are important to a sizeable portion of the population, but which may not appear when all the responses are averaged. This is because if a particular option scores highly with some people, but very low with others, it will average out in the middle of the ranking. As expected, these two methods produced slightly different results. Averaging all the results produced the following top ten barriers:
• Quality • Capital Cost • Customer Requirements • Operating Cost • Productivity • Conformance to a Standard • Lack of Reliability • Technical Uncertainty • Regulatory Complications • Lack of Management Support
The barriers most frequently cited as “most important” were:
• Quality • Capital Cost • Productivity • Customer Requirements or Perception • Operating Cost • Conforming to a Standard

8
The following barriers were frequently cited as “important”7:
• Technical Difficulty • Physical Plant Limitations • Technical Uncertainty
Actions to Overcome Barriers Participants were asked to rank several actions to overcome barriers, in the same manner as barriers were ranked, above. Averaging all the results produced the following top ten actions to overcome barriers:
• Cost-Benefit Information • Stronger Incentives • Demonstration of Available Options • R&D on Specific Technical Limitations • Better Regulatory Drivers • Tax Breaks • Product Verifications • Lab Trials of Alternatives • More Vendor Choice • Workshops, Training, Education
The following actions were most frequently cited as “most important”.
• Cost Benefit Information • Stronger Incentives • Better Regulatory Drivers • R&D on Specific Technical Limitations • Demonstration of Available Options • Tax Breaks
The following actions were frequently cited as “important.”
• More Vendor Choice • Workshops, Training, education • Product Verifications
7 Barriers already noted as “most important” are not listed here, nor in the similar tables that follow, except in the full data set included in the Appendix.

9
• Stronger Incentives • Outreach to Staff
Results of the Specific Survey Identifying Barriers The second stage of the survey was performed exactly the same as what is described above, except that participants were asked to think about actual practices that they had identified as worth doing, but the company had decided not to go forward with implementation. (For a list of the specific sustainable practices identified by the participants, please see Appendix B). Averaging the responses produced the following top ten barriers:
• Quality • Lack of Reliability • Customer Requirements or Perception • Technical Uncertainty • Capital Cost • Conformance to a Standard • Operating Cost • Technical Difficulty • Lack of Management Support • Other Things More Important
As above, a slightly different analysis was performed, examining which barriers were cited most frequently as “most important” or “important”, and slightly different results were produced. The following barriers were most frequently cited as “most important”.
• Quality • Customer Requirements or Perception • Conformance to a Standard • Lack of Reliability • Operating Cost • Technical Uncertainty
The following barriers were frequently cited as “important”.
• Not Enough Benefit from Doing It • Technical Difficulty • Other Things More Important • Capital Cost
10
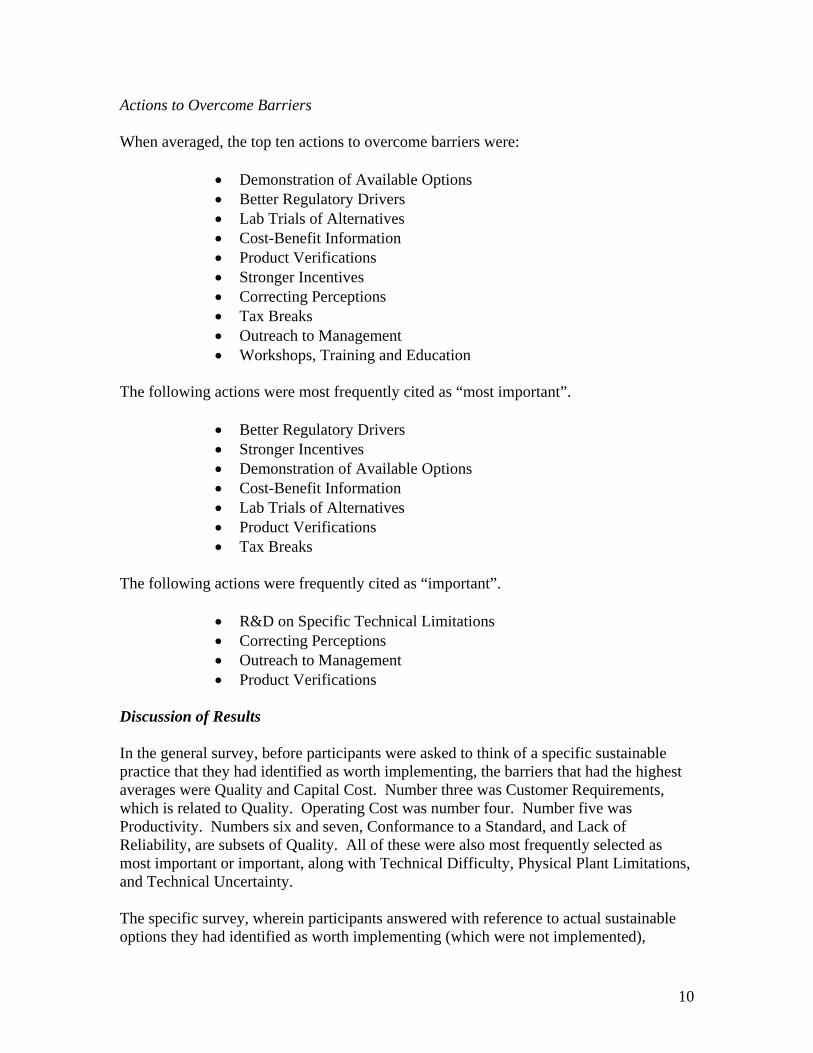
Actions to Overcome Barriers When averaged, the top ten actions to overcome barriers were:
• Demonstration of Available Options • Better Regulatory Drivers • Lab Trials of Alternatives • Cost-Benefit Information • Product Verifications • Stronger Incentives • Correcting Perceptions • Tax Breaks • Outreach to Management • Workshops, Training and Education
The following actions were most frequently cited as “most important”.
• Better Regulatory Drivers • Stronger Incentives • Demonstration of Available Options • Cost-Benefit Information • Lab Trials of Alternatives • Product Verifications • Tax Breaks
The following actions were frequently cited as “important”.
• R&D on Specific Technical Limitations • Correcting Perceptions • Outreach to Management • Product Verifications
Discussion of Results In the general survey, before participants were asked to think of a specific sustainable practice that they had identified as worth implementing, the barriers that had the highest averages were Quality and Capital Cost. Number three was Customer Requirements, which is related to Quality. Operating Cost was number four. Number five was Productivity. Numbers six and seven, Conformance to a Standard, and Lack of Reliability, are subsets of Quality. All of these were also most frequently selected as most important or important, along with Technical Difficulty, Physical Plant Limitations, and Technical Uncertainty. The specific survey, wherein participants answered with reference to actual sustainable options they had identified as worth implementing (which were not implemented),
11
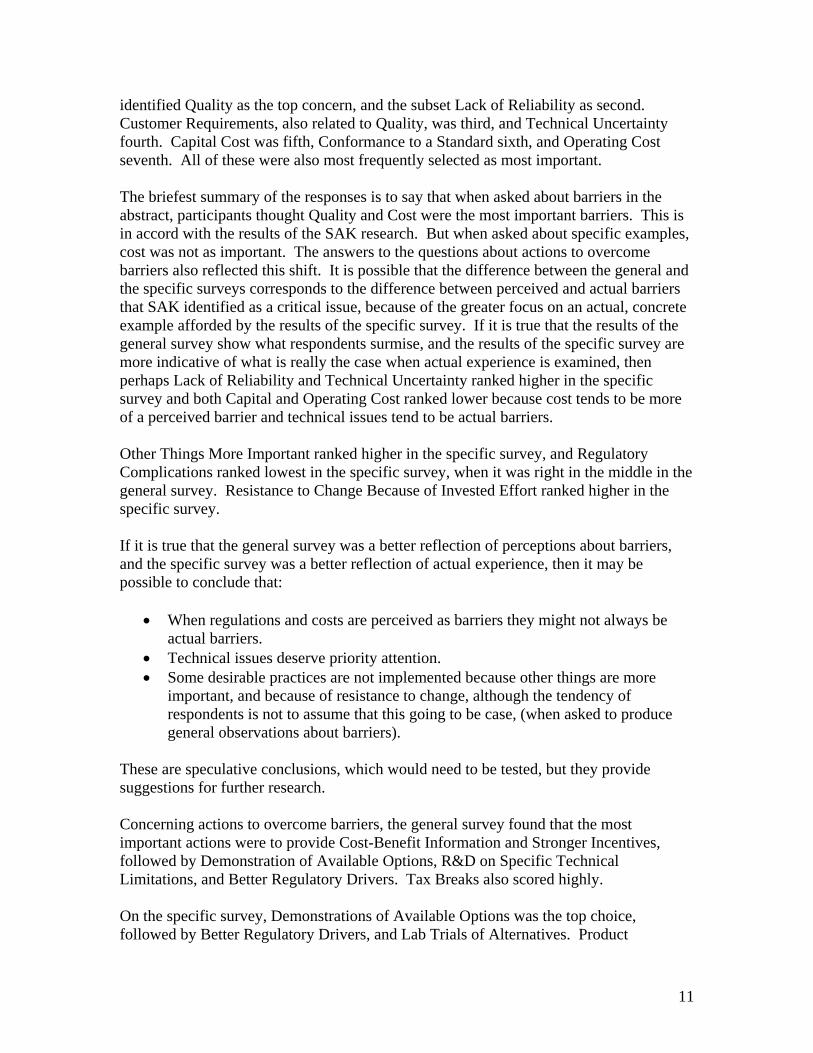
identified Quality as the top concern, and the subset Lack of Reliability as second. Customer Requirements, also related to Quality, was third, and Technical Uncertainty fourth. Capital Cost was fifth, Conformance to a Standard sixth, and Operating Cost seventh. All of these were also most frequently selected as most important. The briefest summary of the responses is to say that when asked about barriers in the abstract, participants thought Quality and Cost were the most important barriers. This is in accord with the results of the SAK research. But when asked about specific examples, cost was not as important. The answers to the questions about actions to overcome barriers also reflected this shift. It is possible that the difference between the general and the specific surveys corresponds to the difference between perceived and actual barriers that SAK identified as a critical issue, because of the greater focus on an actual, concrete example afforded by the results of the specific survey. If it is true that the results of the general survey show what respondents surmise, and the results of the specific survey are more indicative of what is really the case when actual experience is examined, then perhaps Lack of Reliability and Technical Uncertainty ranked higher in the specific survey and both Capital and Operating Cost ranked lower because cost tends to be more of a perceived barrier and technical issues tend to be actual barriers. Other Things More Important ranked higher in the specific survey, and Regulatory Complications ranked lowest in the specific survey, when it was right in the middle in the general survey. Resistance to Change Because of Invested Effort ranked higher in the specific survey. If it is true that the general survey was a better reflection of perceptions about barriers, and the specific survey was a better reflection of actual experience, then it may be possible to conclude that:
• When regulations and costs are perceived as barriers they might not always be actual barriers.
• Technical issues deserve priority attention. • Some desirable practices are not implemented because other things are more
important, and because of resistance to change, although the tendency of respondents is not to assume that this going to be case, (when asked to produce general observations about barriers).
These are speculative conclusions, which would need to be tested, but they provide suggestions for further research. Concerning actions to overcome barriers, the general survey found that the most important actions were to provide Cost-Benefit Information and Stronger Incentives, followed by Demonstration of Available Options, R&D on Specific Technical Limitations, and Better Regulatory Drivers. Tax Breaks also scored highly. On the specific survey, Demonstrations of Available Options was the top choice, followed by Better Regulatory Drivers, and Lab Trials of Alternatives. Product

12
Verifications, as well as Correcting Perceptions scored more highly on the specific survey. What we may surmise from this result is that perhaps people do not tend to think they need to have their perceptions corrected, and perhaps in general people don’t tend to be in favor of regulations, except when thinking about specific cases. The survey on actions to overcome barriers was similar to the survey on barriers in that the specific survey produced more of a focus on technical issues, and cost-related issues, including tax breaks, scored lower. Although in both general and specific surveys Cost-Benefit Information and Tax Breaks scored as important, Grants and Loans, Tailored Help for Stressed Companies, Marketing Help for Green Companies, and Special Help for Small Companies scored low. It is possible that this could have reflected the size or economic health of companies with which the respondents had experience, as it may be assumed that these latter actions would be more important to small, or stressed businesses. As respondents were not asked to identify themselves (or the companies they were thinking of) it is not possible to examine this more closely, but it is an important consideration for future investigations. Outreach to Staff scored better on the specific survey than on the general survey, but Outreach to Management scored in the middle on both surveys. This could also reflect the attitudes of the particular population participating in the survey, which was primarily composed of mid-level company officers or staff, and consultants. Recognition did not score highly, but because this might be more of a concern for management, this might also be a reflection of who took the survey, rather than what might provide effective motivation. Workshops, Training and Education, and Onsite Assistance scored in the middle in both surveys. Conclusions The research described herein is the state’s first systematic attempt to explore ways of answering the question, what are the barriers to toxics use reduction, pollution prevention, and resource conservation practices and how may they be overcome? The conclusions in this report must be regarded as provisional, as they are based on small survey samples. Further research would be necessary to produce firmer guidance on addressing barriers and assisting companies to become more sustainable. The primary findings are that cost and quality are the most important concerns, but the findings that some barriers are perceptual, not substantiated by experience, provides an indication that some cost barriers may be surmountable. This is also supported by the fact that companies implementing alternatives often had resulting savings. It may be possible to overcome concerns about cost with more information to correct misperceptions. It may be possible to overcome concerns about quality with more technical information, such as demonstrations and verifications. The data from the barriers surveys suggest ways to craft more specific investigation into the most important factors that prevent the adoption of desirable practices. That cost and quality are prime concerns could lead us to question what specific quality and capital costs arise when sustainable practices are considered. What specific factors affect quality

13
of product (durability, appearance, functionality)? What can be done to better identify and mitigate the particular costs and risks that pertain to particular sustainable practices? These questions might be best addressed in the context of applying specific recommended practices to similar operations. The following all scored as important actions for the state to consider: Cost-Benefit Information, Stronger Incentives, Better Regulatory Drivers, R&D on Specific Technical Limitations, Demonstration of Available Options, Tax Breaks, Lab Trials of Alternatives, Product Verifications, and Correcting Perceptions. But these are very general categories of actions. What kinds of cost-benefit information is needed? What kinds of incentives? How should regulations be changed so that they work more effectively as drivers of innovation? Exactly what R&D, Lab Trials, and Product Verifications do people want? How should a tax break be crafted? What specific perceptions need to be corrected? Future investigation should attempt to focus in on some of these questions. The TURA program conducts many initiatives to promote toxics use reduction, pollution prevention, and resource conservation. Future initiatives could be increasingly coupled with detailed interviews or follow-up pertaining to acceptance, assessing the reasons a facility chooses whether or not to implement a particular practice. The program has performed this kind of evaluation in the past. The results of this study reinforce considerations for continuing and perhaps expanding this work. The resulting information can be examined to determine if the risks are perceived or actual. If perceived, education, training and workshops can be deployed to address the barriers. If actual, technological research can be designed to address the barriers. Similarly, future surveying and research can be designed to focus on the cost question. If the cost barriers are perceived, then cost-benefit information might be sufficient to address them, provided in education, training and workshops. If the costs are actual, then different actions will be required to develop initiatives to assist in overcoming them. Any future surveys or focus groups should attempt to sort out perception from reality, and to derive information from specific cases. Future research should be concerned with substantiation of responses, and with garnering information specific enough, and pertinent to, the task of developing responses to barriers, whether actual or perceived. Such future research can include: measurement of the success of projects promoting sustainable practice implementation; live surveys of relevant professionals; online surveys of varied manufacturing populations; focus groups; solicitation of suggestions for incentives. Based on the research performed above, it is possible to conclude the following, concerning what the state might do to enhance implementation of TUR and other sustainable practices:
• Companies need help in addressing the risks to the quality of their output, when they consider making changes in their operations.

14
• Companies need to have a better understanding of the costs and benefits of the contemplated changes.
• Companies need specific information of a technical nature, including demonstration of alternatives, and they need help with the customers who buy their products, education, onsite assistance, and outreach.
• Some of the needed help pertains to correcting misperceptions about risks and costs.
SAK’s recommendations after conducting its focus groups included creating a “manufacturing dialogue” by which successful companies would share their experiences, and challenges and solutions when transitioning to greener alternatives. SAK recommended “dispelling perceived barriers” that may have dissuaded others from acting on feasible alternatives. The report noted that facility, manufacturing, quality and environmental managers, as well as company owners, should be included in this dialogue. One direction for research could be to more carefully analyze what has worked so far in decreasing or addressing the concerns manufacturing companies have had in relation to quality and costs, and to apply these successes to new target audiences. Manufacturing dialogues might be useful in communicating successful applications to others, as well as learning more about why seemingly desirable opportunities are not implemented. The more the Commonwealth can improve its practical knowledge of actual practices, about what has succeeded and failed, the better it can assist companies in implementation. Such practical knowledge will enable the Commonwealth to more accurately assess and communicate cost-benefit information, verify whether new products or technologies will actually work, or determine what trials or demonstrations are needed for verification. The more the Commonwealth listens to companies about what risks to quality or productivity they may face from implementation of alternatives, the better it can design responses to these risks, or prepare companies for their consideration. The more the Commonwealth communicates with companies on this specific and practical level, the more will be learned about why they decline implementation when they do. Following up on these efforts can afford information useful for more successfully promoting adoption of those toxics use reduction, pollution prevention, and resource conservation opportunities that make good business sense. Acknowledgements This Report was prepared by Environmental Analyst Richard Reibstein, under the direction of MA Office of Technical Assistance and Technology Director Richard Bizzozero. MIT interns Drew Loney, Nour Abdul-Razzak, Nitin Vaish and Melissa Webster provided invaluable assistance with data analysis, and we thank EOEEA’s Kerrie Bowie for arranging for their help. Helpful advice was provided on the final version of this report by Rachel Massey and Heather Tenney of the MA Toxics Use Reduction Institute, Julia Wolfe of the Massachusetts Department of Environmental Protection, and the Advisory Committee of the Toxics Use Reduction Act. Former OTA Director Paul Richard is credited with initiating this process of closely examining barriers

15
to the actions that the Toxics Use Reduction Act seeks to promote. The Office also wishes to thank the following participants in Barriers focus groups, whose suggestions and guidance were invaluable: Don Alger, Tom Balf, Ed Gomes, William Judd, Lee Miner, Gary Nedelman, Robert Rio, Susan Smits, and Armin Steiner, and other Toxics Use Reduction Planners who provided their insights and comments.

16
Appendix A General Survey Identifying Barriers Participants were asked to rank barriers in terms of importance. When all of the responses are averaged (Most important -1; Important - 2; Less Important – 3; Not Important – 4; No Response – 5) the results were as follows: (the lowest average number is the highest ranking in terms of importance): Quality (1.8) Capital Cost (2) Customer Requirements (2.1) Operating Cost (2.2) Productivity (2.3) Conformance to a Standard (2.5) Lack of Reliability (2.6) Technical Uncertainty (2.6) Regulatory Complications (2.6) Lack of Management Support (2.7) Physical Plant Limitations (2.7) Technical Difficulty (2.8) Not Enough Benefit to Do It (2.8) Not Enough Reason to Do It (2.9) Not Enough Time to Do It (3) Resistance to Change Because of Invested Effort (3) Other Things More Important (3) Lack of Staff Support (3.1) Not Enough Help to Do It (3.3) Respondents were also given the chance to identify “other” barriers, and none did. Another way of looking at the data is to see which barriers were most frequently ranked Most Important or Important. Barrier % of Respondents No. Respondents
Identifying this Barrier Identifying this Barrier As Most Important As Most Important
Quality 71% 27 Capital Cost 50% 19 Productivity 47% 18 Customer Requirements

17
or Perception 45% 17 Operating Cost 37% 14 Conforming to a Standard 37% 14 Barrier % of Respondents No. Respondents
Identifying this Barrier Identifying this Barrier As Important As Important
Technical Difficulty 50% 19 Physical Plant Limitations 42% 16 Technical Uncertainty 39% 15 Operating Cost 39% 15 Capital Cost 32% 12 Customer Requirements or Perception 29% 11 Actions to Overcome Barriers Participants were asked to rank several actions to overcome barriers, in the same manner as barriers were ranked, above. These responses were averaged, and the ranking in terms of importance was as follows: Cost-Benefit Information (2.4) Stronger Incentives (2.5) Demonstration of Available Options (2.6) R&D on Specific Technical Limitations (2.7) Better Regulatory Drivers (2.7) Tax Breaks (2.8) Product Verifications (2.8) Lab Trials of Alternatives (2.8) More Vendor Choice (2.9) Workshops, Training, Education (3) Outreach to Management (3) Onsite Assistance (3) Grants (3) Correcting Perceptions (3.1) Special Help for Small Companies (3.1) Recognition (3.2) Tailored Help for Stressed Companies (3.3) Outreach to Staff (3.3) Marketing Help for Green Companies (3.4) Loans (3.5) Several respondents provided information in the “other” category, as follows:

18
“Foreign competition is hurting Massachusetts manufacturers. We would love to do TUR but if it increases our cost of materials we cannot compete.” “Rebates, eliminate fees.” “Help people and the companies with new and innovative ideas.” “Integration into other ‘improvement’ programs and projects within the company.” “Delisting chemicals at specific levels of use in finished product.” The following actions were most frequently ranked as Most Important or Important. Action to Overcome % of Respondents No. Respondents Barrier Identifying this Action Identifying this Action As Most Important As Most Important Cost Benefit Information 32% 12 Stronger Incentives 29% 11 Better Regulatory Drivers 26% 10 R&D on Specific technical limitations 24% 9 Demonstration of available options 24% 9 Tax Breaks 24% 9 Action to Overcome % of Respondents No. Respondents Barrier Identifying this Action Identifying this Action As Important As Important More Vendor Choice 45% 17 Demonstration of available options 40% 15 Workshops, Training, education 37% 14 Cost-Benefit Information 37% 14 Product Verifications 37% 14 Stronger Incentives 34% 13 R&D on Specific technical limitations 34% 13 Outreach to Staff 34% 13

19
Appendix B Results of the Specific Survey Participants were asked to perform the same ranking of barriers and actions to overcome barriers, except that they were asked these questions with reference to actual sustainable practices that they thought should have been implemented, but were not. The specific sustainable practices identified by the participants were as follows: Replace meter to reduce energy consumption Vapor decreasing Water reclamation/reuse Replace acetone as cleaning solution for “Radome” panels Use of formaldehyde substitute as tissue fixative in pathology labs NAOH to KOH Formaldehyde substitute Changing parts clean to less toxic Switch to aqueous coatings away from current solvents based coatings Replace a liquid biocide that gets incorporated into the product with a solid. The liquid coating is a pthalate-based plasticizer, a VOC, and is corrosive. The solid is not dependent on the VOC or additional pthalate. Using 0.003% lead in zinc vs 1% lead in zinc for galvanizing Reverse Osmosis for water Recycle Deionized water after purification Chemical use reduction for medical use material production General chemical subsitution Using diisocyanate in foam packaging for parts Electrodes copper US direct metalization Chrorinated solvent replacement Using bioproducts/natural materials Trying to eliminate lead from a product or eliminate the lead containing product Substituting 100% diesel fuel for generator to bio-diesel mix Safer alternative chemicals Switched from highly toxic solvent/carrier to less toxic. Not willing/able to switch to non-listed compounds Alternatives to lead compounds in PVC W&C materials Switch from “pirhana” etch to rapid thermal anneal Propylene based paints vs ethylene based paints Replacing a flammable solvent with a non-flammable solvent Reduced Ethanol use in surface decontamination Switch all production to lead-free solder Water recycling Ultra filter to Reverse Osmosis. For water reclaim for planting and water fab. Change from hexavalent black chromate to trivalent black chromate Water reduction (process) Low VOC inks

20
Switch plating line from cyanide based to non-cyanide Acetone clean-up solutions Respondents ranked the identified barriers as follows: Quality (1.9) Lack of Reliability (2.4) Customer Requirements or Perception (2.4) Technical Uncertainty (2.5) Capital Cost (2.6) Conformance to a Standard (2.6) Operating Cost (2.7) Technical Difficulty (2.8) Lack of Management Support (2.8) Other Things More Important (2.8) Not Enough Benefit from Doing It (2.9) Resistance To Change Because of Invested Effort (3) Not Enough Help to Do It (3.2) Not Enough Reasons to Do It (3.2) Lack of Staff Support (3.2) Not Enough Time to Do It (3.3) Physical Plant Limitations (3.3) Regulatory Complications (3.4) The following barriers were most frequently selected as Most Important or Important. Barrier % of Respondents No. Respondents
Identifying this Barrier Identifying this Barrier As Most Important As Most Important
Quality 63% 25 Customer Requirements or Perception 43% 17 Conformance to a Standard 35% 14 Lack of Reliability 30% 12 Operating Cost 28% 11 Technical Uncertainty 28% 11 Barrier % of Respondents No. Respondents
Identifying this Barrier Identifying this Barrier As Important As Important
Not Enough Benefit from Doing It 43% 17 Technical Difficulty 38% 15

21
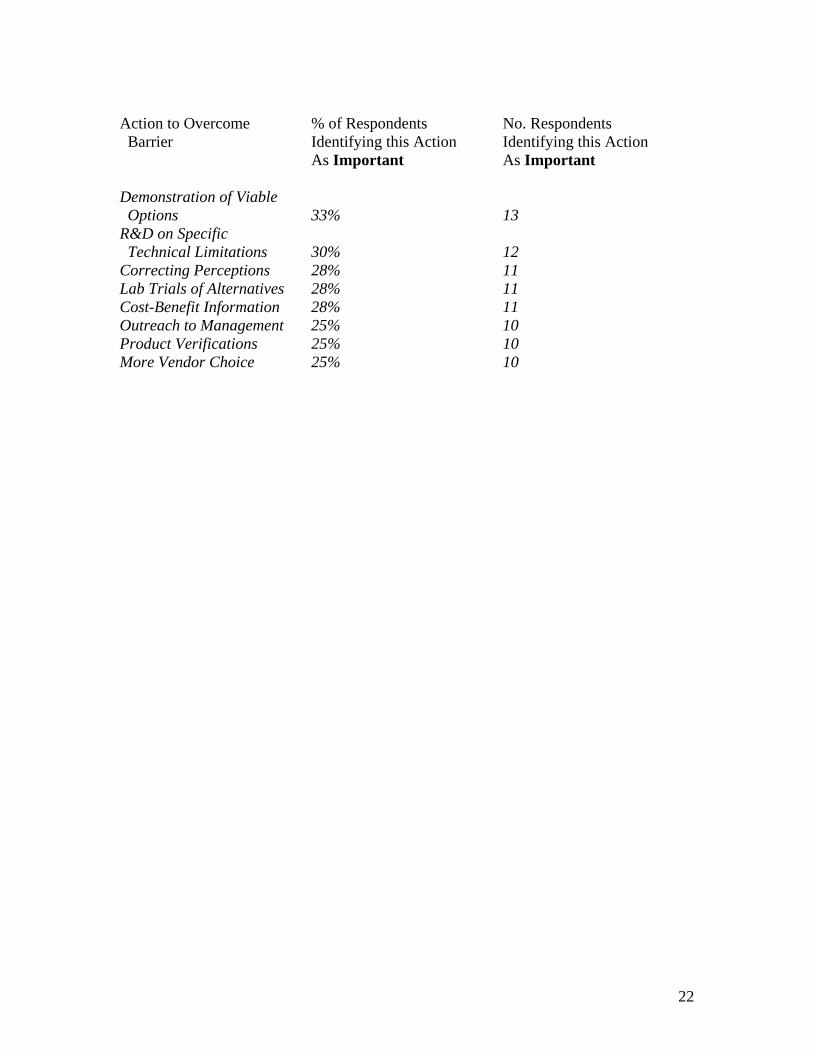
Lack of Reliability 35% 14 Other Things More Important 33% 13 Capital Cost 33% 13 Technical Uncertainty 30% 12 Actions to Overcome Barriers Participants ranked the identified actions in the following manner: Demonstration of Available Options (2.4) Better Regulatory Drivers (2.5) Lab Trials of Alternatives (2.5) Cost-Benefit Information (2.6) Product Verifications (2.7) Stronger Incentives (2.7) Correcting Perceptions (2.8) Tax Breaks (3) Outreach to Management (3.1) Workshops, Training and Education (3.2) Outreach to Staff (3.2) Onsite Assistance (3.3) More Vendor Choice (3.3) Recognition (3.3) Special Help for Small Companies (3.4) Marketing Help for Green Companies (3.5) Tailored Help for Stressed Companies (3.6) Grants (3.7) Loans (3.9) The following actions were most frequently cited as Most Important or Important. Action to Overcome % of Respondents No. Respondents Barrier Identifying this Action Identifying this Action As Most Important As Most Important Better Regulatory Drivers 38% 15 Stronger Incentives 38% 15 Demonstration of Available Options 35% 14 Cost-Benefit Information 33% 13 Lab Trials of Alternatives 30% 12 Product Verifications 30% 12 Tax Breaks 30% 12
22
Action to Overcome % of Respondents No. Respondents Barrier Identifying this Action Identifying this Action As Important As Important Demonstration of Viable Options 33% 13 R&D on Specific Technical Limitations 30% 12 Correcting Perceptions 28% 11 Lab Trials of Alternatives 28% 11 Cost-Benefit Information 28% 11 Outreach to Management 25% 10 Product Verifications 25% 10 More Vendor Choice 25% 10