basel iii data (consolidated) basel iii disclosure fiscal 2012 outline of restrictions on transfer...
TRANSCRIPT
29
Contents
Scope of Consolidation 30
Composition of Equity Capital 32
Capital Adequacy 43
Credit Risk 45
Credit Risk Mitigation 58
Derivative Transactions and Long Settlement Transactions 59
Securitization Exposures
(Subject to calculation of credit risk assets) 60
Securitization Exposures
(Subject to calculation of market risk equivalent amount) 69
Market Risk 71
Equity Exposures in Banking Book 73
Exposures Relating to Funds 74
Interest Rate Risk in the Banking Book (IRRBB) 75
Basel III Data (Consolidated) Fiscal 2012
30
Basel III Disclosure Fiscal 2012
In accordance with the provisions of Article 52-25 of the Banking Law of Japan, Mitsubishi UFJ Financial Group (MUFG) adopts the
“International regulatory framework” to calculate its capital adequacy ratio based on formulas contained in the standards for the
consolidated capital adequacy ratio of bank holding companies (Notification of the Financial Services Agency No. 20, 2006; referred
to hereinafter as the “FSA Holding Company Capital Adequacy Notification”) to assess capital adequacy in light of the assets we
own on a consolidated basis.
With regard to the calculation of the consolidated capital adequacy ratio, MUFG received an independent audit by Deloitte Touche
Tohmatsu (DTT) LLC in accordance with “Treatment of Inspection of the Capital Ratio Calculation Framework Based on Agreed-
Upon Procedures” (JICPA Industry Committee Report No. 30). With regard to part of the internal controls structure governing calcu-
lation of the consolidated capital adequacy ratio, MUFG received a report from DTT LLC, which conducted certain procedures as
deemed necessary by MUFG. The procedures conducted by the independent auditor were not part of an accounting audit of the
consolidated financial statements, and we did not receive any audit opinion with regard to our internal controls structure governing
the calculation of the consolidated capital adequacy ratio or the related consolidated capital adequacy ratio.
Scope of Consolidation
Notes on the scope of consolidation
Differences between those companies
belonging to the corporate group (here-
inafter, the “holding company group”) to
which the calculation of consolidated
capital adequacy ratio as stipulated in
Articles 3 or 15 of the FSA Holding
Company Capital Adequacy Notification
is applicable and those companies that
are included in the scope of consolidation
for accounting purposes
Paragraph 1 of Article 3 of the FSA Holding Company Capital Adequacy Notification
states that “the provisions of Paragraph 2 of Article 5 of the Japanese regulations
pertaining to consolidated financial statements shall not apply” to “financial subsid-
iaries” of a bank holding company. Moreover, Paragraph 2 of the said Article 3 states
that “insurance-related subsidiaries” of a bank holding company “shall not be includ-
ed in the scope of consolidation.”
In addition, with regard to affiliated companies engaged in financial operations, the
FSA Consolidated Capital Adequacy Notification states that, provided certain condi-
tions are met, such companies “can be included in the scope of consolidation and in
the calculation of the consolidated capital adequacy ratio using pro rata consolida-
tion” (under which only those portions of the affiliated company’s assets, liabilities,
income and expenditures that are attributable to the bank holding company or any
consolidated subsidiaries with investments in the said affiliated company are included
in the scope of consolidation).
MUFG Group had no companies to which the above exception applied as of March
31, 2012, or March 31, 2013, and there were no differences between those compa-
nies belonging to the “holding company group” and those companies that are
included in the “scope of consolidation for accounting purposes.”
Number of consolidated subsidiaries, and
names and principal businesses of major
consolidated subsidiaries of the holding
company group
224 companies as of March 31, 2012; 220 companies as of March 31, 2013
The Bank of Tokyo-Mitsubishi UFJ, Ltd. (banking business), Mitsubishi UFJ Trust and
Banking Corporation (trust/banking business), Mitsubishi UFJ Securities Holdings Co.,
Ltd. (securities business), etc.
Number of affiliated companies engaged
in financial operations which are subject to
Articles 9 or 21 of the FSA Holding
Company Capital Adequacy Notification,
and names, amounts of total assets and
net assets shown on the balance sheet and
principal businesses of affiliated companies
engaged in these financial operations
Not applicable as of March 31, 2012 and 2013
Names, amounts of total assets and net
assets shown on the balance sheet, and
principal businesses of companies belong-
ing to the holding company group that
are not included in the scope of consolida-
tion for accounting purposes, and of com-
panies not belonging to the holding
company group but included in the scope
of consolidation for accounting purposes
Not applicable as of March 31, 2012 and 2013
31
Basel III Disclosure Fiscal 2012
Outline of restrictions on transfer of
funds or equity capital within the holding
company group
As of March 31, 2012 and 2013, transfer of funds or capital within the MUFG Group
is conducted with all due consideration given to the appropriateness of each action.
We give priority in ensuring that each group company maintains sufficient capital
level for legal and regulatory compliance purposes. Care is also taken to ensure that
actions do not compromise sound and proper operations, while eliminating negative
effects on payment capacity, liquidity or profitability.
Companies that are deficient in regulatory capital and total regulatory capital deficiencies
Names of any other financial institutions,
etc., classified as subsidiaries or other
members of the bank holding company
that are deficient in regulatory capital,
and corresponding total regulatory capi-
tal deficiencies
Not applicable as of March 31, 2012 and 2013
32
Basel III Disclosure Fiscal 2012
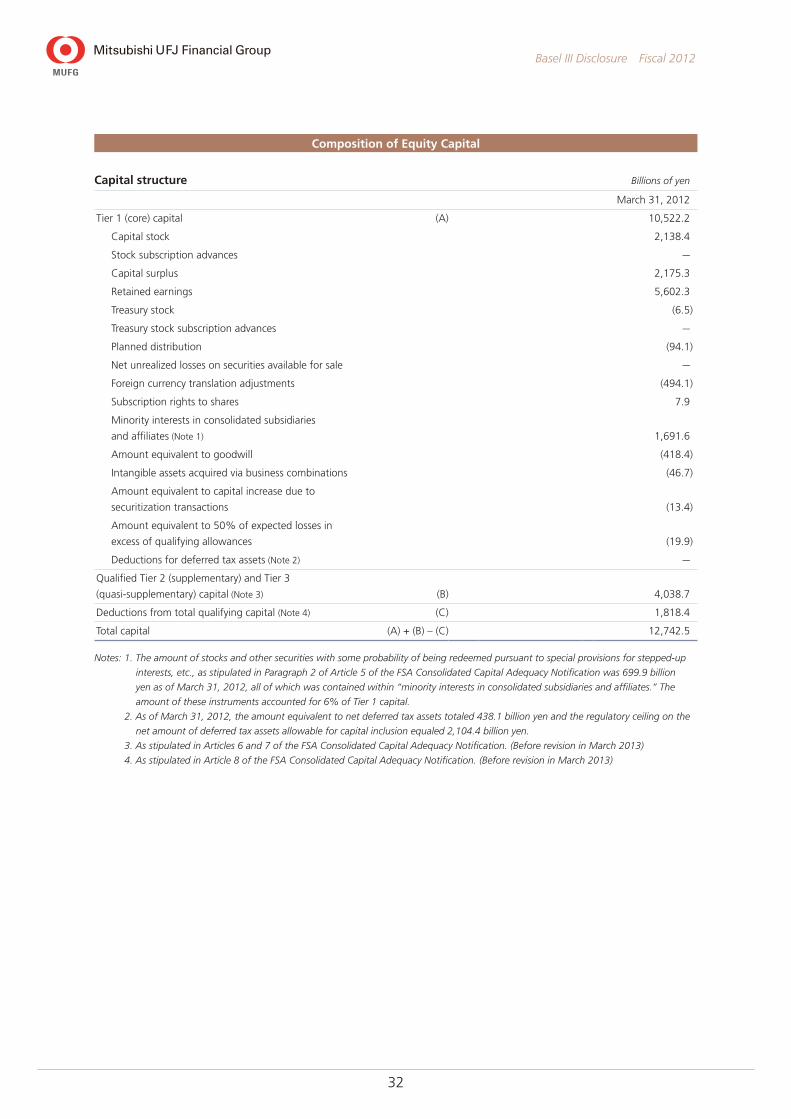
Composition of Equity Capital
Capital structure Billions of yen
March 31, 2012
Tier 1 (core) capital (A) 10,522.2
Capital stock 2,138.4
Stock subscription advances —
Capital surplus 2,175.3
Retained earnings 5,602.3
Treasury stock (6.5)
Treasury stock subscription advances —
Planned distribution (94.1)
Net unrealized losses on securities available for sale —
Foreign currency translation adjustments (494.1)
Subscription rights to shares 7.9
Minority interests in consolidated subsidiaries
and affiliates (Note 1) 1,691.6
Amount equivalent to goodwill (418.4)
Intangible assets acquired via business combinations (46.7)
Amount equivalent to capital increase due to
securitization transactions (13.4)
Amount equivalent to 50% of expected losses in
excess of qualifying allowances (19.9)
Deductions for deferred tax assets (Note 2) —
Qualified Tier 2 (supplementary) and Tier 3
(quasi-supplementary) capital (Note 3) (B) 4,038.7
Deductions from total qualifying capital (Note 4) (C) 1,818.4
Total capital (A) + (B) – (C) 12,742.5
Notes: 1. The amount of stocks and other securities with some probability of being redeemed pursuant to special provisions for stepped-up
interests, etc., as stipulated in Paragraph 2 of Article 5 of the FSA Consolidated Capital Adequacy Notification was 699.9 billion
yen as of March 31, 2012, all of which was contained within “minority interests in consolidated subsidiaries and affiliates.” The
amount of these instruments accounted for 6% of Tier 1 capital.
2. As of March 31, 2012, the amount equivalent to net deferred tax assets totaled 438.1 billion yen and the regulatory ceiling on the
net amount of deferred tax assets allowable for capital inclusion equaled 2,104.4 billion yen.
3. As stipulated in Articles 6 and 7 of the FSA Consolidated Capital Adequacy Notification. (Before revision in March 2013)
4. As stipulated in Article 8 of the FSA Consolidated Capital Adequacy Notification. (Before revision in March 2013)
33
Basel III Disclosure Fiscal 2012
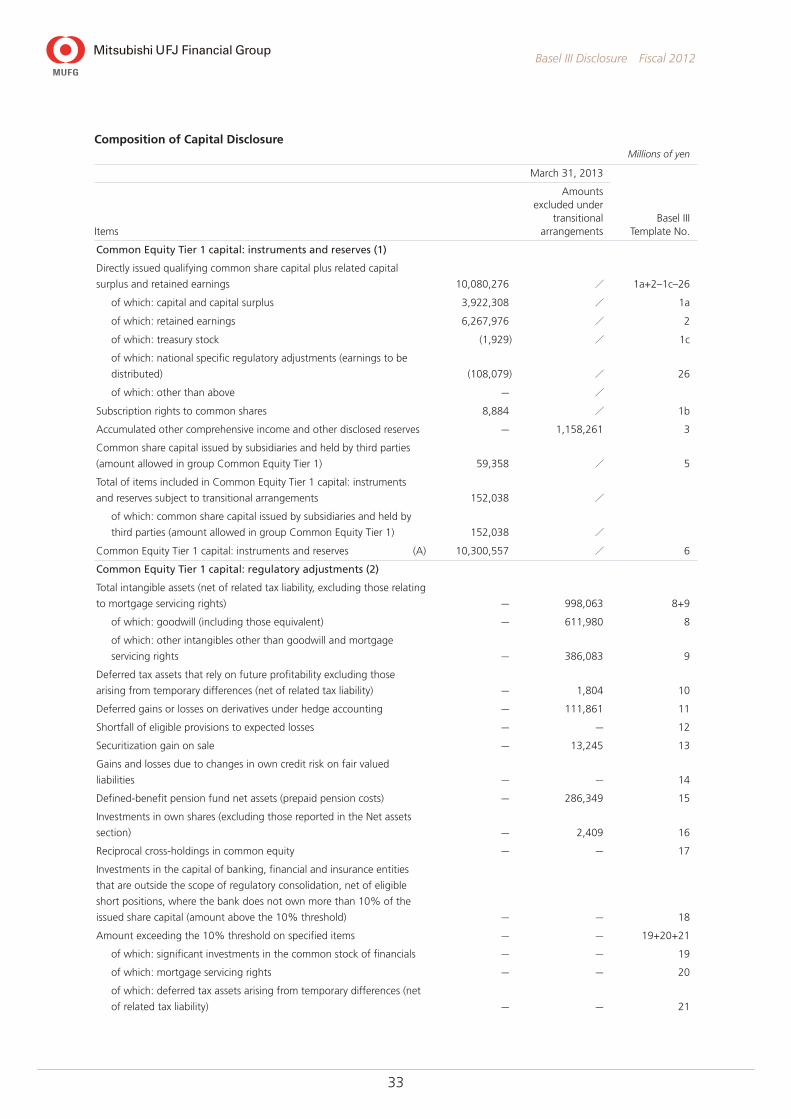
Composition of Capital DisclosureMillions of yen
March 31, 2013
Basel III Template No.Items
Amounts excluded under
transitional arrangements
Common Equity Tier 1 capital: instruments and reserves (1)
Directly issued qualifying common share capital plus related capital
surplus and retained earnings 10,080,276 / 1a+2–1c–26
of which: capital and capital surplus 3,922,308 / 1a
of which: retained earnings 6,267,976 / 2
of which: treasury stock (1,929) / 1c
of which: national specific regulatory adjustments (earnings to be
distributed) (108,079) / 26
of which: other than above — /
Subscription rights to common shares 8,884 / 1b
Accumulated other comprehensive income and other disclosed reserves — 1,158,261 3
Common share capital issued by subsidiaries and held by third parties
(amount allowed in group Common Equity Tier 1) 59,358 / 5
Total of items included in Common Equity Tier 1 capital: instruments
and reserves subject to transitional arrangements 152,038 /
of which: common share capital issued by subsidiaries and held by
third parties (amount allowed in group Common Equity Tier 1) 152,038 /
Common Equity Tier 1 capital: instruments and reserves (A) 10,300,557 / 6
Common Equity Tier 1 capital: regulatory adjustments (2)
Total intangible assets (net of related tax liability, excluding those relating
to mortgage servicing rights) — 998,063 8+9
of which: goodwill (including those equivalent) — 611,980 8
of which: other intangibles other than goodwill and mortgage
servicing rights — 386,083 9
Deferred tax assets that rely on future profitability excluding those
arising from temporary differences (net of related tax liability) — 1,804 10
Deferred gains or losses on derivatives under hedge accounting — 111,861 11
Shortfall of eligible provisions to expected losses — — 12
Securitization gain on sale — 13,245 13
Gains and losses due to changes in own credit risk on fair valued
liabilities — — 14
Defined-benefit pension fund net assets (prepaid pension costs) — 286,349 15
Investments in own shares (excluding those reported in the Net assets
section) — 2,409 16
Reciprocal cross-holdings in common equity — — 17
Investments in the capital of banking, financial and insurance entities
that are outside the scope of regulatory consolidation, net of eligible
short positions, where the bank does not own more than 10% of the
issued share capital (amount above the 10% threshold) — — 18
Amount exceeding the 10% threshold on specified items — — 19+20+21
of which: significant investments in the common stock of financials — — 19
of which: mortgage servicing rights — — 20
of which: deferred tax assets arising from temporary differences (net
of related tax liability) — — 21
34
Basel III Disclosure Fiscal 2012
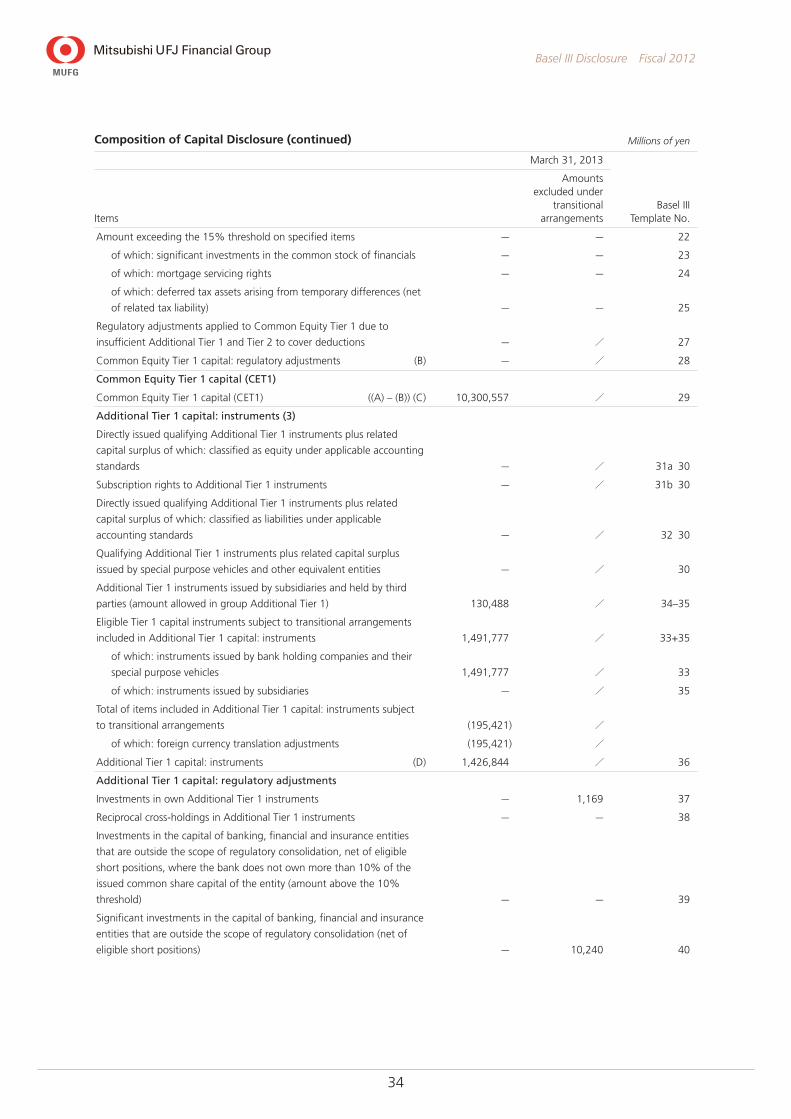
Composition of Capital Disclosure (continued) Millions of yen
March 31, 2013
Basel III Template No.Items
Amounts excluded under
transitional arrangements
Amount exceeding the 15% threshold on specified items — — 22
of which: significant investments in the common stock of financials — — 23
of which: mortgage servicing rights — — 24
of which: deferred tax assets arising from temporary differences (net
of related tax liability) — — 25
Regulatory adjustments applied to Common Equity Tier 1 due to
insufficient Additional Tier 1 and Tier 2 to cover deductions — / 27
Common Equity Tier 1 capital: regulatory adjustments (B) — / 28
Common Equity Tier 1 capital (CET1)
Common Equity Tier 1 capital (CET1) ((A) – (B)) (C) 10,300,557 / 29
Additional Tier 1 capital: instruments (3)
Directly issued qualifying Additional Tier 1 instruments plus related
capital surplus of which: classified as equity under applicable accounting
standards — / 31a 30
Subscription rights to Additional Tier 1 instruments — / 31b 30
Directly issued qualifying Additional Tier 1 instruments plus related
capital surplus of which: classified as liabilities under applicable
accounting standards — / 32 30
Qualifying Additional Tier 1 instruments plus related capital surplus
issued by special purpose vehicles and other equivalent entities — / 30
Additional Tier 1 instruments issued by subsidiaries and held by third
parties (amount allowed in group Additional Tier 1) 130,488 / 34–35
Eligible Tier 1 capital instruments subject to transitional arrangements
included in Additional Tier 1 capital: instruments 1,491,777 / 33+35
of which: instruments issued by bank holding companies and their
special purpose vehicles 1,491,777 / 33
of which: instruments issued by subsidiaries — / 35
Total of items included in Additional Tier 1 capital: instruments subject
to transitional arrangements (195,421) /
of which: foreign currency translation adjustments (195,421) /
Additional Tier 1 capital: instruments (D) 1,426,844 / 36
Additional Tier 1 capital: regulatory adjustments
Investments in own Additional Tier 1 instruments — 1,169 37
Reciprocal cross-holdings in Additional Tier 1 instruments — — 38
Investments in the capital of banking, financial and insurance entities
that are outside the scope of regulatory consolidation, net of eligible
short positions, where the bank does not own more than 10% of the
issued common share capital of the entity (amount above the 10%
threshold) — — 39
Significant investments in the capital of banking, financial and insurance
entities that are outside the scope of regulatory consolidation (net of
eligible short positions) — 10,240 40
35
Basel III Disclosure Fiscal 2012
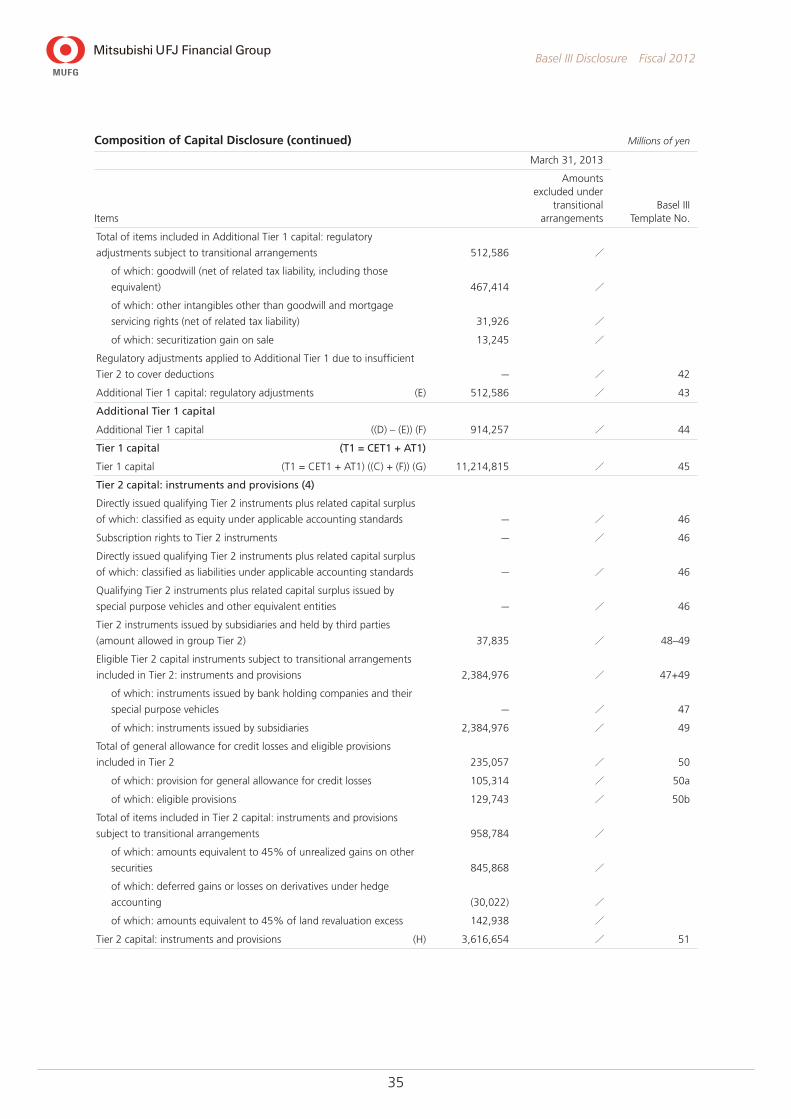
Composition of Capital Disclosure (continued) Millions of yen
March 31, 2013
Basel III Template No.Items
Amounts excluded under
transitional arrangements
Total of items included in Additional Tier 1 capital: regulatory
adjustments subject to transitional arrangements 512,586 /
of which: goodwill (net of related tax liability, including those
equivalent) 467,414 /
of which: other intangibles other than goodwill and mortgage
servicing rights (net of related tax liability) 31,926 /
of which: securitization gain on sale 13,245 /
Regulatory adjustments applied to Additional Tier 1 due to insufficient
Tier 2 to cover deductions — / 42
Additional Tier 1 capital: regulatory adjustments (E) 512,586 / 43
Additional Tier 1 capital
Additional Tier 1 capital ((D) – (E)) (F) 914,257 / 44
Tier 1 capital (T1 = CET1 + AT1)
Tier 1 capital (T1 = CET1 + AT1) ((C) + (F)) (G) 11,214,815 / 45
Tier 2 capital: instruments and provisions (4)
Directly issued qualifying Tier 2 instruments plus related capital surplus
of which: classified as equity under applicable accounting standards — / 46
Subscription rights to Tier 2 instruments — / 46
Directly issued qualifying Tier 2 instruments plus related capital surplus
of which: classified as liabilities under applicable accounting standards — / 46
Qualifying Tier 2 instruments plus related capital surplus issued by
special purpose vehicles and other equivalent entities — / 46
Tier 2 instruments issued by subsidiaries and held by third parties
(amount allowed in group Tier 2) 37,835 / 48–49
Eligible Tier 2 capital instruments subject to transitional arrangements
included in Tier 2: instruments and provisions 2,384,976 / 47+49
of which: instruments issued by bank holding companies and their
special purpose vehicles — / 47
of which: instruments issued by subsidiaries 2,384,976 / 49
Total of general allowance for credit losses and eligible provisions
included in Tier 2 235,057 / 50
of which: provision for general allowance for credit losses 105,314 / 50a
of which: eligible provisions 129,743 / 50b
Total of items included in Tier 2 capital: instruments and provisions
subject to transitional arrangements 958,784 /
of which: amounts equivalent to 45% of unrealized gains on other
securities 845,868 /
of which: deferred gains or losses on derivatives under hedge
accounting (30,022) /
of which: amounts equivalent to 45% of land revaluation excess 142,938 /
Tier 2 capital: instruments and provisions (H) 3,616,654 / 51
36
Basel III Disclosure Fiscal 2012
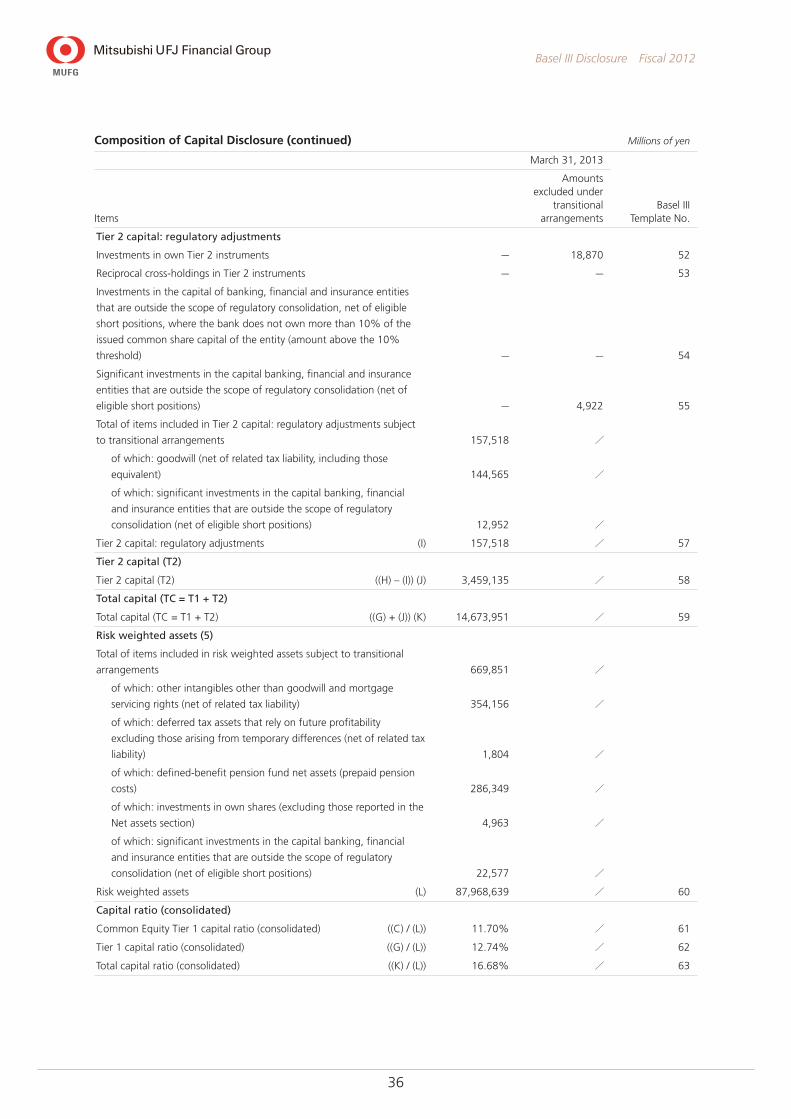
Composition of Capital Disclosure (continued) Millions of yen
March 31, 2013
Basel III Template No.Items
Amounts excluded under
transitional arrangements
Tier 2 capital: regulatory adjustments
Investments in own Tier 2 instruments — 18,870 52
Reciprocal cross-holdings in Tier 2 instruments — — 53
Investments in the capital of banking, financial and insurance entities
that are outside the scope of regulatory consolidation, net of eligible
short positions, where the bank does not own more than 10% of the
issued common share capital of the entity (amount above the 10%
threshold) — — 54
Significant investments in the capital banking, financial and insurance
entities that are outside the scope of regulatory consolidation (net of
eligible short positions) — 4,922 55
Total of items included in Tier 2 capital: regulatory adjustments subject
to transitional arrangements 157,518 /
of which: goodwill (net of related tax liability, including those
equivalent) 144,565 /
of which: significant investments in the capital banking, financial
and insurance entities that are outside the scope of regulatory
consolidation (net of eligible short positions) 12,952 /
Tier 2 capital: regulatory adjustments (I) 157,518 / 57
Tier 2 capital (T2)
Tier 2 capital (T2) ((H) – (I)) (J) 3,459,135 / 58
Total capital (TC = T1 + T2)
Total capital (TC = T1 + T2) ((G) + (J)) (K) 14,673,951 / 59
Risk weighted assets (5)
Total of items included in risk weighted assets subject to transitional
arrangements 669,851 /
of which: other intangibles other than goodwill and mortgage
servicing rights (net of related tax liability) 354,156 /
of which: deferred tax assets that rely on future profitability
excluding those arising from temporary differences (net of related tax
liability) 1,804 /
of which: defined-benefit pension fund net assets (prepaid pension
costs) 286,349 /
of which: investments in own shares (excluding those reported in the
Net assets section) 4,963 /
of which: significant investments in the capital banking, financial
and insurance entities that are outside the scope of regulatory
consolidation (net of eligible short positions) 22,577 /
Risk weighted assets (L) 87,968,639 / 60
Capital ratio (consolidated)
Common Equity Tier 1 capital ratio (consolidated) ((C) / (L)) 11.70% / 61
Tier 1 capital ratio (consolidated) ((G) / (L)) 12.74% / 62
Total capital ratio (consolidated) ((K) / (L)) 16.68% / 63
37
Basel III Disclosure Fiscal 2012
Composition of Capital Disclosure (continued) Millions of yen
March 31, 2013
Basel III Template No.Items
Amounts excluded under
transitional arrangements
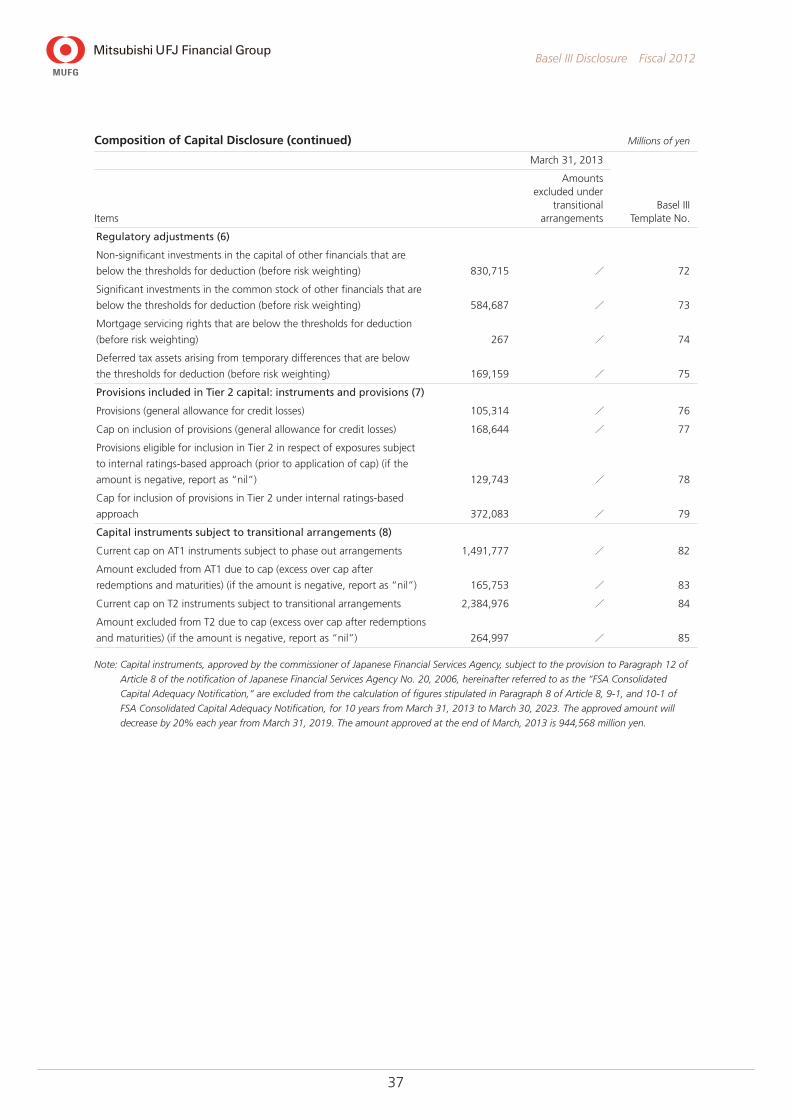
Regulatory adjustments (6)
Non-significant investments in the capital of other financials that are
below the thresholds for deduction (before risk weighting) 830,715 / 72
Significant investments in the common stock of other financials that are
below the thresholds for deduction (before risk weighting) 584,687 / 73
Mortgage servicing rights that are below the thresholds for deduction
(before risk weighting) 267 / 74
Deferred tax assets arising from temporary differences that are below
the thresholds for deduction (before risk weighting) 169,159 / 75
Provisions included in Tier 2 capital: instruments and provisions (7)
Provisions (general allowance for credit losses) 105,314 / 76
Cap on inclusion of provisions (general allowance for credit losses) 168,644 / 77
Provisions eligible for inclusion in Tier 2 in respect of exposures subject
to internal ratings-based approach (prior to application of cap) (if the
amount is negative, report as “nil”) 129,743 / 78
Cap for inclusion of provisions in Tier 2 under internal ratings-based
approach 372,083 / 79
Capital instruments subject to transitional arrangements (8)
Current cap on AT1 instruments subject to phase out arrangements 1,491,777 / 82
Amount excluded from AT1 due to cap (excess over cap after
redemptions and maturities) (if the amount is negative, report as “nil”) 165,753 / 83
Current cap on T2 instruments subject to transitional arrangements 2,384,976 / 84
Amount excluded from T2 due to cap (excess over cap after redemptions
and maturities) (if the amount is negative, report as “nil”) 264,997 / 85
Note: Capital instruments, approved by the commissioner of Japanese Financial Services Agency, subject to the provision to Paragraph 12 of
Article 8 of the notification of Japanese Financial Services Agency No. 20, 2006, hereinafter referred to as the “FSA Consolidated
Capital Adequacy Notification,” are excluded from the calculation of figures stipulated in Paragraph 8 of Article 8, 9-1, and 10-1 of
FSA Consolidated Capital Adequacy Notification, for 10 years from March 31, 2013 to March 30, 2023. The approved amount will
decrease by 20% each year from March 31, 2019. The amount approved at the end of March, 2013 is 944,568 million yen.
38
Basel III Disclosure Fiscal 2012
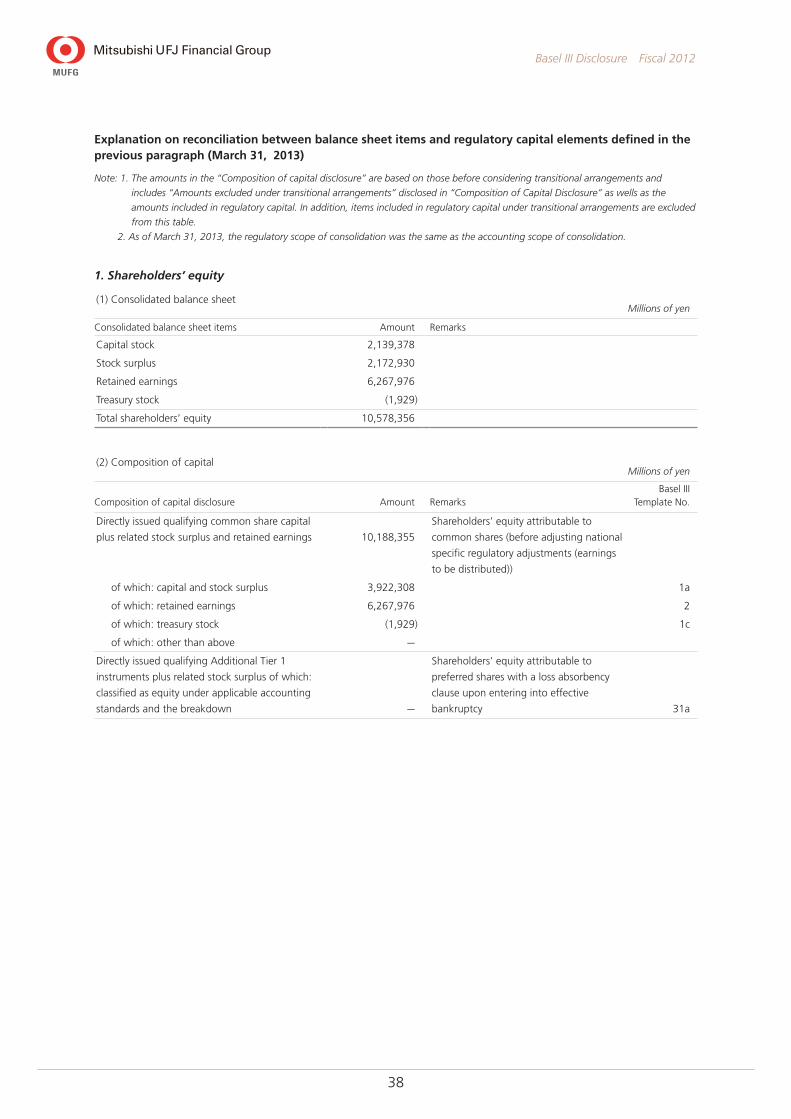
Explanation on reconciliation between balance sheet items and regulatory capital elements defined in the previous paragraph (March 31, 2013)
Note: 1. The amounts in the “Composition of capital disclosure” are based on those before considering transitional arrangements and
includes “Amounts excluded under transitional arrangements” disclosed in “Composition of Capital Disclosure” as wells as the
amounts included in regulatory capital. In addition, items included in regulatory capital under transitional arrangements are excluded
from this table.
2. As of March 31, 2013, the regulatory scope of consolidation was the same as the accounting scope of consolidation.
1. Shareholders’ equity
(1) Consolidated balance sheetMillions of yen
Consolidated balance sheet items Amount Remarks
Capital stock 2,139,378
Stock surplus 2,172,930
Retained earnings 6,267,976
Treasury stock (1,929)
Total shareholders’ equity 10,578,356
(2) Composition of capitalMillions of yen
Composition of capital disclosure Amount RemarksBasel III
Template No.
Directly issued qualifying common share capital
plus related stock surplus and retained earnings 10,188,355
Shareholders’ equity attributable to
common shares (before adjusting national
specific regulatory adjustments (earnings
to be distributed))
of which: capital and stock surplus 3,922,308 1a
of which: retained earnings 6,267,976 2
of which: treasury stock (1,929) 1c
of which: other than above —
Directly issued qualifying Additional Tier 1
instruments plus related stock surplus of which:
classified as equity under applicable accounting
standards and the breakdown —
Shareholders’ equity attributable to
preferred shares with a loss absorbency
clause upon entering into effective
bankruptcy 31a
39
Basel III Disclosure Fiscal 2012
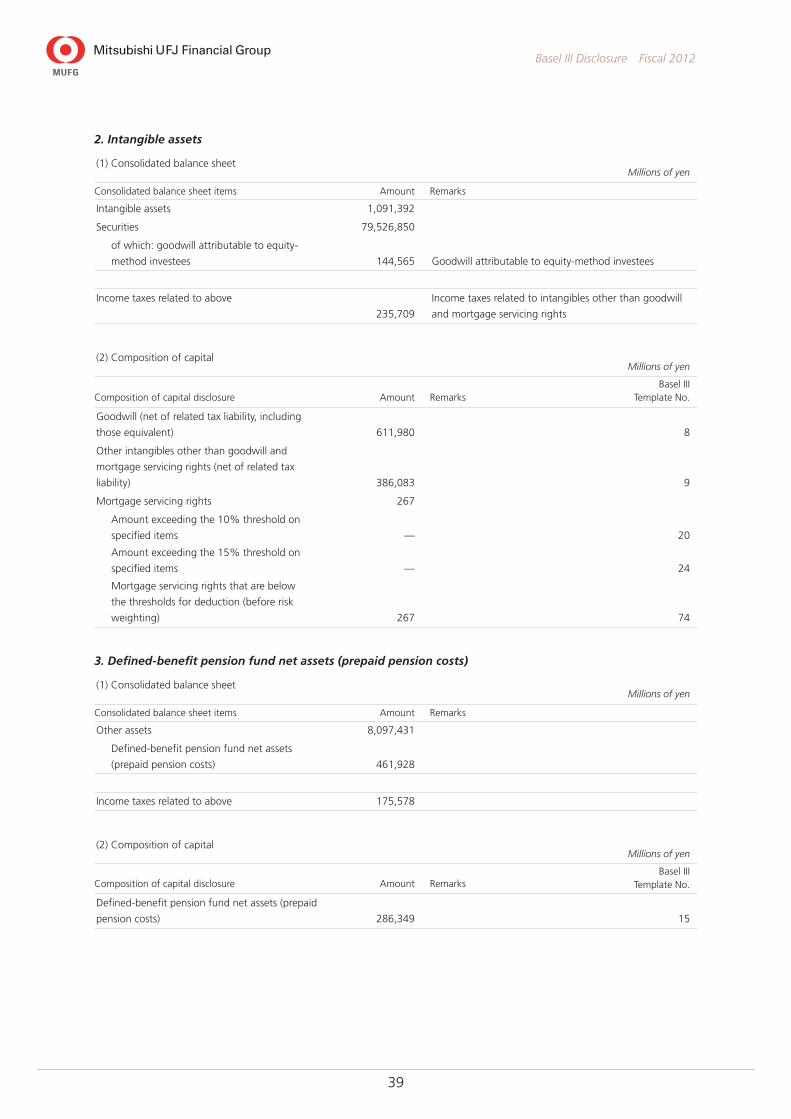
2. Intangible assets
(1) Consolidated balance sheetMillions of yen
Consolidated balance sheet items Amount Remarks
Intangible assets 1,091,392
Securities 79,526,850
of which: goodwill attributable to equity-
method investees 144,565 Goodwill attributable to equity-method investees
Income taxes related to above
235,709
Income taxes related to intangibles other than goodwill
and mortgage servicing rights
(2) Composition of capitalMillions of yen
Composition of capital disclosure Amount RemarksBasel III
Template No.
Goodwill (net of related tax liability, including
those equivalent) 611,980 8
Other intangibles other than goodwill and
mortgage servicing rights (net of related tax
liability) 386,083 9
Mortgage servicing rights 267
Amount exceeding the 10% threshold on
specified items — 20
Amount exceeding the 15% threshold on
specified items — 24
Mortgage servicing rights that are below
the thresholds for deduction (before risk
weighting) 267 74
3. Defined-benefit pension fund net assets (prepaid pension costs)
(1) Consolidated balance sheetMillions of yen
Consolidated balance sheet items Amount Remarks
Other assets 8,097,431
Defined-benefit pension fund net assets
(prepaid pension costs) 461,928
Income taxes related to above 175,578
(2) Composition of capitalMillions of yen
Composition of capital disclosure Amount RemarksBasel III
Template No.
Defined-benefit pension fund net assets (prepaid
pension costs) 286,349 15
40
Basel III Disclosure Fiscal 2012
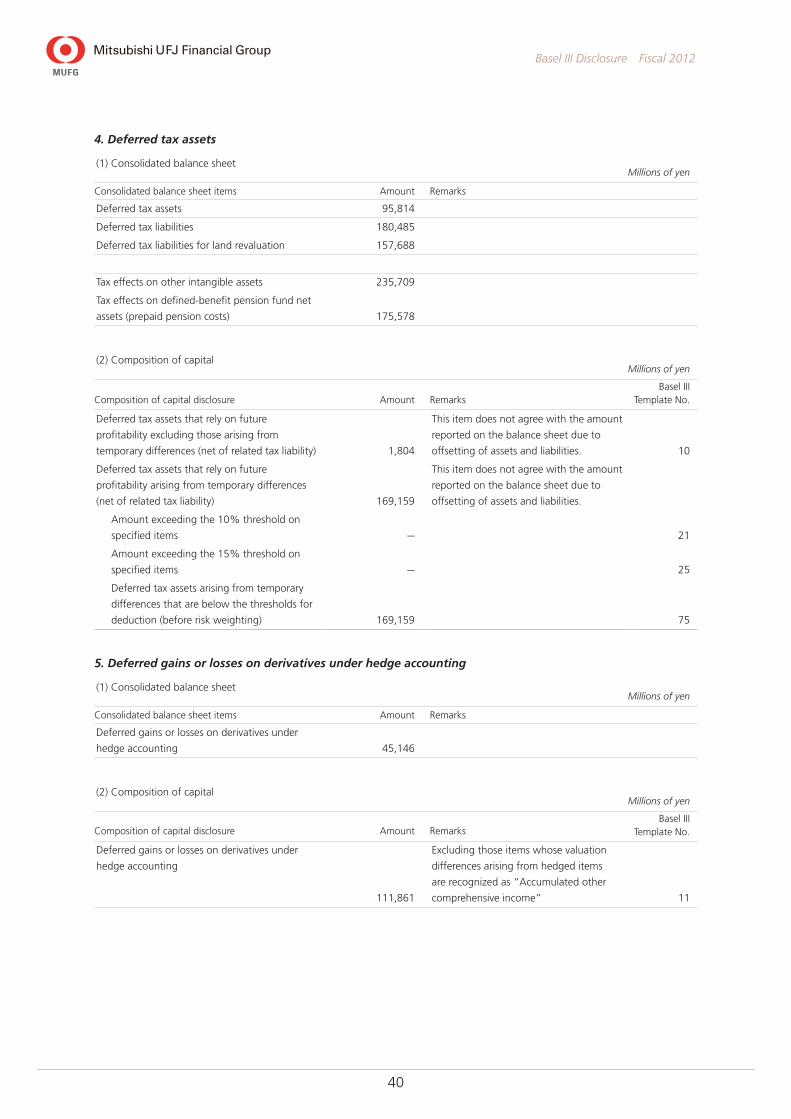
4. Deferred tax assets
(1) Consolidated balance sheetMillions of yen
Consolidated balance sheet items Amount Remarks
Deferred tax assets 95,814
Deferred tax liabilities 180,485
Deferred tax liabilities for land revaluation 157,688
Tax effects on other intangible assets 235,709
Tax effects on defined-benefit pension fund net
assets (prepaid pension costs) 175,578
(2) Composition of capitalMillions of yen
Composition of capital disclosure Amount RemarksBasel III
Template No.
Deferred tax assets that rely on future
profitability excluding those arising from
temporary differences (net of related tax liability) 1,804
This item does not agree with the amount
reported on the balance sheet due to
offsetting of assets and liabilities. 10
Deferred tax assets that rely on future
profitability arising from temporary differences
(net of related tax liability) 169,159
This item does not agree with the amount
reported on the balance sheet due to
offsetting of assets and liabilities.
Amount exceeding the 10% threshold on
specified items — 21
Amount exceeding the 15% threshold on
specified items — 25
Deferred tax assets arising from temporary
differences that are below the thresholds for
deduction (before risk weighting) 169,159 75
5. Deferred gains or losses on derivatives under hedge accounting
(1) Consolidated balance sheetMillions of yen
Consolidated balance sheet items Amount Remarks
Deferred gains or losses on derivatives under
hedge accounting 45,146
(2) Composition of capitalMillions of yen
Composition of capital disclosure Amount RemarksBasel III
Template No.
Deferred gains or losses on derivatives under
hedge accounting
111,861
Excluding those items whose valuation
differences arising from hedged items
are recognized as “Accumulated other
comprehensive income” 11
41
Basel III Disclosure Fiscal 2012
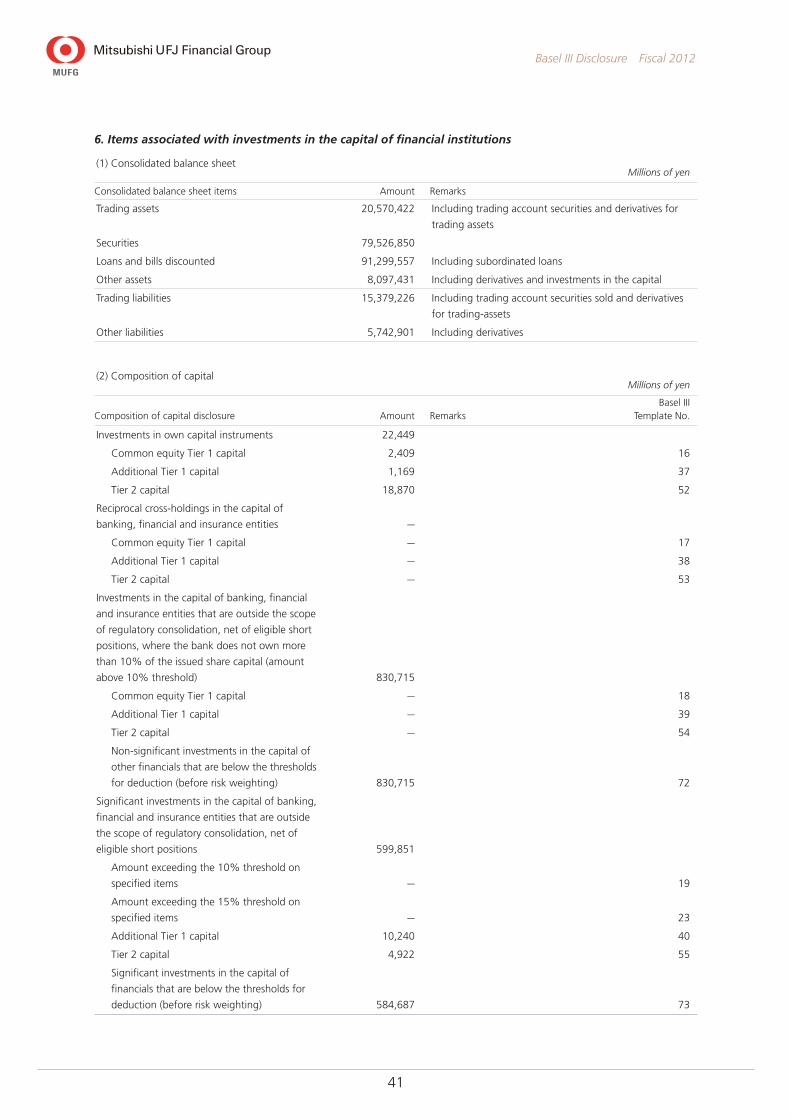
6. Items associated with investments in the capital of financial institutions
(1) Consolidated balance sheetMillions of yen
Consolidated balance sheet items Amount Remarks
Trading assets 20,570,422 Including trading account securities and derivatives for
trading assets
Securities 79,526,850
Loans and bills discounted 91,299,557 Including subordinated loans
Other assets 8,097,431 Including derivatives and investments in the capital
Trading liabilities 15,379,226 Including trading account securities sold and derivatives
for trading-assets
Other liabilities 5,742,901 Including derivatives
(2) Composition of capitalMillions of yen
Composition of capital disclosure Amount RemarksBasel III
Template No.
Investments in own capital instruments 22,449
Common equity Tier 1 capital 2,409 16
Additional Tier 1 capital 1,169 37
Tier 2 capital 18,870 52
Reciprocal cross-holdings in the capital of
banking, financial and insurance entities —
Common equity Tier 1 capital — 17
Additional Tier 1 capital — 38
Tier 2 capital — 53
Investments in the capital of banking, financial
and insurance entities that are outside the scope
of regulatory consolidation, net of eligible short
positions, where the bank does not own more
than 10% of the issued share capital (amount
above 10% threshold) 830,715
Common equity Tier 1 capital — 18
Additional Tier 1 capital — 39
Tier 2 capital — 54
Non-significant investments in the capital of
other financials that are below the thresholds
for deduction (before risk weighting) 830,715 72
Significant investments in the capital of banking,
financial and insurance entities that are outside
the scope of regulatory consolidation, net of
eligible short positions 599,851
Amount exceeding the 10% threshold on
specified items — 19
Amount exceeding the 15% threshold on
specified items — 23
Additional Tier 1 capital 10,240 40
Tier 2 capital 4,922 55
Significant investments in the capital of
financials that are below the thresholds for
deduction (before risk weighting) 584,687 73
42
Basel III Disclosure Fiscal 2012
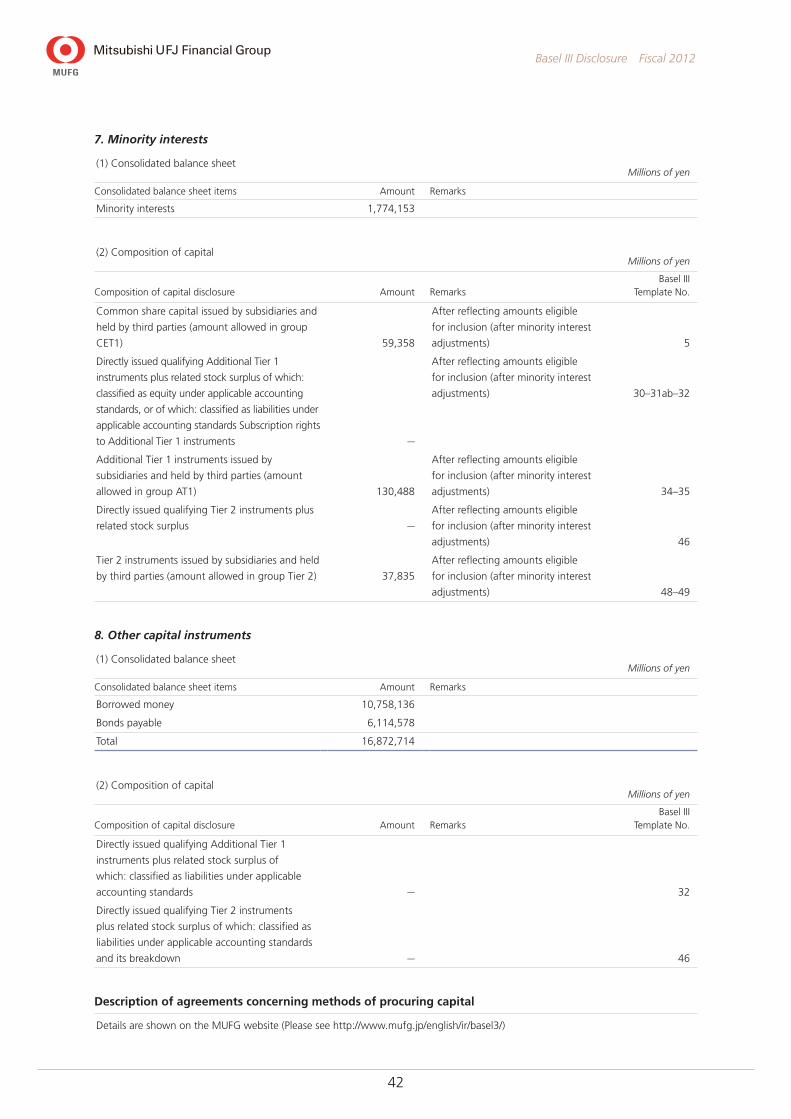
7. Minority interests
(1) Consolidated balance sheetMillions of yen
Consolidated balance sheet items Amount Remarks
Minority interests 1,774,153
(2) Composition of capitalMillions of yen
Composition of capital disclosure Amount RemarksBasel III
Template No.
Common share capital issued by subsidiaries and
held by third parties (amount allowed in group
CET1) 59,358
After reflecting amounts eligible
for inclusion (after minority interest
adjustments) 5
Directly issued qualifying Additional Tier 1
instruments plus related stock surplus of which:
classified as equity under applicable accounting
standards, or of which: classified as liabilities under
applicable accounting standards Subscription rights
to Additional Tier 1 instruments —
After reflecting amounts eligible
for inclusion (after minority interest
adjustments) 30–31ab–32
Additional Tier 1 instruments issued by
subsidiaries and held by third parties (amount
allowed in group AT1) 130,488
After reflecting amounts eligible
for inclusion (after minority interest
adjustments) 34–35
Directly issued qualifying Tier 2 instruments plus
related stock surplus —
After reflecting amounts eligible
for inclusion (after minority interest
adjustments) 46
Tier 2 instruments issued by subsidiaries and held
by third parties (amount allowed in group Tier 2) 37,835
After reflecting amounts eligible
for inclusion (after minority interest
adjustments) 48–49
8. Other capital instruments
(1) Consolidated balance sheetMillions of yen
Consolidated balance sheet items Amount Remarks
Borrowed money 10,758,136
Bonds payable 6,114,578
Total 16,872,714
(2) Composition of capitalMillions of yen
Composition of capital disclosure Amount RemarksBasel III
Template No.
Directly issued qualifying Additional Tier 1
instruments plus related stock surplus of
which: classified as liabilities under applicable
accounting standards — 32
Directly issued qualifying Tier 2 instruments
plus related stock surplus of which: classified as
liabilities under applicable accounting standards
and its breakdown — 46
Description of agreements concerning methods of procuring capital
Details are shown on the MUFG website (Please see http://www.mufg.jp/english/ir/basel3/)
43
Basel III Disclosure Fiscal 2012
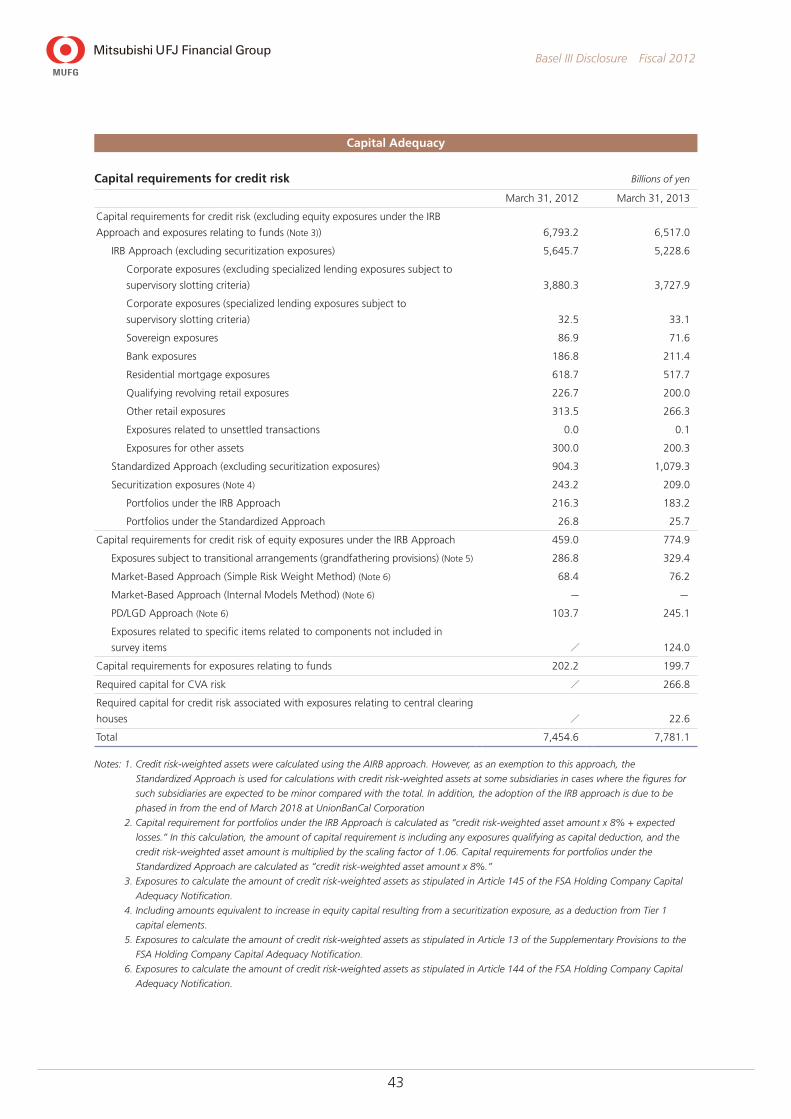
Capital Adequacy
Capital requirements for credit risk Billions of yen
March 31, 2012 March 31, 2013
Capital requirements for credit risk (excluding equity exposures under the IRB
Approach and exposures relating to funds (Note 3)) 6,793.2 6,517.0
IRB Approach (excluding securitization exposures) 5,645.7 5,228.6
Corporate exposures (excluding specialized lending exposures subject to
supervisory slotting criteria) 3,880.3 3,727.9
Corporate exposures (specialized lending exposures subject to
supervisory slotting criteria) 32.5 33.1
Sovereign exposures 86.9 71.6
Bank exposures 186.8 211.4
Residential mortgage exposures 618.7 517.7
Qualifying revolving retail exposures 226.7 200.0
Other retail exposures 313.5 266.3
Exposures related to unsettled transactions 0.0 0.1
Exposures for other assets 300.0 200.3
Standardized Approach (excluding securitization exposures) 904.3 1,079.3
Securitization exposures (Note 4) 243.2 209.0
Portfolios under the IRB Approach 216.3 183.2
Portfolios under the Standardized Approach 26.8 25.7
Capital requirements for credit risk of equity exposures under the IRB Approach 459.0 774.9
Exposures subject to transitional arrangements (grandfathering provisions) (Note 5) 286.8 329.4
Market-Based Approach (Simple Risk Weight Method) (Note 6) 68.4 76.2
Market-Based Approach (Internal Models Method) (Note 6) — —‐
PD/LGD Approach (Note 6) 103.7 245.1
Exposures related to specific items related to components not included in
survey items / 124.0
Capital requirements for exposures relating to funds 202.2 199.7
Required capital for CVA risk / 266.8
Required capital for credit risk associated with exposures relating to central clearing
houses / 22.6
Total 7,454.6 7,781.1
Notes: 1. Credit risk-weighted assets were calculated using the AIRB approach. However, as an exemption to this approach, the
Standardized Approach is used for calculations with credit risk-weighted assets at some subsidiaries in cases where the figures for
such subsidiaries are expected to be minor compared with the total. In addition, the adoption of the IRB approach is due to be
phased in from the end of March 2018 at UnionBanCal Corporation
2. Capital requirement for portfolios under the IRB Approach is calculated as “credit risk-weighted asset amount x 8% + expected
losses.” In this calculation, the amount of capital requirement is including any exposures qualifying as capital deduction, and the
credit risk-weighted asset amount is multiplied by the scaling factor of 1.06. Capital requirements for portfolios under the
Standardized Approach are calculated as “credit risk-weighted asset amount x 8%.”
3. Exposures to calculate the amount of credit risk-weighted assets as stipulated in Article 145 of the FSA Holding Company Capital
Adequacy Notification.
4. Including amounts equivalent to increase in equity capital resulting from a securitization exposure, as a deduction from Tier 1
capital elements.
5. Exposures to calculate the amount of credit risk-weighted assets as stipulated in Article 13 of the Supplementary Provisions to the
FSA Holding Company Capital Adequacy Notification.
6. Exposures to calculate the amount of credit risk-weighted assets as stipulated in Article 144 of the FSA Holding Company Capital
Adequacy Notification.
44
Basel III Disclosure Fiscal 2012
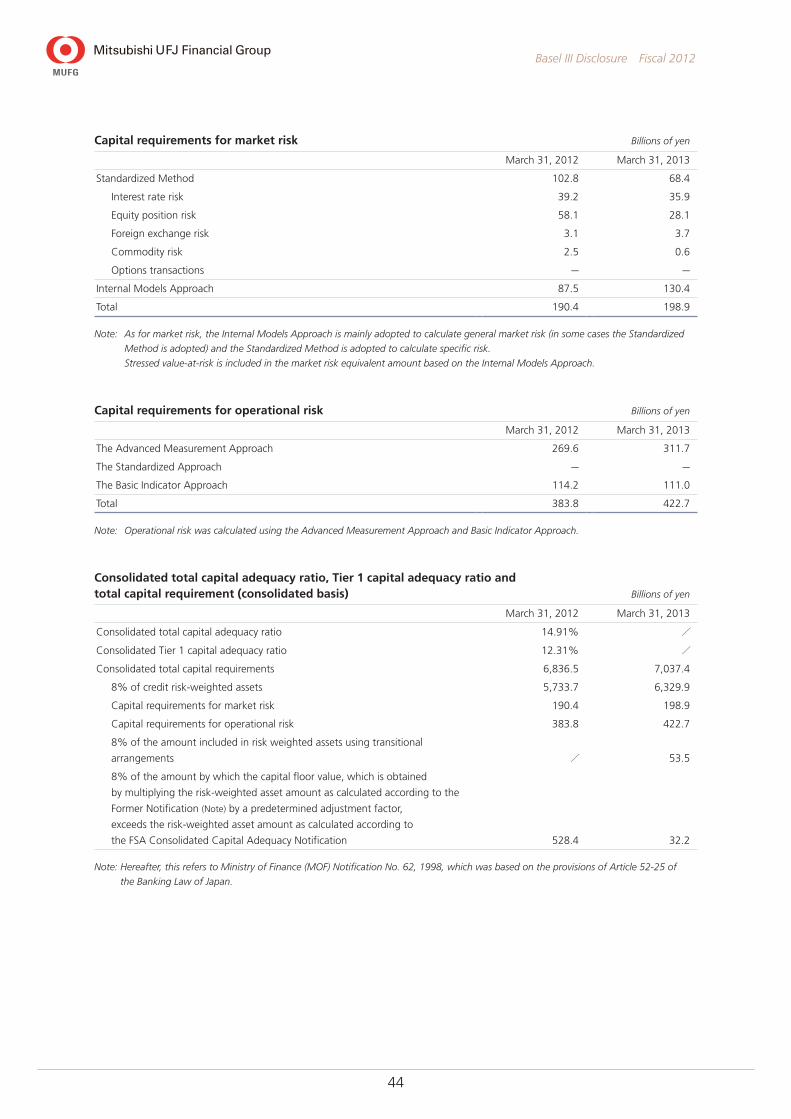
Capital requirements for market risk Billions of yen
March 31, 2012 March 31, 2013
Standardized Method 102.8 68.4
Interest rate risk 39.2 35.9
Equity position risk 58.1 28.1
Foreign exchange risk 3.1 3.7
Commodity risk 2.5 0.6
Options transactions — —
Internal Models Approach 87.5 130.4
Total 190.4 198.9
Note: As for market risk, the Internal Models Approach is mainly adopted to calculate general market risk (in some cases the Standardized
Method is adopted) and the Standardized Method is adopted to calculate specific risk.
Stressed value-at-risk is included in the market risk equivalent amount based on the Internal Models Approach.
Capital requirements for operational risk Billions of yen
March 31, 2012 March 31, 2013
The Advanced Measurement Approach 269.6 311.7
The Standardized Approach — —
The Basic Indicator Approach 114.2 111.0
Total 383.8 422.7
Note: Operational risk was calculated using the Advanced Measurement Approach and Basic Indicator Approach.
Consolidated total capital adequacy ratio, Tier 1 capital adequacy ratio and total capital requirement (consolidated basis) Billions of yen
March 31, 2012 March 31, 2013
Consolidated total capital adequacy ratio 14.91% /
Consolidated Tier 1 capital adequacy ratio 12.31% /
Consolidated total capital requirements 6,836.5 7,037.4
8% of credit risk-weighted assets 5,733.7 6,329.9
Capital requirements for market risk 190.4 198.9
Capital requirements for operational risk 383.8 422.7
8% of the amount included in risk weighted assets using transitional
arrangements / 53.5
8% of the amount by which the capital floor value, which is obtained
by multiplying the risk-weighted asset amount as calculated according to the
Former Notification (Note) by a predetermined adjustment factor,
exceeds the risk-weighted asset amount as calculated according to
the FSA Consolidated Capital Adequacy Notification 528.4 32.2
Note: Hereafter, this refers to Ministry of Finance (MOF) Notification No. 62, 1998, which was based on the provisions of Article 52-25 of
the Banking Law of Japan.
45
Basel III Disclosure Fiscal 2012
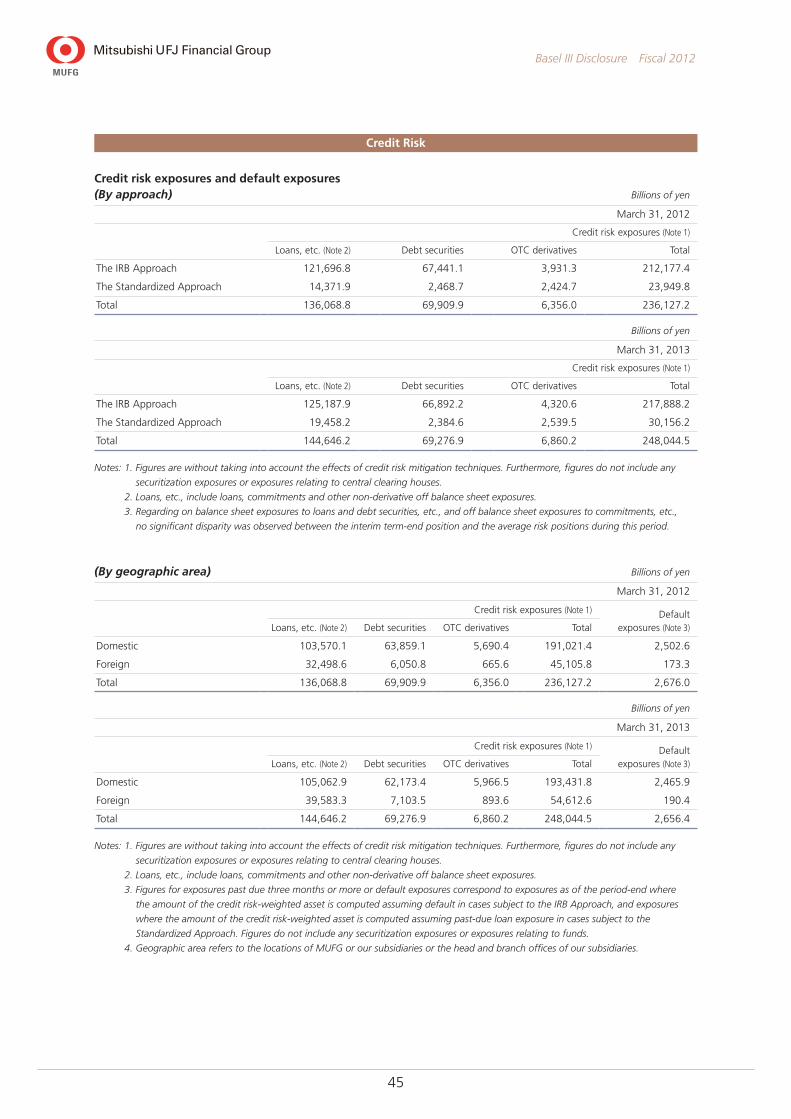
Credit Risk
Credit risk exposures and default exposures (By approach) Billions of yen
March 31, 2012
Credit risk exposures (Note 1)
Loans, etc. (Note 2) Debt securities OTC derivatives Total
The IRB Approach 121,696.8 67,441.1 3,931.3 212,177.4
The Standardized Approach 14,371.9 2,468.7 2,424.7 23,949.8
Total 136,068.8 69,909.9 6,356.0 236,127.2
Billions of yen
March 31, 2013
Credit risk exposures (Note 1)
Loans, etc. (Note 2) Debt securities OTC derivatives Total
The IRB Approach 125,187.9 66,892.2 4,320.6 217,888.2
The Standardized Approach 19,458.2 2,384.6 2,539.5 30,156.2
Total 144,646.2 69,276.9 6,860.2 248,044.5
Notes: 1. Figures are without taking into account the effects of credit risk mitigation techniques. Furthermore, figures do not include any
securitization exposures or exposures relating to central clearing houses.
2. Loans, etc., include loans, commitments and other non-derivative off balance sheet exposures.
3. Regarding on balance sheet exposures to loans and debt securities, etc., and off balance sheet exposures to commitments, etc.,
no significant disparity was observed between the interim term-end position and the average risk positions during this period.
(By geographic area) Billions of yen
March 31, 2012
Credit risk exposures (Note 1) Default exposures (Note 3)Loans, etc. (Note 2) Debt securities OTC derivatives Total
Domestic 103,570.1 63,859.1 5,690.4 191,021.4 2,502.6
Foreign 32,498.6 6,050.8 665.6 45,105.8 173.3
Total 136,068.8 69,909.9 6,356.0 236,127.2 2,676.0
Billions of yen
March 31, 2013
Credit risk exposures (Note 1) Default exposures (Note 3)Loans, etc. (Note 2) Debt securities OTC derivatives Total
Domestic 105,062.9 62,173.4 5,966.5 193,431.8 2,465.9
Foreign 39,583.3 7,103.5 893.6 54,612.6 190.4
Total 144,646.2 69,276.9 6,860.2 248,044.5 2,656.4
Notes: 1. Figures are without taking into account the effects of credit risk mitigation techniques. Furthermore, figures do not include any
securitization exposures or exposures relating to central clearing houses.
2. Loans, etc., include loans, commitments and other non-derivative off balance sheet exposures.
3. Figures for exposures past due three months or more or default exposures correspond to exposures as of the period-end where
the amount of the credit risk-weighted asset is computed assuming default in cases subject to the IRB Approach, and exposures
where the amount of the credit risk-weighted asset is computed assuming past-due loan exposure in cases subject to the
Standardized Approach. Figures do not include any securitization exposures or exposures relating to funds.
4. Geographic area refers to the locations of MUFG or our subsidiaries or the head and branch offices of our subsidiaries.
46
Basel III Disclosure Fiscal 2012
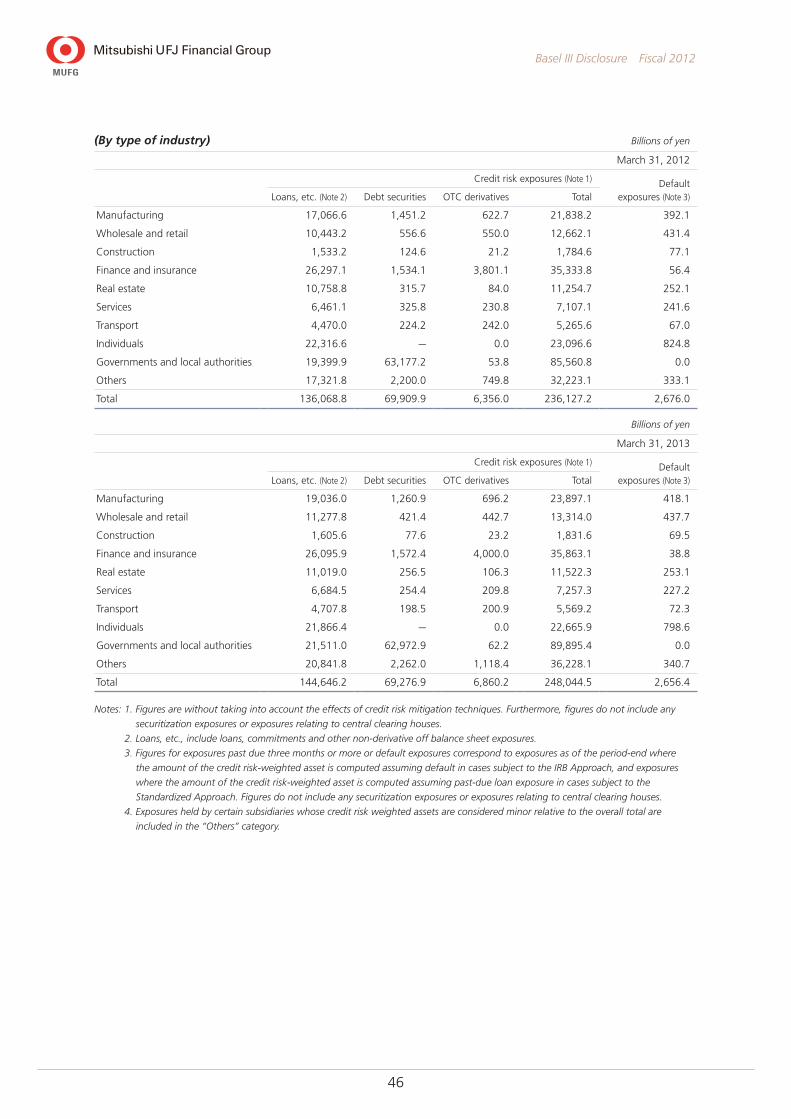
(By type of industry) Billions of yen
March 31, 2012
Credit risk exposures (Note 1) Default exposures (Note 3)Loans, etc. (Note 2) Debt securities OTC derivatives Total
Manufacturing 17,066.6 1,451.2 622.7 21,838.2 392.1
Wholesale and retail 10,443.2 556.6 550.0 12,662.1 431.4
Construction 1,533.2 124.6 21.2 1,784.6 77.1
Finance and insurance 26,297.1 1,534.1 3,801.1 35,333.8 56.4
Real estate 10,758.8 315.7 84.0 11,254.7 252.1
Services 6,461.1 325.8 230.8 7,107.1 241.6
Transport 4,470.0 224.2 242.0 5,265.6 67.0
Individuals 22,316.6 — 0.0 23,096.6 824.8
Governments and local authorities 19,399.9 63,177.2 53.8 85,560.8 0.0
Others 17,321.8 2,200.0 749.8 32,223.1 333.1
Total 136,068.8 69,909.9 6,356.0 236,127.2 2,676.0
Billions of yen
March 31, 2013
Credit risk exposures (Note 1) Default exposures (Note 3)Loans, etc. (Note 2) Debt securities OTC derivatives Total
Manufacturing 19,036.0 1,260.9 696.2 23,897.1 418.1
Wholesale and retail 11,277.8 421.4 442.7 13,314.0 437.7
Construction 1,605.6 77.6 23.2 1,831.6 69.5
Finance and insurance 26,095.9 1,572.4 4,000.0 35,863.1 38.8
Real estate 11,019.0 256.5 106.3 11,522.3 253.1
Services 6,684.5 254.4 209.8 7,257.3 227.2
Transport 4,707.8 198.5 200.9 5,569.2 72.3
Individuals 21,866.4 — 0.0 22,665.9 798.6
Governments and local authorities 21,511.0 62,972.9 62.2 89,895.4 0.0
Others 20,841.8 2,262.0 1,118.4 36,228.1 340.7
Total 144,646.2 69,276.9 6,860.2 248,044.5 2,656.4
Notes: 1. Figures are without taking into account the effects of credit risk mitigation techniques. Furthermore, figures do not include any
securitization exposures or exposures relating to central clearing houses.
2. Loans, etc., include loans, commitments and other non-derivative off balance sheet exposures.
3. Figures for exposures past due three months or more or default exposures correspond to exposures as of the period-end where
the amount of the credit risk-weighted asset is computed assuming default in cases subject to the IRB Approach, and exposures
where the amount of the credit risk-weighted asset is computed assuming past-due loan exposure in cases subject to the
Standardized Approach. Figures do not include any securitization exposures or exposures relating to central clearing houses.
4. Exposures held by certain subsidiaries whose credit risk weighted assets are considered minor relative to the overall total are
included in the “Others” category.
47
Basel III Disclosure Fiscal 2012
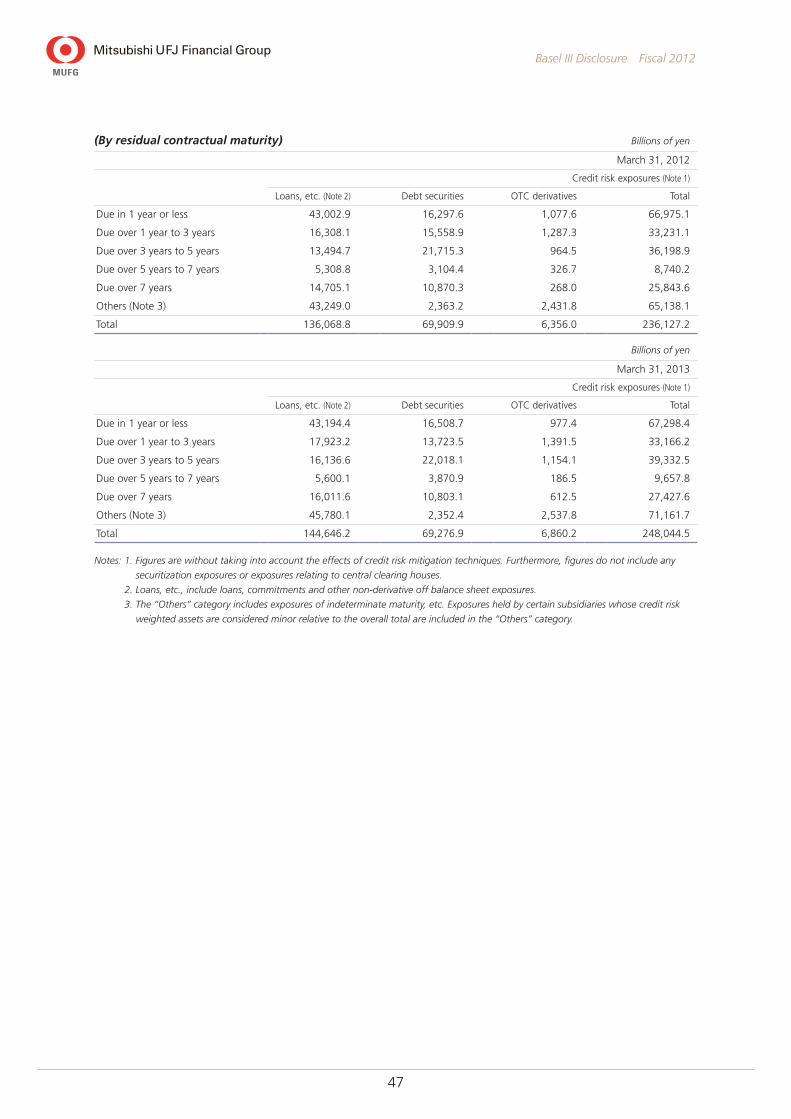
(By residual contractual maturity) Billions of yen
March 31, 2012
Credit risk exposures (Note 1)
Loans, etc. (Note 2) Debt securities OTC derivatives Total
Due in 1 year or less 43,002.9 16,297.6 1,077.6 66,975.1
Due over 1 year to 3 years 16,308.1 15,558.9 1,287.3 33,231.1
Due over 3 years to 5 years 13,494.7 21,715.3 964.5 36,198.9
Due over 5 years to 7 years 5,308.8 3,104.4 326.7 8,740.2
Due over 7 years 14,705.1 10,870.3 268.0 25,843.6
Others (Note 3) 43,249.0 2,363.2 2,431.8 65,138.1
Total 136,068.8 69,909.9 6,356.0 236,127.2
Billions of yen
March 31, 2013
Credit risk exposures (Note 1)
Loans, etc. (Note 2) Debt securities OTC derivatives Total
Due in 1 year or less 43,194.4 16,508.7 977.4 67,298.4
Due over 1 year to 3 years 17,923.2 13,723.5 1,391.5 33,166.2
Due over 3 years to 5 years 16,136.6 22,018.1 1,154.1 39,332.5
Due over 5 years to 7 years 5,600.1 3,870.9 186.5 9,657.8
Due over 7 years 16,011.6 10,803.1 612.5 27,427.6
Others (Note 3) 45,780.1 2,352.4 2,537.8 71,161.7
Total 144,646.2 69,276.9 6,860.2 248,044.5
Notes: 1. Figures are without taking into account the effects of credit risk mitigation techniques. Furthermore, figures do not include any
securitization exposures or exposures relating to central clearing houses.
2. Loans, etc., include loans, commitments and other non-derivative off balance sheet exposures.
3. The “Others” category includes exposures of indeterminate maturity, etc. Exposures held by certain subsidiaries whose credit risk
weighted assets are considered minor relative to the overall total are included in the “Others” category.

48
Basel III Disclosure Fiscal 2012
General allowance for credit losses, specific allowance for credit losses and allowance for loans to specific foreign borrowers
(Balances by geographic area) Millions of yen
March 31, 2012 Against March 31, 2011 March 31, 2013 Against March 31, 2012
General allowance for
credit losses 748,128 (57,114) 729,080 (19,047)
Specific allowance for
credit losses 375,017 36,988 357,625 (17,391)
Domestic 334,362 24,944 314,554 (19,808)
Foreign 40,655 12,044 43,071 2,416
Allowance for loans to specific
foreign borrowers 626 (98) 751 124
Total 1,123,773 (20,224) 1,087,457 (36,315)
(Balances by type of industry) Millions of yen
March 31, 2012 Against March 31, 2011 March 31, 2013 Against March 31, 2012
General allowance for
credit losses 748,128 (57,114) 729,080 (19,047)
Specific allowance for
credit losses 375,017 36,988 357,625 (17,391)
Manufacturing 78,346 29,629 89,623 11,277
Wholesale and retail 75,622 17,512 83,474 7,852
Construction 8,617 (3,027) 8,756 139
Finance and insurance 16,390 2,112 18,038 1,647
Real estate 19,964 (5,705) 20,852 887
Services 24,842 1,538 23,646 (1,196)
Transport 14,469 9,872 16,215 1,745
Individuals 37,213 (11,356) 27,895 (9,317)
Governments and
local authorities 5 (0) 4 (0)
Others 99,545 (3,586) 69,117 (30,428)
Allowance for loans to
specific foreign borrowers 626 (98) 751 124
Total 1,123,773 (20,224) 1,087,457 (36,315)
Notes: 1. Although the specific allowance for credit losses does not include the allowance relating to any securitization exposures and
exposures relating to funds, the allowance relating to these exposures is not excluded from both the general allowance for credit
losses and the allowance for loans to specific foreign borrowers, owing to the fact that MUFG does not manage provisioning with
respect to each asset class based on Basel III.
2. Industry classifications apply primarily to allowances related to exposures held by the Bank of Tokyo-Mitsubishi UFJ and Mitsubishi
UFJ Trust and Banking (both on a non-consolidated basis). The bulk of provisions relating to exposures held by other subsidiaries
are included in the “Others” category.
49
Basel III Disclosure Fiscal 2012
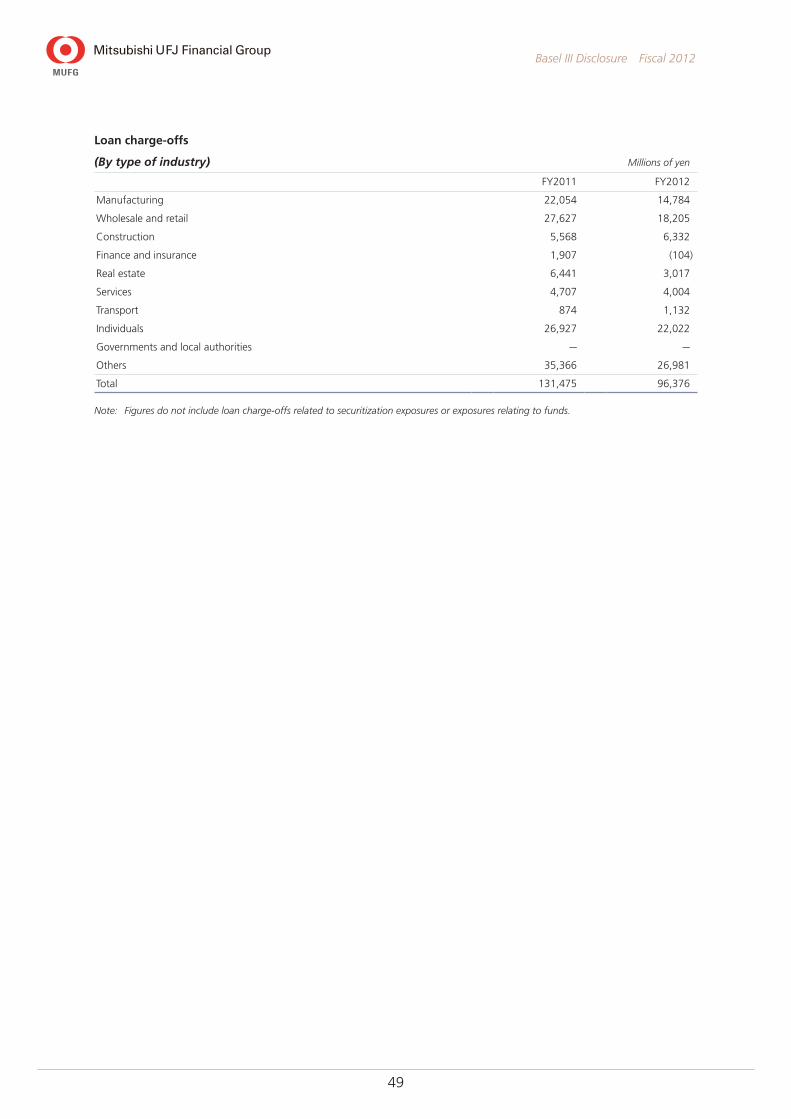
Loan charge-offs
(By type of industry) Millions of yen
FY2011 FY2012
Manufacturing 22,054 14,784
Wholesale and retail 27,627 18,205
Construction 5,568 6,332
Finance and insurance 1,907 (104)
Real estate 6,441 3,017
Services 4,707 4,004
Transport 874 1,132
Individuals 26,927 22,022
Governments and local authorities — —
Others 35,366 26,981
Total 131,475 96,376
Note: Figures do not include loan charge-offs related to securitization exposures or exposures relating to funds.
50
Basel III Disclosure Fiscal 2012
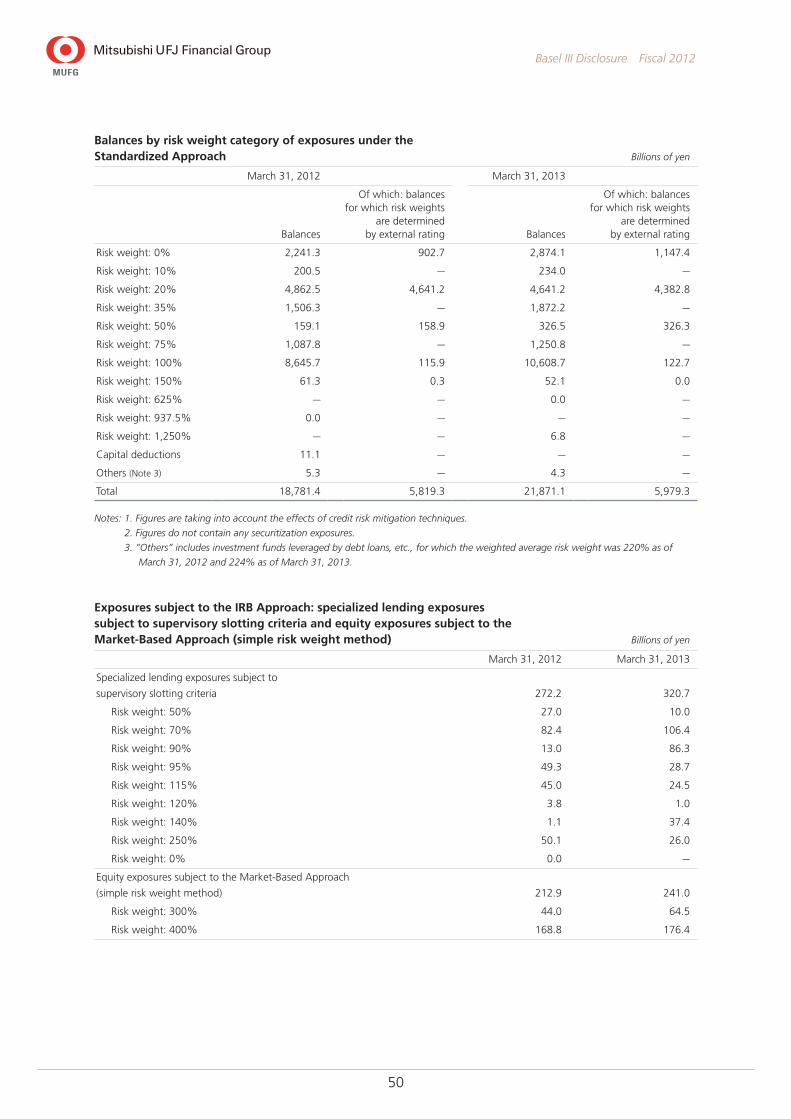
Balances by risk weight category of exposures under the Standardized Approach Billions of yen
March 31, 2012 March 31, 2013
Balances
Of which: balances for which risk weights
are determined by external rating Balances
Of which: balances for which risk weights
are determined by external rating
Risk weight: 0% 2,241.3 902.7 2,874.1 1,147.4
Risk weight: 10% 200.5 — 234.0 —
Risk weight: 20% 4,862.5 4,641.2 4,641.2 4,382.8
Risk weight: 35% 1,506.3 — 1,872.2 —
Risk weight: 50% 159.1 158.9 326.5 326.3
Risk weight: 75% 1,087.8 — 1,250.8 —
Risk weight: 100% 8,645.7 115.9 10,608.7 122.7
Risk weight: 150% 61.3 0.3 52.1 0.0
Risk weight: 625% — — 0.0 —
Risk weight: 937.5% 0.0 — — —
Risk weight: 1,250% — — 6.8 —
Capital deductions 11.1 — — —
Others (Note 3) 5.3 — 4.3 —
Total 18,781.4 5,819.3 21,871.1 5,979.3
Notes: 1. Figures are taking into account the effects of credit risk mitigation techniques.
2. Figures do not contain any securitization exposures.
3. “Others” includes investment funds leveraged by debt loans, etc., for which the weighted average risk weight was 220% as of
March 31, 2012 and 224% as of March 31, 2013.
Exposures subject to the IRB Approach: specialized lending exposures subject to supervisory slotting criteria and equity exposures subject to the Market-Based Approach (simple risk weight method) Billions of yen
March 31, 2012 March 31, 2013
Specialized lending exposures subject to
supervisory slotting criteria 272.2 320.7
Risk weight: 50% 27.0 10.0
Risk weight: 70% 82.4 106.4
Risk weight: 90% 13.0 86.3
Risk weight: 95% 49.3 28.7
Risk weight: 115% 45.0 24.5
Risk weight: 120% 3.8 1.0
Risk weight: 140% 1.1 37.4
Risk weight: 250% 50.1 26.0
Risk weight: 0% 0.0 —
Equity exposures subject to the Market-Based Approach
(simple risk weight method) 212.9 241.0
Risk weight: 300% 44.0 64.5
Risk weight: 400% 168.8 176.4
51
Basel III Disclosure Fiscal 2012
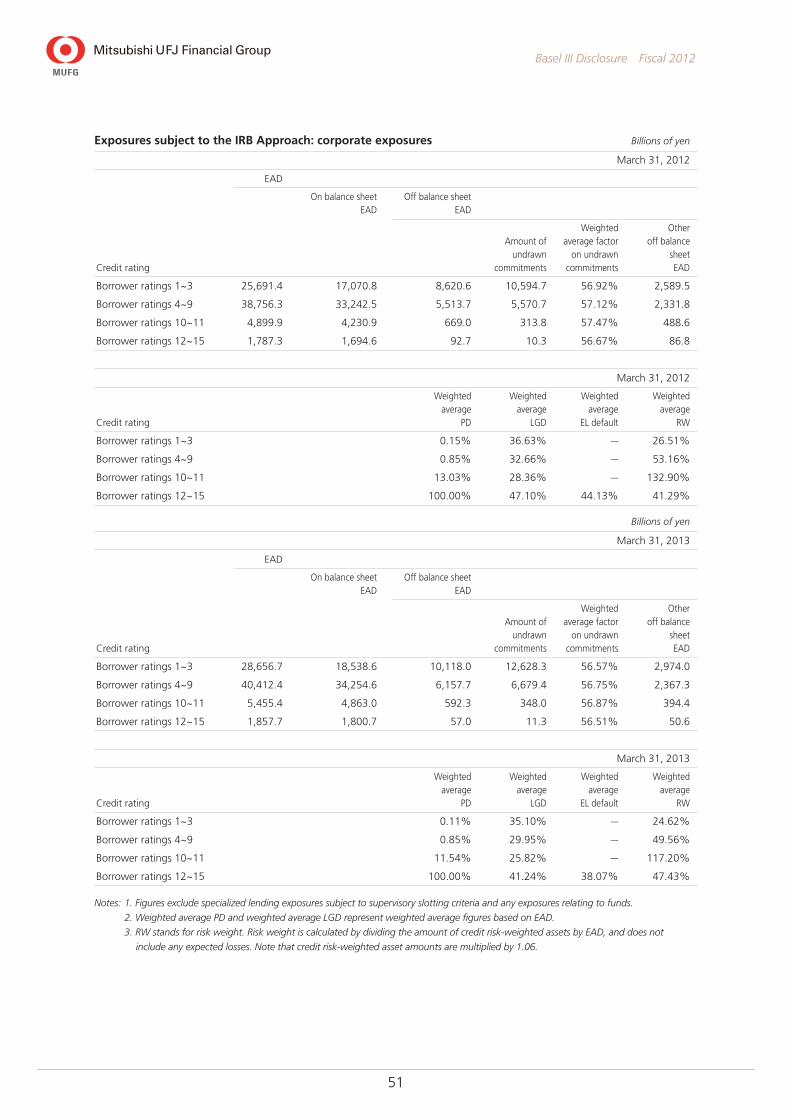
Exposures subject to the IRB Approach: corporate exposures Billions of yen
March 31, 2012
EAD
On balance sheet EAD
Off balance sheet EAD
Credit rating
Amount of undrawn
commitments
Weighted average factor
on undrawn commitments
Other off balance
sheet EAD
Borrower ratings 1~3 25,691.4 17,070.8 8,620.6 10,594.7 56.92% 2,589.5
Borrower ratings 4~9 38,756.3 33,242.5 5,513.7 5,570.7 57.12% 2,331.8
Borrower ratings 10~11 4,899.9 4,230.9 669.0 313.8 57.47% 488.6
Borrower ratings 12~15 1,787.3 1,694.6 92.7 10.3 56.67% 86.8
March 31, 2012
Credit rating
Weighted average
PD
Weighted average
LGD
Weighted average
EL default
Weighted average
RW
Borrower ratings 1~3 0.15% 36.63% — 26.51%
Borrower ratings 4~9 0.85% 32.66% — 53.16%
Borrower ratings 10~11 13.03% 28.36% — 132.90%
Borrower ratings 12~15 100.00% 47.10% 44.13% 41.29%
Billions of yen
March 31, 2013
EAD
On balance sheet EAD
Off balance sheet EAD
Credit rating
Amount of undrawn
commitments
Weighted average factor
on undrawn commitments
Other off balance
sheet EAD
Borrower ratings 1~3 28,656.7 18,538.6 10,118.0 12,628.3 56.57% 2,974.0
Borrower ratings 4~9 40,412.4 34,254.6 6,157.7 6,679.4 56.75% 2,367.3
Borrower ratings 10~11 5,455.4 4,863.0 592.3 348.0 56.87% 394.4
Borrower ratings 12~15 1,857.7 1,800.7 57.0 11.3 56.51% 50.6
March 31, 2013
Credit rating
Weighted average
PD
Weighted average
LGD
Weighted average
EL default
Weighted average
RW
Borrower ratings 1~3 0.11% 35.10% — 24.62%
Borrower ratings 4~9 0.85% 29.95% — 49.56%
Borrower ratings 10~11 11.54% 25.82% — 117.20%
Borrower ratings 12~15 100.00% 41.24% 38.07% 47.43%
Notes: 1. Figures exclude specialized lending exposures subject to supervisory slotting criteria and any exposures relating to funds.
2. Weighted average PD and weighted average LGD represent weighted average figures based on EAD.
3. RW stands for risk weight. Risk weight is calculated by dividing the amount of credit risk-weighted assets by EAD, and does not
include any expected losses. Note that credit risk-weighted asset amounts are multiplied by 1.06.
52
Basel III Disclosure Fiscal 2012
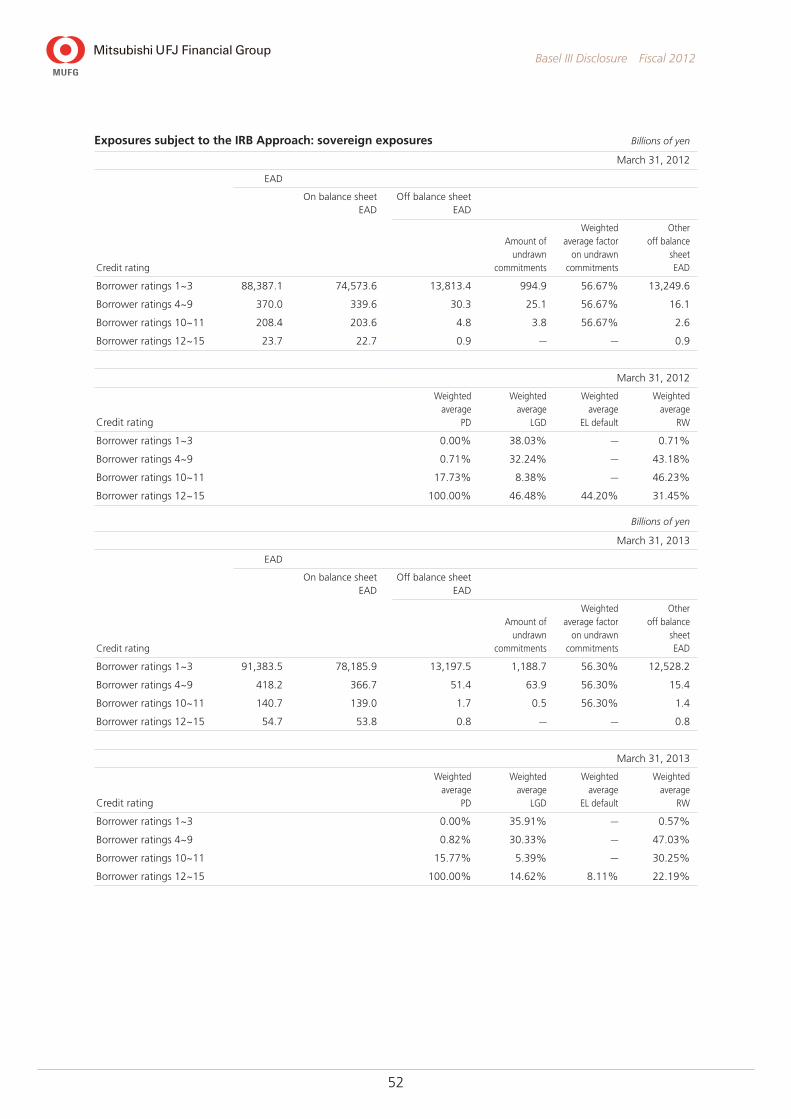
Exposures subject to the IRB Approach: sovereign exposures Billions of yen
March 31, 2012
EAD
On balance sheet EAD
Off balance sheet EAD
Credit rating
Amount of undrawn
commitments
Weighted average factor
on undrawn commitments
Other off balance
sheet EAD
Borrower ratings 1~3 88,387.1 74,573.6 13,813.4 994.9 56.67% 13,249.6
Borrower ratings 4~9 370.0 339.6 30.3 25.1 56.67% 16.1
Borrower ratings 10~11 208.4 203.6 4.8 3.8 56.67% 2.6
Borrower ratings 12~15 23.7 22.7 0.9 — — 0.9
March 31, 2012
Credit rating
Weighted average
PD
Weighted average
LGD
Weighted average
EL default
Weighted average
RW
Borrower ratings 1~3 0.00% 38.03% — 0.71%
Borrower ratings 4~9 0.71% 32.24% — 43.18%
Borrower ratings 10~11 17.73% 8.38% — 46.23%
Borrower ratings 12~15 100.00% 46.48% 44.20% 31.45%
Billions of yen
March 31, 2013
EAD
On balance sheet EAD
Off balance sheet EAD
Credit rating
Amount of undrawn
commitments
Weighted average factor
on undrawn commitments
Other off balance
sheet EAD
Borrower ratings 1~3 91,383.5 78,185.9 13,197.5 1,188.7 56.30% 12,528.2
Borrower ratings 4~9 418.2 366.7 51.4 63.9 56.30% 15.4
Borrower ratings 10~11 140.7 139.0 1.7 0.5 56.30% 1.4
Borrower ratings 12~15 54.7 53.8 0.8 — — 0.8
March 31, 2013
Credit rating
Weighted average
PD
Weighted average
LGD
Weighted average
EL default
Weighted average
RW
Borrower ratings 1~3 0.00% 35.91% — 0.57%
Borrower ratings 4~9 0.82% 30.33% — 47.03%
Borrower ratings 10~11 15.77% 5.39% — 30.25%
Borrower ratings 12~15 100.00% 14.62% 8.11% 22.19%
53
Basel III Disclosure Fiscal 2012
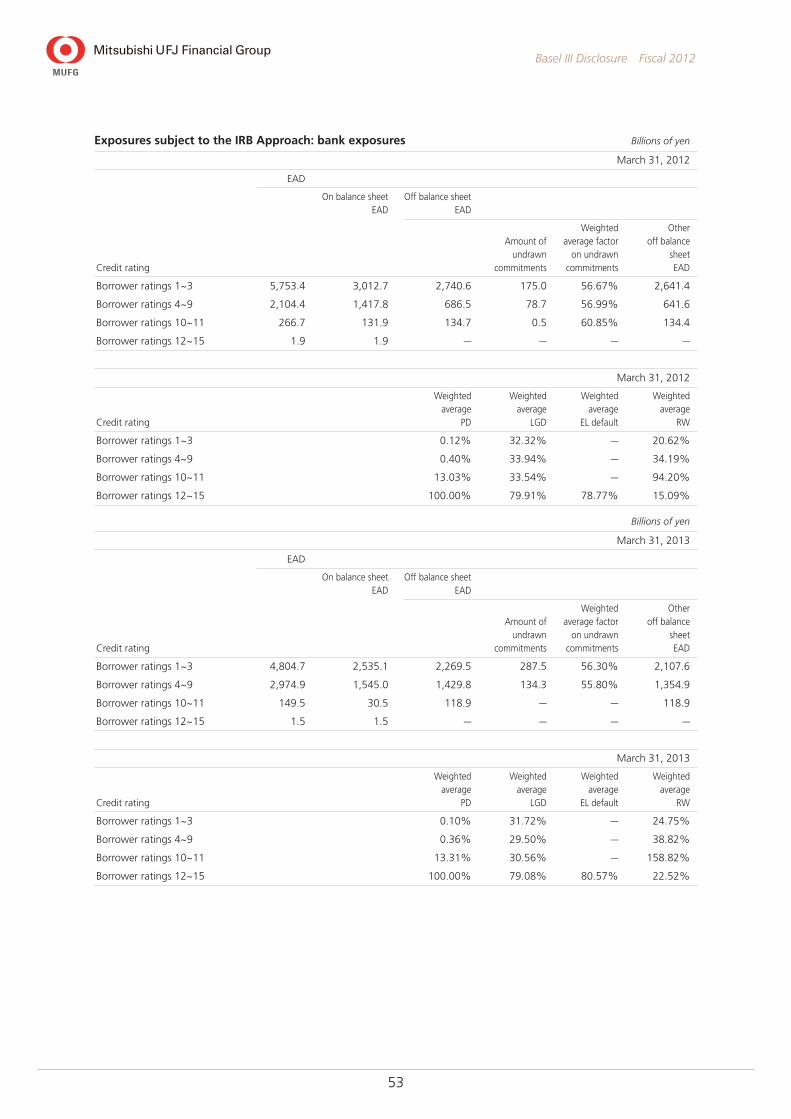
Exposures subject to the IRB Approach: bank exposures Billions of yen
March 31, 2012
EAD
On balance sheet EAD
Off balance sheet EAD
Credit rating
Amount of undrawn
commitments
Weighted average factor
on undrawn commitments
Other off balance
sheet EAD
Borrower ratings 1~3 5,753.4 3,012.7 2,740.6 175.0 56.67% 2,641.4
Borrower ratings 4~9 2,104.4 1,417.8 686.5 78.7 56.99% 641.6
Borrower ratings 10~11 266.7 131.9 134.7 0.5 60.85% 134.4
Borrower ratings 12~15 1.9 1.9 — — — —
March 31, 2012
Credit rating
Weighted average
PD
Weighted average
LGD
Weighted average
EL default
Weighted average
RW
Borrower ratings 1~3 0.12% 32.32% — 20.62%
Borrower ratings 4~9 0.40% 33.94% — 34.19%
Borrower ratings 10~11 13.03% 33.54% — 94.20%
Borrower ratings 12~15 100.00% 79.91% 78.77% 15.09%
Billions of yen
March 31, 2013
EAD
On balance sheet EAD
Off balance sheet EAD
Credit rating
Amount of undrawn
commitments
Weighted average factor
on undrawn commitments
Other off balance
sheet EAD
Borrower ratings 1~3 4,804.7 2,535.1 2,269.5 287.5 56.30% 2,107.6
Borrower ratings 4~9 2,974.9 1,545.0 1,429.8 134.3 55.80% 1,354.9
Borrower ratings 10~11 149.5 30.5 118.9 — — 118.9
Borrower ratings 12~15 1.5 1.5 — — — —
March 31, 2013
Credit rating
Weighted average
PD
Weighted average
LGD
Weighted average
EL default
Weighted average
RW
Borrower ratings 1~3 0.10% 31.72% — 24.75%
Borrower ratings 4~9 0.36% 29.50% — 38.82%
Borrower ratings 10~11 13.31% 30.56% — 158.82%
Borrower ratings 12~15 100.00% 79.08% 80.57% 22.52%
54
Basel III Disclosure Fiscal 2012
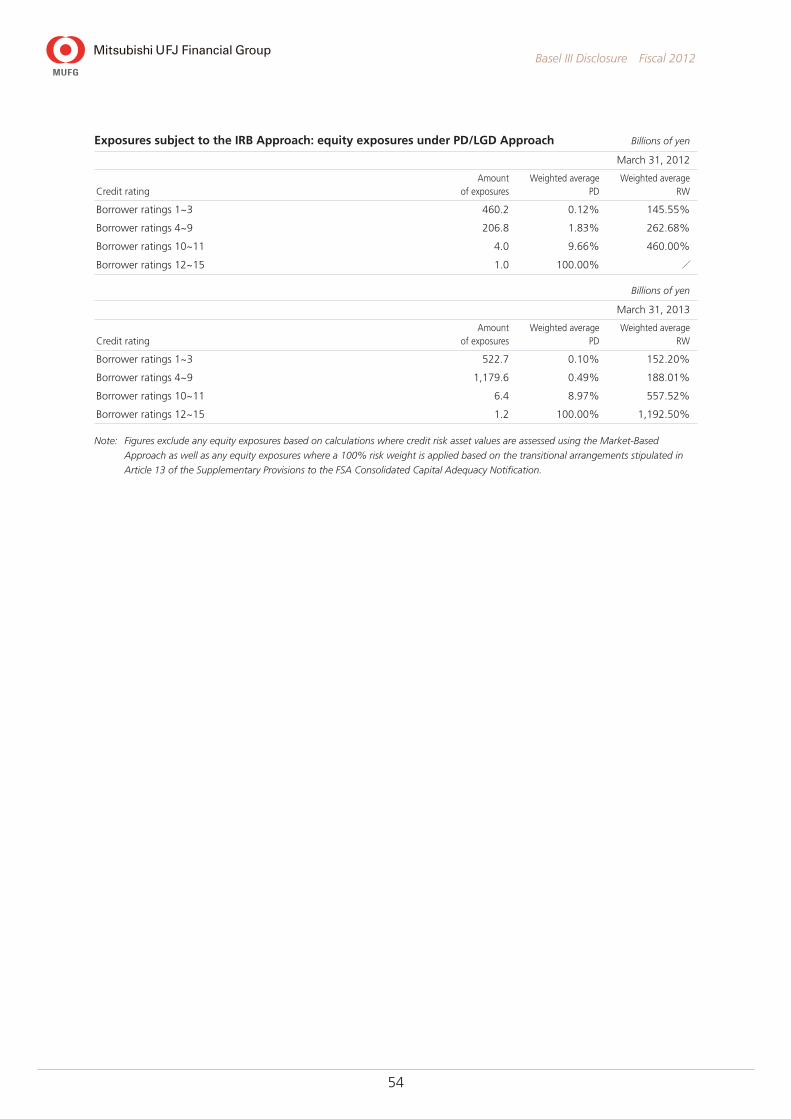
Exposures subject to the IRB Approach: equity exposures under PD/LGD Approach Billions of yen
March 31, 2012
Credit ratingAmount
of exposuresWeighted average
PDWeighted average
RW
Borrower ratings 1~3 460.2 0.12% 145.55%
Borrower ratings 4~9 206.8 1.83% 262.68%
Borrower ratings 10~11 4.0 9.66% 460.00%
Borrower ratings 12~15 1.0 100.00% /
Billions of yen
March 31, 2013
Credit ratingAmount
of exposuresWeighted average
PDWeighted average
RW
Borrower ratings 1~3 522.7 0.10% 152.20%
Borrower ratings 4~9 1,179.6 0.49% 188.01%
Borrower ratings 10~11 6.4 8.97% 557.52%
Borrower ratings 12~15 1.2 100.00% 1,192.50%
Note: Figures exclude any equity exposures based on calculations where credit risk asset values are assessed using the Market-Based
Approach as well as any equity exposures where a 100% risk weight is applied based on the transitional arrangements stipulated in
Article 13 of the Supplementary Provisions to the FSA Consolidated Capital Adequacy Notification.
55
Basel III Disclosure Fiscal 2012
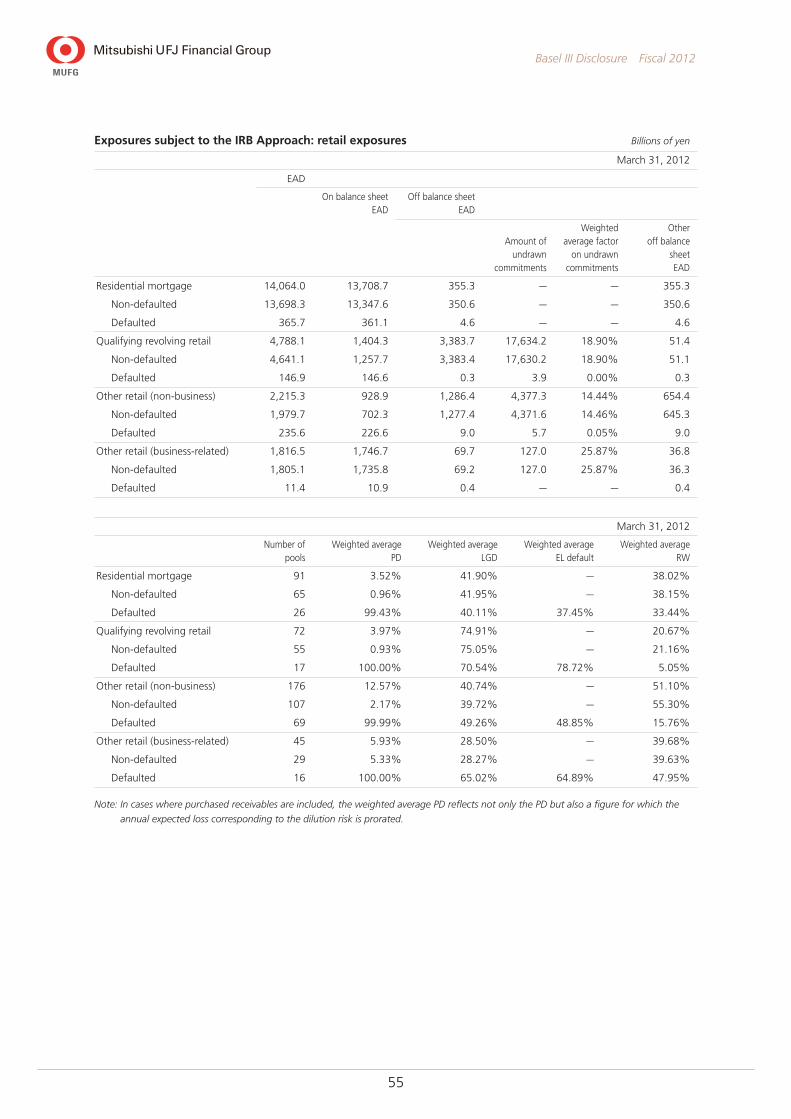
Exposures subject to the IRB Approach: retail exposures Billions of yen
March 31, 2012
EAD
On balance sheet EAD
Off balance sheet EAD
Amount of undrawn
commitments
Weighted average factor
on undrawn commitments
Other off balance
sheet EAD
Residential mortgage 14,064.0 13,708.7 355.3 — — 355.3
Non-defaulted 13,698.3 13,347.6 350.6 — — 350.6
Defaulted 365.7 361.1 4.6 — — 4.6
Qualifying revolving retail 4,788.1 1,404.3 3,383.7 17,634.2 18.90% 51.4
Non-defaulted 4,641.1 1,257.7 3,383.4 17,630.2 18.90% 51.1
Defaulted 146.9 146.6 0.3 3.9 0.00% 0.3
Other retail (non-business) 2,215.3 928.9 1,286.4 4,377.3 14.44% 654.4
Non-defaulted 1,979.7 702.3 1,277.4 4,371.6 14.46% 645.3
Defaulted 235.6 226.6 9.0 5.7 0.05% 9.0
Other retail (business-related) 1,816.5 1,746.7 69.7 127.0 25.87% 36.8
Non-defaulted 1,805.1 1,735.8 69.2 127.0 25.87% 36.3
Defaulted 11.4 10.9 0.4 — — 0.4
March 31, 2012
Number of pools
Weighted average PD
Weighted average LGD
Weighted average EL default
Weighted average RW
Residential mortgage 91 3.52% 41.90% — 38.02%
Non-defaulted 65 0.96% 41.95% — 38.15%
Defaulted 26 99.43% 40.11% 37.45% 33.44%
Qualifying revolving retail 72 3.97% 74.91% — 20.67%
Non-defaulted 55 0.93% 75.05% — 21.16%
Defaulted 17 100.00% 70.54% 78.72% 5.05%
Other retail (non-business) 176 12.57% 40.74% — 51.10%
Non-defaulted 107 2.17% 39.72% — 55.30%
Defaulted 69 99.99% 49.26% 48.85% 15.76%
Other retail (business-related) 45 5.93% 28.50% — 39.68%
Non-defaulted 29 5.33% 28.27% — 39.63%
Defaulted 16 100.00% 65.02% 64.89% 47.95%
Note: In cases where purchased receivables are included, the weighted average PD reflects not only the PD but also a figure for which the
annual expected loss corresponding to the dilution risk is prorated.

56
Basel III Disclosure Fiscal 2012
Exposures subject to the IRB Approach: retail exposures (continued) Billions of yen
March 31, 2013
EAD
On balance sheet EAD
Off balance sheet EAD
Amount of undrawn
commitments
Weighted average factor
on undrawn commitments
Other off balance
sheet EAD
Residential mortgage 13,900.4 13,638.1 262.2 — — 262.2
Non-defaulted 13,569.1 13,311.0 258.1 — — 258.1
Defaulted 331.2 327.0 4.1 — — 4.1
Qualifying revolving retail 4,278.9 1,326.6 2,952.3 17,433.2 16.65% 50.2
Non-defaulted 4,147.4 1,195.6 2,951.8 17,429.3 16.65% 49.7
Defaulted 131.4 131.0 0.4 3.9 0.00% 0.4
Other retail (non-business) 2,040.1 899.8 1,140.3 4,325.2 13.57% 553.3
Non-defaulted 1,830.2 696.9 1,133.3 4,319.2 13.59% 546.3
Defaulted 209.8 202.8 7.0 5.9 0.05% 7.0
Other retail (business-related) 1,649.2 1,587.5 61.7 114.9 24.92% 33.1
Non-defaulted 1,638.8 1,577.4 61.3 114.9 24.92% 32.7
Defaulted 10.4 10.0 0.4 — — 0.4
March 31, 2013
Number of pools
Weighted average PD
Weighted average LGD
Weighted average EL default
Weighted average RW
Residential mortgage 114 3.33% 35.79% — 32.64%
Non-defaulted 77 0.97% 35.83% — 32.93%
Defaulted 37 99.97% 34.48% 32.92% 20.88%
Qualifying revolving retail 72 3.91% 76.51% — 20.20%
Non-defaulted 55 0.87% 76.60% — 20.76%
Defaulted 17 100.00% 73.77% 78.55% 2.74%
Other retail (non-business) 177 12.28% 42.27% — 53.48%
Non-defaulted 105 2.22% 41.59% — 57.98%
Defaulted 72 99.99% 48.29% 47.86% 14.29%
Other retail (business-related) 43 4.52% 20.83% — 27.98%
Non-defaulted 28 3.91% 20.53% — 27.84%
Defaulted 15 100.00% 66.65% 63.14% 50.26%
Note: In cases where purchased receivables are included, the weighted average PD reflects not only the PD but also a figure for which the
annual expected loss corresponding to the dilution risk is prorated.
57
Basel III Disclosure Fiscal 2012
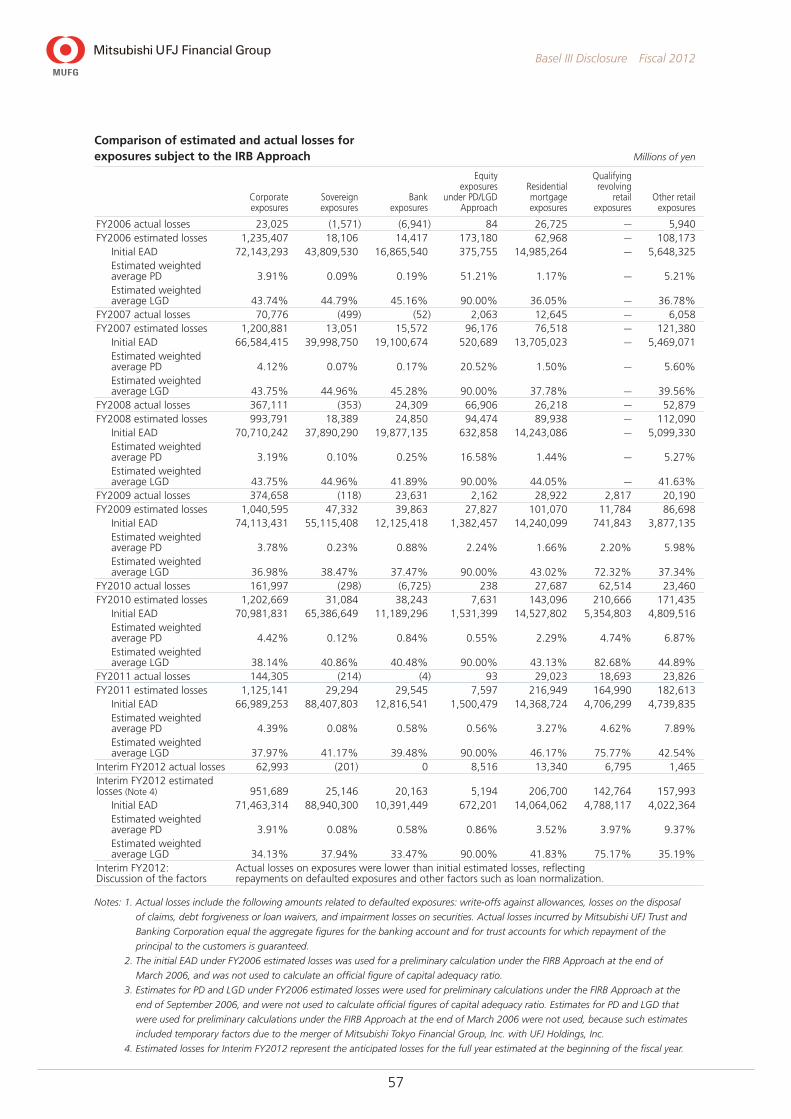
Comparison of estimated and actual losses for exposures subject to the IRB Approach Millions of yen
Corporate exposures
Sovereign exposures
Bank exposures
Equity exposures
under PD/LGD Approach
Residential mortgage exposures
Qualifying revolving
retail exposures
Other retail exposures
FY2006 actual losses 23,025 (1,571) (6,941) 84 26,725 — 5,940FY2006 estimated losses 1,235,407 18,106 14,417 173,180 62,968 — 108,173
Initial EAD 72,143,293 43,809,530 16,865,540 375,755 14,985,264 — 5,648,325Estimated weighted average PD 3.91% 0.09% 0.19% 51.21% 1.17% — 5.21%Estimated weighted average LGD 43.74% 44.79% 45.16% 90.00% 36.05% — 36.78%
FY2007 actual losses 70,776 (499) (52) 2,063 12,645 — 6,058 FY2007 estimated losses 1,200,881 13,051 15,572 96,176 76,518 — 121,380
Initial EAD 66,584,415 39,998,750 19,100,674 520,689 13,705,023 — 5,469,071Estimated weighted average PD 4.12% 0.07% 0.17% 20.52% 1.50% — 5.60%Estimated weighted average LGD 43.75% 44.96% 45.28% 90.00% 37.78% — 39.56%
FY2008 actual losses 367,111 (353) 24,309 66,906 26,218 — 52,879FY2008 estimated losses 993,791 18,389 24,850 94,474 89,938 — 112,090
Initial EAD 70,710,242 37,890,290 19,877,135 632,858 14,243,086 — 5,099,330Estimated weighted average PD 3.19% 0.10% 0.25% 16.58% 1.44% — 5.27%Estimated weighted average LGD 43.75% 44.96% 41.89% 90.00% 44.05% — 41.63%
FY2009 actual losses 374,658 (118) 23,631 2,162 28,922 2,817 20,190 FY2009 estimated losses 1,040,595 47,332 39,863 27,827 101,070 11,784 86,698
Initial EAD 74,113,431 55,115,408 12,125,418 1,382,457 14,240,099 741,843 3,877,135 Estimated weighted average PD 3.78% 0.23% 0.88% 2.24% 1.66% 2.20% 5.98%Estimated weighted average LGD 36.98% 38.47% 37.47% 90.00% 43.02% 72.32% 37.34%
FY2010 actual losses 161,997 (298) (6,725) 238 27,687 62,514 23,460FY2010 estimated losses 1,202,669 31,084 38,243 7,631 143,096 210,666 171,435
Initial EAD 70,981,831 65,386,649 11,189,296 1,531,399 14,527,802 5,354,803 4,809,516 Estimated weighted average PD 4.42% 0.12% 0.84% 0.55% 2.29% 4.74% 6.87%Estimated weighted average LGD 38.14% 40.86% 40.48% 90.00% 43.13% 82.68% 44.89%
FY2011 actual losses 144,305 (214) (4) 93 29,023 18,693 23,826FY2011 estimated losses 1,125,141 29,294 29,545 7,597 216,949 164,990 182,613
Initial EAD 66,989,253 88,407,803 12,816,541 1,500,479 14,368,724 4,706,299 4,739,835Estimated weighted average PD 4.39% 0.08% 0.58% 0.56% 3.27% 4.62% 7.89%Estimated weighted average LGD 37.97% 41.17% 39.48% 90.00% 46.17% 75.77% 42.54%
Interim FY2012 actual losses 62,993 (201) 0 8,516 13,340 6,795 1,465Interim FY2012 estimated losses (Note 4) 951,689 25,146 20,163 5,194 206,700 142,764 157,993
Initial EAD 71,463,314 88,940,300 10,391,449 672,201 14,064,062 4,788,117 4,022,364Estimated weighted average PD 3.91% 0.08% 0.58% 0.86% 3.52% 3.97% 9.37%Estimated weighted average LGD 34.13% 37.94% 33.47% 90.00% 41.83% 75.17% 35.19%
Interim FY2012: Discussion of the factors
Actual losses on exposures were lower than initial estimated losses, reflecting repayments on defaulted exposures and other factors such as loan normalization.
Notes: 1. Actual losses include the following amounts related to defaulted exposures: write-offs against allowances, losses on the disposal
of claims, debt forgiveness or loan waivers, and impairment losses on securities. Actual losses incurred by Mitsubishi UFJ Trust and
Banking Corporation equal the aggregate figures for the banking account and for trust accounts for which repayment of the
principal to the customers is guaranteed.
2. The initial EAD under FY2006 estimated losses was used for a preliminary calculation under the FIRB Approach at the end of
March 2006, and was not used to calculate an official figure of capital adequacy ratio.
3. Estimates for PD and LGD under FY2006 estimated losses were used for preliminary calculations under the FIRB Approach at the
end of September 2006, and were not used to calculate official figures of capital adequacy ratio. Estimates for PD and LGD that
were used for preliminary calculations under the FIRB Approach at the end of March 2006 were not used, because such estimates
included temporary factors due to the merger of Mitsubishi Tokyo Financial Group, Inc. with UFJ Holdings, Inc.
4. Estimated losses for Interim FY2012 represent the anticipated losses for the full year estimated at the beginning of the fiscal year.
58
Basel III Disclosure Fiscal 2012
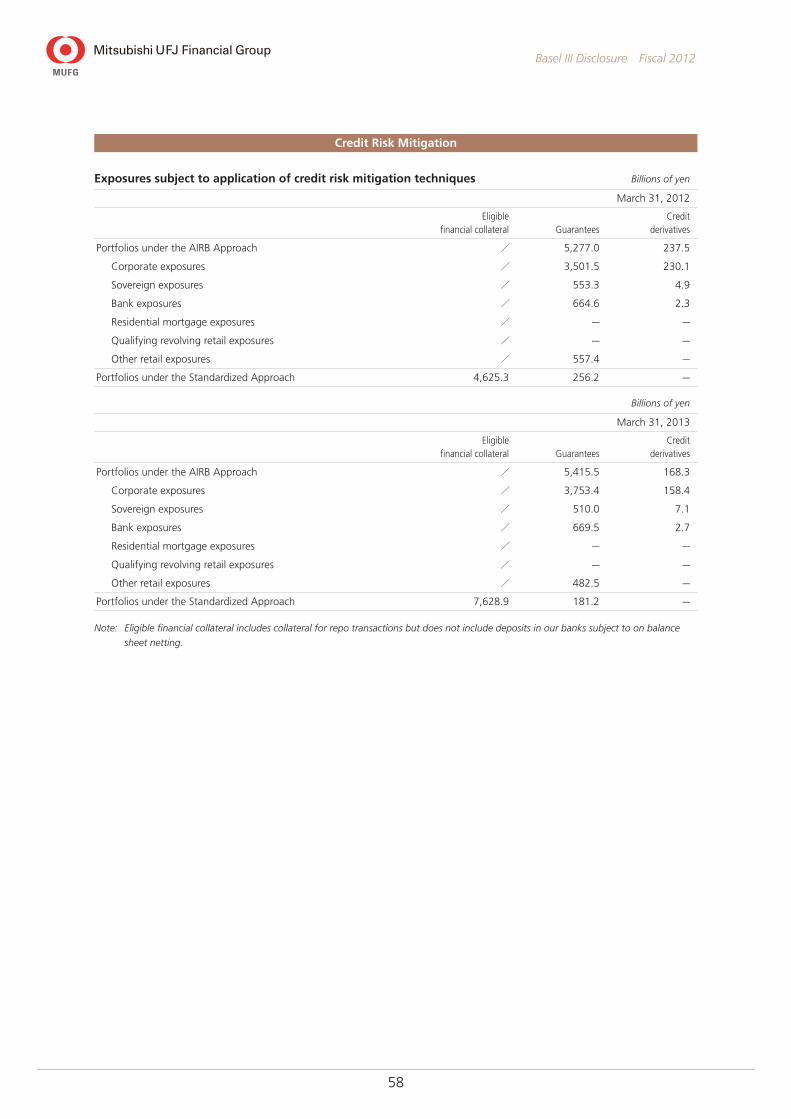
Credit Risk Mitigation
Exposures subject to application of credit risk mitigation techniques Billions of yen
March 31, 2012
Eligible financial collateral Guarantees
Credit derivatives
Portfolios under the AIRB Approach / 5,277.0 237.5
Corporate exposures / 3,501.5 230.1
Sovereign exposures / 553.3 4.9
Bank exposures / 664.6 2.3
Residential mortgage exposures / — —
Qualifying revolving retail exposures / — —
Other retail exposures / 557.4 —
Portfolios under the Standardized Approach 4,625.3 256.2 —
Billions of yen
March 31, 2013
Eligible financial collateral Guarantees
Credit derivatives
Portfolios under the AIRB Approach / 5,415.5 168.3
Corporate exposures / 3,753.4 158.4
Sovereign exposures / 510.0 7.1
Bank exposures / 669.5 2.7
Residential mortgage exposures / — —
Qualifying revolving retail exposures / — —
Other retail exposures / 482.5 —
Portfolios under the Standardized Approach 7,628.9 181.2 —
Note: Eligible financial collateral includes collateral for repo transactions but does not include deposits in our banks subject to on balance
sheet netting.
59
Basel III Disclosure Fiscal 2012
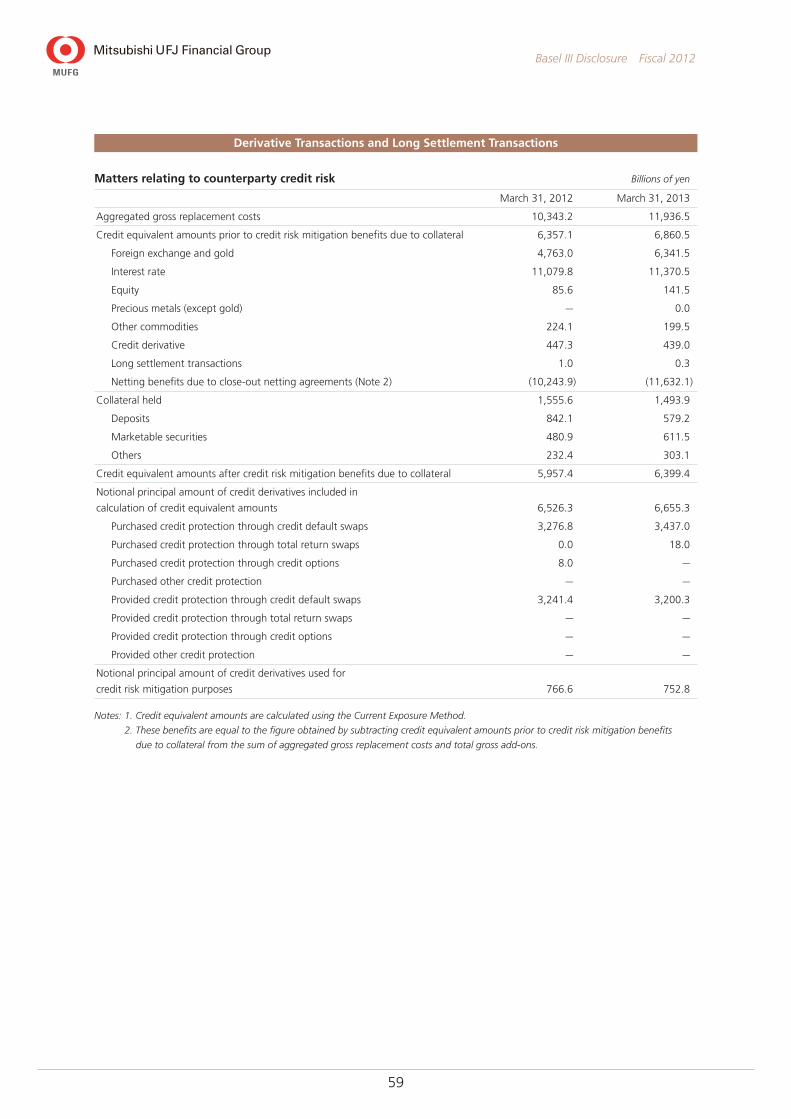
Derivative Transactions and Long Settlement Transactions
Matters relating to counterparty credit risk Billions of yen
March 31, 2012 March 31, 2013
Aggregated gross replacement costs 10,343.2 11,936.5
Credit equivalent amounts prior to credit risk mitigation benefits due to collateral 6,357.1 6,860.5
Foreign exchange and gold 4,763.0 6,341.5
Interest rate 11,079.8 11,370.5
Equity 85.6 141.5
Precious metals (except gold) — 0.0
Other commodities 224.1 199.5
Credit derivative 447.3 439.0
Long settlement transactions 1.0 0.3
Netting benefits due to close-out netting agreements (Note 2) (10,243.9) (11,632.1)
Collateral held 1,555.6 1,493.9
Deposits 842.1 579.2
Marketable securities 480.9 611.5
Others 232.4 303.1
Credit equivalent amounts after credit risk mitigation benefits due to collateral 5,957.4 6,399.4
Notional principal amount of credit derivatives included in
calculation of credit equivalent amounts 6,526.3 6,655.3
Purchased credit protection through credit default swaps 3,276.8 3,437.0
Purchased credit protection through total return swaps 0.0 18.0
Purchased credit protection through credit options 8.0 —
Purchased other credit protection — —
Provided credit protection through credit default swaps 3,241.4 3,200.3
Provided credit protection through total return swaps — —
Provided credit protection through credit options — —
Provided other credit protection — —
Notional principal amount of credit derivatives used for
credit risk mitigation purposes 766.6 752.8
Notes: 1. Credit equivalent amounts are calculated using the Current Exposure Method.
2. These benefits are equal to the figure obtained by subtracting credit equivalent amounts prior to credit risk mitigation benefits
due to collateral from the sum of aggregated gross replacement costs and total gross add-ons.
60
Basel III Disclosure Fiscal 2012
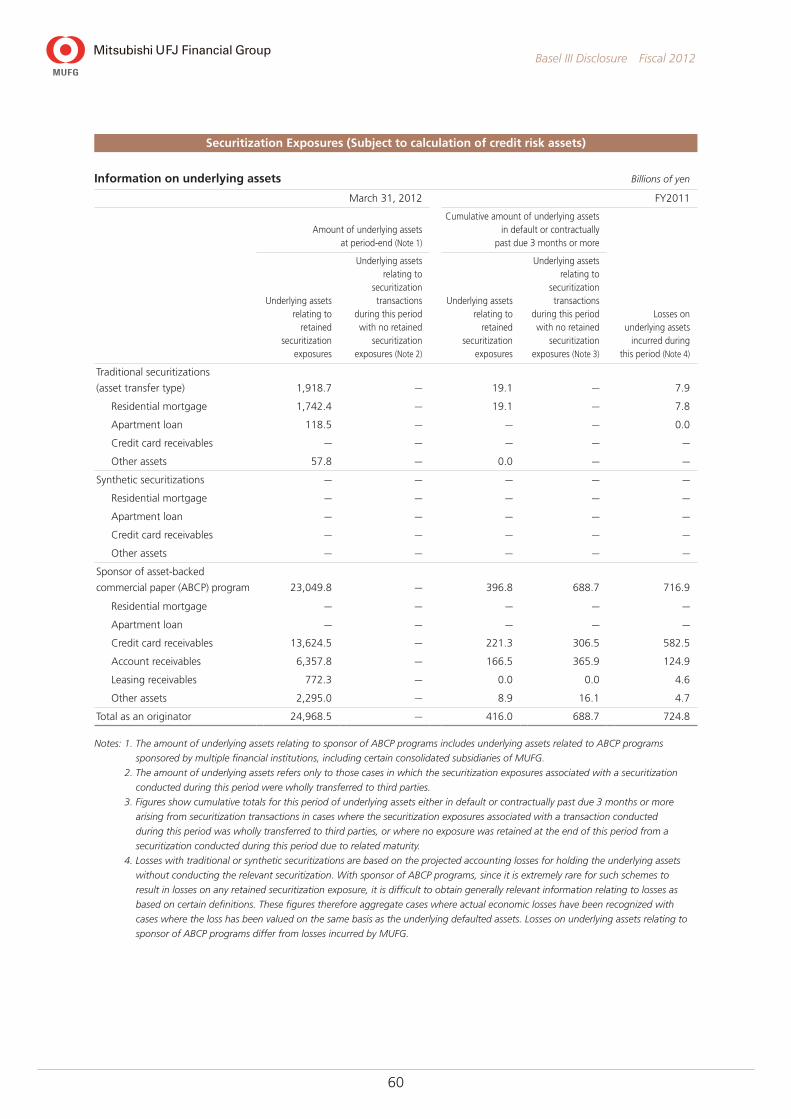
Securitization Exposures (Subject to calculation of credit risk assets)
Information on underlying assets Billions of yen
March 31, 2012 FY2011
Amount of underlying assets at period-end (Note 1)
Cumulative amount of underlying assets in default or contractually
past due 3 months or more
Underlying assets relating to
retained securitization
exposures
Underlying assets relating to
securitization transactions
during this period with no retained
securitization exposures (Note 2)
Underlying assets relating to
retained securitization
exposures
Underlying assets relating to
securitization transactions
during this period with no retained
securitization exposures (Note 3)
Losses on underlying assets
incurred during this period (Note 4)
Traditional securitizations
(asset transfer type) 1,918.7 — 19.1 — 7.9
Residential mortgage 1,742.4 — 19.1 — 7.8
Apartment loan 118.5 — — — 0.0
Credit card receivables — — — — —
Other assets 57.8 — 0.0 — —
Synthetic securitizations — — — — —
Residential mortgage — — — — —
Apartment loan — — — — —
Credit card receivables — — — — —
Other assets — — — — —
Sponsor of asset-backed
commercial paper (ABCP) program 23,049.8 — 396.8 688.7 716.9
Residential mortgage — — — — —
Apartment loan — — — — —
Credit card receivables 13,624.5 — 221.3 306.5 582.5
Account receivables 6,357.8 — 166.5 365.9 124.9
Leasing receivables 772.3 — 0.0 0.0 4.6
Other assets 2,295.0 — 8.9 16.1 4.7
Total as an originator 24,968.5 — 416.0 688.7 724.8
Notes: 1. The amount of underlying assets relating to sponsor of ABCP programs includes underlying assets related to ABCP programs
sponsored by multiple financial institutions, including certain consolidated subsidiaries of MUFG.
2. The amount of underlying assets refers only to those cases in which the securitization exposures associated with a securitization
conducted during this period were wholly transferred to third parties.
3. Figures show cumulative totals for this period of underlying assets either in default or contractually past due 3 months or more
arising from securitization transactions in cases where the securitization exposures associated with a transaction conducted
during this period was wholly transferred to third parties, or where no exposure was retained at the end of this period from a
securitization conducted during this period due to related maturity.
4. Losses with traditional or synthetic securitizations are based on the projected accounting losses for holding the underlying assets
without conducting the relevant securitization. With sponsor of ABCP programs, since it is extremely rare for such schemes to
result in losses on any retained securitization exposure, it is difficult to obtain generally relevant information relating to losses as
based on certain definitions. These figures therefore aggregate cases where actual economic losses have been recognized with
cases where the loss has been valued on the same basis as the underlying defaulted assets. Losses on underlying assets relating to
sponsor of ABCP programs differ from losses incurred by MUFG.

61
Basel III Disclosure Fiscal 2012
Information on underlying assets (continued) Billions of yen
March 31, 2013 FY2012
Amount of underlying assets at period-end (Note 1)
Cumulative amount of underlying assets in default or contractually
past due 3 months or more
Underlying assets relating to
retained securitization
exposures
Underlying assets relating to
securitization transactions
during this period with no retained
securitization exposures (Note 2)
Underlying assets relating to
retained securitization
exposures
Underlying assets relating to
securitization transactions
during this period with no retained
securitization exposures (Note 3)
Losses on underlying assets
incurred during this period (Note 4)
Traditional securitizations
(asset transfer type) 1,558.9 — 11.4 — 3.6
Residential mortgage 1,526.9 — 11.4 — 3.6
Apartment loan — — — — —
Credit card receivables — — — — —
Other assets 31.9 — 0.0 — —
Synthetic securitizations — — — — —
Residential mortgage — — — — —
Apartment loan — — — — —
Credit card receivables — — — — —
Other assets — — — — —
Sponsor of asset-backed
commercial paper (ABCP) program 21,523.8 — 378.6 1,176.4 575.9
Residential mortgage — — — — —
Apartment loan — — — — —
Credit card receivables 8,151.4 — 126.9 656.7 386.4
Account receivables 7,890.6 — 239.2 482.2 150.6
Leasing receivables 1,298.8 — 1.3 0.7 3.3
Other assets 4,182.9 — 11.0 36.6 35.4
Total as an originator 23,082.8 — 390.0 1,176.4 579.6
Notes: 1. The amount of underlying assets relating to sponsor of ABCP programs includes underlying assets related to ABCP programs
sponsored by multiple financial institutions, including certain consolidated subsidiaries of MUFG.
2. The amount of underlying assets refers only to those cases in which the securitization exposures associated with a securitization
conducted during this period were wholly transferred to third parties.
3. Figures show cumulative totals for this period of underlying assets either in default or contractually past due 3 months or more
arising from securitization transactions in cases where the securitization exposures associated with a transaction conducted
during this period was wholly transferred to third parties, or where no exposure was retained at the end of this period from a
securitization conducted during this period due to related maturity.
4. Losses with traditional or synthetic securitizations are based on the projected accounting losses for holding the underlying assets
without conducting the relevant securitization. With sponsor of ABCP programs, since it is extremely rare for such schemes to
result in losses on any retained securitization exposure, it is difficult to obtain generally relevant information relating to losses as
based on certain definitions. These figures therefore aggregate cases where actual economic losses have been recognized with
cases where the loss has been valued on the same basis as the underlying defaulted assets. Losses on underlying assets relating to
sponsor of ABCP programs differ from losses incurred by MUFG.
62
Basel III Disclosure Fiscal 2012
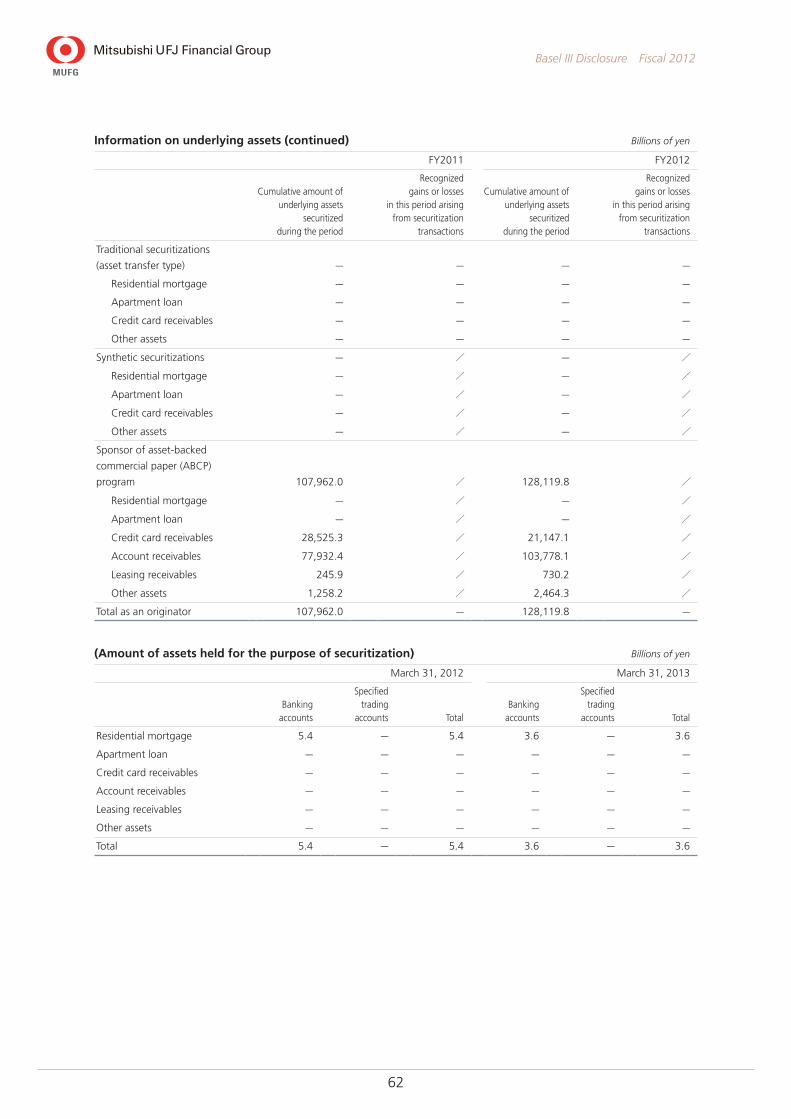
Information on underlying assets (continued) Billions of yen
FY2011 FY2012
Cumulative amount of underlying assets
securitized during the period
Recognized gains or losses
in this period arising from securitization
transactions
Cumulative amount of underlying assets
securitized during the period
Recognized gains or losses
in this period arising from securitization
transactions
Traditional securitizations
(asset transfer type) — — — —
Residential mortgage — — — —
Apartment loan — — — —
Credit card receivables — — — —
Other assets — — — —
Synthetic securitizations — / — /
Residential mortgage — / — /
Apartment loan — / — /
Credit card receivables — / — /
Other assets — / — /
Sponsor of asset-backed
commercial paper (ABCP)
program 107,962.0 / 128,119.8 /
Residential mortgage — / — /
Apartment loan — / — /
Credit card receivables 28,525.3 / 21,147.1 /
Account receivables 77,932.4 / 103,778.1 /
Leasing receivables 245.9 / 730.2 /
Other assets 1,258.2 / 2,464.3 /
Total as an originator 107,962.0 — 128,119.8 —
(Amount of assets held for the purpose of securitization) Billions of yen
March 31, 2012 March 31, 2013
Banking accounts
Specified trading
accounts TotalBanking
accounts
Specified trading
accounts Total
Residential mortgage 5.4 — 5.4 3.6 — 3.6
Apartment loan — — — — — —
Credit card receivables — — — — — —
Account receivables — — — — — —
Leasing receivables — — — — — —
Other assets — — — — — —
Total 5.4 — 5.4 3.6 — 3.6
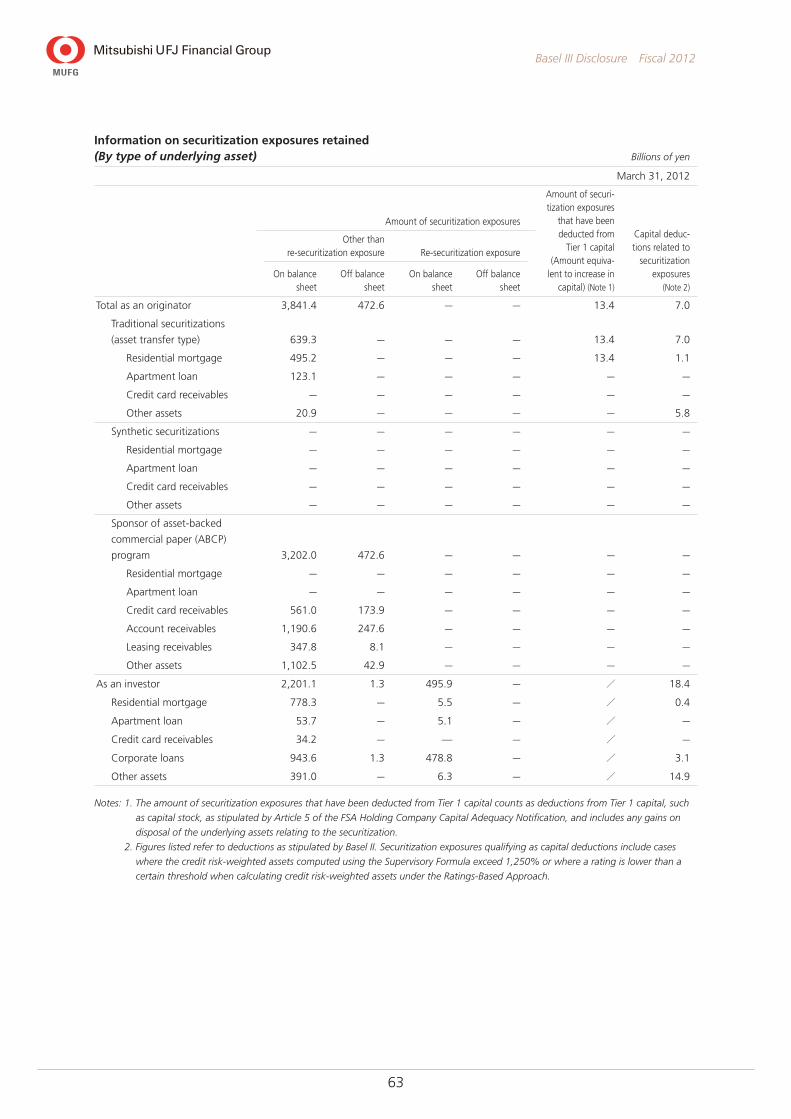
63
Basel III Disclosure Fiscal 2012
Information on securitization exposures retained (By type of underlying asset) Billions of yen
March 31, 2012
Amount of securitization exposures
Amount of securi-tization exposures
that have been deducted from
Tier 1 capital (Amount equiva-
lent to increase in capital) (Note 1)
Capital deduc-tions related to
securitization exposures
(Note 2)
Other than re-securitization exposure Re-securitization exposure
On balance sheet
Off balance sheet
On balance sheet
Off balance sheet
Total as an originator 3,841.4 472.6 — — 13.4 7.0
Traditional securitizations
(asset transfer type) 639.3 — — — 13.4 7.0
Residential mortgage 495.2 — — — 13.4 1.1
Apartment loan 123.1 — — — — —
Credit card receivables — — — — — —
Other assets 20.9 — — — — 5.8
Synthetic securitizations — — — — — —
Residential mortgage — — — — — —
Apartment loan — — — — — —
Credit card receivables — — — — — —
Other assets — — — — — —
Sponsor of asset-backed
commercial paper (ABCP)
program 3,202.0 472.6 — — — —
Residential mortgage — — — — — —
Apartment loan — — — — — —
Credit card receivables 561.0 173.9 — — — —
Account receivables 1,190.6 247.6 — — — —
Leasing receivables 347.8 8.1 — — — —
Other assets 1,102.5 42.9 — — — —
As an investor 2,201.1 1.3 495.9 — / 18.4
Residential mortgage 778.3 — 5.5 — / 0.4
Apartment loan 53.7 — 5.1 — / —
Credit card receivables 34.2 — — — / —
Corporate loans 943.6 1.3 478.8 — / 3.1
Other assets 391.0 — 6.3 — / 14.9
Notes: 1. The amount of securitization exposures that have been deducted from Tier 1 capital counts as deductions from Tier 1 capital, such
as capital stock, as stipulated by Article 5 of the FSA Holding Company Capital Adequacy Notification, and includes any gains on
disposal of the underlying assets relating to the securitization.
2. Figures listed refer to deductions as stipulated by Basel II. Securitization exposures qualifying as capital deductions include cases
where the credit risk-weighted assets computed using the Supervisory Formula exceed 1,250% or where a rating is lower than a
certain threshold when calculating credit risk-weighted assets under the Ratings-Based Approach.
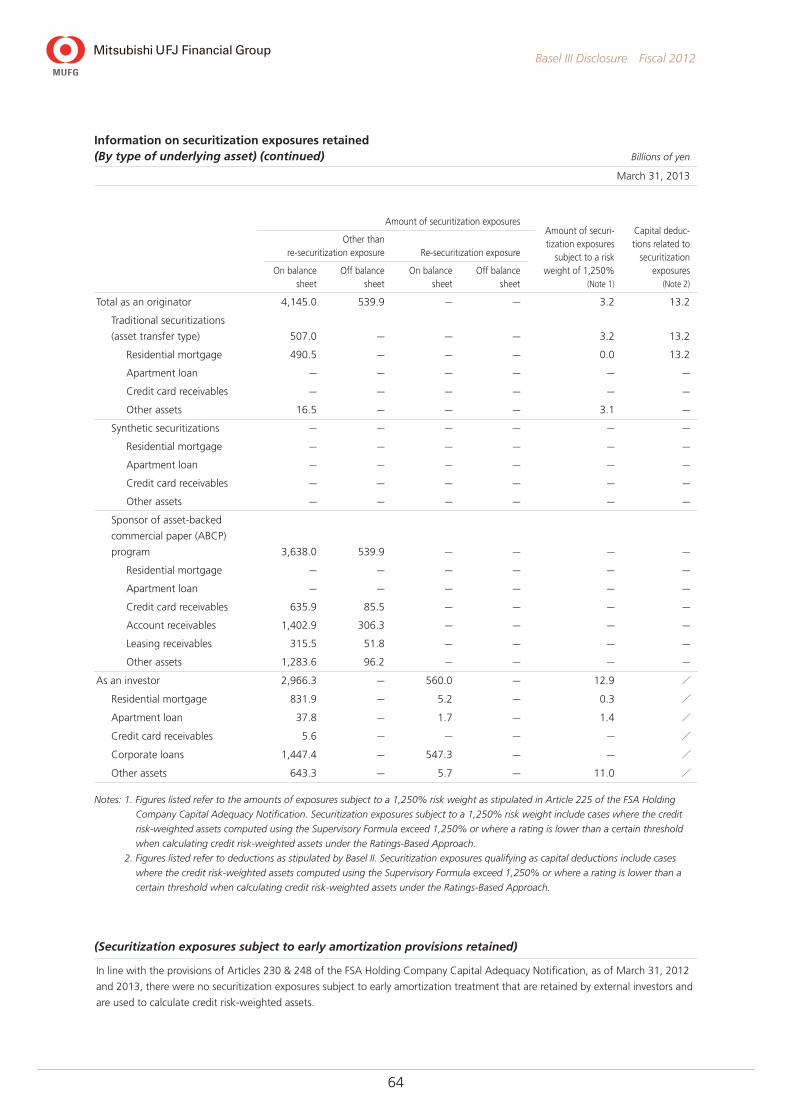
64
Basel III Disclosure Fiscal 2012
Information on securitization exposures retained (By type of underlying asset) (continued) Billions of yen
March 31, 2013
Amount of securitization exposuresAmount of securi-tization exposures
subject to a risk weight of 1,250%
(Note 1)
Capital deduc-tions related to
securitization exposures
(Note 2)
Other than re-securitization exposure Re-securitization exposure
On balance sheet
Off balance sheet
On balance sheet
Off balance sheet
Total as an originator 4,145.0 539.9 — — 3.2 13.2
Traditional securitizations
(asset transfer type) 507.0 — — — 3.2 13.2
Residential mortgage 490.5 — — — 0.0 13.2
Apartment loan — — — — — —
Credit card receivables — — — — — —
Other assets 16.5 — — — 3.1 —
Synthetic securitizations — — — — — —
Residential mortgage — — — — — —
Apartment loan — — — — — —
Credit card receivables — — — — — —
Other assets — — — — — —
Sponsor of asset-backed
commercial paper (ABCP)
program 3,638.0 539.9 — — — —
Residential mortgage — — — — — —
Apartment loan — — — — — —
Credit card receivables 635.9 85.5 — — — —
Account receivables 1,402.9 306.3 — — — —
Leasing receivables 315.5 51.8 — — — —
Other assets 1,283.6 96.2 — — — —
As an investor 2,966.3 — 560.0 — 12.9 /
Residential mortgage 831.9 — 5.2 — 0.3 /
Apartment loan 37.8 — 1.7 — 1.4 /
Credit card receivables 5.6 — — — — /
Corporate loans 1,447.4 — 547.3 — — /
Other assets 643.3 — 5.7 — 11.0 /
Notes: 1. Figures listed refer to the amounts of exposures subject to a 1,250% risk weight as stipulated in Article 225 of the FSA Holding
Company Capital Adequacy Notification. Securitization exposures subject to a 1,250% risk weight include cases where the credit
risk-weighted assets computed using the Supervisory Formula exceed 1,250% or where a rating is lower than a certain threshold
when calculating credit risk-weighted assets under the Ratings-Based Approach.
2. Figures listed refer to deductions as stipulated by Basel II. Securitization exposures qualifying as capital deductions include cases
where the credit risk-weighted assets computed using the Supervisory Formula exceed 1,250% or where a rating is lower than a
certain threshold when calculating credit risk-weighted assets under the Ratings-Based Approach.
(Securitization exposures subject to early amortization provisions retained)
In line with the provisions of Articles 230 & 248 of the FSA Holding Company Capital Adequacy Notification, as of March 31, 2012
and 2013, there were no securitization exposures subject to early amortization treatment that are retained by external investors and
are used to calculate credit risk-weighted assets.
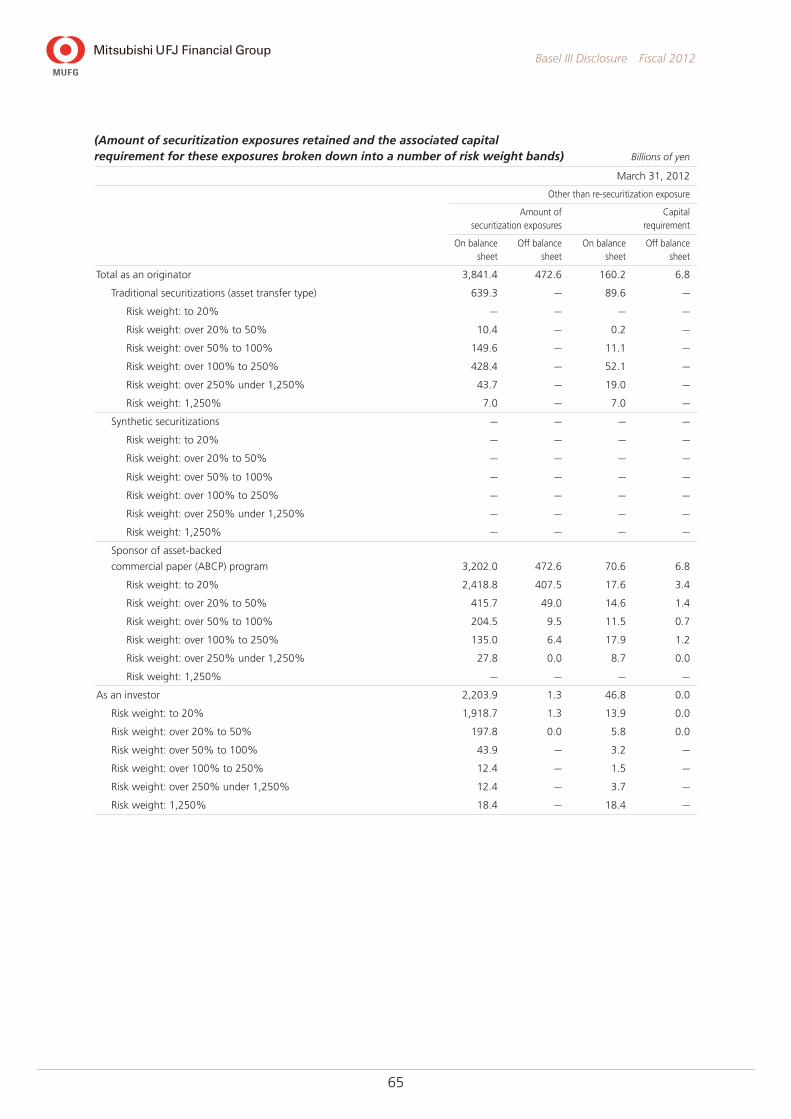
65
Basel III Disclosure Fiscal 2012
(Amount of securitization exposures retained and the associated capital requirement for these exposures broken down into a number of risk weight bands) Billions of yen
March 31, 2012
Other than re-securitization exposure
Amount of securitization exposures
Capital requirement
On balance sheet
Off balance sheet
On balance sheet
Off balance sheet
Total as an originator 3,841.4 472.6 160.2 6.8
Traditional securitizations (asset transfer type) 639.3 — 89.6 —
Risk weight: to 20% — — — —
Risk weight: over 20% to 50% 10.4 — 0.2 —
Risk weight: over 50% to 100% 149.6 — 11.1 —
Risk weight: over 100% to 250% 428.4 — 52.1 —
Risk weight: over 250% under 1,250% 43.7 — 19.0 —
Risk weight: 1,250% 7.0 — 7.0 —
Synthetic securitizations — — — —
Risk weight: to 20% — — — —
Risk weight: over 20% to 50% — — — —
Risk weight: over 50% to 100% — — — —
Risk weight: over 100% to 250% — — — —
Risk weight: over 250% under 1,250% — — — —
Risk weight: 1,250% — — — —
Sponsor of asset-backed
commercial paper (ABCP) program 3,202.0 472.6 70.6 6.8
Risk weight: to 20% 2,418.8 407.5 17.6 3.4
Risk weight: over 20% to 50% 415.7 49.0 14.6 1.4
Risk weight: over 50% to 100% 204.5 9.5 11.5 0.7
Risk weight: over 100% to 250% 135.0 6.4 17.9 1.2
Risk weight: over 250% under 1,250% 27.8 0.0 8.7 0.0
Risk weight: 1,250% — — — —
As an investor 2,203.9 1.3 46.8 0.0
Risk weight: to 20% 1,918.7 1.3 13.9 0.0
Risk weight: over 20% to 50% 197.8 0.0 5.8 0.0
Risk weight: over 50% to 100% 43.9 — 3.2 —
Risk weight: over 100% to 250% 12.4 — 1.5 —
Risk weight: over 250% under 1,250% 12.4 — 3.7 —
Risk weight: 1,250% 18.4 — 18.4 —
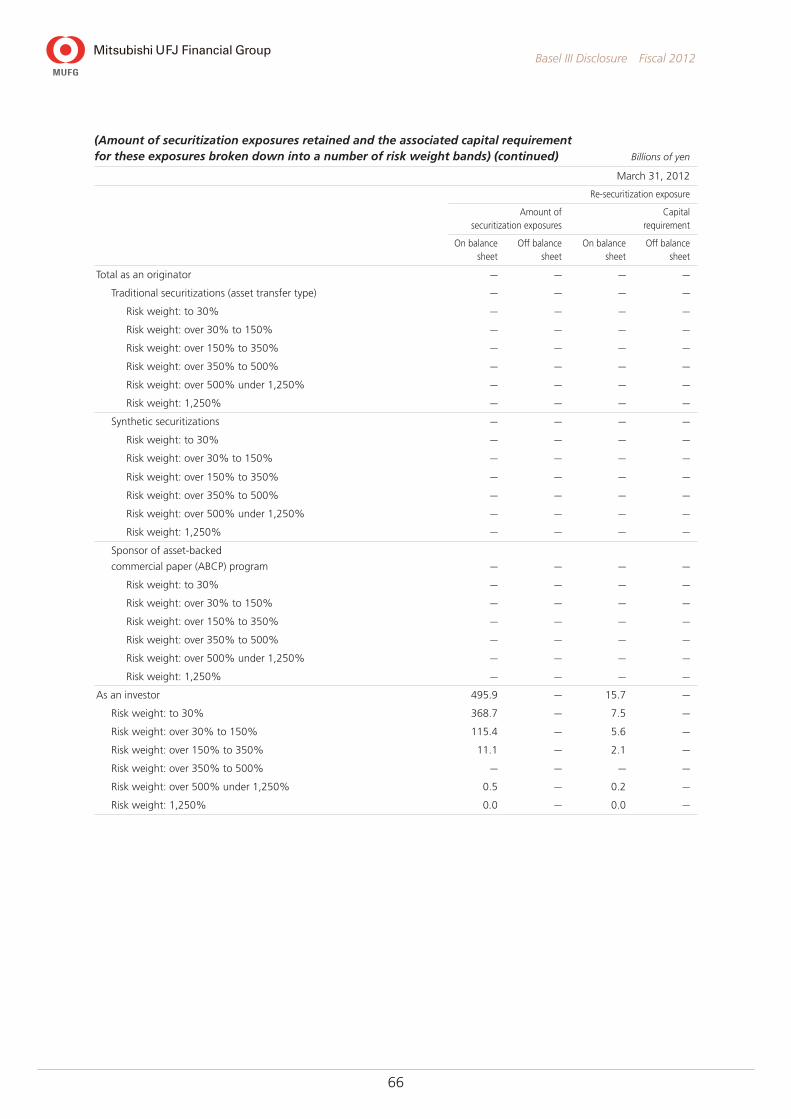
66
Basel III Disclosure Fiscal 2012
(Amount of securitization exposures retained and the associated capital requirement for these exposures broken down into a number of risk weight bands) (continued) Billions of yen
March 31, 2012
Re-securitization exposure
Amount of securitization exposures
Capital requirement
On balance sheet
Off balance sheet
On balance sheet
Off balance sheet
Total as an originator — — — —
Traditional securitizations (asset transfer type) — — — —
Risk weight: to 30% — — — —
Risk weight: over 30% to 150% — — — —
Risk weight: over 150% to 350% — — — —
Risk weight: over 350% to 500% — — — —
Risk weight: over 500% under 1,250% — — — —
Risk weight: 1,250% — — — —
Synthetic securitizations — — — —
Risk weight: to 30% — — — —
Risk weight: over 30% to 150% — — — —
Risk weight: over 150% to 350% — — — —
Risk weight: over 350% to 500% — — — —
Risk weight: over 500% under 1,250% — — — —
Risk weight: 1,250% — — — —
Sponsor of asset-backed
commercial paper (ABCP) program — — — —
Risk weight: to 30% — — — —
Risk weight: over 30% to 150% — — — —
Risk weight: over 150% to 350% — — — —
Risk weight: over 350% to 500% — — — —
Risk weight: over 500% under 1,250% — — — —
Risk weight: 1,250% — — — —
As an investor 495.9 — 15.7 —
Risk weight: to 30% 368.7 — 7.5 —
Risk weight: over 30% to 150% 115.4 — 5.6 —
Risk weight: over 150% to 350% 11.1 — 2.1 —
Risk weight: over 350% to 500% — — — —
Risk weight: over 500% under 1,250% 0.5 — 0.2 —
Risk weight: 1,250% 0.0 — 0.0 —
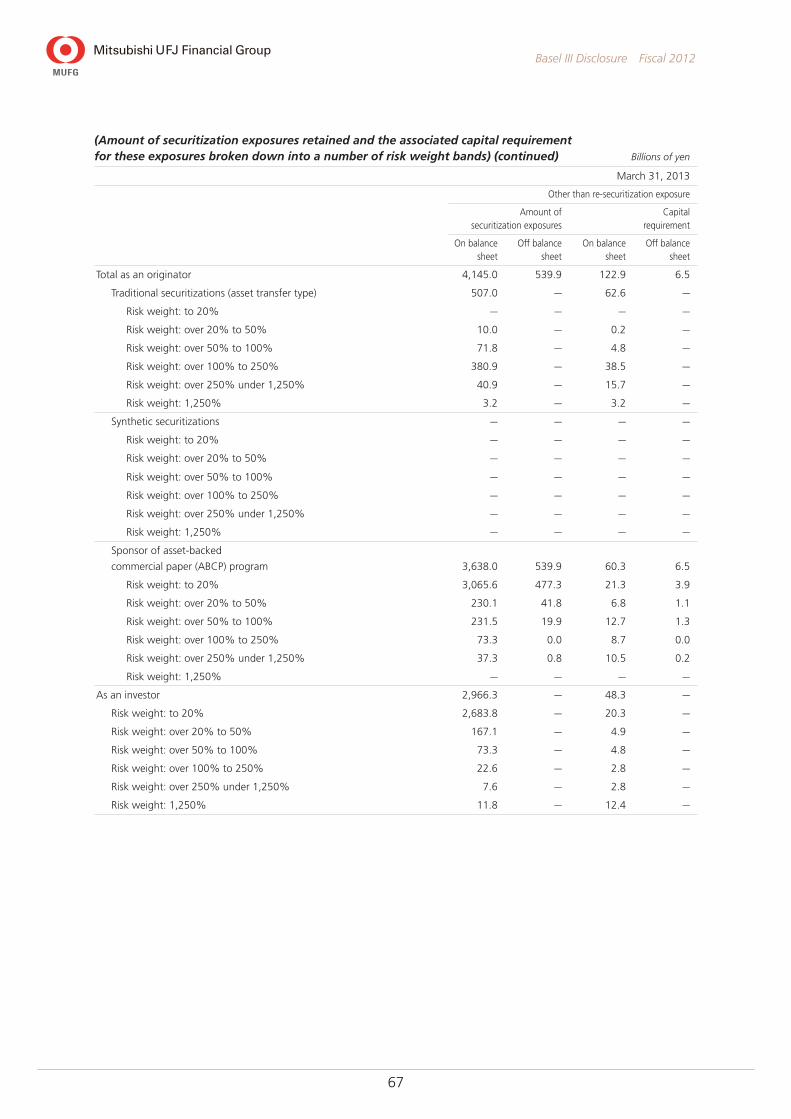
67
Basel III Disclosure Fiscal 2012
(Amount of securitization exposures retained and the associated capital requirement for these exposures broken down into a number of risk weight bands) (continued) Billions of yen
March 31, 2013
Other than re-securitization exposure
Amount of securitization exposures
Capital requirement
On balance sheet
Off balance sheet
On balance sheet
Off balance sheet
Total as an originator 4,145.0 539.9 122.9 6.5
Traditional securitizations (asset transfer type) 507.0 — 62.6 —
Risk weight: to 20% — — — —
Risk weight: over 20% to 50% 10.0 — 0.2 —
Risk weight: over 50% to 100% 71.8 — 4.8 —
Risk weight: over 100% to 250% 380.9 — 38.5 —
Risk weight: over 250% under 1,250% 40.9 — 15.7 —
Risk weight: 1,250% 3.2 — 3.2 —
Synthetic securitizations — — — —
Risk weight: to 20% — — — —
Risk weight: over 20% to 50% — — — —
Risk weight: over 50% to 100% — — — —
Risk weight: over 100% to 250% — — — —
Risk weight: over 250% under 1,250% — — — —
Risk weight: 1,250% — — — —
Sponsor of asset-backed
commercial paper (ABCP) program 3,638.0 539.9 60.3 6.5
Risk weight: to 20% 3,065.6 477.3 21.3 3.9
Risk weight: over 20% to 50% 230.1 41.8 6.8 1.1
Risk weight: over 50% to 100% 231.5 19.9 12.7 1.3
Risk weight: over 100% to 250% 73.3 0.0 8.7 0.0
Risk weight: over 250% under 1,250% 37.3 0.8 10.5 0.2
Risk weight: 1,250% — — — —
As an investor 2,966.3 — 48.3 —
Risk weight: to 20% 2,683.8 — 20.3 —
Risk weight: over 20% to 50% 167.1 — 4.9 —
Risk weight: over 50% to 100% 73.3 — 4.8 —
Risk weight: over 100% to 250% 22.6 — 2.8 —
Risk weight: over 250% under 1,250% 7.6 — 2.8 —
Risk weight: 1,250% 11.8 — 12.4 —
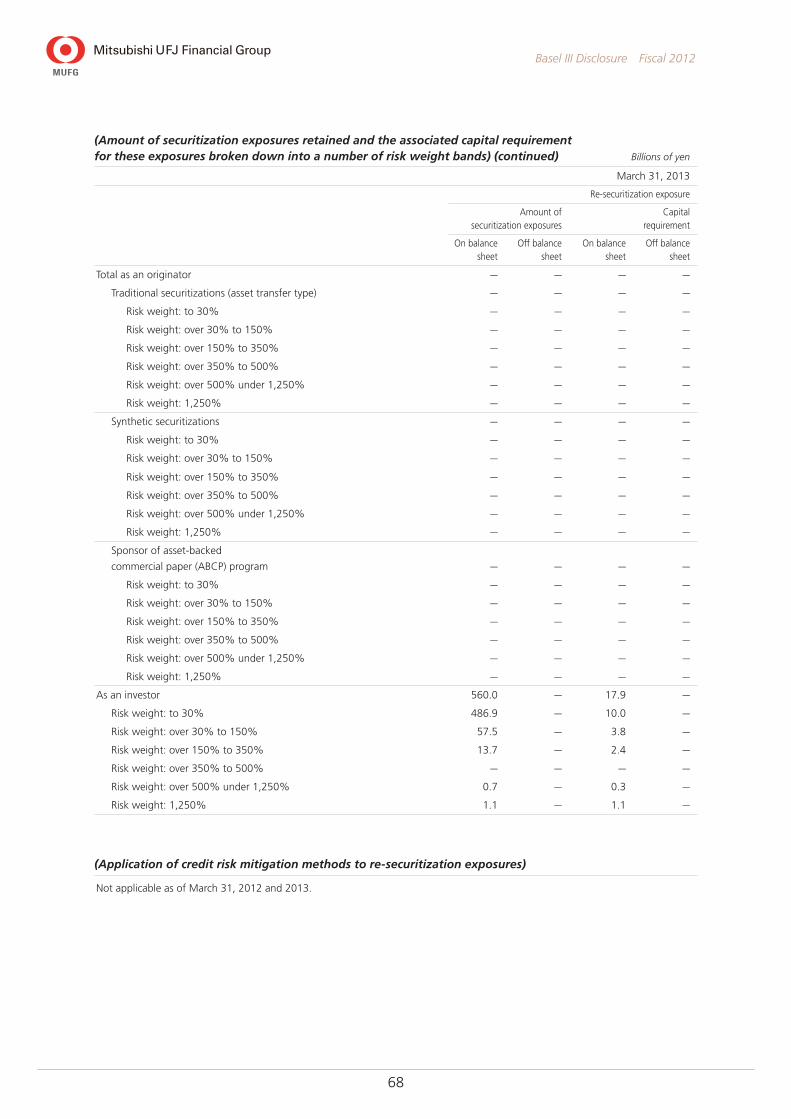
68
Basel III Disclosure Fiscal 2012
(Amount of securitization exposures retained and the associated capital requirement for these exposures broken down into a number of risk weight bands) (continued) Billions of yen
March 31, 2013
Re-securitization exposure
Amount of securitization exposures
Capital requirement
On balance sheet
Off balance sheet
On balance sheet
Off balance sheet
Total as an originator — — — —
Traditional securitizations (asset transfer type) — — — —
Risk weight: to 30% — — — —
Risk weight: over 30% to 150% — — — —
Risk weight: over 150% to 350% — — — —
Risk weight: over 350% to 500% — — — —
Risk weight: over 500% under 1,250% — — — —
Risk weight: 1,250% — — — —
Synthetic securitizations — — — —
Risk weight: to 30% — — — —
Risk weight: over 30% to 150% — — — —
Risk weight: over 150% to 350% — — — —
Risk weight: over 350% to 500% — — — —
Risk weight: over 500% under 1,250% — — — —
Risk weight: 1,250% — — — —
Sponsor of asset-backed
commercial paper (ABCP) program — — — —
Risk weight: to 30% — — — —
Risk weight: over 30% to 150% — — — —
Risk weight: over 150% to 350% — — — —
Risk weight: over 350% to 500% — — — —
Risk weight: over 500% under 1,250% — — — —
Risk weight: 1,250% — — — —
As an investor 560.0 — 17.9 —
Risk weight: to 30% 486.9 — 10.0 —
Risk weight: over 30% to 150% 57.5 — 3.8 —
Risk weight: over 150% to 350% 13.7 — 2.4 —
Risk weight: over 350% to 500% — — — —
Risk weight: over 500% under 1,250% 0.7 — 0.3 —
Risk weight: 1,250% 1.1 — 1.1 —
(Application of credit risk mitigation methods to re-securitization exposures)
Not applicable as of March 31, 2012 and 2013.
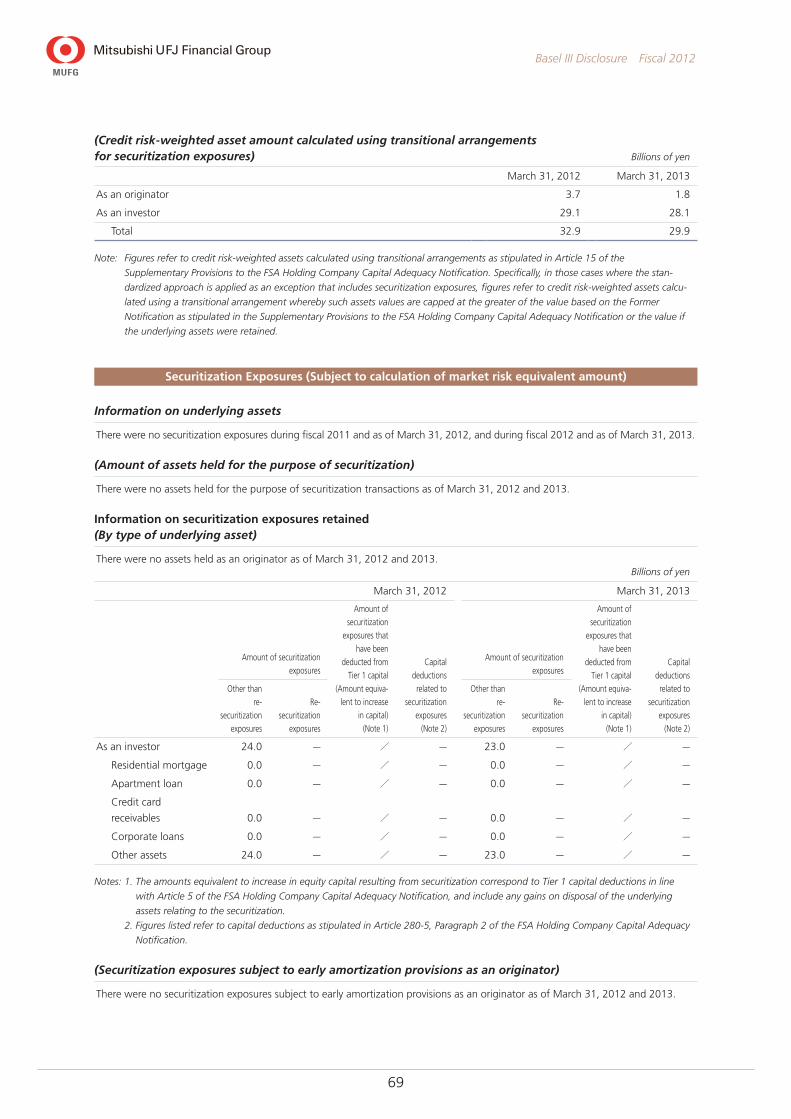
69
Basel III Disclosure Fiscal 2012
(Credit risk-weighted asset amount calculated using transitional arrangements for securitization exposures) Billions of yen
March 31, 2012 March 31, 2013
As an originator 3.7 1.8
As an investor 29.1 28.1
Total 32.9 29.9
Note: Figures refer to credit risk-weighted assets calculated using transitional arrangements as stipulated in Article 15 of the
Supplementary Provisions to the FSA Holding Company Capital Adequacy Notification. Specifically, in those cases where the stan-
dardized approach is applied as an exception that includes securitization exposures, figures refer to credit risk-weighted assets calcu-
lated using a transitional arrangement whereby such assets values are capped at the greater of the value based on the Former
Notification as stipulated in the Supplementary Provisions to the FSA Holding Company Capital Adequacy Notification or the value if
the underlying assets were retained.
Securitization Exposures (Subject to calculation of market risk equivalent amount)
Information on underlying assets
There were no securitization exposures during fiscal 2011 and as of March 31, 2012, and during fiscal 2012 and as of March 31, 2013.
(Amount of assets held for the purpose of securitization)
There were no assets held for the purpose of securitization transactions as of March 31, 2012 and 2013.
Information on securitization exposures retained(By type of underlying asset)
There were no assets held as an originator as of March 31, 2012 and 2013.Billions of yen
March 31, 2012 March 31, 2013
Amount of securitization
exposures
Amount of
securitization
exposures that
have been
deducted from
Tier 1 capital
(Amount equiva-
lent to increase
in capital)
(Note 1)
Capital
deductions
related to
securitization
exposures
(Note 2)
Amount of securitization
exposures
Amount of
securitization
exposures that
have been
deducted from
Tier 1 capital
(Amount equiva-
lent to increase
in capital)
(Note 1)
Capital
deductions
related to
securitization
exposures
(Note 2)
Other than
re-
securitization
exposures
Re-
securitization
exposures
Other than
re-
securitization
exposures
Re-
securitization
exposures
As an investor 24.0 — / — 23.0 — / —
Residential mortgage 0.0 — / — 0.0 — / —
Apartment loan 0.0 — / — 0.0 — / —
Credit card
receivables 0.0 — / — 0.0 — / —
Corporate loans 0.0 — / — 0.0 — / —
Other assets 24.0 — / — 23.0 — / —
Notes: 1. The amounts equivalent to increase in equity capital resulting from securitization correspond to Tier 1 capital deductions in line
with Article 5 of the FSA Holding Company Capital Adequacy Notification, and include any gains on disposal of the underlying
assets relating to the securitization.
2. Figures listed refer to capital deductions as stipulated in Article 280-5, Paragraph 2 of the FSA Holding Company Capital Adequacy
Notification.
(Securitization exposures subject to early amortization provisions as an originator)
There were no securitization exposures subject to early amortization provisions as an originator as of March 31, 2012 and 2013.
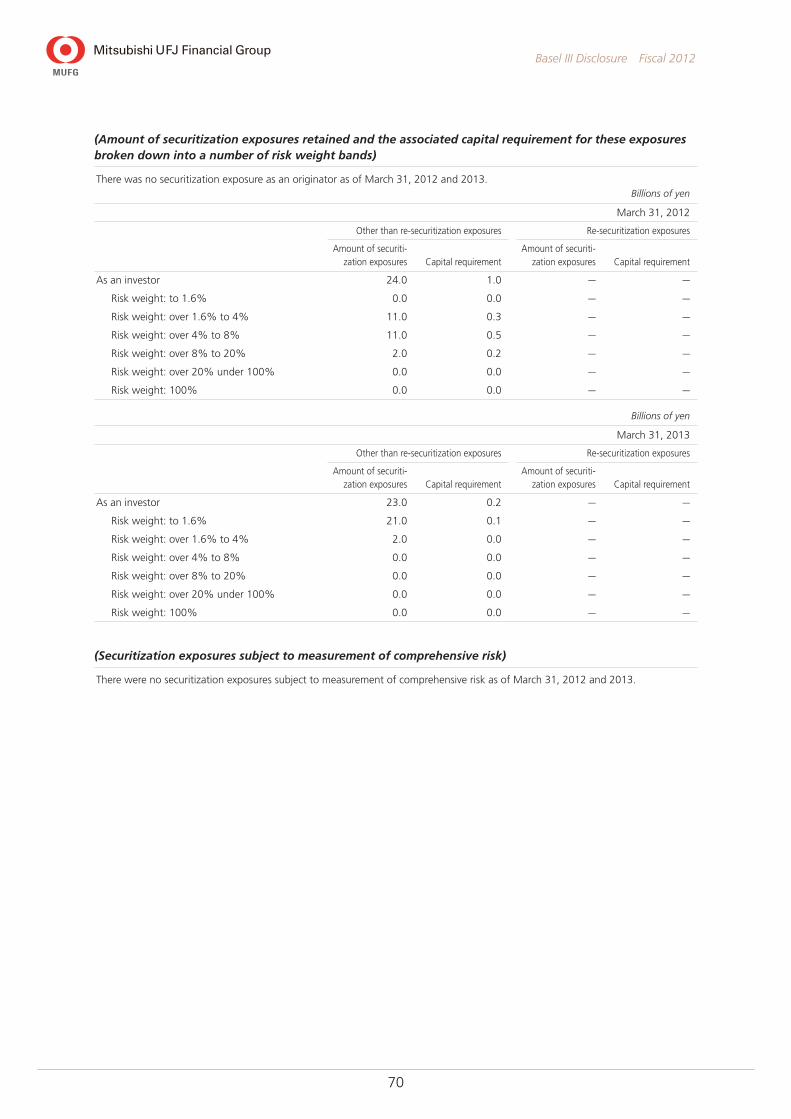
70
Basel III Disclosure Fiscal 2012
(Amount of securitization exposures retained and the associated capital requirement for these exposures broken down into a number of risk weight bands)
There was no securitization exposure as an originator as of March 31, 2012 and 2013.Billions of yen
March 31, 2012
Other than re-securitization exposures Re-securitization exposures
Amount of securiti-zation exposures Capital requirement
Amount of securiti-zation exposures Capital requirement
As an investor 24.0 1.0 — —
Risk weight: to 1.6% 0.0 0.0 — —
Risk weight: over 1.6% to 4% 11.0 0.3 — —
Risk weight: over 4% to 8% 11.0 0.5 — —
Risk weight: over 8% to 20% 2.0 0.2 — —
Risk weight: over 20% under 100% 0.0 0.0 — —
Risk weight: 100% 0.0 0.0 — —
Billions of yen
March 31, 2013
Other than re-securitization exposures Re-securitization exposures
Amount of securiti-zation exposures Capital requirement
Amount of securiti-zation exposures Capital requirement
As an investor 23.0 0.2 — —
Risk weight: to 1.6% 21.0 0.1 — —
Risk weight: over 1.6% to 4% 2.0 0.0 — —
Risk weight: over 4% to 8% 0.0 0.0 — —
Risk weight: over 8% to 20% 0.0 0.0 — —
Risk weight: over 20% under 100% 0.0 0.0 — —
Risk weight: 100% 0.0 0.0 — —
(Securitization exposures subject to measurement of comprehensive risk)
There were no securitization exposures subject to measurement of comprehensive risk as of March 31, 2012 and 2013.
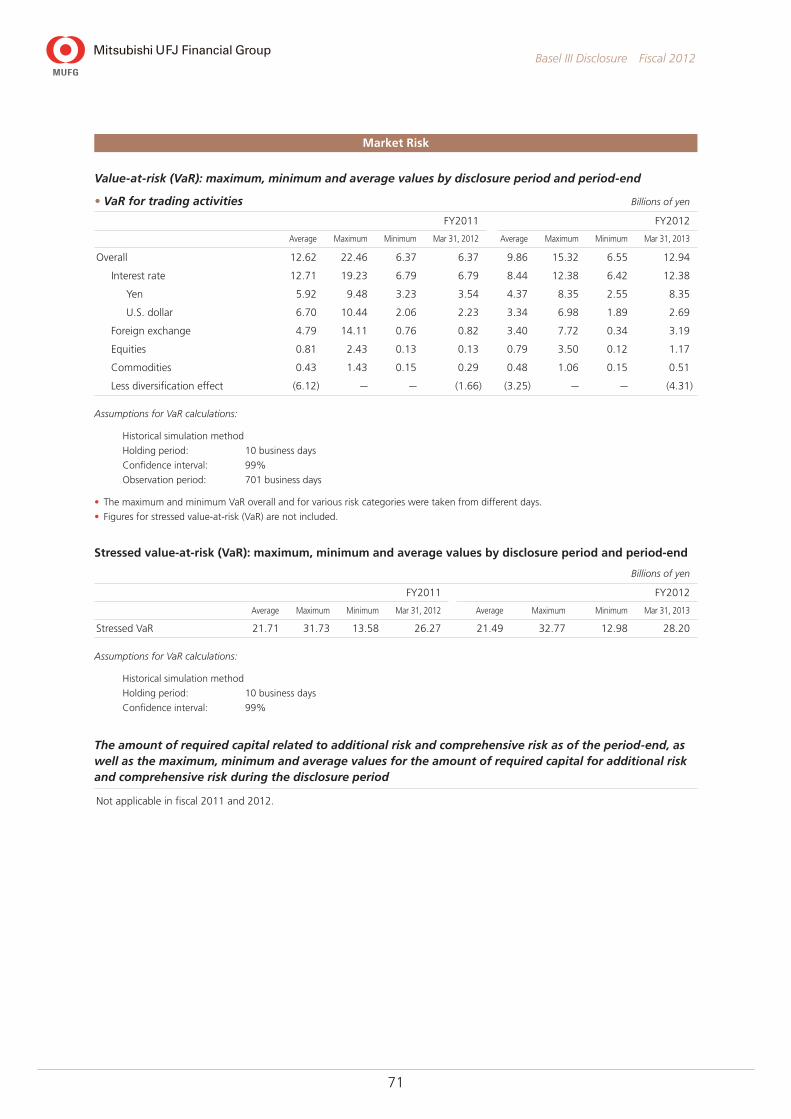
71
Basel III Disclosure Fiscal 2012
Market Risk
Value-at-risk (VaR): maximum, minimum and average values by disclosure period and period-end
• VaR for trading activities Billions of yen
FY2011 FY2012
Average Maximum Minimum Mar 31, 2012 Average Maximum Minimum Mar 31, 2013
Overall 12.62 22.46 6.37 6.37 9.86 15.32 6.55 12.94
Interest rate 12.71 19.23 6.79 6.79 8.44 12.38 6.42 12.38
Yen 5.92 9.48 3.23 3.54 4.37 8.35 2.55 8.35
U.S. dollar 6.70 10.44 2.06 2.23 3.34 6.98 1.89 2.69
Foreign exchange 4.79 14.11 0.76 0.82 3.40 7.72 0.34 3.19
Equities 0.81 2.43 0.13 0.13 0.79 3.50 0.12 1.17
Commodities 0.43 1.43 0.15 0.29 0.48 1.06 0.15 0.51
Less diversification effect (6.12) — — (1.66) (3.25) — — (4.31)
Assumptions for VaR calculations:
Historical simulation method
Holding period: 10 business days
Confidence interval: 99%
Observation period: 701 business days
• The maximum and minimum VaR overall and for various risk categories were taken from different days.
• Figures for stressed value-at-risk (VaR) are not included.
Stressed value-at-risk (VaR): maximum, minimum and average values by disclosure period and period-end
Billions of yen
FY2011 FY2012
Average Maximum Minimum Mar 31, 2012 Average Maximum Minimum Mar 31, 2013
Stressed VaR 21.71 31.73 13.58 26.27 21.49 32.77 12.98 28.20
Assumptions for VaR calculations:
Historical simulation method
Holding period: 10 business days
Confidence interval: 99%
The amount of required capital related to additional risk and comprehensive risk as of the period-end, as well as the maximum, minimum and average values for the amount of required capital for additional risk and comprehensive risk during the disclosure period
Not applicable in fiscal 2011 and 2012.
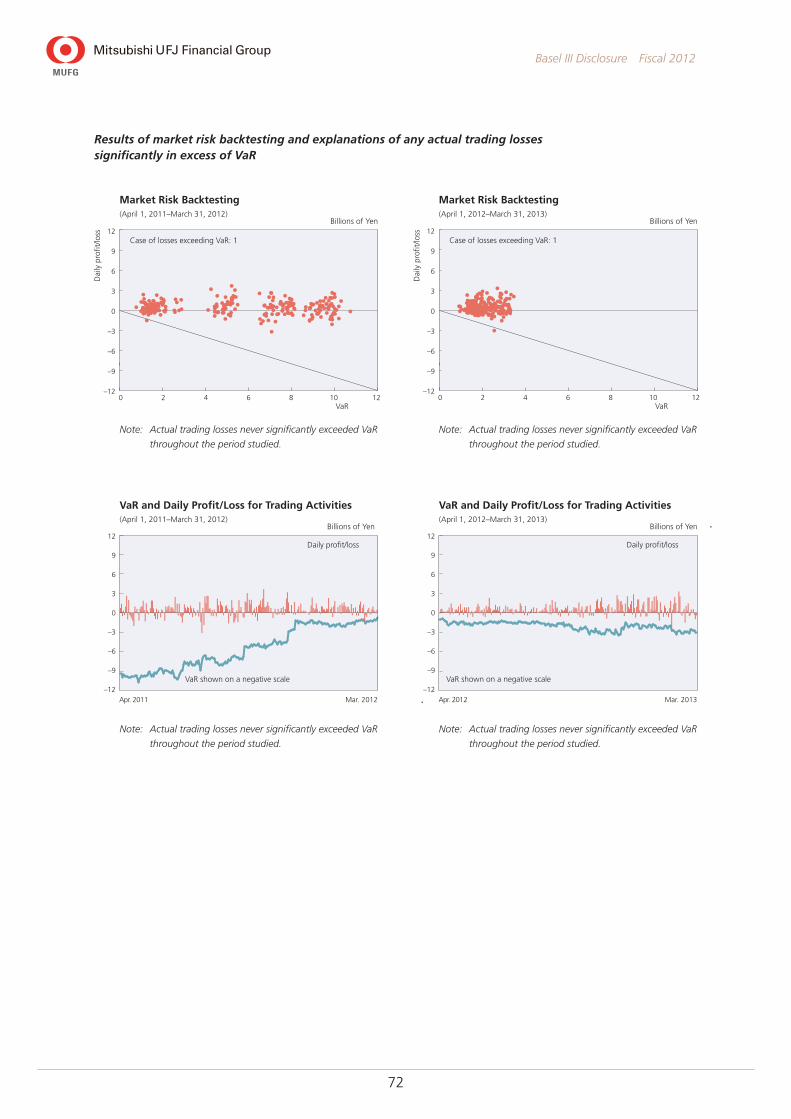
72
Basel III Disclosure Fiscal 2012
Results of market risk backtesting and explanations of any actual trading losses significantly in excess of VaR
Note: Actual trading losses never significantly exceeded VaR
throughout the period studied.
Note: Actual trading losses never significantly exceeded VaR
throughout the period studied.
VaR
Dai
ly p
rofit
/loss
0
–6
–1212106 842
0
6
–9
3
–3
12
9
Case of losses exceeding VaR: 1
Market Risk Backtesting(April 1, 2011–March 31, 2012)
Billions of Yen
0
–3
–6
–9
–12
6
3
12
9
Daily profit/loss
VaR shown on a negative scale
Mar. 2012Apr. 2011
VaR and Daily Profit/Loss for Trading Activities(April 1, 2011–March 31, 2012)
Billions of Yen
Note: Actual trading losses never significantly exceeded VaR
throughout the period studied.
Note: Actual trading losses never significantly exceeded VaR
throughout the period studied.
VaRD
aily
pro
fit/lo
ss
0
–6
–1212106 842
0
6
–9
3
–3
12
9
Case of losses exceeding VaR: 1
Market Risk Backtesting(April 1, 2012–March 31, 2013)
Billions of Yen
0
–3
–6
–9
–12
6
3
12
9
Daily profit/loss
VaR shown on a negative scale
Mar. 2013Apr. 2012
VaR and Daily Profit/Loss for Trading Activities(April 1, 2012–March 31, 2013)
Billions of Yen

73
Basel III Disclosure Fiscal 2012
Equity Exposures in Banking Book
Amount on consolidated balance sheet and market values
• Exposures to publicly traded equities Billions of yen
March 31, 2012 March 31, 2013
Amount on consolidated
balance sheetMarket
value
Amount on consolidated
balance sheetMarket
value
Exposures to publicly traded equities 3,504.2 3,504.2 4,105.7 4,105.7
Notes: 1. Figures only count Japanese and foreign equities held within securities available for sale with quoted market value.
2. There is no significant disparity between the share prices of publicly quoted share values and fair value.
• Equity exposures other than above Billions of yen
March 31, 2012 March 31, 2013
Amount on consolidated
balance sheet
Amount on consolidated
balance sheet
Equity exposures other than above 411.0 363.3
Note: Figures only count Japanese and foreign equities held within securities available for sale whose market values are not readily determinable.
Cumulative gains or losses arising from sales or write-offs of exposures to equities Millions of yen
FY2011 FY2012
Gains on sales Losses on sales Write-offs Gains on sales Losses on sales Write-offs
Exposures to equities 56,410 (65,844) (79,251) 53,169 (19,471) (87,357)
Note: Figures refer to net gains or losses on equity securities within net non-recurring gains or losses.
Unrealized gains or losses recognized on consolidated balance sheet but not on consolidated statement of income Billions of yen
March 31, 2012 March 31, 2013
Acquisition cost
Amount on consolidated
balance sheetUnrealized
gains or lossesAcquisition
cost
Amount on consolidated
balance sheetUnrealized
gains or losses
Exposures to equities 3,132.2 3,504.2 371.9 2,965.0 4,105.7 1,140.6
Note: Figures only count Japanese and foreign equities held within securities available for sale with quoted market value.
Unrealized gains or losses not recognized either on consolidated balance sheet or on consolidated statement of income
Not applicable as of March 31, 2012 and 2013.
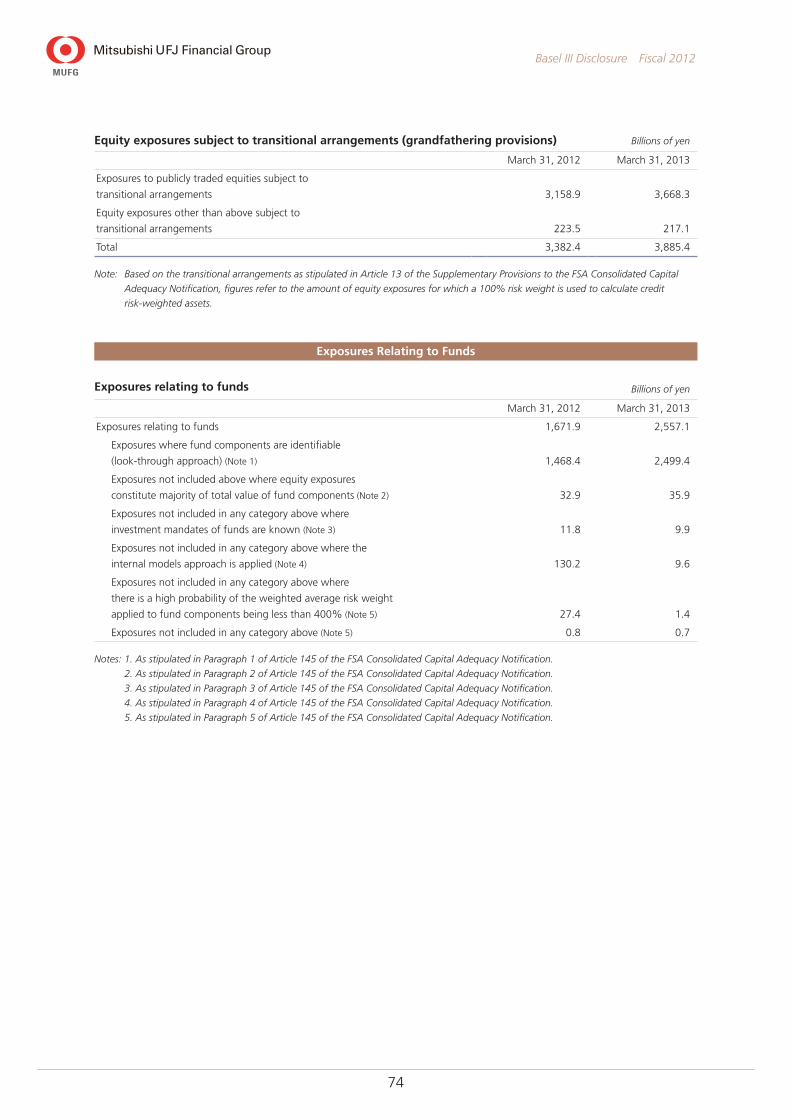
74
Basel III Disclosure Fiscal 2012
Equity exposures subject to transitional arrangements (grandfathering provisions) Billions of yen
March 31, 2012 March 31, 2013
Exposures to publicly traded equities subject to
transitional arrangements 3,158.9 3,668.3
Equity exposures other than above subject to
transitional arrangements 223.5 217.1
Total 3,382.4 3,885.4
Note: Based on the transitional arrangements as stipulated in Article 13 of the Supplementary Provisions to the FSA Consolidated Capital
Adequacy Notification, figures refer to the amount of equity exposures for which a 100% risk weight is used to calculate credit
risk-weighted assets.
Exposures Relating to Funds
Exposures relating to funds Billions of yen
March 31, 2012 March 31, 2013
Exposures relating to funds 1,671.9 2,557.1
Exposures where fund components are identifiable
(look-through approach) (Note 1) 1,468.4 2,499.4
Exposures not included above where equity exposures
constitute majority of total value of fund components (Note 2) 32.9 35.9
Exposures not included in any category above where
investment mandates of funds are known (Note 3) 11.8 9.9
Exposures not included in any category above where the
internal models approach is applied (Note 4) 130.2 9.6
Exposures not included in any category above where
there is a high probability of the weighted average risk weight
applied to fund components being less than 400% (Note 5) 27.4 1.4
Exposures not included in any category above (Note 5) 0.8 0.7
Notes: 1. As stipulated in Paragraph 1 of Article 145 of the FSA Consolidated Capital Adequacy Notification.
2. As stipulated in Paragraph 2 of Article 145 of the FSA Consolidated Capital Adequacy Notification.
3. As stipulated in Paragraph 3 of Article 145 of the FSA Consolidated Capital Adequacy Notification.
4. As stipulated in Paragraph 4 of Article 145 of the FSA Consolidated Capital Adequacy Notification.
5. As stipulated in Paragraph 5 of Article 145 of the FSA Consolidated Capital Adequacy Notification.
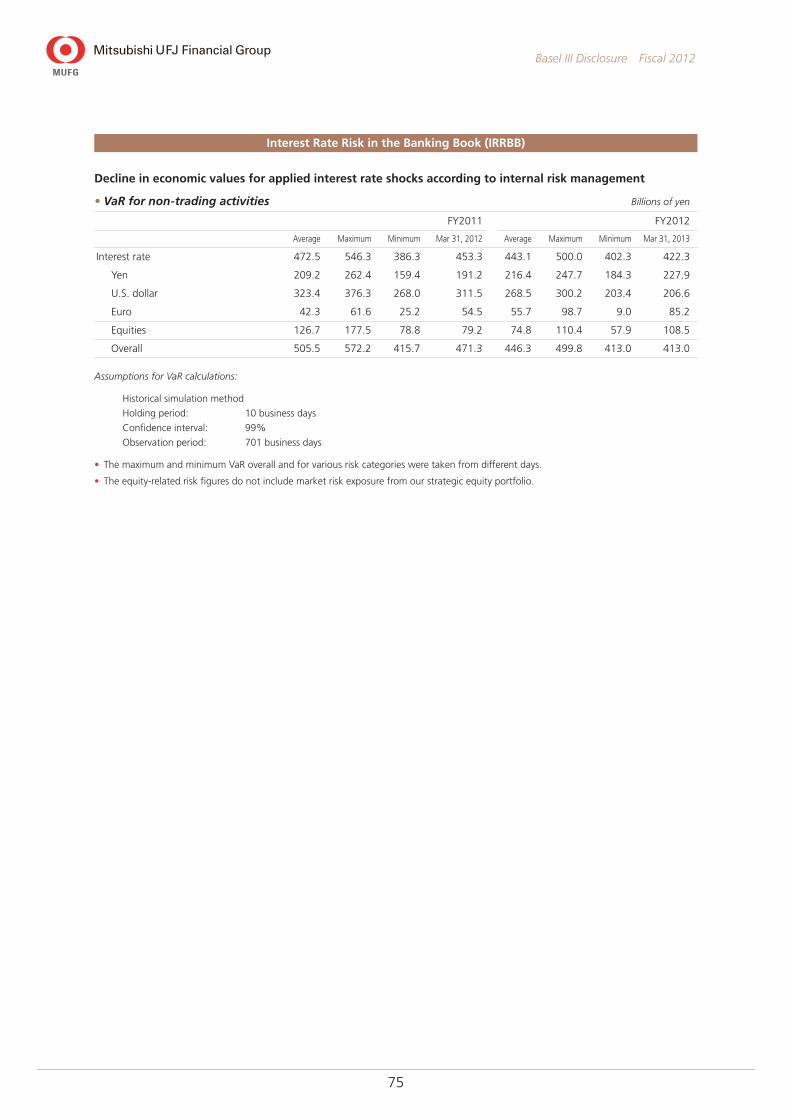
75
Basel III Disclosure Fiscal 2012
Interest Rate Risk in the Banking Book (IRRBB)
Decline in economic values for applied interest rate shocks according to internal risk management
• VaR for non-trading activities Billions of yen
FY2011 FY2012
Average Maximum Minimum Mar 31, 2012 Average Maximum Minimum Mar 31, 2013
Interest rate 472.5 546.3 386.3 453.3 443.1 500.0 402.3 422.3
Yen 209.2 262.4 159.4 191.2 216.4 247.7 184.3 227.9
U.S. dollar 323.4 376.3 268.0 311.5 268.5 300.2 203.4 206.6
Euro 42.3 61.6 25.2 54.5 55.7 98.7 9.0 85.2
Equities 126.7 177.5 78.8 79.2 74.8 110.4 57.9 108.5
Overall 505.5 572.2 415.7 471.3 446.3 499.8 413.0 413.0
Assumptions for VaR calculations:
Historical simulation method
Holding period: 10 business days
Confidence interval: 99%
Observation period: 701 business days
• The maximum and minimum VaR overall and for various risk categories were taken from different days.
• The equity-related risk figures do not include market risk exposure from our strategic equity portfolio.