baseline study module - dme for peace indicators.pdf · indicator module this module will ......
TRANSCRIPT

Indicator Module This module will help the user understand and use indicators in project planning and proposal writing, implementation, and evaluation.
Section
3.511

Page 2 of 27
THIS MODULE INCLUDES:
Contents (Direct links clickable below)
Interactive Pages
(i.e. Worksheets) will help you…
What is an Indicator?
Why use Indicators?
When Should Indicators be used?
Types of Indicators
Indicators on different levels?
What are the features of a good
indicator?
Who should be involved in Creating
and Developing Indicators?
Ways to Create and Develop
Indicators
Things to Note when Developing and
Using Indicators
Additional Resources
Practice Distinguishing between
Indicators
Practice Revising Quantitative and
Qualitative Indicators
Practice Revising Output and Outcome
Indicators
Practice Creating and Developing
SMART Indicators

Page 3 of 27
Pre-test- Check your knowledge!
Please answer the following questions. Read each statement below. If you agree with a statement, write A = YES. If you disagree with a statement, write B = NO. Also, explain why you believe that statement is wrong. __________ 1. Thoughtfully developing indicators is an optional step in the proposal development process. __________ 2. Indicators are only used during the proposal writing stage of a project. __________ 3. An indicator is vital for every project cycle and useful for problem-identification and measuring progress towards project goals and objectives. __________ 4. It is important for the project manager and staff, stakeholders, proposal writer, and the DME specialist to all be involved in developing indicators. __________ 5. An example of a SMART indicator is: “Participants reporting an improvement in their relationship”.
If you answered 3 or more incorrect, you must complete this module!

Page 4 of 27
What is an indicator?
An indicator is used to answer the question: ‘how do we know whether or how much we have achieved our objective?” It refers to a measure used to demonstrate change in a situation, or the progress in, or results of, an activity, project, or program. It is a sign showing where we are (current situation/actual results), the progress made so far (from baseline), and the remaining distance towards achieving our objective (expected results). For example:
# of trainings organized on collaboration between military personnel and civilians since program start
# of civilians who attended the training and can cite 2 behaviour changes of the military after the training
% over baseline of military who can identify 3 examples of military behaviour that is in violation of human rights by end of project
Top of the Document The difference between indicators, targets and benchmarks are:
An indicator is a factor or variable that provides a simple and reliable means to reflect changes. An indicator enables us to perceive the differences, improvements or developments relating to a desired change (output, objective, and goal). In DM&E, the term indicator is compatible with such terms as performance indicator, performance measure, indicator of success, and indicator of change.
Example
A smoke detector in a room is an indicator that detects the presence of smoke particles in the room, alerting when it reaches dangerous levels. It is an indicator of smoke and danger. It alerts us to a potential fire.
A thermometer is an indicator that measures temperature. When the temperature goes down, the scale on a thermometer goes down. It is an indicator of temperature. It alerts us to the change of weather.
“Indicator” is a general term that can be applied in many different fields and contexts. To name a few, in conflict settings, in development settings, in economy, education, health, governance, environmental protection, etc. No matter what kinds of fields they are used in, all indicators have one thing in common; they consist of specific information that signals change in the field they measure and they can be used by project managers and directors as a basis for relevant decision-making and/or policy change.

Page 5 of 27
An indicator is a measure of change or progress, e.g.:
# of new projects in which residents and repatriated refugees collaborate since
the beginning of the project
Increase over baseline in % of military personnel who can cite 5 appropriate attitudes of
a military person towards a civilian
A target is a clear and specific statement of desired results for a specific indicator over a specified period of time. It is usually specified in terms of quantity or quality, target area, target group, and time, e.g.:
65% of high-level officials practice decision-making for common good in Morocco by end of phase 1 of the program
16 skilled advocates of coaching as a tool of leadership and conflict resolution in the region at end of the third year of the project
Reduction of severe and moderate malnutrition in Africa by 20% by 2012 A benchmark is a standard of measurement used to compare and judge the performance of similar components, groups of people, programs, and systems. In DM&E, a benchmark presents a reference to a standard of what is achievable, e.g.:
The existence of ongoing dialogue groups where there were none before is a benchmark in post conflict settings.
In the first post-conflict election 70% more people voted than in the election during the conflict. Future benchmark would be 90% voting in the next election.
Top of the Document
Why use indicators?
Indicators are an integral part of a DM&E system. The main functions of indicators can be summarized as: 1. Monitoring program operations: monitoring if and how an activity, a project or a program is performing to an agreed standard. Indicators enable program managers and directors to assess progress towards the achievement of intended outputs, outcomes, objectives, and goals. 2. Improving program performance and management: providing information on how an activity, a project or a program works and how it might be improved. Indicators enable program staff to perceive differences, improvements or developments relating to the achievement of intended outputs, outcomes, objectives, and goals. Indicators are at the bedrock of a DM&E system, especially in the framework of management by objectives. In project management and implementation, most of the monitoring activities are

Page 6 of 27
conducted towards the development and measurement of the indicators. Meaningful indicators obtained from a system of data collection, analysis, findings and recommendations can lead to management information and thus play a key role in making management information systems operational. 3. Enhancing accountability: providing data that allows program staff, managers and directors to hold accountable to themselves, funders, beneficiaries and all other stakeholders.
When should Indicators be used? Indicators are used at several stages in the project or program cycle including establishing baselines, monitoring, and evaluation. Information is gathered in the baseline to set the target for the indicator. Indicators can then be used for determining progress toward results in monitoring as well as in monitoring the context of the conflict. E.g. peace activists often track changes in militarization in order to be able to anticipate changes in the conflict context. If we want to know about changes in militarization, military recruitment is one good indicator. Recruitment may signal a number of different things: the replacement of an aging force, an increase in soldier/officer ratios, or a more equitable regional representation within the military. Top of the Document
Types of Indicators Generally speaking, there are two types of indicators: quantitative indicators and qualitative indicators Quantitative indicators are measures of quantities or amounts, e.g.:
A 50% increase over the baseline in the number of people who enrol their children in ethnically mixed schools by the end of the project
500 disputes resolved by trained mediators over 18 months
100 new soap opera episodes produced and aired on local conflict issues Qualitative indicators are measures of changes in attitudes, knowledge and behaviour/skills, e.g.:
25% increase in the level of confidence people have in their ability to circulate safely in all areas in their community by end of project
10% decrease in fear of violence in village D in 6 months
Page 7 of 27
Quantitative indicators are usually measures of outputs and always include a number (#, %, $, etc.). Qualitative indicators can often include a target number, usually a %, to indicate the percentage of change from baseline to program end in knowledge, attitude or behaviour/skills. These are, in many cases, outcome indicators, though many projects may also use quantitative measurement for DM&E at outcomes or impact level. Wherever possible, indicators should be direct, meaning they describe the subject to be measured specifically, e.g., number of radio shows, number or percent of people listening, the percent of change from pre to post, etc. When this is not possible, an indirect or proxy indicator may be used. Normally this is used to demonstrate the change or results where direct measures are not feasible due to data collection constraints or time constraints. For example, SFCG often uses general listenership surveys to estimate the number of people who may hear an SFCG radio program, or, if ethnicity figures are unavailable, you might use data on how many speak the different languages spoken in a region. Direct indicators can provide the best evidence of the condition or result they are measuring. Interpretation of indirect indicators needs to be done in a cautious and careful manner. However, the use of an indirect indicator can be more cost-effective than the use of a direct one, and is better than having no evidence at all. Both quantitative and qualitative indicators provide valuable information. Often quantitative indicators are preferred over qualitative indicators as their numerical precision may make interpretation of results data easier and more concrete. They tell us what happened and how much. However, qualitative indicators can supplement quantitative indicators by revealing more meaningful, deeper information on how something is working or not working and why this happens. Therefore a combined usage of the two types of indicators is always recommended in program design, monitoring and evaluation.
Top of the Document
Indicators on Different Levels
There are different levels of indicators and their uses are different. These include indicators for inputs, outputs, outcomes, and impact. Input indicators reflect the resources (input) allocated to an activity, a project, program or intervention. This is a measure of all resources including human, financial, material, technological, and information resources, e.g.:
Amount of funds allotted
Number of local consultants available
Number of radios/TVs available for distribution
Number of days available

Page 8 of 27
Number of trainers eligible for the program Output indicator: Products and services produced (Immediate or short-term results) Output indicators measure the quantity of products and services needed to meet an objective and the efficiency of production, e.g.:
# of people in the municipality attending facilitated events that are geared toward strengthening understanding among conflict-affected groups that were supported with USG assistance in the past three months
# of coaching sessions conducted in the 10 communities by end of the project Outcome indicator: Immediate or Intermediate results Outcome indicators describe knowledge, behaviour, attitude and skill changes resulting from our work. The nature of our work often makes it difficult to track these types of changes accurately and realistically, e.g.:
Increased # of youth participating in a youth parliament and interacting with government parliament after participation in a SFCG program
Increased % of citizens voting in current election as compared to previous election after participation in an SFCG program
Impact indicator: Long-term results Impact indicator measures the impact or the achievement of the project or program goal. It indicates the quality and quantity of long-term results generated by programmed outputs, e.g.:
Building the capacity for collaboration and conflict mitigation at the Parliamentary level in Kenya
Reconciliation facilitated between divided ethnic/religious groups in Côte d’Ivoire
Reduction in community and regional tensions over territorial conflicts in Côte d’Ivoire
The two indicator levels usually applied at SFCG are output and outcome indicators. As with the balance between qualitative and quantitative indicators, there should also be a balance between output and outcome indicators. Output indicators tell us implementation is on track. Outcome indicators tell us the desired change is on track.
Top of the Document
What are the features of a good indicator?
Criteria for good indicators vary across organizations. They depend on the types of goals and objectives and the type of project focus. However, all criteria for good indicators share something in common. At the very least, an indicator should be relevant to what

Page 9 of 27
is to be measured, should be clear, practical, doable, and appropriate. Indicators need to contain certain basic information and also be able to pass tests of reliability, feasibility, and utility in decision making. One of the most commonly used standards to assess an indicator is SMART (Specific, Measurable, Achievable/Attainable, Result-oriented, and Time-bound). It is also the criteria we use at SFCG when creating indicators in proposal writing, and in monitoring and evaluation. Specific: measures as closely as possible the result it is intended to measure; disaggregated data (where appropriated) Measurable: quantitative (where possible); no ambiguity on what is being measured Achievable/Attainable: it is technically possible to obtain data at a reasonable cost Result-oriented: reliable; general agreement over interpretation of the results Time-bound: data can be collected frequently enough to inform the progress and influence the decisions
SMART Indicators Example #1
Example Indicator: Increase the percentage of participants from the southern districts reporting an improvement in their relationship with other groups to the point where they now enter each other’s homes from 20% in 2005 to 70% by 2008.
Specific:
Participants reporting improvement in their relationship with the other(s)
Measurable: Percentage of participants
Achievable/Attainable: From 20% of the participants in 2005 to 70% of the participants in 2008
Result-Oriented: Improved to the point where they enter each others’ homes
Time-bound: Between 1 January 2005 and 1 January 2008
SMART Indicators Example #2
Example Indicator: Increase the number of men and women participating in at least two inter-community activities from 75 men and women/year in 2005 to 450 men and women/year for all ten program communities before the end of 2007
Specific:
The number of men and women participating in at least two intercommunity activities
Measurable: Number of men and women
Achievable/Attainable: From 75 men and women/year in 2005 to 450 men and women/year before the end of

Page 10 of 27
Sometimes we will see some other criteria for good indicators which are very similar to SMART. See the SPICED and the CREAM criteria illustrated below.
Who
should be involved in Creating and Developing
Indicators?
Keep in mind that the following varies by project, context, and personnel:
CREAM (Schiavo-Campo, 1999)
Clear: precise and unambiguous
Relevant: appropriate to the subject at hand
Economic: available at reasonable cost
Adequate: able to provide sufficient basis to assess performance
Monitorable: amenable to independent validation
SPICED (Roche, 2002)
Subjective: using informants for their insights
Participatory: involving a project's ultimate beneficiaries, involving local staff and other stakeholders
Interpreted and communicable: explaining locally defined indicators to other stakeholders
Cross-checked and compared: comparing different indicators and progress, and using different informants, methods, and researchers
Empowering: allowing groups and individuals to reflect critically on their changing situation
Diverse and disaggregated: seeking out different indicators from a range of groups, especially men and women, to assess their differences over time

Page 11 of 27
The donors: Sometimes donors will provide us with a set of indicators before a project starts, e.g., USAID. In this case, we will need to use, add to or adapt the indicators from the donors in project design, monitoring and evaluation. If the donors do not provide us with indicators, it is a good idea to involve them in the process where possible. The project manager, DME coordinator and other staff, along with relevant stakeholders, will make decisions about the goals, objectives, and activities of the project. Consultation of mission plans and interviews with project staff may be necessary to select indicators. Often, this process can help reveal differences in assumptions of varying members of staff. Everyone should be on the same page regarding how the program will contribute to peace and development. The proposal writer will need to clearly describe and discuss the selected indicators in the proposal and should therefore be familiar with the underlying premises of the project. The DME Specialist in the DC office can be used as a resource to help the team develop and decide on indicators.
Top of the Document
Ways to Create and Develop Indicators There are different ways to develop indicators. Below is one suggested way using four steps for indicator development. 1. Preparation
Clarify goals, objectives and intended results for your project of interest;
Articulate your theory(ies) of change as well as the types of change specified in the objectives;
Check what indicators have already been developed, tested, and refined in your program and other programs with which you are in contact. You can ask other practitioners in peacebuilding for their indicators.
2. Generation
Brainstorm all related things or dimensions that can be counted, measured, or sized and look for creative ways to combine some of those;
Consult the parties or stakeholders in the conflict what they consider to be significant signals of change;
Break issues into smaller components. Rather than measure reconciliation, consider its components: mercy, justice, truth, and peace. Try not to use vague “buzz” words. Be able to describe in operational terms what, reconciliation, mercy, etc. will look like; have a descriptive criteria. To

Page 12 of 27
measure capacity, focus on skills, technical knowledge, process, motivation, and opportunity. This practice also goes by the name of factor analysis where all factors that influence the change are identified and, where possible, weighed according to the degree of influence each factor has;
Develop a list of possible indicators. 3. Refinement and Selection
Modify your draft indicators to make them as specific and simple as possible.
Come up with at least one or two indicators for each key activity or objective.
“Select no more than 10-15 indicators per area of significant program focus” (MENTOR).
Select indicators that can realistically be collected with the resources available.
Use a mix of data sources so that indicators could be collected from different data sources.
4. Testing Indicators
Test your new and newly modified indicators for their utility in decision making as early as possible, preferably during the design phase while there is still time to make changes. This test is different from a test of the data collection method. The idea is to determine the utility of the indicators in the analysis and subsequent decisions. Pick hypothetical extremes using fictitious data and consider how the different extremes will influence decisions. If vastly different information has no influence over the decisions, the indicator is probably not useful and should be changed. Select the best indicators for your use.
You should also test both the most promising indicators and those which are also viable but not as ideal to ensure there is an alternative in the event that the ideal indicators don’t survive the test;
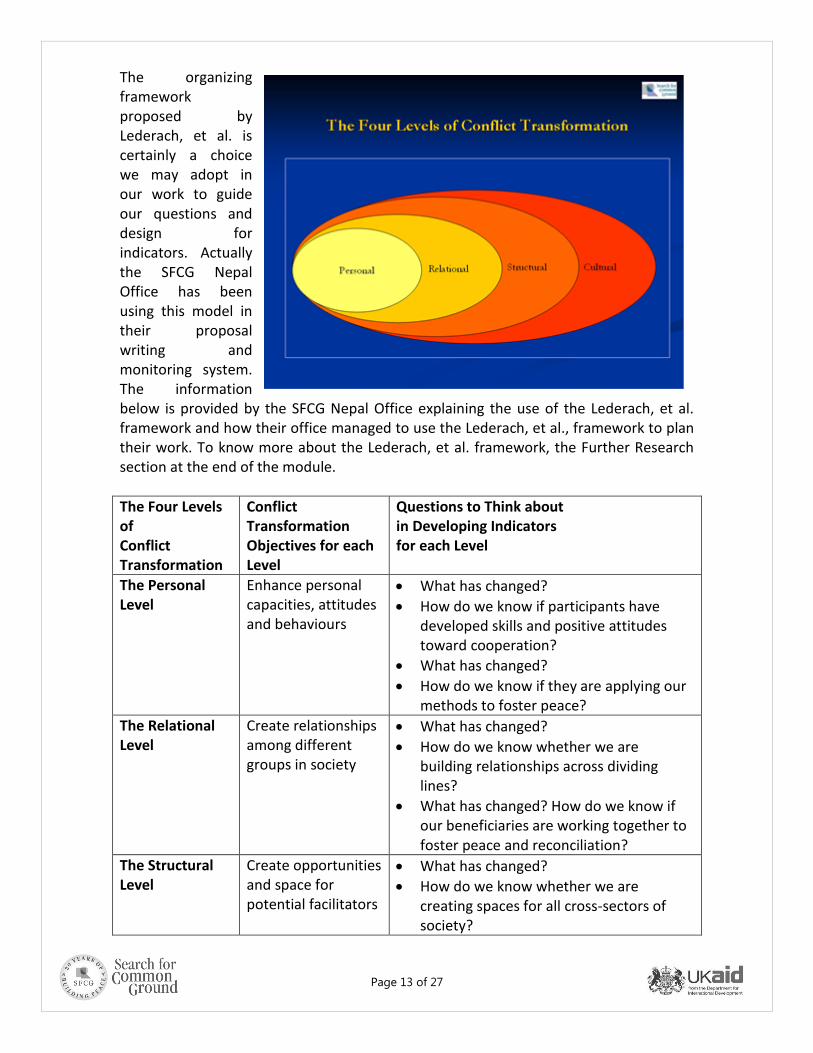
You can also use the Levels of Conflict Transformation Framework. In peacebuilding and conflict resolution settings, sometimes people follow an organizing framework proposed by Lederach, et al. (2007) when creating and developing indicators. Lederach, et al. comments that as social conflict can cause changes in four dimensions: the personal, the relational, the structural and the cultural, peacebuilding and conflict resolution work should also try to act at each of these levels and achieve results at all four levels (as illustrated by the diagram below).
Page 13 of 27
The organizing framework proposed by Lederach, et al. is certainly a choice we may adopt in our work to guide our questions and design for indicators. Actually the SFCG Nepal Office has been using this model in their proposal writing and monitoring system. The information below is provided by the SFCG Nepal Office explaining the use of the Lederach, et al. framework and how their office managed to use the Lederach, et al., framework to plan their work. To know more about the Lederach, et al. framework, the Further Research section at the end of the module.
The Four Levels of Conflict Transformation
Conflict Transformation Objectives for each Level
Questions to Think about in Developing Indicators for each Level
The Personal Level
Enhance personal capacities, attitudes and behaviours
What has changed?
How do we know if participants have developed skills and positive attitudes toward cooperation?
What has changed?
How do we know if they are applying our methods to foster peace?
The Relational Level
Create relationships among different groups in society
What has changed?
How do we know whether we are building relationships across dividing lines?
What has changed? How do we know if our beneficiaries are working together to foster peace and reconciliation?
The Structural Level
Create opportunities and space for potential facilitators
What has changed?
How do we know whether we are creating spaces for all cross-sectors of society?

Page 14 of 27
What has changed?
How do we know whether we are working with key sectors of society?
The Cultural Level
Overcome stereotypes and cultural constraints that led to conflict
What has changed?
How do we know whether we are working to overcome stereotypes which led to conflict?
What has changed?
How do we know whether we are dealing with cultural issues in a sustainable manner?
Below are some examples of indicators the SFCG Nepal Office have created and developed in their work using the Lederach, et al. framework.
Top of the Document
Nepal Indicators Example
Personal Objective: To increase ownership and local participation in the transition to peace
and democracy Indicators:
Increase the % of people trained who demonstrate knowledge in peacebuilding Increase the % of people trained who incorporate our methods in their activities The # of peacebuilding initiatives that result from our programs
Relational Objective: To strengthen inter-communal relations across ethnic, caste, and
geographical lines. (Continued on next page)
Nepal Indicators Example (continued)
Relational Indicators:
Increase the % of citizens in target VDCs who report cooperation from across dividing lines
The # of initiatives resulting from our programs led by people from across dividing lines
The # of projects initiated by participants which aim to break down dividing lines Relational Objective: To involve multiple stakeholders, particularly those who have
been traditionally marginalized, in democratic processes at local and national levels

Page 15 of 27
There are different ways to create and develop indicators, and the Lederach, et al.
framework is one of the examples that we can follow to guide our thoughts in indicator
development. One thing is certain. That is, no matter what kind of framework we choose
to follow or what steps we choose to adopt, we must try our best to develop SMART
indicators. Indicators that are not SMART will be of little use for problem-identification
and measuring progress towards our project goals and objectives.
Top of the Document
Things to Note When Developing and using
Indicators
Developing good indicators requires in-depth conflict analysis and a good understanding of the context. Good indicators need to be applicable to the local context. There are no universally good choices of indicators. Indicators suitable for one project might not suit the same or a similar project in a different setting. When we use existing indicators for a new project or a different setting, careful

Page 16 of 27
consideration should be given as to whether and how the indicators could be adapted to suit the objectives of the new project or population in the new context.
For each outcome indicator, a baseline is necessary. This is crucial in measuring progress toward an intermediate result or objective. Depending on the type of indicator being measured, the baseline data can be a point-in-time observation, a cumulative or an average value over a period of time. For output indicators we do not compare with a baseline, but with our benchmarks or targets.
Indicators must be chosen and used in a way that relates very specifically to the objectives of the project or program.
When selecting indicators, be sure to select at least one or two for each objective.
Do not rely on a single indicator to measure the significant effects of a project because, if the data for that one indicator became unavailable, it would be difficult to document the effects. Thus it is important to try to select a diversity of indicators in DM&E. However, you probably need no more than two or three indicators for each outcome.
It can be cost-effective and time-effective to build on existing indicators when developing new indicators. However, they must be adapted to fit, or supplemented with others that are more locally relevant.
Sometimes an indicator applied to an entire population will hide the fact that there are variances and discrepancies among different groups in that population. Thus it may be important to collect information on an indicator separately for each group. This is called “data disaggregation.” Typically, information is collected in ways that reflect the components most relevant to the project such as gender, identity, ethnicity, age, or area of origin. e.g., if we are considering youth involvement in politics, an increase in the number of youth joining political parties may conceal the fact that young women are not becoming more involved.
Indicators can tell us that a change we are interested in is occurring, but they cannot explain why or how that change occurs. Determining why change happens requires additional research and analysis. This is because the activities a project implemented may be the sole contribution to the change happening, or to some degree, or not at all. There could be other factors at work. Therefore, a more credible approach is to identify and acknowledge all the major contributing factors and illustrate how the program contributed along with the other factors. This implies some analysis and understanding of the many forces bearing on the issues under consideration.
Top of the Document

Page 17 of 27
Practice Exercises Answers are provided below, but try getting as far as you can in the examples before looking at the answers!
Summary
Indicators are a means to measure change. They are the raw materials for much of monitoring and evaluation. Yet indicators are approximations, based largely on assumptions: the smaller or more accurate the assumption, the more reliable the indicator.
Indicators need to be clear, practical, doable, appropriate, relevant, and reliable.
It is important to involve and engage all stakeholders in the design and implementation of indicators for their insights and inputs.
A mix of qualitative and quantitative indicators usually reveals nuances and greater insight into what is happening.
Test or pilot indicators before staring to use them in monitoring and evaluation. If some indicators are found not working well in piloting, they must be dropped or modified.
Good indicators are context specific. Indicators that are useful

Page 18 of 27
Exercise 1: Distinguishing between Indicators
The table below lists in its left column some indicators used in SFCG proposals. Go through these indicators. Think what types or levels of indicators they are in the four choices given below (Quantitative Indicators, Qualitative Indicators, Output Indicators, and Outcome Indicators). Then put a “√” in the corresponding column you choose in the table. Note that you may need to put more than one “√”in the corresponding columns for each indicator. When you are finished, click here or scroll down to the next page to see the answer sheet. Table 1
Indicators Quantitative
Indicators
Qualitative
Indicators
Output
Indicators
Outcome
Indicators
# of leadership coaching training sessions
provided for decision makers in Kenya in
2008
Increase over baseline in 15% of survey
respondents in targeted areas who can
name candidates from special populations
(e.g. a woman, person with disabilities, or
from other special population) within one
month of elections
Media outlets surveyed that have
increased their elections-related
programming by two or more
programs/articles each week between
beginning of project and end of election
period
# of public fora/educational events to
teach public about peace process
supported by USG assistance from June
2006 to December 2007
Reduced % of reported acts of violence
over baseline per month as reported to
community police stations
Increase in 12% of trained youth leaders
who can name three conflict resolution
strategies, basic rights according to the
UN Declaration on Human Rights, and
citizen roles in civil society by EOP over
baseline

Page 19 of 27
Practice Exercise 1 – Answer 1
Here is the answer sheet for Table 1. Compare it with your own answer sheet to see how many correct choices you made. For the wrong choices you made, can you understand now why the indicator(s) is/are not the type or level you chose? Answer Sheet for Table 1
Indicators Quantitative Indicators
Qualitative Indicators
Output Indicators
Outcome Indicators
# of leadership coaching training sessions provided for decision makers in Kenya in 2008
√ √
Increase over baseline in 15% of survey respondents in targeted areas who can name candidates from special populations (e.g. a woman, person with disabilities, or from other special population) within one month of elections
√
√
Media outlets surveyed that have increased their elections-related programming by two or more programs/articles each week between beginning of project and end of election period
√
√
# of public fora/educational events to teach public about peace process supported by USG assistance from June 2006 to December 2007
√
√
Reduced % of reported acts of violence over baseline per month as reported to community police stations
√
√
Increase % of trained youth leaders who can name three conflict resolution strategies, basic rights according to the UN Declaration on Human Rights, and citizen roles in civil society by EOP over baseline
√
√

Page 20 of 27
Practice Exercises
Exercise 2: Revising Quantitative and Qualitative Indicators
Below you will see two tables (Table 2 and Table 3). Each table uses the same three project objectives. You will see three draft quantitative indicators in Table 2 and four qualitative indicators in Table 3 corresponding to the objectives. None of these indicators are SMART. Considering the objectives, can you revise these indicators to make them SMART? Write your answers in the blank column in each table below. When you are finished, click here or scroll down to the next page to see suggested revision for Table 2 and Table 3 by SFCG. Table 2
Table 3
Objectives
Draft
Quantitative
Indicators
Your Revised
Quantitative
Indicators
Increase in solidarity
between 450 former
enemies in five
municipalities in
Chalatenango over three
years
More former enemies to
join mixed-community
organizations
Enhance capacity of
regional and local
government institutions and
communities to monitor,
report, and manage conflict
in two years in three
southern provinces
Number of disputes
Increase the political
empowerment of women in
the province over two years
More women to be elected
parliamentarians

Page 21 of 27
Objectives
Draft
Qualitative
Indicators
Your Revised
Qualitative
Indicators
Increase in solidarity
between 450 former
enemies in five
municipalities in
Chalatenango over three
years
More former enemies
identifying themselves as
members of the larger
community rather than
belonging to one group or
faction
Enhance capacity of
regional and local
government institutions and
communities to monitor,
report, and manage conflict
in two years in three
southern provinces
Authorities to believe more
often that monitoring
reports lead to a timely
intervention and the
prevention of escalation
Increase the political
empowerment of women in
the province over two years
More women
parliamentarians believing
that their voices are making
a difference in decision
-making
Elected women feel less
that they are marginalized
in decision-making

Page 22 of 27
Practice Exercises - Answer 2
Below is a suggested revision for the draft quantitative and qualitative indicators. Compare it with your own revision and think how you may be able to write SMART quantitative and qualitative indicators of your own next time. Note that there is not one answer to each revision. Different people might come up with different ways for revision. It depends on goals and objectives of the project and the context where the project is implemented. All indicators need to be SMART and they need to suit the objective, population, condition and context of the project they are developed for. Suggested Revision for Table 2
Objectives Draft
Quantitative
Indicators
SMART
Quantitative
Indicators
Increase solidarity between
450 former enemies in five
municipalities in
Chalatenango over three
years
More former enemies to
join mixed-community
organizations
% of the former
enemies in five
municipalities
in Chalatenango who have
joined mixed-community
organizations at the end of
year one
Enhance capacity of
regional and local
government institutions and
communities to monitor,
report, and manage conflict
in two years in three
Southern provinces.
Number of disputes
# of disputes reported at
each level during the course
of the project
Increase the political
empowerment of women in
the province over two years
More women to be elected
parliamentarians
50 women elected
parliamentarians in the next
election
Suggested Revision for Table 3

Page 23 of 27
Objectives Draft
Qualitative
Indicators
SMART
Qualitative
Indicators
Increase solidarity between
450 former enemies in five
municipalities in
Chalatenango over three
years
More former enemies
identifying themselves as
members of the larger
community rather than
belonging to one group or
faction
% of former enemies who,
at the end of year one,
routinely identify
themselves as members of
the larger community
rather than belonging to one
group or faction
Enhance capacity of
regional and local
government institutions and
communities to monitor,
report, and manage conflict
in two years in three
Southern provinces.
Authorities to believe more
often that monitoring
reports lead to a timely
intervention and the
prevention of escalation
# of instances at each
level where authorities
believe that monitoring
reports lead to a timely
intervention and the
prevention of escalation
over the course of the
project
Increase the political
empowerment of women in
the province over two years
More women
parliamentarians believing
that their voices are making
a difference in decision
-making
Elected women feel less
that they are marginalized
in decision-making
10% increase in women
parliamentarians’ belief that
their voices are making a
difference in decision
-making
15% decrease in elected
women’s perception that
they are marginalized in
decision-making
Top of the Document
Practice Exercises

Page 24 of 27
Exercise 2: Revising Output and Outcome Indicators
Below you will see two tables (Table 4 and Table 5). Each table uses the same two project objectives. You will see two draft output indicators in Table 4 and two outcome indicators in Table 5 corresponding to the objectives. None of these indicators are SMART. Considering their objectives, can you revise these indicators to make them SMART? Write your answers in the blank column in each table below. When you are finished, click here or scroll down to the next page to see suggested revision for Table 4 and Table 5 by SFCG. Table 4
Objectives Draft
Output Indicators
Your Revised
Output Indicators
Increase trust between the
two communities.
Training events
Increase inter-community
collaboration on public
policy issues that address
common interests.
Public policy debates
or forums
Table 5
Objectives Draft
Outcome Indicators
Your Revised
Outcome Indicators
Increase trust between the
two communities.
More mobility among
residents living on both sides
within the areas
Increase inter-community
collaboration on public
policy issues that address
common interests.
More public policy debates
or forums among the three
communities
Practice Exercise 3– Answer 1

Page 25 of 27
Below are suggested revisions for the draft output and outcome indicators. Compare it with your own revision and think how you may be able to write SMART output and outcome indicators of your own next time. Note that there is not one answer to each revision. Different people might come up with different ways for revision. It depends on goals and objectives of the project and the context where the project is implemented. All indicators need to be SMART and they need to suit the objective, population, condition and context of the project they are developed for.
Suggested Revision for Table 4
Objectives Draft
Output Indicators
SMART
Output Indicators
Increase trust between the
two communities.
Training events # of men, women, and
children in the two
communities participating
in the SFCG trust building
training events in the year
Increase inter-community
collaboration on public
policy issues that address
common interests.
Public policy debates
or forums
# of public policy debates
or forums where all three
communities contribute
interest-based solutions on
natural resource
management disputes by the
end of 2009
Suggested Revision for Table 5
Objectives Draft
Outcome Indicators
SMART
Outcome Indicators
Increase trust between the
two communities.
More mobility among
residents living on both sides
within the areas
50% of men, women, and
children from each side
increase their mobility
within the areas controlled
by the other side by at least
one square kilometre per
year
Increase inter-community
collaboration on public
policy issues that address
common interests.
More public policy debates
or forums among the three
communities
All three communities
contribute interest-based
solutions on natural
resource management
disputes by the end of 2009
through expansion from
twice/year to six times/year
public policy debate
forums.
Page 26 of 27
Top of the Document
Additional Resources The following resources are particularly good for the development of goals and objectives. Anne J. Atkinson and Carolyne Ashton, Planning for Results: The Safe and Drug-Free
Schools and Community Program Planning and Evaluation Handbook (Richmond:

Page 27 of 27
Virginia Department of Education, 2002), accessed 24 September 2010, http://www.safeanddrugfreeva.org/planningforresults.pdf
Cheyanne Church and Mark M. Rogers, Designing for Results: Integrating Monitoring
and Evaluation in Conflict Transformation Programs Part 1 (Washington DC: Search for Common Ground, 2006), accessed 24 September 2010, http://www.sfcg.org/programmes/ilr/ilt_manualpage.html
Department for International Development, Log Frame Guidelines (London: DFID, 2005) European Commission, Aid Delivery Methods Vol. 1: Project Cycle Management
Guidelines, Part 2 Chapter 5 (Brussells: EuropeAid Cooperation Office, 2004). J.P. Lederach, Neufeldt, R., Culbertson, H. Reflective Peacebuilding: A Planning,
Monitoring, and Learning Tool Kit. (Baltimore: Catholic Relief Services, 2007), accessed August 25, 2011, http://kroc.nd.edu/sites/default/files/reflective_peacebuilding.pdf
MENTOR (Monitoring and Evaluation Network of Training Online Resources), accessed
August 25, 2011, https://www.cpc.unc.edu/measure/training/mentor/me_fundamentals/basic_m_and_e_concepts/what_is_monitoring_and_evaluation
Salvatore Schiavo-Campo. “’Performance’ in the Public Sector,” p. 85. (World Bank Manual - Building a Results-Based Monitoring and Evaluation System, 1999) , accessed August 25, 2011, http://www.usaid.gov/our_work/humanitarian_assistance/ffp/crg/annex-2.htm http://www.toolkitsportdevelopment.org/html/topic_03DF8A69-0DAC-47D5-8A14-1E1833901BFE_BBA5D8DC-5C40-4F9C-A6A4-0268098134D7_1.htm
UNICEF Monitoring & Evaluation Training Package. Indicators: definitions and
distinctions. UNICEF, accessed August 25, 2011, http://www.ceecis.org/remf/Service3/unicef_eng/module2/docs/2-3-1_indicators.doc
Following are various models that complement the ABCDE and SMART models in developing indicators:
SPICED (Roche, 2002, http://www.toolkitsportdevelopment.org/html/topic_03DF8A69-0DAC-47D5-8A14-1E1833901BFE_BBA5D8DC-5C40-4F9C-A6A4-0268098134D7_1.htm [accessed 15 September 2010])