basic data analysis. levels of scale measurement & suggested descriptive statistics
TRANSCRIPT

Basic Data Analysis

Levels of Scale Measurement & Suggested Descriptive Statistics
Creating & Interpreting Tabulation
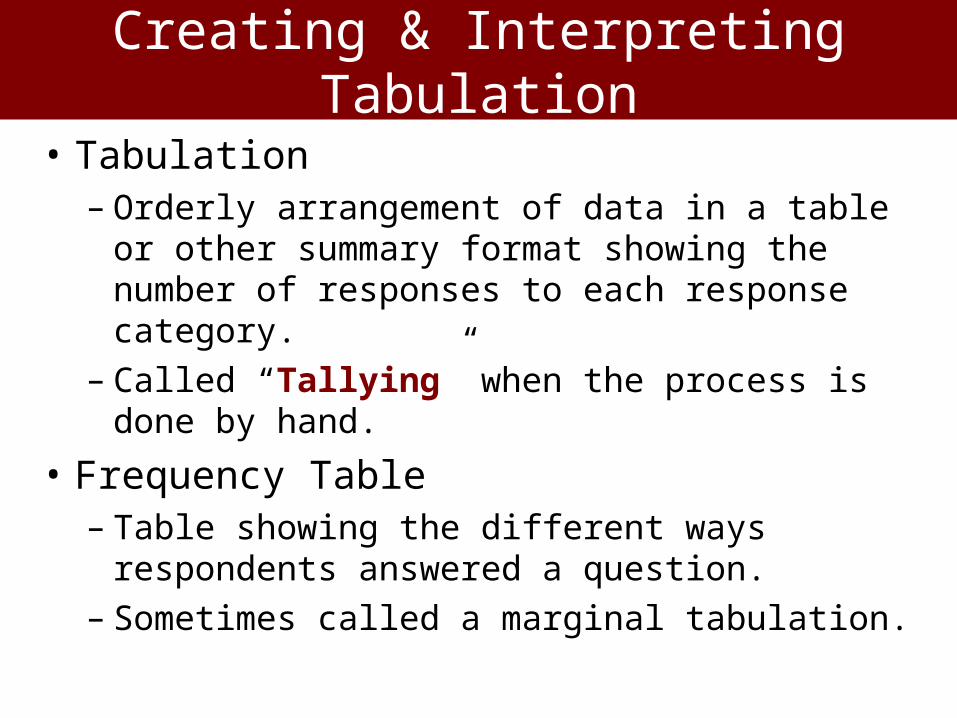
• Tabulation– Orderly arrangement of data in a table or other
summary format showing the number of responses to each response category.
– Called “Tallying” when the process is done by hand.
• Frequency Table– Table showing the different ways respondents
answered a question.– Sometimes called a marginal tabulation.

A Typical Table
Gender Frequency Percentage Valid %
Female 100 = 100/150 = 100/145
Male 45 = 45/150 = 45/145
Missing 5 = 5/150
Total 150 = (100+45+5)
/150
= (100+45) /
145

CROSS-TABULATION
• Analyze data by groups or categories
• Compare differences
• Percentage cross-tabulations

Different Ways of Depicting the Cross-Tabulation of Biological Sex and Target Patronage
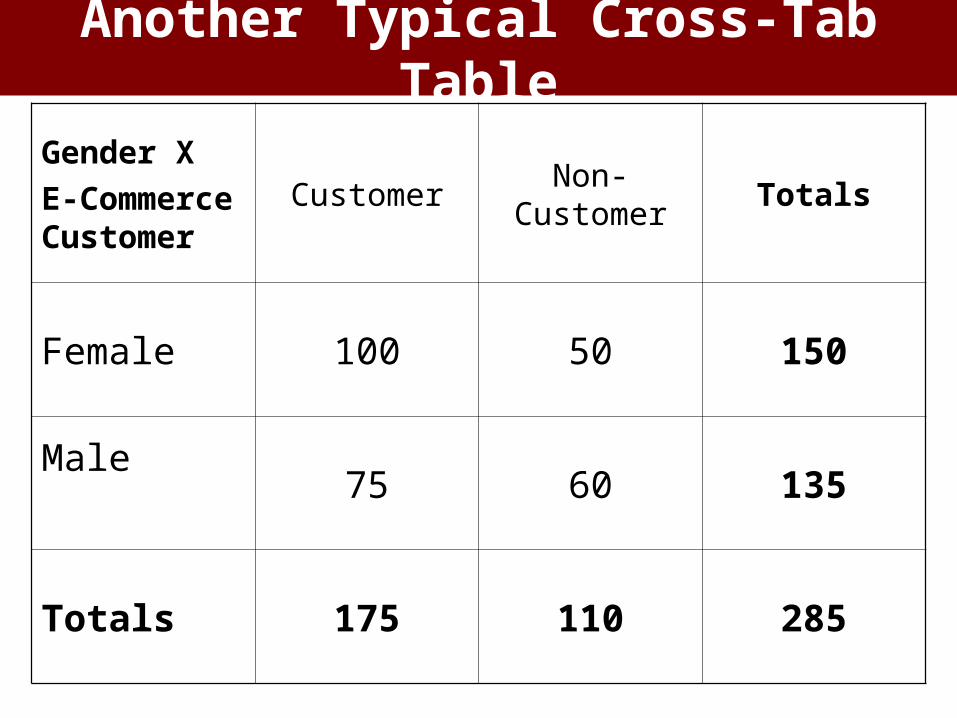
Another Typical Cross-Tab Table
Gender X
E-Commerce Customer
Customer Non-Customer Totals
Female 100 50 150
Male75 60 135
Totals 175 110 285
Data Transformation
• A.K.A data conversion
• Changing the original form of the data to a new format
• More appropriate data analysis
• New variables– Summated
– Standardized
Degrees of Significance
• Mathematical differences
• Statistically significant differences
• Managerially significant differences

Hypothesis Testing Procedure
• The specifically stated hypothesis is derived from the research objectives.
• Sample is obtained & relevant variable measured.
• Measured sample value is compared to value either stated explicitly or implied in the hypothesis.– If the value is consistent with the hypothesis, the
hypothesis is supported, or not rejected.– If the value is not consistent with the hypothesis, the
hypothesis is not supported, or is rejected.
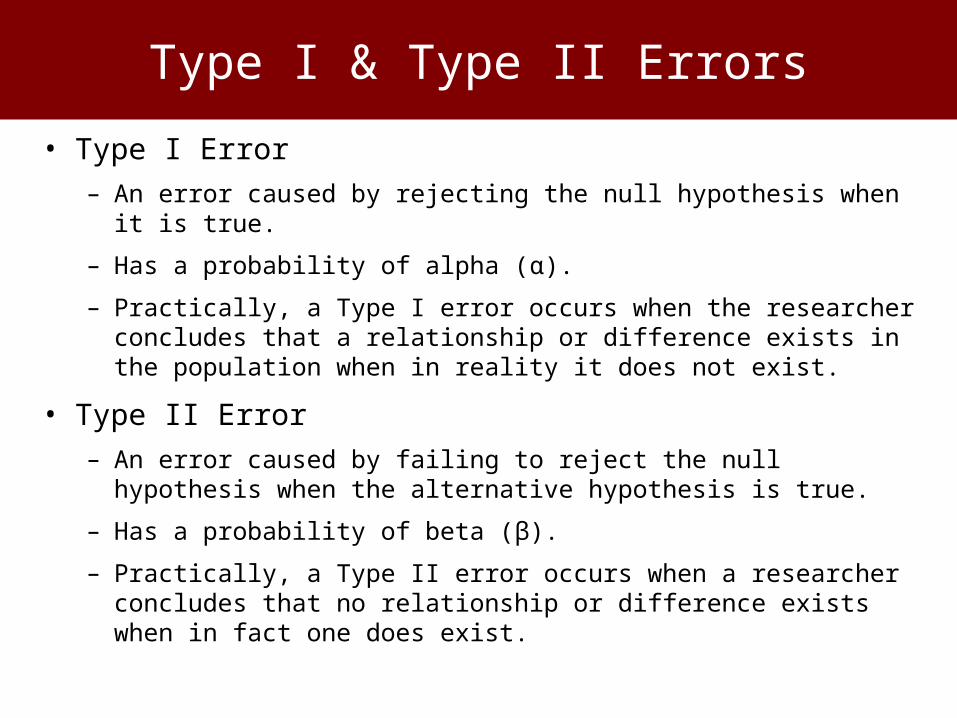
Type I & Type II Errors
• Type I Error
– An error caused by rejecting the null hypothesis when it is true.
– Has a probability of alpha (α).
– Practically, a Type I error occurs when the researcher concludes that a relationship or difference exists in the population when in reality it does not exist.
• Type II Error
– An error caused by failing to reject the null hypothesis when the alternative hypothesis is true.
– Has a probability of beta (β).
– Practically, a Type II error occurs when a researcher concludes that no relationship or difference exists when in fact one does exist.
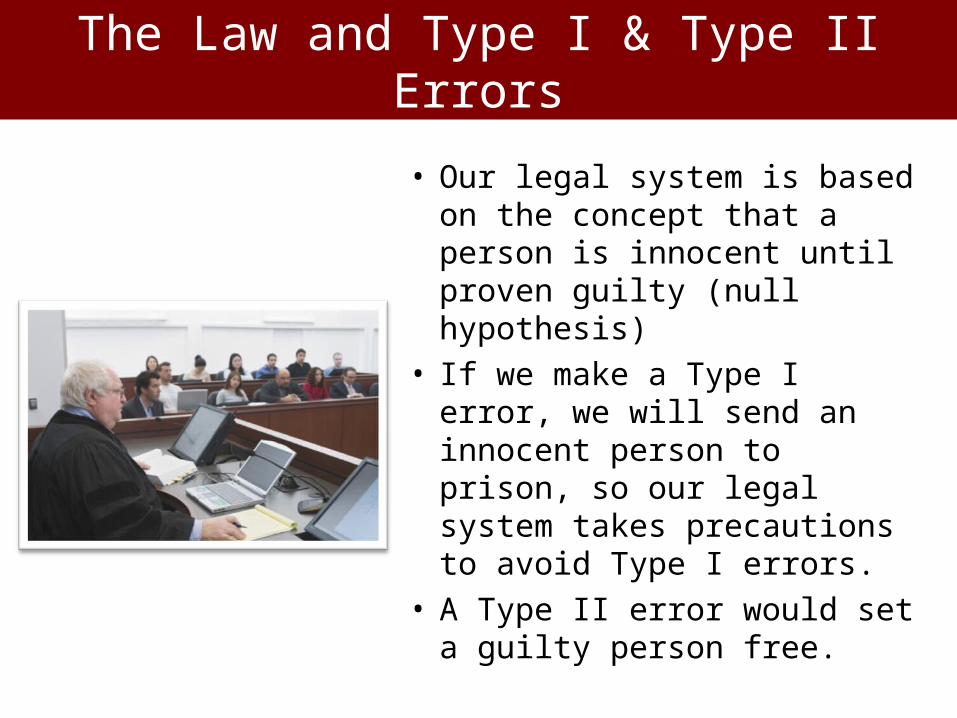
The Law and Type I & Type II Errors
• Our legal system is based on the concept that a person is innocent until proven guilty (null hypothesis)
• If we make a Type I error, we will send an innocent person to prison, so our legal system takes precautions to avoid Type I errors.
• A Type II error would set a guilty person free.

Differences Between Groups
• Primary tests used are ANOVA and MANOVA
• ANOVA = Analysis of Variance
• MANOVA = Multiple Analysis of Variance
• Significance Standard:– Churchill (1978) Alpha or Sig. less than or equal to
0.05
• If Sig. is less than or equal to 0.05, then a statistically significant difference exists between the groups.
Example
• Hypothesis: No difference exists between females and males on technophobia.
• If a statistically significant difference exists, we reject the hypothesis.
• If no s.s. difference exists, we fail to reject.
Example
• Hypothesis: Males are more technophobic then females (i.e., a difference does exist)
• If a statistically significant difference exists, and it is in the direction predicted, we fail to reject the hypothesis.
• If no s.s. difference exists, or if females are statistically more likely to be technophobic, we reject the hypothesis.
Testing for Significant Causality
• Simple regression or Multiple regression
• Same standard of significance (Churchill 1978)
• Adj. R2 = percentage of the variance in the dependent variable explained by the regression model.
• If Sig. is less than or equal to 0.05, then the independent variable IS having a statistically significant impact on the dependent variable.
• Note: must take into account whether the impact is positive or negative.
Example
• Hypothesis: Technophobia positively influences mental intangibility.
• If a technophobia is shown to statistically impact mental intangibility (Sig. is less than or equal to 0.05), AND.
• The impact is positive, we fail to reject the hypothesis.
• Otherwise, we reject the hypothesis.