bat mineral oil and gas refineries
TRANSCRIPT
Edificio Expo-WTC s/ Inca Garcilaso s/n, E-41092 Seville – SpainTelephone: +34 95 448 8284 Fax: +34 95 448 8426E-mail: [email protected] Internet: http://eippcb.jrc.es
EUROPEAN COMMISSIONDIRECTORATE-GENERAL JRCJOINT RESEARCH CENTREInstitute for Prospective Technological Studies (Seville)Technologies for Sustainable DevelopmentEuropean IPPC Bureau
Integrated Pollution Prevention and Control (IPPC)
Reference Document on Best Available Techniques forMineral Oil and Gas Refineries
December 2001

Executive Summary
MA/EIPPCB/REF_BREF_FINAL December 2001 i
EXECUTIVE SUMMARY
The BREF (Best Available Techniques reference document) on Mineral Oil and Gas Refineriesreflects an information exchange carried out according to Article 16(2) of Council Directive96/61/EC. This Executive Summary – which is intended to be read in conjunction with theBREF preface’s explanations of objectives, usage and legal terms – describes the main findings,the principal BAT conclusions and the associated emission levels. It can be read and understoodas a stand-alone document but, as a summary, it does not present all the complexities of the fullBREF text. It is therefore not intended as a substitute for the full BREF text as a tool in BATdecision making. In this information exchange more than 40 people have participated directly.Oil companies are typically international companies, so people from outside the EU have alsobeen involved in the process.
ScopeThe scope of this BREF for the Mineral Oil and Gas Refinery Industry is based on Section 2.1of Annex I of the IPPC Directive 96/61/EC, from which it also takes its title. This documentaddresses the mineral oil refining industry as well as the natural gas plants. Other relatedactivities such as exploration, production, transportation or marketing of products are notincluded here. All types of mineral oil refineries regardless of capacity and all types of processactivities typically found there are covered in this document. Some activities that are or may befound in refineries are not covered here because they are covered in other BREFs (e.g. lowolefins and solvent production, generation of power with natural gas). Other activities have notbeen fully covered in this document because they are partially covered in other BREFs (e.g.cooling, storage, waste water and waste gas). Thus, when implementing IPPC permits for aspecific site, other BREFs should also be considered. Soil remediation is not included in thisBREF because it is not a contamination prevention or control technique.
The European Refinery industryThe mineral oil and gas refinery industry is an important and strategic industry. Mineral oilrefineries alone provide 42% of EU energy requirements and 95% of the fuels required fortransport. About 100 mineral oil refineries have been identified in EU, Switzerland and Norwayand together they process around 700 million tonnes per year. Installations are well spreadaround the European geography, generally located near the coast. Estimations show that themineral oil refinery sector has 55000 direct employees and some 35000 indirect employees. 4on-shore natural gas plants have been identified.
Refinery processes and the most important environmental issuesThe document provides an updated picture of the technical and environmental situation of thetwo industrial sectors. It contains a brief technical description of the major activities andprocesses found in the sectors complemented by the actual emissions and consumptions foundin European installations.
Refinery installations are typically big and fully integrated. Refineries are industrial sites thatmanage huge amounts of raw materials and products and they are also intensive consumers ofenergy and water. In their storage and refining processes, refineries generate emissions to theatmosphere, to the water and to the soil, to the extent that environmental management hasbecome a major factor for refineries. The type and quantity of refinery emissions to theenvironment are typically well known. Oxides of carbon, nitrogen and sulphur, particulates(mainly generated from combustion processes), and volatile organic carbons are the main airpollutants generated by both sectors. Water is used intensively in a refinery as process water andfor cooling purposes. Its use contaminates the water with oil products. The main watercontaminants are hydrocarbons, sulphides, ammonia and some metals. In the context of thehuge amount of raw material that they process, refineries do not generate substantial quantitiesof waste. Currently, waste generated by refineries are dominated by sludges, non-specificrefinery waste (domestic, demolition, etc.), and spent chemicals (e.g. acids, amines, catalysts).
Executive Summary
ii December 2001 MA / EIPPCB /REF_BREF_FINAL
Emissions to air are the main pollutants generated by mineral oil refineries and, to a much lesserextent, natural gas plants (i.e. number of emission points, tonnes emitted, number of BATdeveloped). For every million tonnes of crude oil processed (European refineries range from 0.5to more than 20 million tonnes), refineries emit from 20000 – 820000 t of carbon dioxide,60 - 700 t of nitrogen oxides, 10 – 3000 t of particulate matter, 30 – 6000 t of sulphur oxidesand 50 – 6000 t of volatile organic chemicals. They generate, per million tonnes of crude oilrefined, from 0.1 – 5 million tonnes of waste water and from 10 – 2000 tonnes of solid waste.Those big differences in emissions from European refineries can be partially explained by thedifferences in integration and type of refineries (e.g. simple vs. complex). However, the maindifferences are related to different environmental legislation schemes in Europe. Main airemissions from natural gas plants are CO2, NOx, SOx, and VOC. Water and waste are typicallyless important than for mineral oil refineries.
Given the progress that refineries have made in the abatement of sulphur emissions to air, thefocus has started to shift towards VOC (including odour), particulates (size and composition)and NOx, as it has in the environmental debate generally. When the carbon dioxide emissionsdebate gathers momentum, it will also strongly affect refineries. Refinery waste water treatmenttechniques are mature techniques, and emphasis has now shifted to prevention and reduction.Reduction of water use and/or the concentration of pollutants in the water can have effects inreducing the final emission of pollutants.
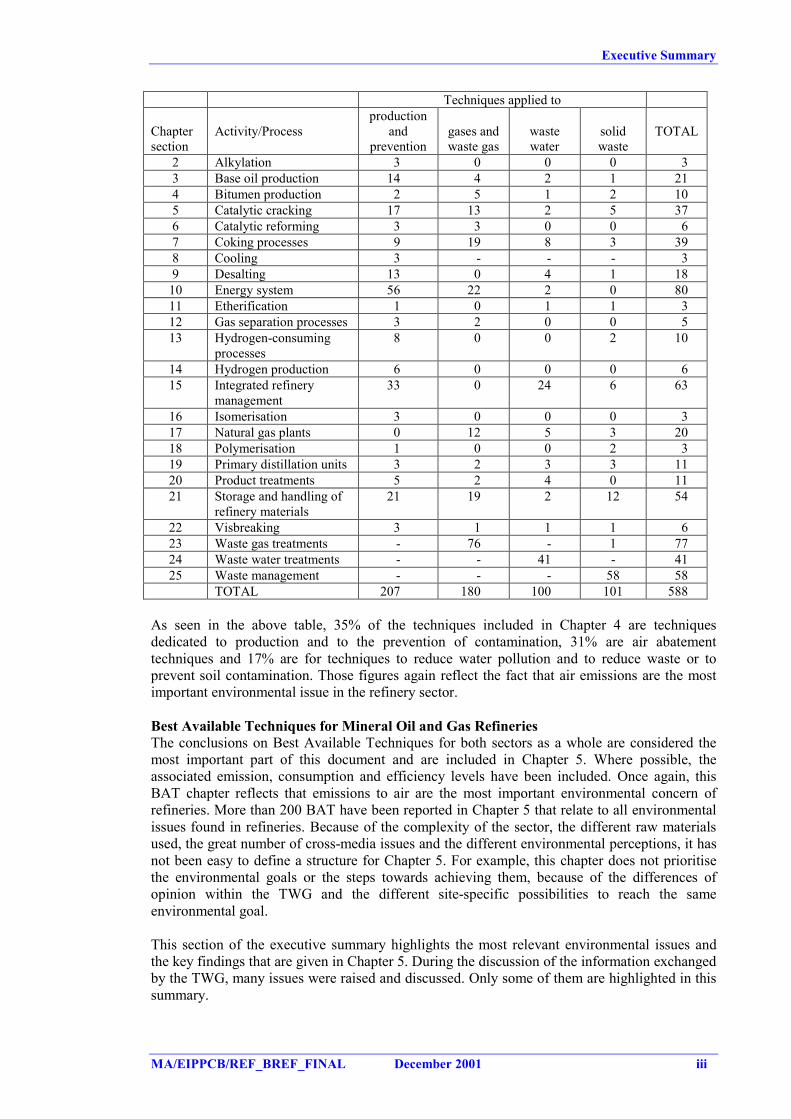
Techniques to consider in the determination of BATClose to 600 techniques have been considered in the determination of BAT. Those techniqueshave been analysed following a consistent scheme. That analysis is reported for each techniquewith a brief description, the environmental benefits, the cross-media effects, the operationaldata, the applicability and economics. In some cases the driving force for implementation hasbeen explored and references to the number of installations containing the technique have beenincluded. The description of the techniques ends with the reference literature supporting the datain Chapter 4. Those techniques have been put into in 25 sections as shown in the followingtable.
Executive Summary
MA/EIPPCB/REF_BREF_FINAL December 2001 iii
Techniques applied to
Chaptersection
Activity/Processproduction
andprevention
gases andwaste gas
wastewater
solidwaste
TOTAL
2 Alkylation 3 0 0 0 33 Base oil production 14 4 2 1 214 Bitumen production 2 5 1 2 105 Catalytic cracking 17 13 2 5 376 Catalytic reforming 3 3 0 0 67 Coking processes 9 19 8 3 398 Cooling 3 - - - 39 Desalting 13 0 4 1 18
10 Energy system 56 22 2 0 8011 Etherification 1 0 1 1 312 Gas separation processes 3 2 0 0 513 Hydrogen-consuming
processes8 0 0 2 10
14 Hydrogen production 6 0 0 0 615 Integrated refinery
management33 0 24 6 63
16 Isomerisation 3 0 0 0 317 Natural gas plants 0 12 5 3 2018 Polymerisation 1 0 0 2 319 Primary distillation units 3 2 3 3 1120 Product treatments 5 2 4 0 1121 Storage and handling of
refinery materials21 19 2 12 54
22 Visbreaking 3 1 1 1 623 Waste gas treatments - 76 - 1 7724 Waste water treatments - - 41 - 4125 Waste management - - - 58 58
TOTAL 207 180 100 101 588
As seen in the above table, 35% of the techniques included in Chapter 4 are techniquesdedicated to production and to the prevention of contamination, 31% are air abatementtechniques and 17% are for techniques to reduce water pollution and to reduce waste or toprevent soil contamination. Those figures again reflect the fact that air emissions are the mostimportant environmental issue in the refinery sector.
Best Available Techniques for Mineral Oil and Gas RefineriesThe conclusions on Best Available Techniques for both sectors as a whole are considered themost important part of this document and are included in Chapter 5. Where possible, theassociated emission, consumption and efficiency levels have been included. Once again, thisBAT chapter reflects that emissions to air are the most important environmental concern ofrefineries. More than 200 BAT have been reported in Chapter 5 that relate to all environmentalissues found in refineries. Because of the complexity of the sector, the different raw materialsused, the great number of cross-media issues and the different environmental perceptions, it hasnot been easy to define a structure for Chapter 5. For example, this chapter does not prioritisethe environmental goals or the steps towards achieving them, because of the differences ofopinion within the TWG and the different site-specific possibilities to reach the sameenvironmental goal.
This section of the executive summary highlights the most relevant environmental issues andthe key findings that are given in Chapter 5. During the discussion of the information exchangedby the TWG, many issues were raised and discussed. Only some of them are highlighted in thissummary.
Executive Summary
iv December 2001 MA / EIPPCB /REF_BREF_FINAL
Unit- based BAT approach vs. generic BAT approachA most controversial issue during the preparation of the BREF, given its bearing on most of theconclusions on BAT in Chapter 5, has been the issue of process integration within the refineryas a whole, notably on the basis of the bubble approach, versus an integrated multi-mediaapproach per individual process unit, i.e. the unit-by-unit approach. An important conclusionhas been that both approaches should be respected as having their own merits in the permittingprocedure and can complement each other rather than opposing each other. Chapter 5 hastherefore been divided into two sections (generic and process BAT). So, BAT for any specificrefinery is the combination of the non-unit-specific elements, i.e. those applicable to refineriesas a whole (generic BAT), and the unit-specific-BAT applicable to that particular case.
Implementation of IPPC permits based on BATAs totally new refineries are unlikely to be built in Europe, the application of the BAT conceptis most relevant to the permitting of new process units in existing refineries or the update andrenewal of permits for existing facilities. Implementation of some concepts or techniques relatedto BAT in those existing refineries may be very difficult. This difficulty is related to thecomplex nature of the refinery sector, its diversity, the high degree of process integration or itstechnical complexity.
Emission or consumption levels “associated with best available techniques” are presented whererelevant within BAT chapter. BREFs do not set legally binding standards, they are meant togive information for the guidance of industry, Member States and the public on achievableemission and consumption levels when using specified techniques. Those levels are neitheremission nor consumption limit values and should not be understood as such. The appropriatelimit values for any specific case will need to be determined taking into account the objectivesof the IPPC Directive and the local considerations.
It was acknowledged that the implementation of BAT in each refinery needs to be addressed ineach case and that multiple technical solutions exist. That is why prevention or controltechniques are given in the BAT as a group of possibilities.
Amongst the many environmental issues addressed in the BREF, the five that are dealt withbelow are probably the most important:• increase the energy efficiency• reduce the nitrogen oxide emissions• reduce the sulphur oxide emissions• reduce the volatile organic compounds emissions• reduce the contamination of water
BAT is to increase refinery energy efficiencyIt was recognised during the exchange of information that one of the most important BAT forthe sector is to increase energy efficiency, the principal benefit of which would be a reduction inthe emissions of all air pollutants. Techniques to increase energy efficiency within refinerieswere identified (~32) and data were provided, but it was not possible, with any of the severalmethods available, to quantify what constitutes an energy efficient refinery. Only some reportedfigures on the Solomon index for ten European refineries were included. It is recognised in theBAT chapter that an increase in energy efficiency should be tackled on two fronts: increasingthe energy efficiency of the various processes/activities and enhancing energy integrationthroughout the refinery.
BAT is to reduce nitrogen oxides emissionsNOx emissions from refineries were also identified as an issue that should be analysed from twoperspectives: that of the refinery as a whole and that of specific processes/activities, notably theenergy system (furnaces, boilers, gas turbines) and catalytic cracker regenerators, because that iswhere they are mainly generated. The TWG has therefore tried to reach consensus using boththe bubble concept and scrutiny of the individual processes that generate NOx emissions. The
Executive Summary
MA/EIPPCB/REF_BREF_FINAL December 2001 v
TWG has not been able to identify a single range of emissions associated with the application ofBAT under the bubble concept. Five different ranges or values were provided by the TWG forthe concentration bubble approach (three based on different scenarios when implementing BAT)and two for the load bubble approach (one based on the scenario of implementation of BAT).BAT related to NOx emissions (~17) typically contain associated emission values.
BAT is to reduce sulphur oxides emissionsThe third area identified as an issue that should be examined from those two perspectives is SOxemissions, which are typically generated in the energy system (from fuels containing sulphurcompounds), catalytic cracker regenerators, bitumen production, coking processes, aminetreating, sulphur recovery units and flares. An additional difficulty here is that sulphur appearsin the products manufactured by the refinery. A sulphur balance has therefore been included as atechnique to consider as part of the Environmental Management System. As a consequence ofall that, the TWG tried to reach consensus using the bubble concept and by examining theindividual processes that generate SOx emissions. The TWG was not able to identify a singlerange of emissions associated with the application of BAT under the bubble concept. Fivedifferent ranges or values were provided by the TWG for the concentration bubble approach(two based on different scenarios when implementing BAT) and two for the load bubbleapproach (one based on the scenario of implementation of BAT). BAT related to SOx emissions(~38) typically contain associated emission values.
BAT is to reduce VOC emissionsVOC emissions from refineries were identified more as a global issue than a process/activityissue, because VOC emissions in the sector come from fugitives, for which the point ofemission is not identified. However, those processes/activities with a high potential for VOCemissions are identified in the Specific BAT for processes/activities. Because of this difficultyin identifying points of emission, the TWG concluded that one important BAT is to quantify theVOC emissions. One method is mentioned in Chapter 5 as an example. In this case theimplementation of a LDAR programme or equivalent is also recognised as very important. TheTWG was not able to identify any range of emissions associated with the application of BAT,mainly because of a lack of information. Many (~19) BAT related to VOC emissions have beenidentified.
BAT is to reduce contamination to waterAs mentioned repeatedly in the document, air emissions are the most important environmentalissues that appear within a refinery. However, because refineries are extensive consumers ofwater, they also generate great quantities of contaminated waste water. The (~37) BAT relatedto water are on two levels. One deals with water management and waste water management inthe refinery as a whole and the other deals with specific actions to reduce contamination orreduce water consumption. In this case, benchmarks for fresh water usage and process effluentvolume are included in Chapter 5 as well as water parameters for the effluent of the waste watertreatment. Chapter 5 contains many (~21) BAT related to the possibility of recycling of wastewater from one process to another.
Emerging techniquesThis brief chapter includes the techniques that have not yet been commercially applied and arestill in the research or development phase. However, because of the implications they may havein the refinery sector, they have been included here to raise awareness during any future revisionof the document.
Concluding remarksThe environmental situation of European refineries varies greatly across the EuropeanCommunity, so the starting point for each case is very different. Different environmentalperceptions and priorities are also evident.
Executive Summary
vi December 2001 MA / EIPPCB /REF_BREF_FINAL
Level of consensusThe refineries sector is a large and complex one, spread across all Member States exceptLuxembourg. This size and complexity are reflected in the number of processes / activitiesaddressed in the BREF and the number (200+) of BAT it contains. The fact that agreement hasbeen reached on all but 27 of those 200+ BAT is a measure of the broad commitment of TWGmembers to the conclusions reached. Those 27 split views can be summarised and classified inthe following three ways:
• One relates to the general introduction to Chapter 5• eleven relate to the Generic BAT• fifteen relate to Specific BAT.
• Nineteen relate to the figures in the ranges given in Chapter 5. They represent two pointsof view; the first is that control techniques are almost always applicable in all cases andthe second is that control techniques are hardly applicable
• four relate to the structure of the parts of Chapter 5 that relate to SOx and NOx emissionsand are driven by the bubble concept approach
• two relate to the water emissions table; one to the average time period given in theconcentration column and the other to how the metal content should be expressed withinthe table
• one is addressed to the introduction to Chapter 5 and relates to the way in which theupper value of the ranges in Chapter 5 is selected
• only one split view relates fundamentally to a technique; base oil production.
• Nine relate to the water emissions table• eight relate to SOx emissions• eight relate to NOx emissions• two relate to particulates emissions.
Recommendations for future workIn preparation for future BREF reviews, all TWG members and interested parties shouldcontinue to collect data on the current emission and consumption levels and on the performanceof techniques to be considered in the determination of BAT. For the review, it is also importantto collect more data on the achievable emission and consumption levels and the economics ofall production processes under analysis. It is also important to continue collecting informationon energy efficiency. Apart from these general areas, some techniques in Chapter 4 need moreinformation in order to be complete. Other complementary data missing in the document isabout characteristics of particulates, noise and odour. It is also recognised that otherorganisations such as technology providers, may enhance the appearance and validation of datawithin the document.
Recommendations for future R&D workThe previous paragraph highlights many areas for attention in future work. Much of the futurework concerns the collecting of information to be used in reviewing this BREF. Proposals forfuture R&D work focus on the techniques that are identified in this BREF, but are too expensiveor cannot be used yet in the sector.
Preface
MA/EIPPCB/REF_BREF_FINAL December 2001 vii
PREFACE
1. Status of this document
Unless otherwise stated, references to “the Directive” in this document means the CouncilDirective 96/61/EC on integrated pollution prevention and control.
This document forms part of a series presenting the results of an exchange of informationbetween EU Member States and industries concerned on best available technique (BAT),associated monitoring, and developments in them. *[It is published by the EuropeanCommission pursuant to Article 16(2) of the Directive, and must therefore be taken into accountin accordance with Annex IV of the Directive when determining “best available techniques”.]
*Note: brackets will be removed once the procedure of publication by the Commission is completed.
2. Relevant legal obligations of the IPPC Directive and the definition of BAT
In order to help the reader understand the legal context in which this document has been drafted,some of the most relevant provisions of the IPPC Directive, including the definition of the term“best available techniques”, are described in this preface. This description is inevitablyincomplete and is given for information only. It has no legal value and does not in any way alteror prejudice the actual provisions of the Directive.
The purpose of the Directive is to achieve integrated prevention and control of pollution arisingfrom the activities listed in its Annex I, leading to a high level of protection of the environmentas a whole. The legal basis of the Directive relates to environmental protection. Itsimplementation should also take account of other Community objectives such as thecompetitiveness of the Community’s industry thereby contributing to sustainable development.
More specifically, it provides for a permitting system for certain categories of industrialinstallations requiring both operators and regulators to take an integrated, overall look at thepolluting and consuming potential of the installation. The overall aim of such an integratedapproach must be to improve the management and control of industrial processes so as to ensurea high level of protection for the environment as a whole. Central to this approach is the generalprinciple given in Article 3 that operators should take all appropriate preventative measuresagainst pollution, in particular through the application of best available techniques enablingthem to improve their environmental performance.
The term “best available techniques” is defined in Article 2(11) of the Directive as “the mosteffective and advanced stage in the development of activities and their methods of operationwhich indicate the practical suitability of particular techniques for providing in principle thebasis for emission limit values designed to prevent and, where that is not practicable, generallyto reduce emissions and the impact on the environment as a whole.” Article 2(11) goes on toclarify further this definition as follows:
“techniques” includes both the technology used and the way in which the installation isdesigned, built, maintained, operated and decommissioned;
“available” techniques are those developed on a scale which allows implementation in therelevant industrial sector, under economically and technically viable conditions, taking intoconsideration the costs and advantages, whether or not the techniques are used or producedinside the Member State in question, as long as they are reasonably accessible to the operator;
“best” means most effective in achieving a high general level of protection of the environmentas a whole.
Preface
viii December 2001 MA/EIPPCB/REF_BREF_FINAL
Furthermore, Annex IV of the Directive contains a list of “considerations to be taken intoaccount generally or in specific cases when determining best available techniques.. bearing inmind the likely costs and benefits of a measure and the principles of precaution and prevention”.These considerations include the information published by the Commission pursuant toArticle 16(2).
Competent authorities responsible for issuing permits are required to take account of the generalprinciples set out in Article 3 when determining the conditions of the permit. These conditionsmust include emission limit values, supplemented or replaced where appropriate by equivalentparameters or technical measures. According to Article 9(4) of the Directive, these emissionlimit values, equivalent parameters and technical measures must, without prejudice tocompliance with environmental quality standards, be based on the best available techniques,without prescribing the use of any technique or specific technology, but taking into account thetechnical characteristics of the installation concerned, its geographical location and the localenvironmental conditions. In all circumstances, the conditions of the permit must includeprovisions on the minimisation of long-distance or transboundary pollution and must ensure ahigh level of protection for the environment as a whole.
Member States have the obligation, according to Article 11 of the Directive, to ensure thatcompetent authorities follow or are informed of developments in best available techniques.
3. Objective of this Document
Article 16(2) of the Directive requires the Commission to organise “an exchange of informationbetween Member States and the industries concerned on best available techniques, associatedmonitoring and developments in them”, and to publish the results of the exchange.
The purpose of the information exchange is given in recital 25 of the Directive, which states that“the development and exchange of information at Community level about best availabletechniques will help to redress the technological imbalances in the Community, will promotethe world-wide dissemination of limit values and techniques used in the Community and willhelp the Member States in the efficient implementation of this Directive.”
The Commission (Environment DG) established an information exchange forum (IEF) to assistthe work under Article 16(2) and a number of technical working groups have been establishedunder the umbrella of the IEF. Both IEF and the technical working groups includerepresentation from Member States and industry as required in Article 16(2).
The aim of this series of documents is to reflect accurately the exchange of information whichhas taken place as required by Article 16(2) and to provide reference information for thepermitting authority to take into account when determining permit conditions. By providingrelevant information concerning best available techniques, these documents should act asvaluable tools to drive environmental performance.
4. Information sources
This document represents a summary of information collected from a number of sources,including in particular the expertise of the groups established to assist the Commission in itswork, and verified by the Commission services. All contributions are gratefully acknowledged.
5. How to understand and use this document
The information provided in this document is intended to be used as an input to thedetermination of BAT in specific cases. When determining BAT and setting BAT-based permitconditions, account should always be taken of the overall goal to achieve a high level ofprotection for the environment as a whole.
Preface
MA/EIPPCB/REF_BREF_FINAL December 2001 ix
This document provides information for two industrial sectors: Mineral Oil refineries andNatural Gas plants. The rest of this section describes the type of information that is provided ineach section of the document.
The document has been divided into seven chapters plus annexes. Chapters 1 and 2 providegeneral information on the mineral oil refinery and natural gas sector and on the productionprocesses and activities that can be found within the sector. Chapter 3 provides data andinformation concerning current emission and consumption levels reflecting the situation inexisting installations at the time of writing. Chapter 4 describes the prevention (includingproduction techniques) and control techniques that are considered to be most relevant fordetermining BAT and BAT-based permit conditions. Each technique within Chapter 4 includesinformation on consumption and emission levels considered achievable by using the technique,some idea of the costs and the cross-media issues associated with the technique, and the extentto which the technique is applicable to the range of installations requiring IPPC permits, forexample new, existing, large or small installations. Chapter 5 presents the techniques and theemission and consumption levels that are considered to be compatible with BAT in a generalsense for the mineral oil refineries and natural gas plants as a whole. Chapter 6 describesbriefly techniques that may be applied in both sectors in the future. Chapter 7 summarises theconclusions and recommendations of the document. In order to help the reader, a Glossary isalso included. Complementing the document, the Annexes contain a summary of the legislationapplicable to the sector as well as summaries of the type of refinery configurations anddescriptions of the refinery products/intermediates generated within refineries.
The purpose of Chapter 5 is thus to provide general indications regarding the emission andconsumption levels that can be considered as an appropriate reference point to assist in thedetermination of BAT-based permit conditions or for the establishment of general binding rulesunder Article 9(8). It should be stressed, however, that this document does not propose emissionlimit values. The determination of appropriate permit conditions will involve taking account oflocal, site-specific factors such as the technical characteristics of the installation concerned, itsgeographical location and the local environmental conditions. In the case of existinginstallations, the economic and technical viability of upgrading them also needs to be taken intoaccount. Even the single objective of ensuring a high level of protection for the environment asa whole will often involve making trade-off judgements between different types ofenvironmental impact, and these judgements will often be influenced by local considerations.Although an attempt is made to address some of above-mentioned issues, it is not possible forsome of them to be considered fully in this document. The techniques and levels presented inChapter 5 will therefore not necessarily be appropriate for all installations. On the other hand,the obligation to ensure a high level of environmental protection including the minimisation oflong-distance or transboundary pollution implies that permit conditions cannot be set on thebasis of purely local considerations. It is therefore of the utmost importance that the informationcontained in this document is fully taken into account by permitting authorities.
6. How chapters have been structured
Chapters 2, 3, 4 and 6 as well as Section 5.2 have a common internal structure, so as to facilitatethe reading and understanding of the document. Each of those chapters has been structured pertype of process or activity found in the refinery sector and classified in alphabetical order tomake it easier to find them in the document. Those sections do not pretend to be of equalimportance from the environmental impact point of view. Some have more relevance thanothers, but this structure is considered a good and clear way to tackle the BAT assessment forthese industrial sectors. Moreover, it is unlikely that a completely new mineral oil refineryinstallation will be built in Europe, but it is very likely that new processes will be installed inexisting European refineries.
The first section in each of those chapters is dedicated to a general description of the chapterissue under consideration in refineries as a whole. Then follow 20 sections covering all themineral oil refinery processes and activities and one covering natural gas plants.

Preface
x December 2001 MA/EIPPCB/REF_BREF_FINAL
Since the best available techniques change over time, this document will be reviewed andupdated as appropriate. All comments and suggestions should be made to the European IPPCBureau at the Institute for Prospective Technological Studies at the following address:
World Trade Center, Isla de la Cartuja s/n, E-41092 Seville – SpainTelephone: +34 95 4488 284 Fax: +34 95 4488 426e-mail: [email protected]: http://eippcb.jrc.es
MA/EIPPCB/REF_BREF_FINAL December 2001 xi
Reference document on Best Available Techniquesfor Mineral Oil and Gas Refineries
EXECUTIVE SUMMARY------------------------------------------------------------------------------------------ I
PREFACE ----------------------------------------------------------------------------------------------------------- VII
SCOPE ------------------------------------------------------------------------------------------------------------XXIII
1 GENERAL INFORMATION ----------------------------------------------------------------------------------11.1 The purpose of refineries .............................................................................................................11.2 Refinery sector in the EU ............................................................................................................11.3 European refineries......................................................................................................................6
1.3.1 Technical characteristics of European refineries ....................................................................91.3.2 Employment in the European refinery sector .......................................................................13
1.4 Main environmental issues in the refining sector ......................................................................141.4.1 Emissions to the atmosphere.................................................................................................151.4.2 Emissions to water ................................................................................................................161.4.3 Waste generation ..................................................................................................................171.4.4 Soil and groundwater contamination ....................................................................................181.4.5 Other environmental issues...................................................................................................19
2 APPLIED PROCESSES AND TECHNIQUES ----------------------------------------------------------- 212.1 General overview of the refinery processes...............................................................................212.2 Alkylation ..................................................................................................................................252.3 Base oil production....................................................................................................................272.4 Bitumen production ...................................................................................................................292.5 Catalytic cracking ......................................................................................................................312.6 Catalytic reforming....................................................................................................................332.7 Coking processes .......................................................................................................................352.8 Cooling systems.........................................................................................................................382.9 Desalting....................................................................................................................................402.10 Energy system............................................................................................................................412.11 Etherification .............................................................................................................................482.12 Gas separation processes ...........................................................................................................512.13 Hydrogen consuming processes.................................................................................................532.14 Hydrogen production .................................................................................................................602.15 Integrated refinery management ................................................................................................632.16 Isomerisation .............................................................................................................................662.17 Natural gas plants ......................................................................................................................682.18 Polymerisation ...........................................................................................................................702.19 Primary distillation units............................................................................................................712.20 Product treatments .....................................................................................................................742.21 Storage and handling of refinery materials ................................................................................762.22 Visbreaking................................................................................................................................782.23 Techniques for the abatement of emissions ...............................................................................80
3 CURRENT EMISSION AND CONSUMPTION LEVELS -------------------------------------------- 813.1 Current emission and consumption levels in refineries as a whole............................................81
3.1.1 Present consumption levels in refineries...............................................................................833.1.2 Emissions to air.....................................................................................................................843.1.3 Emissions to water ................................................................................................................923.1.4 Waste generation ..................................................................................................................94
3.2 Alkylation ..................................................................................................................................963.3 Base oil production....................................................................................................................983.4 Bitumen production .................................................................................................................1003.5 Catalytic cracking ....................................................................................................................1013.6 Catalytic reforming..................................................................................................................1063.7 Coking processes .....................................................................................................................1083.8 Cooling systems.......................................................................................................................1103.9 Desalting..................................................................................................................................1123.10 Energy system..........................................................................................................................114
3.10.1 Energy management ...........................................................................................................1143.10.2 Energy capacity and consumptions.....................................................................................115
xii December 2001 MA/EIPPCB/REF_BREF_FINAL
3.10.3 Emissions ........................................................................................................................... 1173.11 Etherification........................................................................................................................... 1223.12 Gas separation processes......................................................................................................... 1233.13 Hydrogen-consuming processes.............................................................................................. 1243.14 Hydrogen production............................................................................................................... 1273.15 Integrated refinery management.............................................................................................. 1303.16 Isomerisation........................................................................................................................... 1343.17 Natural gas plants.................................................................................................................... 1363.18 Polymerisation......................................................................................................................... 1383.19 Primary distillation units ......................................................................................................... 1393.20 Product treatments................................................................................................................... 1413.21 Storage and handling of refinery materials ............................................................................. 1433.22 Visbreaking ............................................................................................................................. 1463.23 Emissions from waste gas treatment techniques ..................................................................... 1483.24 Emissions from waste water treatment techniques.................................................................. 1503.25 Waste generation..................................................................................................................... 1523.26 Monitoring .............................................................................................................................. 154
4 TECHNIQUES TO CONSIDER IN THE DETERMINATION OF BAT-------------------------- 1594.1 General overview of activities considered in this chapter ....................................................... 1604.2 Alkylation................................................................................................................................ 162
4.2.1 Hydrofluoric acid alkylation process.................................................................................. 1624.2.2 Sulphuric acid alkylation process....................................................................................... 1634.2.3 Upgrade feedstock by selective hydrogenation or isomerisation ....................................... 165
4.3 Base oil production ................................................................................................................. 1664.3.1 Multiple-effect extraction process...................................................................................... 1664.3.2 Types of solvent used in the aromatic extraction unit ........................................................ 1674.3.3 Solvent recovery from dewaxing units............................................................................... 1684.3.4 Wax reprocessing unit ........................................................................................................ 1694.3.5 Lube oil clean-up................................................................................................................ 1704.3.6 Storage of base oil intermediates and products .................................................................. 1704.3.7 Storage and benchmarking of solvents............................................................................... 1714.3.8 Sulphur treatment from hydrogenation units...................................................................... 1714.3.9 Stripping of waste water from aromatic extraction ............................................................ 1724.3.10 Hot oil system..................................................................................................................... 172
4.4 Bitumen production................................................................................................................. 1744.4.1 Storage of bitumen products............................................................................................... 1744.4.2 Techniques to control emissions to the air ......................................................................... 1744.4.3 Techniques to control emissions to the waste water........................................................... 1774.4.4 Techniques for prevention of generation of waste ............................................................. 1774.4.5 Hot oil system..................................................................................................................... 178
4.5 Catalytic cracking.................................................................................................................... 1794.5.1 Full combustion mode in regenerator................................................................................. 1794.5.2 Residue catalytic cracking (RCC) ...................................................................................... 1804.5.3 Partial combustion mode in the regenerator ....................................................................... 1814.5.4 Hydrotreatment of feed to the catcraker ............................................................................. 1824.5.5 Waste heat boiler and expander applied to flue gas from the FCC regenerator ................. 1844.5.6 Catalyst selection................................................................................................................ 1854.5.7 Waste water management within FCCU ............................................................................ 1854.5.8 Nitrogen oxides abatement techniques ............................................................................... 1864.5.9 Particulate abatement techniques ....................................................................................... 1894.5.10 Sulphur oxides abatement techniques ................................................................................ 1934.5.11 Combined abatement techniques........................................................................................ 1984.5.12 Waste management techniques........................................................................................... 198
4.6 Catalytic reforming ................................................................................................................. 2004.6.1 Continuous catalytic reformer ............................................................................................ 2004.6.2 Semiregenerative reformer ................................................................................................. 2004.6.3 Type of catalyst promoter................................................................................................... 2014.6.4 Cleaning of the regeneration flue gas ................................................................................. 2024.6.5 Electrostatic precipitator in the regeneration flue gas ........................................................ 2024.6.6 Dioxins formation in catalytic reforming units .................................................................. 203
4.7 Coking processes..................................................................................................................... 2044.7.1 Delayed coking................................................................................................................... 204
MA/EIPPCB/REF_BREF_FINAL December 2001 xiii
4.7.2 Fluid coking........................................................................................................................2054.7.3 Calcination process .............................................................................................................2054.7.4 Flexicoking .........................................................................................................................2064.7.5 Use of oily sludges and/or waste as coker feedstock ..........................................................2074.7.6 Cleaning of the coking gas..................................................................................................2084.7.7 Water use in the cooling/cutting process ............................................................................2094.7.8 Handling and storage of the coke........................................................................................2104.7.9 Techniques to reduce air emissions ....................................................................................2114.7.10 Techniques to prevent emissions to water ..........................................................................2124.7.11 Techniques to reduce soil contamination............................................................................213
4.8 Cooling systems.......................................................................................................................2144.8.1 Segregation of cooling and process waters .........................................................................2144.8.2 Air cooling..........................................................................................................................2144.8.3 Prevention of oil leakages into cooling water .....................................................................215
4.9 Desalting..................................................................................................................................2164.9.1 Good desalting practices.....................................................................................................2164.9.2 Enhance the oil/water separation before discharge to the waste water treatment plant ......2164.9.3 Enhance the solid/water-oil separation ...............................................................................2174.9.4 Re-use of water for the desalter ..........................................................................................2184.9.5 Stripping of the desalter brine.............................................................................................219
4.10 Energy system..........................................................................................................................2204.10.1 Energy management ...........................................................................................................2214.10.2 Refinery fuels: types and cleaning......................................................................................2254.10.3 Energy production techniques.............................................................................................2294.10.4 Nitrogen oxide control and abatement techniques ..............................................................2364.10.5 Particulate abatement techniques........................................................................................2494.10.6 Sulphur oxides abatement techniques .................................................................................251
4.11 Etherification ...........................................................................................................................2544.11.1 Catalytic distillation............................................................................................................2544.11.2 Prevent upsets in the waste water biotreater .......................................................................2544.11.3 Prevent leaking of water soluble compounds .....................................................................255
4.12 Gas separation processes .........................................................................................................2564.12.1 Increase the heat integration with upstream plants .............................................................2564.12.2 Improve the condensate knock-out system .........................................................................2564.12.3 Fugitive emissions minimisation ........................................................................................2564.12.4 Re-use of the fuel gas used in LPG production...................................................................2574.12.5 Prevention of emissions of LPG odorant ............................................................................257
4.13 Hydrogen-consuming processes ..............................................................................................2584.13.1 Hydrotreating......................................................................................................................2584.13.2 Hydrodesulphurisation processes........................................................................................2594.13.3 Catalytic distillation............................................................................................................2604.13.4 On-stream catalyst replacement technology for processing high-metal feeds ....................2604.13.5 Hydrogenation of light dienes.............................................................................................2614.13.6 Hydrocracker ......................................................................................................................2624.13.7 Residue hydroprocessing ....................................................................................................262
4.14 Hydrogen production ...............................................................................................................2644.14.1 Gas Heated Steam Reformer Technology...........................................................................2644.14.2 Coke and heavy oils gasification ........................................................................................2654.14.3 Purification of hydrogen .....................................................................................................266
4.15 Integrated refinery management ..............................................................................................2684.15.1 Environmental management tools.......................................................................................2684.15.2 The bubble concept.............................................................................................................2694.15.3 Good housekeeping.............................................................................................................2744.15.4 Training ..............................................................................................................................2754.15.5 Production planning and control.........................................................................................2764.15.6 Safety management.............................................................................................................2764.15.7 Water management .............................................................................................................2774.15.8 Emissions integrated management......................................................................................283
4.16 Isomerisation ...........................................................................................................................2844.16.1 Active chloride promoted catalyst isomerisation process ...................................................2844.16.2 Zeolitic isomerisation process.............................................................................................2844.16.3 Increase of the cyclic hexanes in the isomerisation feedstream..........................................285
4.17 Natural gas plants ....................................................................................................................286
xiv December 2001 MA/EIPPCB/REF_BREF_FINAL
4.17.1 Amine sweetening of natural gas ....................................................................................... 2864.17.2 Sulphur recovery unit ......................................................................................................... 2864.17.3 Re-use of carbon dioxide.................................................................................................... 2874.17.4 Techniques to reduce VOC emissions................................................................................ 2874.17.5 Techniques to reduce NOx emissions ................................................................................. 2874.17.6 Techniques to reduce water emissions ............................................................................... 2874.17.7 Techniques to reduce waste generation.............................................................................. 288
4.18 Polymerisation......................................................................................................................... 2894.18.1 Process ............................................................................................................................... 2894.18.2 Management and re-use of the catalyst .............................................................................. 289
4.19 Primary distillation units ......................................................................................................... 2914.19.1 Progressive distillation unit ................................................................................................ 2914.19.2 Heat integration of crude distillation units ......................................................................... 2924.19.3 Heat integration of the vacuum distillation units................................................................ 2934.19.4 Use of vacuum pumps and surface condensers .................................................................. 2944.19.5 Reduction of the vacuum pressure in the vacuum distillation unit..................................... 2954.19.6 Treatment of non-condensables from vacuum ejector set condensor................................. 2954.19.7 Waste water treatment and re-use....................................................................................... 2964.19.8 Other techniques to consider in the atmospheric units ....................................................... 296
4.20 Product treatments................................................................................................................... 2984.20.1 Cascading of caustic solutions............................................................................................ 2984.20.2 Management of the spent caustic ....................................................................................... 2984.20.3 Incineration of foul air vented from sweetening................................................................. 3004.20.4 Replace clay filtration with hydrotreating .......................................................................... 3004.20.5 Treating .............................................................................................................................. 3004.20.6 Catalytic dewaxing............................................................................................................. 301
4.21 Storage and handling of materials ........................................................................................... 3024.21.1 Underground caverns ......................................................................................................... 3024.21.2 Internal floating roof tanks ................................................................................................. 3024.21.3 Fixed-roof tanks ................................................................................................................. 3034.21.4 External floating roofs........................................................................................................ 3044.21.5 Pressurised vessels ............................................................................................................. 3054.21.6 Double and secondary seals ............................................................................................... 3054.21.7 Storage strategy.................................................................................................................. 3064.21.8 Prevention of leakage through tank bottoms ...................................................................... 3074.21.9 Tank farm bund containment ............................................................................................. 3104.21.10 Reduce the generation of tank bottoms .............................................................................. 3114.21.11 Tank cleaning procedures................................................................................................... 3114.21.12 Colour of tanks ................................................................................................................... 3124.21.13 Other good storage practices .............................................................................................. 3124.21.14 In-line blending .................................................................................................................. 3134.21.15 Batch blending.................................................................................................................... 3154.21.16 Vapour recovery................................................................................................................. 3154.21.17 Vapour destruction/ use...................................................................................................... 3174.21.18 Vapour balancing during loading processes....................................................................... 3184.21.19 Bottom loading measures ................................................................................................... 3194.21.20 Tightly-sealed floors .......................................................................................................... 3194.21.21 LPG odorant plant .............................................................................................................. 3194.21.22 Overground pipelines and transfer lines............................................................................. 320
4.22 Visbreaking ............................................................................................................................. 3214.22.1 Deep thermal conversion.................................................................................................... 3214.22.2 Hydrovisbreaking ............................................................................................................... 3214.22.3 Soaker visbreakers.............................................................................................................. 3214.22.4 Sour gas and waste water management .............................................................................. 3224.22.5 Reduction of coke formation in visbreakers....................................................................... 322
4.23 Waste gas treatments............................................................................................................... 3244.23.1 CO abatement techniques................................................................................................... 3244.23.2 CO2 emission control options ............................................................................................. 3244.23.3 NOx abatement techniques ................................................................................................. 3254.23.4 Particulates ......................................................................................................................... 3304.23.5 Sulphur management system.............................................................................................. 3354.23.6 VOC abatement techniques ................................................................................................ 3514.23.7 Flares .................................................................................................................................. 360

MA/EIPPCB/REF_BREF_FINAL December 2001 xv
4.23.8 Combined techniques to abate air pollutants ......................................................................3624.23.9 Odour preventing and control techniques ...........................................................................3644.23.10 Noise prevention and control techniques ............................................................................364
4.24 Waste water treatments............................................................................................................3654.24.1 Management of waste water within a refinery....................................................................3654.24.2 Sour water stripping (SWS)................................................................................................3674.24.3 Reduction and recovery of hydrocarbons from waste water...............................................3704.24.4 Primary treatments..............................................................................................................3724.24.5 Secondary treatments..........................................................................................................3744.24.6 Tertiary treatments..............................................................................................................3754.24.7 Final treatments ..................................................................................................................3764.24.8 Refinery waste water treatments.........................................................................................377
4.25 Waste management..................................................................................................................3794.25.1 Establishment of a waste management programme ............................................................3794.25.2 Sludge management and treatment .....................................................................................3804.25.3 Spent solid catalyst management ........................................................................................3834.25.4 Recovery and recycling waste ............................................................................................3854.25.5 Biodegradation of wastes....................................................................................................3874.25.6 Stabilisation/solidification of waste ....................................................................................3884.25.7 Waste storage......................................................................................................................390
5 BEST AVAILABLE TECHNIQUES (BAT) -------------------------------------------------------------3915.1 Generic (whole refinery) BAT.................................................................................................3955.2 BAT for process/activity..........................................................................................................402
6 EMERGING TECHNIQUES -------------------------------------------------------------------------------415
7 CONCLUDING REMARKS --------------------------------------------------------------------------------419
8 LIST OF REFERENCES ------------------------------------------------------------------------------------425
9 GLOSSARY-----------------------------------------------------------------------------------------------------431
10 ANNEXES-------------------------------------------------------------------------------------------------------43710.1 Annex I. Environmental legislation and emission limit values applied to refineries ...............438
10.1.1 EU and other international legislation ................................................................................43810.1.2 EU+ national legislation and emission limit values............................................................44110.1.3 Non-EU+ legislation and emission limit values .................................................................458
10.2 Annex II. Refinery configurations ...........................................................................................46010.2.1 Configuration 1: hydroskimming + isomerisation unit .......................................................46110.2.2 Configuration 2: catcracker configuration ..........................................................................46210.2.3 Configuration 3: hydrocracker configuration......................................................................46310.2.4 Configuration 4: complex refinery with hydroconversion and IGCC.................................464
10.3 Annex III. Refinery feedstock, intermediates and products.....................................................46610.3.1 Crude oil .............................................................................................................................46610.3.2 Refinery intermediates and products ..................................................................................468
10.4 Annex IV. Submitted examples on cost-effectiveness of implementation of environmentaltechnologies .............................................................................................................................471
10.4.1 Calculation of the cost-effectiveness of the implementation of a technique in a hypotheticalcase.....................................................................................................................................471
10.4.2 Cost-effectiveness data for SRU.........................................................................................47210.4.3 Compendium of cost-effectiveness data for some NOx abatement techniques ...................47210.4.4 Feasibility study on the applicability of NOx environmental measures in two different
refinery sites.......................................................................................................................47510.5 Annex V: Background information from TWG members for the different proposals of SO2 and
NOx emission under the bubble concept ..................................................................................47710.5.1 Calculations based on BAT assumptions provided by the Netherlands..............................47710.5.2 Example provided by Austria .............................................................................................48110.5.3 Two examples provided a TWG member ...........................................................................48110.5.4 Italian proposals and justification for the given bubble figures ..........................................48210.5.5 Concawe proposals and justifications for the given bubble figures....................................483
10.6 Annex VI. Proposals from two Member States on the implementation of BAT in the refinerysector........................................................................................................................................486
10.6.1 French proposals for the structure of some parts of Chapter 5 ...........................................48610.6.2 Italian proposals for the structure of some parts of Chapter 5. ...........................................490
xvi December 2001 MA/EIPPCB/REF_BREF_FINAL
List of figures
Figure 1.1: Percentage of sulphur in the crude used in each European Country ....................................... 3Figure 1.2: Geographical distribution of the European refineries ............................................................. 8Figure 1.3: Nelson complexity index of European refineries per country (average 6.1)......................... 12Figure 1.4: Evolution of the complexity of European refineries ............................................................. 13Figure 1.5: Employment in European refineries as a function of the complexity of the refinery ........... 14Figure 1.6: Employment in the European refineries as a function of the crude capacity ........................ 14Figure 2.1: General scheme of a complex oil refinery ............................................................................ 23
Figure 2.2: Simplified process flow scheme for HF alkylation unit........................................................ 26Figure 2.3: Block scheme of a lubricating oil manufacturing plant ........................................................ 27Figure 2.4: Simplified process flow scheme of a bitumen blowing unit ................................................. 29Figure 2.5: Simplified process flow scheme for fluid catalytic cracker .................................................. 32Figure 2.6: Simplified process flow scheme for a continuous catalytic reformer ................................... 34Figure 2.7: Simplified process flow scheme for delayed coking unit ..................................................... 35Figure 2.8: Simplified process flow scheme for a flexicoker.................................................................. 37Figure 2.9: Simplified diagrams of the cooling systems used in refineries............................................. 38Figure 2.10: Simplified flow diagram of a crude desalter......................................................................... 40Figure 2.11: Simplified flow diagram of a fuel gas system....................................................................... 42Figure 2.12: Simplified flow diagram of a heavy fuel oil system ............................................................. 43Figure 2.13: Block flow scheme for IGCC ............................................................................................... 44Figure 2.14: Typical layout of a boiler feed water preparation unit and a steam boiler ............................ 46Figure 2.15: Simplified process flow scheme for a MTBE production process........................................ 49Figure 2.16: Simplified process flow scheme for TAME production ....................................................... 49Figure 2.17: Simplified process flow scheme for a part of a gas plant ..................................................... 51Figure 2.18: Simplified process flow scheme of a distillate hydrodesulphurisation unit .......................... 56Figure 2.19: Simplified process flow scheme for hydrocracker (single stage with recycle) ..................... 58Figure 2.20: Sample of simplified process flow scheme for hydroconversion process (moving bed) ...... 59Figure 2.21: Hydrogen production by steam reforming and pressure-swing recovery ............................. 61Figure 2.22: Simplified process flow scheme for an isomerisation unit ................................................... 66Figure 2.23: General flow diagram of the natural gas industry................................................................. 69Figure 2.24: Simplified scheme of a polymerisation unit ......................................................................... 70Figure 2.25: Simplified process flow diagram for a crude distillation unit............................................... 72Figure 2.26: Simplified process flow scheme for high-vacuum distillation unit....................................... 73Figure 2.27: Simplified process flow diagram of the mercaptan oxidation extraction process................. 75Figure 2.28: Simplified process flow diagram of the caustic cascading system (mercaptan oxidation
extraction and mercaptan oxidation sweetening).................................................................. 75Figure 2.29: Different type of storage tanks.............................................................................................. 77Figure 2.30: Simplified process flow scheme for visbreaking unit ........................................................... 78
Figure 3.1: Example of specific emissions and consumptions found in European refineries ................. 82Figure 3.2: Specific CO2 emissions from some European refineries as function of the Nelson
complexity index .................................................................................................................. 84Figure 3.3: Specific NOx emissions from some European refineries as function of the Nelson
complexity index .................................................................................................................. 85Figure 3.4: SO2 emissions from some European refineries as function of the crude capacity ................ 88Figure 3.5: Specific SO2 emissions from some European refineries as function of the crude
capacity................................................................................................................................. 88Figure 3.6: Specific SO2 emissions from some European refineries against the Nelson complexity
index ..................................................................................................................................... 89Figure 3.7: Energy intensity index vs. Nelson complexity index for some EU+ refineries .................. 115Figure 3.8: Sulphur and nitrogen contents in HFO (vacuum residues) according to their
geographical origin ............................................................................................................. 116Figure 3.9: Petroleum coke commercial process................................................................................... 128Figure 3.10: Historical and distribution trend of calculated annual SO2 combustion bubble for EU
refineries ............................................................................................................................. 131
Figure 4.1: Waste heat boiler applied to a catcracker ........................................................................... 184Figure 4.2: Treatment of the coking gas................................................................................................ 208Figure 4.3: Schematic presentation of the catalyst system.................................................................... 247Figure 4.4: The bubble concept............................................................................................................. 269
MA/EIPPCB/REF_BREF_FINAL December 2001 xvii
Figure 4.5: Example of a process water integration scheme for a catcracker refinery configuration(10 Mt/yr) ............................................................................................................................278
Figure 4.6: Block diagram of an example of an optimised water/effluent routing for a refinery ..........281Figure 4.7: Process flow diagram of a progressive distillation unit.......................................................291Figure 4.8: Simplified scheme of an in-line blending system for gasoils (automotive diesel and
heating oil) ..........................................................................................................................314Figure 4.9: Some examples of SCR retrofit situations in refineries (clean gas situations) ....................329Figure 4.10: Simplified process flow diagram of an amine treating unit.................................................336Figure 4.11: Simplified process flow diagram of a sulphur recovery unit (CLAUS) unit.......................338Figure 4.12: Simplified process flow diagram of a tail gas Claus unit (SCOT) unit ...............................341Figure 4.13: Simplified process flow scheme of a vapour recovery unit.................................................355Figure 4.14: Applicability different techniques for end-of-pipe gas treatment for VOC removal...........357Figure 4.15: Simplified process flow diagram of a flare system .............................................................361Figure 4.16: Simplified process flow diagram of a sour water stripping unit (SWS)..............................368Figure 4.17: Simplified process flow diagram of a typical refinery waste water treatment plant,
including denitrification/nitrification biotreater. .................................................................377Figure 4.18: Simplified process flow diagram of sludge handling and incineration ...............................381
Figure 10.1: Scheme 1: Hydroskimming + isomerisation unit ................................................................461Figure 10.2: Scheme 2: Catcracker configuration ...................................................................................463Figure 10.3: Scheme 3: Hydrocracker configuration...............................................................................464Figure 10.4: Scheme 4: Complex refinery with hydroconversion and IGCC..........................................465Figure 10.5: Some values on the cost for the abatement of NOx in different industrial sectors ..............473Figure 10.6: Variable efficiency and cost of retrofitting of existing units (FRF/tonne NOx reduced).....476Figure 10.7: Daily SO2 bubble variation and fuels breakdown – real refinery case (global annual
average of 1200 mg/Nm3) ...................................................................................................484Figure 10.8: Global sulphur balance in a refinery ...................................................................................490
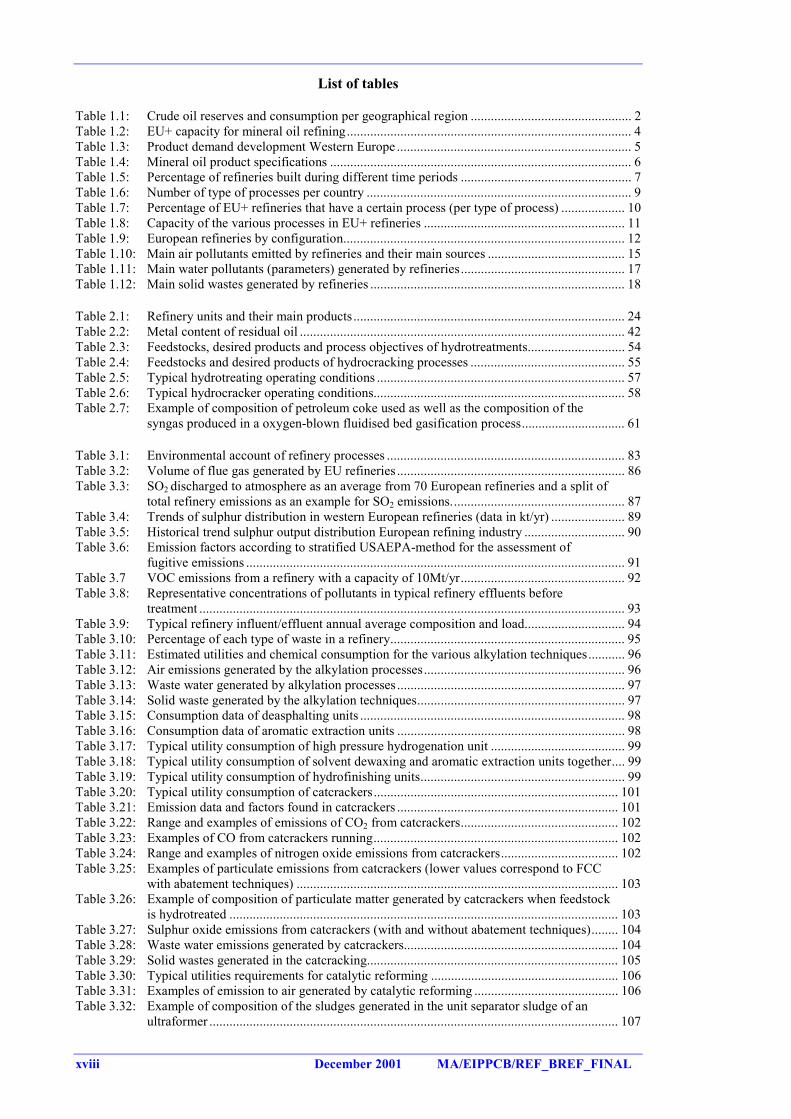
xviii December 2001 MA/EIPPCB/REF_BREF_FINAL
List of tables
Table 1.1: Crude oil reserves and consumption per geographical region ................................................ 2Table 1.2: EU+ capacity for mineral oil refining..................................................................................... 4Table 1.3: Product demand development Western Europe ...................................................................... 5Table 1.4: Mineral oil product specifications .......................................................................................... 6Table 1.5: Percentage of refineries built during different time periods ................................................... 7Table 1.6: Number of type of processes per country ............................................................................... 9Table 1.7: Percentage of EU+ refineries that have a certain process (per type of process) ................... 10Table 1.8: Capacity of the various processes in EU+ refineries ............................................................ 11Table 1.9: European refineries by configuration.................................................................................... 12Table 1.10: Main air pollutants emitted by refineries and their main sources ......................................... 15Table 1.11: Main water pollutants (parameters) generated by refineries................................................. 17Table 1.12: Main solid wastes generated by refineries ............................................................................ 18
Table 2.1: Refinery units and their main products................................................................................. 24Table 2.2: Metal content of residual oil ................................................................................................. 42Table 2.3: Feedstocks, desired products and process objectives of hydrotreatments............................. 54Table 2.4: Feedstocks and desired products of hydrocracking processes .............................................. 55Table 2.5: Typical hydrotreating operating conditions .......................................................................... 57Table 2.6: Typical hydrocracker operating conditions........................................................................... 58Table 2.7: Example of composition of petroleum coke used as well as the composition of the
syngas produced in a oxygen-blown fluidised bed gasification process............................... 61
Table 3.1: Environmental account of refinery processes ....................................................................... 83Table 3.2: Volume of flue gas generated by EU refineries .................................................................... 86Table 3.3: SO2 discharged to atmosphere as an average from 70 European refineries and a split of
total refinery emissions as an example for SO2 emissions.................................................... 87Table 3.4: Trends of sulphur distribution in western European refineries (data in kt/yr) ...................... 89Table 3.5: Historical trend sulphur output distribution European refining industry .............................. 90Table 3.6: Emission factors according to stratified USAEPA-method for the assessment of
fugitive emissions ................................................................................................................. 91Table 3.7 VOC emissions from a refinery with a capacity of 10Mt/yr................................................. 92Table 3.8: Representative concentrations of pollutants in typical refinery effluents before
treatment ............................................................................................................................... 93Table 3.9: Typical refinery influent/effluent annual average composition and load.............................. 94Table 3.10: Percentage of each type of waste in a refinery...................................................................... 95Table 3.11: Estimated utilities and chemical consumption for the various alkylation techniques........... 96Table 3.12: Air emissions generated by the alkylation processes............................................................ 96Table 3.13: Waste water generated by alkylation processes .................................................................... 97Table 3.14: Solid waste generated by the alkylation techniques.............................................................. 97Table 3.15: Consumption data of deasphalting units ............................................................................... 98Table 3.16: Consumption data of aromatic extraction units .................................................................... 98Table 3.17: Typical utility consumption of high pressure hydrogenation unit ........................................ 99Table 3.18: Typical utility consumption of solvent dewaxing and aromatic extraction units together.... 99Table 3.19: Typical utility consumption of hydrofinishing units............................................................. 99Table 3.20: Typical utility consumption of catcrackers......................................................................... 101Table 3.21: Emission data and factors found in catcrackers .................................................................. 101Table 3.22: Range and examples of emissions of CO2 from catcrackers............................................... 102Table 3.23: Examples of CO from catcrackers running......................................................................... 102Table 3.24: Range and examples of nitrogen oxide emissions from catcrackers................................... 102Table 3.25: Examples of particulate emissions from catcrackers (lower values correspond to FCC
with abatement techniques) ................................................................................................ 103Table 3.26: Example of composition of particulate matter generated by catcrackers when feedstock
is hydrotreated .................................................................................................................... 103Table 3.27: Sulphur oxide emissions from catcrackers (with and without abatement techniques)........ 104Table 3.28: Waste water emissions generated by catcrackers................................................................ 104Table 3.29: Solid wastes generated in the catcracking........................................................................... 105Table 3.30: Typical utilities requirements for catalytic reforming ........................................................ 106Table 3.31: Examples of emission to air generated by catalytic reforming ........................................... 106Table 3.32: Example of composition of the sludges generated in the unit separator sludge of an
ultraformer .......................................................................................................................... 107
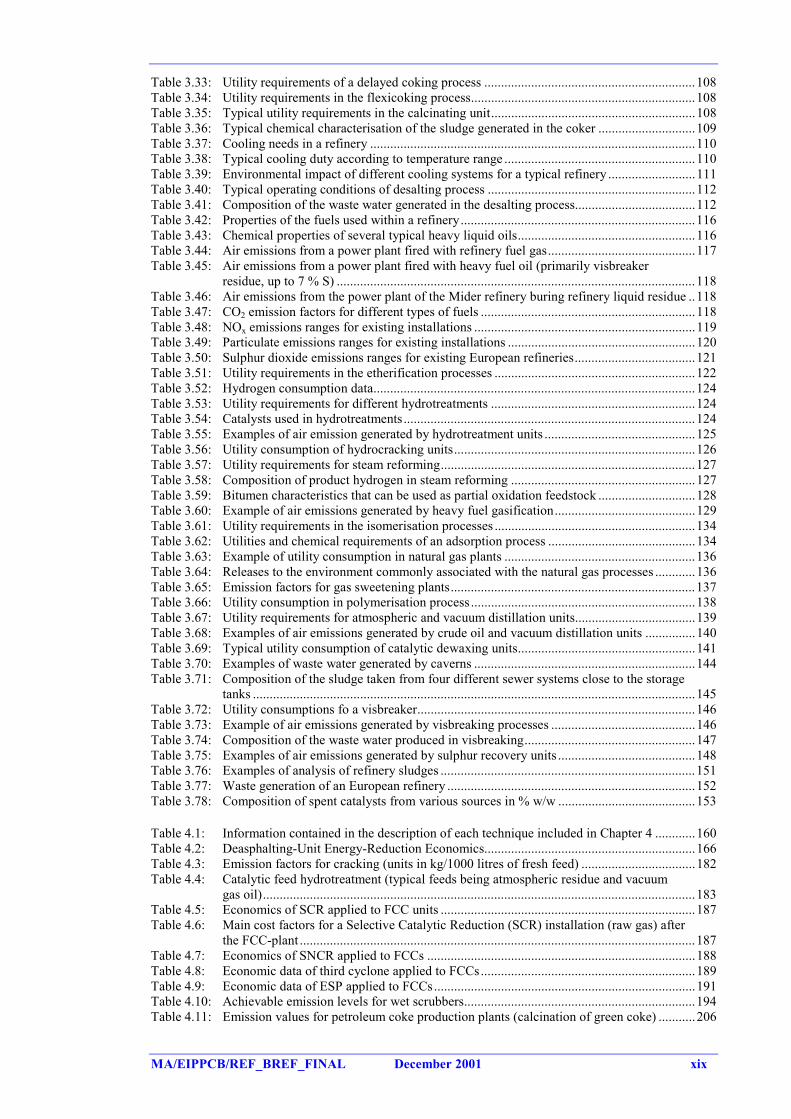
MA/EIPPCB/REF_BREF_FINAL December 2001 xix
Table 3.33: Utility requirements of a delayed coking process ...............................................................108Table 3.34: Utility requirements in the flexicoking process...................................................................108Table 3.35: Typical utility requirements in the calcinating unit.............................................................108Table 3.36: Typical chemical characterisation of the sludge generated in the coker .............................109Table 3.37: Cooling needs in a refinery .................................................................................................110Table 3.38: Typical cooling duty according to temperature range .........................................................110Table 3.39: Environmental impact of different cooling systems for a typical refinery ..........................111Table 3.40: Typical operating conditions of desalting process ..............................................................112Table 3.41: Composition of the waste water generated in the desalting process....................................112Table 3.42: Properties of the fuels used within a refinery......................................................................116Table 3.43: Chemical properties of several typical heavy liquid oils.....................................................116Table 3.44: Air emissions from a power plant fired with refinery fuel gas............................................117Table 3.45: Air emissions from a power plant fired with heavy fuel oil (primarily visbreaker
residue, up to 7 % S) ...........................................................................................................118Table 3.46: Air emissions from the power plant of the Mider refinery buring refinery liquid residue ..118Table 3.47: CO2 emission factors for different types of fuels ................................................................118Table 3.48: NOx emissions ranges for existing installations ..................................................................119Table 3.49: Particulate emissions ranges for existing installations ........................................................120Table 3.50: Sulphur dioxide emissions ranges for existing European refineries....................................121Table 3.51: Utility requirements in the etherification processes ............................................................122Table 3.52: Hydrogen consumption data................................................................................................124Table 3.53: Utility requirements for different hydrotreatments .............................................................124Table 3.54: Catalysts used in hydrotreatments.......................................................................................124Table 3.55: Examples of air emission generated by hydrotreatment units .............................................125Table 3.56: Utility consumption of hydrocracking units........................................................................126Table 3.57: Utility requirements for steam reforming............................................................................127Table 3.58: Composition of product hydrogen in steam reforming .......................................................127Table 3.59: Bitumen characteristics that can be used as partial oxidation feedstock .............................128Table 3.60: Example of air emissions generated by heavy fuel gasification..........................................129Table 3.61: Utility requirements in the isomerisation processes ............................................................134Table 3.62: Utilities and chemical requirements of an adsorption process ............................................134Table 3.63: Example of utility consumption in natural gas plants .........................................................136Table 3.64: Releases to the environment commonly associated with the natural gas processes ............136Table 3.65: Emission factors for gas sweetening plants.........................................................................137Table 3.66: Utility consumption in polymerisation process ...................................................................138Table 3.67: Utility requirements for atmospheric and vacuum distillation units....................................139Table 3.68: Examples of air emissions generated by crude oil and vacuum distillation units ...............140Table 3.69: Typical utility consumption of catalytic dewaxing units.....................................................141Table 3.70: Examples of waste water generated by caverns ..................................................................144Table 3.71: Composition of the sludge taken from four different sewer systems close to the storage
tanks ....................................................................................................................................145Table 3.72: Utility consumptions fo a visbreaker...................................................................................146Table 3.73: Example of air emissions generated by visbreaking processes ...........................................146Table 3.74: Composition of the waste water produced in visbreaking...................................................147Table 3.75: Examples of air emissions generated by sulphur recovery units .........................................148Table 3.76: Examples of analysis of refinery sludges ............................................................................151Table 3.77: Waste generation of an European refinery ..........................................................................152Table 3.78: Composition of spent catalysts from various sources in % w/w .........................................153
Table 4.1: Information contained in the description of each technique included in Chapter 4 ............160Table 4.2: Deasphalting-Unit Energy-Reduction Economics...............................................................166Table 4.3: Emission factors for cracking (units in kg/1000 litres of fresh feed) ..................................182Table 4.4: Catalytic feed hydrotreatment (typical feeds being atmospheric residue and vacuum
gas oil).................................................................................................................................183Table 4.5: Economics of SCR applied to FCC units ............................................................................187Table 4.6: Main cost factors for a Selective Catalytic Reduction (SCR) installation (raw gas) after
the FCC-plant ......................................................................................................................187Table 4.7: Economics of SNCR applied to FCCs ................................................................................188Table 4.8: Economic data of third cyclone applied to FCCs................................................................189Table 4.9: Economic data of ESP applied to FCCs..............................................................................191Table 4.10: Achievable emission levels for wet scrubbers.....................................................................194Table 4.11: Emission values for petroleum coke production plants (calcination of green coke) ...........206
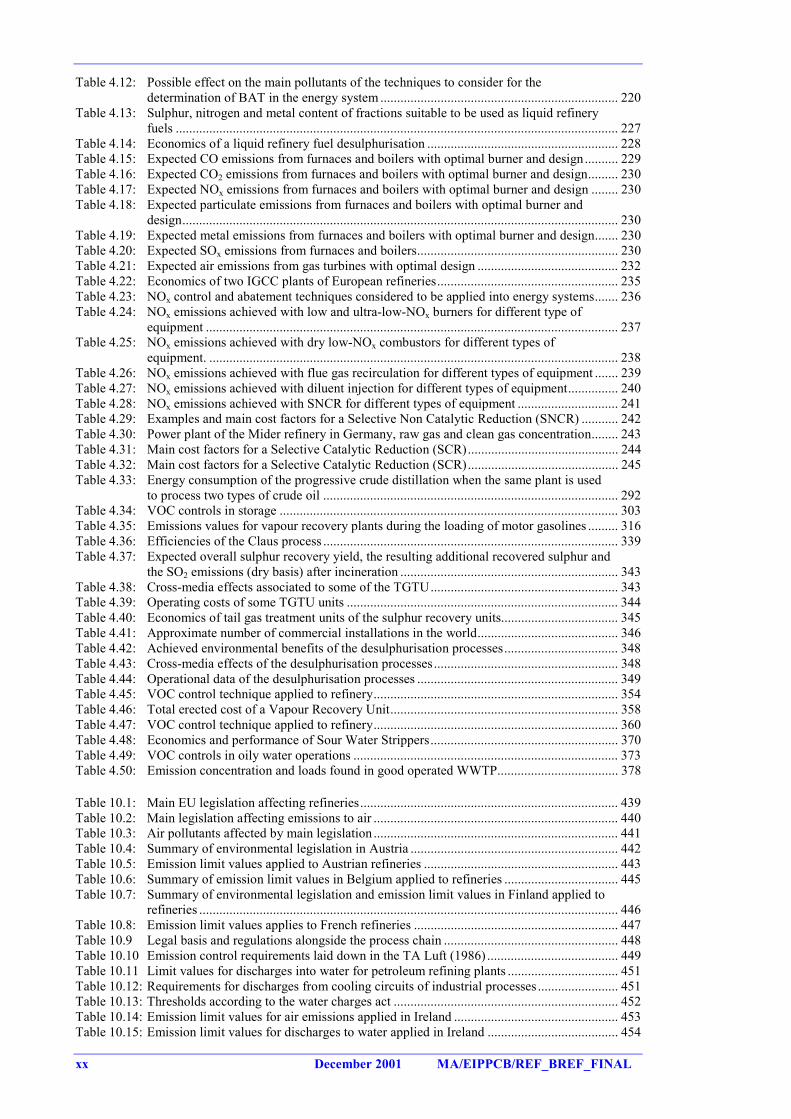
xx December 2001 MA/EIPPCB/REF_BREF_FINAL
Table 4.12: Possible effect on the main pollutants of the techniques to consider for thedetermination of BAT in the energy system ....................................................................... 220
Table 4.13: Sulphur, nitrogen and metal content of fractions suitable to be used as liquid refineryfuels .................................................................................................................................... 227
Table 4.14: Economics of a liquid refinery fuel desulphurisation ......................................................... 228Table 4.15: Expected CO emissions from furnaces and boilers with optimal burner and design.......... 229Table 4.16: Expected CO2 emissions from furnaces and boilers with optimal burner and design......... 230Table 4.17: Expected NOx emissions from furnaces and boilers with optimal burner and design ........ 230Table 4.18: Expected particulate emissions from furnaces and boilers with optimal burner and
design.................................................................................................................................. 230Table 4.19: Expected metal emissions from furnaces and boilers with optimal burner and design....... 230Table 4.20: Expected SOx emissions from furnaces and boilers............................................................ 230Table 4.21: Expected air emissions from gas turbines with optimal design .......................................... 232Table 4.22: Economics of two IGCC plants of European refineries...................................................... 235Table 4.23: NOx control and abatement techniques considered to be applied into energy systems....... 236Table 4.24: NOx emissions achieved with low and ultra-low-NOx burners for different type of
equipment ........................................................................................................................... 237Table 4.25: NOx emissions achieved with dry low-NOx combustors for different types of
equipment. .......................................................................................................................... 238Table 4.26: NOx emissions achieved with flue gas recirculation for different types of equipment ....... 239Table 4.27: NOx emissions achieved with diluent injection for different types of equipment............... 240Table 4.28: NOx emissions achieved with SNCR for different types of equipment .............................. 241Table 4.29: Examples and main cost factors for a Selective Non Catalytic Reduction (SNCR) ........... 242Table 4.30: Power plant of the Mider refinery in Germany, raw gas and clean gas concentration........ 243Table 4.31: Main cost factors for a Selective Catalytic Reduction (SCR)............................................. 244Table 4.32: Main cost factors for a Selective Catalytic Reduction (SCR)............................................. 245Table 4.33: Energy consumption of the progressive crude distillation when the same plant is used
to process two types of crude oil ........................................................................................ 292Table 4.34: VOC controls in storage ..................................................................................................... 303Table 4.35: Emissions values for vapour recovery plants during the loading of motor gasolines ......... 316Table 4.36: Efficiencies of the Claus process ........................................................................................ 339Table 4.37: Expected overall sulphur recovery yield, the resulting additional recovered sulphur and
the SO2 emissions (dry basis) after incineration ................................................................. 343Table 4.38: Cross-media effects associated to some of the TGTU........................................................ 343Table 4.39: Operating costs of some TGTU units ................................................................................. 344Table 4.40: Economics of tail gas treatment units of the sulphur recovery units................................... 345Table 4.41: Approximate number of commercial installations in the world.......................................... 346Table 4.42: Achieved environmental benefits of the desulphurisation processes.................................. 348Table 4.43: Cross-media effects of the desulphurisation processes....................................................... 348Table 4.44: Operational data of the desulphurisation processes ............................................................ 349Table 4.45: VOC control technique applied to refinery......................................................................... 354Table 4.46: Total erected cost of a Vapour Recovery Unit.................................................................... 358Table 4.47: VOC control technique applied to refinery......................................................................... 360Table 4.48: Economics and performance of Sour Water Strippers........................................................ 370Table 4.49: VOC controls in oily water operations ............................................................................... 373Table 4.50: Emission concentration and loads found in good operated WWTP.................................... 378
Table 10.1: Main EU legislation affecting refineries............................................................................. 439Table 10.2: Main legislation affecting emissions to air ......................................................................... 440Table 10.3: Air pollutants affected by main legislation ......................................................................... 441Table 10.4: Summary of environmental legislation in Austria .............................................................. 442Table 10.5: Emission limit values applied to Austrian refineries .......................................................... 443Table 10.6: Summary of emission limit values in Belgium applied to refineries .................................. 445Table 10.7: Summary of environmental legislation and emission limit values in Finland applied to
refineries ............................................................................................................................. 446Table 10.8: Emission limit values applies to French refineries ............................................................. 447Table 10.9 Legal basis and regulations alongside the process chain .................................................... 448Table 10.10 Emission control requirements laid down in the TA Luft (1986) ....................................... 449Table 10.11 Limit values for discharges into water for petroleum refining plants ................................. 451Table 10.12: Requirements for discharges from cooling circuits of industrial processes ........................ 451Table 10.13: Thresholds according to the water charges act ................................................................... 452Table 10.14: Emission limit values for air emissions applied in Ireland ................................................. 453Table 10.15: Emission limit values for discharges to water applied in Ireland ....................................... 454
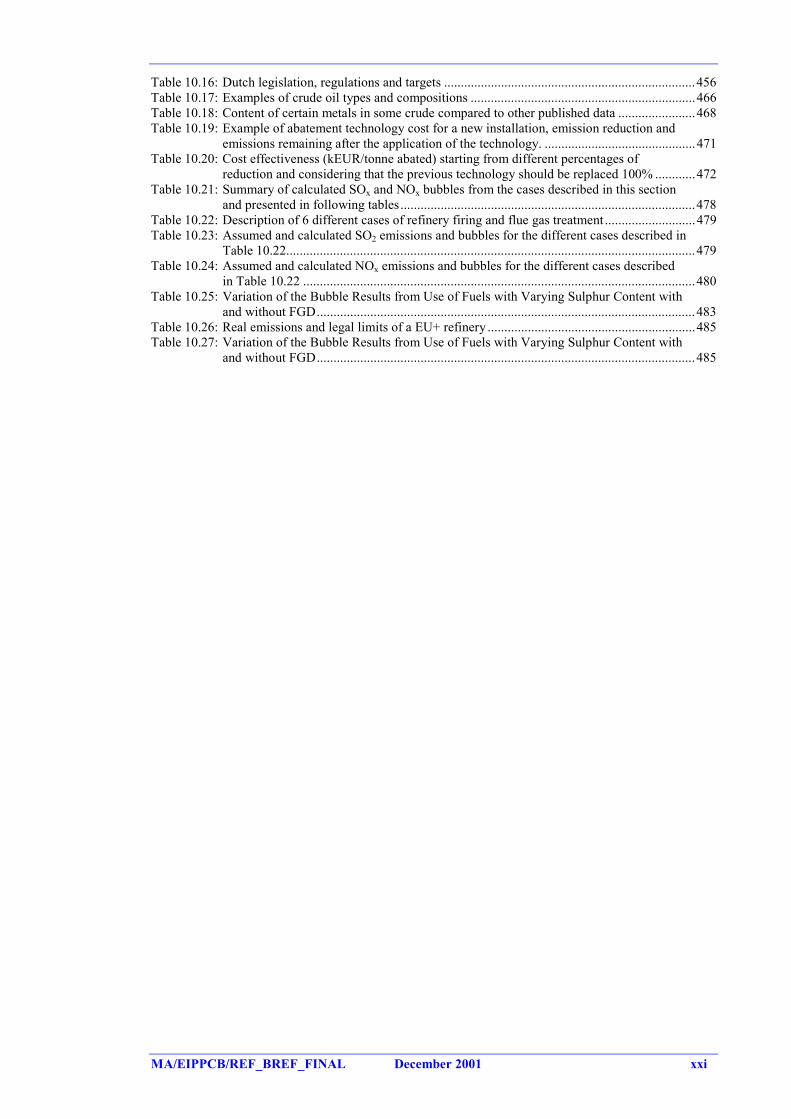
MA/EIPPCB/REF_BREF_FINAL December 2001 xxi
Table 10.16: Dutch legislation, regulations and targets ...........................................................................456Table 10.17: Examples of crude oil types and compositions ...................................................................466Table 10.18: Content of certain metals in some crude compared to other published data .......................468Table 10.19: Example of abatement technology cost for a new installation, emission reduction and
emissions remaining after the application of the technology. .............................................471Table 10.20: Cost effectiveness (kEUR/tonne abated) starting from different percentages of
reduction and considering that the previous technology should be replaced 100% ............472Table 10.21: Summary of calculated SOx and NOx bubbles from the cases described in this section
and presented in following tables........................................................................................478Table 10.22: Description of 6 different cases of refinery firing and flue gas treatment ...........................479Table 10.23: Assumed and calculated SO2 emissions and bubbles for the different cases described in
Table 10.22..........................................................................................................................479Table 10.24: Assumed and calculated NOx emissions and bubbles for the different cases described
in Table 10.22 .....................................................................................................................480Table 10.25: Variation of the Bubble Results from Use of Fuels with Varying Sulphur Content with
and without FGD.................................................................................................................483Table 10.26: Real emissions and legal limits of a EU+ refinery ..............................................................485Table 10.27: Variation of the Bubble Results from Use of Fuels with Varying Sulphur Content with
and without FGD.................................................................................................................485

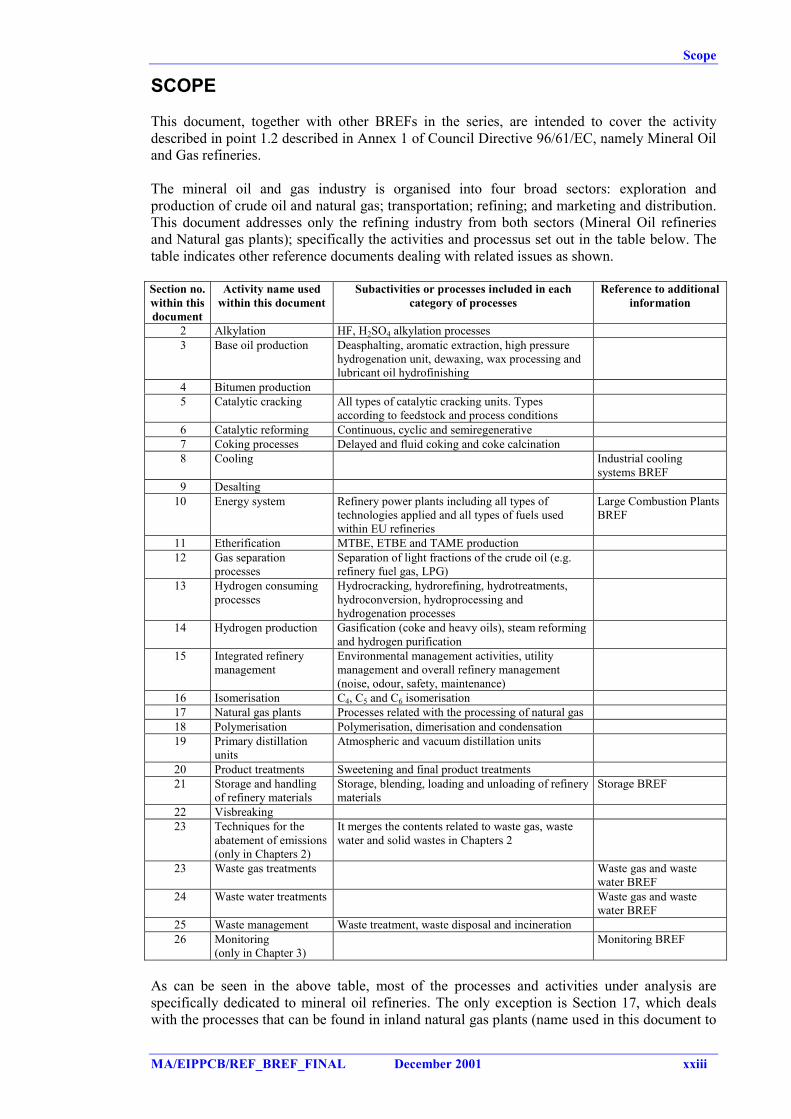
Scope
MA/EIPPCB/REF_BREF_FINAL December 2001 xxiii
SCOPE
This document, together with other BREFs in the series, are intended to cover the activitydescribed in point 1.2 described in Annex 1 of Council Directive 96/61/EC, namely Mineral Oiland Gas refineries.
The mineral oil and gas industry is organised into four broad sectors: exploration andproduction of crude oil and natural gas; transportation; refining; and marketing and distribution.This document addresses only the refining industry from both sectors (Mineral Oil refineriesand Natural gas plants); specifically the activities and processus set out in the table below. Thetable indicates other reference documents dealing with related issues as shown.
Section no.within thisdocument
Activity name usedwithin this document
Subactivities or processes included in eachcategory of processes
Reference to additionalinformation
2 Alkylation HF, H2SO4 alkylation processes3 Base oil production Deasphalting, aromatic extraction, high pressure
hydrogenation unit, dewaxing, wax processing andlubricant oil hydrofinishing
4 Bitumen production5 Catalytic cracking All types of catalytic cracking units. Types
according to feedstock and process conditions6 Catalytic reforming Continuous, cyclic and semiregenerative7 Coking processes Delayed and fluid coking and coke calcination8 Cooling Industrial cooling
systems BREF9 Desalting
10 Energy system Refinery power plants including all types oftechnologies applied and all types of fuels usedwithin EU refineries
Large Combustion PlantsBREF
11 Etherification MTBE, ETBE and TAME production12 Gas separation
processesSeparation of light fractions of the crude oil (e.g.refinery fuel gas, LPG)
13 Hydrogen consumingprocesses
Hydrocracking, hydrorefining, hydrotreatments,hydroconversion, hydroprocessing andhydrogenation processes
14 Hydrogen production Gasification (coke and heavy oils), steam reformingand hydrogen purification
15 Integrated refinerymanagement
Environmental management activities, utilitymanagement and overall refinery management(noise, odour, safety, maintenance)
16 Isomerisation C4, C5 and C6 isomerisation17 Natural gas plants Processes related with the processing of natural gas18 Polymerisation Polymerisation, dimerisation and condensation19 Primary distillation
unitsAtmospheric and vacuum distillation units
20 Product treatments Sweetening and final product treatments21 Storage and handling
of refinery materialsStorage, blending, loading and unloading of refinerymaterials
Storage BREF
22 Visbreaking23 Techniques for the
abatement of emissions(only in Chapters 2)
It merges the contents related to waste gas, wastewater and solid wastes in Chapters 2
23 Waste gas treatments Waste gas and wastewater BREF
24 Waste water treatments Waste gas and wastewater BREF
25 Waste management Waste treatment, waste disposal and incineration26 Monitoring
(only in Chapter 3)Monitoring BREF
As can be seen in the above table, most of the processes and activities under analysis arespecifically dedicated to mineral oil refineries. The only exception is Section 17, which dealswith the processes that can be found in inland natural gas plants (name used in this document to
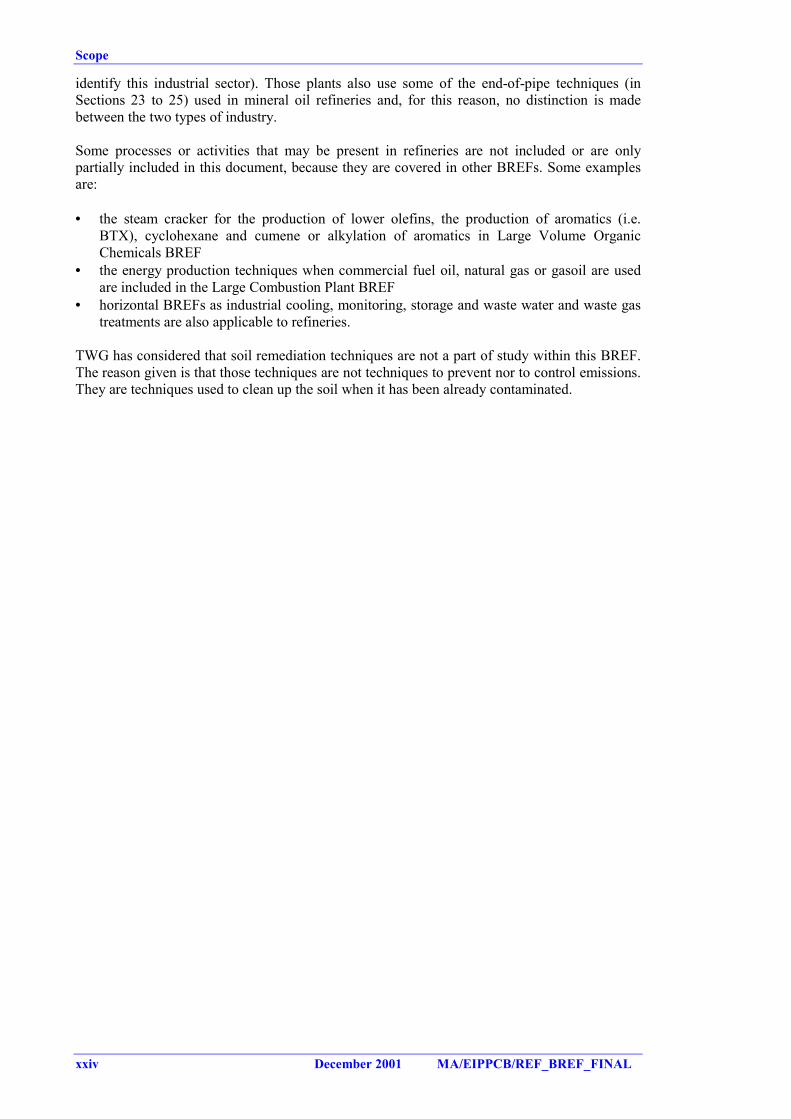
Scope
xxiv December 2001 MA/EIPPCB/REF_BREF_FINAL
identify this industrial sector). Those plants also use some of the end-of-pipe techniques (inSections 23 to 25) used in mineral oil refineries and, for this reason, no distinction is madebetween the two types of industry.
Some processes or activities that may be present in refineries are not included or are onlypartially included in this document, because they are covered in other BREFs. Some examplesare:
• the steam cracker for the production of lower olefins, the production of aromatics (i.e.BTX), cyclohexane and cumene or alkylation of aromatics in Large Volume OrganicChemicals BREF
• the energy production techniques when commercial fuel oil, natural gas or gasoil are usedare included in the Large Combustion Plant BREF
• horizontal BREFs as industrial cooling, monitoring, storage and waste water and waste gastreatments are also applicable to refineries.
TWG has considered that soil remediation techniques are not a part of study within this BREF.The reason given is that those techniques are not techniques to prevent nor to control emissions.They are techniques used to clean up the soil when it has been already contaminated.
General information Chapter 1
MA/EIPPCB/REF_BREF_FINAL December 2001 1
1 GENERAL INFORMATION
1.1 The purpose of refineries
The purpose of refining is to convert natural raw materials such as crude oil and natural gas intouseful saleable products. Crude oil and natural gas are naturally occurring hydrocarbons foundin many areas of the world in varying quantities and compositions. In refineries, they aretransformed into different products as:
• fuels for cars, trucks, aeroplanes, ships and other forms of transport• combustion fuels for the generation of heat and power for industry and households• raw materials for the petrochemical and chemical industries• speciality products such as lubricating oils, paraffins/waxes and bitumen• energy as a by-product in the form of heat (steam) and power (electricity).
In order to manufacture these products, these raw materials are processed in a number ofdifferent refining facilities. The combination of these processing units to convert crude oil andnatural gas into products, including its supporting units and facilities, is called a refinery. Themarket demand for the type of products, the available crude quality and certain requirements setby authorities influence the size, configuration and complexity of a refinery. As these factorsvary from location to location no two refineries are identical.
1.2 Refinery sector in the EU
The economic and political worldwide refining industry has undergone considerable changes.The increased effort in oil and gas exploration and production as well as cost reductionsachieved in those activities has resulted in a worldwide maintenance of the total world reserves.
Oil provides 42 % of the European Union's (EU) energy requirement, and 94 % of the fuelsrequired for transport. The health and viability of the refining industry is of critical strategicimportance to the Union for maintaining a successful and internationally competitive positionfor industry as a whole, and for providing competitively priced products to consumers.
The refining industry has suffered from a structural distillation overcapacity most of the timesince the oil crisis in 1973/1974. Only in the early 1980s, early 1990s and last years wereattractive margins achieved due to high oil prices at those times. Moreover, severe competitioncosts, environmental compliance of the refining industry and regulatory uncertainty have addedto the decrease in profitability in certain periods. This long-lasting recession led oil and gascompanies to make significant adjustments in upstream and downstream operations such as cutsin production costs, innovations in technology and organisational restructuring.
However co-operation in the form of partnerships, alliances, joint ventures or mergers betweencompanies, governments and local communities, contractors and suppliers has led to significantcost reductions. This trend is also fuelled by increased environmental awareness in society atlarge and is supported by the current process of harmonisation of legislation, particularly withinEurope. Examples of new forms of co-operation are the recent (mid-1998) downstream mergerbetween BP and Mobil which started as a partnership in refining and marketing in 1996 andsecured reportedly significant pre-tax cost savings. Recently a Total-Fina-Elf merger and anEsso-Mobil merger were concluded. A further recent example is the refining capacity exchangebetween Statoil (Mongstad-Norway) and Shell (Sola/Pernis-Netherlands).
Some European refineries have been closed in the last 20 years, but crude oil processingcapacity has increased in recent years, mainly by ‘capacity creep’ (debottlenecking,improvement in equipment reliability and longer cycles between turnarounds) to cope with thelow but steady increase in product demand of 1 - 2 % per year in Europe. Worldwide ‘capacity
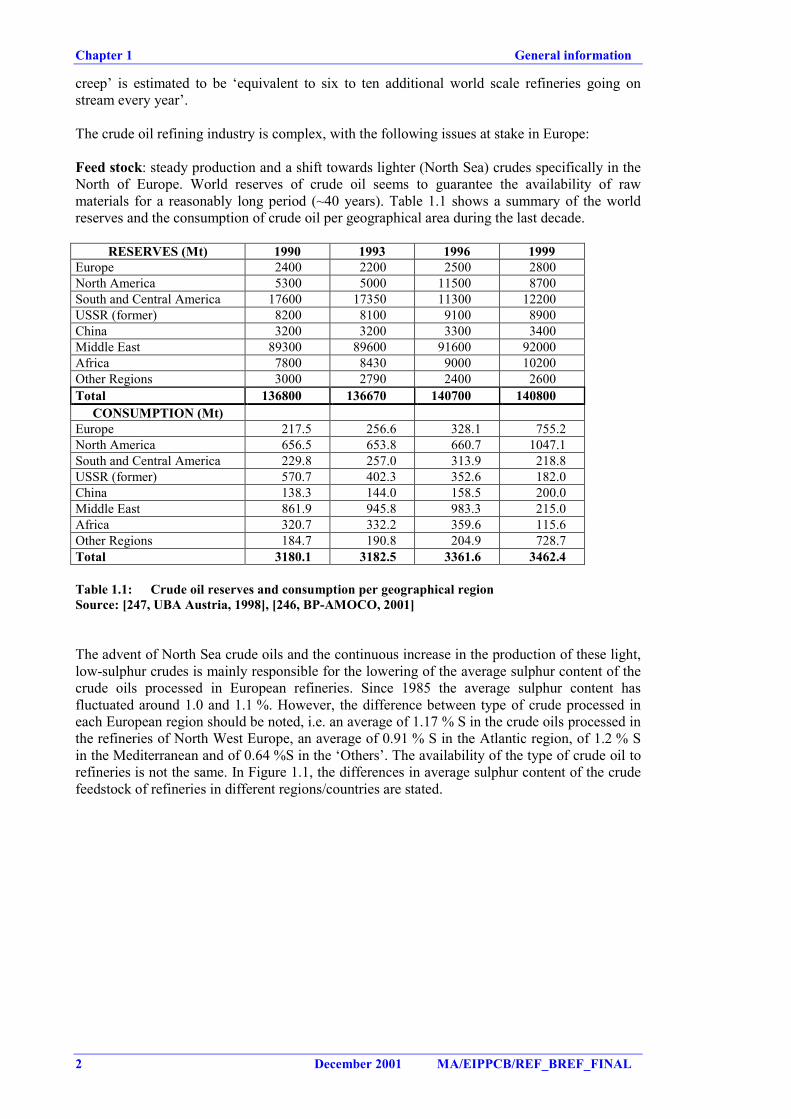
Chapter 1 General information
2 December 2001 MA/EIPPCB/REF_BREF_FINAL
creep’ is estimated to be ‘equivalent to six to ten additional world scale refineries going onstream every year’.
The crude oil refining industry is complex, with the following issues at stake in Europe:
Feed stock: steady production and a shift towards lighter (North Sea) crudes specifically in theNorth of Europe. World reserves of crude oil seems to guarantee the availability of rawmaterials for a reasonably long period (~40 years). Table 1.1 shows a summary of the worldreserves and the consumption of crude oil per geographical area during the last decade.
RESERVES (Mt) 1990 1993 1996 1999Europe 2400 2200 2500 2800North America 5300 5000 11500 8700South and Central America 17600 17350 11300 12200USSR (former) 8200 8100 9100 8900China 3200 3200 3300 3400Middle East 89300 89600 91600 92000Africa 7800 8430 9000 10200Other Regions 3000 2790 2400 2600Total 136800 136670 140700 140800
CONSUMPTION (Mt)Europe 217.5 256.6 328.1 755.2North America 656.5 653.8 660.7 1047.1South and Central America 229.8 257.0 313.9 218.8USSR (former) 570.7 402.3 352.6 182.0China 138.3 144.0 158.5 200.0Middle East 861.9 945.8 983.3 215.0Africa 320.7 332.2 359.6 115.6Other Regions 184.7 190.8 204.9 728.7Total 3180.1 3182.5 3361.6 3462.4
Table 1.1: Crude oil reserves and consumption per geographical regionSource: [247, UBA Austria, 1998], [246, BP-AMOCO, 2001]
The advent of North Sea crude oils and the continuous increase in the production of these light,low-sulphur crudes is mainly responsible for the lowering of the average sulphur content of thecrude oils processed in European refineries. Since 1985 the average sulphur content hasfluctuated around 1.0 and 1.1 %. However, the difference between type of crude processed ineach European region should be noted, i.e. an average of 1.17 % S in the crude oils processed inthe refineries of North West Europe, an average of 0.91 % S in the Atlantic region, of 1.2 % Sin the Mediterranean and of 0.64 %S in the ‘Others’. The availability of the type of crude oil torefineries is not the same. In Figure 1.1, the differences in average sulphur content of the crudefeedstock of refineries in different regions/countries are stated.
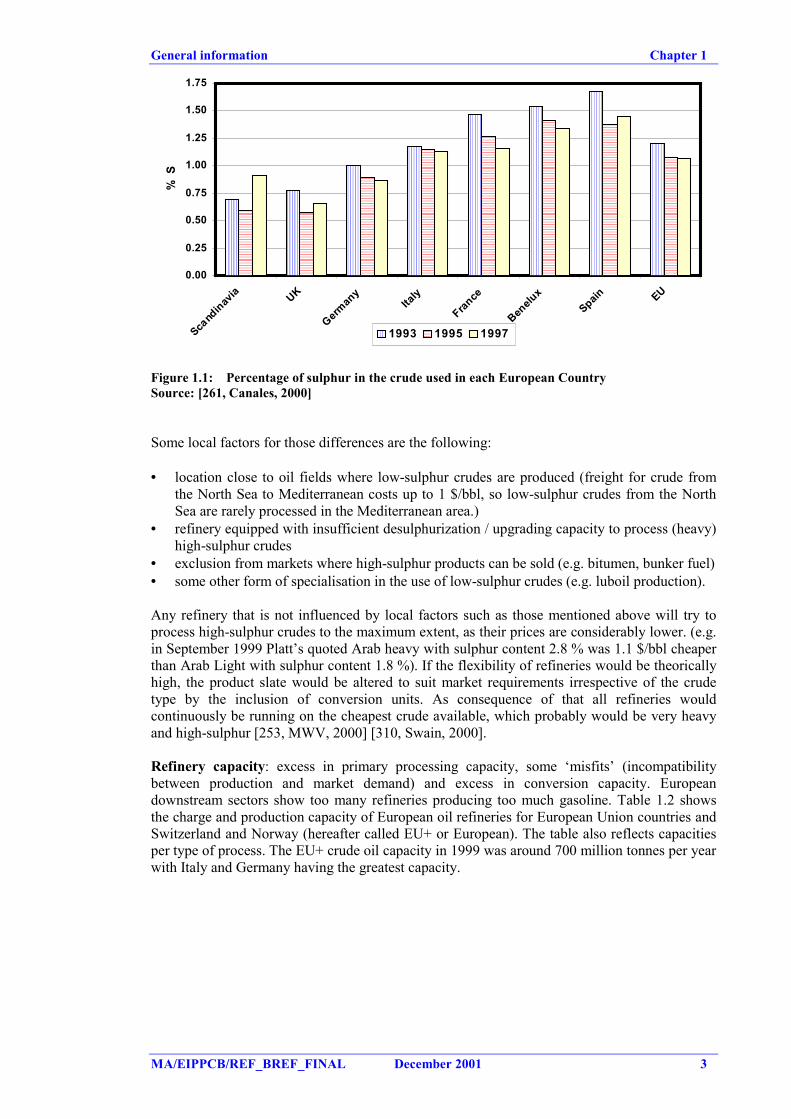
General information Chapter 1
MA/EIPPCB/REF_BREF_FINAL December 2001 3
0.00
0.25
0.50
0.75
1.00
1.25
1.50
1.75
Scand
inavia UK
German
yIta
ly
France
Benelu
xSpain EU
% S
1993 1995 1997
Figure 1.1: Percentage of sulphur in the crude used in each European CountrySource: [261, Canales, 2000]
Some local factors for those differences are the following:
• location close to oil fields where low-sulphur crudes are produced (freight for crude fromthe North Sea to Mediterranean costs up to 1 $/bbl, so low-sulphur crudes from the NorthSea are rarely processed in the Mediterranean area.)
• refinery equipped with insufficient desulphurization / upgrading capacity to process (heavy)high-sulphur crudes
• exclusion from markets where high-sulphur products can be sold (e.g. bitumen, bunker fuel)• some other form of specialisation in the use of low-sulphur crudes (e.g. luboil production).
Any refinery that is not influenced by local factors such as those mentioned above will try toprocess high-sulphur crudes to the maximum extent, as their prices are considerably lower. (e.g.in September 1999 Platt’s quoted Arab heavy with sulphur content 2.8 % was 1.1 $/bbl cheaperthan Arab Light with sulphur content 1.8 %). If the flexibility of refineries would be theoricallyhigh, the product slate would be altered to suit market requirements irrespective of the crudetype by the inclusion of conversion units. As consequence of that all refineries wouldcontinuously be running on the cheapest crude available, which probably would be very heavyand high-sulphur [253, MWV, 2000] [310, Swain, 2000].
Refinery capacity: excess in primary processing capacity, some ‘misfits’ (incompatibilitybetween production and market demand) and excess in conversion capacity. Europeandownstream sectors show too many refineries producing too much gasoline. Table 1.2 showsthe charge and production capacity of European oil refineries for European Union countries andSwitzerland and Norway (hereafter called EU+ or European). The table also reflects capacitiesper type of process. The EU+ crude oil capacity in 1999 was around 700 million tonnes per yearwith Italy and Germany having the greatest capacity.
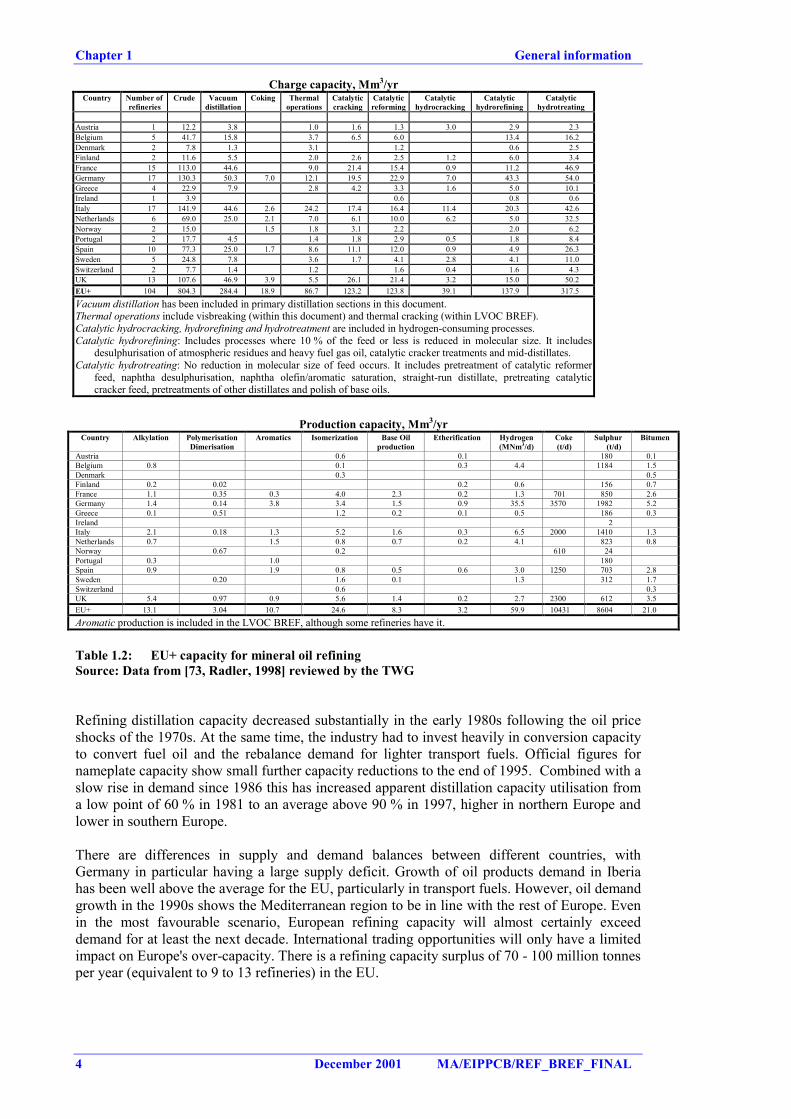
Chapter 1 General information
4 December 2001 MA/EIPPCB/REF_BREF_FINAL
Charge capacity, Mm3/yrCountry Number of
refineriesCrude Vacuum
distillationCoking Thermal
operationsCatalyticcracking
Catalyticreforming
Catalytichydrocracking
Catalytichydrorefining
Catalytichydrotreating
Austria 1 12.2 3.8 1.0 1.6 1.3 3.0 2.9 2.3Belgium 5 41.7 15.8 3.7 6.5 6.0 13.4 16.2Denmark 2 7.8 1.3 3.1 1.2 0.6 2.5Finland 2 11.6 5.5 2.0 2.6 2.5 1.2 6.0 3.4France 15 113.0 44.6 9.0 21.4 15.4 0.9 11.2 46.9Germany 17 130.3 50.3 7.0 12.1 19.5 22.9 7.0 43.3 54.0Greece 4 22.9 7.9 2.8 4.2 3.3 1.6 5.0 10.1Ireland 1 3.9 0.6 0.8 0.6Italy 17 141.9 44.6 2.6 24.2 17.4 16.4 11.4 20.3 42.6Netherlands 6 69.0 25.0 2.1 7.0 6.1 10.0 6.2 5.0 32.5Norway 2 15.0 1.5 1.8 3.1 2.2 2.0 6.2Portugal 2 17.7 4.5 1.4 1.8 2.9 0.5 1.8 8.4Spain 10 77.3 25.0 1.7 8.6 11.1 12.0 0.9 4.9 26.3Sweden 5 24.8 7.8 3.6 1.7 4.1 2.8 4.1 11.0Switzerland 2 7.7 1.4 1.2 1.6 0.4 1.6 4.3UK 13 107.6 46.9 3.9 5.5 26.1 21.4 3.2 15.0 50.2EU+ 104 804.3 284.4 18.9 86.7 123.2 123.8 39.1 137.9 317.5
Vacuum distillation has been included in primary distillation sections in this document.Thermal operations include visbreaking (within this document) and thermal cracking (within LVOC BREF).Catalytic hydrocracking, hydrorefining and hydrotreatment are included in hydrogen-consuming processes.Catalytic hydrorefining: Includes processes where 10 % of the feed or less is reduced in molecular size. It includes
desulphurisation of atmospheric residues and heavy fuel gas oil, catalytic cracker treatments and mid-distillates.Catalytic hydrotreating: No reduction in molecular size of feed occurs. It includes pretreatment of catalytic reformer
feed, naphtha desulphurisation, naphtha olefin/aromatic saturation, straight-run distillate, pretreating catalyticcracker feed, pretreatments of other distillates and polish of base oils.
Production capacity, Mm3/yrCountry Alkylation Polymerisation
DimerisationAromatics Isomerization Base Oil
productionEtherification Hydrogen
(MNm3/d)Coke(t/d)
Sulphur(t/d)
Bitumen
Austria 0.6 0.1 180 0.1Belgium 0.8 0.1 0.3 4.4 1184 1.5Denmark 0.3 0.5Finland 0.2 0.02 0.2 0.6 156 0.7France 1.1 0.35 0.3 4.0 2.3 0.2 1.3 701 850 2.6Germany 1.4 0.14 3.8 3.4 1.5 0.9 35.5 3570 1982 5.2Greece 0.1 0.51 1.2 0.2 0.1 0.5 186 0.3Ireland 2Italy 2.1 0.18 1.3 5.2 1.6 0.3 6.5 2000 1410 1.3Netherlands 0.7 1.5 0.8 0.7 0.2 4.1 823 0.8Norway 0.67 0.2 610 24Portugal 0.3 1.0 180Spain 0.9 1.9 0.8 0.5 0.6 3.0 1250 703 2.8Sweden 0.20 1.6 0.1 1.3 312 1.7Switzerland 0.6 0.3UK 5.4 0.97 0.9 5.6 1.4 0.2 2.7 2300 612 3.5EU+ 13.1 3.04 10.7 24.6 8.3 3.2 59.9 10431 8604 21.0
Aromatic production is included in the LVOC BREF, although some refineries have it.
Table 1.2: EU+ capacity for mineral oil refiningSource: Data from [73, Radler, 1998] reviewed by the TWG
Refining distillation capacity decreased substantially in the early 1980s following the oil priceshocks of the 1970s. At the same time, the industry had to invest heavily in conversion capacityto convert fuel oil and the rebalance demand for lighter transport fuels. Official figures fornameplate capacity show small further capacity reductions to the end of 1995. Combined with aslow rise in demand since 1986 this has increased apparent distillation capacity utilisation froma low point of 60 % in 1981 to an average above 90 % in 1997, higher in northern Europe andlower in southern Europe.
There are differences in supply and demand balances between different countries, withGermany in particular having a large supply deficit. Growth of oil products demand in Iberiahas been well above the average for the EU, particularly in transport fuels. However, oil demandgrowth in the 1990s shows the Mediterranean region to be in line with the rest of Europe. Evenin the most favourable scenario, European refining capacity will almost certainly exceeddemand for at least the next decade. International trading opportunities will only have a limitedimpact on Europe's over-capacity. There is a refining capacity surplus of 70 - 100 million tonnesper year (equivalent to 9 to 13 refineries) in the EU.
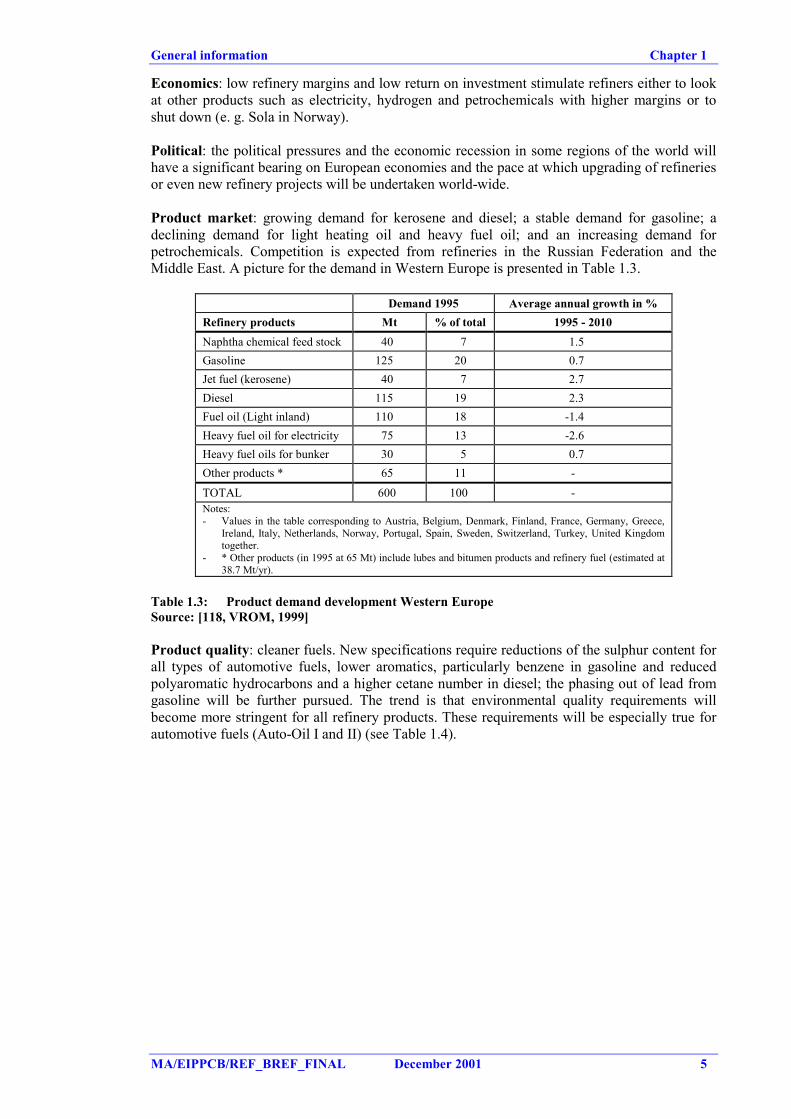
General information Chapter 1
MA/EIPPCB/REF_BREF_FINAL December 2001 5
Economics: low refinery margins and low return on investment stimulate refiners either to lookat other products such as electricity, hydrogen and petrochemicals with higher margins or toshut down (e. g. Sola in Norway).
Political: the political pressures and the economic recession in some regions of the world willhave a significant bearing on European economies and the pace at which upgrading of refineriesor even new refinery projects will be undertaken world-wide.
Product market: growing demand for kerosene and diesel; a stable demand for gasoline; adeclining demand for light heating oil and heavy fuel oil; and an increasing demand forpetrochemicals. Competition is expected from refineries in the Russian Federation and theMiddle East. A picture for the demand in Western Europe is presented in Table 1.3.
Demand 1995 Average annual growth in %Refinery products Mt % of total 1995 - 2010Naphtha chemical feed stock 40 7 1.5Gasoline 125 20 0.7Jet fuel (kerosene) 40 7 2.7Diesel 115 19 2.3Fuel oil (Light inland) 110 18 -1.4Heavy fuel oil for electricity 75 13 -2.6Heavy fuel oils for bunker 30 5 0.7Other products * 65 11 -
TOTAL 600 100 -Notes:- Values in the table corresponding to Austria, Belgium, Denmark, Finland, France, Germany, Greece,
Ireland, Italy, Netherlands, Norway, Portugal, Spain, Sweden, Switzerland, Turkey, United Kingdomtogether.
- * Other products (in 1995 at 65 Mt) include lubes and bitumen products and refinery fuel (estimated at38.7 Mt/yr).
Table 1.3: Product demand development Western EuropeSource: [118, VROM, 1999]
Product quality: cleaner fuels. New specifications require reductions of the sulphur content forall types of automotive fuels, lower aromatics, particularly benzene in gasoline and reducedpolyaromatic hydrocarbons and a higher cetane number in diesel; the phasing out of lead fromgasoline will be further pursued. The trend is that environmental quality requirements willbecome more stringent for all refinery products. These requirements will be especially true forautomotive fuels (Auto-Oil I and II) (see Table 1.4).
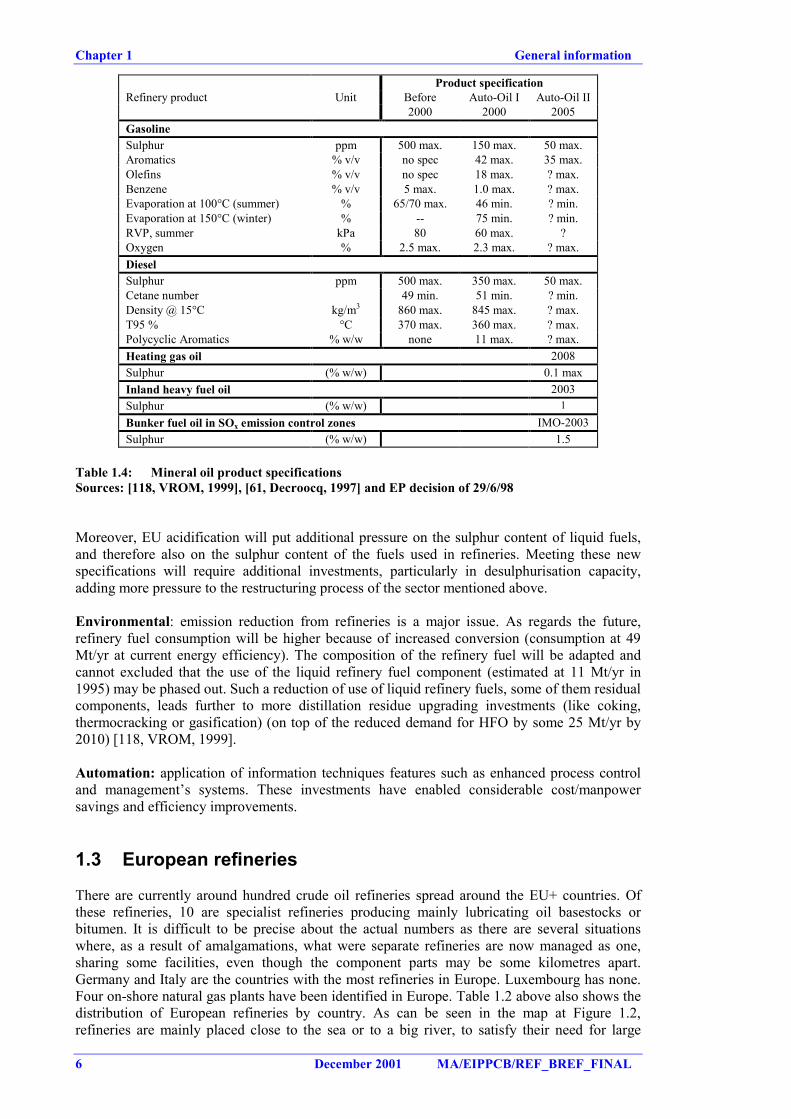
Chapter 1 General information
6 December 2001 MA/EIPPCB/REF_BREF_FINAL
Product specificationRefinery product Unit Before Auto-Oil I Auto-Oil II
2000 2000 2005GasolineSulphur ppm 500 max. 150 max. 50 max.Aromatics % v/v no spec 42 max. 35 max.Olefins % v/v no spec 18 max. ? max.Benzene % v/v 5 max. 1.0 max. ? max.Evaporation at 100°C (summer) % 65/70 max. 46 min. ? min.Evaporation at 150°C (winter) % -- 75 min. ? min.RVP, summer kPa 80 60 max. ?Oxygen % 2.5 max. 2.3 max. ? max.DieselSulphur ppm 500 max. 350 max. 50 max.Cetane number 49 min. 51 min. ? min.Density @ 15°C kg/m3 860 max. 845 max. ? max.T95 % °C 370 max. 360 max. ? max.Polycyclic Aromatics % w/w none 11 max. ? max.Heating gas oil 2008Sulphur (% w/w) 0.1 maxInland heavy fuel oil 2003Sulphur (% w/w) 1
Bunker fuel oil in SOx emission control zones IMO-2003Sulphur (% w/w) 1.5
Table 1.4: Mineral oil product specificationsSources: [118, VROM, 1999], [61, Decroocq, 1997] and EP decision of 29/6/98
Moreover, EU acidification will put additional pressure on the sulphur content of liquid fuels,and therefore also on the sulphur content of the fuels used in refineries. Meeting these newspecifications will require additional investments, particularly in desulphurisation capacity,adding more pressure to the restructuring process of the sector mentioned above.
Environmental: emission reduction from refineries is a major issue. As regards the future,refinery fuel consumption will be higher because of increased conversion (consumption at 49Mt/yr at current energy efficiency). The composition of the refinery fuel will be adapted andcannot excluded that the use of the liquid refinery fuel component (estimated at 11 Mt/yr in1995) may be phased out. Such a reduction of use of liquid refinery fuels, some of them residualcomponents, leads further to more distillation residue upgrading investments (like coking,thermocracking or gasification) (on top of the reduced demand for HFO by some 25 Mt/yr by2010) [118, VROM, 1999].
Automation: application of information techniques features such as enhanced process controland management’s systems. These investments have enabled considerable cost/manpowersavings and efficiency improvements.
1.3 European refineries
There are currently around hundred crude oil refineries spread around the EU+ countries. Ofthese refineries, 10 are specialist refineries producing mainly lubricating oil basestocks orbitumen. It is difficult to be precise about the actual numbers as there are several situationswhere, as a result of amalgamations, what were separate refineries are now managed as one,sharing some facilities, even though the component parts may be some kilometres apart.Germany and Italy are the countries with the most refineries in Europe. Luxembourg has none.Four on-shore natural gas plants have been identified in Europe. Table 1.2 above also shows thedistribution of European refineries by country. As can be seen in the map at Figure 1.2,refineries are mainly placed close to the sea or to a big river, to satisfy their need for large
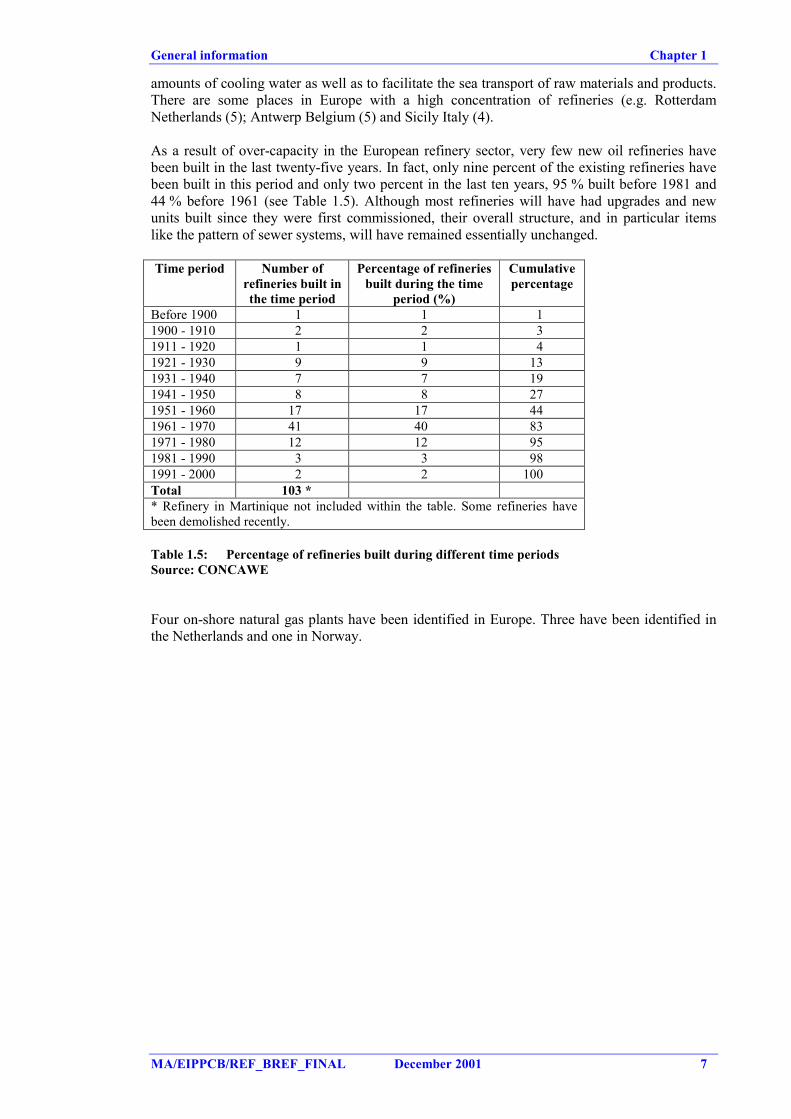
General information Chapter 1
MA/EIPPCB/REF_BREF_FINAL December 2001 7
amounts of cooling water as well as to facilitate the sea transport of raw materials and products.There are some places in Europe with a high concentration of refineries (e.g. RotterdamNetherlands (5); Antwerp Belgium (5) and Sicily Italy (4).
As a result of over-capacity in the European refinery sector, very few new oil refineries havebeen built in the last twenty-five years. In fact, only nine percent of the existing refineries havebeen built in this period and only two percent in the last ten years, 95 % built before 1981 and44 % before 1961 (see Table 1.5). Although most refineries will have had upgrades and newunits built since they were first commissioned, their overall structure, and in particular itemslike the pattern of sewer systems, will have remained essentially unchanged.
Time period Number ofrefineries built inthe time period
Percentage of refineriesbuilt during the time
period (%)
Cumulativepercentage
Before 1900 1 1 11900 - 1910 2 2 31911 - 1920 1 1 41921 - 1930 9 9 131931 - 1940 7 7 191941 - 1950 8 8 271951 - 1960 17 17 441961 - 1970 41 40 831971 - 1980 12 12 951981 - 1990 3 3 981991 - 2000 2 2 100Total 103 ** Refinery in Martinique not included within the table. Some refineries havebeen demolished recently.
Table 1.5: Percentage of refineries built during different time periodsSource: CONCAWE
Four on-shore natural gas plants have been identified in Europe. Three have been identified inthe Netherlands and one in Norway.
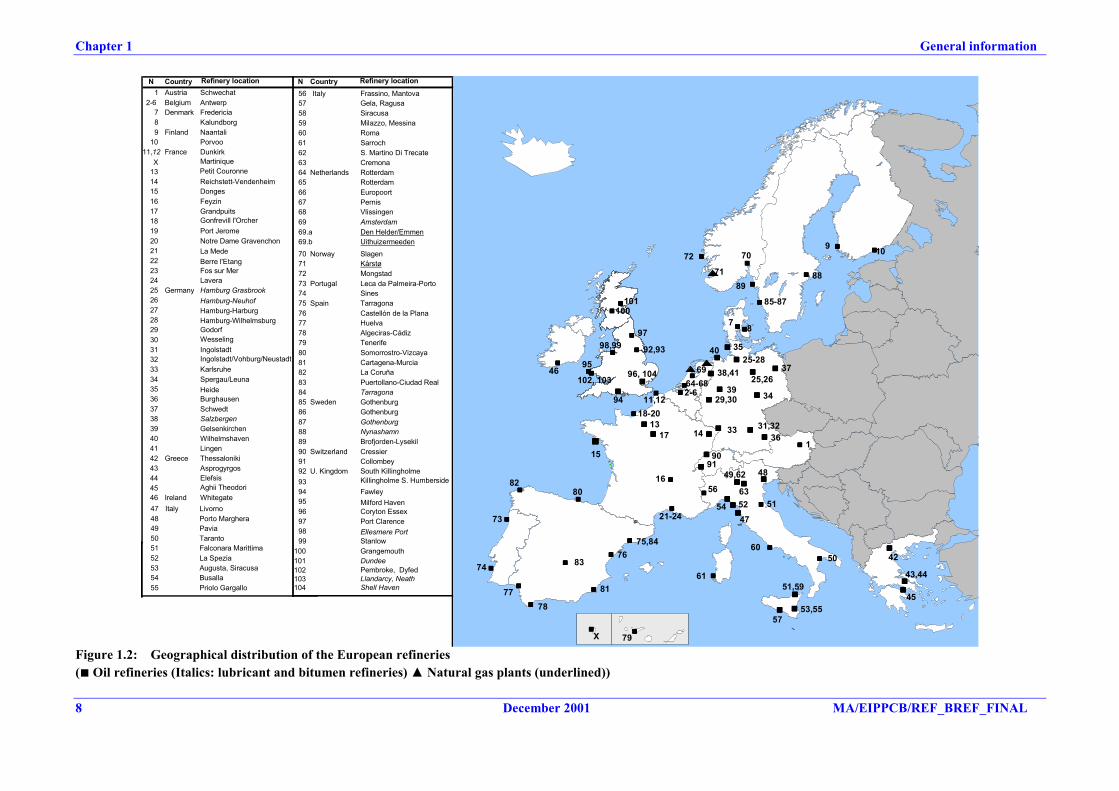
Chapter 1 General information
8 December 2001 MA/EIPPCB/REF_BREF_FINAL
N Country Refinery location N Country Refinery location1 Austria Schwechat
2-6 Belgium Antwerp7 Denmark Fredericia8 Kalundborg9 Finland Naantali
10 Porvoo
56 Frassino, Mantova
11,12 France Dunkirk
57 Gela, Ragusa
Gonfrevill l'Orcher
58 Siracusa
13
La Mede
59 Milazzo, Messina
14 Reichstett-Vendenheim
60 Roma
15 Donges
61 Sarroch
16 Feyzin
62 S. Martino Di Trecate
17 Grandpuits
63 Cremona
18
Fos sur Mer
64 Netherlands Rotterdam
19 Port Jerome
65 Rotterdam
20 Notre Dame Gravenchon
66 Europoort
21Berre l'Etang
67 Pernis
22
Petit Couronne
68 Vlissingen
23
Martinique
69 Amsterdam
24 Lavera25 Germany Hamburg Grasbrook
70 Norway Slagen71 Kårstø
26
72 Mongstad
27
Heide
73 Portugal Leca da Palmeira-Porto
28
Wesseling
74 Sines
29 Godorf
75 Spain Tarragona
30
Hamburg-Neuhof
76 Castellón de la Plana
31 Ingolstadt
77 Huelva
32
Hamburg-Harburg
78 Algeciras-Cádiz
33 Karlsruhe
79 Tenerife
34 Spergau/Leuna
80 Somorrostro-Vizcaya
35
Hamburg-Wilhelmsburg
81 Cartagena-Murcia
36 Burghausen
82 La Coruña
37 Schwedt
83 Puertollano-Ciudad Real
38 Salzbergen
84 Tarragona
39 Gelsenkirchen
85 Sweden Gothenburg
40 Wilhelmshaven
86 Gothenburg
41 Lingen
87 Gothenburg
42 Greece Thessaloniki
88 Nynashamn
43 Asprogyrgos
89 Brofjorden-Lysekil
44Aghii Theodori
90 Switzerland Cressier
45Elefsis
91 Collombey
46 Ireland Whitegate
92 U. Kingdom South Killingholme93
Ellesmere Port
94 Fawley95
Killingholme S. Humberside
96 Coryton Essex97 Port Clarence9899 Stanlow
100 Grangemouth101 Dundee102103104
Milford Haven
Pembroke, DyfedLlandarcy, NeathShell Haven
Ingolstadt/Vohburg/Neustadt
47 Italy Livorno48 Porto Marghera49 Pavia50 Taranto51 Falconara Marittima52 La Spezia53 Augusta, Siracusa54 Busalla55 Priolo Gargallo
Italy
X
76
81
����
���� 75,84
����
80����
82
����
��������
77���� 78
83
����
79
����
����
����
����
61
����
����
����
72 ����
89
����
����
2-6
1
74
73����
11,12����
���� 88
����
16 ����
21-24����
15����
����
5753,55
51,59
���� 50����60
����56
54 51����
48
33
52
14
���� 29,30
31,32����
����35
����25,26
����
����
42
43,44
����
95
����
94
����
96, 104
����18-20
46
71����
85-87
102, 103
����
98,99
9 10����
7 8����
����64-6869
����
����
101100
���� 92,93
����
����
9091
47
����
����
����
��������
63
49,62��������
����
��������
���� ����
���� 37
4025-28
38,41����
���� 39 34����
���� 36���� 17����13
����
70
����97
����
X
����45
69.a Den Helder/Emmen69.b Uithuizermeeden
Figure 1.2: Geographical distribution of the European refineries(■ Oil refineries (Italics: lubricant and bitumen refineries) ▲ Natural gas plants (underlined))
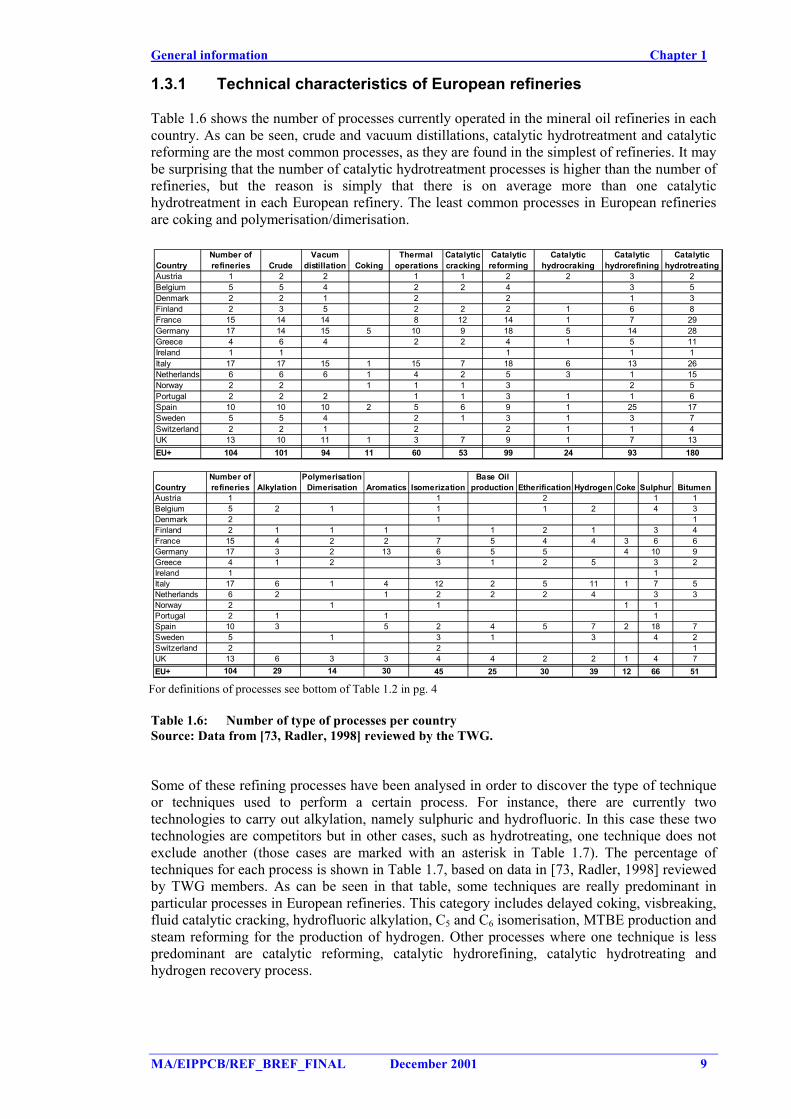
General information Chapter 1
MA/EIPPCB/REF_BREF_FINAL December 2001 9
1.3.1 Technical characteristics of European refineries
Table 1.6 shows the number of processes currently operated in the mineral oil refineries in eachcountry. As can be seen, crude and vacuum distillations, catalytic hydrotreatment and catalyticreforming are the most common processes, as they are found in the simplest of refineries. It maybe surprising that the number of catalytic hydrotreatment processes is higher than the number ofrefineries, but the reason is simply that there is on average more than one catalytichydrotreatment in each European refinery. The least common processes in European refineriesare coking and polymerisation/dimerisation.
CountryNumber of refineries Crude
Vacum distillation Coking
Thermal operations
Catalytic cracking
Catalytic reforming
Catalytic hydrocraking
Catalytic hydrorefining
Catalytic hydrotreating
Austria 1 2 2 1 1 2 2 3 2Belgium 5 5 4 2 2 4 3 5Denmark 2 2 1 2 2 1 3Finland 2 3 5 2 2 2 1 6 8France 15 14 14 8 12 14 1 7 29Germany 17 14 15 5 10 9 18 5 14 28Greece 4 6 4 2 2 4 1 5 11Ireland 1 1 1 1 1Italy 17 17 15 1 15 7 18 6 13 26Netherlands 6 6 6 1 4 2 5 3 1 15Norway 2 2 1 1 1 3 2 5Portugal 2 2 2 1 1 3 1 1 6Spain 10 10 10 2 5 6 9 1 25 17Sweden 5 5 4 2 1 3 1 3 7Switzerland 2 2 1 2 2 1 1 4UK 13 10 11 1 3 7 9 1 7 13EU+ 104 101 94 11 60 53 99 24 93 180
CountryNumber of refineries Alkylation
Polymerisation Dimerisation Aromatics Isomerization
Base Oil production Etherification Hydrogen Coke Sulphur Bitumen
Austria 1 1 2 1 1Belgium 5 2 1 1 1 2 4 3Denmark 2 1 1Finland 2 1 1 1 1 2 1 3 4France 15 4 2 2 7 5 4 4 3 6 6Germany 17 3 2 13 6 5 5 4 10 9Greece 4 1 2 3 1 2 5 3 2Ireland 1 1Italy 17 6 1 4 12 2 5 11 1 7 5Netherlands 6 2 1 2 2 2 4 3 3Norway 2 1 1 1 1Portugal 2 1 1 1Spain 10 3 5 2 4 5 7 2 18 7Sweden 5 1 3 1 3 4 2Switzerland 2 2 1UK 13 6 3 3 4 4 2 2 1 4 7EU+ 104 29 14 30 45 25 30 39 12 66 51
For definitions of processes see bottom of Table 1.2 in pg. 4
Table 1.6: Number of type of processes per countrySource: Data from [73, Radler, 1998] reviewed by the TWG.
Some of these refining processes have been analysed in order to discover the type of techniqueor techniques used to perform a certain process. For instance, there are currently twotechnologies to carry out alkylation, namely sulphuric and hydrofluoric. In this case these twotechnologies are competitors but in other cases, such as hydrotreating, one technique does notexclude another (those cases are marked with an asterisk in Table 1.7). The percentage oftechniques for each process is shown in Table 1.7, based on data in [73, Radler, 1998] reviewedby TWG members. As can be seen in that table, some techniques are really predominant inparticular processes in European refineries. This category includes delayed coking, visbreaking,fluid catalytic cracking, hydrofluoric alkylation, C5 and C6 isomerisation, MTBE production andsteam reforming for the production of hydrogen. Other processes where one technique is lesspredominant are catalytic reforming, catalytic hydrorefining, catalytic hydrotreating andhydrogen recovery process.
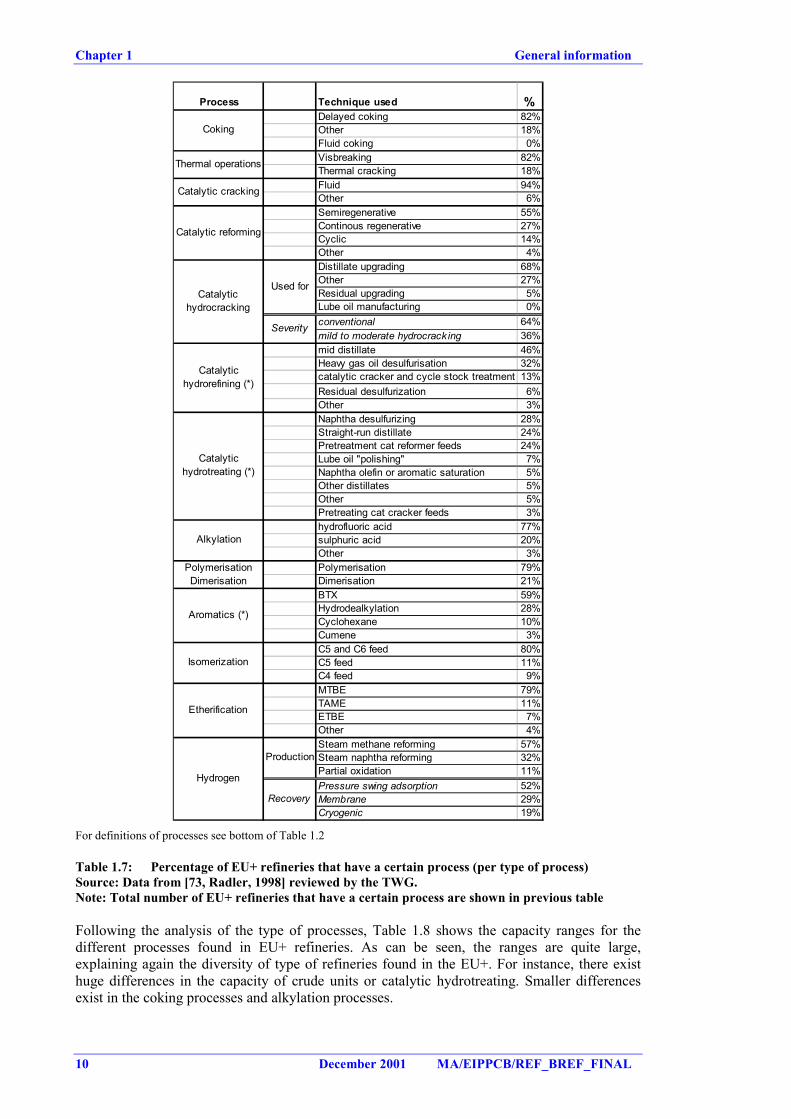
Chapter 1 General information
10 December 2001 MA/EIPPCB/REF_BREF_FINAL
Process Technique used %Delayed coking 82%Other 18%Fluid coking 0%Visbreaking 82%Thermal cracking 18%Fluid 94%Other 6%Semiregenerative 55%Continous regenerative 27%Cyclic 14%Other 4%Distillate upgrading 68%Other 27%Residual upgrading 5%Lube oil manufacturing 0%conventional 64%mild to moderate hydrocrack ing 36%mid distillate 46%Heavy gas oil desulfurisation 32%catalytic cracker and cycle stock treatment 13%Residual desulfurization 6%Other 3%Naphtha desulfurizing 28%Straight-run distillate 24%Pretreatment cat reformer feeds 24%Lube oil "polishing" 7%Naphtha olefin or aromatic saturation 5%Other distillates 5%Other 5%Pretreating cat cracker feeds 3%hydrofluoric acid 77%sulphuric acid 20%Other 3%Polymerisation 79%Dimerisation 21%BTX 59%Hydrodealkylation 28%Cyclohexane 10%Cumene 3%C5 and C6 feed 80%C5 feed 11%C4 feed 9%MTBE 79%TAME 11%ETBE 7%Other 4%Steam methane reforming 57%Steam naphtha reforming 32%Partial oxidation 11%Pressure swing adsorption 52%Membrane 29%Cryogenic 19%
Production
Catalytic hydrotreating (*)
Aromatics (*)
Polymerisation Dimerisation
Alkylation
Used for
Severity
Recovery
Hydrogen
Coking
Thermal operations
Catalytic cracking
Catalytic reforming
Catalytic hydrocracking
Catalytic hydrorefining (*)
Isomerization
Etherification
For definitions of processes see bottom of Table 1.2
Table 1.7: Percentage of EU+ refineries that have a certain process (per type of process)Source: Data from [73, Radler, 1998] reviewed by the TWG.Note: Total number of EU+ refineries that have a certain process are shown in previous table
Following the analysis of the type of processes, Table 1.8 shows the capacity ranges for thedifferent processes found in EU+ refineries. As can be seen, the ranges are quite large,explaining again the diversity of type of refineries found in the EU+. For instance, there existhuge differences in the capacity of crude units or catalytic hydrotreating. Smaller differencesexist in the coking processes and alkylation processes.
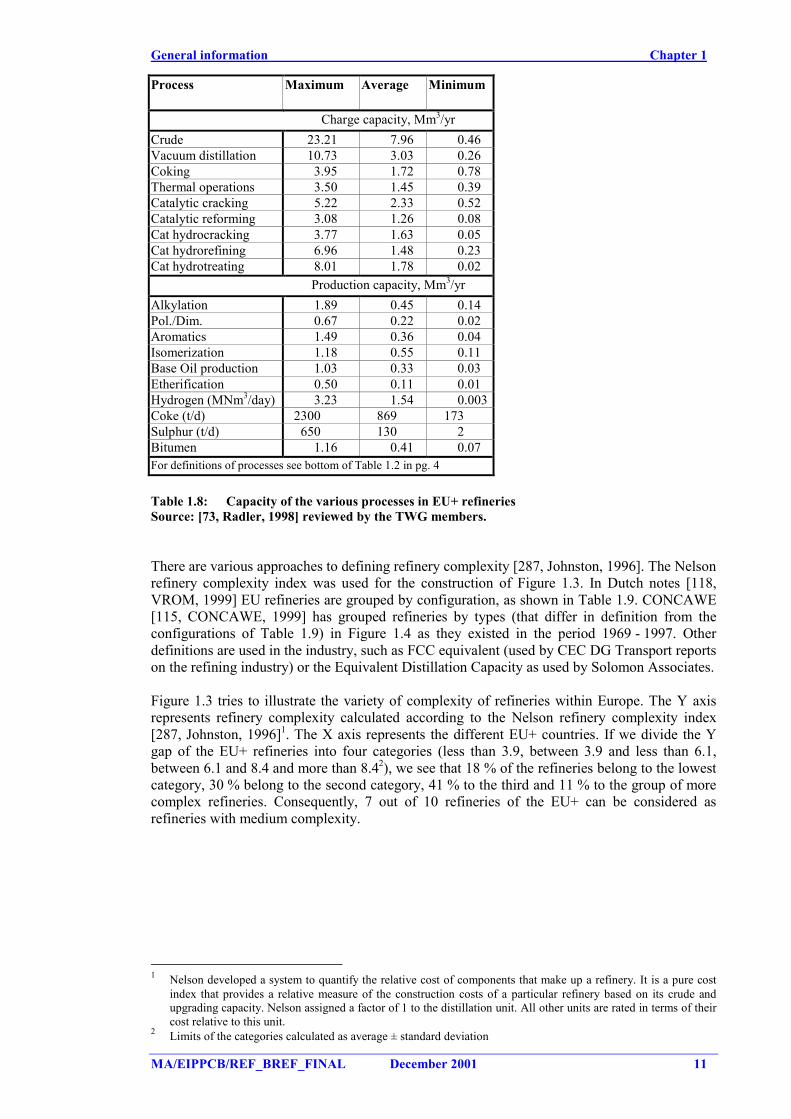
General information Chapter 1
MA/EIPPCB/REF_BREF_FINAL December 2001 11
Process Maximum Average Minimum
Charge capacity, Mm3/yrCrude 23.21 7.96 0.46Vacuum distillation 10.73 3.03 0.26Coking 3.95 1.72 0.78Thermal operations 3.50 1.45 0.39Catalytic cracking 5.22 2.33 0.52Catalytic reforming 3.08 1.26 0.08Cat hydrocracking 3.77 1.63 0.05Cat hydrorefining 6.96 1.48 0.23Cat hydrotreating 8.01 1.78 0.02
Production capacity, Mm3/yrAlkylation 1.89 0.45 0.14Pol./Dim. 0.67 0.22 0.02Aromatics 1.49 0.36 0.04Isomerization 1.18 0.55 0.11Base Oil production 1.03 0.33 0.03Etherification 0.50 0.11 0.01Hydrogen (MNm3/day) 3.23 1.54 0.003Coke (t/d) 2300 869 173Sulphur (t/d) 650 130 2Bitumen 1.16 0.41 0.07For definitions of processes see bottom of Table 1.2 in pg. 4
Table 1.8: Capacity of the various processes in EU+ refineriesSource: [73, Radler, 1998] reviewed by the TWG members.
There are various approaches to defining refinery complexity [287, Johnston, 1996]. The Nelsonrefinery complexity index was used for the construction of Figure 1.3. In Dutch notes [118,VROM, 1999] EU refineries are grouped by configuration, as shown in Table 1.9. CONCAWE[115, CONCAWE, 1999] has grouped refineries by types (that differ in definition from theconfigurations of Table 1.9) in Figure 1.4 as they existed in the period 1969 - 1997. Otherdefinitions are used in the industry, such as FCC equivalent (used by CEC DG Transport reportson the refining industry) or the Equivalent Distillation Capacity as used by Solomon Associates.
Figure 1.3 tries to illustrate the variety of complexity of refineries within Europe. The Y axisrepresents refinery complexity calculated according to the Nelson refinery complexity index[287, Johnston, 1996]1. The X axis represents the different EU+ countries. If we divide the Ygap of the EU+ refineries into four categories (less than 3.9, between 3.9 and less than 6.1,between 6.1 and 8.4 and more than 8.42), we see that 18 % of the refineries belong to the lowestcategory, 30 % belong to the second category, 41 % to the third and 11 % to the group of morecomplex refineries. Consequently, 7 out of 10 refineries of the EU+ can be considered asrefineries with medium complexity.
1 Nelson developed a system to quantify the relative cost of components that make up a refinery. It is a pure cost
index that provides a relative measure of the construction costs of a particular refinery based on its crude andupgrading capacity. Nelson assigned a factor of 1 to the distillation unit. All other units are rated in terms of theircost relative to this unit.
2 Limits of the categories calculated as average ± standard deviation
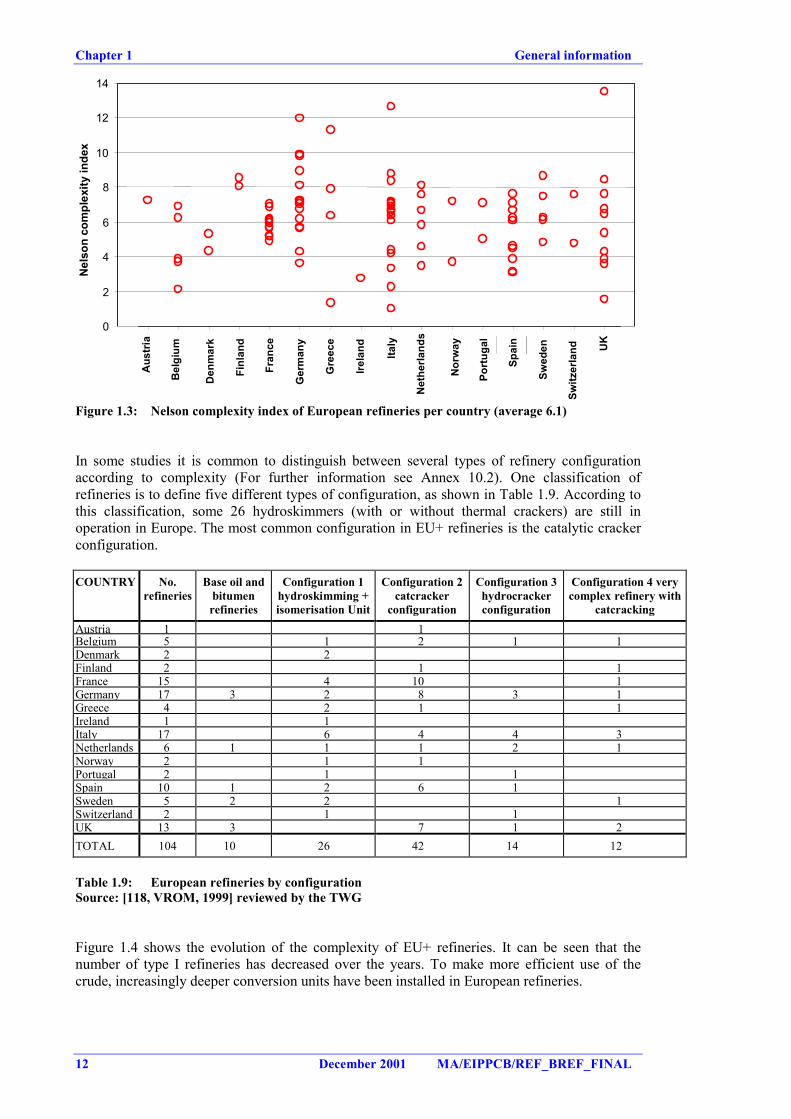
Chapter 1 General information
12 December 2001 MA/EIPPCB/REF_BREF_FINAL
0
2
4
6
8
10
12
14
1 2 3 4 5 6 7 8 9 10 11 12 13
Nel
son
com
plex
ity in
dex
Aus
tria
Fran
ce
Bel
gium
Den
mar
k
Finl
and
Ger
man
y
Gre
ece
Italy
Irela
nd
Net
herla
nds
Norw
ay
Switz
erla
nd
Portu
gal
Spai
n
Swed
en UK
Figure 1.3: Nelson complexity index of European refineries per country (average 6.1)
In some studies it is common to distinguish between several types of refinery configurationaccording to complexity (For further information see Annex 10.2). One classification ofrefineries is to define five different types of configuration, as shown in Table 1.9. According tothis classification, some 26 hydroskimmers (with or without thermal crackers) are still inoperation in Europe. The most common configuration in EU+ refineries is the catalytic crackerconfiguration.
COUNTRY No.refineries
Base oil andbitumenrefineries
Configuration 1hydroskimming +isomerisation Unit
Configuration 2catcracker
configuration
Configuration 3hydrocrackerconfiguration
Configuration 4 verycomplex refinery with
catcrackingAustria 1 1Belgium 5 1 2 1 1Denmark 2 2Finland 2 1 1France 15 4 10 1Germany 17 3 2 8 3 1Greece 4 2 1 1Ireland 1 1Italy 17 6 4 4 3Netherlands 6 1 1 1 2 1Norway 2 1 1Portugal 2 1 1Spain 10 1 2 6 1Sweden 5 2 2 1Switzerland 2 1 1UK 13 3 7 1 2TOTAL 104 10 26 42 14 12
Table 1.9: European refineries by configurationSource: [118, VROM, 1999] reviewed by the TWG
Figure 1.4 shows the evolution of the complexity of EU+ refineries. It can be seen that thenumber of type I refineries has decreased over the years. To make more efficient use of thecrude, increasingly deeper conversion units have been installed in European refineries.
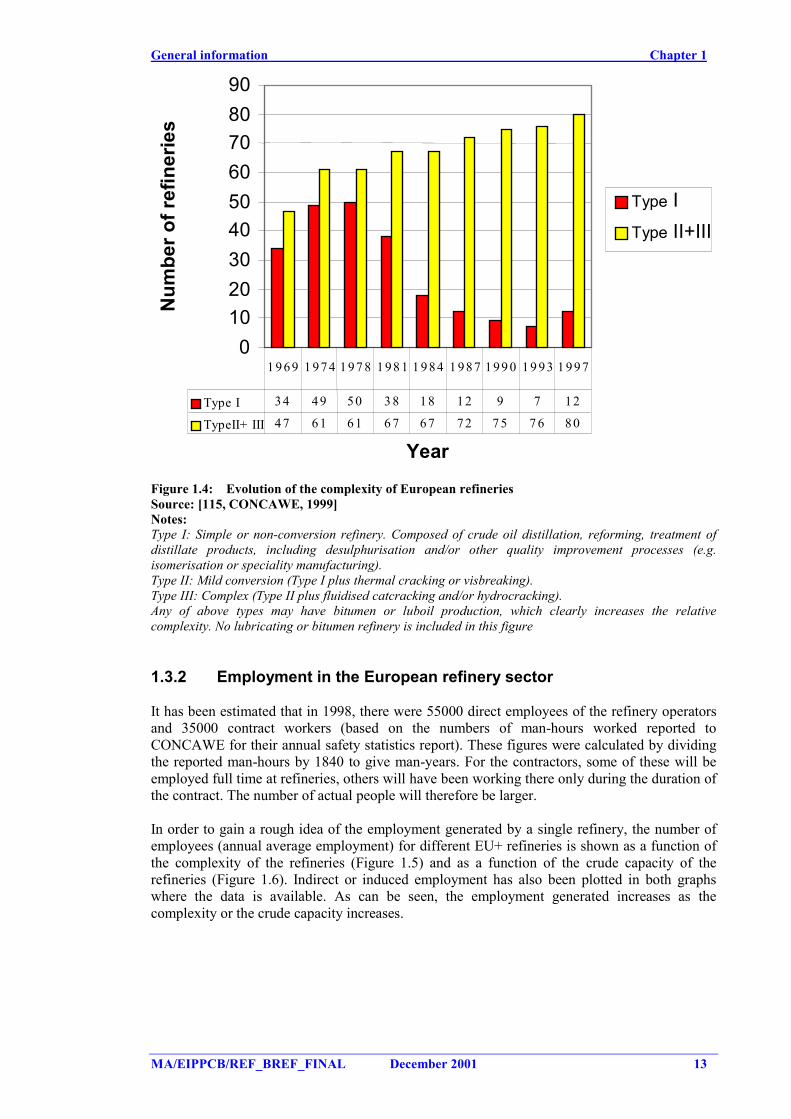
General information Chapter 1
MA/EIPPCB/REF_BREF_FINAL December 2001 13
0102030405060708090
Year
Num
ber o
f ref
iner
ies
Type IType II+III
Type I 34 49 50 3 8 18 12 9 7 12
TypeII+ III 47 61 61 6 7 67 72 7 5 7 6 80
1 969 1 974 197 8 198 1 1 984 1 987 199 0 19 93 1 997
Figure 1.4: Evolution of the complexity of European refineriesSource: [115, CONCAWE, 1999]Notes:Type I: Simple or non-conversion refinery. Composed of crude oil distillation, reforming, treatment ofdistillate products, including desulphurisation and/or other quality improvement processes (e.g.isomerisation or speciality manufacturing).Type II: Mild conversion (Type I plus thermal cracking or visbreaking).Type III: Complex (Type II plus fluidised catcracking and/or hydrocracking).Any of above types may have bitumen or luboil production, which clearly increases the relativecomplexity. No lubricating or bitumen refinery is included in this figure
1.3.2 Employment in the European refinery sector
It has been estimated that in 1998, there were 55000 direct employees of the refinery operatorsand 35000 contract workers (based on the numbers of man-hours worked reported toCONCAWE for their annual safety statistics report). These figures were calculated by dividingthe reported man-hours by 1840 to give man-years. For the contractors, some of these will beemployed full time at refineries, others will have been working there only during the duration ofthe contract. The number of actual people will therefore be larger.
In order to gain a rough idea of the employment generated by a single refinery, the number ofemployees (annual average employment) for different EU+ refineries is shown as a function ofthe complexity of the refineries (Figure 1.5) and as a function of the crude capacity of therefineries (Figure 1.6). Indirect or induced employment has also been plotted in both graphswhere the data is available. As can be seen, the employment generated increases as thecomplexity or the crude capacity increases.
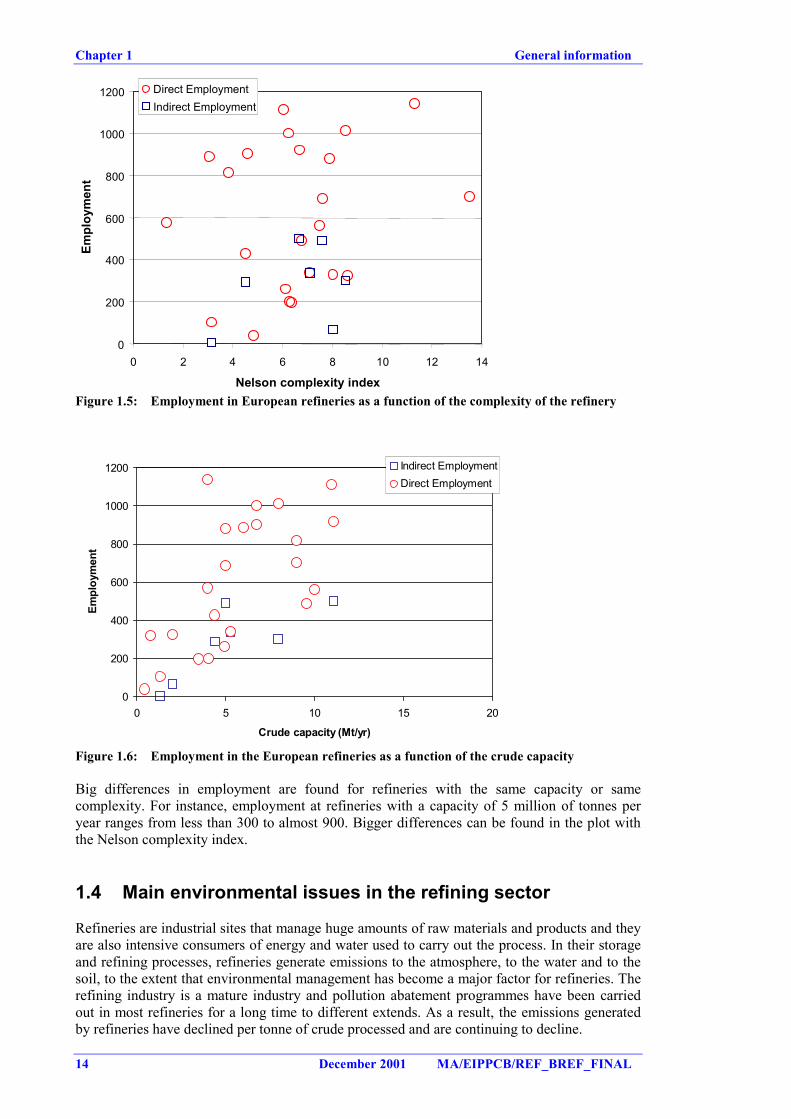
Chapter 1 General information
14 December 2001 MA/EIPPCB/REF_BREF_FINAL
0
200
400
600
800
1000
1200
0 2 4 6 8 10 12 14
Nelson complexity index
Empl
oym
ent
Direct EmploymentIndirect Employment
Figure 1.5: Employment in European refineries as a function of the complexity of the refinery
0
200
400
600
800
1000
1200
0 5 10 15 20
Crude capacity (Mt/yr)
Empl
oym
ent
Indirect EmploymentDirect Employment
Figure 1.6: Employment in the European refineries as a function of the crude capacity
Big differences in employment are found for refineries with the same capacity or samecomplexity. For instance, employment at refineries with a capacity of 5 million of tonnes peryear ranges from less than 300 to almost 900. Bigger differences can be found in the plot withthe Nelson complexity index.
1.4 Main environmental issues in the refining sector
Refineries are industrial sites that manage huge amounts of raw materials and products and theyare also intensive consumers of energy and water used to carry out the process. In their storageand refining processes, refineries generate emissions to the atmosphere, to the water and to thesoil, to the extent that environmental management has become a major factor for refineries. Therefining industry is a mature industry and pollution abatement programmes have been carriedout in most refineries for a long time to different extends. As a result, the emissions generatedby refineries have declined per tonne of crude processed and are continuing to decline.
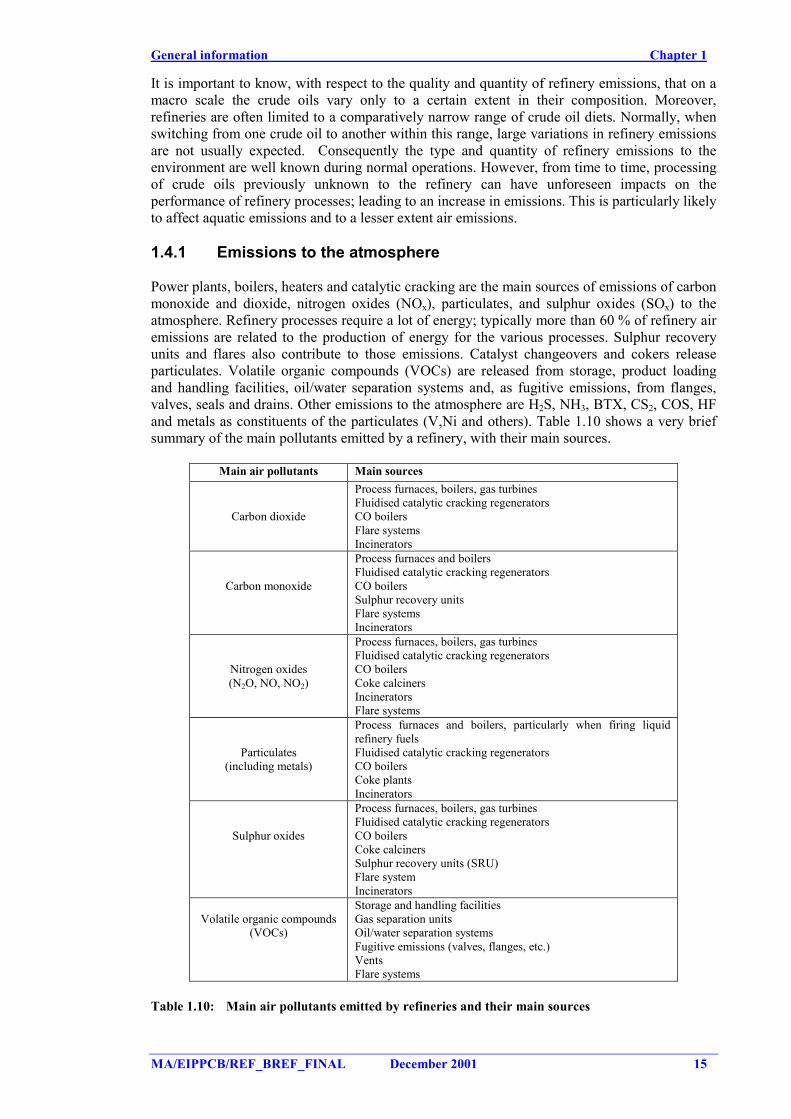
General information Chapter 1
MA/EIPPCB/REF_BREF_FINAL December 2001 15
It is important to know, with respect to the quality and quantity of refinery emissions, that on amacro scale the crude oils vary only to a certain extent in their composition. Moreover,refineries are often limited to a comparatively narrow range of crude oil diets. Normally, whenswitching from one crude oil to another within this range, large variations in refinery emissionsare not usually expected. Consequently the type and quantity of refinery emissions to theenvironment are well known during normal operations. However, from time to time, processingof crude oils previously unknown to the refinery can have unforeseen impacts on theperformance of refinery processes; leading to an increase in emissions. This is particularly likelyto affect aquatic emissions and to a lesser extent air emissions.
1.4.1 Emissions to the atmosphere
Power plants, boilers, heaters and catalytic cracking are the main sources of emissions of carbonmonoxide and dioxide, nitrogen oxides (NOx), particulates, and sulphur oxides (SOx) to theatmosphere. Refinery processes require a lot of energy; typically more than 60 % of refinery airemissions are related to the production of energy for the various processes. Sulphur recoveryunits and flares also contribute to those emissions. Catalyst changeovers and cokers releaseparticulates. Volatile organic compounds (VOCs) are released from storage, product loadingand handling facilities, oil/water separation systems and, as fugitive emissions, from flanges,valves, seals and drains. Other emissions to the atmosphere are H2S, NH3, BTX, CS2, COS, HFand metals as constituents of the particulates (V,Ni and others). Table 1.10 shows a very briefsummary of the main pollutants emitted by a refinery, with their main sources.
Main air pollutants Main sources
Carbon dioxide
Process furnaces, boilers, gas turbinesFluidised catalytic cracking regeneratorsCO boilersFlare systemsIncinerators
Carbon monoxide
Process furnaces and boilersFluidised catalytic cracking regeneratorsCO boilersSulphur recovery unitsFlare systemsIncinerators
Nitrogen oxides(N2O, NO, NO2)
Process furnaces, boilers, gas turbinesFluidised catalytic cracking regeneratorsCO boilersCoke calcinersIncineratorsFlare systems
Particulates(including metals)
Process furnaces and boilers, particularly when firing liquidrefinery fuelsFluidised catalytic cracking regeneratorsCO boilersCoke plantsIncinerators
Sulphur oxides
Process furnaces, boilers, gas turbinesFluidised catalytic cracking regeneratorsCO boilersCoke calcinersSulphur recovery units (SRU)Flare systemIncinerators
Volatile organic compounds(VOCs)
Storage and handling facilitiesGas separation unitsOil/water separation systemsFugitive emissions (valves, flanges, etc.)VentsFlare systems
Table 1.10: Main air pollutants emitted by refineries and their main sources
Chapter 1 General information
16 December 2001 MA/EIPPCB/REF_BREF_FINAL
Carbon dioxide (CO2) is the greenhouse gas which receives most attention in the debate aboutglobal climate change. The main source of CO2 emissions is the production of energy. Since thefirst oil crisis in 1973, refineries have made a concerted effort to enhance energy efficiency.Despite these energy conservation measures, refinery energy demand has increased due totightened product specifications and a shift over the years from producing heavy fuel oils totransport fuels.
Carbon monoxide (CO) always appears as an intermediate product of the combustion processesand in particular in understoichiometric combustion conditions. However, the relevance of COreleases from refineries is not very high compared to CO2.
Oxides of nitrogen (NOx), when emitted to the air, can combine with water and form acomponent of ‘acid rain’. Further, NOx in combination with volatile organic compounds andsunlight, can lead to the formation of ground-level ozone. The source of NOx is mainly thecombustion processes; during the combustion of fuel, nitrogen (mainly originating from thecombustion air itself) is transformed to a mixture of NO2 and NO. Combustion conditions playan important role here. N2O (laughing gas) is a powerful greenhouse gas that contributes to thestratospheric ozone depletion.
Particulate emissions have become a focus of attention because of their potential adverse healtheffects. Particulate emissions are caused by combustion of fuel oils, especially when there issub-optimal combustion. Another source is the catcracker.
Sulphur oxides (SOx), when emitted to the air, can combine with water and form a componentof ‘acid rain’. The main source of SOx is the production of energy; during combustion, thesulphur in the fuel is transformed to a mixture of SO2 and SO3. Another source, typicallysmaller, is the flue gas from the sulphur recovery units. There is a direct relation between thesulphur in the feed to a combustion process and the sulphur oxides in its flue gas. Generallyspeaking the sulphur content of the refinery fuel pool is a careful balance between energyrequired, the type of crude processed, the emission limits and economic optimisations.
Volatile organic carbons (VOC), as mentioned above, can react with NOx in the presence ofsunlight to form low-level atmospheric ozone. Furthermore, emissions of VOC can give rise toodour problems, which may result in complaints from nearby residents. The source of VOCemissions is the evaporation and leakage of hydrocarbon fractions during storage anddistribution. Hydrocarbons may also be emitted during non-optimal combustion conditions, butthese give only a small contribution.
Given the progress that refineries have made in the abatement of sulphur emissions to air, thefocus has started to shift towards VOC (including odour), particulates (size and composition)and NOx, as it has in the environmental debate generally. When the carbon dioxide emissionsdebate gathers momentum, it will also strongly affect refineries.
1.4.2 Emissions to water
Water is used intensively in a refinery as process water and for cooling purposes. Its usecontaminates the water with oil products mainly increasing the oxygen demand of the effluent.Refineries discharge waste water which originates from:
• Process water, steam and wash water. These waters have been in contact with the processfluids, and apart from oil, will also have taken up hydrogen sulphide (H2S), ammonia (NH3)and phenols. The more severe the conversion processes, the more H2S and NH3 are taken upby the process water. The process water is treated in several, well-known steps beforedischarge to the environment.
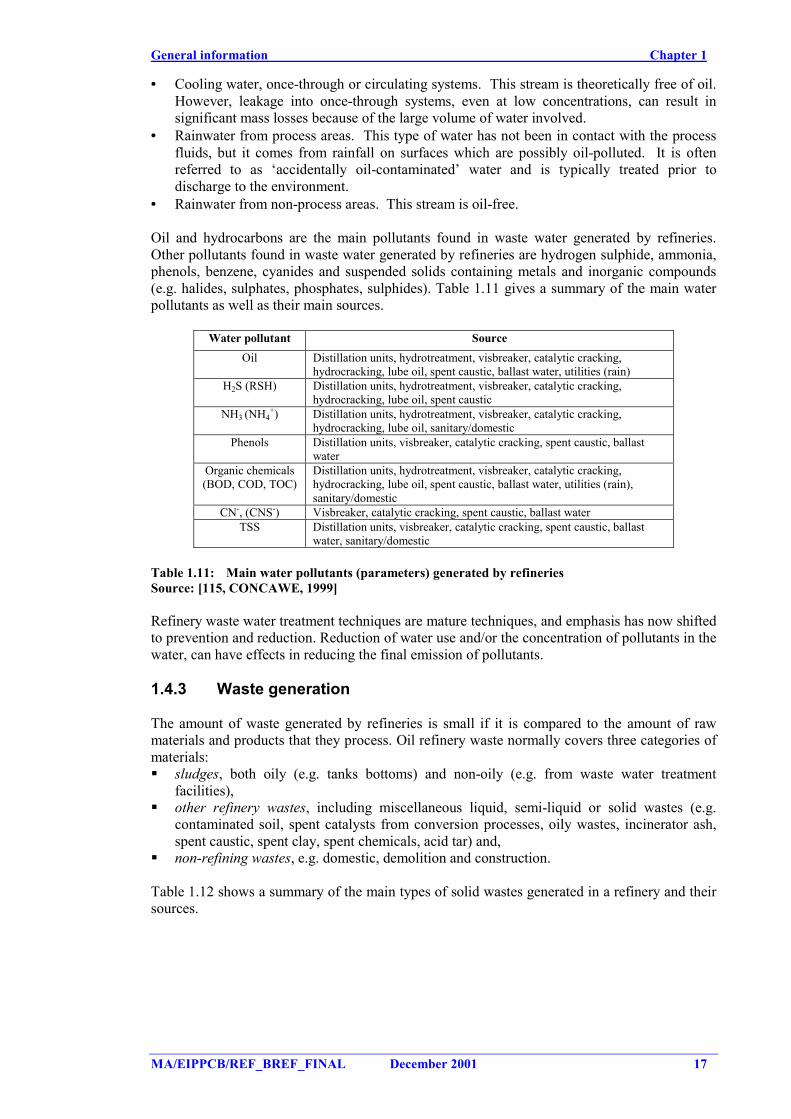
General information Chapter 1
MA/EIPPCB/REF_BREF_FINAL December 2001 17
• Cooling water, once-through or circulating systems. This stream is theoretically free of oil.However, leakage into once-through systems, even at low concentrations, can result insignificant mass losses because of the large volume of water involved.
• Rainwater from process areas. This type of water has not been in contact with the processfluids, but it comes from rainfall on surfaces which are possibly oil-polluted. It is oftenreferred to as ‘accidentally oil-contaminated’ water and is typically treated prior todischarge to the environment.
• Rainwater from non-process areas. This stream is oil-free.
Oil and hydrocarbons are the main pollutants found in waste water generated by refineries.Other pollutants found in waste water generated by refineries are hydrogen sulphide, ammonia,phenols, benzene, cyanides and suspended solids containing metals and inorganic compounds(e.g. halides, sulphates, phosphates, sulphides). Table 1.11 gives a summary of the main waterpollutants as well as their main sources.
Water pollutant SourceOil Distillation units, hydrotreatment, visbreaker, catalytic cracking,
hydrocracking, lube oil, spent caustic, ballast water, utilities (rain)H2S (RSH) Distillation units, hydrotreatment, visbreaker, catalytic cracking,
hydrocracking, lube oil, spent causticNH3 (NH4
+) Distillation units, hydrotreatment, visbreaker, catalytic cracking,hydrocracking, lube oil, sanitary/domestic
Phenols Distillation units, visbreaker, catalytic cracking, spent caustic, ballastwater
Organic chemicals(BOD, COD, TOC)
Distillation units, hydrotreatment, visbreaker, catalytic cracking,hydrocracking, lube oil, spent caustic, ballast water, utilities (rain),sanitary/domestic
CN-, (CNS-) Visbreaker, catalytic cracking, spent caustic, ballast waterTSS Distillation units, visbreaker, catalytic cracking, spent caustic, ballast
water, sanitary/domestic
Table 1.11: Main water pollutants (parameters) generated by refineriesSource: [115, CONCAWE, 1999]
Refinery waste water treatment techniques are mature techniques, and emphasis has now shiftedto prevention and reduction. Reduction of water use and/or the concentration of pollutants in thewater, can have effects in reducing the final emission of pollutants.
1.4.3 Waste generation
The amount of waste generated by refineries is small if it is compared to the amount of rawmaterials and products that they process. Oil refinery waste normally covers three categories ofmaterials:� sludges, both oily (e.g. tanks bottoms) and non-oily (e.g. from waste water treatment
facilities),� other refinery wastes, including miscellaneous liquid, semi-liquid or solid wastes (e.g.
contaminated soil, spent catalysts from conversion processes, oily wastes, incinerator ash,spent caustic, spent clay, spent chemicals, acid tar) and,
� non-refining wastes, e.g. domestic, demolition and construction.
Table 1.12 shows a summary of the main types of solid wastes generated in a refinery and theirsources.
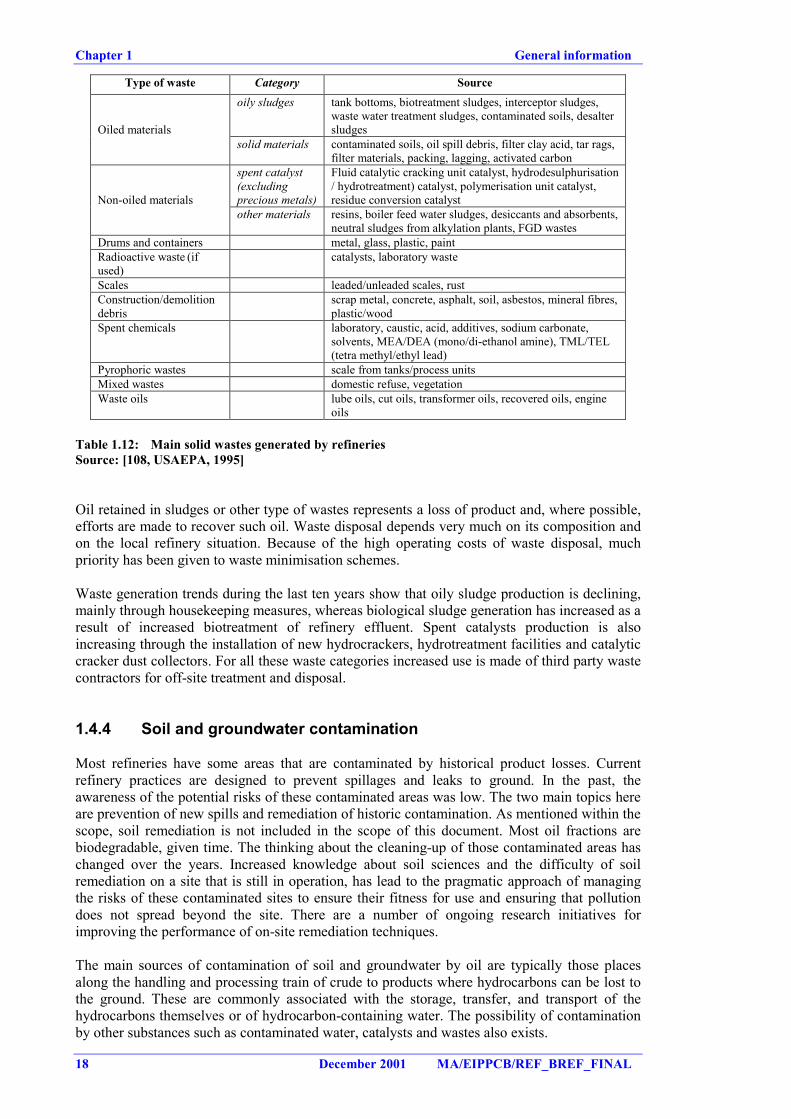
Chapter 1 General information
18 December 2001 MA/EIPPCB/REF_BREF_FINAL
Type of waste Category Sourceoily sludges tank bottoms, biotreatment sludges, interceptor sludges,
waste water treatment sludges, contaminated soils, desaltersludgesOiled materials
solid materials contaminated soils, oil spill debris, filter clay acid, tar rags,filter materials, packing, lagging, activated carbon
spent catalyst(excludingprecious metals)
Fluid catalytic cracking unit catalyst, hydrodesulphurisation/ hydrotreatment) catalyst, polymerisation unit catalyst,residue conversion catalystNon-oiled materials
other materials resins, boiler feed water sludges, desiccants and absorbents,neutral sludges from alkylation plants, FGD wastes
Drums and containers metal, glass, plastic, paintRadioactive waste (ifused)
catalysts, laboratory waste
Scales leaded/unleaded scales, rustConstruction/demolitiondebris
scrap metal, concrete, asphalt, soil, asbestos, mineral fibres,plastic/wood
Spent chemicals laboratory, caustic, acid, additives, sodium carbonate,solvents, MEA/DEA (mono/di-ethanol amine), TML/TEL(tetra methyl/ethyl lead)
Pyrophoric wastes scale from tanks/process unitsMixed wastes domestic refuse, vegetationWaste oils lube oils, cut oils, transformer oils, recovered oils, engine
oils
Table 1.12: Main solid wastes generated by refineriesSource: [108, USAEPA, 1995]
Oil retained in sludges or other type of wastes represents a loss of product and, where possible,efforts are made to recover such oil. Waste disposal depends very much on its composition andon the local refinery situation. Because of the high operating costs of waste disposal, muchpriority has been given to waste minimisation schemes.
Waste generation trends during the last ten years show that oily sludge production is declining,mainly through housekeeping measures, whereas biological sludge generation has increased as aresult of increased biotreatment of refinery effluent. Spent catalysts production is alsoincreasing through the installation of new hydrocrackers, hydrotreatment facilities and catalyticcracker dust collectors. For all these waste categories increased use is made of third party wastecontractors for off-site treatment and disposal.
1.4.4 Soil and groundwater contamination
Most refineries have some areas that are contaminated by historical product losses. Currentrefinery practices are designed to prevent spillages and leaks to ground. In the past, theawareness of the potential risks of these contaminated areas was low. The two main topics hereare prevention of new spills and remediation of historic contamination. As mentioned within thescope, soil remediation is not included in the scope of this document. Most oil fractions arebiodegradable, given time. The thinking about the cleaning-up of those contaminated areas haschanged over the years. Increased knowledge about soil sciences and the difficulty of soilremediation on a site that is still in operation, has lead to the pragmatic approach of managingthe risks of these contaminated sites to ensure their fitness for use and ensuring that pollutiondoes not spread beyond the site. There are a number of ongoing research initiatives forimproving the performance of on-site remediation techniques.
The main sources of contamination of soil and groundwater by oil are typically those placesalong the handling and processing train of crude to products where hydrocarbons can be lost tothe ground. These are commonly associated with the storage, transfer, and transport of thehydrocarbons themselves or of hydrocarbon-containing water. The possibility of contaminationby other substances such as contaminated water, catalysts and wastes also exists.
General information Chapter 1
MA/EIPPCB/REF_BREF_FINAL December 2001 19
1.4.5 Other environmental issues
Besides the environmental issues mentioned in the above sections, especially for refineriessituated near residential areas, nuisance has become an issue of discussion with both localauthorities and with representatives of the local population in so-called neighbourhood councils.Topics such as noise, light and smoke emission (flaring) and smell which directly impact theresidents receive much more emphasis in these neighbourhood councils than the above-mentioned ‘major’ emissions which tended to receive more attention historically.
Nuisance by light can be caused through flaring at night by refineries and petrochemical plantslocated near densely populated areas.
Since the 1970s refineries have devoted considerable resources to increasing process safety,both in design and operation by training, procedures and personal protection equipment.Increased attention, training, safe design and adequate tools and personal protection equipmenthas resulted in a steady decrease in the number of unsafe acts, accidents, incidents and nearmisses [242, CONCAWE, 1998].
Occupational health is included in the operational safety procedures aimed at protecting workersfrom exposure to toxic materials and providing them with all necessary facilities whichcontribute to their well-being and their sense of security and safety. Instructions, informationexchange and training of personnel, the provision of personal protection equipment as well asstrict adherence to stringent operational procedures have contributed to a steady decrease inaccidents and health incidents. Typical refinery pollutants and products with a health riskinclude hydrogen sulphide, BTEX (of which benzene is the most prominent), ammonia, phenol,HF, NOx and SOx, for which legally binding Maximum Acceptable Concentrations valuesprevail.
The design of the refinery installations and the process control systems needs to includeprovisions for a safe shut-down with minimum emissions from the unit involved. Duringunplanned operational upsets, these provisions should guarantee that feed supply is terminatedfollowed by subsequent pre-programmed automated activation of pumps, relief systems,purging systems, flares and other equipment. Examples of such occurrences are utility failure,breakdown of equipment, a fire or an explosion. Emergency situations leading to direct spillsoccurring in parts of the plant which are neither fully contained nor fully automated, such aspipeline and tank bottom rupture, have to be addressed with standing emergency procedures.These are directed to minimisation and containment of the spills, followed by rapid clean-up inorder to minimise the environmental impact.

Applied processes and techniques Chapter 2
MA/EIPPCB/REF_BREF_FINAL December 2001 21
2 APPLIED PROCESSES AND TECHNIQUES
This section describes the major activities and processes that may be found within the naturalgas plant sector and petroleum refining industry, including the materials and equipment usedand the processes employed. This chapter is designed for those interested in gaining a generalunderstanding of the processes and activities that can be found in these two industrial sectors,and for those interested in the inter-relationship between the industrial process and the topicsdescribed in subsequent chapters of this document - emission, consumption and best availabletechniques for the different processes. This section does not attempt to replicate publishedengineering information that is available for this industry in the general literature.
The major production unit operations and activities typically involved at petroleum refineriesare described briefly, in alphabetical order, in the current chapter. For many of these productionoperations, a number of different techniques and or unit operations are used in the industry.While the major techniques used for each process/activity are described, it is not intended todiscuss and describe all of the different processes currently in use. This chapter specificallycontains the purpose and principle of the process, feed and product streams, a brief processdescription of commonly used production processes/activity and operability. This information,coupled with schematic drawings of the identified processes, provides a concise description ofthe process/activity.
The first section is dedicated to a general technical description of refineries and the following 22sections cover all the processes and activities within the scope of the BREF. Natural gas plantsprocesses are included in one independent section (Section 17). These sections do not pretend tobe of equal importance from the environmental impact point of view. Some sections have morerelevance than others, but this structure is considered a good way to tackle the BAT assessmentfor the mineral oil and gas refinery sectors. No pollution abatement technique is include in thischapter. However, some of the processes (e.g. hydrotreatments) have an environmental aspect.Environmental implications of production techniques can be found in Chapter 3. Discussion ongood environmental practices (prevention techniques) of production techniques can be found inChapter 4. As consequence of that, no information about emissions can be found in Chapter 2.Information on, for instance, flares, sulphur recovery units, waste water systems and wastemanagement is not included in this chapter because they are not considered productionactivities. They are security or environmental techniques that are applied in both sectors.
2.1 General overview of the refinery processes
Crude oil and natural gas are mixtures of many different hydrocarbons and small amounts ofimpurities. The composition of those raw materials can vary significantly depending on itssource (see Section 10.3 for type of crude oils). Petroleum refineries are complex plants, wherethe combination and sequence of processes is usually very specific to the characteristics of theraw materials (crude oil) and the products to be produced. In a refinery, portions of the outputsfrom some processes are fed back into the same process, fed to new processes, fed back to aprevious process or blended with other outputs to form finished products. One example of thatcan be seen in Figure 2.1, which also shows that all refineries are different regarding theirconfiguration, process integration, feedstock, feedstock flexibility, products, product mix, unitsize and design and control systems. In addition, differences in owner’s strategy, marketsituation, location and age of the refinery, historic development, available infrastructure andenvironmental regulation are amongst other reasons for the wide variety in refinery concepts,designs and modes of operation. The environmental performance can also vary from refinery torefinery.
The production of a large number of fuels is by far the most important function of refineries andwill generally determine the overall configuration and operation. Nevertheless some refineriescan produce valuable non-fuel products such as feedstocks for the chemical and petrochemicalindustries. Examples are mixed naphtha feed for a steam cracker, recovered propylene, butylene
Chapter 2 Applied processes and techniques
22 December 2001 MA/EIPPCB/REF_BREF_FINAL
for polymer applications and aromatics manufacture covered under the Large Volume OrganicChemical BREF. Other speciality products from a refinery include bitumen, lubricating oils,waxes and coke. In recent years the electricity boards in many countries have been liberalisedallowing refineries to feed surplus electricity generated into the public grid.
Refining crude oil into usable petroleum products can be separated into two phases and anumber of supporting operations. The first phase is desalting of crude oil (Section 2.9) and thesubsequent distillation into its various components or "fractions" (Section 2.19). A furtherdistillation of the lighter components and naphtha is carried out to recover methane and ethanefor use as refinery fuel, LPG (propane and butane), gasoline blending components andpetrochemical feedstocks. This light product separation is done in every refinery.
The second phase is made up of three different types of "downstream" processes: combining,breaking and reshaping fractions. These processes change the molecular structure ofhydrocarbon molecules either by breaking them into smaller molecules, joining them to formlarger molecules, or reshaping them into higher quality molecules. The goal of those processesis to convert some of the distillation fractions into marketable petroleum products (seeSection 10.3) through any combination of downstream processes. Those processes define thevarious refinery types, of which the simplest is the ‘Hydroskimming’, which merelydesulphurises (Section 2.13) and catalytically reforms (Section 2.6) selected cuts from thedistillation unit. The amounts of the various products obtained are determined almost entirely bythe crude composition. If the product mix no longer matches the market requirements,conversion units have to be added to restore the balance.
The market demand has for many years obliged refineries to convert heavier fractions to lighterfractions with a higher value. These refineries separate the atmospheric residue into vacuumgasoil and vacuum residue fractions by distillation under high vacuum (Section 2.19), and thenfeed one or both of these cuts to the appropriate conversion units. Thus by inclusion ofconversion units, the product slate can be altered to suit market requirements irrespective of thecrude type. The number and the possible combinations of conversion units are large.
The simplest conversion unit is the thermal cracker (Section 2.22) by which the residue issubjected to such high temperatures that the large hydrocarbon molecules in the residue convertinto smaller ones. Thermal crackers can handle virtually any feed, but produce relatively smallquantities of light products. An improved type of thermal cracker is the coker (Section 2.7), inwhich all the residue is converted into distillates and a coke product. In order to increase thedegree of conversion and improve product quality, a number of different catalytic crackingprocesses have evolved, of which fluid catalytic cracking (Section 2.5) and hydrocracking(Section 2.13) are the most prominent. Recently, residue gasification processes (Section 2.14)have been introduced within refineries, which enable refineries to eliminate heavy residuescompletely and to convert them into clean syngas for captive use and production of hydrogen,steam and electricity via combined cycle techniques.
Supporting operations are those not directly involved in the production of hydrocarbon fuelsbut serving in a supporting role. They may include energy generation, waste water treatment,sulphur recovery, additive production, waste gas treatment, blowdown systems, handling andblending of products and storage of products.
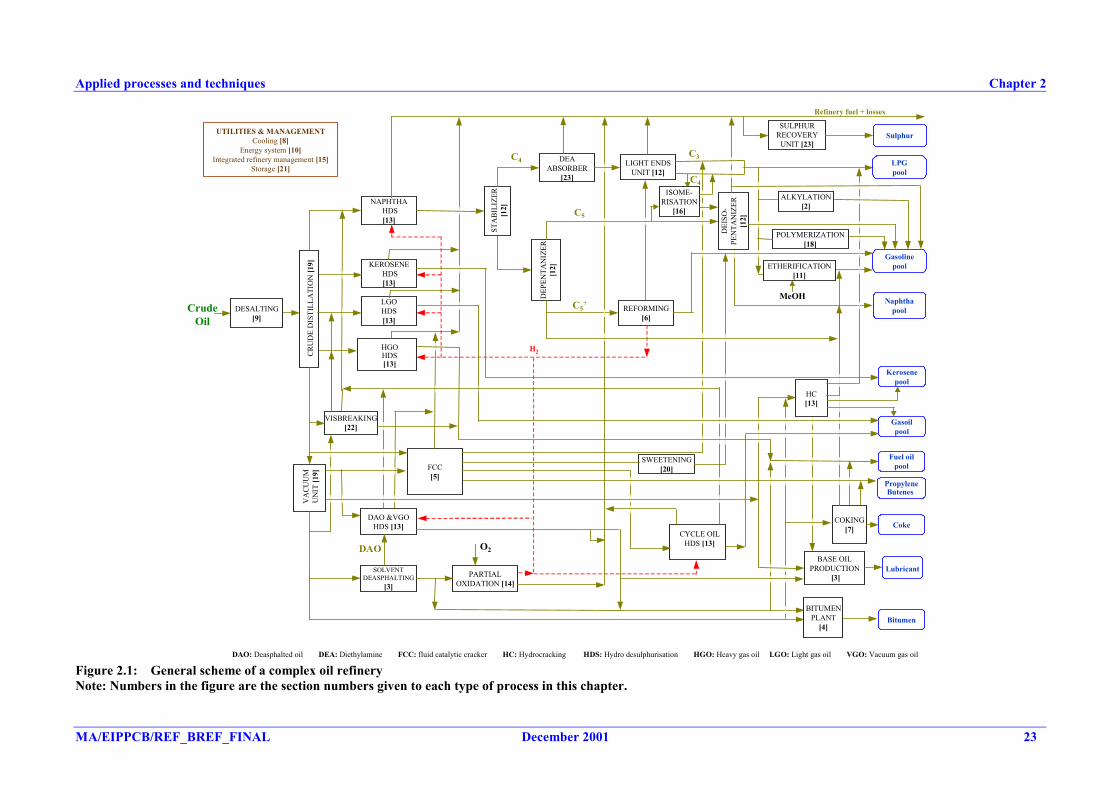
Applied processes and techniques Chapter 2
MA/EIPPCB/REF_BREF_FINAL December 2001 23
NAPHTHA HDS[13]
KEROSENE HDS[13]
LGOHDS[13]
DAO &VGOHDS [13]
SOLVENTDEASPHALTING
[3]PARTIAL
OXIDATION [14]
FCC[5]
DEAABSORBER
[23]
LIGHT ENDSUNIT [12]
REFORMING[6]
DEI
SO-
PEN
TAN
IZER
[12]
SWEETENING[20]
SULPHURRECOVERY
UNIT [23]
CRU
DE
DIS
TILL
ATI
ON
[19]
VA
CUU
MU
NIT
[19]
HGOHDS[13]
STA
BILI
ZER
[12]
DEP
ENTA
NIZ
ER[1
2]
CYCLE OILHDS [13]
PropyleneButenes
H2
C3
C4
DAO
C4
Refinery fuel + losses
DESALTING[9]
VISBREAKING[22]
O2
ISOME-RISATION
[16]
BITUMENPLANT
[4]
POLYMERIZATION[18]
ALKYLATION[2]
MeOH
BASE OILPRODUCTION
[3]
DAO: Deasphalted oil DEA: Diethylamine FCC: fluid catalytic cracker HC: Hydrocracking HDS: Hydro desulphurisation HGO: Heavy gas oil LGO: Light gas oil VGO: Vacuum gas oil
CrudeOil
HC[13]
COKING[7]
Lubricant
Bitumen
Coke
Fuel oilpool
Gasoilpool
Kerosenepool
Naphthapool
Gasolinepool
LPGpool
Sulphur
C5
ETHERIFICATION[11]
UTILITIES & MANAGEMENTCooling [8]
Energy system [10]Integrated refinery management [15]
Storage [21]
C5+
Figure 2.1: General scheme of a complex oil refineryNote: Numbers in the figure are the section numbers given to each type of process in this chapter.
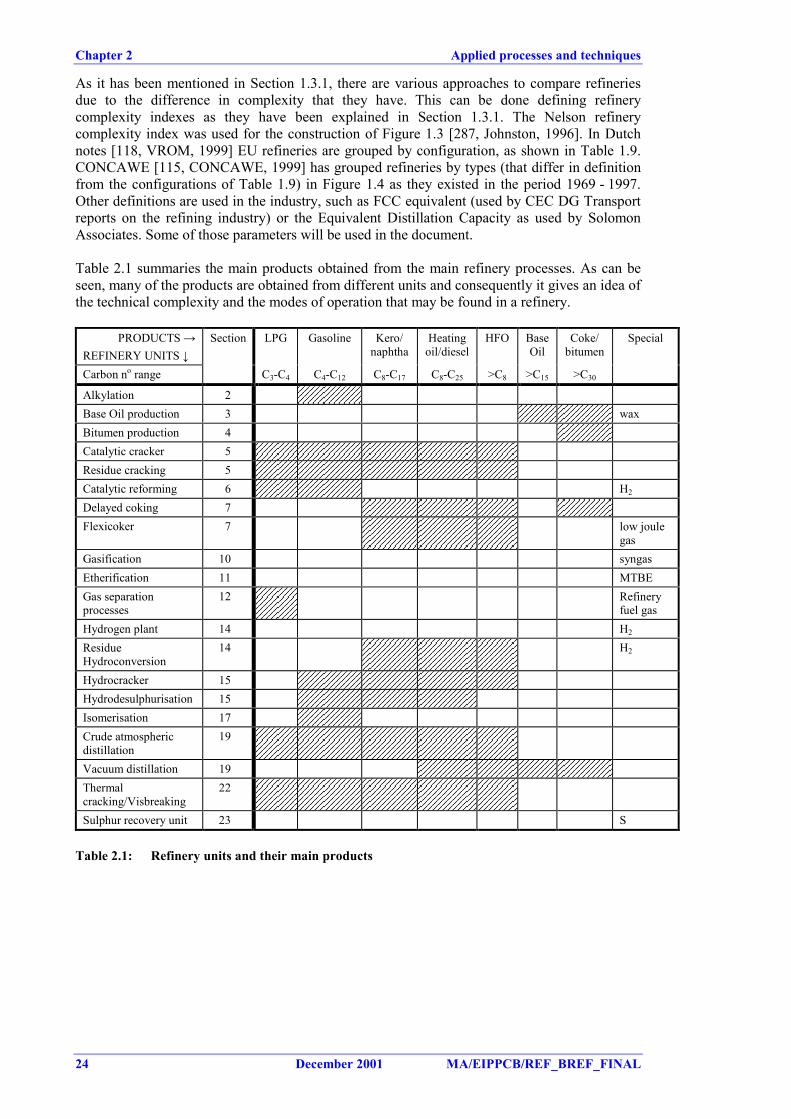
Chapter 2 Applied processes and techniques
24 December 2001 MA/EIPPCB/REF_BREF_FINAL
As it has been mentioned in Section 1.3.1, there are various approaches to compare refineriesdue to the difference in complexity that they have. This can be done defining refinerycomplexity indexes as they have been explained in Section 1.3.1. The Nelson refinerycomplexity index was used for the construction of Figure 1.3 [287, Johnston, 1996]. In Dutchnotes [118, VROM, 1999] EU refineries are grouped by configuration, as shown in Table 1.9.CONCAWE [115, CONCAWE, 1999] has grouped refineries by types (that differ in definitionfrom the configurations of Table 1.9) in Figure 1.4 as they existed in the period 1969 - 1997.Other definitions are used in the industry, such as FCC equivalent (used by CEC DG Transportreports on the refining industry) or the Equivalent Distillation Capacity as used by SolomonAssociates. Some of those parameters will be used in the document.
Table 2.1 summaries the main products obtained from the main refinery processes. As can beseen, many of the products are obtained from different units and consequently it gives an idea ofthe technical complexity and the modes of operation that may be found in a refinery.
PRODUCTS →REFINERY UNITS ↓
LPG Gasoline Kero/naphtha
Heatingoil/diesel
HFO BaseOil
Coke/bitumen
Special
Carbon no range
Section
C3-C4 C4-C12 C8-C17 C8-C25 >C8 >C15 >C30
Alkylation 2Base Oil production 3 waxBitumen production 4Catalytic cracker 5Residue cracking 5Catalytic reforming 6 H2
Delayed coking 7Flexicoker 7 low joule
gasGasification 10 syngasEtherification 11 MTBEGas separationprocesses
12 Refineryfuel gas
Hydrogen plant 14 H2
ResidueHydroconversion
14 H2
Hydrocracker 15Hydrodesulphurisation 15Isomerisation 17Crude atmosphericdistillation
19
Vacuum distillation 19Thermalcracking/Visbreaking
22
Sulphur recovery unit 23 S
Table 2.1: Refinery units and their main products
Applied processes and techniques Chapter 2
MA/EIPPCB/REF_BREF_FINAL December 2001 25
2.2 Alkylation
PURPOSE AND PRINCIPLEThe purpose of alkylation is to yield high-quality motor fuel blending. The term alkylation isused for the reaction of olefins with isobutane, to form higher molecular-weight isoparaffinswith a high octane number. The process involves low-temperature reaction conditionsconducted in the presence of strong acids.
FEED AND PRODUCT STREAMSLow-molecular weight olefins (C3-C5) and isobutane are used as alkylation unit feedstocks. Themajor sources of low olefins are catalytic crackers and cokers. Isobutane is produced byhydrocrackers, catcrackers, catalytic reformers, crude distillation and natural gas processing. Insome cases, n-butane is isomerised (see Section 2.16) to produce additional isobutane. Theproduct is alkylate (a high octane gasoline component) with some propane and butane liquids.By proper choice of operating conditions, most of the product can be made to fall within thegasoline boiling range. Dissolved polymerization products are removed from the acid as thickdark oil.
PROCESS DESCRIPTIONIn the alkylation unit HF or H2SO4 is used as a catalyst. When the concentration of acidbecomes low, some of the acid must be removed and replaced with fresh acid.
In the hydrofluoric acid process, the slipstream of acid is redistilled. The concentratedhydrofluoric acid is recycled and its net consumption is relatively low. In this process (Figure2.2), the feed enters the reactor and is mixed with the isobutane recycle and HF from the settler.Both the olefin and isobutane feeds are dehydrated first (not in Figure 2.2), as this is essential tominimise potential corrosion. The reactor, operating at 25 - 45 °C and 7 - 10 barg, is cooled toremove the heat generated by the reaction. In the settler, alkylate and excess isobutane areseparated from the HF. The HF is recycled to the reactor, where it is regenerated while theorganic phase consisting of the alkylate and unreacted isobutane flow to the isostripper. There,the isobutane and some other light components are stripped from the alkylate. This is routed asproduct to storage after treating with potassium hydroxide. The decomposition of any organicfluoride formed is promoted by the high tube wall temperatures. The butane feed (n and iso) isnormally fed to the isostripper. The isostripper overhead, essentially isobutane, is returned to thereactor. A small overhead slipstream is sent to a depropaniser, where propane is removed. Thebottoms of the depropaniser, isobutane, are routed to the isobutane circulation stream, while thedepropaniser overhead stream, propane, passes through a HF stripper to remove traces of HFand is sent to storage after final KOH treating. From the unit feed stream, n-butanes are drawnoff as a side-stream from the isostripper, treated with KOH and sent to storage.
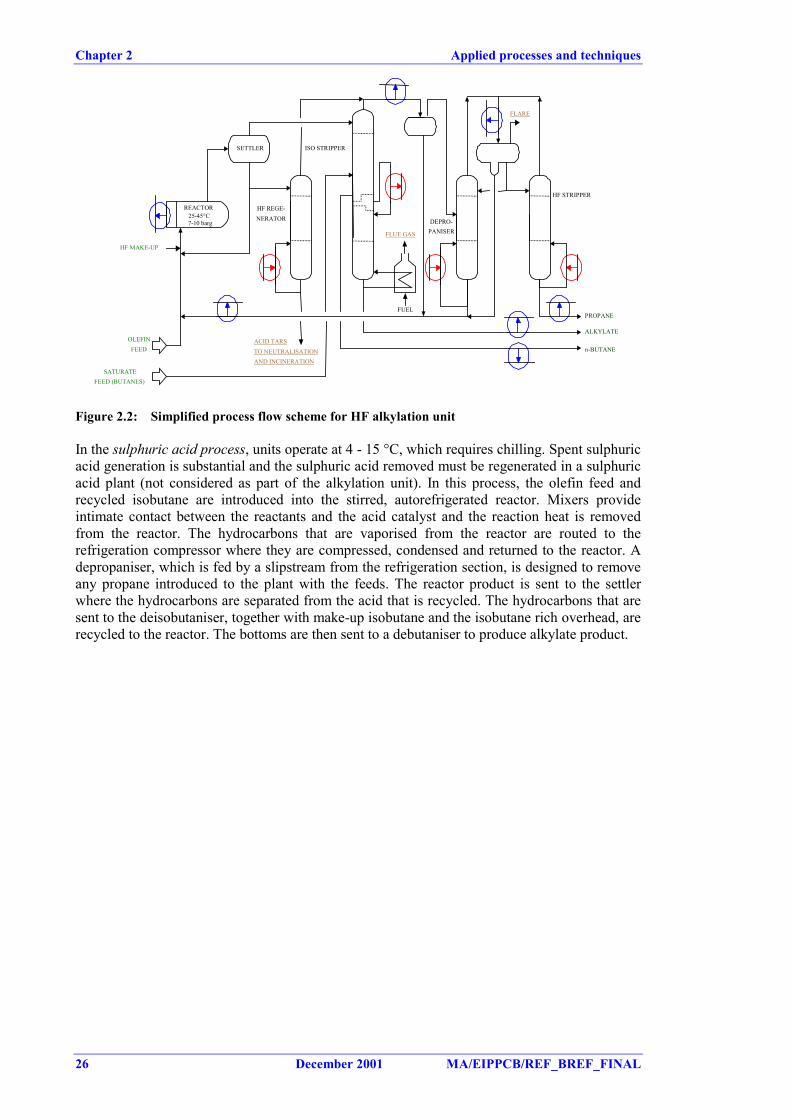
Chapter 2 Applied processes and techniques
26 December 2001 MA/EIPPCB/REF_BREF_FINAL
ACID TARSTO NEUTRALISATIONAND INCINERATION
OLEFINFEED
SATURATEFEED (BUTANES)
HF MAKE-UP
HF REGE-NERATOR
REACTOR
SETTLER ISO STRIPPER
DEPRO-PANISER
HF STRIPPER
PROPANE
ALKYLATE
n-BUTANE
FLARE
25-45°C7-10 barg
FLUE GAS
FUEL
Figure 2.2: Simplified process flow scheme for HF alkylation unit
In the sulphuric acid process, units operate at 4 - 15 °C, which requires chilling. Spent sulphuricacid generation is substantial and the sulphuric acid removed must be regenerated in a sulphuricacid plant (not considered as part of the alkylation unit). In this process, the olefin feed andrecycled isobutane are introduced into the stirred, autorefrigerated reactor. Mixers provideintimate contact between the reactants and the acid catalyst and the reaction heat is removedfrom the reactor. The hydrocarbons that are vaporised from the reactor are routed to therefrigeration compressor where they are compressed, condensed and returned to the reactor. Adepropaniser, which is fed by a slipstream from the refrigeration section, is designed to removeany propane introduced to the plant with the feeds. The reactor product is sent to the settlerwhere the hydrocarbons are separated from the acid that is recycled. The hydrocarbons that aresent to the deisobutaniser, together with make-up isobutane and the isobutane rich overhead, arerecycled to the reactor. The bottoms are then sent to a debutaniser to produce alkylate product.
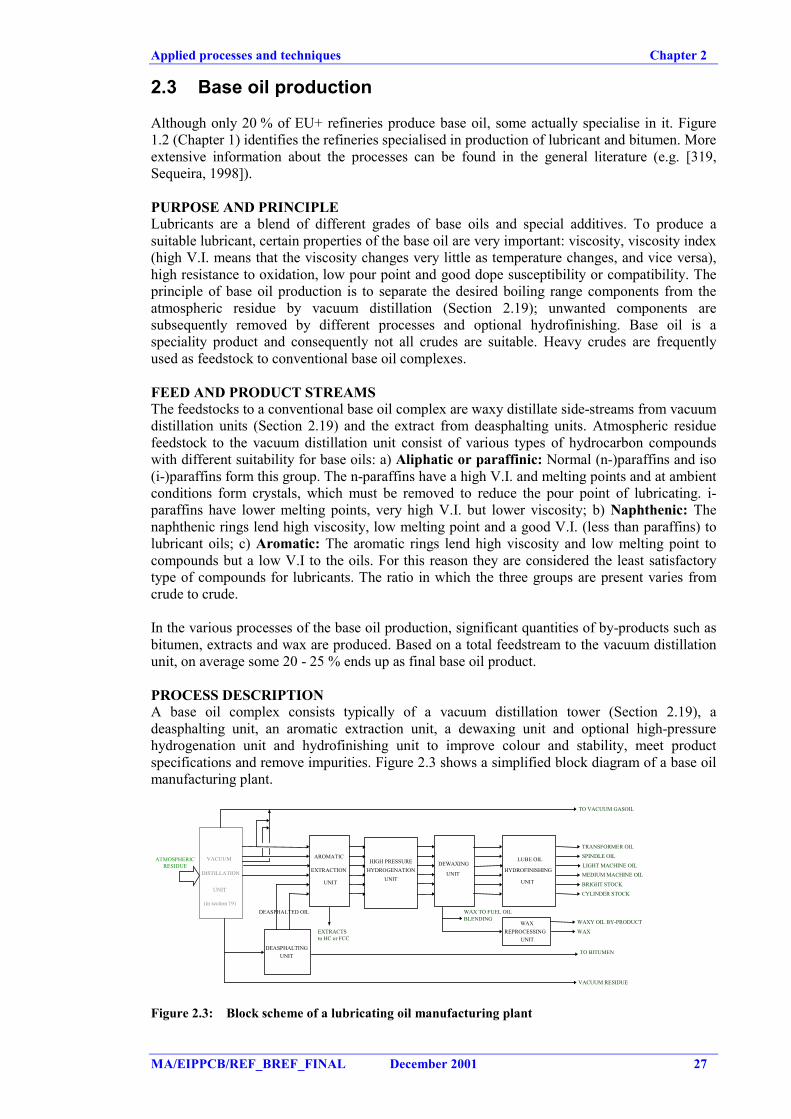
Applied processes and techniques Chapter 2
MA/EIPPCB/REF_BREF_FINAL December 2001 27
2.3 Base oil production
Although only 20 % of EU+ refineries produce base oil, some actually specialise in it. Figure1.2 (Chapter 1) identifies the refineries specialised in production of lubricant and bitumen. Moreextensive information about the processes can be found in the general literature (e.g. [319,Sequeira, 1998]).
PURPOSE AND PRINCIPLELubricants are a blend of different grades of base oils and special additives. To produce asuitable lubricant, certain properties of the base oil are very important: viscosity, viscosity index(high V.I. means that the viscosity changes very little as temperature changes, and vice versa),high resistance to oxidation, low pour point and good dope susceptibility or compatibility. Theprinciple of base oil production is to separate the desired boiling range components from theatmospheric residue by vacuum distillation (Section 2.19); unwanted components aresubsequently removed by different processes and optional hydrofinishing. Base oil is aspeciality product and consequently not all crudes are suitable. Heavy crudes are frequentlyused as feedstock to conventional base oil complexes.
FEED AND PRODUCT STREAMSThe feedstocks to a conventional base oil complex are waxy distillate side-streams from vacuumdistillation units (Section 2.19) and the extract from deasphalting units. Atmospheric residuefeedstock to the vacuum distillation unit consist of various types of hydrocarbon compoundswith different suitability for base oils: a) Aliphatic or paraffinic: Normal (n-)paraffins and iso(i-)paraffins form this group. The n-paraffins have a high V.I. and melting points and at ambientconditions form crystals, which must be removed to reduce the pour point of lubricating. i-paraffins have lower melting points, very high V.I. but lower viscosity; b) Naphthenic: Thenaphthenic rings lend high viscosity, low melting point and a good V.I. (less than paraffins) tolubricant oils; c) Aromatic: The aromatic rings lend high viscosity and low melting point tocompounds but a low V.I to the oils. For this reason they are considered the least satisfactorytype of compounds for lubricants. The ratio in which the three groups are present varies fromcrude to crude.
In the various processes of the base oil production, significant quantities of by-products such asbitumen, extracts and wax are produced. Based on a total feedstream to the vacuum distillationunit, on average some 20 - 25 % ends up as final base oil product.
PROCESS DESCRIPTIONA base oil complex consists typically of a vacuum distillation tower (Section 2.19), adeasphalting unit, an aromatic extraction unit, a dewaxing unit and optional high-pressurehydrogenation unit and hydrofinishing unit to improve colour and stability, meet productspecifications and remove impurities. Figure 2.3 shows a simplified block diagram of a base oilmanufacturing plant.
VACUUM
DISTILLATION
UNIT
(in section 19)
ATMOSPHERICRESIDUE
DEASPHALTINGUNIT
WAXREPROCESSING
UNIT
VACUUM RESIDUE
TO BITUMEN
CYLINDER STOCK
MEDIUM MACHINE OIL
LIGHT MACHINE OIL
SPINDLE OIL
TRANSFORMER OIL
TO VACUUM GASOIL
AROMATIC
EXTRACTION
UNIT
DEWAXING
UNIT
LUBE OIL
HYDROFINISHING
UNIT
WAX TO FUEL OILBLENDING
EXTRACTSto HC or FCC
BRIGHT STOCK
WAX
WAXY OIL BY-PRODUCT
HIGH PRESSUREHYDROGENATION
UNIT
DEASPHALTED OIL
Figure 2.3: Block scheme of a lubricating oil manufacturing plant
Chapter 2 Applied processes and techniques
28 December 2001 MA/EIPPCB/REF_BREF_FINAL
A conventional base oil complex is very labour intensive mainly due to its batch operation, themany grades of base oil normally produced and the associated intensive product handlingoperations.
DeasphaltingSolvent deasphalting produces lubricating oil base stocks by extracting high-boiling lighterparaffinic and naphthenic hydrocarbons (asphaltenes and resins) from the vacuum residue of thevacuum distillation unit. This process makes the deasphalted oil extract light and paraffinic andthe bitumen raffinate heavy and aromatic. Propane or propane-butane mixtures are usually usedas solvents. At specific operating conditions, 37 - 40 bar and 40 - 70 °C, lower boiling paraffinicand naphthenic hydrocarbons are very soluble in propane. At higher temperatures (100 ºC) allhydrocarbons are almost insoluble in propane. The solvent deasphalting process is a typicalextraction process consisting of an extractor and recovery sections, flash evaporation andstripping, to separate the propane solvent from the oil and bitumen phase. The deasphalted oilproduct stream is run down to intermediate storage; the bitumen product stream can be blendedto heavy fuel, used as feedstock for the coker or used for the bitumen product.
More recently, solvent deasphalting has been adapted for the preparation of catalytic cracking,hydrocracking, hydrodesulphuriser feeds and hard bitumen (deep deasphalting). For thesepurposes, heavier-than-propane solvents (butane to hexane mixture) are used together withhigher operating temperatures. This maximises the yield of valuable deasphalted oil andminimises the yield of hard bitumen with a softening point usually over 150 ºC.
Aromatic extractionAromatic extraction uses solvents to remove aromatics from base oil feedstocks, improvingviscosity, oxidation resistance, colour and gum formation. A number of different solvents canbe used (furfural, N-methyl-2-pyrrolidone (NMP), phenol or liquid sulphur dioxide). Theseprocesses are typical extraction processes consisting of an extractor and recovery sections, flashevaporation and stripping, to separate the solvent from the oil-rich raffinate and aromatic-richextract stream. Typically, feed lube stocks are contacted with the solvent in a packed tower orrotating disc contactor. Solvents are recovered from the oil stream through distillation and steamstripping in a fractionator. The raffinate stream is rundown to intermediate storage. The extract,after solvent recovery, is likely to contain high concentrations of sulphur, aromatics, naphthenesand other hydrocarbons, and is often fed to the hydrocracker or catcracker unit.
High pressure hydrogenation unitHydrogenation process is used to reduce aromatics and olephinic compounds found in the baseoil streams.
DewaxingDewaxing of lubricating oil base stocks is necessary to ensure that the oil will have the properviscosity at lower ambient temperatures. This process is used when paraffinic-rich crudes areprocessed. Solvent dewaxing is more prevalent. In these units the high pour point constituents(mainly paraffins) are removed from the raffinate streams. The oil feed is diluted with solvent tolower the viscosity, chilled until the wax is crystallized, and then filtered to remove the wax.Solvents used for the process include propane and mixtures of methyl ethyl ketone (MEK) withmethyl isobutyl ketone (MIBK), toluene or chlorinated hydrocarbons. Solvent is recovered fromthe oil and crystallised wax through heating, two-stage flashing, followed by steam stripping.The wax is removed from the filters, melted and subsequently fed to a solvent recovery unit toseparate the solvent from the wax. The wax is either used as feed to the catalytic cracker or isde-oiled and sold as industrial wax.
HydrofinishingIn this unit the colour and colour stability is improved and the organic acid components areremoved. The need for hydrofinishing depends on the crude oil processed and to a certain extenton the licensor and the design of the preceding units. The design and operation of this unit issimilar to that of a normal hydrotreater unit (Section 2.13).
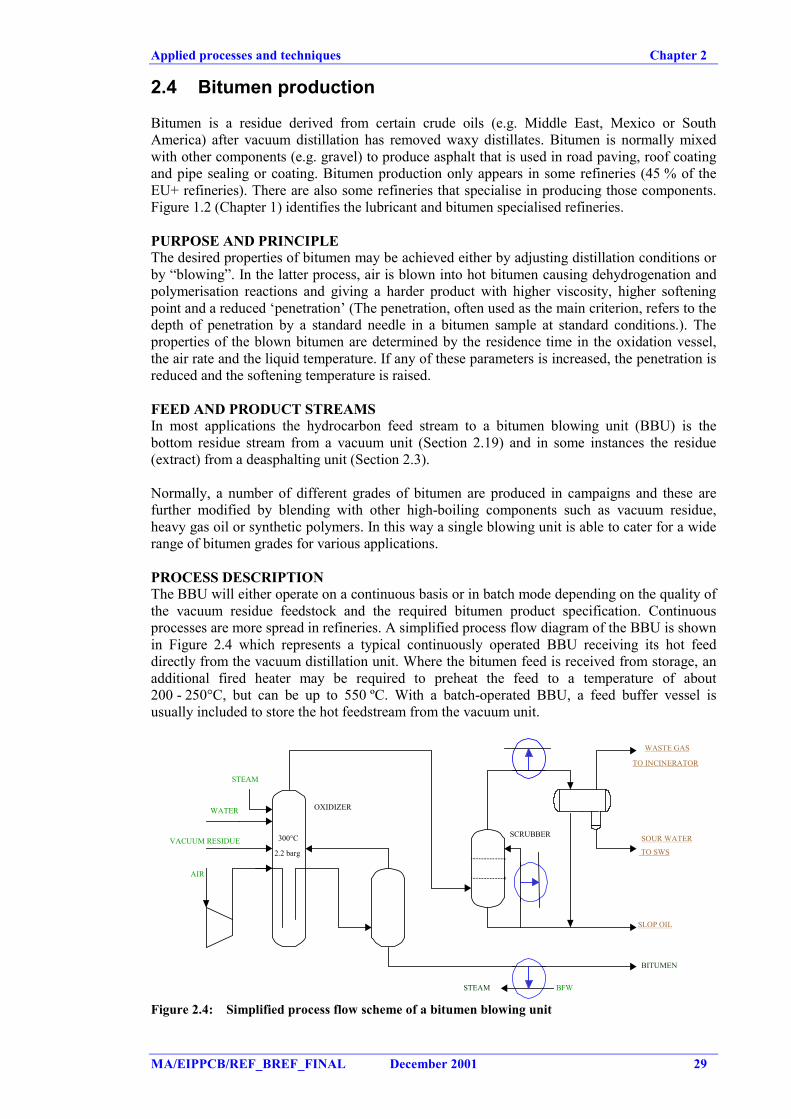
Applied processes and techniques Chapter 2
MA/EIPPCB/REF_BREF_FINAL December 2001 29
2.4 Bitumen production
Bitumen is a residue derived from certain crude oils (e.g. Middle East, Mexico or SouthAmerica) after vacuum distillation has removed waxy distillates. Bitumen is normally mixedwith other components (e.g. gravel) to produce asphalt that is used in road paving, roof coatingand pipe sealing or coating. Bitumen production only appears in some refineries (45 % of theEU+ refineries). There are also some refineries that specialise in producing those components.Figure 1.2 (Chapter 1) identifies the lubricant and bitumen specialised refineries.
PURPOSE AND PRINCIPLEThe desired properties of bitumen may be achieved either by adjusting distillation conditions orby “blowing”. In the latter process, air is blown into hot bitumen causing dehydrogenation andpolymerisation reactions and giving a harder product with higher viscosity, higher softeningpoint and a reduced ‘penetration’ (The penetration, often used as the main criterion, refers to thedepth of penetration by a standard needle in a bitumen sample at standard conditions.). Theproperties of the blown bitumen are determined by the residence time in the oxidation vessel,the air rate and the liquid temperature. If any of these parameters is increased, the penetration isreduced and the softening temperature is raised.
FEED AND PRODUCT STREAMSIn most applications the hydrocarbon feed stream to a bitumen blowing unit (BBU) is thebottom residue stream from a vacuum unit (Section 2.19) and in some instances the residue(extract) from a deasphalting unit (Section 2.3).
Normally, a number of different grades of bitumen are produced in campaigns and these arefurther modified by blending with other high-boiling components such as vacuum residue,heavy gas oil or synthetic polymers. In this way a single blowing unit is able to cater for a widerange of bitumen grades for various applications.
PROCESS DESCRIPTIONThe BBU will either operate on a continuous basis or in batch mode depending on the quality ofthe vacuum residue feedstock and the required bitumen product specification. Continuousprocesses are more spread in refineries. A simplified process flow diagram of the BBU is shownin Figure 2.4 which represents a typical continuously operated BBU receiving its hot feeddirectly from the vacuum distillation unit. Where the bitumen feed is received from storage, anadditional fired heater may be required to preheat the feed to a temperature of about200 - 250°C, but can be up to 550 ºC. With a batch-operated BBU, a feed buffer vessel isusually included to store the hot feedstream from the vacuum unit.
SOUR WATER
TO SWSVACUUM RESIDUE
AIR
OXIDIZER
STEAM
WATER
STEAM BFW
SLOP OIL
BITUMEN
WASTE GAS
TO INCINERATOR
300°C
2.2 barg
SCRUBBER
Figure 2.4: Simplified process flow scheme of a bitumen blowing unit
Chapter 2 Applied processes and techniques
30 December 2001 MA/EIPPCB/REF_BREF_FINAL
The residue feedstream is pumped into the top of the oxidation vessel. Operating pressure in thetop of the oxidation vessel is normally around 1 barg and in the bottom around 2 barg,depending on the height of the vessel. As air is sparged into the base of the vessel, oxidation ofthe residue takes place, resulting in heat. The temperature in the oxidation vessel, whichdetermines to a certain extent the bitumen grade, is normally controlled between 260 – 300 °C.Different options are applied, taking in colder feed to the oxidation vessel, recirculation ofcooled bitumen product from the bitumen rundown cooler, and in older units even direct waterquenching is applied. The blown bitumen is removed from the bottom of the oxidation vesseland cooled by raising steam before being sent to storage.
The air rate is normally well in excess of stoichiometric requirements and so a considerablequantity of oxygen is present in the upper vapour space of the oxidation vessel. To avoid anexplosion in the vapour space, in most units steam is injected at a rate necessary to keep theoxygen concentration below the lower flammable limit (5 - 6 % vol.). In some units a smallamount of water is also injected into the vapour outlet of the oxidation vessel to reduce thevapour temperature. This is sometimes considered necessary to prevent afterburning in theoverhead system that could lead to severe coke formation.
The overhead vapours are first passed through a vent gas scrubber to remove oil and otheroxidation products. In most cases gasoil is used as once-through scrubbing liquid. The vent gasfrom the scrubber is subsequently cooled to condense light hydrocarbons and sour water,sometimes in a water spray contact condenser or scrubber. The remaining gas, consisting mainlyof light hydrocarbons, N2, O2, CO2 and SO2, is incinerated at high temperature (~800 °C) toensure complete destruction of minor components such as H2S, complex aldehydes, organicacids and phenolics, which have a highly unpleasant odour.
The majority of the BBUs produce the higher grades of bitumen (roof and pipe coatings) andnormally operate continuously throughout the year. The BBUs which are used to produce roadbitumens operate only when the demand for road asphalt is high.
Applied processes and techniques Chapter 2
MA/EIPPCB/REF_BREF_FINAL December 2001 31
2.5 Catalytic cracking
PURPOSE AND PRINCIPLECatalytic cracking is the most widely used conversion process for upgrading heavierhydrocarbons into more valuable lower boiling hydrocarbons. It uses heat and a catalyst tobreak larger hydrocarbon molecules into smaller, lighter molecules. Unlike the hydrocrackerprocess, no hydrogen is used and consequently, limited desulphurisation takes place. Comparedto other heavy oil catalytic conversion processes the FCC process is superior in being able tohandle larger quantities of metals, sulphur and asphaltenes. One drawback is the minimalflexibility in changing the product yields.
FEED AND PRODUCT STREAMSNormally the main feed stream to a catalytic cracking unit (catcracker) is the heavy vacuumdistillate stream from the vacuum distillation unit. Other process streams may be blended intothe catcracker feed such as heavy gasoil from the atmospheric distillation unit, coker orvisbroken gasoil, deasphalted oil and extracts from lube oil units and sometimes a smallquantity of atmospheric residue. Those streams may be hydrotreated to make them suitable forthe catcracker. Compared to other conversion processes the catalytic cracker process ischaracterised by a relatively high yield of good quality gasoline and relatively high quantities ofC3 and C4. Both products are highly olefinic and therefore ideal feedstreams for the alkylation,etherification and petrochemical industries. One drawback of the FCC process is the very lowquality of the mid-distillate products in terms of sulphur, olefins, aromatics and cetane index.The residue catalytic cracking (RCC) unit is a catcracker unit used to upgrade heavier fractionssuch as atmospheric residue. The majority of products need further treatment prior to storage.
PROCESS DESCRIPTIONA number of different catalytic cracking designs are currently in use in the world, includingfixed-bed reactors, moving-bed reactors, fluidized-bed reactors and once-through units. Thefluidized- and moving-bed reactors are by far the most prevalent in world refineries.
Fluid catalytic cracking (FCC) units are by far the most common catcracking units. The FCCunit consists of three distinct sections, the reactor-regenerator section including air blower andwaste heat boiler, the main fractionator section including wet gas compressor and theunsaturated gas plant section. A simplified flow scheme is shown in Figure 2.5. In the FCCprocess, oil and oil vapour preheated to 250 to 425°C is contacted with hot catalyst (zeolite) atabout 680 - 730°C in the riser reactor. To enhance vaporisation and subsequent cracking, thefeed is atomised with steam. The cracking process takes place at temperatures between 500 and540°C and a pressure of 1.5 - 2.0 barg. Most catalysts used in catalytic cracking are zeolites(some 15% w/w) supported by amorphous synthetic silica-alumina with metals. The catalyst isin a fine, granular form which mixes intimately with the vaporised feed. The fluidised catalystand the reacted hydrocarbon vapour separate mechanically in a (two-stage) cyclone system andany oil remaining on the catalyst is removed by steam stripping. The amount of lost catalyst asfines in the cyclone system is balanced by the addition of fresh catalyst. The catalytic crackingprocesses produce coke which collects on the catalyst surface and diminishes its catalyticproperties. The catalyst therefore needs to be regenerated continuously or periodically,essentially by burning the coke off the catalyst at high temperatures. The method and frequencywith which catalysts are regenerated are a major factor in the design of catalytic cracking units.The catalyst flows into a separate vessel(s) for either single- or two-stage regeneration byburning off the coke deposits with air. However, in time the catalyst deactivates gradually andirreversibly due to high temperature exposure and metal poisoning (mainly vanadium). The hotregenerated catalyst flows back to the base of the reactor riser, where it is cooled byvaporisation of the feed and by the heat required for cracking reactions. The cracked oil vapoursare then fed to a fractionation tower where the various desired fractions are separated andcollected. The streams are steam-stripped to remove volatile hydrocarbons prior to cooling andsending to storage. Slurry oil is taken from the bottom of the column and part of it is cooledwith the reactor feed stream and steam generation and is returned to the column. The recycledslurry oil is used as wash oil and as a quench for the hot reactor overhead vapours to prevent
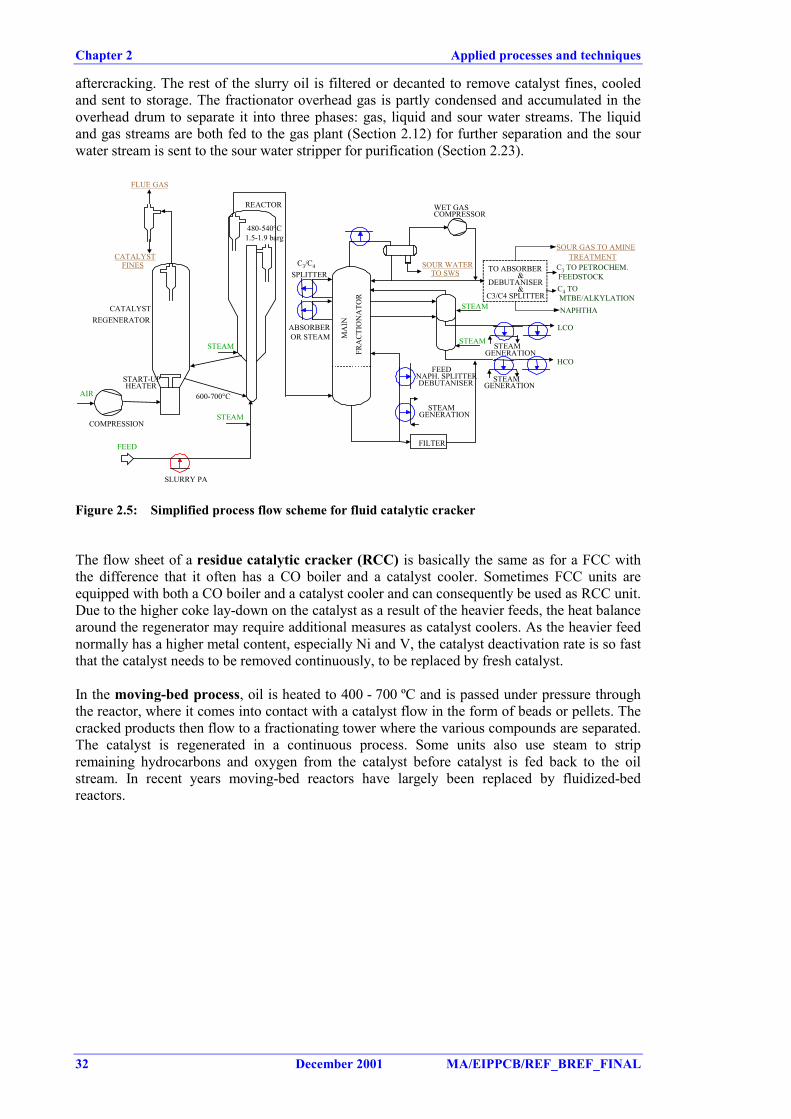
Chapter 2 Applied processes and techniques
32 December 2001 MA/EIPPCB/REF_BREF_FINAL
aftercracking. The rest of the slurry oil is filtered or decanted to remove catalyst fines, cooledand sent to storage. The fractionator overhead gas is partly condensed and accumulated in theoverhead drum to separate it into three phases: gas, liquid and sour water streams. The liquidand gas streams are both fed to the gas plant (Section 2.12) for further separation and the sourwater stream is sent to the sour water stripper for purification (Section 2.23).
SOUR WATERTO SWS TO ABSORBER
&DEBUTANISER
&C3/C4 SPLITTER
LCO
MA
IN
FRA
CTIO
NA
TOR
REACTOR
CATALYSTREGENERATOR
START-UPHEATER
FEED
AIR
CATALYSTFINES
COMPRESSION
SOUR GAS TO AMINETREATMENT
C3 TO PETROCHEM. FEEDSTOCK
480-540°C1.5-1.9 barg
600-700°C
STEAM
STEAM
FILTER
STEAM
STEAM NAPHTHA
C4 TO MTBE/ALKYLATION
WET GASCOMPRESSOR
HCO
STEAMGENERATION
STEAMGENERATION
STEAMGENERATION
FEEDNAPH. SPLITTERDEBUTANISER
C3/C4
SPLITTER
ABSORBEROR STEAM
SLURRY PA
FLUE GAS
Figure 2.5: Simplified process flow scheme for fluid catalytic cracker
The flow sheet of a residue catalytic cracker (RCC) is basically the same as for a FCC withthe difference that it often has a CO boiler and a catalyst cooler. Sometimes FCC units areequipped with both a CO boiler and a catalyst cooler and can consequently be used as RCC unit.Due to the higher coke lay-down on the catalyst as a result of the heavier feeds, the heat balancearound the regenerator may require additional measures as catalyst coolers. As the heavier feednormally has a higher metal content, especially Ni and V, the catalyst deactivation rate is so fastthat the catalyst needs to be removed continuously, to be replaced by fresh catalyst.
In the moving-bed process, oil is heated to 400 - 700 ºC and is passed under pressure throughthe reactor, where it comes into contact with a catalyst flow in the form of beads or pellets. Thecracked products then flow to a fractionating tower where the various compounds are separated.The catalyst is regenerated in a continuous process. Some units also use steam to stripremaining hydrocarbons and oxygen from the catalyst before catalyst is fed back to the oilstream. In recent years moving-bed reactors have largely been replaced by fluidized-bedreactors.
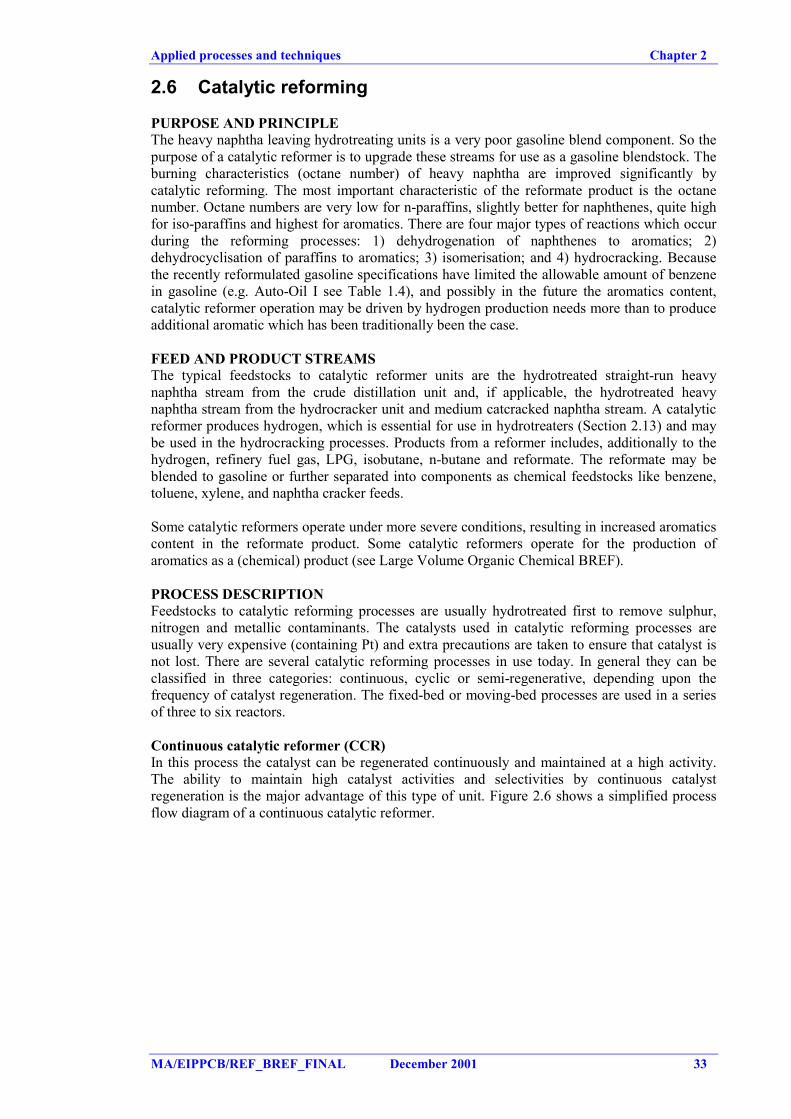
Applied processes and techniques Chapter 2
MA/EIPPCB/REF_BREF_FINAL December 2001 33
2.6 Catalytic reforming
PURPOSE AND PRINCIPLEThe heavy naphtha leaving hydrotreating units is a very poor gasoline blend component. So thepurpose of a catalytic reformer is to upgrade these streams for use as a gasoline blendstock. Theburning characteristics (octane number) of heavy naphtha are improved significantly bycatalytic reforming. The most important characteristic of the reformate product is the octanenumber. Octane numbers are very low for n-paraffins, slightly better for naphthenes, quite highfor iso-paraffins and highest for aromatics. There are four major types of reactions which occurduring the reforming processes: 1) dehydrogenation of naphthenes to aromatics; 2)dehydrocyclisation of paraffins to aromatics; 3) isomerisation; and 4) hydrocracking. Becausethe recently reformulated gasoline specifications have limited the allowable amount of benzenein gasoline (e.g. Auto-Oil I see Table 1.4), and possibly in the future the aromatics content,catalytic reformer operation may be driven by hydrogen production needs more than to produceadditional aromatic which has been traditionally been the case.
FEED AND PRODUCT STREAMSThe typical feedstocks to catalytic reformer units are the hydrotreated straight-run heavynaphtha stream from the crude distillation unit and, if applicable, the hydrotreated heavynaphtha stream from the hydrocracker unit and medium catcracked naphtha stream. A catalyticreformer produces hydrogen, which is essential for use in hydrotreaters (Section 2.13) and maybe used in the hydrocracking processes. Products from a reformer includes, additionally to thehydrogen, refinery fuel gas, LPG, isobutane, n-butane and reformate. The reformate may beblended to gasoline or further separated into components as chemical feedstocks like benzene,toluene, xylene, and naphtha cracker feeds.
Some catalytic reformers operate under more severe conditions, resulting in increased aromaticscontent in the reformate product. Some catalytic reformers operate for the production ofaromatics as a (chemical) product (see Large Volume Organic Chemical BREF).
PROCESS DESCRIPTIONFeedstocks to catalytic reforming processes are usually hydrotreated first to remove sulphur,nitrogen and metallic contaminants. The catalysts used in catalytic reforming processes areusually very expensive (containing Pt) and extra precautions are taken to ensure that catalyst isnot lost. There are several catalytic reforming processes in use today. In general they can beclassified in three categories: continuous, cyclic or semi-regenerative, depending upon thefrequency of catalyst regeneration. The fixed-bed or moving-bed processes are used in a seriesof three to six reactors.
Continuous catalytic reformer (CCR)In this process the catalyst can be regenerated continuously and maintained at a high activity.The ability to maintain high catalyst activities and selectivities by continuous catalystregeneration is the major advantage of this type of unit. Figure 2.6 shows a simplified processflow diagram of a continuous catalytic reformer.
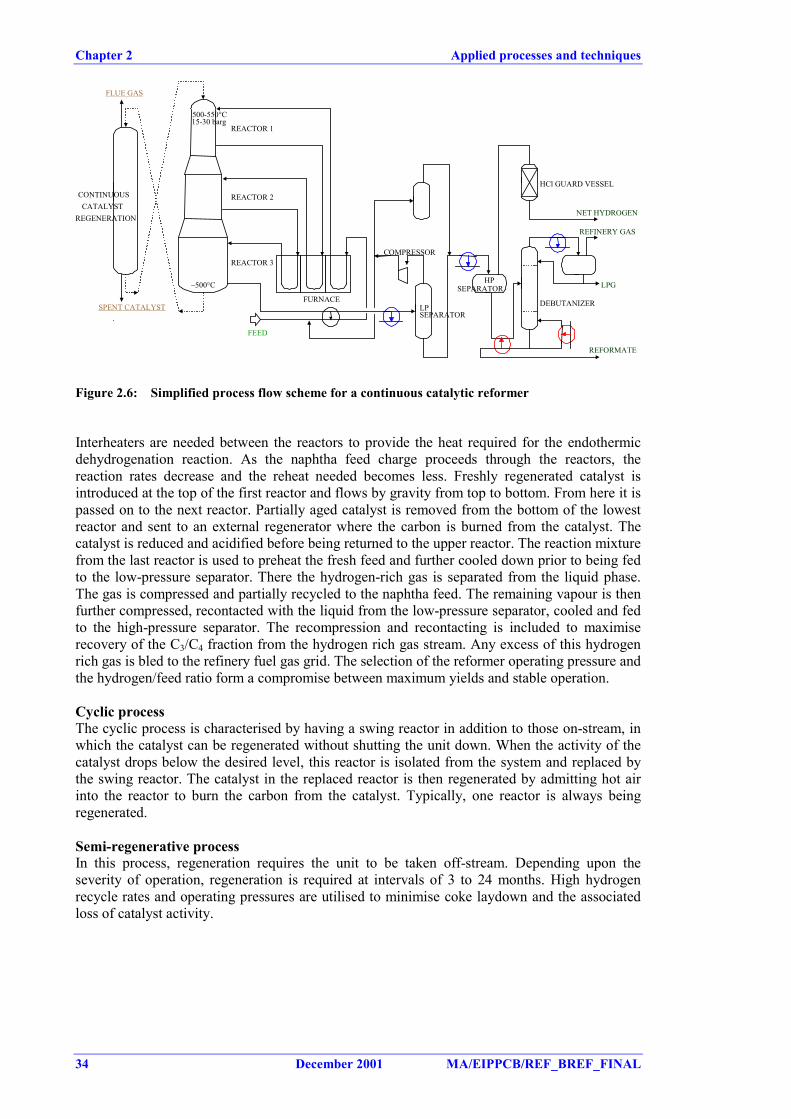
Chapter 2 Applied processes and techniques
34 December 2001 MA/EIPPCB/REF_BREF_FINAL
FLUE GAS
FEED
NET HYDROGEN
REFINERY GAS
LPG
REFORMATE
DEBUTANIZER
HPSEPARATOR
LPSEPARATOR
COMPRESSOR
REACTOR 1
REACTOR 2
REACTOR 3
CONTINUOUSCATALYST
REGENERATION
HCl GUARD VESSEL
500-550°C15-30 barg
~500°C
FURNACESPENT CATALYST
Figure 2.6: Simplified process flow scheme for a continuous catalytic reformer
Interheaters are needed between the reactors to provide the heat required for the endothermicdehydrogenation reaction. As the naphtha feed charge proceeds through the reactors, thereaction rates decrease and the reheat needed becomes less. Freshly regenerated catalyst isintroduced at the top of the first reactor and flows by gravity from top to bottom. From here it ispassed on to the next reactor. Partially aged catalyst is removed from the bottom of the lowestreactor and sent to an external regenerator where the carbon is burned from the catalyst. Thecatalyst is reduced and acidified before being returned to the upper reactor. The reaction mixturefrom the last reactor is used to preheat the fresh feed and further cooled down prior to being fedto the low-pressure separator. There the hydrogen-rich gas is separated from the liquid phase.The gas is compressed and partially recycled to the naphtha feed. The remaining vapour is thenfurther compressed, recontacted with the liquid from the low-pressure separator, cooled and fedto the high-pressure separator. The recompression and recontacting is included to maximiserecovery of the C3/C4 fraction from the hydrogen rich gas stream. Any excess of this hydrogenrich gas is bled to the refinery fuel gas grid. The selection of the reformer operating pressure andthe hydrogen/feed ratio form a compromise between maximum yields and stable operation.
Cyclic processThe cyclic process is characterised by having a swing reactor in addition to those on-stream, inwhich the catalyst can be regenerated without shutting the unit down. When the activity of thecatalyst drops below the desired level, this reactor is isolated from the system and replaced bythe swing reactor. The catalyst in the replaced reactor is then regenerated by admitting hot airinto the reactor to burn the carbon from the catalyst. Typically, one reactor is always beingregenerated.
Semi-regenerative processIn this process, regeneration requires the unit to be taken off-stream. Depending upon theseverity of operation, regeneration is required at intervals of 3 to 24 months. High hydrogenrecycle rates and operating pressures are utilised to minimise coke laydown and the associatedloss of catalyst activity.
Applied processes and techniques Chapter 2
MA/EIPPCB/REF_BREF_FINAL December 2001 35
2.7 Coking processes
PURPOSE AND PRINCIPLECoking is a severe thermal cracking process used primarily to reduce refinery production oflow-value residual fuel oils and transform it into transportation fuels, such as gasoline anddiesel. As part of the process, coking also produces petroleum coke, which is essentially solidcarbon with varying amounts of impurities.
FEED AND PRODUCT STREAMSAs the coking process is a thermal destruction process, the quality of the feed in terms of metalcontent, Concarbon number and other contaminants is not critical. As a matter of fact, coking ispredominantly used when the feed has a high Concarbon number and contains high quantities ofimpurities which cannot be handled in catalytic conversion processes. All this gives highfeedstock flexibility. The feed to a delayed coking unit can consist of atmospheric residue,vacuum residue, shale oils, tar sands liquid and coal tar, which results in a petroleum coke usedfor fuel applications. Aromatic oils and residues such as heavy cycle oils from a catalyticcracking unit and thermal tars are suitable feed stocks for the production of needle coke andanode coke. The feed to a fluid coker is the vacuum residue, sometimes mixed with refinerysludges, tarsands, bitumen and other heavy residues.
The products from the coking fractionator are refinery fuel gas, LPG, naphtha and light andheavy gas oils. Petroleum coke is another product, with the type depending upon the processused, operating conditions and feedstock used. Coke produced by the coker is called “green”coke and still contains some heavy hydrocarbons left from incomplete carbonisation reactions.More information about the properties of the coke can be found in Section 10.3.2.
PROCESS DESCRIPTIONTwo types of coking processes exist: the Delayed and fluid coking processes that produce cokeand the Flexicoking process that gasifies the coke produced in a fluid coking process to producecoke gas.
Delayed and fluid cokingThe basic process is the same as thermal cracking (Section 2.22), except that feed streams areallowed to react for longer without being cooled. Figure 2.7 shows a simplified process flowdiagram of delayed coking unit.
FUEL
COKE DRUMS
480-510°C1.5-7.0 barg 410-450°C
400°C0.5-2.0
barg
FEEDLGOSTRIPPER
STEAM
SOUR WATERTO SWS
UNSTABILIZED NAPHTHA
LGOHGO
GREEN COKE
HGO RECYCLE
FEED
FRACTIONATOR
GAS PLANT
REFINERY GAS
C3/C4
NAPHTHA
COKEHANDLING GREEN COKE
WATER
FLUE GAS
COKE FINES
WASTE WATER
Figure 2.7: Simplified process flow scheme for delayed coking unit
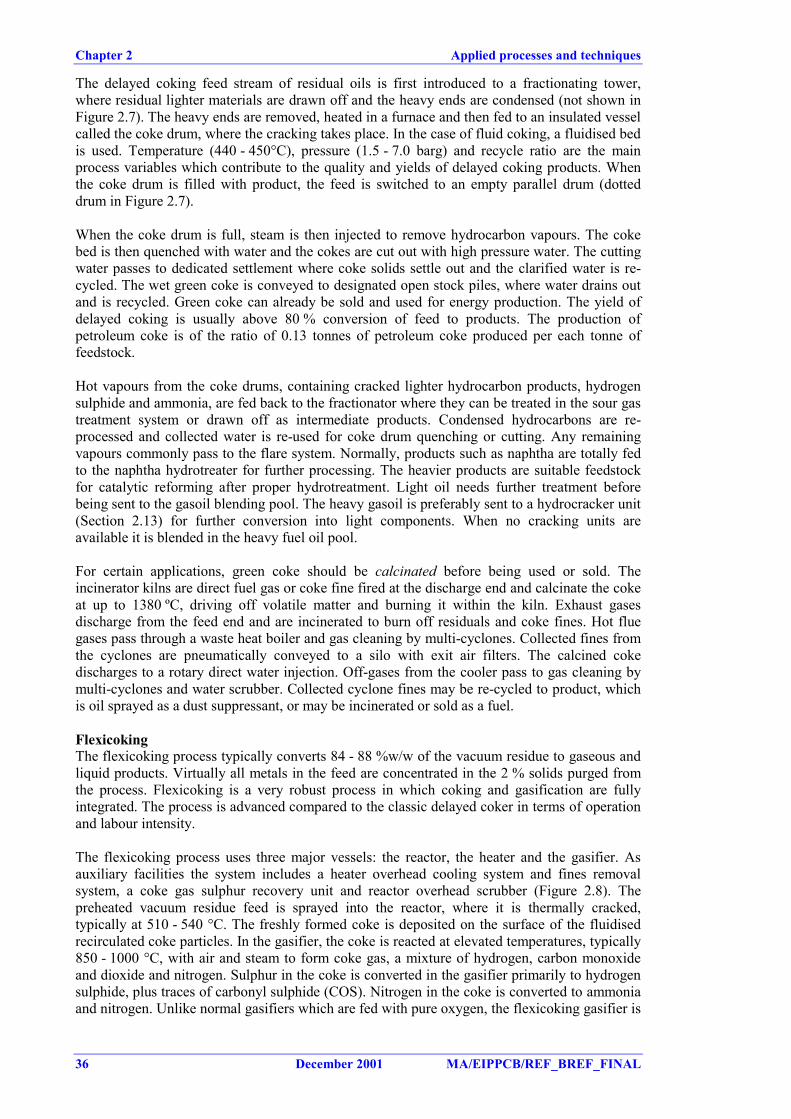
Chapter 2 Applied processes and techniques
36 December 2001 MA/EIPPCB/REF_BREF_FINAL
The delayed coking feed stream of residual oils is first introduced to a fractionating tower,where residual lighter materials are drawn off and the heavy ends are condensed (not shown inFigure 2.7). The heavy ends are removed, heated in a furnace and then fed to an insulated vesselcalled the coke drum, where the cracking takes place. In the case of fluid coking, a fluidised bedis used. Temperature (440 - 450°C), pressure (1.5 - 7.0 barg) and recycle ratio are the mainprocess variables which contribute to the quality and yields of delayed coking products. Whenthe coke drum is filled with product, the feed is switched to an empty parallel drum (dotteddrum in Figure 2.7).
When the coke drum is full, steam is then injected to remove hydrocarbon vapours. The cokebed is then quenched with water and the cokes are cut out with high pressure water. The cuttingwater passes to dedicated settlement where coke solids settle out and the clarified water is re-cycled. The wet green coke is conveyed to designated open stock piles, where water drains outand is recycled. Green coke can already be sold and used for energy production. The yield ofdelayed coking is usually above 80 % conversion of feed to products. The production ofpetroleum coke is of the ratio of 0.13 tonnes of petroleum coke produced per each tonne offeedstock.
Hot vapours from the coke drums, containing cracked lighter hydrocarbon products, hydrogensulphide and ammonia, are fed back to the fractionator where they can be treated in the sour gastreatment system or drawn off as intermediate products. Condensed hydrocarbons are re-processed and collected water is re-used for coke drum quenching or cutting. Any remainingvapours commonly pass to the flare system. Normally, products such as naphtha are totally fedto the naphtha hydrotreater for further processing. The heavier products are suitable feedstockfor catalytic reforming after proper hydrotreatment. Light oil needs further treatment beforebeing sent to the gasoil blending pool. The heavy gasoil is preferably sent to a hydrocracker unit(Section 2.13) for further conversion into light components. When no cracking units areavailable it is blended in the heavy fuel oil pool.
For certain applications, green coke should be calcinated before being used or sold. Theincinerator kilns are direct fuel gas or coke fine fired at the discharge end and calcinate the cokeat up to 1380 ºC, driving off volatile matter and burning it within the kiln. Exhaust gasesdischarge from the feed end and are incinerated to burn off residuals and coke fines. Hot fluegases pass through a waste heat boiler and gas cleaning by multi-cyclones. Collected fines fromthe cyclones are pneumatically conveyed to a silo with exit air filters. The calcined cokedischarges to a rotary direct water injection. Off-gases from the cooler pass to gas cleaning bymulti-cyclones and water scrubber. Collected cyclone fines may be re-cycled to product, whichis oil sprayed as a dust suppressant, or may be incinerated or sold as a fuel.
FlexicokingThe flexicoking process typically converts 84 - 88 %w/w of the vacuum residue to gaseous andliquid products. Virtually all metals in the feed are concentrated in the 2 % solids purged fromthe process. Flexicoking is a very robust process in which coking and gasification are fullyintegrated. The process is advanced compared to the classic delayed coker in terms of operationand labour intensity.
The flexicoking process uses three major vessels: the reactor, the heater and the gasifier. Asauxiliary facilities the system includes a heater overhead cooling system and fines removalsystem, a coke gas sulphur recovery unit and reactor overhead scrubber (Figure 2.8). Thepreheated vacuum residue feed is sprayed into the reactor, where it is thermally cracked,typically at 510 - 540 °C. The freshly formed coke is deposited on the surface of the fluidisedrecirculated coke particles. In the gasifier, the coke is reacted at elevated temperatures, typically850 - 1000 °C, with air and steam to form coke gas, a mixture of hydrogen, carbon monoxideand dioxide and nitrogen. Sulphur in the coke is converted in the gasifier primarily to hydrogensulphide, plus traces of carbonyl sulphide (COS). Nitrogen in the coke is converted to ammoniaand nitrogen. Unlike normal gasifiers which are fed with pure oxygen, the flexicoking gasifier is
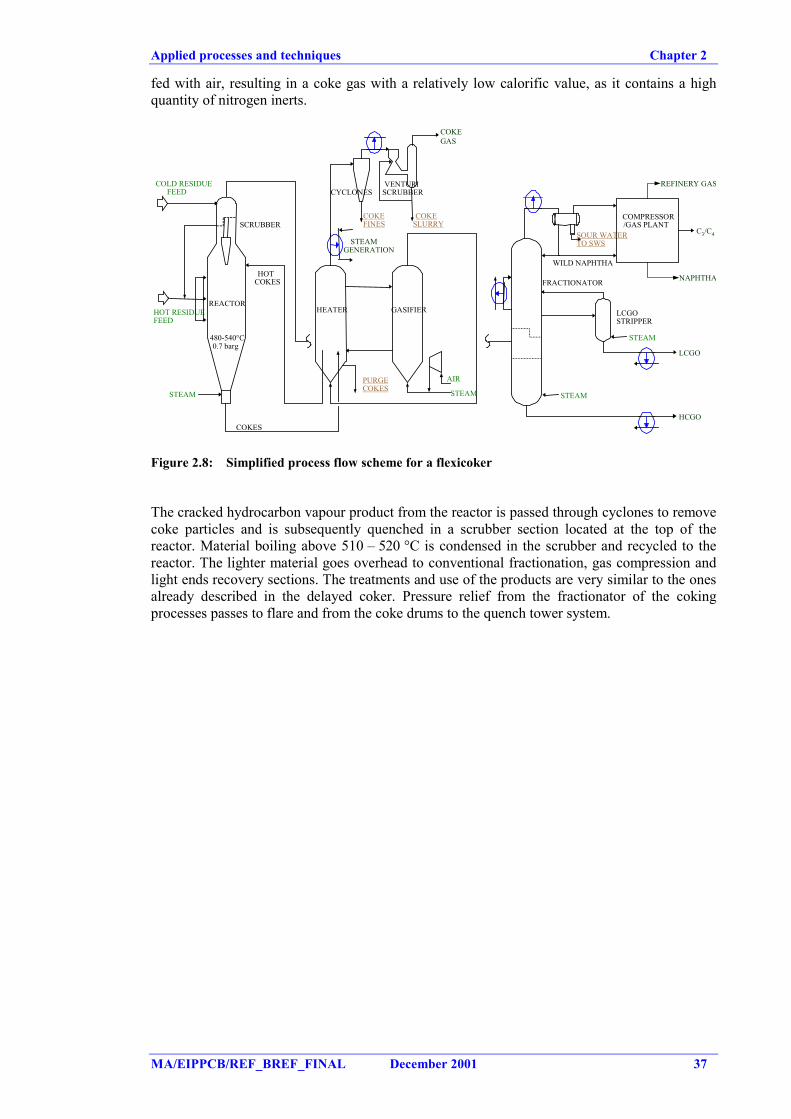
Applied processes and techniques Chapter 2
MA/EIPPCB/REF_BREF_FINAL December 2001 37
fed with air, resulting in a coke gas with a relatively low calorific value, as it contains a highquantity of nitrogen inerts.
HEATER GASIFIERREACTOR
SCRUBBER
STEAMGENERATION
COKEFINES
CYCLONESVENTURI
SCRUBBER
PURGECOKES STEAMSTEAM
HOT RESIDUEFEED
COKES
HOTCOKES
COLD RESIDUEFEED
COKESLURRY
AIR
480-540°C0.7 barg
SOUR WATERTO SWS
WILD NAPHTHA
LCGO
FRACTIONATOR
COMPRESSOR/GAS PLANT
REFINERY GAS
C3/C4
NAPHTHA
LCGOSTRIPPER
STEAM
STEAM
HCGO
COKEGAS
Figure 2.8: Simplified process flow scheme for a flexicoker
The cracked hydrocarbon vapour product from the reactor is passed through cyclones to removecoke particles and is subsequently quenched in a scrubber section located at the top of thereactor. Material boiling above 510 – 520 °C is condensed in the scrubber and recycled to thereactor. The lighter material goes overhead to conventional fractionation, gas compression andlight ends recovery sections. The treatments and use of the products are very similar to the onesalready described in the delayed coker. Pressure relief from the fractionator of the cokingprocesses passes to flare and from the coke drums to the quench tower system.
Chapter 2 Applied processes and techniques
38 December 2001 MA/EIPPCB/REF_BREF_FINAL
2.8 Cooling systems
Under the IPPC process, a horizontal BREF on industrial cooling systems has been producedthat covers many topics of relevance to the refineries sector. To avoid repetition, therefore, thissection on cooling addresses only topics not covered by that horizontal BREF. Moreover, somecooling water pollution issues have already been studied in the OSPAR (North Sea) andHELCOM (Baltic) processes.
PURPOSE AND PRINCIPLEIn a refinery, cooling of feed and product streams is required to allow refinery processoperations to take place at the right temperatures, and to bring products to their appropriatestorage temperature. Even though heat integration of process systems ensures that significantcooling can be achieved by exchanging heat between streams to be cooled and streams to beheated, additional cooling is still required. This additional cooling should be provided by anexternal cooling medium: water and/or air.
PROCESS DESCRIPTIONA wide range of techniques is used for cooling purposes in oil refineries. Most refineries use acombination of the techniques available. The selection of a cooling system depends on requiredcooling temperature, cooling capacity, contamination risk (primary or secondary cooling loop)and local circumstances. Simplified diagram of the cooling techniques are shown in Figure 2.9and briefly described below:
C D
E FPROCESS
OR COOLINGSYSTEM
HOT AIR
COLD AIR
OTHER COOLING
SYSTEMPROCESS
WetDry
G H ClosedOpen
A B
Air
Wet air
water
AIR
Figure 2.9: Simplified diagrams of the cooling systems used in refineriesA: Once-through cooling, B: Direct cooling with cooling of water cooling effluent, C:Indirect/Secondary system, D: Recirculating, E,F: Closed circuit, G,H: Hybrid system
Air coolingIn an air cooler (forced or induced draught), the process stream in the tubes is cooled against airdelivered by a fan. An induced draught air cooler is illustrated in Figure 2.9E.
Applied processes and techniques Chapter 2
MA/EIPPCB/REF_BREF_FINAL December 2001 39
Water cooling(1) Direct cooling (i.e. quenching)Because the high contamination generated by this type of cooling, nowadays, quenching is onlyused in cokers (Section 2.7), in gasifiers and in some sludge incinerators.
(2) Once-through system (seawater, river water, etc.)In a typical once-through cooling system, water is extracted from a surface water body, filteredif necessary and sometimes treated with biocide to inhibit fouling. It is then passed around therefinery to enable cooling through heat exchangers. The cooling water is passed through aprocess unit once and is then discharged directly without treatment in the waste water treatmentplant. There are several ways to use water for once-through cooling in refineries that carry adifferent risk of contamination by process streams:� Once-through cooling water used for cooling non-polluting streams, e.g. in power
generation. A cooling tower system is generally applied when the thermal loading of thesurface water is too high. Figure 2.9A&B
� Once-through cooling water used for heat exchange with a recirculating water system whichthen cools the process streams. Figure 2.9C.
� Once-through cooling water is used to cool process streams directly (via heat exchangers)Figure 2.9A&B.
(3) Circulation system (tempered water, cooling water).In this system, most cooling water is repeatedly recycled through cooling towers using ambientair. In order to control the concentration of contaminants and the solids content in the coolingwater, a blowdown stream is used – which is sent to the waste water treatment unit – and make-up water is added. A certain amount of water also exits the system through evaporation. Figure2.9D
(4) Wet closed system (normally water)Tempered water is used when process streams to be cooled should not be exposed to the (low)cooling water temperatures, (see Figure 2.9F).
(5) Hybrid systemsIn these cases, both air and water are used as cooling media. These systems normally maximisethe use of air cooling and the rest is done by water cooling. Two types of systems are availableand they are shown in Figure 2.9G&H.
(6) Refrigeration systemsIn specific cases when process streams have to be cooled below ambient temperatures,refrigeration systems are applied. This can be either a direct refrigeration system, i.e. using therefrigerant (propane or ammonia) in the process, or an indirect system (Figure 2.9F) using acirculation system (e.g. brine, glycol) where the refrigerant cools the circulating liquid.
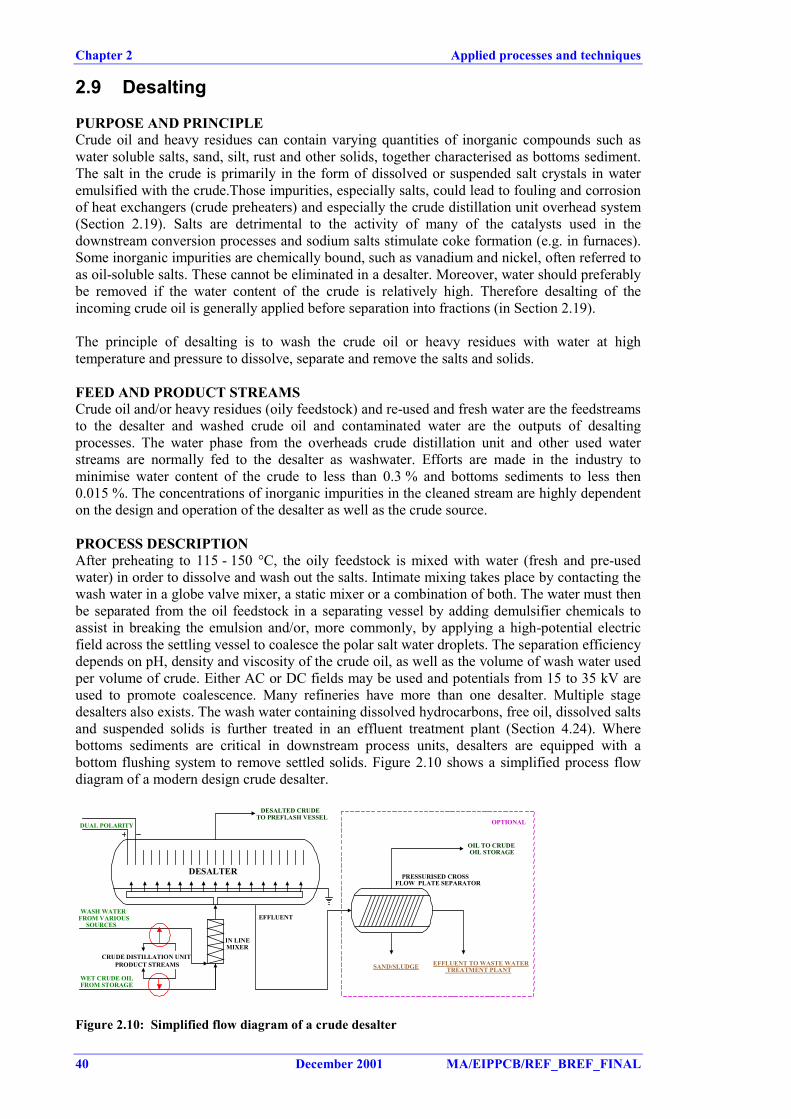
Chapter 2 Applied processes and techniques
40 December 2001 MA/EIPPCB/REF_BREF_FINAL
2.9 Desalting
PURPOSE AND PRINCIPLECrude oil and heavy residues can contain varying quantities of inorganic compounds such aswater soluble salts, sand, silt, rust and other solids, together characterised as bottoms sediment.The salt in the crude is primarily in the form of dissolved or suspended salt crystals in wateremulsified with the crude.Those impurities, especially salts, could lead to fouling and corrosionof heat exchangers (crude preheaters) and especially the crude distillation unit overhead system(Section 2.19). Salts are detrimental to the activity of many of the catalysts used in thedownstream conversion processes and sodium salts stimulate coke formation (e.g. in furnaces).Some inorganic impurities are chemically bound, such as vanadium and nickel, often referred toas oil-soluble salts. These cannot be eliminated in a desalter. Moreover, water should preferablybe removed if the water content of the crude is relatively high. Therefore desalting of theincoming crude oil is generally applied before separation into fractions (in Section 2.19).
The principle of desalting is to wash the crude oil or heavy residues with water at hightemperature and pressure to dissolve, separate and remove the salts and solids.
FEED AND PRODUCT STREAMSCrude oil and/or heavy residues (oily feedstock) and re-used and fresh water are the feedstreamsto the desalter and washed crude oil and contaminated water are the outputs of desaltingprocesses. The water phase from the overheads crude distillation unit and other used waterstreams are normally fed to the desalter as washwater. Efforts are made in the industry tominimise water content of the crude to less than 0.3 % and bottoms sediments to less then0.015 %. The concentrations of inorganic impurities in the cleaned stream are highly dependenton the design and operation of the desalter as well as the crude source.
PROCESS DESCRIPTIONAfter preheating to 115 - 150 °C, the oily feedstock is mixed with water (fresh and pre-usedwater) in order to dissolve and wash out the salts. Intimate mixing takes place by contacting thewash water in a globe valve mixer, a static mixer or a combination of both. The water must thenbe separated from the oil feedstock in a separating vessel by adding demulsifier chemicals toassist in breaking the emulsion and/or, more commonly, by applying a high-potential electricfield across the settling vessel to coalesce the polar salt water droplets. The separation efficiencydepends on pH, density and viscosity of the crude oil, as well as the volume of wash water usedper volume of crude. Either AC or DC fields may be used and potentials from 15 to 35 kV areused to promote coalescence. Many refineries have more than one desalter. Multiple stagedesalters also exists. The wash water containing dissolved hydrocarbons, free oil, dissolved saltsand suspended solids is further treated in an effluent treatment plant (Section 4.24). Wherebottoms sediments are critical in downstream process units, desalters are equipped with abottom flushing system to remove settled solids. Figure 2.10 shows a simplified process flowdiagram of a modern design crude desalter.
WET CRUDE OILFROM STORAGE
WASH WATERFROM VARIOUS
SOURCES
EFFLUENT TO WASTE WATER TREATMENT PLANTSAND/SLUDGE
DESALTER
CRUDE DISTILLATION UNIT PRODUCT STREAMS
IN LINEMIXER
EFFLUENT
OIL TO CRUDE OIL STORAGE
DESALTED CRUDETO PREFLASH VESSEL
PRESSURISED CROSSFLOW PLATE SEPARATOR
DESALTER
DUAL POLARITY OPTIONAL
Figure 2.10: Simplified flow diagram of a crude desalter
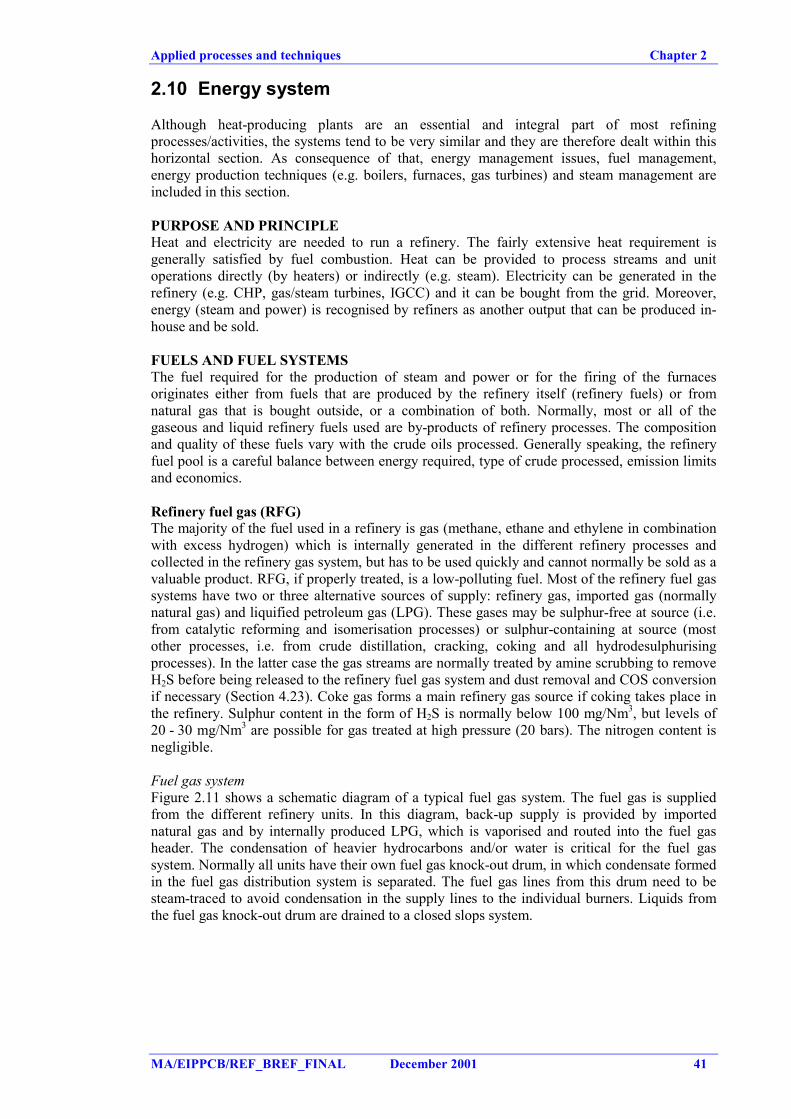
Applied processes and techniques Chapter 2
MA/EIPPCB/REF_BREF_FINAL December 2001 41
2.10 Energy system
Although heat-producing plants are an essential and integral part of most refiningprocesses/activities, the systems tend to be very similar and they are therefore dealt within thishorizontal section. As consequence of that, energy management issues, fuel management,energy production techniques (e.g. boilers, furnaces, gas turbines) and steam management areincluded in this section.
PURPOSE AND PRINCIPLEHeat and electricity are needed to run a refinery. The fairly extensive heat requirement isgenerally satisfied by fuel combustion. Heat can be provided to process streams and unitoperations directly (by heaters) or indirectly (e.g. steam). Electricity can be generated in therefinery (e.g. CHP, gas/steam turbines, IGCC) and it can be bought from the grid. Moreover,energy (steam and power) is recognised by refiners as another output that can be produced in-house and be sold.
FUELS AND FUEL SYSTEMSThe fuel required for the production of steam and power or for the firing of the furnacesoriginates either from fuels that are produced by the refinery itself (refinery fuels) or fromnatural gas that is bought outside, or a combination of both. Normally, most or all of thegaseous and liquid refinery fuels used are by-products of refinery processes. The compositionand quality of these fuels vary with the crude oils processed. Generally speaking, the refineryfuel pool is a careful balance between energy required, type of crude processed, emission limitsand economics.
Refinery fuel gas (RFG)The majority of the fuel used in a refinery is gas (methane, ethane and ethylene in combinationwith excess hydrogen) which is internally generated in the different refinery processes andcollected in the refinery gas system, but has to be used quickly and cannot normally be sold as avaluable product. RFG, if properly treated, is a low-polluting fuel. Most of the refinery fuel gassystems have two or three alternative sources of supply: refinery gas, imported gas (normallynatural gas) and liquified petroleum gas (LPG). These gases may be sulphur-free at source (i.e.from catalytic reforming and isomerisation processes) or sulphur-containing at source (mostother processes, i.e. from crude distillation, cracking, coking and all hydrodesulphurisingprocesses). In the latter case the gas streams are normally treated by amine scrubbing to removeH2S before being released to the refinery fuel gas system and dust removal and COS conversionif necessary (Section 4.23). Coke gas forms a main refinery gas source if coking takes place inthe refinery. Sulphur content in the form of H2S is normally below 100 mg/Nm3, but levels of20 - 30 mg/Nm3 are possible for gas treated at high pressure (20 bars). The nitrogen content isnegligible.
Fuel gas systemFigure 2.11 shows a schematic diagram of a typical fuel gas system. The fuel gas is suppliedfrom the different refinery units. In this diagram, back-up supply is provided by importednatural gas and by internally produced LPG, which is vaporised and routed into the fuel gasheader. The condensation of heavier hydrocarbons and/or water is critical for the fuel gassystem. Normally all units have their own fuel gas knock-out drum, in which condensate formedin the fuel gas distribution system is separated. The fuel gas lines from this drum need to besteam-traced to avoid condensation in the supply lines to the individual burners. Liquids fromthe fuel gas knock-out drum are drained to a closed slops system.
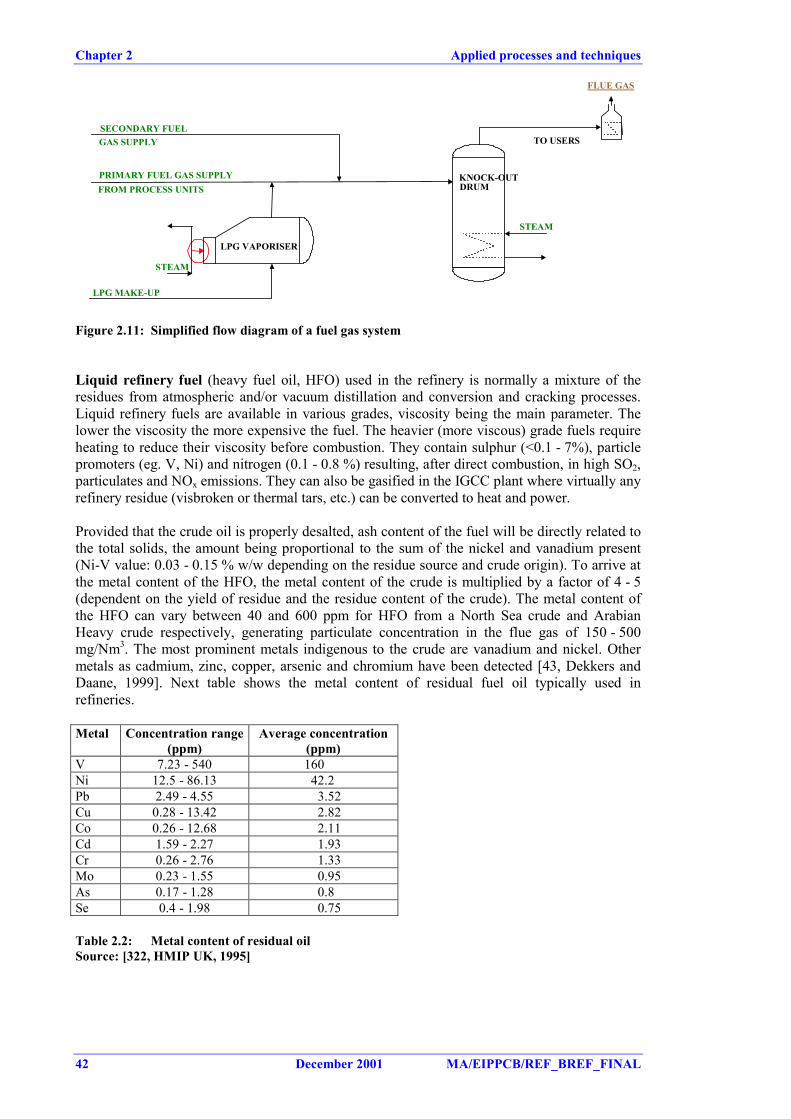
Chapter 2 Applied processes and techniques
42 December 2001 MA/EIPPCB/REF_BREF_FINAL
STEAM
LPG VAPORISER
LPG MAKE-UP
PRIMARY FUEL GAS SUPPLYFROM PROCESS UNITS
SECONDARY FUELGAS SUPPLY TO USERS
STEAM
KNOCK-OUTDRUM
FLUE GAS
Figure 2.11: Simplified flow diagram of a fuel gas system
Liquid refinery fuel (heavy fuel oil, HFO) used in the refinery is normally a mixture of theresidues from atmospheric and/or vacuum distillation and conversion and cracking processes.Liquid refinery fuels are available in various grades, viscosity being the main parameter. Thelower the viscosity the more expensive the fuel. The heavier (more viscous) grade fuels requireheating to reduce their viscosity before combustion. They contain sulphur (<0.1 - 7%), particlepromoters (eg. V, Ni) and nitrogen (0.1 - 0.8 %) resulting, after direct combustion, in high SO2,particulates and NOx emissions. They can also be gasified in the IGCC plant where virtually anyrefinery residue (visbroken or thermal tars, etc.) can be converted to heat and power.
Provided that the crude oil is properly desalted, ash content of the fuel will be directly related tothe total solids, the amount being proportional to the sum of the nickel and vanadium present(Ni-V value: 0.03 - 0.15 % w/w depending on the residue source and crude origin). To arrive atthe metal content of the HFO, the metal content of the crude is multiplied by a factor of 4 - 5(dependent on the yield of residue and the residue content of the crude). The metal content ofthe HFO can vary between 40 and 600 ppm for HFO from a North Sea crude and ArabianHeavy crude respectively, generating particulate concentration in the flue gas of 150 - 500mg/Nm3. The most prominent metals indigenous to the crude are vanadium and nickel. Othermetals as cadmium, zinc, copper, arsenic and chromium have been detected [43, Dekkers andDaane, 1999]. Next table shows the metal content of residual fuel oil typically used inrefineries.
Metal Concentration range(ppm)
Average concentration(ppm)
V 7.23 - 540 160Ni 12.5 - 86.13 42.2Pb 2.49 - 4.55 3.52Cu 0.28 - 13.42 2.82Co 0.26 - 12.68 2.11Cd 1.59 - 2.27 1.93Cr 0.26 - 2.76 1.33Mo 0.23 - 1.55 0.95As 0.17 - 1.28 0.8Se 0.4 - 1.98 0.75
Table 2.2: Metal content of residual oilSource: [322, HMIP UK, 1995]
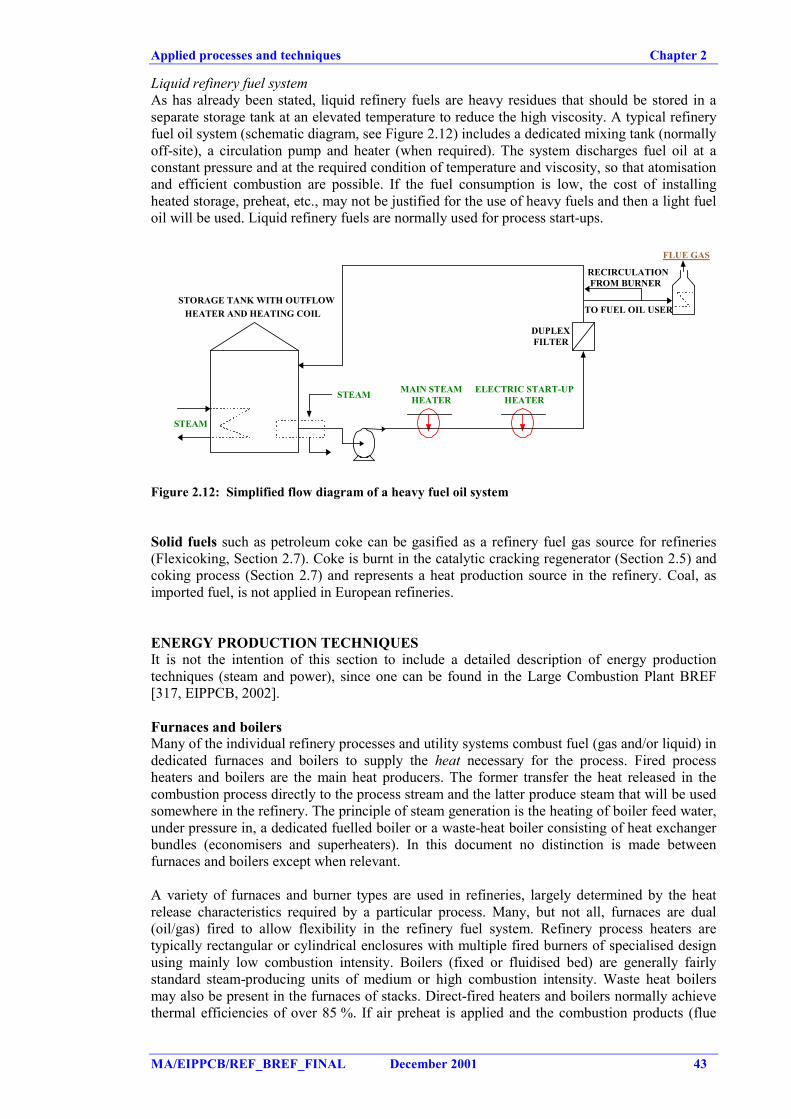
Applied processes and techniques Chapter 2
MA/EIPPCB/REF_BREF_FINAL December 2001 43
Liquid refinery fuel systemAs has already been stated, liquid refinery fuels are heavy residues that should be stored in aseparate storage tank at an elevated temperature to reduce the high viscosity. A typical refineryfuel oil system (schematic diagram, see Figure 2.12) includes a dedicated mixing tank (normallyoff-site), a circulation pump and heater (when required). The system discharges fuel oil at aconstant pressure and at the required condition of temperature and viscosity, so that atomisationand efficient combustion are possible. If the fuel consumption is low, the cost of installingheated storage, preheat, etc., may not be justified for the use of heavy fuels and then a light fueloil will be used. Liquid refinery fuels are normally used for process start-ups.
STORAGE TANK WITH OUTFLOWHEATER AND HEATING COIL
STEAM MAIN STEAMHEATER
ELECTRIC START-UPHEATER
DUPLEXFILTER
TO FUEL OIL USER
RECIRCULATIONFROM BURNER
FLUE GAS
STEAM
Figure 2.12: Simplified flow diagram of a heavy fuel oil system
Solid fuels such as petroleum coke can be gasified as a refinery fuel gas source for refineries(Flexicoking, Section 2.7). Coke is burnt in the catalytic cracking regenerator (Section 2.5) andcoking process (Section 2.7) and represents a heat production source in the refinery. Coal, asimported fuel, is not applied in European refineries.
ENERGY PRODUCTION TECHNIQUESIt is not the intention of this section to include a detailed description of energy productiontechniques (steam and power), since one can be found in the Large Combustion Plant BREF[317, EIPPCB, 2002].
Furnaces and boilersMany of the individual refinery processes and utility systems combust fuel (gas and/or liquid) indedicated furnaces and boilers to supply the heat necessary for the process. Fired processheaters and boilers are the main heat producers. The former transfer the heat released in thecombustion process directly to the process stream and the latter produce steam that will be usedsomewhere in the refinery. The principle of steam generation is the heating of boiler feed water,under pressure in, a dedicated fuelled boiler or a waste-heat boiler consisting of heat exchangerbundles (economisers and superheaters). In this document no distinction is made betweenfurnaces and boilers except when relevant.
A variety of furnaces and burner types are used in refineries, largely determined by the heatrelease characteristics required by a particular process. Many, but not all, furnaces are dual(oil/gas) fired to allow flexibility in the refinery fuel system. Refinery process heaters aretypically rectangular or cylindrical enclosures with multiple fired burners of specialised designusing mainly low combustion intensity. Boilers (fixed or fluidised bed) are generally fairlystandard steam-producing units of medium or high combustion intensity. Waste heat boilersmay also be present in the furnaces of stacks. Direct-fired heaters and boilers normally achievethermal efficiencies of over 85 %. If air preheat is applied and the combustion products (flue
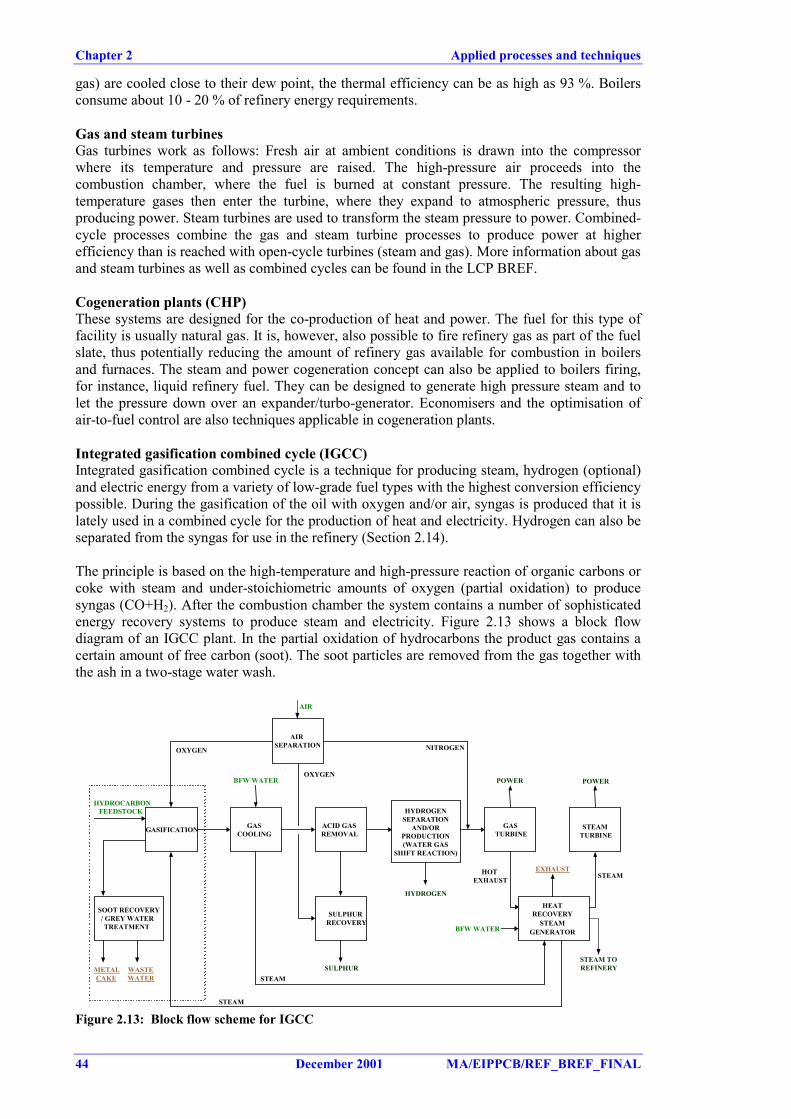
Chapter 2 Applied processes and techniques
44 December 2001 MA/EIPPCB/REF_BREF_FINAL
gas) are cooled close to their dew point, the thermal efficiency can be as high as 93 %. Boilersconsume about 10 - 20 % of refinery energy requirements.
Gas and steam turbinesGas turbines work as follows: Fresh air at ambient conditions is drawn into the compressorwhere its temperature and pressure are raised. The high-pressure air proceeds into thecombustion chamber, where the fuel is burned at constant pressure. The resulting high-temperature gases then enter the turbine, where they expand to atmospheric pressure, thusproducing power. Steam turbines are used to transform the steam pressure to power. Combined-cycle processes combine the gas and steam turbine processes to produce power at higherefficiency than is reached with open-cycle turbines (steam and gas). More information about gasand steam turbines as well as combined cycles can be found in the LCP BREF.
Cogeneration plants (CHP)These systems are designed for the co-production of heat and power. The fuel for this type offacility is usually natural gas. It is, however, also possible to fire refinery gas as part of the fuelslate, thus potentially reducing the amount of refinery gas available for combustion in boilersand furnaces. The steam and power cogeneration concept can also be applied to boilers firing,for instance, liquid refinery fuel. They can be designed to generate high pressure steam and tolet the pressure down over an expander/turbo-generator. Economisers and the optimisation ofair-to-fuel control are also techniques applicable in cogeneration plants.
Integrated gasification combined cycle (IGCC)Integrated gasification combined cycle is a technique for producing steam, hydrogen (optional)and electric energy from a variety of low-grade fuel types with the highest conversion efficiencypossible. During the gasification of the oil with oxygen and/or air, syngas is produced that it islately used in a combined cycle for the production of heat and electricity. Hydrogen can also beseparated from the syngas for use in the refinery (Section 2.14).
The principle is based on the high-temperature and high-pressure reaction of organic carbons orcoke with steam and under-stoichiometric amounts of oxygen (partial oxidation) to producesyngas (CO+H2). After the combustion chamber the system contains a number of sophisticatedenergy recovery systems to produce steam and electricity. Figure 2.13 shows a block flowdiagram of an IGCC plant. In the partial oxidation of hydrocarbons the product gas contains acertain amount of free carbon (soot). The soot particles are removed from the gas together withthe ash in a two-stage water wash.
HYDROGENSEPARATION
AND/ORPRODUCTION(WATER GAS
SHIFT REACTION)
GAS TURBINE
STEAM TURBINE
HEATRECOVERY
STEAMGENERATOR
STEAM
BFW WATER
HOT EXHAUST
EXHAUSTSTEAM
POWER POWER
STEAM TOREFINERY
OXYGEN NITROGEN
OXYGEN
GASIFICATION GASCOOLING
SOOT RECOVERY/ GREY WATERTREATMENT
HYDROCARBONFEEDSTOCK
STEAM
METALCAKE
WASTEWATER
BFW WATER
ACID GASREMOVAL
SULPHURRECOVERY
AIR SEPARATION
SULPHUR
HYDROGEN
AIR
Figure 2.13: Block flow scheme for IGCC
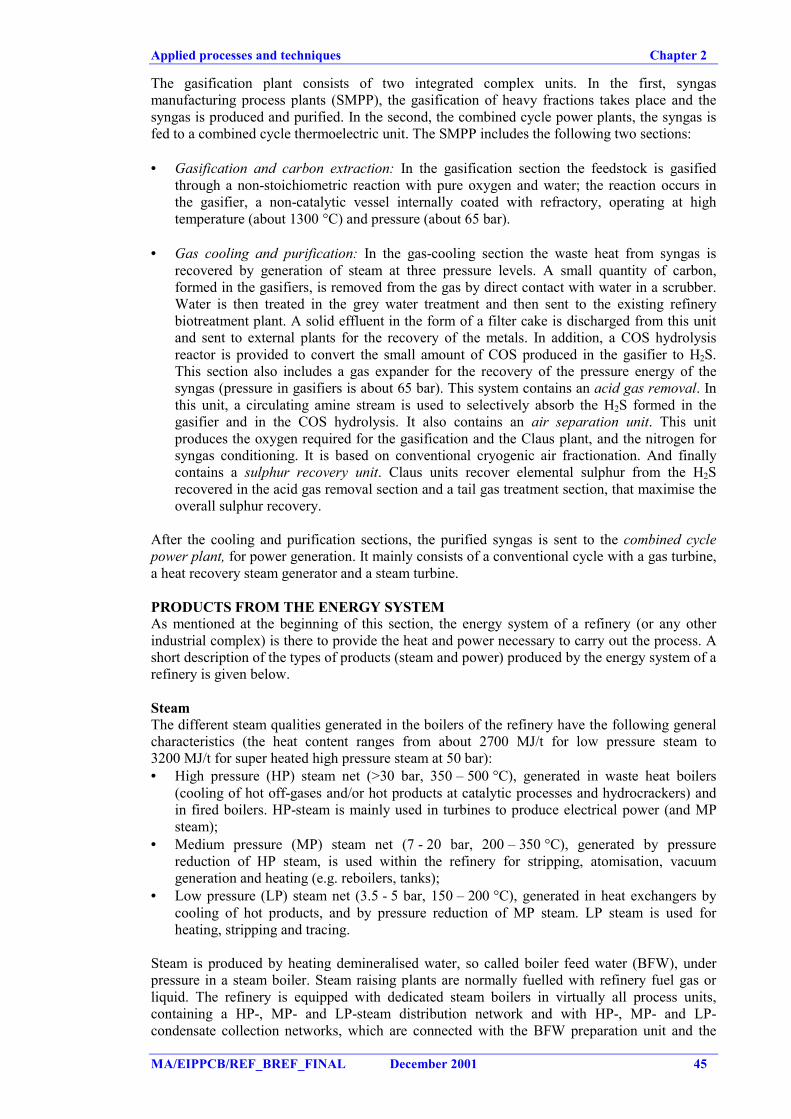
Applied processes and techniques Chapter 2
MA/EIPPCB/REF_BREF_FINAL December 2001 45
The gasification plant consists of two integrated complex units. In the first, syngasmanufacturing process plants (SMPP), the gasification of heavy fractions takes place and thesyngas is produced and purified. In the second, the combined cycle power plants, the syngas isfed to a combined cycle thermoelectric unit. The SMPP includes the following two sections:
• Gasification and carbon extraction: In the gasification section the feedstock is gasifiedthrough a non-stoichiometric reaction with pure oxygen and water; the reaction occurs inthe gasifier, a non-catalytic vessel internally coated with refractory, operating at hightemperature (about 1300 °C) and pressure (about 65 bar).
• Gas cooling and purification: In the gas-cooling section the waste heat from syngas isrecovered by generation of steam at three pressure levels. A small quantity of carbon,formed in the gasifiers, is removed from the gas by direct contact with water in a scrubber.Water is then treated in the grey water treatment and then sent to the existing refinerybiotreatment plant. A solid effluent in the form of a filter cake is discharged from this unitand sent to external plants for the recovery of the metals. In addition, a COS hydrolysisreactor is provided to convert the small amount of COS produced in the gasifier to H2S.This section also includes a gas expander for the recovery of the pressure energy of thesyngas (pressure in gasifiers is about 65 bar). This system contains an acid gas removal. Inthis unit, a circulating amine stream is used to selectively absorb the H2S formed in thegasifier and in the COS hydrolysis. It also contains an air separation unit. This unitproduces the oxygen required for the gasification and the Claus plant, and the nitrogen forsyngas conditioning. It is based on conventional cryogenic air fractionation. And finallycontains a sulphur recovery unit. Claus units recover elemental sulphur from the H2Srecovered in the acid gas removal section and a tail gas treatment section, that maximise theoverall sulphur recovery.
After the cooling and purification sections, the purified syngas is sent to the combined cyclepower plant, for power generation. It mainly consists of a conventional cycle with a gas turbine,a heat recovery steam generator and a steam turbine.
PRODUCTS FROM THE ENERGY SYSTEMAs mentioned at the beginning of this section, the energy system of a refinery (or any otherindustrial complex) is there to provide the heat and power necessary to carry out the process. Ashort description of the types of products (steam and power) produced by the energy system of arefinery is given below.
SteamThe different steam qualities generated in the boilers of the refinery have the following generalcharacteristics (the heat content ranges from about 2700 MJ/t for low pressure steam to3200 MJ/t for super heated high pressure steam at 50 bar):• High pressure (HP) steam net (>30 bar, 350 – 500 °C), generated in waste heat boilers
(cooling of hot off-gases and/or hot products at catalytic processes and hydrocrackers) andin fired boilers. HP-steam is mainly used in turbines to produce electrical power (and MPsteam);
• Medium pressure (MP) steam net (7 - 20 bar, 200 – 350 °C), generated by pressurereduction of HP steam, is used within the refinery for stripping, atomisation, vacuumgeneration and heating (e.g. reboilers, tanks);
• Low pressure (LP) steam net (3.5 - 5 bar, 150 – 200 °C), generated in heat exchangers bycooling of hot products, and by pressure reduction of MP steam. LP steam is used forheating, stripping and tracing.
Steam is produced by heating demineralised water, so called boiler feed water (BFW), underpressure in a steam boiler. Steam raising plants are normally fuelled with refinery fuel gas orliquid. The refinery is equipped with dedicated steam boilers in virtually all process units,containing a HP-, MP- and LP-steam distribution network and with HP-, MP- and LP-condensate collection networks, which are connected with the BFW preparation unit and the
Chapter 2 Applied processes and techniques
46 December 2001 MA/EIPPCB/REF_BREF_FINAL
condensate storage tank. (Reference is made to Figure 2.14 and to the LCP BREF [317,EIPPCB, 2002]).
Steam used in turbines and heaters after cooling is usually recovered as condensate. BFW istherefore a mixture of fresh demineralised make up water (quality dependent on steam pressure)and recovered condensate. BFW make up can be bought in but can also be prepared at therefinery using drinking water, filtered ground water, seawater distillation, surface water or eventreated effluent by using a combination of treatment operations, such as sandfiltration ormicrofiltration (to remove suspended solids) and demineralisation which is accomplished bysubsequent cation and anion exchange (see dotted area in Figure 2.14). Reverse osmosis (toremove ions, colloids and large organic molecules) is usually applied in new plants and isfollowed in some cases by mixed bed ion exchange and active carbon filtration for finalpolishing. The condensate tank is generally equipped with an oil detection system and an oilskimming device. To avoid corrosion in the steam and condensate systems, oxygen and carbondioxide are removed in de-aerators, and oxygen scavengers and corrosion inhibitors are added.After conditioning, the BFW is pumped to the boilers. In boilers the hot flue gases and BFWflow in countercurrent; BFW is preheated in the economiser and further heated in the first andsecond superheater. In order to keep the concentration of dissolved compounds and suspendedsolids in the steam drum constant, a condensate blown down of 1 - 2 % is normally required.
HClTANK
CATIONEXCHANGER DEGASSER
ANIONEXCHANGER
Regeneratecollection
tank
Boiler feedwater make-up
tank
CONDENSATESTORAGE TANK
DAERATOR
Chemicalsconditioning
tank
ECONOMISER
SUPERHEATER 1
SUPERHEATER 2
NaOHTANK
Drinkingwater ofiron-freegroundwater
CO2
Boiler feed water (BFW)Fuel Blowdown
to WWTP
BOILER
Stackemissions
Steam
ELECTRICITY
Condensatereturn
STEAM USERS
Figure 2.14: Typical layout of a boiler feed water preparation unit and a steam boiler
Electrical power is mainly generated in turbines with high-pressure steam but can be also beproduced in gas turbines. Electricity is necessary to run pumps, compressors, control systems,valves, etc. Refinery electrical systems are therefore extensive.
ENERGY MANAGEMENTGood design and management of energy systems are important aspects of minimising theenvironmental impact of a refinery, bearing in mind the highly integrated and interdependentnature of most processes. The normal aim is to match continuously the variable production andconsumption of fuels in processes and utilities at the lowest economic and environmental cost.This issue is also analysed in this document and in Section 2.15 the integration of all thetechniques that may be used in a refinery is examinated. This section is included here becausethe energy efficiency of a refinery can be increased not only by improving the energy efficiencyof the individual processes (which is addressed in each section) or energy efficiency of the
Applied processes and techniques Chapter 2
MA/EIPPCB/REF_BREF_FINAL December 2001 47
energy production system but also by improving energy management, energy conservation andheat integration/recovery within the refinery as a whole.
Energy management has long been an important issue for refineries. For example, managementtechniques such as the ISO 14000 system series or EMAS can provide an appropiate frameworkto develop suitable energy management system and can increase the energy efficiency of therefinery as a whole. Energy conservation techniques such as reporting and incentivating theenergy savings, carrying out combustion improvements or reviewing the energy integration ofthe refinery are some of the techniques that may have a big impact in reducing energyconsumption and consequently in increasing the energy efficiency of a refinery. Other technicaltools to increase that efficiency are the heat integration/recovery techniques, of which examplesare: the installation of waste heat boilers, the installation of expanders to recuperate power andincreasing the insulation of buildings and process units to reduce heat losses. Steammanagement is another good tool for increasing energy efficiency.
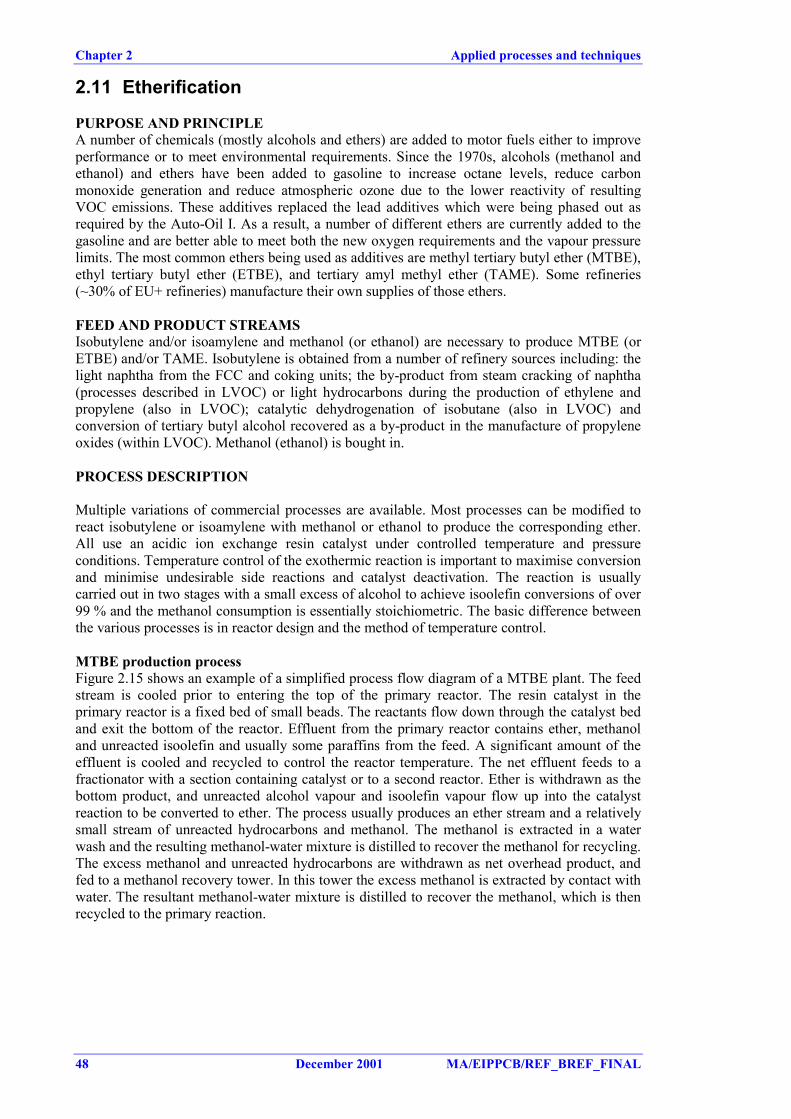
Chapter 2 Applied processes and techniques
48 December 2001 MA/EIPPCB/REF_BREF_FINAL
2.11 Etherification
PURPOSE AND PRINCIPLEA number of chemicals (mostly alcohols and ethers) are added to motor fuels either to improveperformance or to meet environmental requirements. Since the 1970s, alcohols (methanol andethanol) and ethers have been added to gasoline to increase octane levels, reduce carbonmonoxide generation and reduce atmospheric ozone due to the lower reactivity of resultingVOC emissions. These additives replaced the lead additives which were being phased out asrequired by the Auto-Oil I. As a result, a number of different ethers are currently added to thegasoline and are better able to meet both the new oxygen requirements and the vapour pressurelimits. The most common ethers being used as additives are methyl tertiary butyl ether (MTBE),ethyl tertiary butyl ether (ETBE), and tertiary amyl methyl ether (TAME). Some refineries(~30% of EU+ refineries) manufacture their own supplies of those ethers.
FEED AND PRODUCT STREAMSIsobutylene and/or isoamylene and methanol (or ethanol) are necessary to produce MTBE (orETBE) and/or TAME. Isobutylene is obtained from a number of refinery sources including: thelight naphtha from the FCC and coking units; the by-product from steam cracking of naphtha(processes described in LVOC) or light hydrocarbons during the production of ethylene andpropylene (also in LVOC); catalytic dehydrogenation of isobutane (also in LVOC) andconversion of tertiary butyl alcohol recovered as a by-product in the manufacture of propyleneoxides (within LVOC). Methanol (ethanol) is bought in.
PROCESS DESCRIPTION
Multiple variations of commercial processes are available. Most processes can be modified toreact isobutylene or isoamylene with methanol or ethanol to produce the corresponding ether.All use an acidic ion exchange resin catalyst under controlled temperature and pressureconditions. Temperature control of the exothermic reaction is important to maximise conversionand minimise undesirable side reactions and catalyst deactivation. The reaction is usuallycarried out in two stages with a small excess of alcohol to achieve isoolefin conversions of over99 % and the methanol consumption is essentially stoichiometric. The basic difference betweenthe various processes is in reactor design and the method of temperature control.
MTBE production processFigure 2.15 shows an example of a simplified process flow diagram of a MTBE plant. The feedstream is cooled prior to entering the top of the primary reactor. The resin catalyst in theprimary reactor is a fixed bed of small beads. The reactants flow down through the catalyst bedand exit the bottom of the reactor. Effluent from the primary reactor contains ether, methanoland unreacted isoolefin and usually some paraffins from the feed. A significant amount of theeffluent is cooled and recycled to control the reactor temperature. The net effluent feeds to afractionator with a section containing catalyst or to a second reactor. Ether is withdrawn as thebottom product, and unreacted alcohol vapour and isoolefin vapour flow up into the catalystreaction to be converted to ether. The process usually produces an ether stream and a relativelysmall stream of unreacted hydrocarbons and methanol. The methanol is extracted in a waterwash and the resulting methanol-water mixture is distilled to recover the methanol for recycling.The excess methanol and unreacted hydrocarbons are withdrawn as net overhead product, andfed to a methanol recovery tower. In this tower the excess methanol is extracted by contact withwater. The resultant methanol-water mixture is distilled to recover the methanol, which is thenrecycled to the primary reaction.
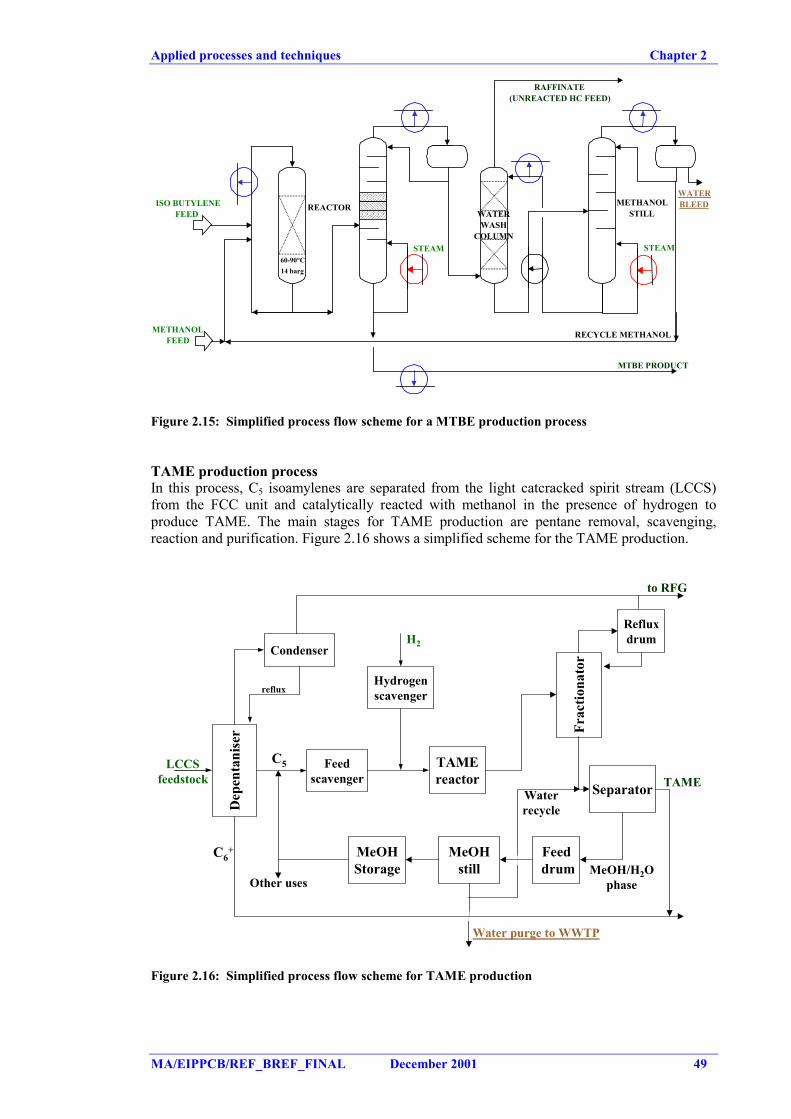
Applied processes and techniques Chapter 2
MA/EIPPCB/REF_BREF_FINAL December 2001 49
MTBE PRODUCT
RAFFINATE(UNREACTED HC FEED)
RECYCLE METHANOLMETHANOL FEED
ISO BUTYLENEFEED
STEAM STEAM
REACTORWATERWASH
COLUMN
METHANOLSTILL
WATERBLEED
60-90°C14 barg
Figure 2.15: Simplified process flow scheme for a MTBE production process
TAME production processIn this process, C5 isoamylenes are separated from the light catcracked spirit stream (LCCS)from the FCC unit and catalytically reacted with methanol in the presence of hydrogen toproduce TAME. The main stages for TAME production are pentane removal, scavenging,reaction and purification. Figure 2.16 shows a simplified scheme for the TAME production.
Dep
enta
nise
r
MeOHStorage
MeOHstill
Feed drum
Separator
Refluxdrum
Frac
tiona
tor
Hydrogenscavenger
TAMEreactor
Feedscavenger
Condenser
reflux
H2
LCCSfeedstock
C5
C6+
Other uses
to RFG
TAME
Water purge to WWTP
MeOH/H2Ophase
Waterrecycle
Figure 2.16: Simplified process flow scheme for TAME production
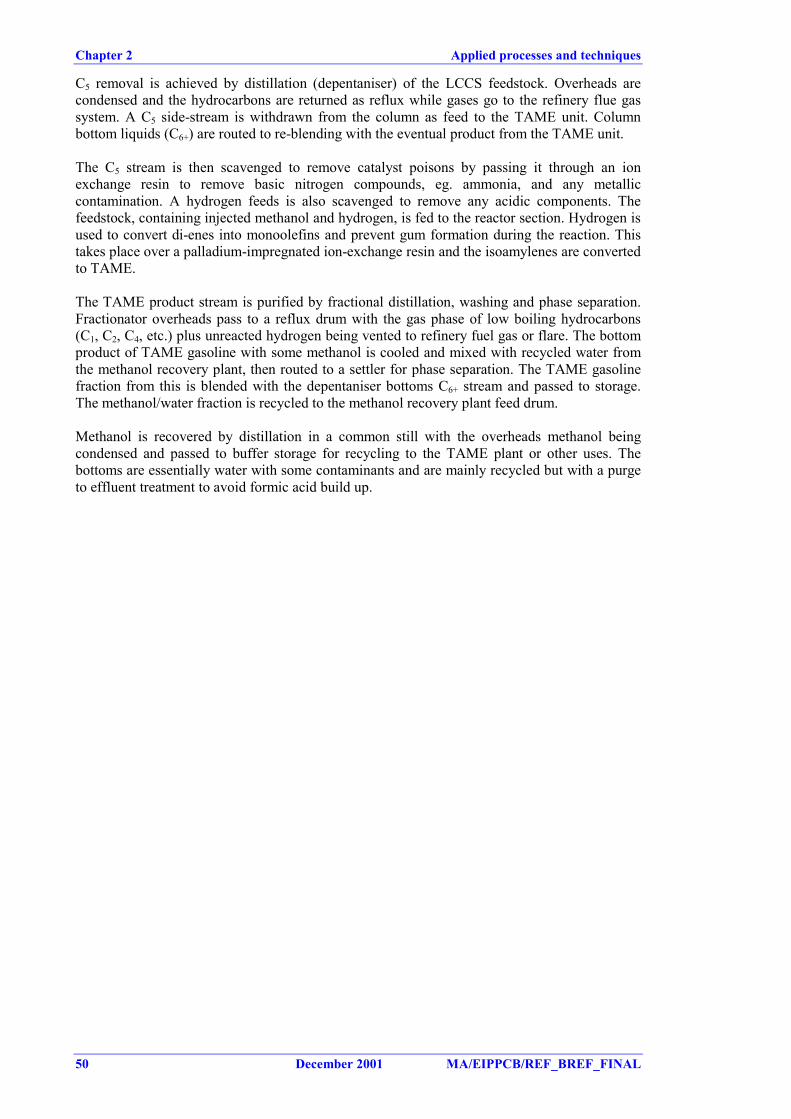
Chapter 2 Applied processes and techniques
50 December 2001 MA/EIPPCB/REF_BREF_FINAL
C5 removal is achieved by distillation (depentaniser) of the LCCS feedstock. Overheads arecondensed and the hydrocarbons are returned as reflux while gases go to the refinery flue gassystem. A C5 side-stream is withdrawn from the column as feed to the TAME unit. Columnbottom liquids (C6+) are routed to re-blending with the eventual product from the TAME unit.
The C5 stream is then scavenged to remove catalyst poisons by passing it through an ionexchange resin to remove basic nitrogen compounds, eg. ammonia, and any metalliccontamination. A hydrogen feeds is also scavenged to remove any acidic components. Thefeedstock, containing injected methanol and hydrogen, is fed to the reactor section. Hydrogen isused to convert di-enes into monoolefins and prevent gum formation during the reaction. Thistakes place over a palladium-impregnated ion-exchange resin and the isoamylenes are convertedto TAME.
The TAME product stream is purified by fractional distillation, washing and phase separation.Fractionator overheads pass to a reflux drum with the gas phase of low boiling hydrocarbons(C1, C2, C4, etc.) plus unreacted hydrogen being vented to refinery fuel gas or flare. The bottomproduct of TAME gasoline with some methanol is cooled and mixed with recycled water fromthe methanol recovery plant, then routed to a settler for phase separation. The TAME gasolinefraction from this is blended with the depentaniser bottoms C6+ stream and passed to storage.The methanol/water fraction is recycled to the methanol recovery plant feed drum.
Methanol is recovered by distillation in a common still with the overheads methanol beingcondensed and passed to buffer storage for recycling to the TAME plant or other uses. Thebottoms are essentially water with some contaminants and are mainly recycled but with a purgeto effluent treatment to avoid formic acid build up.
Applied processes and techniques Chapter 2
MA/EIPPCB/REF_BREF_FINAL December 2001 51
2.12 Gas separation processes
PURPOSE AND PRINCIPLELow boiling hydrocarbons are usually treated in a common separation plant operating atelevated pressures. The purpose of a gas plant is to recover and to separate C1 - C5 and highercompounds from various refinery off-gases by distillation. In mineral oil refineries, one (ormore) gas plant is present to handle different gas streams from different processes. (eg. catreformers, catcrackers, distillation units). Those systems are the core for installations refiningnatural gas (Section 2.17) where the different components are separated. Depending onapplication of the products, some refineries remove mercury from LPG, tops and naphtha.
FEED AND PRODUCT STREAMSThe feed of the gas plant consists of gas and liquid streams from crude distillation, catcrackers,catalytic reformer, alkylation, desulphurisation and similar units. Pretreatment of somefeedstocks may be necessary, typically by hydro-desulphurisation (Section 2.13) or aminetreating (H2S removal, see Section 4.23.5.1). The compounds recovered depend on thecomposition of the feed and the market requirements. The gas streams are normally separatedinto C1 and C2 fractions for sale or use as refinery fuel gas, LPG (propane and butane) and alight gasoline (C5 and higher) stream. Olefins, isoparaffins and n-paraffins can be also separatedin the process.
PROCESS DESCRIPTIONAs a minimum, the gas plant consists of two columns, an absorber/stripper column (de-ethaniser) to strip all light C2-minus components and to maximise recovery of C3-pluscomponents from the feed streams. Figure 2.17 shows a simplified process flow diagram of agas plant.
TREATEDDEBUTANISER LPG
FROM VARIOUS UNITS
GAS VIA AMINETREATER FROMVARIOUS UNITS
STEAM
DEETHANISER DEPROPANISER
STEAM
RECONTACTING SECTION
(OPTIONAL)RefineryFuel Gas
PROPANE TOSTORAGE
BUTANE TOSTORAGE
112°C 110°C
55°C29barg
57°C19barg
25°C 55°C
Figure 2.17: Simplified process flow scheme for a part of a gas plant
The feed stream to the gas plant is cooled and chilled, the residual vapour phase from this beingrouted to a refrigerated absorber, meeting chilled re-cycled light gasoline absorbent. Absorberoverhead is the C1, C2 fraction. The bottoms are combined with the liquid stream from chillingand pass to the first fractionator or de-ethaniser. The first fractionator overheads (essentially C2-ethane) are combined with the absorber overheads while the bottoms pass to the secondfractionator to produce a C3/C4 overheads stream and debutanised gasoline bottoms. Arecontacting section, where vapours from various units are compressed and recontacted with thede-ethaniser overhead can be installed to maximise the C3/C4 recovery. The bottoms of the de-ethanizer column, mainly C3/C4 compounds, are fed to the depropaniser column. This overheadsstream is routed to a third fractionator to split the C3 and C4 streams as overheads (propane) andbottoms (butane) respectively. Products pass to pressurised storage via any final sweetening by
Chapter 2 Applied processes and techniques
52 December 2001 MA/EIPPCB/REF_BREF_FINAL
selective molecular sieve adsorption. Subsequent loading of transport containers is carried outby means such as closed loop systems or by venting and release to the refinery fuel gas system.
The gasoline bottoms stream passes to a fourth fractionator to produce a depentanised fractionfor use as chilled, recycle gasoline on the absorber. The net output is blended to form thegasoline product. A drying step before sending to storage can be necessary (not shown). Also, avessel containing a bed of caustic pellets (not shown) can be installed in the butane system as anadditional guard, although water and H2S should have been removed in the top of the de-ethaniser and depropaniser column. If no (or insufficient) upstream treatment has taken place,this can also be done in the unit itself, e.g. with an amine H2S absorber followed by a mercaptanoxidation/extraction of the de-ethaniser bottoms with amine H2S absorption of the de-ethanisernet overhead gas.
If thermal and/or catalytic cracking units are present, recovery of olefinic components may alsobe worthwhile. It is also possible to separate isobutane from n-butane. The iso-butane can beused as feed to an alkylation unit, while the n-butane (or part of it) can be used as a blendingcomponent in the gasoline pool or isomerisation.
Applied processes and techniques Chapter 2
MA/EIPPCB/REF_BREF_FINAL December 2001 53
2.13 Hydrogen consuming processes
Two types of process are included in this section: hydrocracking and hydrotreatments. Bothprocesses take place over a metal catalyst in a hydrogen atmosphere. Many of those processesare found in a refinery, normally named according to the type of feed to treat and the reactionconditions. The common denominator to those processes is that all rely on hydrogenationprocesses and consequently consume hydrogen. Isomerisation processes of alkanes or olefinsalso consume some hydrogen, but those processes are included in a separate section(Section 2.16).
PURPOSE AND PRINCIPLEHydrotreating and hydroprocessingThey are similar processes used to remove impurities such as sulphur, nitrogen, oxygen, halidesand trace metal impurities that may deactivate process catalysts. Hydrotreating also upgradesthe quality of fractions by converting olefins and diolefins to paraffins for the purpose ofreducing gum formation in fuels. Hydroprocessing, which typically uses residuals from thecrude distillation units, also cracks these heavier molecules to lighter, more saleable products.Both processes are usually placed upstream of those processes in which sulphur and nitrogencould have adverse effects on the catalyst, such as catalytic reforming and hydrocracking units.The processes use catalysts in the presence of substantial amounts of hydrogen under highpressure and temperature to react the feedstocks and impurities with hydrogen.
The hydrotreating process can be divided into a number of reaction categories:hydrodesulphurisation, hydrodenitrification, saturation of olefins and saturation of aromatics. Ahydrotreater unit specifically employed to remove sulphur is usually called ahydrodesulphurisation unit (HDS). In this section the standard hydrotreating of naphtha, mid-distillate and residue type feed streams is discussed:
• A naphtha hydrotreater unit normally serves three purposes, desulphurisation,denitrogenation and stabilising the naphtha feed stream to the downstream isomerisationand reformer units. Stabilising the naphtha streams usually requires the conversion ofunsaturated hydrocarbons produced in thermal and catalytic cracking processes intoparaffins. The selective hydrogenation of light dienes that are contaminants of many lightolefin streams may also be partially hydrogenated. Hydrogenation of aromatics is a variantof either naphtha or of distillate processed.
• A mid-distillate hydrotreater unit normally has two purposes, desulphurisation andhydrogenation of the mid-distillate stream. Stabilising mid-distillate streams is requiredwhen large quantities of cracked components are blended to the mid-distillate pool, andusually requires partial saturation of aromatics and olefins and reduction of the N-content.The saturation of aromatics may be required to saturated in naphtha, kerosene, and dieselfeedstocks. Among the applications of this process are smoke-point improvements inaircraft turbine fuels, reduction of the aromatic content of solvent stocks to meetrequirements for air pollution control, production of cyclohexane from benzene (LVOC)and cetane number improvement in diesel fuels.
• Diesel Oil deep desulphurisation (Hydrofining) is normally done to heating and diesel oilsto meet product sulphur specifications. Other reasons are to improve colour and sedimentstability.
• Residue hydrotreating is mainly applied to improve the residue feed quality (normallyatmospheric residue) to a residue catalytic cracker (RCC) unit. RCCs are restricted toprocess residue streams by their metal content and Concarbon number.
Hydroprocessing may also be designed to remove low levels of metals from the feed. Themetals to be removed include nickel and vanadium, which are native to the crude oil, as well assilicon and lead-containing metals that may be added elsewhere in the refinery.
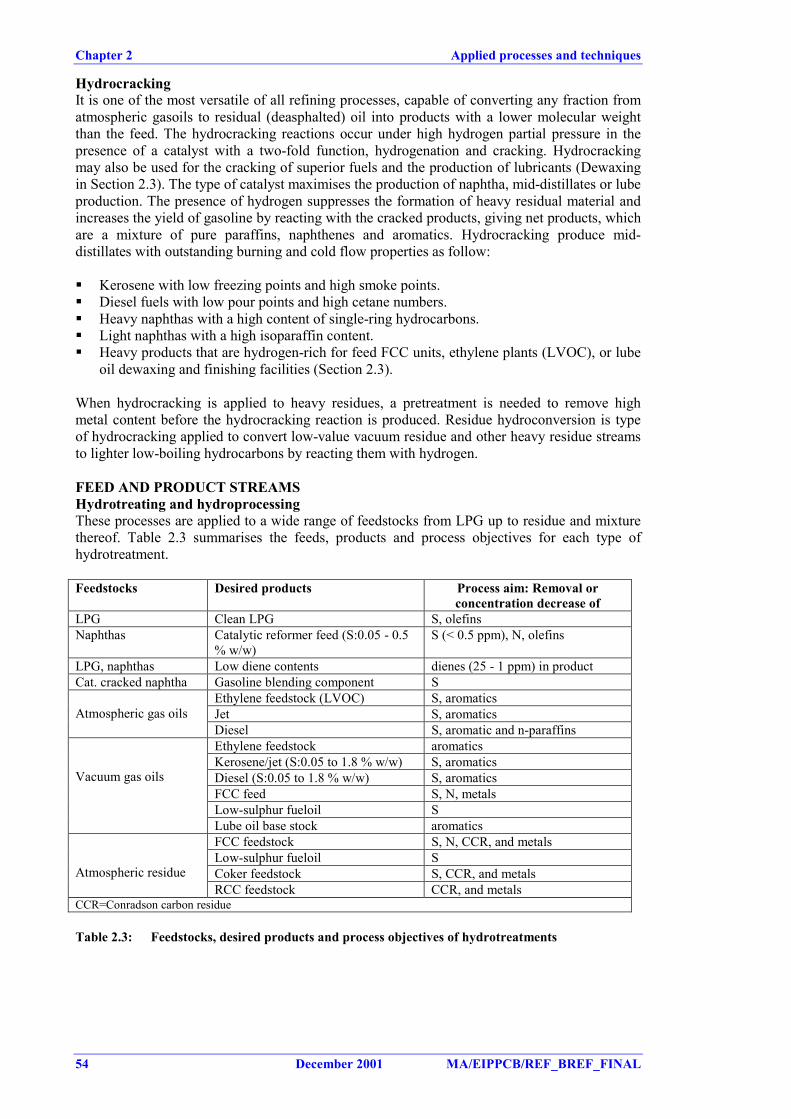
Chapter 2 Applied processes and techniques
54 December 2001 MA/EIPPCB/REF_BREF_FINAL
HydrocrackingIt is one of the most versatile of all refining processes, capable of converting any fraction fromatmospheric gasoils to residual (deasphalted) oil into products with a lower molecular weightthan the feed. The hydrocracking reactions occur under high hydrogen partial pressure in thepresence of a catalyst with a two-fold function, hydrogenation and cracking. Hydrocrackingmay also be used for the cracking of superior fuels and the production of lubricants (Dewaxingin Section 2.3). The type of catalyst maximises the production of naphtha, mid-distillates or lubeproduction. The presence of hydrogen suppresses the formation of heavy residual material andincreases the yield of gasoline by reacting with the cracked products, giving net products, whichare a mixture of pure paraffins, naphthenes and aromatics. Hydrocracking produce mid-distillates with outstanding burning and cold flow properties as follow:
� Kerosene with low freezing points and high smoke points.� Diesel fuels with low pour points and high cetane numbers.� Heavy naphthas with a high content of single-ring hydrocarbons.� Light naphthas with a high isoparaffin content.� Heavy products that are hydrogen-rich for feed FCC units, ethylene plants (LVOC), or lube
oil dewaxing and finishing facilities (Section 2.3).
When hydrocracking is applied to heavy residues, a pretreatment is needed to remove highmetal content before the hydrocracking reaction is produced. Residue hydroconversion is typeof hydrocracking applied to convert low-value vacuum residue and other heavy residue streamsto lighter low-boiling hydrocarbons by reacting them with hydrogen.
FEED AND PRODUCT STREAMSHydrotreating and hydroprocessingThese processes are applied to a wide range of feedstocks from LPG up to residue and mixturethereof. Table 2.3 summarises the feeds, products and process objectives for each type ofhydrotreatment.
Feedstocks Desired products Process aim: Removal orconcentration decrease of
LPG Clean LPG S, olefinsNaphthas Catalytic reformer feed (S:0.05 - 0.5
% w/w)S (< 0.5 ppm), N, olefins
LPG, naphthas Low diene contents dienes (25 - 1 ppm) in productCat. cracked naphtha Gasoline blending component S
Ethylene feedstock (LVOC) S, aromaticsJet S, aromaticsAtmospheric gas oilsDiesel S, aromatic and n-paraffinsEthylene feedstock aromaticsKerosene/jet (S:0.05 to 1.8 % w/w) S, aromaticsDiesel (S:0.05 to 1.8 % w/w) S, aromaticsFCC feed S, N, metalsLow-sulphur fueloil S
Vacuum gas oils
Lube oil base stock aromaticsFCC feedstock S, N, CCR, and metalsLow-sulphur fueloil SCoker feedstock S, CCR, and metalsAtmospheric residueRCC feedstock CCR, and metals
CCR=Conradson carbon residue
Table 2.3: Feedstocks, desired products and process objectives of hydrotreatments
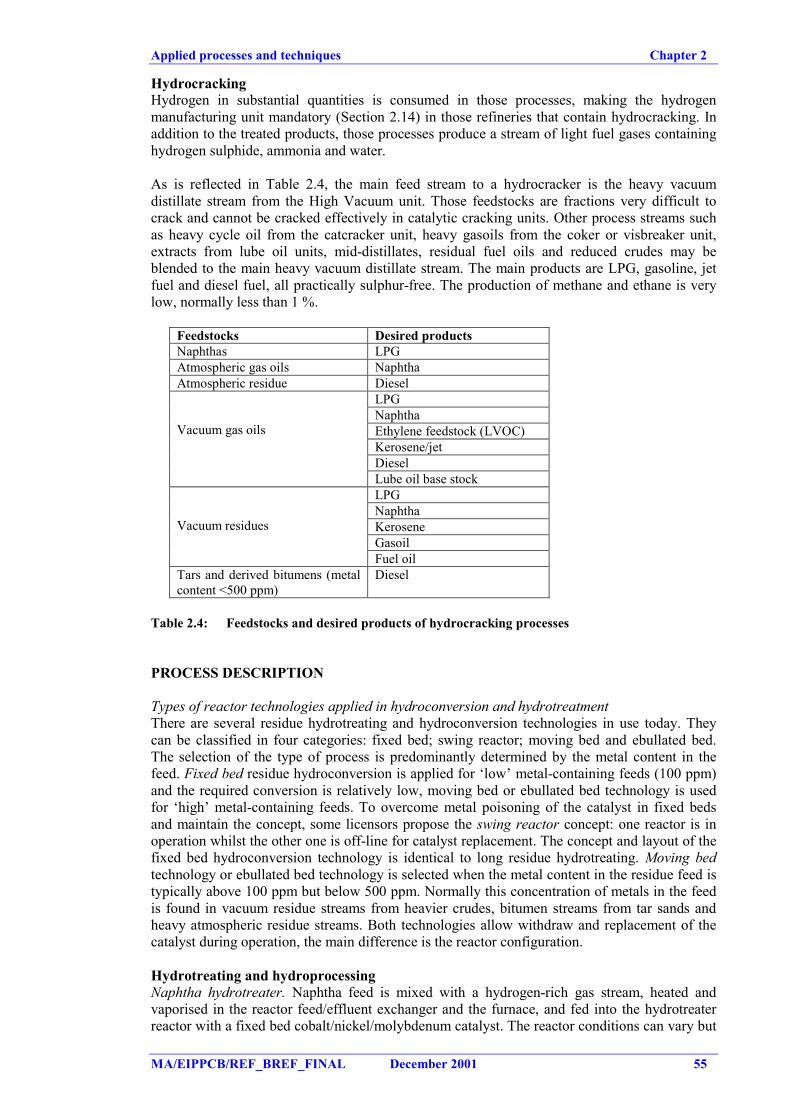
Applied processes and techniques Chapter 2
MA/EIPPCB/REF_BREF_FINAL December 2001 55
HydrocrackingHydrogen in substantial quantities is consumed in those processes, making the hydrogenmanufacturing unit mandatory (Section 2.14) in those refineries that contain hydrocracking. Inaddition to the treated products, those processes produce a stream of light fuel gases containinghydrogen sulphide, ammonia and water.
As is reflected in Table 2.4, the main feed stream to a hydrocracker is the heavy vacuumdistillate stream from the High Vacuum unit. Those feedstocks are fractions very difficult tocrack and cannot be cracked effectively in catalytic cracking units. Other process streams suchas heavy cycle oil from the catcracker unit, heavy gasoils from the coker or visbreaker unit,extracts from lube oil units, mid-distillates, residual fuel oils and reduced crudes may beblended to the main heavy vacuum distillate stream. The main products are LPG, gasoline, jetfuel and diesel fuel, all practically sulphur-free. The production of methane and ethane is verylow, normally less than 1 %.
Feedstocks Desired productsNaphthas LPGAtmospheric gas oils NaphthaAtmospheric residue Diesel
LPGNaphthaEthylene feedstock (LVOC)Kerosene/jetDiesel
Vacuum gas oils
Lube oil base stockLPGNaphthaKeroseneGasoil
Vacuum residues
Fuel oilTars and derived bitumens (metalcontent <500 ppm)
Diesel
Table 2.4: Feedstocks and desired products of hydrocracking processes
PROCESS DESCRIPTION
Types of reactor technologies applied in hydroconversion and hydrotreatmentThere are several residue hydrotreating and hydroconversion technologies in use today. Theycan be classified in four categories: fixed bed; swing reactor; moving bed and ebullated bed.The selection of the type of process is predominantly determined by the metal content in thefeed. Fixed bed residue hydroconversion is applied for ‘low’ metal-containing feeds (100 ppm)and the required conversion is relatively low, moving bed or ebullated bed technology is usedfor ‘high’ metal-containing feeds. To overcome metal poisoning of the catalyst in fixed bedsand maintain the concept, some licensors propose the swing reactor concept: one reactor is inoperation whilst the other one is off-line for catalyst replacement. The concept and layout of thefixed bed hydroconversion technology is identical to long residue hydrotreating. Moving bedtechnology or ebullated bed technology is selected when the metal content in the residue feed istypically above 100 ppm but below 500 ppm. Normally this concentration of metals in the feedis found in vacuum residue streams from heavier crudes, bitumen streams from tar sands andheavy atmospheric residue streams. Both technologies allow withdraw and replacement of thecatalyst during operation, the main difference is the reactor configuration.
Hydrotreating and hydroprocessingNaphtha hydrotreater. Naphtha feed is mixed with a hydrogen-rich gas stream, heated andvaporised in the reactor feed/effluent exchanger and the furnace, and fed into the hydrotreaterreactor with a fixed bed cobalt/nickel/molybdenum catalyst. The reactor conditions can vary but
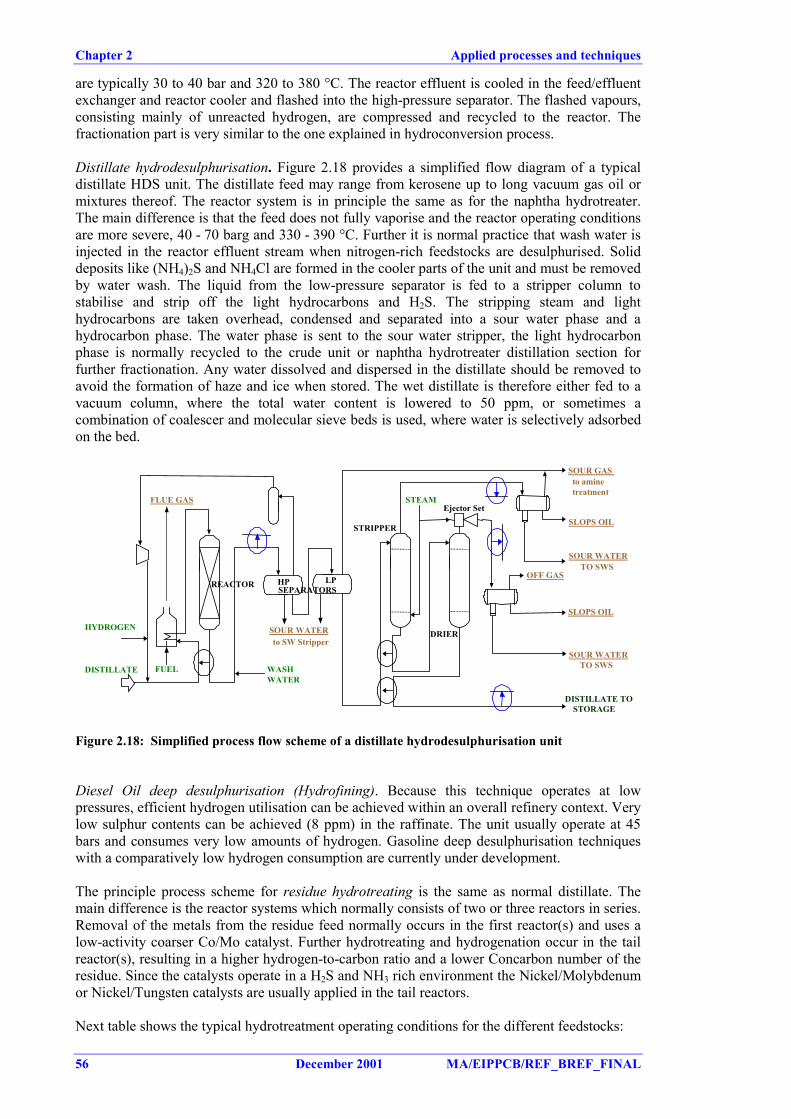
Chapter 2 Applied processes and techniques
56 December 2001 MA/EIPPCB/REF_BREF_FINAL
are typically 30 to 40 bar and 320 to 380 °C. The reactor effluent is cooled in the feed/effluentexchanger and reactor cooler and flashed into the high-pressure separator. The flashed vapours,consisting mainly of unreacted hydrogen, are compressed and recycled to the reactor. Thefractionation part is very similar to the one explained in hydroconversion process.
Distillate hydrodesulphurisation. Figure 2.18 provides a simplified flow diagram of a typicaldistillate HDS unit. The distillate feed may range from kerosene up to long vacuum gas oil ormixtures thereof. The reactor system is in principle the same as for the naphtha hydrotreater.The main difference is that the feed does not fully vaporise and the reactor operating conditionsare more severe, 40 - 70 barg and 330 - 390 °C. Further it is normal practice that wash water isinjected in the reactor effluent stream when nitrogen-rich feedstocks are desulphurised. Soliddeposits like (NH4)2S and NH4Cl are formed in the cooler parts of the unit and must be removedby water wash. The liquid from the low-pressure separator is fed to a stripper column tostabilise and strip off the light hydrocarbons and H2S. The stripping steam and lighthydrocarbons are taken overhead, condensed and separated into a sour water phase and ahydrocarbon phase. The water phase is sent to the sour water stripper, the light hydrocarbonphase is normally recycled to the crude unit or naphtha hydrotreater distillation section forfurther fractionation. Any water dissolved and dispersed in the distillate should be removed toavoid the formation of haze and ice when stored. The wet distillate is therefore either fed to avacuum column, where the total water content is lowered to 50 ppm, or sometimes acombination of coalescer and molecular sieve beds is used, where water is selectively adsorbedon the bed.
SOUR GAS to aminetreatment
DISTILLATE
SOUR WATERTO SWS
SOUR WATER TO SWS
SLOPS OIL
SLOPS OIL
DISTILLATE TOSTORAGE
HYDROGEN
REACTOR
WASHWATER
STRIPPER
DRIER
Ejector SetSTEAM
OFF GAS
SOUR WATERto SW Stripper
FUEL
FLUE GAS
HP LPSEPARATORS
Figure 2.18: Simplified process flow scheme of a distillate hydrodesulphurisation unit
Diesel Oil deep desulphurisation (Hydrofining). Because this technique operates at lowpressures, efficient hydrogen utilisation can be achieved within an overall refinery context. Verylow sulphur contents can be achieved (8 ppm) in the raffinate. The unit usually operate at 45bars and consumes very low amounts of hydrogen. Gasoline deep desulphurisation techniqueswith a comparatively low hydrogen consumption are currently under development.
The principle process scheme for residue hydrotreating is the same as normal distillate. Themain difference is the reactor systems which normally consists of two or three reactors in series.Removal of the metals from the residue feed normally occurs in the first reactor(s) and uses alow-activity coarser Co/Mo catalyst. Further hydrotreating and hydrogenation occur in the tailreactor(s), resulting in a higher hydrogen-to-carbon ratio and a lower Concarbon number of theresidue. Since the catalysts operate in a H2S and NH3 rich environment the Nickel/Molybdenumor Nickel/Tungsten catalysts are usually applied in the tail reactors.
Next table shows the typical hydrotreatment operating conditions for the different feedstocks:
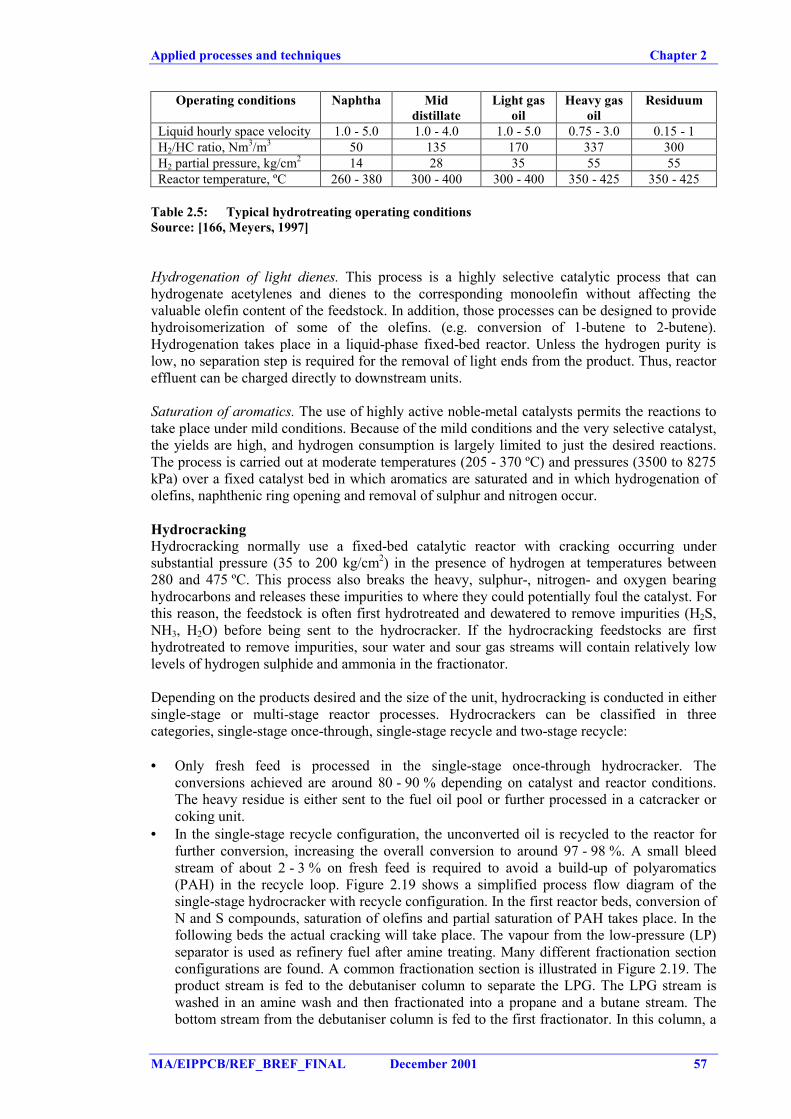
Applied processes and techniques Chapter 2
MA/EIPPCB/REF_BREF_FINAL December 2001 57
Operating conditions Naphtha Middistillate
Light gasoil
Heavy gasoil
Residuum
Liquid hourly space velocity 1.0 - 5.0 1.0 - 4.0 1.0 - 5.0 0.75 - 3.0 0.15 - 1H2/HC ratio, Nm3/m3 50 135 170 337 300H2 partial pressure, kg/cm2 14 28 35 55 55Reactor temperature, ºC 260 - 380 300 - 400 300 - 400 350 - 425 350 - 425
Table 2.5: Typical hydrotreating operating conditionsSource: [166, Meyers, 1997]
Hydrogenation of light dienes. This process is a highly selective catalytic process that canhydrogenate acetylenes and dienes to the corresponding monoolefin without affecting thevaluable olefin content of the feedstock. In addition, those processes can be designed to providehydroisomerization of some of the olefins. (e.g. conversion of 1-butene to 2-butene).Hydrogenation takes place in a liquid-phase fixed-bed reactor. Unless the hydrogen purity islow, no separation step is required for the removal of light ends from the product. Thus, reactoreffluent can be charged directly to downstream units.
Saturation of aromatics. The use of highly active noble-metal catalysts permits the reactions totake place under mild conditions. Because of the mild conditions and the very selective catalyst,the yields are high, and hydrogen consumption is largely limited to just the desired reactions.The process is carried out at moderate temperatures (205 - 370 ºC) and pressures (3500 to 8275kPa) over a fixed catalyst bed in which aromatics are saturated and in which hydrogenation ofolefins, naphthenic ring opening and removal of sulphur and nitrogen occur.
HydrocrackingHydrocracking normally use a fixed-bed catalytic reactor with cracking occurring undersubstantial pressure (35 to 200 kg/cm2) in the presence of hydrogen at temperatures between280 and 475 ºC. This process also breaks the heavy, sulphur-, nitrogen- and oxygen bearinghydrocarbons and releases these impurities to where they could potentially foul the catalyst. Forthis reason, the feedstock is often first hydrotreated and dewatered to remove impurities (H2S,NH3, H2O) before being sent to the hydrocracker. If the hydrocracking feedstocks are firsthydrotreated to remove impurities, sour water and sour gas streams will contain relatively lowlevels of hydrogen sulphide and ammonia in the fractionator.
Depending on the products desired and the size of the unit, hydrocracking is conducted in eithersingle-stage or multi-stage reactor processes. Hydrocrackers can be classified in threecategories, single-stage once-through, single-stage recycle and two-stage recycle:
• Only fresh feed is processed in the single-stage once-through hydrocracker. Theconversions achieved are around 80 - 90 % depending on catalyst and reactor conditions.The heavy residue is either sent to the fuel oil pool or further processed in a catcracker orcoking unit.
• In the single-stage recycle configuration, the unconverted oil is recycled to the reactor forfurther conversion, increasing the overall conversion to around 97 - 98 %. A small bleedstream of about 2 - 3 % on fresh feed is required to avoid a build-up of polyaromatics(PAH) in the recycle loop. Figure 2.19 shows a simplified process flow diagram of thesingle-stage hydrocracker with recycle configuration. In the first reactor beds, conversion ofN and S compounds, saturation of olefins and partial saturation of PAH takes place. In thefollowing beds the actual cracking will take place. The vapour from the low-pressure (LP)separator is used as refinery fuel after amine treating. Many different fractionation sectionconfigurations are found. A common fractionation section is illustrated in Figure 2.19. Theproduct stream is fed to the debutaniser column to separate the LPG. The LPG stream iswashed in an amine wash and then fractionated into a propane and a butane stream. Thebottom stream from the debutaniser column is fed to the first fractionator. In this column, a
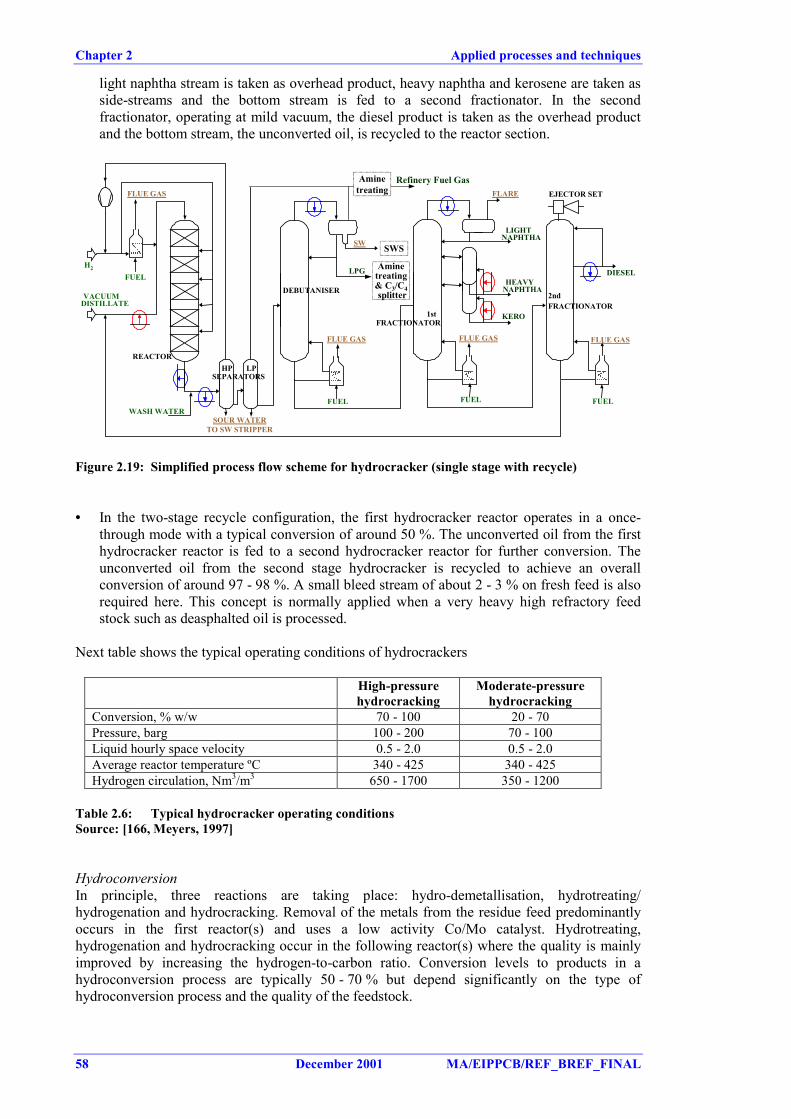
Chapter 2 Applied processes and techniques
58 December 2001 MA/EIPPCB/REF_BREF_FINAL
light naphtha stream is taken as overhead product, heavy naphtha and kerosene are taken asside-streams and the bottom stream is fed to a second fractionator. In the secondfractionator, operating at mild vacuum, the diesel product is taken as the overhead productand the bottom stream, the unconverted oil, is recycled to the reactor section.
H2
VACUUMDISTILLATE
Refinery Fuel Gas
LPG
SW
FLARE
HEAVYNAPHTHA
KERO
LIGHTNAPHTHA
1stFRACTIONATOR
DIESEL
EJECTOR SET
2ndFRACTIONATOR
SOUR WATERTO SW STRIPPER
WASH WATER
FLUE GAS
FUEL
FLUE GAS
FUEL
FLUE GAS
FUEL
FLUE GAS
FUEL
Aminetreating
DEBUTANISER
REACTORLPHP
SEPARATORS
Aminetreating& C3/C4 splitter
SWS
Figure 2.19: Simplified process flow scheme for hydrocracker (single stage with recycle)
• In the two-stage recycle configuration, the first hydrocracker reactor operates in a once-through mode with a typical conversion of around 50 %. The unconverted oil from the firsthydrocracker reactor is fed to a second hydrocracker reactor for further conversion. Theunconverted oil from the second stage hydrocracker is recycled to achieve an overallconversion of around 97 - 98 %. A small bleed stream of about 2 - 3 % on fresh feed is alsorequired here. This concept is normally applied when a very heavy high refractory feedstock such as deasphalted oil is processed.
Next table shows the typical operating conditions of hydrocrackers
High-pressurehydrocracking
Moderate-pressurehydrocracking
Conversion, % w/w 70 - 100 20 - 70Pressure, barg 100 - 200 70 - 100Liquid hourly space velocity 0.5 - 2.0 0.5 - 2.0Average reactor temperature ºC 340 - 425 340 - 425Hydrogen circulation, Nm3/m3 650 - 1700 350 - 1200
Table 2.6: Typical hydrocracker operating conditionsSource: [166, Meyers, 1997]
HydroconversionIn principle, three reactions are taking place: hydro-demetallisation, hydrotreating/hydrogenation and hydrocracking. Removal of the metals from the residue feed predominantlyoccurs in the first reactor(s) and uses a low activity Co/Mo catalyst. Hydrotreating,hydrogenation and hydrocracking occur in the following reactor(s) where the quality is mainlyimproved by increasing the hydrogen-to-carbon ratio. Conversion levels to products in ahydroconversion process are typically 50 - 70 % but depend significantly on the type ofhydroconversion process and the quality of the feedstock.
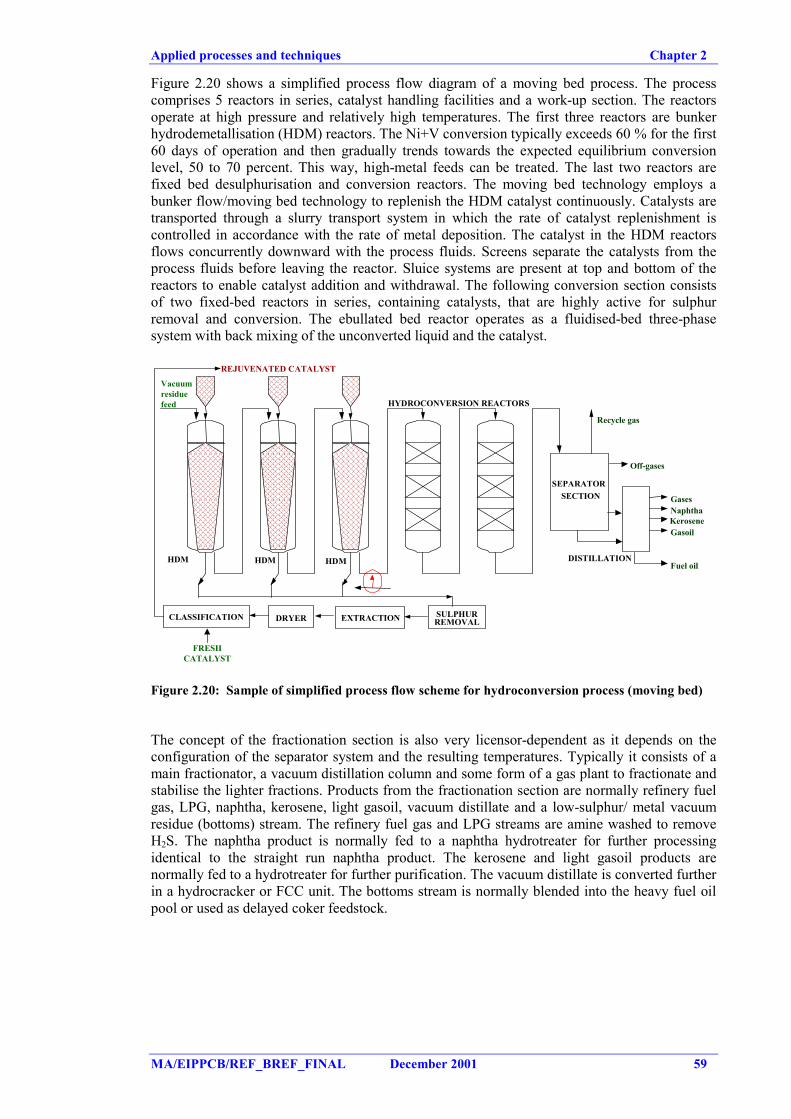
Applied processes and techniques Chapter 2
MA/EIPPCB/REF_BREF_FINAL December 2001 59
Figure 2.20 shows a simplified process flow diagram of a moving bed process. The processcomprises 5 reactors in series, catalyst handling facilities and a work-up section. The reactorsoperate at high pressure and relatively high temperatures. The first three reactors are bunkerhydrodemetallisation (HDM) reactors. The Ni+V conversion typically exceeds 60 % for the first60 days of operation and then gradually trends towards the expected equilibrium conversionlevel, 50 to 70 percent. This way, high-metal feeds can be treated. The last two reactors arefixed bed desulphurisation and conversion reactors. The moving bed technology employs abunker flow/moving bed technology to replenish the HDM catalyst continuously. Catalysts aretransported through a slurry transport system in which the rate of catalyst replenishment iscontrolled in accordance with the rate of metal deposition. The catalyst in the HDM reactorsflows concurrently downward with the process fluids. Screens separate the catalysts from theprocess fluids before leaving the reactor. Sluice systems are present at top and bottom of thereactors to enable catalyst addition and withdrawal. The following conversion section consistsof two fixed-bed reactors in series, containing catalysts, that are highly active for sulphurremoval and conversion. The ebullated bed reactor operates as a fluidised-bed three-phasesystem with back mixing of the unconverted liquid and the catalyst.
REJUVENATED CATALYST
SEPARATORSECTION
Off-gases
Recycle gas
GasesNaphthaKeroseneGasoil
Fuel oilDISTILLATION
HYDROCONVERSION REACTORS
HDM HDMHDM
Vacuumresiduefeed
SULPHURREMOVALEXTRACTIONDRYERCLASSIFICATION
FRESHCATALYST
Figure 2.20: Sample of simplified process flow scheme for hydroconversion process (moving bed)
The concept of the fractionation section is also very licensor-dependent as it depends on theconfiguration of the separator system and the resulting temperatures. Typically it consists of amain fractionator, a vacuum distillation column and some form of a gas plant to fractionate andstabilise the lighter fractions. Products from the fractionation section are normally refinery fuelgas, LPG, naphtha, kerosene, light gasoil, vacuum distillate and a low-sulphur/ metal vacuumresidue (bottoms) stream. The refinery fuel gas and LPG streams are amine washed to removeH2S. The naphtha product is normally fed to a naphtha hydrotreater for further processingidentical to the straight run naphtha product. The kerosene and light gasoil products arenormally fed to a hydrotreater for further purification. The vacuum distillate is converted furtherin a hydrocracker or FCC unit. The bottoms stream is normally blended into the heavy fuel oilpool or used as delayed coker feedstock.
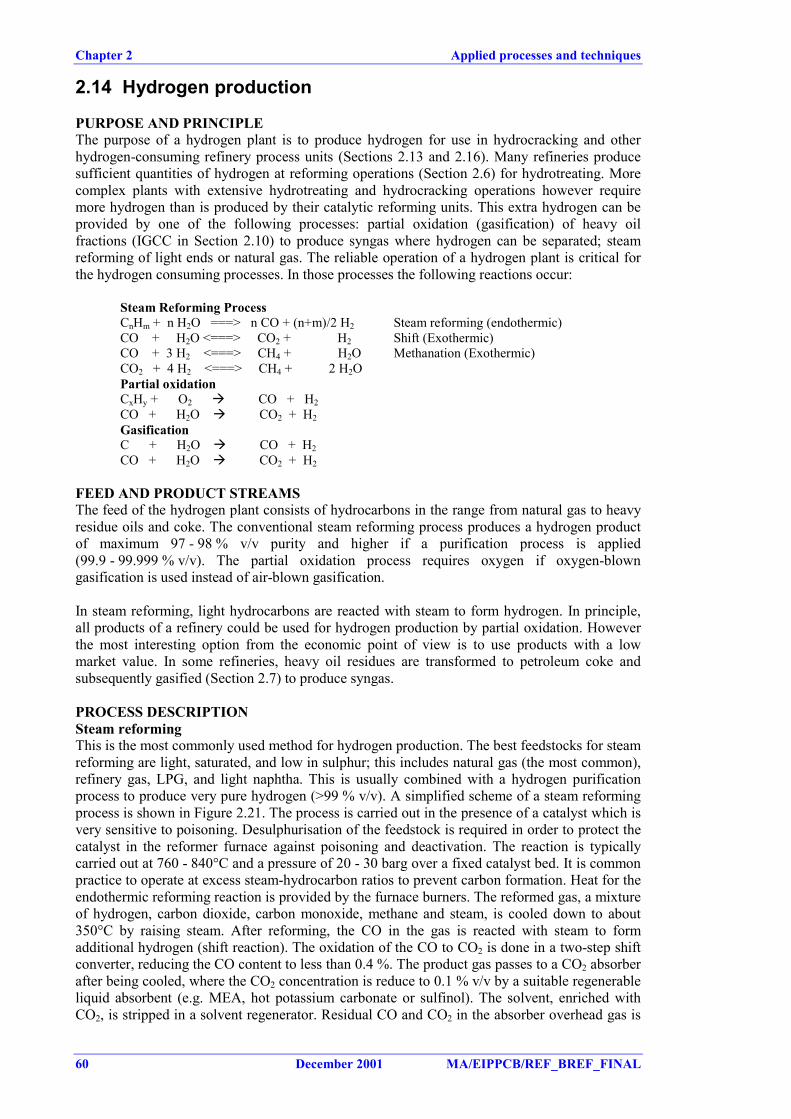
Chapter 2 Applied processes and techniques
60 December 2001 MA/EIPPCB/REF_BREF_FINAL
2.14 Hydrogen production
PURPOSE AND PRINCIPLEThe purpose of a hydrogen plant is to produce hydrogen for use in hydrocracking and otherhydrogen-consuming refinery process units (Sections 2.13 and 2.16). Many refineries producesufficient quantities of hydrogen at reforming operations (Section 2.6) for hydrotreating. Morecomplex plants with extensive hydrotreating and hydrocracking operations however requiremore hydrogen than is produced by their catalytic reforming units. This extra hydrogen can beprovided by one of the following processes: partial oxidation (gasification) of heavy oilfractions (IGCC in Section 2.10) to produce syngas where hydrogen can be separated; steamreforming of light ends or natural gas. The reliable operation of a hydrogen plant is critical forthe hydrogen consuming processes. In those processes the following reactions occur:
Steam Reforming ProcessCnHm + n H2O ===> n CO + (n+m)/2 H2 Steam reforming (endothermic)CO + H2O <===> CO2 + H2 Shift (Exothermic)CO + 3 H2 <===> CH4 + H2OCO2 + 4 H2 <===> CH4 + 2 H2O
Methanation (Exothermic)
Partial oxidationCxHy + O2 � CO + H2CO + H2O � CO2 + H2GasificationC + H2O � CO + H2CO + H2O � CO2 + H2
FEED AND PRODUCT STREAMSThe feed of the hydrogen plant consists of hydrocarbons in the range from natural gas to heavyresidue oils and coke. The conventional steam reforming process produces a hydrogen productof maximum 97 - 98 % v/v purity and higher if a purification process is applied(99.9 - 99.999 % v/v). The partial oxidation process requires oxygen if oxygen-blowngasification is used instead of air-blown gasification.
In steam reforming, light hydrocarbons are reacted with steam to form hydrogen. In principle,all products of a refinery could be used for hydrogen production by partial oxidation. Howeverthe most interesting option from the economic point of view is to use products with a lowmarket value. In some refineries, heavy oil residues are transformed to petroleum coke andsubsequently gasified (Section 2.7) to produce syngas.
PROCESS DESCRIPTIONSteam reformingThis is the most commonly used method for hydrogen production. The best feedstocks for steamreforming are light, saturated, and low in sulphur; this includes natural gas (the most common),refinery gas, LPG, and light naphtha. This is usually combined with a hydrogen purificationprocess to produce very pure hydrogen (>99 % v/v). A simplified scheme of a steam reformingprocess is shown in Figure 2.21. The process is carried out in the presence of a catalyst which isvery sensitive to poisoning. Desulphurisation of the feedstock is required in order to protect thecatalyst in the reformer furnace against poisoning and deactivation. The reaction is typicallycarried out at 760 - 840°C and a pressure of 20 - 30 barg over a fixed catalyst bed. It is commonpractice to operate at excess steam-hydrocarbon ratios to prevent carbon formation. Heat for theendothermic reforming reaction is provided by the furnace burners. The reformed gas, a mixtureof hydrogen, carbon dioxide, carbon monoxide, methane and steam, is cooled down to about350°C by raising steam. After reforming, the CO in the gas is reacted with steam to formadditional hydrogen (shift reaction). The oxidation of the CO to CO2 is done in a two-step shiftconverter, reducing the CO content to less than 0.4 %. The product gas passes to a CO2 absorberafter being cooled, where the CO2 concentration is reduce to 0.1 % v/v by a suitable regenerableliquid absorbent (e.g. MEA, hot potassium carbonate or sulfinol). The solvent, enriched withCO2, is stripped in a solvent regenerator. Residual CO and CO2 in the absorber overhead gas is
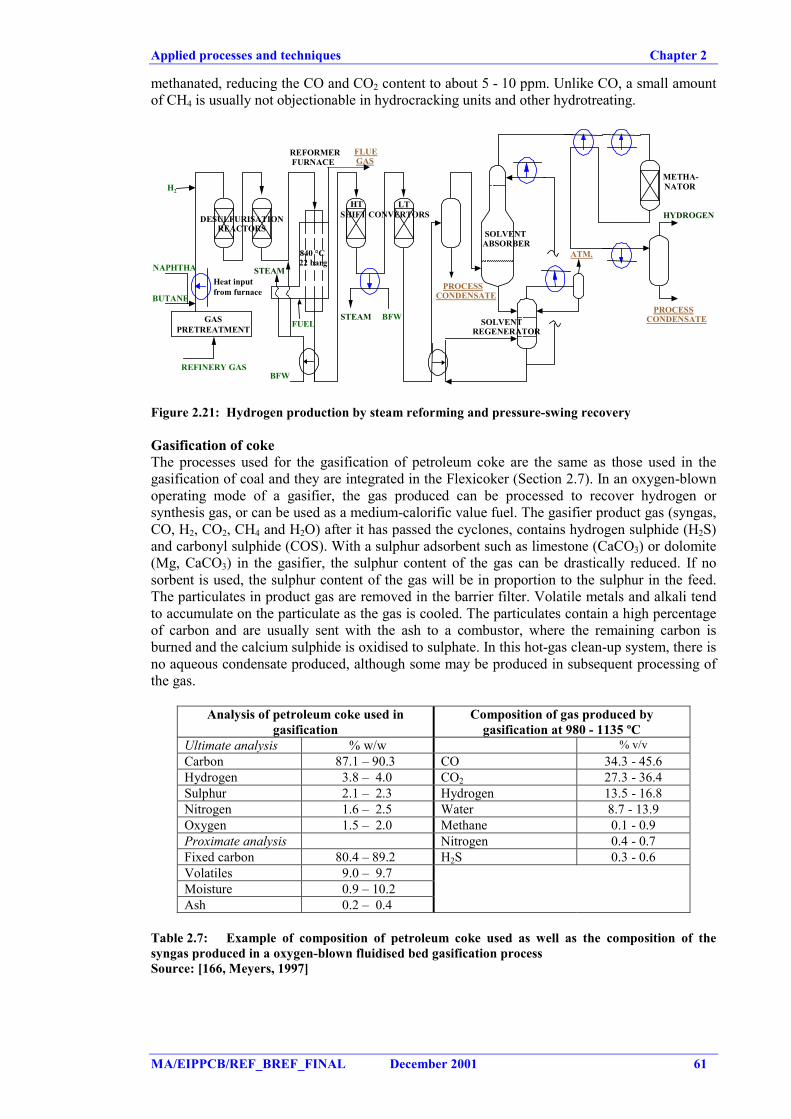
Applied processes and techniques Chapter 2
MA/EIPPCB/REF_BREF_FINAL December 2001 61
methanated, reducing the CO and CO2 content to about 5 - 10 ppm. Unlike CO, a small amountof CH4 is usually not objectionable in hydrocracking units and other hydrotreating.
DESULFURISATIONREACTORS
GASPRETREATMENT
REFINERY GASBFW
STEAM
REFORMERFURNACE
HT SHIFT CONVERTORS
LT
SOLVENTABSORBER
SOLVENTREGENERATOR
ATM.
METHA-NATOR
HYDROGEN
PROCESSCONDENSATE
PROCESSCONDENSATE
NAPHTHA
BUTANE
H2
Heat inputfrom furnace
BFWSTEAM
840 °C22 barg
FUEL
FLUEGAS
Figure 2.21: Hydrogen production by steam reforming and pressure-swing recovery
Gasification of cokeThe processes used for the gasification of petroleum coke are the same as those used in thegasification of coal and they are integrated in the Flexicoker (Section 2.7). In an oxygen-blownoperating mode of a gasifier, the gas produced can be processed to recover hydrogen orsynthesis gas, or can be used as a medium-calorific value fuel. The gasifier product gas (syngas,CO, H2, CO2, CH4 and H2O) after it has passed the cyclones, contains hydrogen sulphide (H2S)and carbonyl sulphide (COS). With a sulphur adsorbent such as limestone (CaCO3) or dolomite(Mg, CaCO3) in the gasifier, the sulphur content of the gas can be drastically reduced. If nosorbent is used, the sulphur content of the gas will be in proportion to the sulphur in the feed.The particulates in product gas are removed in the barrier filter. Volatile metals and alkali tendto accumulate on the particulate as the gas is cooled. The particulates contain a high percentageof carbon and are usually sent with the ash to a combustor, where the remaining carbon isburned and the calcium sulphide is oxidised to sulphate. In this hot-gas clean-up system, there isno aqueous condensate produced, although some may be produced in subsequent processing ofthe gas.
Analysis of petroleum coke used ingasification
Composition of gas produced bygasification at 980 - 1135 ºC
Ultimate analysis % w/w % v/vCarbon 87.1 – 90.3 CO 34.3 - 45.6Hydrogen 3.8 – 4.0 CO2 27.3 - 36.4Sulphur 2.1 – 2.3 Hydrogen 13.5 - 16.8Nitrogen 1.6 – 2.5 Water 8.7 - 13.9Oxygen 1.5 – 2.0 Methane 0.1 - 0.9Proximate analysis Nitrogen 0.4 - 0.7Fixed carbon 80.4 – 89.2 H2S 0.3 - 0.6Volatiles 9.0 – 9.7Moisture 0.9 – 10.2Ash 0.2 – 0.4
Table 2.7: Example of composition of petroleum coke used as well as the composition of thesyngas produced in a oxygen-blown fluidised bed gasification processSource: [166, Meyers, 1997]
Chapter 2 Applied processes and techniques
62 December 2001 MA/EIPPCB/REF_BREF_FINAL
Gasification of hydrocarbons (Partial oxidation)In partial oxidation, hydrocarbon feed reacts with oxygen at high temperatures to produce amixture of hydrogen and carbon monoxide (also covered in IGCC in Section 2.10). Since thehigh temperature takes the place of a catalyst, partial oxidation is not limited to the light, cleanfeedstocks required for steam reforming.
Hydrogen processing in this system depends on how much of the gas is to be recovered ashydrogen, and how much is to be used as fuel. Where hydrogen production is a relatively smallpart of the total gas stream, a membrane is normally used to withdraw a hydrogen-rich stream.That stream is then refined in a purification unit.
Purification of hydrogenA wide variety of processes are used to purify hydrogen streams. Since the streams are availableat a wide variety of compositions, flows, and pressures, the method of purification will vary.They are wet scrubbing, membrane systems, cryogenic separation and pressure-swingadsorption (PSA). This last technique is the most commonly used. In the PSA plant, mostimpurities can be removed to any desired level. An adsorbent (molecular sieves) removesmethane and nitrogen from the out-stream. Nitrogen is the most difficult to remove of thecommon impurities, and removing it completely requires additional adsorbent. Since nitrogenacts mainly as a diluent, it is usually left in the product if the hydrogen is not going to be used ina very high-pressure system such as a hydrocracker. Hydrogen purity is 99.9 - 99.999 % v/vafter the PSA unit. The residual constituents of the product gas are mainly methane and lessthan 10 ppm CO. Several adsorber beds are used, and the gas flow is periodically switched fromone vessel to another to allow regeneration of the adsorbent by pressure reduction and purging,thus releasing the adsorbed components. The desorbed gas is normally accumulated in a vesseland used as fuel at a convenient location.
Applied processes and techniques Chapter 2
MA/EIPPCB/REF_BREF_FINAL December 2001 63
2.15 Integrated refinery management
Refineries contain processes and activities that are integrated in different ways. Because thisintegration, this section tries to analyse the following groups of activities:� Process/activities that are so common in all parts of the refinery that has no sense to deal it
in each single process/activity section. Some of those issues are already treated in othersections as for example energy issues (including management), cooling systems, storage andhandling of materials and sulphur management (Section 4.23.5). So, no mention to thoseactivities is done in this section.
� Evaluate the implications for the environment of the process integration. All refineryprocess units, systems and activities are typically operated in an integrated way, aimed tooptimize the production in a way that is economic, sustainable and acceptable to society.This requires a concerted well managed approach in the execution and planning of allactivities. This aspect has a great implications in the impact of the refinery into theenvironment.
Techniques to prevent air emissions, such as fugitive emissions, odour and noise that arerelevant to the whole refinery are included in Sections 23. Soil contamination preventiontechniques are also included in Sections 25.
Sections 15 within Chapters 2 to 4 have been structured according to two categories:1. Refinery management activities including environmental management tools and good
housekeeping techniques.Within this section activities as maintenance, cleaning, gooddesign, production planning (including start-ups and shutdowns), training, informationsystem process supervision/control systems and safety systems have been included.
2. Utilities management within a refinery not covered by other sections, such as watermanagement, blowdown systems, compressed air generation and distribution and electricitydistribution systems.
REFINERY MANAGEMENT ACTIVITIES
1. Environmental management toolsAn Environmental Management System is a system for managing all activities (includingenergy) in a refinery that lays down the purpose of the refinery as a whole, the responsibilitiesof employees/management and procedures to be followed. An intrinsic aim of many systems isto achieve continuous improvement, with a refinery learning, in particular, from its ownoperationed experience as well as that of others.
The development of Environmental Management Systems (EMS) started by building upon theexperience gained with other business parameters. Quite often, management responsibility forSafety is combined in one person with responsibility for the Environment (and Health, andsometimes Quality). Environmental Management is also named Environmental Care. In thissection the importance of Good housekeeping and Management is highlighted. It is remarkedthat systems exist for improving performance in many fields such as Safety, Maintenance,Product Quality. Environmental Management Systems have also been developed for theimprovement of refinery performance in environmental matters.
2. Good housekeeping activitiesGood housekeeping techniques refers to the proper handling of the day-to-day aspects ofrunning a refinery. Numerous examples of this nature can be given for refinery activities thathave an impact on its performance. Other activities that may have an impact on theenvironmental performance of a refinery can be the maintenance, cleaning, good design,production planning (including start-ups, shut downs), information system processsupervision/control systems, training and safety systems. The Council Directive on the controlof major-accident hazards (Directive 96/82/EC) plays an important role in the safetymanagement of refineries.
Chapter 2 Applied processes and techniques
64 December 2001 MA/EIPPCB/REF_BREF_FINAL
Heat exchanger cleaningHeat exchangers are used throughout petroleum refineries to heat or cool petroleum processstreams. The heat exchangers consist of bundles of pipes, tubes, plate coils, or steam coilsenclosing heating or cooling water, steam, or oil to transfer heat indirectly to or from the oilprocess stream. The bundles are cleaned periodically to remove accumulations of scale, sludgeand any oily wastes.
UTILITIES MANAGEMENTEnergy management including steam management and cooling are included in other Sections (8and 10).
1.- Water managementWater is used within a refinery as process water and cooling water. Rainwater (clean orcontaminated) is another type of water that should be also considered. Sanitary waste water,ballast water and blowdown water are other sources of waste water. Water masterplans arenormally applied to refineries in order to optimise the consumption of water. Water inventoriesare sometimes a great help in the management of water, matching the quantity and quality of theeffluents. Water integration and management is dependent on the refinery configuration, thecrude quality and the level of desalting required, the cost of potable water, the availability ofrainwater and the quality of the cooling water. Within a refinery, a number of standard process-integrated effluent/water treatment provisions are available as well as a number of standardpossibilities for water reduction and re-use. In most refineries a number of these options havealready been implemented to some extent, either in the original design or by retrofit.Segregation of process water discharges and other types of water are also points to consider inthe water management system. Sewerage systems also play an important role in the watermanagement system within refineries.
Ballast water is relevant to those refineries that have crude receipt facilities from ships or handlebig product tankers or inland barges. This ballast water can be high in volume and salt content(seawater), and heavily polluted with oil. However, volumes of ballast water to be treated aredeclining with the gradual introduction of segregated ballast tankers.
Water and drainage applies to any industrial site. It entails the complete system of fresh watersupply, rainwater, ballast water, process water, cooling water and ground water as well aseffluent collection, storage and the various (primary, secondary and tertiary) waste watertreatment systems. The design is based on local factors (rainfall, receiving water bodies, etc.),effluent segregation, source reduction, first flush philosophies, flexible routing and re-useoptions.
Recirculated process water streams and cooling water streams are often manually purged toprevent the continued build up of contaminants in the stream (blowdown system).
2.- Purge/vents systemsMost refinery process units and equipment are manifolded into a collection unit, called thepurge/vent system. Those systems provide for the safe handling and disposal of liquid and gasesas well as for shutdown, cleaning and emergency situations. Purge/vents systems are eitherautomatically vented from the process units through pressure relief valves, or are manuallydrawn from units. Part or all of the contents of equipment can also be purged prior to shutdownbefore normal or emergency shutdowns. Purge/vents systems use a series of flash drums andcondensers to separate the blowdown into its vapour and liquid components.
3.- Compressed air generationCompressed air is necessary as a utility within a refinery. It is normally generated by electriccompressors and is distributed round the refinery.

Applied processes and techniques Chapter 2
MA/EIPPCB/REF_BREF_FINAL December 2001 65
4.- Heating of pipesCurrent practices are to apply steam heating (low-pressure steam), electric heating or hot oilheating of lines, if it is required. Electric heating normally generates less corrosion andconsequently is easier to maintain compared with heating using steam. Hot oil heating is usedwhen high temperatures are needed.
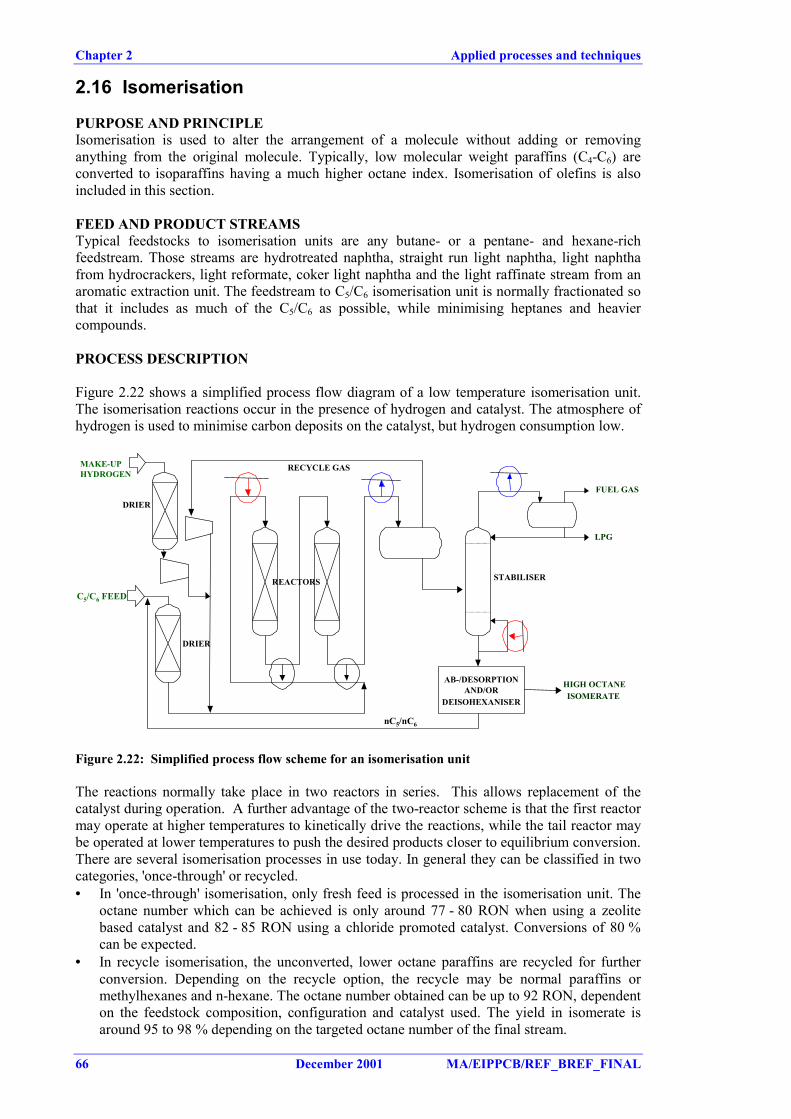
Chapter 2 Applied processes and techniques
66 December 2001 MA/EIPPCB/REF_BREF_FINAL
2.16 Isomerisation
PURPOSE AND PRINCIPLEIsomerisation is used to alter the arrangement of a molecule without adding or removinganything from the original molecule. Typically, low molecular weight paraffins (C4-C6) areconverted to isoparaffins having a much higher octane index. Isomerisation of olefins is alsoincluded in this section.
FEED AND PRODUCT STREAMSTypical feedstocks to isomerisation units are any butane- or a pentane- and hexane-richfeedstream. Those streams are hydrotreated naphtha, straight run light naphtha, light naphthafrom hydrocrackers, light reformate, coker light naphtha and the light raffinate stream from anaromatic extraction unit. The feedstream to C5/C6 isomerisation unit is normally fractionated sothat it includes as much of the C5/C6 as possible, while minimising heptanes and heaviercompounds.
PROCESS DESCRIPTION
Figure 2.22 shows a simplified process flow diagram of a low temperature isomerisation unit.The isomerisation reactions occur in the presence of hydrogen and catalyst. The atmosphere ofhydrogen is used to minimise carbon deposits on the catalyst, but hydrogen consumption low.
REACTORS
DRIER
C5/C6 FEED
DRIER
MAKE-UPHYDROGEN
STABILISER
HIGH OCTANEISOMERATE
LPG
FUEL GAS
RECYCLE GAS
AB-/DESORPTIONAND/OR
DEISOHEXANISER
nC5/nC6
Figure 2.22: Simplified process flow scheme for an isomerisation unit
The reactions normally take place in two reactors in series. This allows replacement of thecatalyst during operation. A further advantage of the two-reactor scheme is that the first reactormay operate at higher temperatures to kinetically drive the reactions, while the tail reactor maybe operated at lower temperatures to push the desired products closer to equilibrium conversion.There are several isomerisation processes in use today. In general they can be classified in twocategories, 'once-through' or recycled.• In 'once-through' isomerisation, only fresh feed is processed in the isomerisation unit. The
octane number which can be achieved is only around 77 - 80 RON when using a zeolitebased catalyst and 82 - 85 RON using a chloride promoted catalyst. Conversions of 80 %can be expected.
• In recycle isomerisation, the unconverted, lower octane paraffins are recycled for furtherconversion. Depending on the recycle option, the recycle may be normal paraffins ormethylhexanes and n-hexane. The octane number obtained can be up to 92 RON, dependenton the feedstock composition, configuration and catalyst used. The yield in isomerate isaround 95 to 98 % depending on the targeted octane number of the final stream.
Applied processes and techniques Chapter 2
MA/EIPPCB/REF_BREF_FINAL December 2001 67
There are three distinctly different types of catalysts currently in use: chloride promoted,zeolitic, and sulphated zirconia catalysts. The zeolite catalyst operates at significant highertemperatures (250 – 275 °C and 28 barg) and is more tolerant to contaminants though resultingoctane improvements is lower. The zeolite catalyst is mainly used when higher octaneisomerate product does not justify the additional capital required to reduce feed contaminantsfor the chlorided alumina catalyst or is a better match for a retrofit unit. The highly activechloride promoted catalyst, operates at a relatively low temperature (190 – 210 °C and 20 barg)and gives the highest octane improvement.This type of catalyst requires the addition of smallamounts of organic chlorides converted to hydrogen chloride in the reactor to maintain the highactivity. In such a reactor, the feed must be free of oxygen sources including water to avoiddeactivation and corrosion problems. Furthermore, this catalyst is very sensitive to sulphur, sodeep desulphurisation of the feed to 0.5 ppm is required. Lower reaction temperatures arepreferred to higher temperatures because the equilibrium conversion to the desired isomers isenhanced at lower temperatures.
After isomerisation, the light ends are stripped from the product stream leaving the reactor andare then sent to the sour gas treatment unit. In a once-through isomerisation unit the bottomstream from the stabiliser is, after product cooling, sent to the gasoline pool. In a recycle stream,the bottom stream from the stabiliser is fed to a separation unit, which is either a de-isohexaniser column or an adsorption system.
In the de-isohexaniser column, a split can be made between the higher octane dimethylbutanesand the lower octane methylpentanes. The dimethylbutanes and lower boiling C5 components(isomerate product) are taken overhead from the column and are sent to the gasoline pool. Themethylpentanes and normal hexane are taken as a side-stream close to the bottom, and arerecycled to the reactor. The bottom stream from the de-isohexaniser is a small quantity of heavyby-product which is sent with the isomerate product to the gasoline pool or to a catalyticreformer if the refinery recovers benzene as chemical feed. The principle of adsorption is thatthe unconverted normal paraffins are adsorbed on the molecular sieve whereas the iso-paraffinspass the adsorbent. Desorption takes place with heated hydrogen-rich gas from the separator ora butane mixture. The desorbent is separated from the net hydrogen-rich recycle stream in aseparator vessel.
Chapter 2 Applied processes and techniques
68 December 2001 MA/EIPPCB/REF_BREF_FINAL
2.17 Natural gas plants
Gas in Europe has been typically found in the North Sea. Natural gas is also obtained from asmall number of on-shore oil fields, where it is co-produced with crude oil and separated atlocal facilities before being treated, brought up to specification and exported. The off-shore gasproduction consists of a number of central platforms with satellite platforms. The sateliteplatforms deliver gas to the central platform, where gas is dried (removal of water). Alsocondensates are partially removed, but these are re-injected again in the produced gas.Chemicals are added to the gas stream either at the well-head or prior to transmission to preventsolid hydrate formation and to limit corrosion in the underwater pipeline. Off-shore platformsare not included in the scope of this document. Subsequently, the central platforms deliverthrough one main gas pipeline to the on-shore natural gas plants for the final treatment.
PURPOSE AND PRINCIPLEThe overall objective of natural gas processing is to remove the treatment chemicals and toremove any contaminants from the well-head stream in order to produce a methane rich gaswhich satisfies statutory and contractual specifications. The main contaminants to be removedfall into the following categories:• solids: sands, clay, sometimes scale like carbonates and sulphates (including naturally
occurring radioactive metals (e.g. lead or radium)), mercury• liquids: water/brine, hydrocarbons, chemicals added at well-head• gases: acid gases, carbon dioxide, hydrogen sulphide, nitrogen, mercury and other gases
(e.g. mercaptans).
FEED AND PRODUCT STREAMSFeedstock is natural gas and the products that may be separated within the natural gas plants aremethane reach gas, C2, C3, C4 fractions and condensates (C5+).
PROCESS DESCRIPTIONAs it is shown in Figure 2.23, the purification plant consists on a gas sweetening plant whereacid gases as CO2, H2S, SO2 are separated. Natural gas is considered "sour" when containssignificantly greater amounts of hydrogen sulphide than those quoted for pipeline quality orwhen contains such amounts of SO2 or CO2 to make it impractical to use without purification.The H2S must be removed (called "sweetening" the gas) before the gas can be utilized. If H2S ispresent, the gas is usually sweetened by absorption of the H2S in an amine solution. Amineprocesses are the most common process used in the United States and Europe. Other methods,such as carbonate processes, solid bed absorbents, and physical absorption, are employed in theother sweetening plants.
Natural gasoline, butane and propane are usually present in the gas, and gas processing plantsare required for the recovery of these liquefiable constituents (see Figure 2.23). The type ofprocesses found are very similar to those described in Section 2.12. As summary, they arephysical separations at very low temperatures (typically distillation).
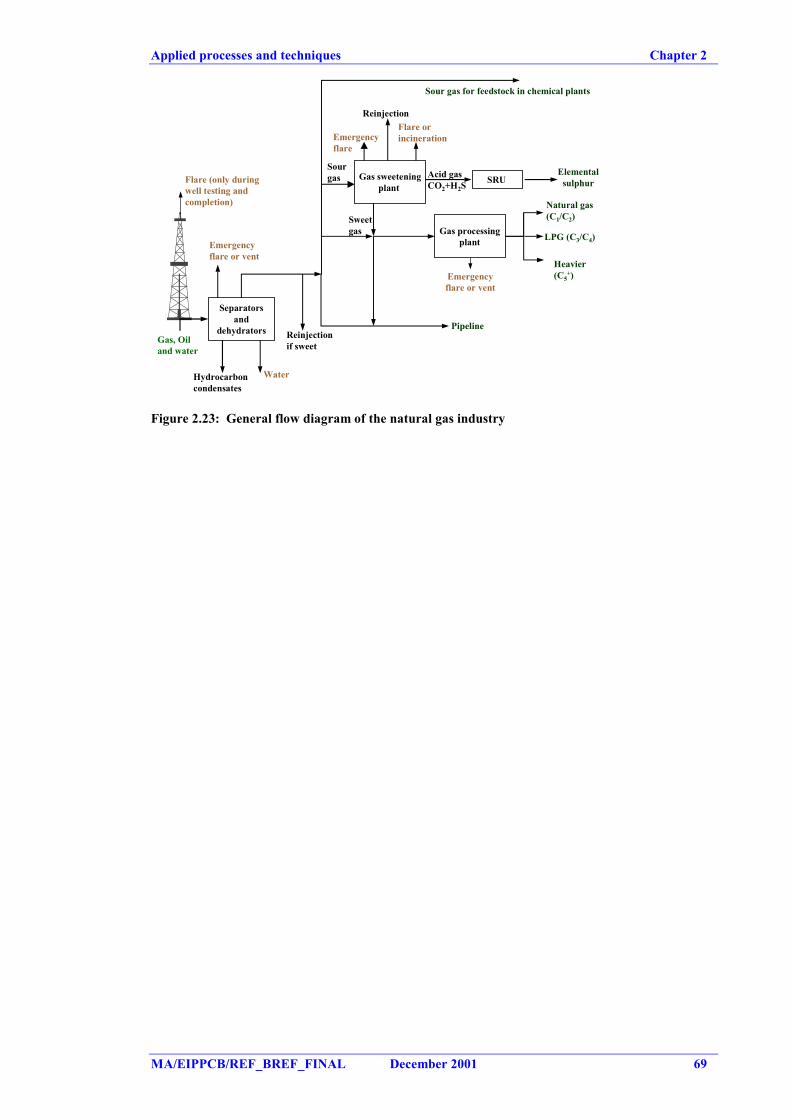
Applied processes and techniques Chapter 2
MA/EIPPCB/REF_BREF_FINAL December 2001 69
Separatorsand
dehydrators Gas, Oiland water
Flare (only duringwell testing andcompletion)
Hydrocarboncondensates
Water
Emergencyflare or vent
Reinjectionif sweet
Gas sweeteningplant
Sourgas
Emergencyflare
Reinjection
Sweetgas Gas processing
plant
Emergencyflare or vent
SRU
Flare orincineration
Acid gasCO2+H2S
Pipeline
Natural gas(C1/C2)
LPG (C3/C4)
Heavier(C5
+)
Sour gas for feedstock in chemical plants
Elementalsulphur
Figure 2.23: General flow diagram of the natural gas industry
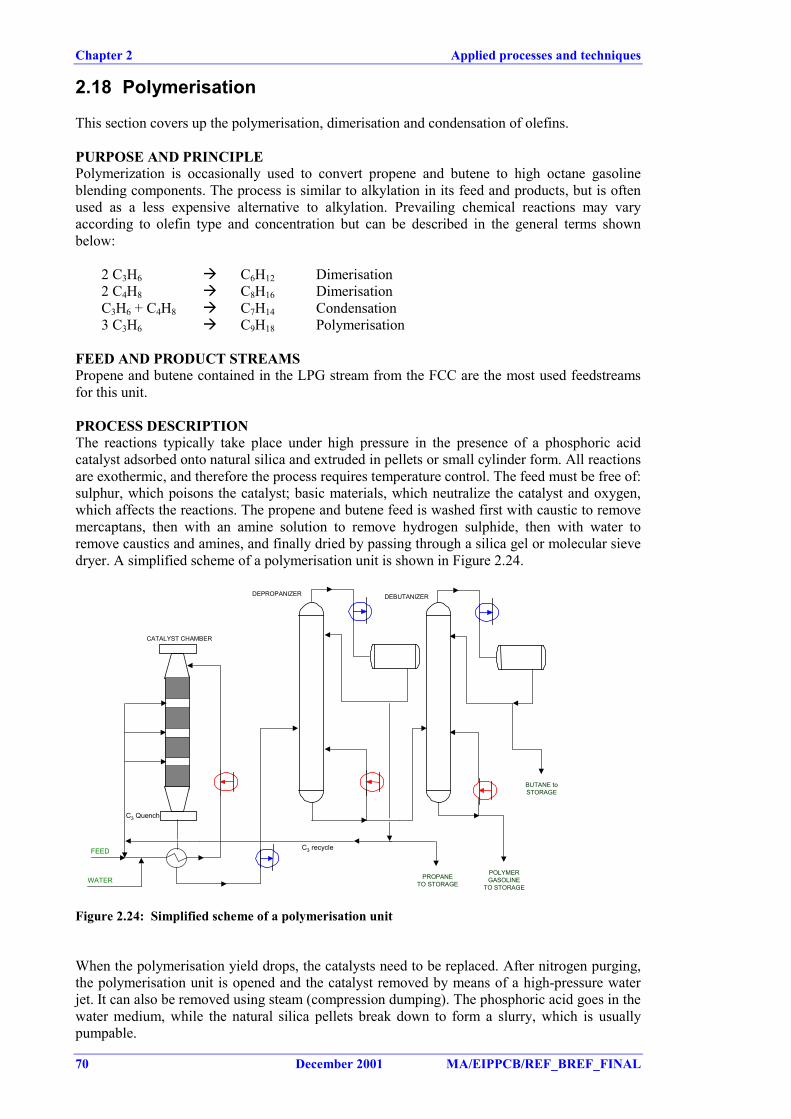
Chapter 2 Applied processes and techniques
70 December 2001 MA/EIPPCB/REF_BREF_FINAL
2.18 Polymerisation
This section covers up the polymerisation, dimerisation and condensation of olefins.
PURPOSE AND PRINCIPLEPolymerization is occasionally used to convert propene and butene to high octane gasolineblending components. The process is similar to alkylation in its feed and products, but is oftenused as a less expensive alternative to alkylation. Prevailing chemical reactions may varyaccording to olefin type and concentration but can be described in the general terms shownbelow:
2 C3H6 � C6H12 Dimerisation2 C4H8 � C8H16 DimerisationC3H6 + C4H8 � C7H14 Condensation3 C3H6 � C9H18 Polymerisation
FEED AND PRODUCT STREAMSPropene and butene contained in the LPG stream from the FCC are the most used feedstreamsfor this unit.
PROCESS DESCRIPTIONThe reactions typically take place under high pressure in the presence of a phosphoric acidcatalyst adsorbed onto natural silica and extruded in pellets or small cylinder form. All reactionsare exothermic, and therefore the process requires temperature control. The feed must be free of:sulphur, which poisons the catalyst; basic materials, which neutralize the catalyst and oxygen,which affects the reactions. The propene and butene feed is washed first with caustic to removemercaptans, then with an amine solution to remove hydrogen sulphide, then with water toremove caustics and amines, and finally dried by passing through a silica gel or molecular sievedryer. A simplified scheme of a polymerisation unit is shown in Figure 2.24.
BUTANE toSTORAGE
POLYMERGASOLINE
TO STORAGE
PROPANETO STORAGEWATER
FEED
CATALYST CHAMBER
DEPROPANIZER DEBUTANIZER
C3 Quench
C3 recycle
Figure 2.24: Simplified scheme of a polymerisation unit
When the polymerisation yield drops, the catalysts need to be replaced. After nitrogen purging,the polymerisation unit is opened and the catalyst removed by means of a high-pressure waterjet. It can also be removed using steam (compression dumping). The phosphoric acid goes in thewater medium, while the natural silica pellets break down to form a slurry, which is usuallypumpable.
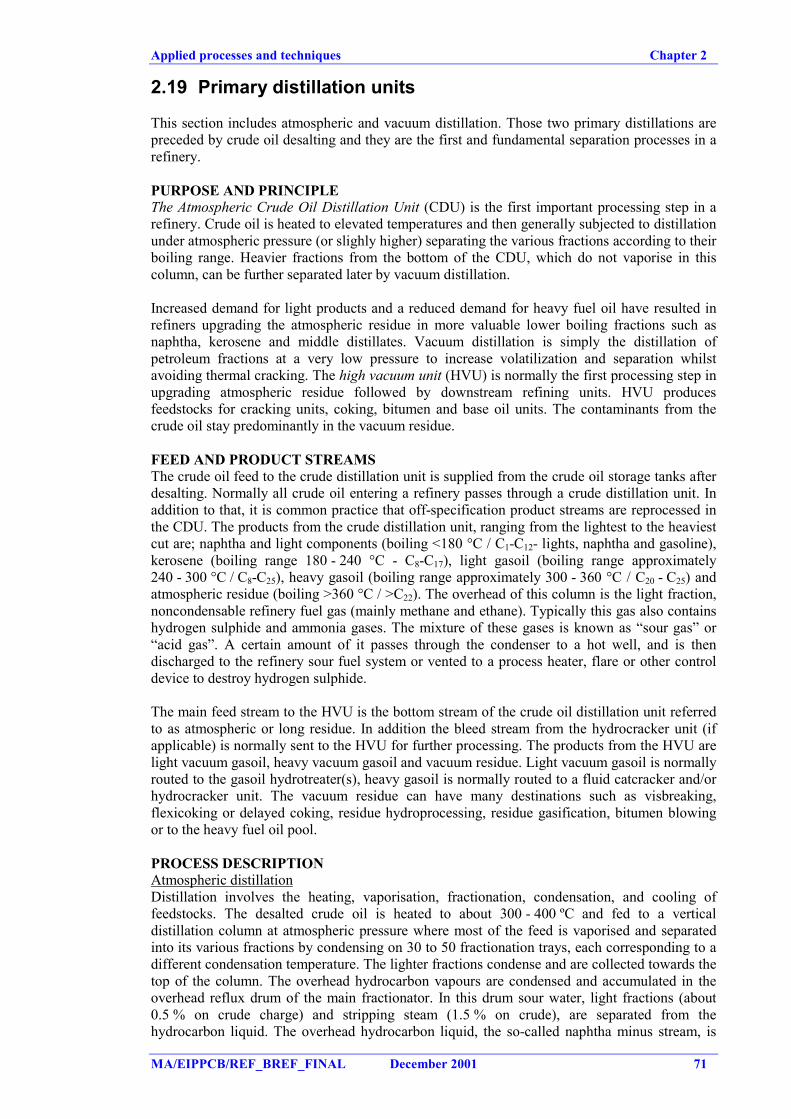
Applied processes and techniques Chapter 2
MA/EIPPCB/REF_BREF_FINAL December 2001 71
2.19 Primary distillation units
This section includes atmospheric and vacuum distillation. Those two primary distillations arepreceded by crude oil desalting and they are the first and fundamental separation processes in arefinery.
PURPOSE AND PRINCIPLEThe Atmospheric Crude Oil Distillation Unit (CDU) is the first important processing step in arefinery. Crude oil is heated to elevated temperatures and then generally subjected to distillationunder atmospheric pressure (or slighly higher) separating the various fractions according to theirboiling range. Heavier fractions from the bottom of the CDU, which do not vaporise in thiscolumn, can be further separated later by vacuum distillation.
Increased demand for light products and a reduced demand for heavy fuel oil have resulted inrefiners upgrading the atmospheric residue in more valuable lower boiling fractions such asnaphtha, kerosene and middle distillates. Vacuum distillation is simply the distillation ofpetroleum fractions at a very low pressure to increase volatilization and separation whilstavoiding thermal cracking. The high vacuum unit (HVU) is normally the first processing step inupgrading atmospheric residue followed by downstream refining units. HVU producesfeedstocks for cracking units, coking, bitumen and base oil units. The contaminants from thecrude oil stay predominantly in the vacuum residue.
FEED AND PRODUCT STREAMSThe crude oil feed to the crude distillation unit is supplied from the crude oil storage tanks afterdesalting. Normally all crude oil entering a refinery passes through a crude distillation unit. Inaddition to that, it is common practice that off-specification product streams are reprocessed inthe CDU. The products from the crude distillation unit, ranging from the lightest to the heaviestcut are; naphtha and light components (boiling <180 °C / C1-C12- lights, naphtha and gasoline),kerosene (boiling range 180 - 240 °C - C8-C17), light gasoil (boiling range approximately240 - 300 °C / C8-C25), heavy gasoil (boiling range approximately 300 - 360 °C / C20 - C25) andatmospheric residue (boiling >360 °C / >C22). The overhead of this column is the light fraction,noncondensable refinery fuel gas (mainly methane and ethane). Typically this gas also containshydrogen sulphide and ammonia gases. The mixture of these gases is known as “sour gas” or“acid gas”. A certain amount of it passes through the condenser to a hot well, and is thendischarged to the refinery sour fuel system or vented to a process heater, flare or other controldevice to destroy hydrogen sulphide.
The main feed stream to the HVU is the bottom stream of the crude oil distillation unit referredto as atmospheric or long residue. In addition the bleed stream from the hydrocracker unit (ifapplicable) is normally sent to the HVU for further processing. The products from the HVU arelight vacuum gasoil, heavy vacuum gasoil and vacuum residue. Light vacuum gasoil is normallyrouted to the gasoil hydrotreater(s), heavy gasoil is normally routed to a fluid catcracker and/orhydrocracker unit. The vacuum residue can have many destinations such as visbreaking,flexicoking or delayed coking, residue hydroprocessing, residue gasification, bitumen blowingor to the heavy fuel oil pool.
PROCESS DESCRIPTIONAtmospheric distillationDistillation involves the heating, vaporisation, fractionation, condensation, and cooling offeedstocks. The desalted crude oil is heated to about 300 - 400 ºC and fed to a verticaldistillation column at atmospheric pressure where most of the feed is vaporised and separatedinto its various fractions by condensing on 30 to 50 fractionation trays, each corresponding to adifferent condensation temperature. The lighter fractions condense and are collected towards thetop of the column. The overhead hydrocarbon vapours are condensed and accumulated in theoverhead reflux drum of the main fractionator. In this drum sour water, light fractions (about0.5 % on crude charge) and stripping steam (1.5 % on crude), are separated from thehydrocarbon liquid. The overhead hydrocarbon liquid, the so-called naphtha minus stream, is
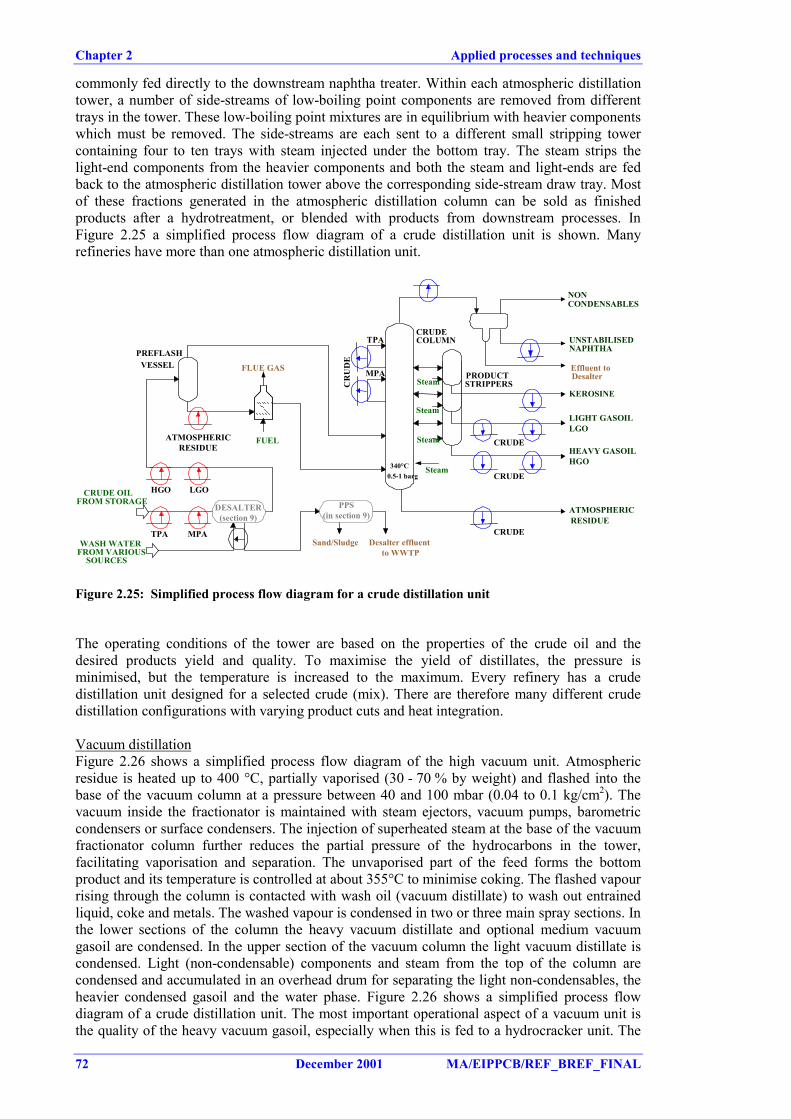
Chapter 2 Applied processes and techniques
72 December 2001 MA/EIPPCB/REF_BREF_FINAL
commonly fed directly to the downstream naphtha treater. Within each atmospheric distillationtower, a number of side-streams of low-boiling point components are removed from differenttrays in the tower. These low-boiling point mixtures are in equilibrium with heavier componentswhich must be removed. The side-streams are each sent to a different small stripping towercontaining four to ten trays with steam injected under the bottom tray. The steam strips thelight-end components from the heavier components and both the steam and light-ends are fedback to the atmospheric distillation tower above the corresponding side-stream draw tray. Mostof these fractions generated in the atmospheric distillation column can be sold as finishedproducts after a hydrotreatment, or blended with products from downstream processes. InFigure 2.25 a simplified process flow diagram of a crude distillation unit is shown. Manyrefineries have more than one atmospheric distillation unit.
CRUDE OILFROM STORAGE
TPA
340°C0.5-1 barg
Steam
Steam
Steam
Steam
WASH WATERFROM VARIOUS
SOURCES
Sand/Sludge Desalter effluent to WWTP
MPA
CR
UD
E
ATMOSPHERICRESIDUE
TPA MPA
LGOHGO
PREFLASHVESSEL
CRUDE
CRUDE
CRUDE
CRUDECOLUMN UNSTABILISED
NAPHTHA
NONCONDENSABLES
Effluent toDesalter
KEROSINE
LIGHT GASOILLGO
HEAVY GASOILHGO
ATMOSPHERICRESIDUE
PRODUCTSTRIPPERS
FLUE GAS
FUEL
DESALTER(section 9)
PPS(in section 9)
Figure 2.25: Simplified process flow diagram for a crude distillation unit
The operating conditions of the tower are based on the properties of the crude oil and thedesired products yield and quality. To maximise the yield of distillates, the pressure isminimised, but the temperature is increased to the maximum. Every refinery has a crudedistillation unit designed for a selected crude (mix). There are therefore many different crudedistillation configurations with varying product cuts and heat integration.
Vacuum distillationFigure 2.26 shows a simplified process flow diagram of the high vacuum unit. Atmosphericresidue is heated up to 400 °C, partially vaporised (30 - 70 % by weight) and flashed into thebase of the vacuum column at a pressure between 40 and 100 mbar (0.04 to 0.1 kg/cm2). Thevacuum inside the fractionator is maintained with steam ejectors, vacuum pumps, barometriccondensers or surface condensers. The injection of superheated steam at the base of the vacuumfractionator column further reduces the partial pressure of the hydrocarbons in the tower,facilitating vaporisation and separation. The unvaporised part of the feed forms the bottomproduct and its temperature is controlled at about 355°C to minimise coking. The flashed vapourrising through the column is contacted with wash oil (vacuum distillate) to wash out entrainedliquid, coke and metals. The washed vapour is condensed in two or three main spray sections. Inthe lower sections of the column the heavy vacuum distillate and optional medium vacuumgasoil are condensed. In the upper section of the vacuum column the light vacuum distillate iscondensed. Light (non-condensable) components and steam from the top of the column arecondensed and accumulated in an overhead drum for separating the light non-condensables, theheavier condensed gasoil and the water phase. Figure 2.26 shows a simplified process flowdiagram of a crude distillation unit. The most important operational aspect of a vacuum unit isthe quality of the heavy vacuum gasoil, especially when this is fed to a hydrocracker unit. The
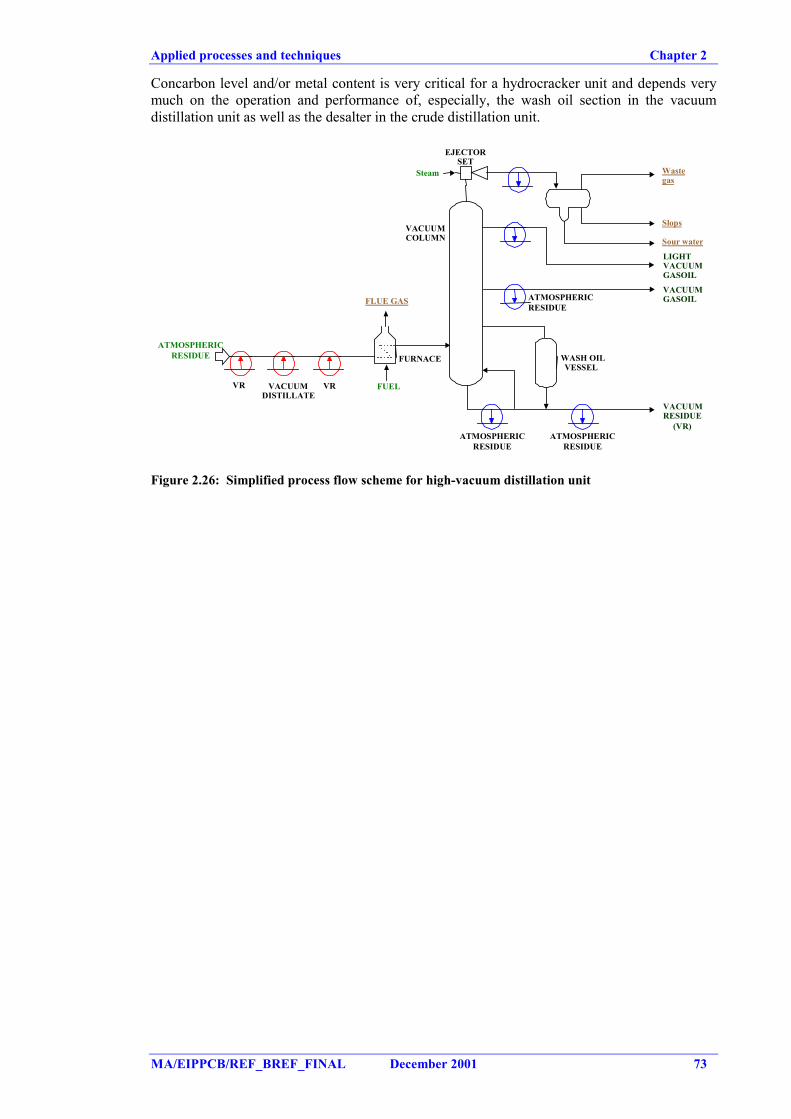
Applied processes and techniques Chapter 2
MA/EIPPCB/REF_BREF_FINAL December 2001 73
Concarbon level and/or metal content is very critical for a hydrocracker unit and depends verymuch on the operation and performance of, especially, the wash oil section in the vacuumdistillation unit as well as the desalter in the crude distillation unit.
VACUUMCOLUMN
LIGHTVACUUMGASOIL
Wastegas
Slops
VACUUMGASOIL
VACUUMRESIDUE
(VR)
Steam
ATMOSPHERICRESIDUE
VR VACUUMDISTILLATE
ATMOSPHERICRESIDUE
Sour water
WASH OILVESSEL
VR
FURNACE
EJECTORSET
FLUE GAS
FUEL
ATMOSPHERICRESIDUE
ATMOSPHERICRESIDUE
Figure 2.26: Simplified process flow scheme for high-vacuum distillation unit
Chapter 2 Applied processes and techniques
74 December 2001 MA/EIPPCB/REF_BREF_FINAL
2.20 Product treatments
The treatments used in a refinery to achieve certain product specifications are included in thissection, in which two types of processes can be identified. The first group of processescorresponds to extraction or removal techniques where the component to treat is removed fromthe stream to be treated. Under this category, mention can be made of molecular sieve extractionfor removal of carbon dioxide, water, hydrogen sulphide or mercaptans (Section 4.23.5.3),amine scrubbing for removal of hydrogen sulphide (included in Section 4.23.5.1) or causticwashing for the removal of acids or mercaptans. The second group is composed of thosesystems where the chemical to be treated is not removed from the stream to be treated.
PURPOSE AND PRINCIPLEIn petroleum refining, chemical treating is used to remove or change the undesirable propertiesassociated with sulphur, nitrogen, or oxygen compound contaminants in petroleum products.Some of those systems (so called mercaptan oxidation) are designed to reduce the mercaptancontent (organic sulphur compounds) of hydrocarbon streams to improve product odour and toreduce corrosivity. Those treatments are accomplished by either extraction or oxidation (alsoknown as sweetening), depending upon the product. The extraction process removes themercaptans by caustic extraction, resulting in a lower sulphur content. The following reactiontakes place at low temperatures:
R-SH + NaOH NaSR + H2O
Mercaptan oxidation-sweetening is another version of the mercaptan oxidation process in whichthe mercaptans in the hydrocarbon products are converted to less odorous and less corrosivedisulphides which remain in the product. The reaction is:
NaSR + ¼ O2 + ½ H2O NaOH + ½ RSSR
As a result no reduction in the total sulphur content takes place during sweetening andconsequently it is only applied to those streams where sulphur content is not a problem.
FEED AND PRODUCT STREAMSThe mercaptan oxidation-extraction process entails the removal of mercaptans from LPG,naphtha and gasoline and kerosene streams. Oxidation or "sweetening" is used on gasoline anddistillate fractions. It should also be stressed that mercaptans are also removed byhydrotreatment (Section 2.13).
PROCESS DESCRIPTIONMercaptans are removed from light hydrocarbon streams by a concentrated alkaline wash in anextraction column under elevated pressure (5 barg). If H2S or acids are present a causticprewash is required. The treated and odour-free hydrocarbon stream leaves the reactor as anoverhead stream. The aqueous bottom phase is heated to 50 °C, mixed with air and fed to theoxidation reactor. The dissolved NaSR is now converted into disulphides (which are insolublein caustic soda water solution) at 4.5 barg. By using an excess of air and adding catalyst, a highrate of reaction is maintained. In this way the alkaline solution is regenerated. The liquid fromthe reactor is routed to a vessel where spent air, the disulphide fraction insoluble in the causticsolution and the caustic solution are separated. The spent air is routed to an incinerator orprocess furnace, the disulphides are usually recycled to the crude and the regenerated caustic iscirculated to the extraction column. Figure 2.27 shows a simplified process flow diagram of anextraction process.
Another oxidation process is also a mercaptan oxidation process that uses a solid catalyst bed.Air and a minimum amount of alkaline caustic ("mini-alky" operation) are injected into thehydrocarbon stream and the caustic cannot regenerated. As the hydrocarbon passes through themercaptan oxidation catalyst bed, sulphur mercaptans are oxidized to disulphide.
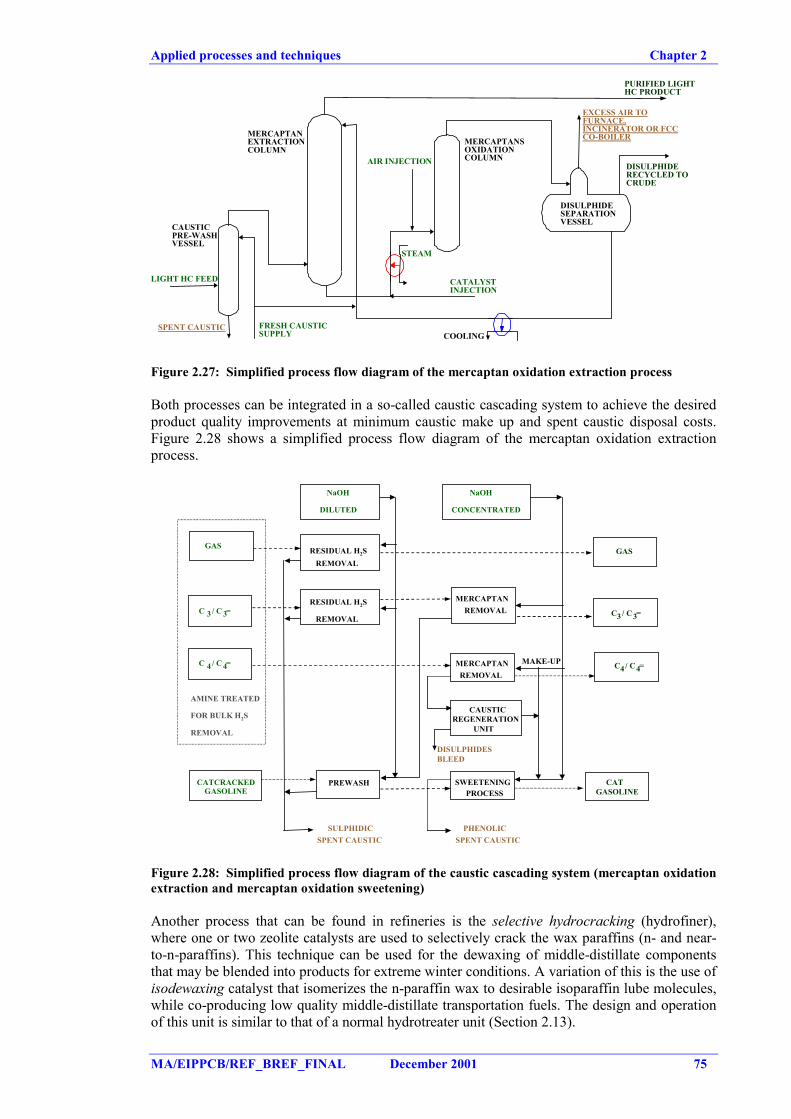
Applied processes and techniques Chapter 2
MA/EIPPCB/REF_BREF_FINAL December 2001 75
EXCESS AIR TOFURNACE,INCINERATOR OR FCCCO-BOILER
LIGHT HC FEED
SPENT CAUSTIC FRESH CAUSTICSUPPLY COOLING
STEAM
CATALYSTINJECTION
MERCAPTANSOXIDATIONCOLUMNAIR INJECTION
MERCAPTANEXTRACTIONCOLUMN
CAUSTICPRE-WASHVESSEL
DISULPHIDESEPARATIONVESSEL
DISULPHIDERECYCLED TOCRUDE
PURIFIED LIGHTHC PRODUCT
Figure 2.27: Simplified process flow diagram of the mercaptan oxidation extraction process
Both processes can be integrated in a so-called caustic cascading system to achieve the desiredproduct quality improvements at minimum caustic make up and spent caustic disposal costs.Figure 2.28 shows a simplified process flow diagram of the mercaptan oxidation extractionprocess.
NaOH NaOH
DILUTED CONCENTRATED
GAS RESIDUAL H2S GAS REMOVAL
RESIDUAL H2S MERCAPTAN
C 3 / C 3= REMOVAL
REMOVAL C3 / C3=
C 4 / C 4= MERCAPTAN C4 / C4= REMOVAL
AMINE TREATED
FOR BULK H2S CAUSTIC
REMOVAL
REGENERATIONUNIT
DISULPHIDES BLEED
CATCRACKED SWEETENING CATGASOLINE PROCESS GASOLINE
SULPHIDIC PHENOLIC SPENT CAUSTIC SPENT CAUSTIC
PREWASH
MAKE-UP
Figure 2.28: Simplified process flow diagram of the caustic cascading system (mercaptan oxidationextraction and mercaptan oxidation sweetening)
Another process that can be found in refineries is the selective hydrocracking (hydrofiner),where one or two zeolite catalysts are used to selectively crack the wax paraffins (n- and near-to-n-paraffins). This technique can be used for the dewaxing of middle-distillate componentsthat may be blended into products for extreme winter conditions. A variation of this is the use ofisodewaxing catalyst that isomerizes the n-paraffin wax to desirable isoparaffin lube molecules,while co-producing low quality middle-distillate transportation fuels. The design and operationof this unit is similar to that of a normal hydrotreater unit (Section 2.13).
Chapter 2 Applied processes and techniques
76 December 2001 MA/EIPPCB/REF_BREF_FINAL
2.21 Storage and handling of refinery materials
Storage and handling of refinery materials are not covered exhaustively in this document,because the storage and handling of oil products are within the scope of the horizontal BREF onstorage, to which reference will be made as appropriate. This section also covers activitiesrelated to feed and product blending, piping and other small techniques used for the handling ofmaterials. Storage of specific products, such as base oils, bitumen and petroleum coke, isincluded in their respective production sections.
PURPOSE AND PRINCIPLECrude oil, petroleum intermediates and final products are transferred to, in and from refineries,through marine terminals, via pipeline or rail/road vehicles. Between these movements, theproducts are stored in tanks. Storage tanks or caverns are used throughout the refining processto store crude oil, other raw materials and intermediate process feeds. Finished petroleumproducts are also kept in storage tanks before transport off site. Tanks are also needed toaccommodate blocked-out operation of processing units, to link continuous refinery processeswith discontinuous ones. Consequently, storage is an essential part of a refinery. Blendingsystems are also used in refineries to prepare feed streams to individual refinery units and toproduce finished products to be sold.
Feed blending may be applied to prepare the optimum feed stream to a refinery unit, therebyensuring the optimum performance of the refinery unit. For example, a refiner processes amixture of four different low-sulphur crudes in his atmospheric distillation unit. The feed blendis selected so that the throughput in the distillation unit and further downstream units areoptimised/ maximised with the objective of maximising overall profit. Alternatively, it alsohappens that the different quality crudes are processed separately for a short period (a few days)in so-called “blocked-out” operations.
Product blending is applied to produce the optimum mix of finished refinery products. Themajority of the product streams as produced in different refinery units, normally identified as anintermediate product stream, can be blended into more than one finished product stream. Forexample (hydrotreated) kerosene product is normally blended into diesel oil, light heating oiland even heavy fuel oil, with the remainder blended into the jet fuel oil. The amount of keroseneallocated to the different products is selected so that product demands and specifications are metwith the objective of maximising overall profit. Blending products involves mixing the productsin various proportions to meet specifications such as vapour pressure, specific gravity, sulphurcontent, viscosity, octane number, cetane index, initial boiling point and pour point and to adddistinctive smells (LPG).
PROCESS DESCRIPTIONThe crude oil storage systems can be located either at a separate oil terminal or within therefinery complex. More than 50 % of the refinery area is occupied by oil movement facilities.Storage tanks can be divided into four main types: Pressure vessels, fixed roof tanks, fixed rooftanks with floating cover and floating roof tanks. Figure 2.29 shows a drawing of the differenttypes of storage systems found in a refinery.
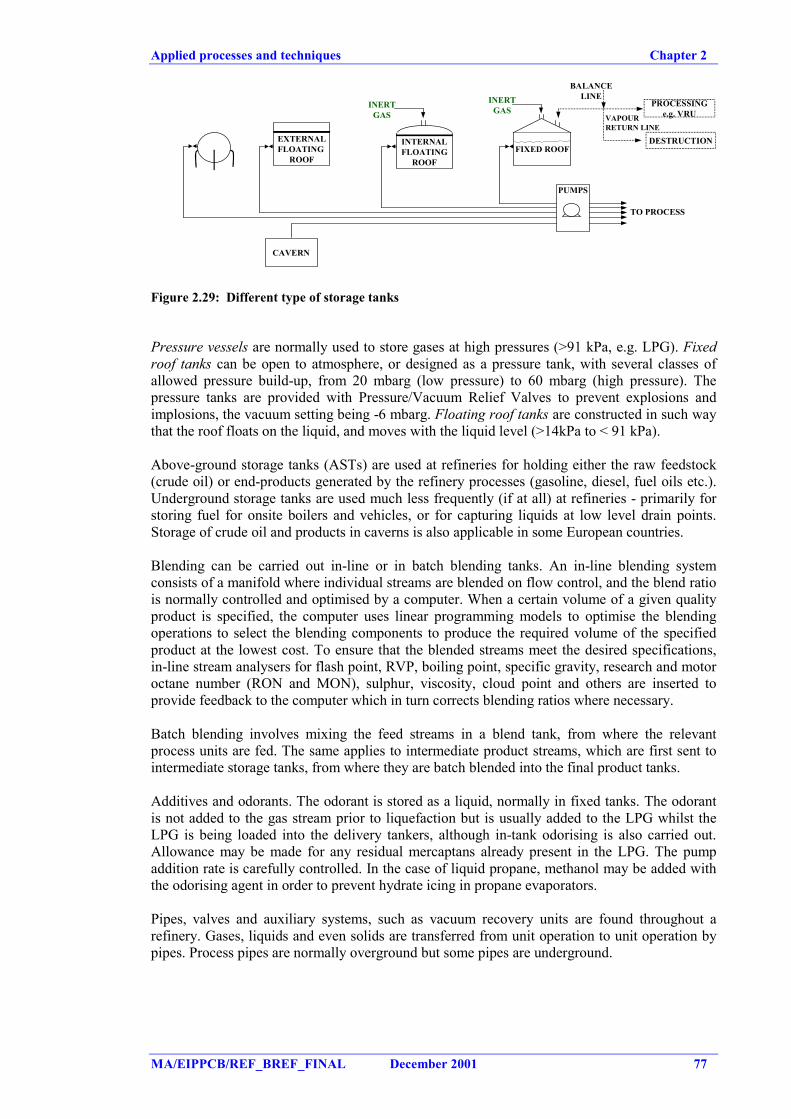
Applied processes and techniques Chapter 2
MA/EIPPCB/REF_BREF_FINAL December 2001 77
EXTERNALFLOATING
ROOF
INERTGAS
INERTGAS
PROCESSINGe.g. VRU
DESTRUCTION
VAPOURRETURN LINE
TO PROCESS
BALANCELINE
PUMPS
CAVERN
INTERNALFLOATING
ROOFFIXED ROOF
Figure 2.29: Different type of storage tanks
Pressure vessels are normally used to store gases at high pressures (>91 kPa, e.g. LPG). Fixedroof tanks can be open to atmosphere, or designed as a pressure tank, with several classes ofallowed pressure build-up, from 20 mbarg (low pressure) to 60 mbarg (high pressure). Thepressure tanks are provided with Pressure/Vacuum Relief Valves to prevent explosions andimplosions, the vacuum setting being -6 mbarg. Floating roof tanks are constructed in such waythat the roof floats on the liquid, and moves with the liquid level (>14kPa to < 91 kPa).
Above-ground storage tanks (ASTs) are used at refineries for holding either the raw feedstock(crude oil) or end-products generated by the refinery processes (gasoline, diesel, fuel oils etc.).Underground storage tanks are used much less frequently (if at all) at refineries - primarily forstoring fuel for onsite boilers and vehicles, or for capturing liquids at low level drain points.Storage of crude oil and products in caverns is also applicable in some European countries.
Blending can be carried out in-line or in batch blending tanks. An in-line blending systemconsists of a manifold where individual streams are blended on flow control, and the blend ratiois normally controlled and optimised by a computer. When a certain volume of a given qualityproduct is specified, the computer uses linear programming models to optimise the blendingoperations to select the blending components to produce the required volume of the specifiedproduct at the lowest cost. To ensure that the blended streams meet the desired specifications,in-line stream analysers for flash point, RVP, boiling point, specific gravity, research and motoroctane number (RON and MON), sulphur, viscosity, cloud point and others are inserted toprovide feedback to the computer which in turn corrects blending ratios where necessary.
Batch blending involves mixing the feed streams in a blend tank, from where the relevantprocess units are fed. The same applies to intermediate product streams, which are first sent tointermediate storage tanks, from where they are batch blended into the final product tanks.
Additives and odorants. The odorant is stored as a liquid, normally in fixed tanks. The odorantis not added to the gas stream prior to liquefaction but is usually added to the LPG whilst theLPG is being loaded into the delivery tankers, although in-tank odorising is also carried out.Allowance may be made for any residual mercaptans already present in the LPG. The pumpaddition rate is carefully controlled. In the case of liquid propane, methanol may be added withthe odorising agent in order to prevent hydrate icing in propane evaporators.
Pipes, valves and auxiliary systems, such as vacuum recovery units are found throughout arefinery. Gases, liquids and even solids are transferred from unit operation to unit operation bypipes. Process pipes are normally overground but some pipes are underground.
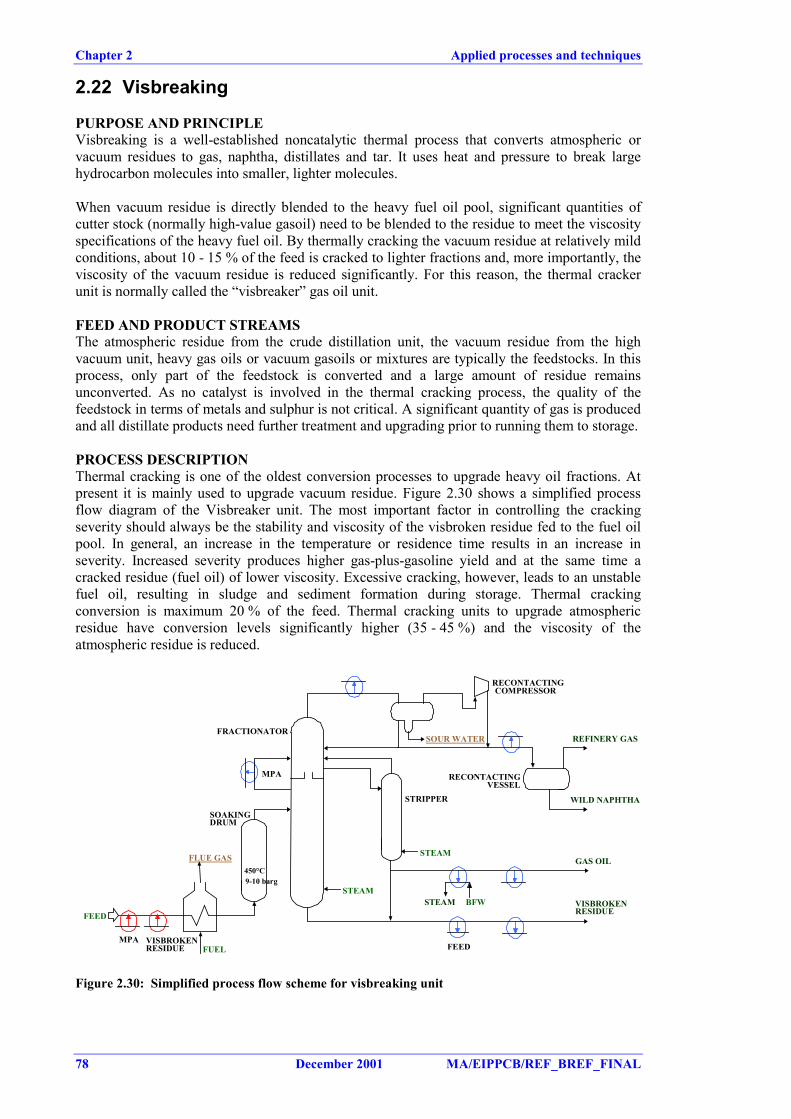
Chapter 2 Applied processes and techniques
78 December 2001 MA/EIPPCB/REF_BREF_FINAL
2.22 Visbreaking
PURPOSE AND PRINCIPLEVisbreaking is a well-established noncatalytic thermal process that converts atmospheric orvacuum residues to gas, naphtha, distillates and tar. It uses heat and pressure to break largehydrocarbon molecules into smaller, lighter molecules.
When vacuum residue is directly blended to the heavy fuel oil pool, significant quantities ofcutter stock (normally high-value gasoil) need to be blended to the residue to meet the viscosityspecifications of the heavy fuel oil. By thermally cracking the vacuum residue at relatively mildconditions, about 10 - 15 % of the feed is cracked to lighter fractions and, more importantly, theviscosity of the vacuum residue is reduced significantly. For this reason, the thermal crackerunit is normally called the “visbreaker” gas oil unit.
FEED AND PRODUCT STREAMSThe atmospheric residue from the crude distillation unit, the vacuum residue from the highvacuum unit, heavy gas oils or vacuum gasoils or mixtures are typically the feedstocks. In thisprocess, only part of the feedstock is converted and a large amount of residue remainsunconverted. As no catalyst is involved in the thermal cracking process, the quality of thefeedstock in terms of metals and sulphur is not critical. A significant quantity of gas is producedand all distillate products need further treatment and upgrading prior to running them to storage.
PROCESS DESCRIPTIONThermal cracking is one of the oldest conversion processes to upgrade heavy oil fractions. Atpresent it is mainly used to upgrade vacuum residue. Figure 2.30 shows a simplified processflow diagram of the Visbreaker unit. The most important factor in controlling the crackingseverity should always be the stability and viscosity of the visbroken residue fed to the fuel oilpool. In general, an increase in the temperature or residence time results in an increase inseverity. Increased severity produces higher gas-plus-gasoline yield and at the same time acracked residue (fuel oil) of lower viscosity. Excessive cracking, however, leads to an unstablefuel oil, resulting in sludge and sediment formation during storage. Thermal crackingconversion is maximum 20 % of the feed. Thermal cracking units to upgrade atmosphericresidue have conversion levels significantly higher (35 - 45 %) and the viscosity of theatmospheric residue is reduced.
GAS OILSTEAM
SOAKINGDRUM
450°C9-10 barg
FRACTIONATOR
STRIPPER
FEED
FEED
BFWSTEAM
VISBROKENRESIDUE
MPA
MPA
VISBROKENRESIDUE
WILD NAPHTHA
SOUR WATER
RECONTACTINGVESSEL
RECONTACTINGCOMPRESSOR
REFINERY GAS
STEAM
FLUE GAS
FUEL
Figure 2.30: Simplified process flow scheme for visbreaking unit
Applied processes and techniques Chapter 2
MA/EIPPCB/REF_BREF_FINAL December 2001 79
The feedstock is heated above 500 ºC and then fed to a reaction chamber which is kept at apressure of about 9.65 barg. Following the reactor step, the process stream is mixed with acooler recycle stream, which stops the cracking reactions. The product is then fed to a flasherchamber, where pressure is reduced and lighter products vaporise and are drawn off. The lighterproducts are fed to a fractionating tower, where the various fractions are separated. The"bottoms" consist of heavy residue, part of which is recycled to cool the process stream leavingthe reaction chamber; the remaining bottoms are usually blended into residual fuel.
There are two types of visbreaker operations, “coil or furnace cracking” and “soaker cracking”.Coil cracking uses higher furnace outlet temperatures (470 – 500 °C) and reaction times fromone to three minutes, while soaker cracking uses lower furnace outlet temperatures(430 - 440 °C) and longer reaction times. The product yields and properties are similar. Runtimes of 3 - 6 months are common for furnace visbreakers and 6 - 18 months for soakervisbreakers.
Chapter 2 Applied processes and techniques
80 December 2001 MA/EIPPCB/REF_BREF_FINAL
2.23 Techniques for the abatement of emissions
There are many non-production techniques in use in a refinery. In particular, for this documentare relevant those techniques used to control and abate emissions to air, water and soil.Descriptions of many of those techniques can be found in the BREF on Waste Gas and WasteWater in the Chemical Industry and in Chapter 4 (Section 4.23 to 4.25). Those techniques arenot described in this chapter because they are typically techniques that might be considered inthe determination of BAT and consequently are going to be described and analysed inChapter 4, Sections 23-25.
Pollutants such as NOx, particulates, H2S, SO2, other sulphur compounds and VOC, amongothers, are typically abated by end-of-pipe techniques. One of the largest systems within arefinery is the abatement of H2S produced across the refinery. These systems typically containan amine scrubbing system and a sulphur recovery unit to convert H2S into sulphur, a by-product produced within refineries. Flares are also another technique used within the refineryfor safety and environmental reasons. Techniques for the abatement of odour and noise are alsorelevant for refineries.
Refineries also contain waste water plants with different unit operations. Oil separators,flotation, floculation and biological treatment are typical within refineries. Biological treatmentis required when biodegradation of some organic chemicals that may be present within thewaste water stream is necessary. Final water cleaning systems can also be present.
Refineries also generate solid wastes. Some of them are recycled within the refinery, others arerecycled by specialist companies (e.g. catalysts) and others are disposed of. Soil contaminationprevention techniques that are also relevant to the whole refinery.
Emissions and consumption levels Chapter 3
MA/EIPPCB/REF_BREF_FINAL December 2001 81
3 CURRENT EMISSION AND CONSUMPTION LEVELS
This chapter provides data and information about current emission and consumption levels inexisting installations at the time of writing. Because it covers many types and sizes of refinery,the data are very wide-ranging. The goal of the chapter is to bring together, as far as possible,the emission and consumption levels of the refinery as a whole and for each specific process.The data quoted will, in most cases, enable an estimate of the concentration and load ofemissions, in turn enabling a competent authority issuing a permit to verify the informationprovided in the permit application.
Section 3.1 gives an overview of the main emissions and consumptions of European refineriesas a whole. It is not a simple aggregation of the emissions and consumptions in the othersections: most of them cannot be aggregated because of the integration of processes inrefineries.
Section 2 to 22 cover the emissions and consumptions from the various processes/activitiescovered by this document. Sections 23-25 covers the emissions generated by the techniquesused to abate emissions, including the emissions from sulphur recovery units. The chapter endswith a section on monitoring, which covers the monitoring systems typically applied inrefineries and provides some discussion on their application.
3.1 Current emission and consumption levels in refineries asa whole
Refineries are industrial sites that manage huge amounts of raw materials and products and theyare also intensive consumers of energy and water. From storage and from the refining process,they generate emissions to the atmosphere, to the water and to the soil.
This chapter addresses those three media in turn, and the pollutants that affect them, and is asummary of the emissions from all refinery processes. The main environmental problems werementioned in Chapter 1 (Section 1.4), but without figures. This section aims to quantify refineryemissions.
Although the principal raw material input to petroleum refineries is crude oil, they use andgenerate an enormous number of chemicals, some of which leave the facilities as discharges ofair emissions, waste water or solid waste. Pollutants generated typically include ammonia(NH3), carbon dioxide (CO2), carbon monoxide (CO), hydrogen sulphide (H2S), metals,nitrogen oxides (NOx), particulates, spent acids (e.g. HF, H2SO4), sulphur oxides (SOx), volatileorganic compounds (VOC) and numerous organic compounds (some very toxic). Figure 3.1shows a simplified example of what it is consumed and emitted by a refinery.
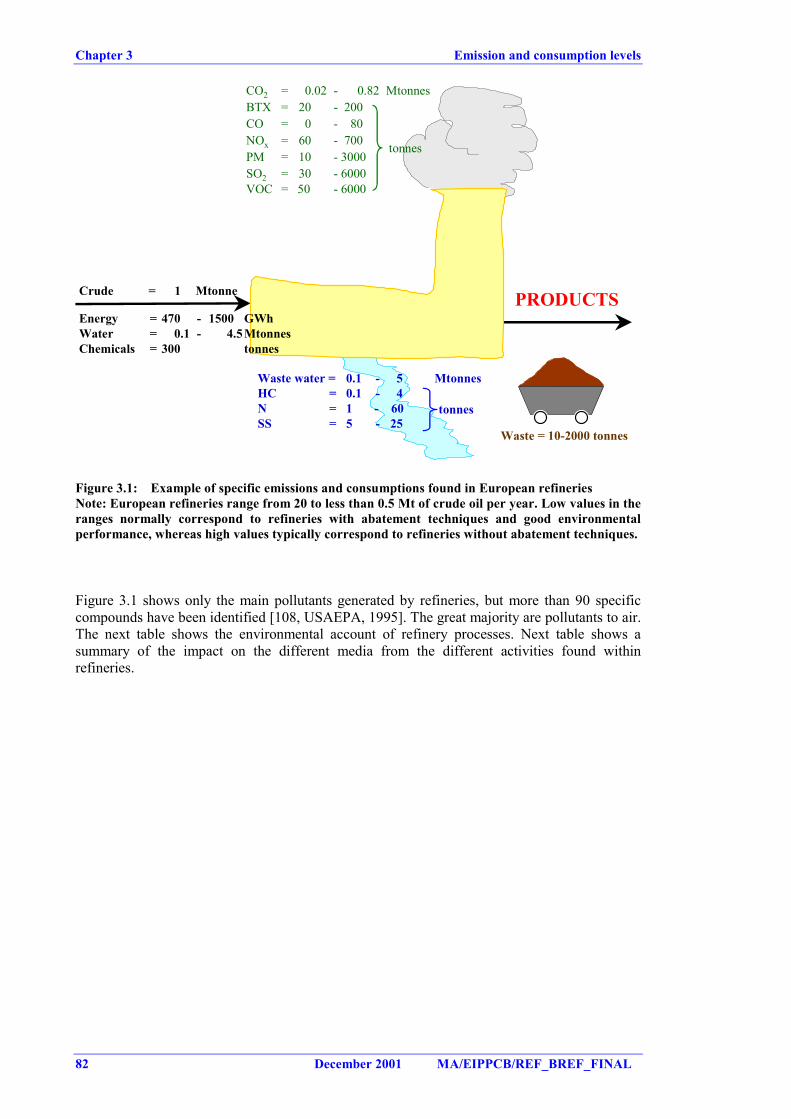
Chapter 3 Emission and consumption levels
82 December 2001 MA/EIPPCB/REF_BREF_FINAL
Waste = 10-2000 tonnes
PRODUCTS
CO2 = 0.02 - 0.82 MtonnesBTX = 20 - 200 CO = 0 - 80 NOx = 60 - 700 PM = 10 - 3000SO2 = 30 - 6000 VOC = 50 - 6000
tonnes
Waste water = 0.1 - 5 MtonnesHC = 0.1 - 4 N = 1 - 60 SS = 5 - 25
tonnes
Energy = 470 - 1500 GWhWater = 0.1 - 4.5MtonnesChemicals = 300 tonnes
Crude = 1 Mtonne
Figure 3.1: Example of specific emissions and consumptions found in European refineriesNote: European refineries range from 20 to less than 0.5 Mt of crude oil per year. Low values in theranges normally correspond to refineries with abatement techniques and good environmentalperformance, whereas high values typically correspond to refineries without abatement techniques.
Figure 3.1 shows only the main pollutants generated by refineries, but more than 90 specificcompounds have been identified [108, USAEPA, 1995]. The great majority are pollutants to air.The next table shows the environmental account of refinery processes. Next table shows asummary of the impact on the different media from the different activities found withinrefineries.
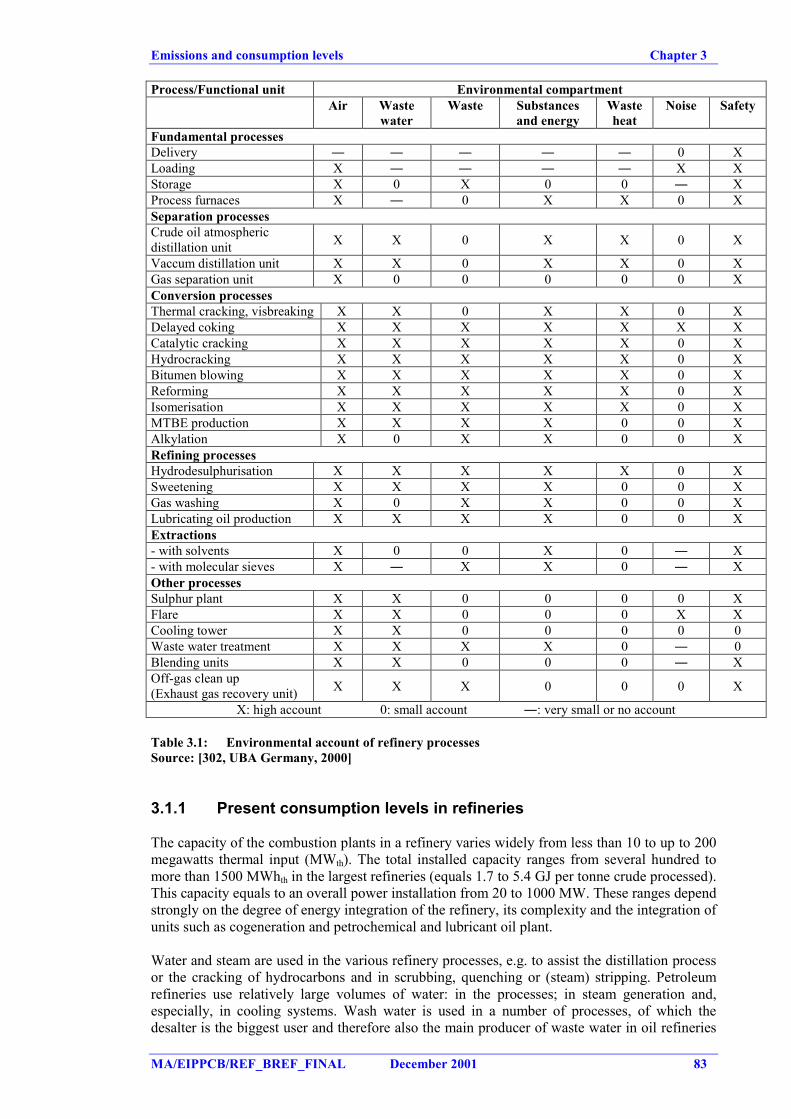
Emissions and consumption levels Chapter 3
MA/EIPPCB/REF_BREF_FINAL December 2001 83
Process/Functional unit Environmental compartmentAir Waste
waterWaste Substances
and energyWasteheat
Noise Safety
Fundamental processesDelivery ― ― ― ― ― 0 XLoading X ― ― ― ― X XStorage X 0 X 0 0 ― XProcess furnaces X ― 0 X X 0 XSeparation processesCrude oil atmosphericdistillation unit X X 0 X X 0 X
Vaccum distillation unit X X 0 X X 0 XGas separation unit X 0 0 0 0 0 XConversion processesThermal cracking, visbreaking X X 0 X X 0 XDelayed coking X X X X X X XCatalytic cracking X X X X X 0 XHydrocracking X X X X X 0 XBitumen blowing X X X X X 0 XReforming X X X X X 0 XIsomerisation X X X X X 0 XMTBE production X X X X 0 0 XAlkylation X 0 X X 0 0 XRefining processesHydrodesulphurisation X X X X X 0 XSweetening X X X X 0 0 XGas washing X 0 X X 0 0 XLubricating oil production X X X X 0 0 XExtractions- with solvents X 0 0 X 0 ― X- with molecular sieves X ― X X 0 ― XOther processesSulphur plant X X 0 0 0 0 XFlare X X 0 0 0 X XCooling tower X X 0 0 0 0 0Waste water treatment X X X X 0 ― 0Blending units X X 0 0 0 ― XOff-gas clean up(Exhaust gas recovery unit) X X X 0 0 0 X
X: high account 0: small account ―: very small or no account
Table 3.1: Environmental account of refinery processesSource: [302, UBA Germany, 2000]
3.1.1 Present consumption levels in refineries
The capacity of the combustion plants in a refinery varies widely from less than 10 to up to 200megawatts thermal input (MWth). The total installed capacity ranges from several hundred tomore than 1500 MWhth in the largest refineries (equals 1.7 to 5.4 GJ per tonne crude processed).This capacity equals to an overall power installation from 20 to 1000 MW. These ranges dependstrongly on the degree of energy integration of the refinery, its complexity and the integration ofunits such as cogeneration and petrochemical and lubricant oil plant.
Water and steam are used in the various refinery processes, e.g. to assist the distillation processor the cracking of hydrocarbons and in scrubbing, quenching or (steam) stripping. Petroleumrefineries use relatively large volumes of water: in the processes; in steam generation and,especially, in cooling systems. Wash water is used in a number of processes, of which thedesalter is the biggest user and therefore also the main producer of waste water in oil refineries
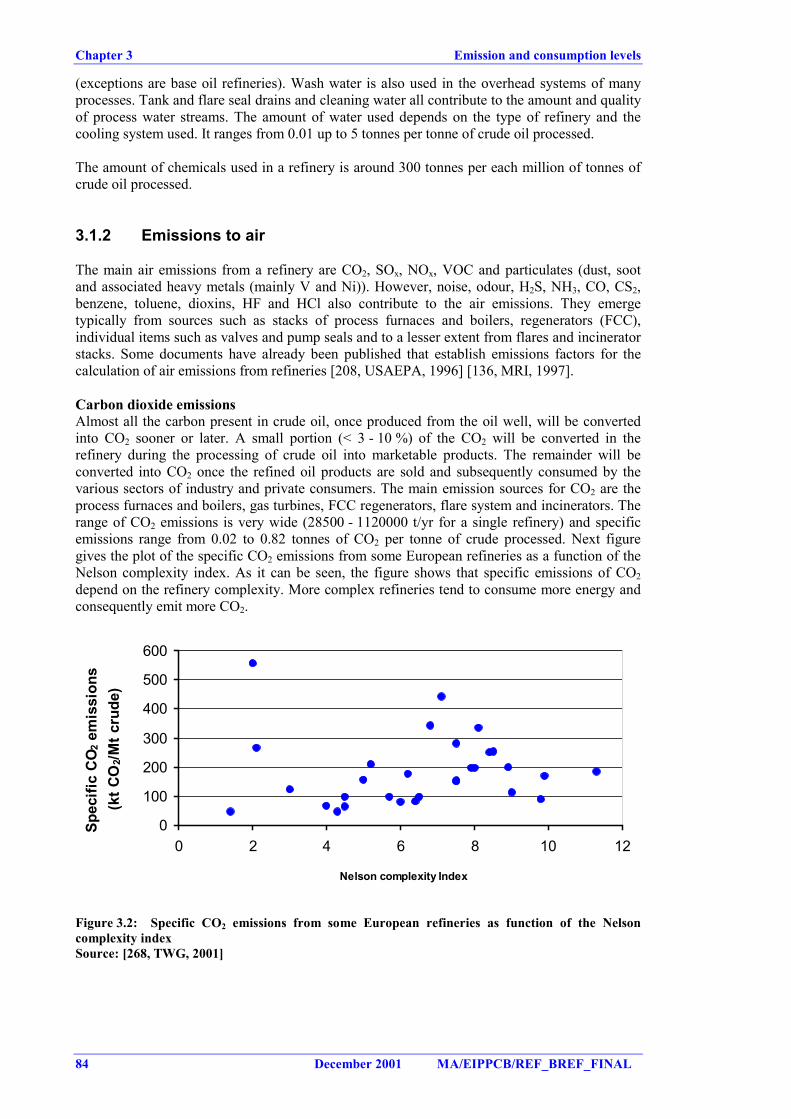
Chapter 3 Emission and consumption levels
84 December 2001 MA/EIPPCB/REF_BREF_FINAL
(exceptions are base oil refineries). Wash water is also used in the overhead systems of manyprocesses. Tank and flare seal drains and cleaning water all contribute to the amount and qualityof process water streams. The amount of water used depends on the type of refinery and thecooling system used. It ranges from 0.01 up to 5 tonnes per tonne of crude oil processed.
The amount of chemicals used in a refinery is around 300 tonnes per each million of tonnes ofcrude oil processed.
3.1.2 Emissions to air
The main air emissions from a refinery are CO2, SOx, NOx, VOC and particulates (dust, sootand associated heavy metals (mainly V and Ni)). However, noise, odour, H2S, NH3, CO, CS2,benzene, toluene, dioxins, HF and HCl also contribute to the air emissions. They emergetypically from sources such as stacks of process furnaces and boilers, regenerators (FCC),individual items such as valves and pump seals and to a lesser extent from flares and incineratorstacks. Some documents have already been published that establish emissions factors for thecalculation of air emissions from refineries [208, USAEPA, 1996] [136, MRI, 1997].
Carbon dioxide emissionsAlmost all the carbon present in crude oil, once produced from the oil well, will be convertedinto CO2 sooner or later. A small portion (< 3 - 10 %) of the CO2 will be converted in therefinery during the processing of crude oil into marketable products. The remainder will beconverted into CO2 once the refined oil products are sold and subsequently consumed by thevarious sectors of industry and private consumers. The main emission sources for CO2 are theprocess furnaces and boilers, gas turbines, FCC regenerators, flare system and incinerators. Therange of CO2 emissions is very wide (28500 - 1120000 t/yr for a single refinery) and specificemissions range from 0.02 to 0.82 tonnes of CO2 per tonne of crude processed. Next figuregives the plot of the specific CO2 emissions from some European refineries as a function of theNelson complexity index. As it can be seen, the figure shows that specific emissions of CO2depend on the refinery complexity. More complex refineries tend to consume more energy andconsequently emit more CO2.
0
100
200
300
400
500
600
0 2 4 6 8 10 12
Nelson complexity Index
Spec
ific
CO2 e
mis
sion
s (k
t CO
2/Mt c
rude
)
Figure 3.2: Specific CO2 emissions from some European refineries as function of the Nelsoncomplexity indexSource: [268, TWG, 2001]
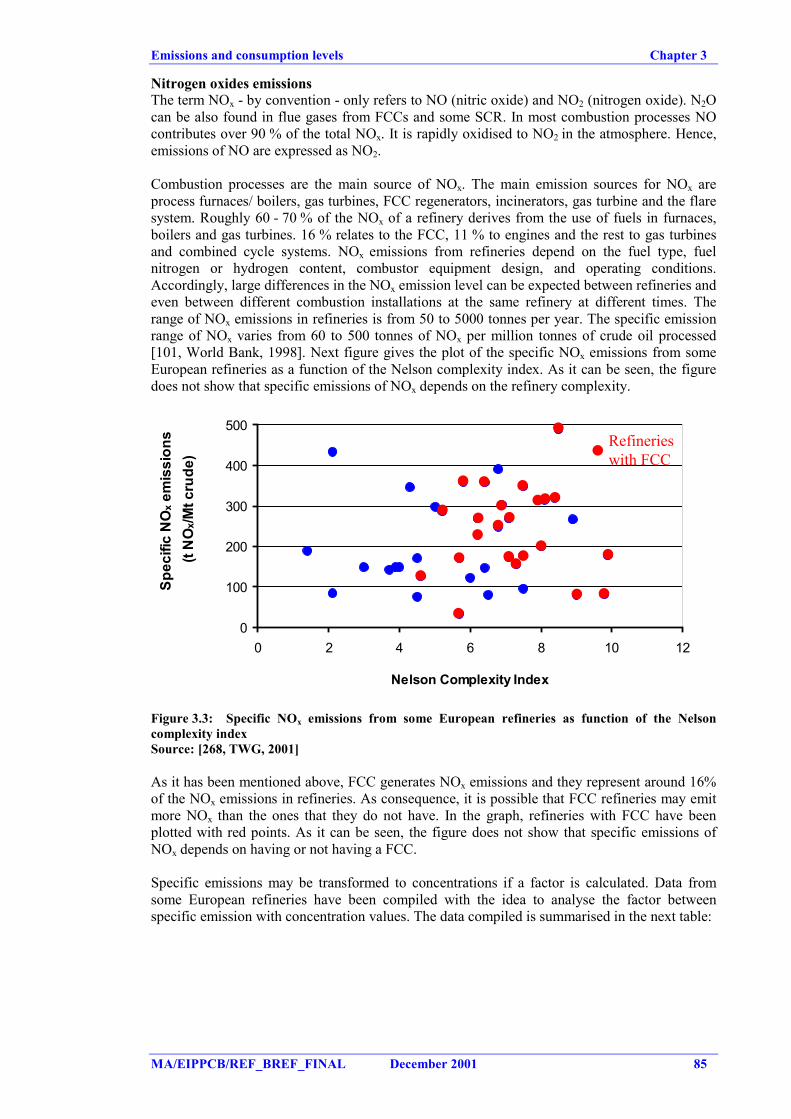
Emissions and consumption levels Chapter 3
MA/EIPPCB/REF_BREF_FINAL December 2001 85
Nitrogen oxides emissionsThe term NOx - by convention - only refers to NO (nitric oxide) and NO2 (nitrogen oxide). N2Ocan be also found in flue gases from FCCs and some SCR. In most combustion processes NOcontributes over 90 % of the total NOx. It is rapidly oxidised to NO2 in the atmosphere. Hence,emissions of NO are expressed as NO2.
Combustion processes are the main source of NOx. The main emission sources for NOx areprocess furnaces/ boilers, gas turbines, FCC regenerators, incinerators, gas turbine and the flaresystem. Roughly 60 - 70 % of the NOx of a refinery derives from the use of fuels in furnaces,boilers and gas turbines. 16 % relates to the FCC, 11 % to engines and the rest to gas turbinesand combined cycle systems. NOx emissions from refineries depend on the fuel type, fuelnitrogen or hydrogen content, combustor equipment design, and operating conditions.Accordingly, large differences in the NOx emission level can be expected between refineries andeven between different combustion installations at the same refinery at different times. Therange of NOx emissions in refineries is from 50 to 5000 tonnes per year. The specific emissionrange of NOx varies from 60 to 500 tonnes of NOx per million tonnes of crude oil processed[101, World Bank, 1998]. Next figure gives the plot of the specific NOx emissions from someEuropean refineries as a function of the Nelson complexity index. As it can be seen, the figuredoes not show that specific emissions of NOx depends on the refinery complexity.
0
100
200
300
400
500
0 2 4 6 8 10 12
Nelson Complexity Index
Spec
ific
NO
x em
issi
ons
(t N
Ox/M
t cru
de)
Refinerieswith FCC
Figure 3.3: Specific NOx emissions from some European refineries as function of the Nelsoncomplexity indexSource: [268, TWG, 2001]
As it has been mentioned above, FCC generates NOx emissions and they represent around 16%of the NOx emissions in refineries. As consequence, it is possible that FCC refineries may emitmore NOx than the ones that they do not have. In the graph, refineries with FCC have beenplotted with red points. As it can be seen, the figure does not show that specific emissions ofNOx depends on having or not having a FCC.
Specific emissions may be transformed to concentrations if a factor is calculated. Data fromsome European refineries have been compiled with the idea to analyse the factor betweenspecific emission with concentration values. The data compiled is summarised in the next table:
Chapter 3 Emission and consumption levels
86 December 2001 MA/EIPPCB/REF_BREF_FINAL
Refinery capacity(Mt)
Total flue gas volume(109 Nm3/yr)
Specific volume of flue gas(109 Nm3/yr per Mt)
15 22.173 1.4812.4 10.171 0.8210 11.9 0.84 gas fired refinery
9.6* 6.2 1.55 More liquid fuel9.6* 6.6 1.469.6* 7.4 1.309.6* 9.9 0.97 Less liquid fuel9 8.28 0.929.0 9.2 0.985 5.098 1.024.5 5.535 1.234.2 1.996 0.482.5 0.866 0.351.2 0.288 0.24
Range in a EU+country
1 – 1.5
* Values that correspond to the same refinery but for different years. The proportion of RFG increases as you godown in the table.
Table 3.2: Volume of flue gas generated by EU refineriesSource: [268, TWG, 2001]
As it can be shown in this table, the specific volume of flue gas is very variable. However, it hasbeen found a correlation that speciality refineries (last two raws in the table) tend to give lowervalues. The average for other nine refineries is around 1 and it varies between 0.48 and 1.55.This factor depends on fuel distribution (gas/liquid ratio as shown in the asterisk example withinthe table), fuel composition, oxygen content of the flue gas, etc. and consequently the range iswide. However, it may be calculated, considering those values, that a refinery emitting 200tonnes of NOx/Mt of crude processes may emit flue gases with a NOx concentration of 130-420mg/Nm3 (average: 200 mg/Nm3).
Particulate emissionsThe concern with particulate emissions (including of heavy metals) stems from health effects.The main emission sources are process furnaces/ boilers (mainly those fired with (liquid) heavyfuel oil), catalytic cracker regenerators, coke plants, incinerators, decoking & sootblowing offurnaces and the flare. The range of emissions found in European refineries is from 100 to20000 tonnes of particulates emitted per year. The specific emission range found is from 10 to3000 tonnes of particulates per million tonnes of crude oil processed. The lower emission valuecan be achieved in simple refineries burning substantial amounts of gas or when effectivededusting devices (ESP, bag filters) are installed.
Important heavy metals in crude oils are arsenic, mercury, nickel and vanadium (SeeSection 10.3). Nickel and vanadiun are enriched in the residues during distillation and areremoved with the particulate matter by ESP or fabric filters after combustion in the furnaces orafter regeneration of catalysts by burning off. Next table shows data on air emissions of Nickeland Vanadium from two EU+ refineries:
Nickel VanadiumRefinery capacity (Mt) Specific load
(t/Mt)Range of
concentration(mg/Nm3)
Specific load(t/Mt)
Rangeconcentration
(mg/Nm3)15.3 0.196 0.2 – 1.2 0.327 0.3 – 2.112.3 0.772 0.02 – 2.35 1.666 0.05 – 5.1
Emissions and consumption levels Chapter 3
MA/EIPPCB/REF_BREF_FINAL December 2001 87
Sulphur oxides emissionsSulphur emission to the atmosphere has long been an issue for refineries. All crude oils containsulphur compounds. Consequently, when firing refinery fuels, SO2 and SO3 will be emitted.There is a direct relation between the sulphur content of the fuel and the amount of SOx emitted(for example, a fuel with 1% sulphur generates a flue gas with 1700 mg/Nm3). The sulphur,which is not extracted from the products in the refinery, will remain in the various products andwill be combusted to SOx by the various end-users. The refinery as consumer of fuel for itsenergy use, similarly emits SOx. Natural gas normally contains only traces of sulphurcompounds.
There are both continuous and non-continuous sources of SOx emissions. The number of sourcesmay vary from refinery to refinery. The main emission sources of SO2 are the process furnaces/boilers, gas turbines, sulphur recovery units, FCC regenerators, flare system, incinerators,decoking operations and the treating units. CONCAWE [49, CONCAWE, 1998] gives anaverage distribution of the SOx emissions of some 70 refineries studied. Mainly as a result of theuse of liquid refinery fuels in boilers and furnaces, 59.4 % of refinery SOx emissions stem fromcombustion processes. FCC units account for 13.5 %, sulphur recovery units for 10.7 % andother miscellaneous sources for 11.4 %. Next table shows the ranges found for those refineries.
SO2 discharged expressedas sulphur (kt/yr)
Percentage of refinery SO2emissions (%)
Fuel fired infurnaces/boilers 257 59 - 69
FCC units 58 7 - 14Sulphur recovery units 46 10 - 11Flares 22 5 - 9Miscellaneous 49 5 - 12TOTAL 432
Table 3.3: SO2 discharged to atmosphere as an average from 70 European refineries and a splitof total refinery emissions as an example for SO2 emissions.Sources: Corinair W-Europe and CONCAWE report 3/98
The same report mentioned above shows that, in 1995 the average SO2 concentration inEuropean refineries amounted to 1350 mg/Nm3; concentrations ranged from 226 – 2064mg/Nm3 flue gas. Some data on average bubble calculations have been included in Section 3.15.uhe range of annual emissions is from 49 to 10000 tonnes per year and specific emissions rangefrom 30 - 6000 tonnes of SO2 per million of tonne of crude processed. That report also showsthat, despite similar sulphur levels in the crude oil, major differences exist between averagerefinery SOx emissions. In order to complement this information the next three figures relatingSOx emissions from EU+ refineries are plot. Next figure gives the plot of the SO2 emissionsfrom some European refineries as a function of the crude capacity. Figure shows that biggerrefineries tend to emit more SO2.
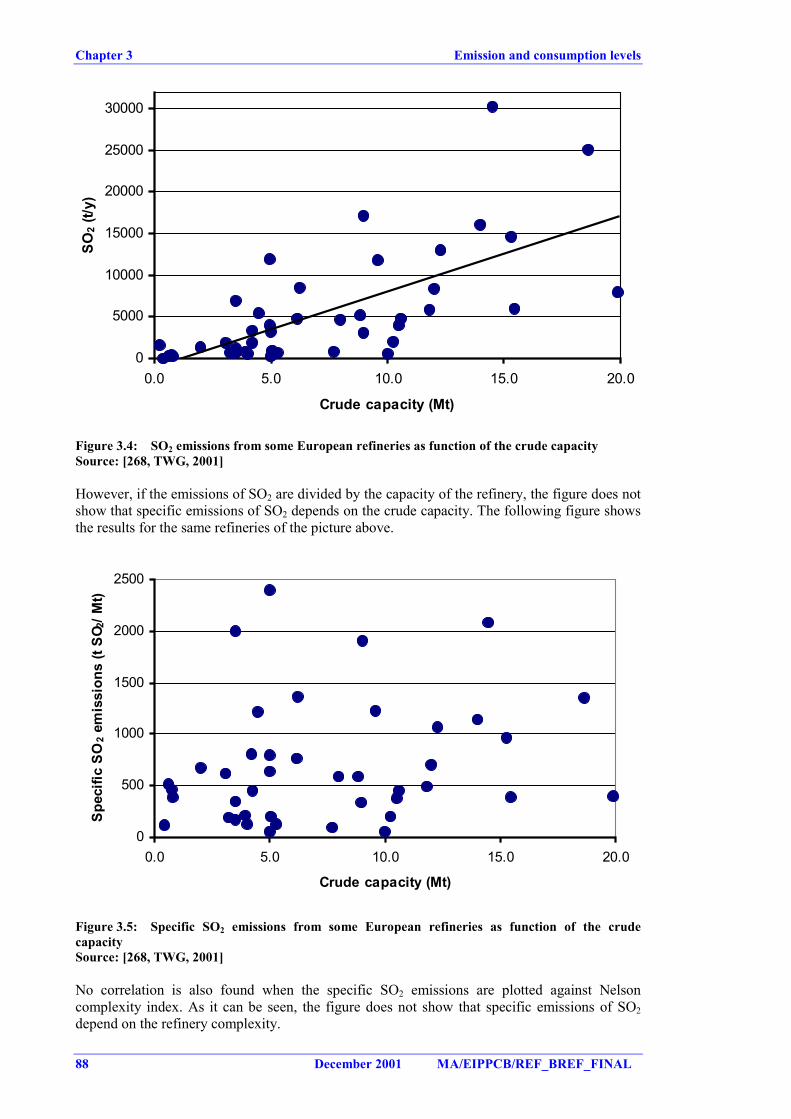
Chapter 3 Emission and consumption levels
88 December 2001 MA/EIPPCB/REF_BREF_FINAL
0
5000
10000
15000
20000
25000
30000
0.0 5.0 10.0 15.0 20.0
Crude capacity (Mt)
SO2 (
t/y)
Figure 3.4: SO2 emissions from some European refineries as function of the crude capacitySource: [268, TWG, 2001]
However, if the emissions of SO2 are divided by the capacity of the refinery, the figure does notshow that specific emissions of SO2 depends on the crude capacity. The following figure showsthe results for the same refineries of the picture above.
0
500
1000
1500
2000
2500
0.0 5.0 10.0 15.0 20.0
Crude capacity (Mt)
Spec
ific
SO2 e
mis
sion
s (t
SO2/
Mt)
Figure 3.5: Specific SO2 emissions from some European refineries as function of the crudecapacitySource: [268, TWG, 2001]
No correlation is also found when the specific SO2 emissions are plotted against Nelsoncomplexity index. As it can be seen, the figure does not show that specific emissions of SO2depend on the refinery complexity.
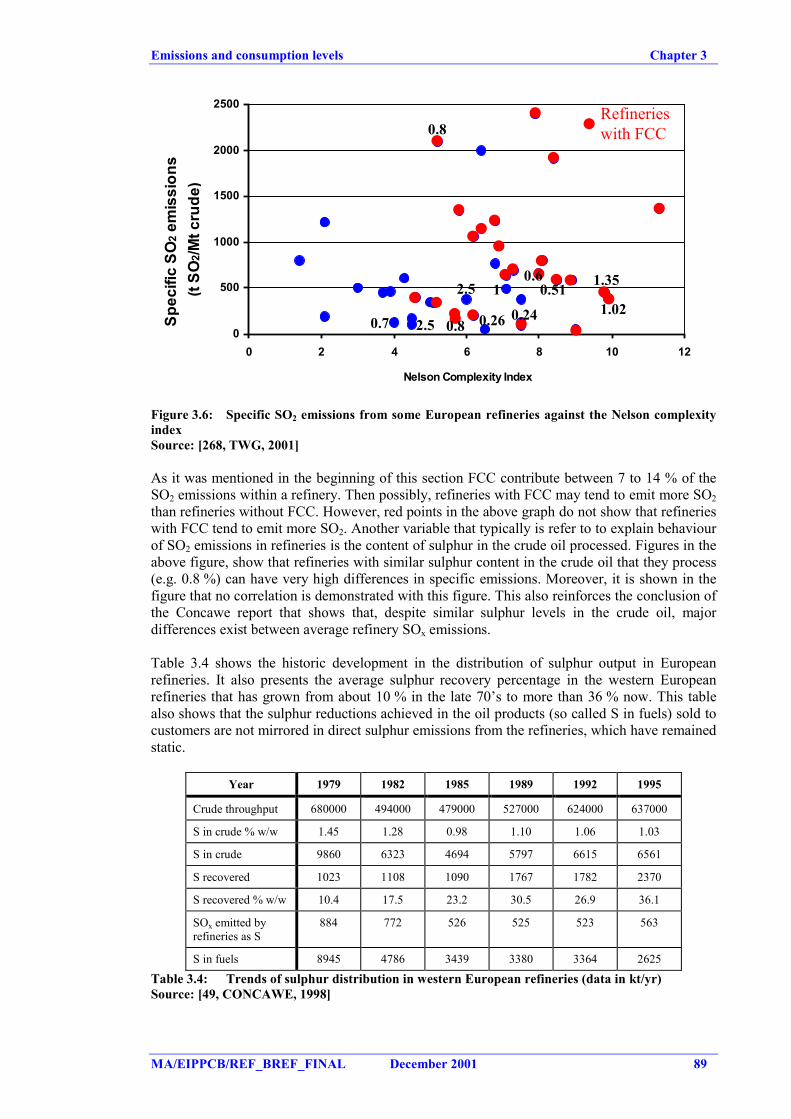
Emissions and consumption levels Chapter 3
MA/EIPPCB/REF_BREF_FINAL December 2001 89
0
500
1000
1500
2000
2500
0 2 4 6 8 10 12
Nelson Complexity Index
Spec
ific
SO2 e
mis
sion
s (t
SO
2/Mt c
rude
)
Refinerieswith FCC0.8
1.35
1.020.8
0.510.6
0.240.7
1
0.26
2.5
2.5
Figure 3.6: Specific SO2 emissions from some European refineries against the Nelson complexityindexSource: [268, TWG, 2001]
As it was mentioned in the beginning of this section FCC contribute between 7 to 14 % of theSO2 emissions within a refinery. Then possibly, refineries with FCC may tend to emit more SO2than refineries without FCC. However, red points in the above graph do not show that refinerieswith FCC tend to emit more SO2. Another variable that typically is refer to to explain behaviourof SO2 emissions in refineries is the content of sulphur in the crude oil processed. Figures in theabove figure, show that refineries with similar sulphur content in the crude oil that they process(e.g. 0.8 %) can have very high differences in specific emissions. Moreover, it is shown in thefigure that no correlation is demonstrated with this figure. This also reinforces the conclusion ofthe Concawe report that shows that, despite similar sulphur levels in the crude oil, majordifferences exist between average refinery SOx emissions.
Table 3.4 shows the historic development in the distribution of sulphur output in Europeanrefineries. It also presents the average sulphur recovery percentage in the western Europeanrefineries that has grown from about 10 % in the late 70’s to more than 36 % now. This tablealso shows that the sulphur reductions achieved in the oil products (so called S in fuels) sold tocustomers are not mirrored in direct sulphur emissions from the refineries, which have remainedstatic.
Year 1979 1982 1985 1989 1992 1995
Crude throughput 680000 494000 479000 527000 624000 637000
S in crude % w/w 1.45 1.28 0.98 1.10 1.06 1.03
S in crude 9860 6323 4694 5797 6615 6561
S recovered 1023 1108 1090 1767 1782 2370
S recovered % w/w 10.4 17.5 23.2 30.5 26.9 36.1
SOx emitted byrefineries as S
884 772 526 525 523 563
S in fuels 8945 4786 3439 3380 3364 2625
Table 3.4: Trends of sulphur distribution in western European refineries (data in kt/yr)Source: [49, CONCAWE, 1998]
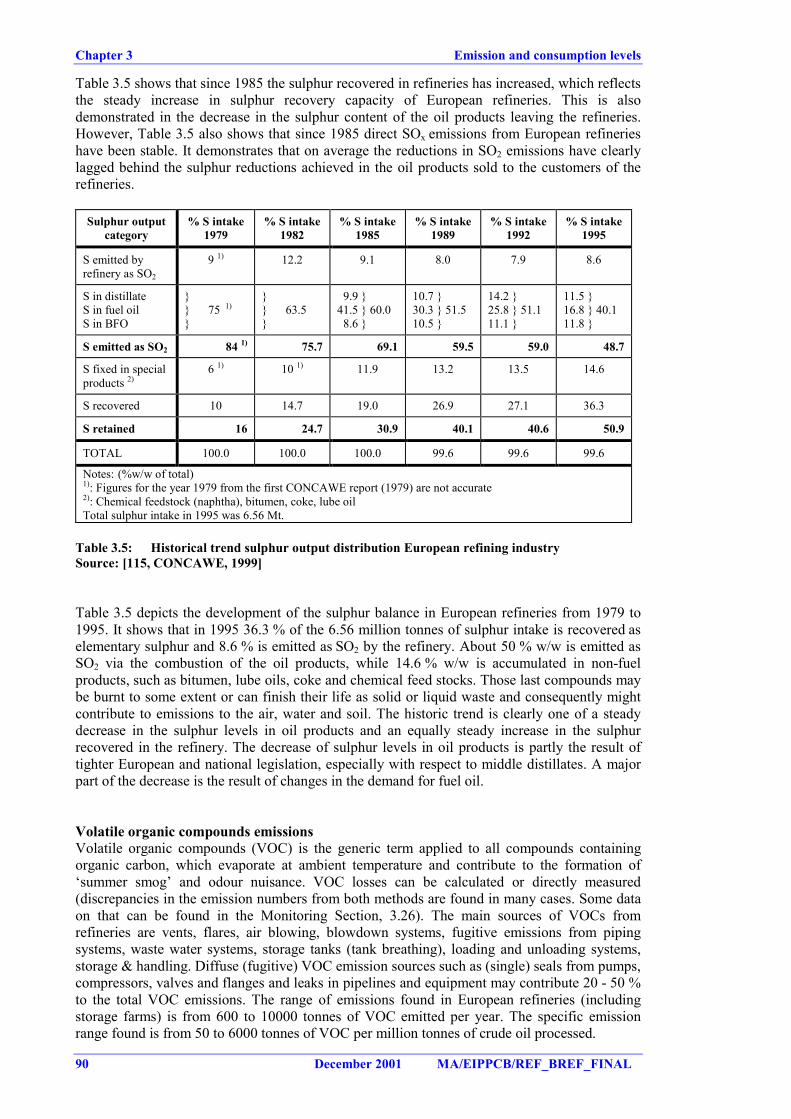
Chapter 3 Emission and consumption levels
90 December 2001 MA/EIPPCB/REF_BREF_FINAL
Table 3.5 shows that since 1985 the sulphur recovered in refineries has increased, which reflectsthe steady increase in sulphur recovery capacity of European refineries. This is alsodemonstrated in the decrease in the sulphur content of the oil products leaving the refineries.However, Table 3.5 also shows that since 1985 direct SOx emissions from European refinerieshave been stable. It demonstrates that on average the reductions in SO2 emissions have clearlylagged behind the sulphur reductions achieved in the oil products sold to the customers of therefineries.
Sulphur outputcategory
% S intake1979
% S intake1982
% S intake1985
% S intake1989
% S intake1992
% S intake1995
S emitted byrefinery as SO2
9 1) 12.2 9.1 8.0 7.9 8.6
S in distillateS in fuel oilS in BFO
}} 75 1)
}
}} 63.5}
9.9 }41.5 } 60.0 8.6 }
10.7 }30.3 } 51.510.5 }
14.2 }25.8 } 51.111.1 }
11.5 }16.8 } 40.111.8 }
S emitted as SO2 84 1) 75.7 69.1 59.5 59.0 48.7
S fixed in specialproducts 2)
6 1) 10 1) 11.9 13.2 13.5 14.6
S recovered 10 14.7 19.0 26.9 27.1 36.3
S retained 16 24.7 30.9 40.1 40.6 50.9
TOTAL 100.0 100.0 100.0 99.6 99.6 99.6
Notes: (%w/w of total)1): Figures for the year 1979 from the first CONCAWE report (1979) are not accurate2): Chemical feedstock (naphtha), bitumen, coke, lube oilTotal sulphur intake in 1995 was 6.56 Mt.
Table 3.5: Historical trend sulphur output distribution European refining industrySource: [115, CONCAWE, 1999]
Table 3.5 depicts the development of the sulphur balance in European refineries from 1979 to1995. It shows that in 1995 36.3 % of the 6.56 million tonnes of sulphur intake is recovered aselementary sulphur and 8.6 % is emitted as SO2 by the refinery. About 50 % w/w is emitted asSO2 via the combustion of the oil products, while 14.6 % w/w is accumulated in non-fuelproducts, such as bitumen, lube oils, coke and chemical feed stocks. Those last compounds maybe burnt to some extent or can finish their life as solid or liquid waste and consequently mightcontribute to emissions to the air, water and soil. The historic trend is clearly one of a steadydecrease in the sulphur levels in oil products and an equally steady increase in the sulphurrecovered in the refinery. The decrease of sulphur levels in oil products is partly the result oftighter European and national legislation, especially with respect to middle distillates. A majorpart of the decrease is the result of changes in the demand for fuel oil.
Volatile organic compounds emissionsVolatile organic compounds (VOC) is the generic term applied to all compounds containingorganic carbon, which evaporate at ambient temperature and contribute to the formation of‘summer smog’ and odour nuisance. VOC losses can be calculated or directly measured(discrepancies in the emission numbers from both methods are found in many cases. Some dataon that can be found in the Monitoring Section, 3.26). The main sources of VOCs fromrefineries are vents, flares, air blowing, blowdown systems, fugitive emissions from pipingsystems, waste water systems, storage tanks (tank breathing), loading and unloading systems,storage & handling. Diffuse (fugitive) VOC emission sources such as (single) seals from pumps,compressors, valves and flanges and leaks in pipelines and equipment may contribute 20 - 50 %to the total VOC emissions. The range of emissions found in European refineries (includingstorage farms) is from 600 to 10000 tonnes of VOC emitted per year. The specific emissionrange found is from 50 to 6000 tonnes of VOC per million tonnes of crude oil processed.
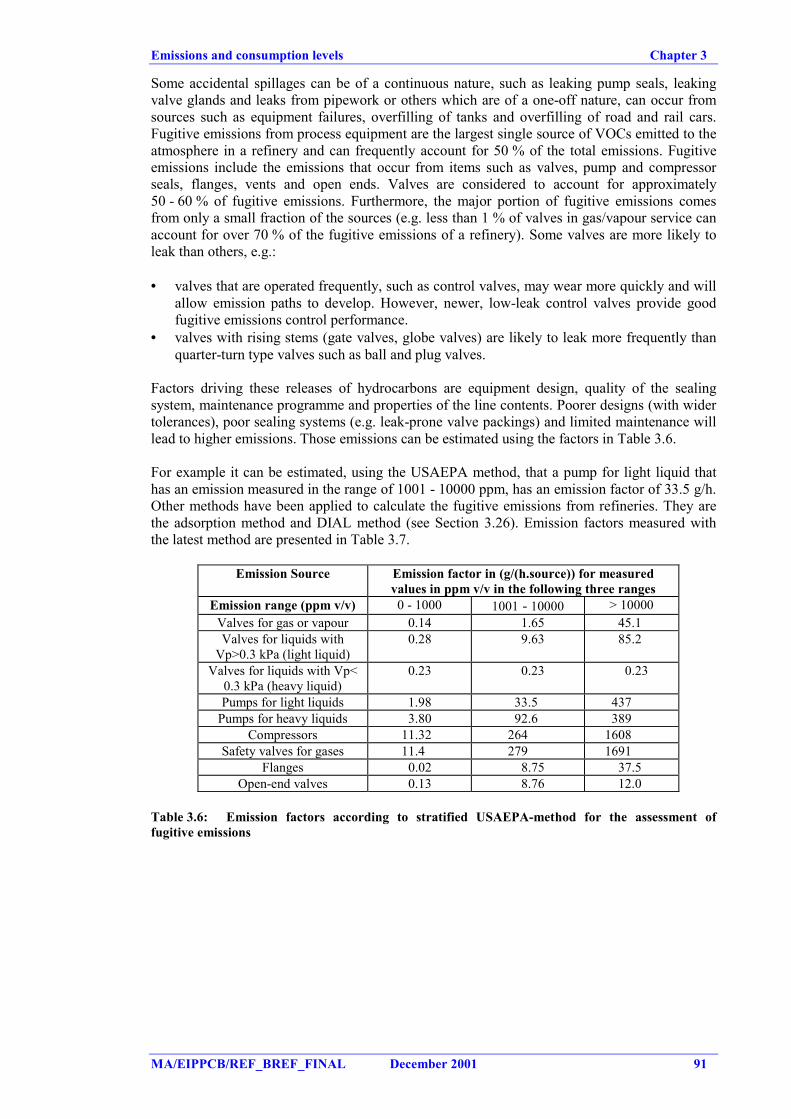
Emissions and consumption levels Chapter 3
MA/EIPPCB/REF_BREF_FINAL December 2001 91
Some accidental spillages can be of a continuous nature, such as leaking pump seals, leakingvalve glands and leaks from pipework or others which are of a one-off nature, can occur fromsources such as equipment failures, overfilling of tanks and overfilling of road and rail cars.Fugitive emissions from process equipment are the largest single source of VOCs emitted to theatmosphere in a refinery and can frequently account for 50 % of the total emissions. Fugitiveemissions include the emissions that occur from items such as valves, pump and compressorseals, flanges, vents and open ends. Valves are considered to account for approximately50 - 60 % of fugitive emissions. Furthermore, the major portion of fugitive emissions comesfrom only a small fraction of the sources (e.g. less than 1 % of valves in gas/vapour service canaccount for over 70 % of the fugitive emissions of a refinery). Some valves are more likely toleak than others, e.g.:
• valves that are operated frequently, such as control valves, may wear more quickly and willallow emission paths to develop. However, newer, low-leak control valves provide goodfugitive emissions control performance.
• valves with rising stems (gate valves, globe valves) are likely to leak more frequently thanquarter-turn type valves such as ball and plug valves.
Factors driving these releases of hydrocarbons are equipment design, quality of the sealingsystem, maintenance programme and properties of the line contents. Poorer designs (with widertolerances), poor sealing systems (e.g. leak-prone valve packings) and limited maintenance willlead to higher emissions. Those emissions can be estimated using the factors in Table 3.6.
For example it can be estimated, using the USAEPA method, that a pump for light liquid thathas an emission measured in the range of 1001 - 10000 ppm, has an emission factor of 33.5 g/h.Other methods have been applied to calculate the fugitive emissions from refineries. They arethe adsorption method and DIAL method (see Section 3.26). Emission factors measured withthe latest method are presented in Table 3.7.
Emission Source Emission factor in (g/(h.source)) for measuredvalues in ppm v/v in the following three ranges
Emission range (ppm v/v) 0 - 1000 1001 - 10000 > 10000Valves for gas or vapour 0.14 1.65 45.1Valves for liquids with
Vp>0.3 kPa (light liquid)0.28 9.63 85.2
Valves for liquids with Vp<0.3 kPa (heavy liquid)
0.23 0.23 0.23
Pumps for light liquids 1.98 33.5 437Pumps for heavy liquids 3.80 92.6 389
Compressors 11.32 264 1608Safety valves for gases 11.4 279 1691
Flanges 0.02 8.75 37.5Open-end valves 0.13 8.76 12.0
Table 3.6: Emission factors according to stratified USAEPA-method for the assessment offugitive emissions
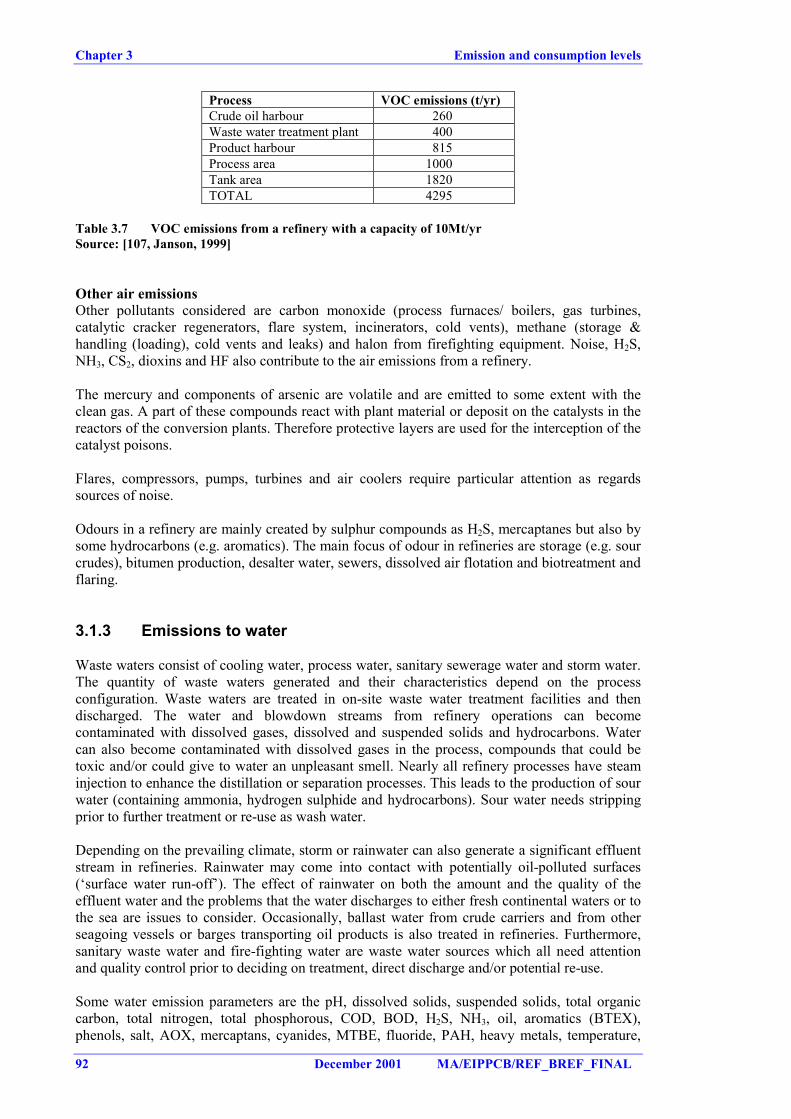
Chapter 3 Emission and consumption levels
92 December 2001 MA/EIPPCB/REF_BREF_FINAL
Process VOC emissions (t/yr)Crude oil harbour 260Waste water treatment plant 400Product harbour 815Process area 1000Tank area 1820TOTAL 4295
Table 3.7 VOC emissions from a refinery with a capacity of 10Mt/yrSource: [107, Janson, 1999]
Other air emissionsOther pollutants considered are carbon monoxide (process furnaces/ boilers, gas turbines,catalytic cracker regenerators, flare system, incinerators, cold vents), methane (storage &handling (loading), cold vents and leaks) and halon from firefighting equipment. Noise, H2S,NH3, CS2, dioxins and HF also contribute to the air emissions from a refinery.
The mercury and components of arsenic are volatile and are emitted to some extent with theclean gas. A part of these compounds react with plant material or deposit on the catalysts in thereactors of the conversion plants. Therefore protective layers are used for the interception of thecatalyst poisons.
Flares, compressors, pumps, turbines and air coolers require particular attention as regardssources of noise.
Odours in a refinery are mainly created by sulphur compounds as H2S, mercaptanes but also bysome hydrocarbons (e.g. aromatics). The main focus of odour in refineries are storage (e.g. sourcrudes), bitumen production, desalter water, sewers, dissolved air flotation and biotreatment andflaring.
3.1.3 Emissions to water
Waste waters consist of cooling water, process water, sanitary sewerage water and storm water.The quantity of waste waters generated and their characteristics depend on the processconfiguration. Waste waters are treated in on-site waste water treatment facilities and thendischarged. The water and blowdown streams from refinery operations can becomecontaminated with dissolved gases, dissolved and suspended solids and hydrocarbons. Watercan also become contaminated with dissolved gases in the process, compounds that could betoxic and/or could give to water an unpleasant smell. Nearly all refinery processes have steaminjection to enhance the distillation or separation processes. This leads to the production of sourwater (containing ammonia, hydrogen sulphide and hydrocarbons). Sour water needs strippingprior to further treatment or re-use as wash water.
Depending on the prevailing climate, storm or rainwater can also generate a significant effluentstream in refineries. Rainwater may come into contact with potentially oil-polluted surfaces(‘surface water run-off’). The effect of rainwater on both the amount and the quality of theeffluent water and the problems that the water discharges to either fresh continental waters or tothe sea are issues to consider. Occasionally, ballast water from crude carriers and from otherseagoing vessels or barges transporting oil products is also treated in refineries. Furthermore,sanitary waste water and fire-fighting water are waste water sources which all need attentionand quality control prior to deciding on treatment, direct discharge and/or potential re-use.
Some water emission parameters are the pH, dissolved solids, suspended solids, total organiccarbon, total nitrogen, total phosphorous, COD, BOD, H2S, NH3, oil, aromatics (BTEX),phenols, salt, AOX, mercaptans, cyanides, MTBE, fluoride, PAH, heavy metals, temperature,
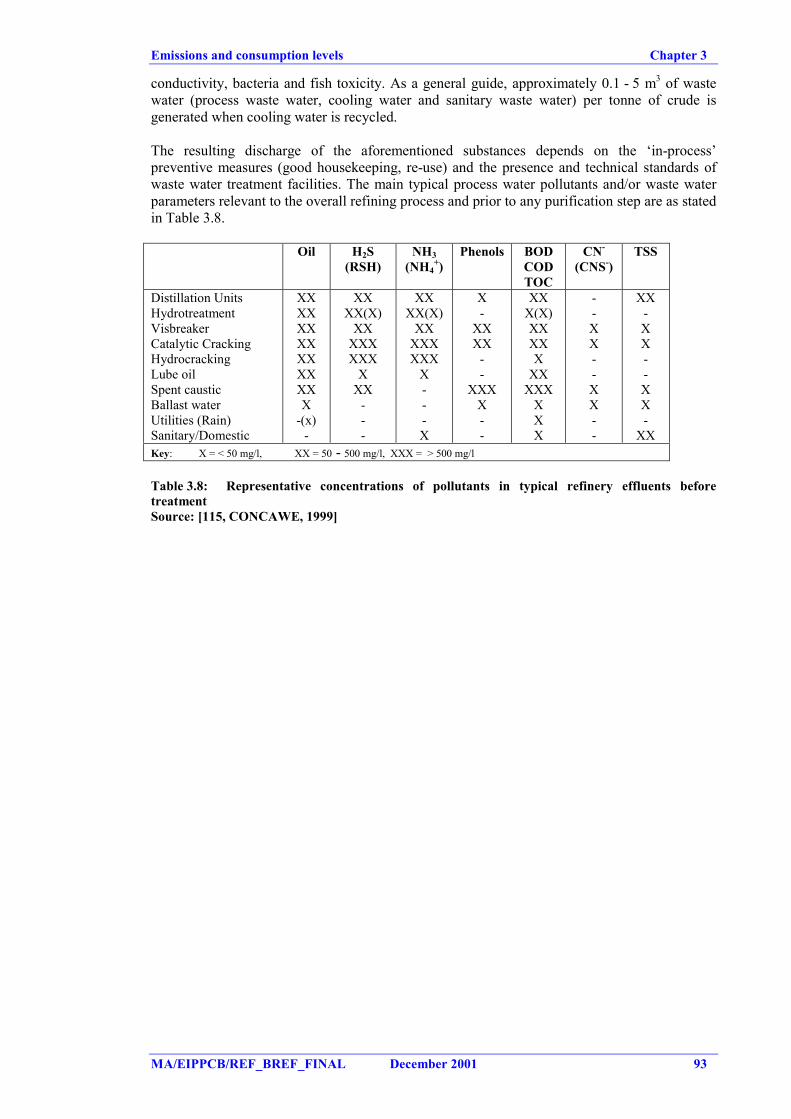
Emissions and consumption levels Chapter 3
MA/EIPPCB/REF_BREF_FINAL December 2001 93
conductivity, bacteria and fish toxicity. As a general guide, approximately 0.1 - 5 m3 of wastewater (process waste water, cooling water and sanitary waste water) per tonne of crude isgenerated when cooling water is recycled.
The resulting discharge of the aforementioned substances depends on the ‘in-process’preventive measures (good housekeeping, re-use) and the presence and technical standards ofwaste water treatment facilities. The main typical process water pollutants and/or waste waterparameters relevant to the overall refining process and prior to any purification step are as statedin Table 3.8.
Oil H2S(RSH)
NH3(NH4
+)Phenols BOD
CODTOC
CN-
(CNS-)TSS
Distillation UnitsHydrotreatmentVisbreakerCatalytic CrackingHydrocrackingLube oilSpent causticBallast waterUtilities (Rain)Sanitary/Domestic
XXXXXXXXXXXXXXX
-(x)-
XXXX(X)
XXXXXXXX
XXX
---
XXXX(X)
XXXXXXXX
X---X
X-
XXXX
--
XXXX--
XXX(X)XXXXX
XXXXX
XXX
--XX--XX--
XX-XX--XX-
XXKey: X = < 50 mg/l, XX = 50 - 500 mg/l, XXX = > 500 mg/l
Table 3.8: Representative concentrations of pollutants in typical refinery effluents beforetreatmentSource: [115, CONCAWE, 1999]
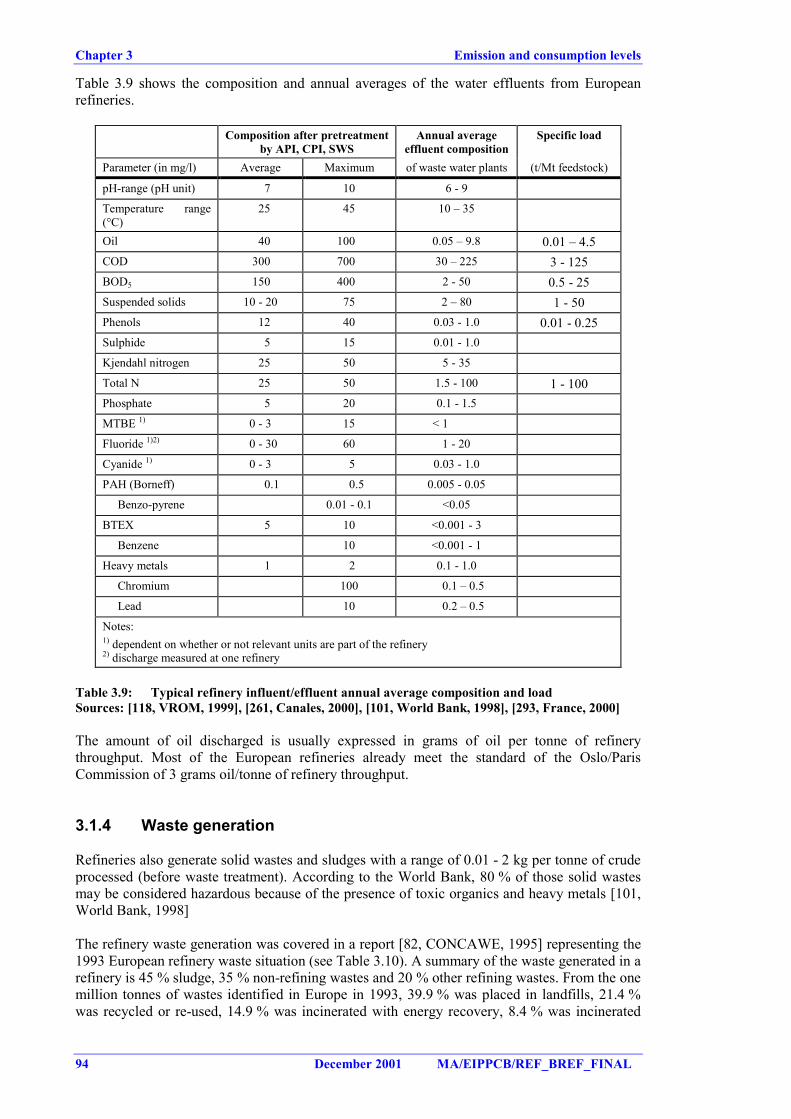
Chapter 3 Emission and consumption levels
94 December 2001 MA/EIPPCB/REF_BREF_FINAL
Table 3.9 shows the composition and annual averages of the water effluents from Europeanrefineries.
Composition after pretreatmentby API, CPI, SWS
Annual averageeffluent composition
Specific load
Parameter (in mg/l) Average Maximum of waste water plants (t/Mt feedstock)
pH-range (pH unit) 7 10 6 - 9
Temperature range(°C)
25 45 10 – 35
Oil 40 100 0.05 – 9.8 0.01 – 4.5COD 300 700 30 – 225 3 - 125BOD5 150 400 2 - 50 0.5 - 25Suspended solids 10 - 20 75 2 – 80 1 - 50Phenols 12 40 0.03 - 1.0 0.01 - 0.25Sulphide 5 15 0.01 - 1.0
Kjendahl nitrogen 25 50 5 - 35
Total N 25 50 1.5 - 100 1 - 100Phosphate 5 20 0.1 - 1.5
MTBE 1) 0 - 3 15 < 1
Fluoride 1)2) 0 - 30 60 1 - 20
Cyanide 1) 0 - 3 5 0.03 - 1.0
PAH (Borneff) 0.1 0.5 0.005 - 0.05
Benzo-pyrene 0.01 - 0.1 <0.05
BTEX 5 10 <0.001 - 3
Benzene 10 <0.001 - 1
Heavy metals 1 2 0.1 - 1.0
Chromium 100 0.1 – 0.5
Lead 10 0.2 – 0.5
Notes:1) dependent on whether or not relevant units are part of the refinery2) discharge measured at one refinery
Table 3.9: Typical refinery influent/effluent annual average composition and loadSources: [118, VROM, 1999], [261, Canales, 2000], [101, World Bank, 1998], [293, France, 2000]
The amount of oil discharged is usually expressed in grams of oil per tonne of refinerythroughput. Most of the European refineries already meet the standard of the Oslo/ParisCommission of 3 grams oil/tonne of refinery throughput.
3.1.4 Waste generation
Refineries also generate solid wastes and sludges with a range of 0.01 - 2 kg per tonne of crudeprocessed (before waste treatment). According to the World Bank, 80 % of those solid wastesmay be considered hazardous because of the presence of toxic organics and heavy metals [101,World Bank, 1998]
The refinery waste generation was covered in a report [82, CONCAWE, 1995] representing the1993 European refinery waste situation (see Table 3.10). A summary of the waste generated in arefinery is 45 % sludge, 35 % non-refining wastes and 20 % other refining wastes. From the onemillion tonnes of wastes identified in Europe in 1993, 39.9 % was placed in landfills, 21.4 %was recycled or re-used, 14.9 % was incinerated with energy recovery, 8.4 % was incinerated
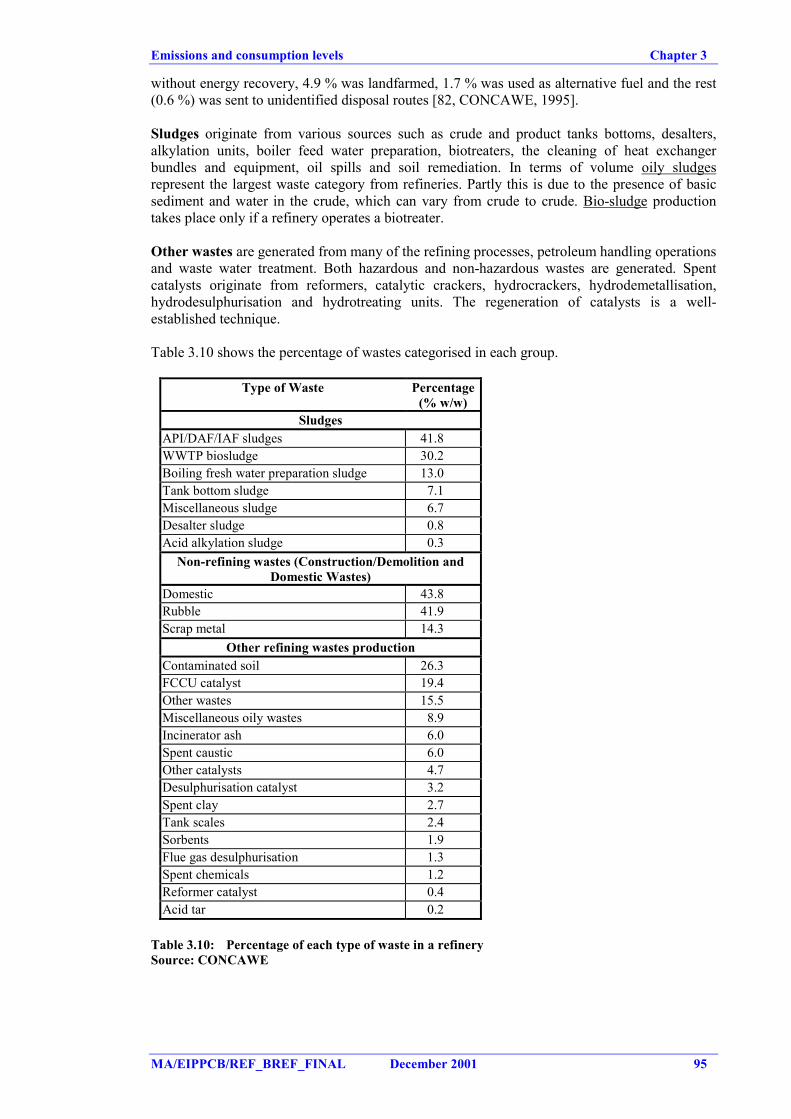
Emissions and consumption levels Chapter 3
MA/EIPPCB/REF_BREF_FINAL December 2001 95
without energy recovery, 4.9 % was landfarmed, 1.7 % was used as alternative fuel and the rest(0.6 %) was sent to unidentified disposal routes [82, CONCAWE, 1995].
Sludges originate from various sources such as crude and product tanks bottoms, desalters,alkylation units, boiler feed water preparation, biotreaters, the cleaning of heat exchangerbundles and equipment, oil spills and soil remediation. In terms of volume oily sludgesrepresent the largest waste category from refineries. Partly this is due to the presence of basicsediment and water in the crude, which can vary from crude to crude. Bio-sludge productiontakes place only if a refinery operates a biotreater.
Other wastes are generated from many of the refining processes, petroleum handling operationsand waste water treatment. Both hazardous and non-hazardous wastes are generated. Spentcatalysts originate from reformers, catalytic crackers, hydrocrackers, hydrodemetallisation,hydrodesulphurisation and hydrotreating units. The regeneration of catalysts is a well-established technique.
Table 3.10 shows the percentage of wastes categorised in each group.
Type of Waste Percentage(% w/w)
SludgesAPI/DAF/IAF sludges 41.8WWTP biosludge 30.2Boiling fresh water preparation sludge 13.0Tank bottom sludge 7.1Miscellaneous sludge 6.7Desalter sludge 0.8Acid alkylation sludge 0.3
Non-refining wastes (Construction/Demolition andDomestic Wastes)
Domestic 43.8Rubble 41.9Scrap metal 14.3
Other refining wastes productionContaminated soil 26.3FCCU catalyst 19.4Other wastes 15.5Miscellaneous oily wastes 8.9Incinerator ash 6.0Spent caustic 6.0Other catalysts 4.7Desulphurisation catalyst 3.2Spent clay 2.7Tank scales 2.4Sorbents 1.9Flue gas desulphurisation 1.3Spent chemicals 1.2Reformer catalyst 0.4Acid tar 0.2
Table 3.10: Percentage of each type of waste in a refinerySource: CONCAWE
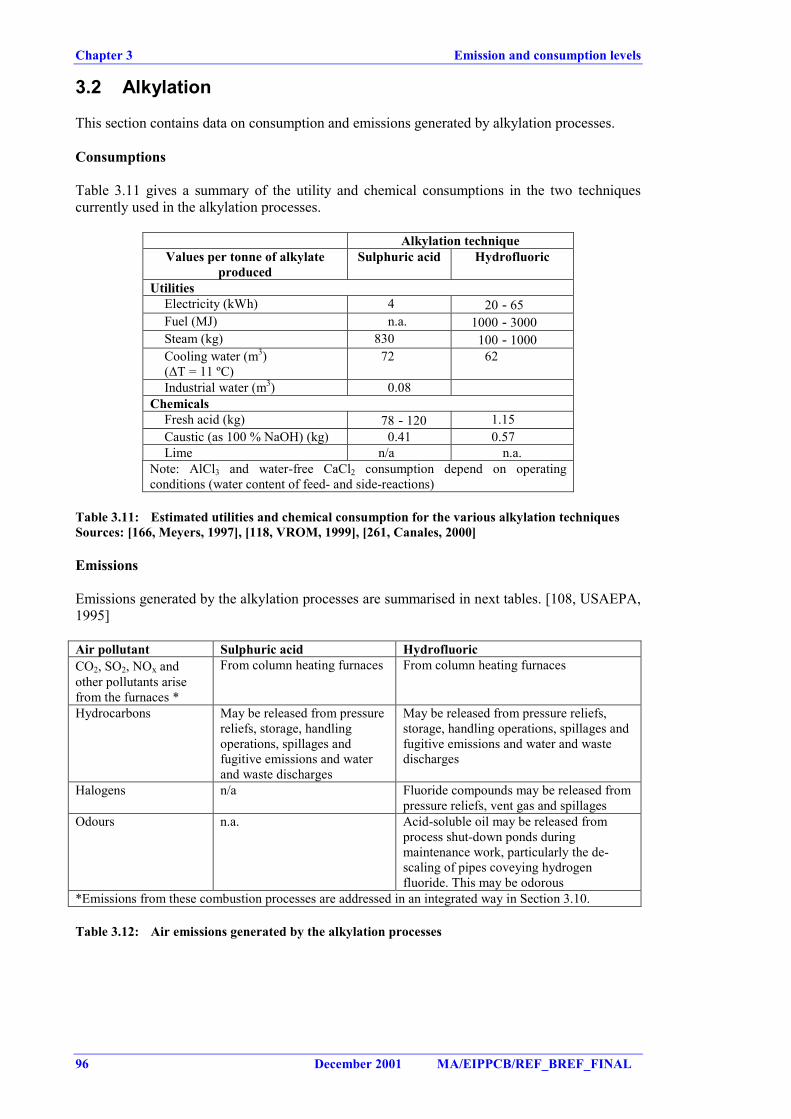
Chapter 3 Emission and consumption levels
96 December 2001 MA/EIPPCB/REF_BREF_FINAL
3.2 Alkylation
This section contains data on consumption and emissions generated by alkylation processes.
Consumptions
Table 3.11 gives a summary of the utility and chemical consumptions in the two techniquescurrently used in the alkylation processes.
Alkylation techniqueValues per tonne of alkylate
producedSulphuric acid Hydrofluoric
UtilitiesElectricity (kWh) 4 20 - 65Fuel (MJ) n.a. 1000 - 3000Steam (kg) 830 100 - 1000Cooling water (m3)(∆T = 11 ºC)
72 62
Industrial water (m3) 0.08Chemicals
Fresh acid (kg) 78 - 120 1.15Caustic (as 100 % NaOH) (kg) 0.41 0.57Lime n/a n.a.
Note: AlCl3 and water-free CaCl2 consumption depend on operatingconditions (water content of feed- and side-reactions)
Table 3.11: Estimated utilities and chemical consumption for the various alkylation techniquesSources: [166, Meyers, 1997], [118, VROM, 1999], [261, Canales, 2000]
Emissions
Emissions generated by the alkylation processes are summarised in next tables. [108, USAEPA,1995]
Air pollutant Sulphuric acid HydrofluoricCO2, SO2, NOx andother pollutants arisefrom the furnaces *
From column heating furnaces From column heating furnaces
Hydrocarbons May be released from pressurereliefs, storage, handlingoperations, spillages andfugitive emissions and waterand waste discharges
May be released from pressure reliefs,storage, handling operations, spillages andfugitive emissions and water and wastedischarges
Halogens n/a Fluoride compounds may be released frompressure reliefs, vent gas and spillages
Odours n.a. Acid-soluble oil may be released fromprocess shut-down ponds duringmaintenance work, particularly the de-scaling of pipes coveying hydrogenfluoride. This may be odorous
*Emissions from these combustion processes are addressed in an integrated way in Section 3.10.
Table 3.12: Air emissions generated by the alkylation processes
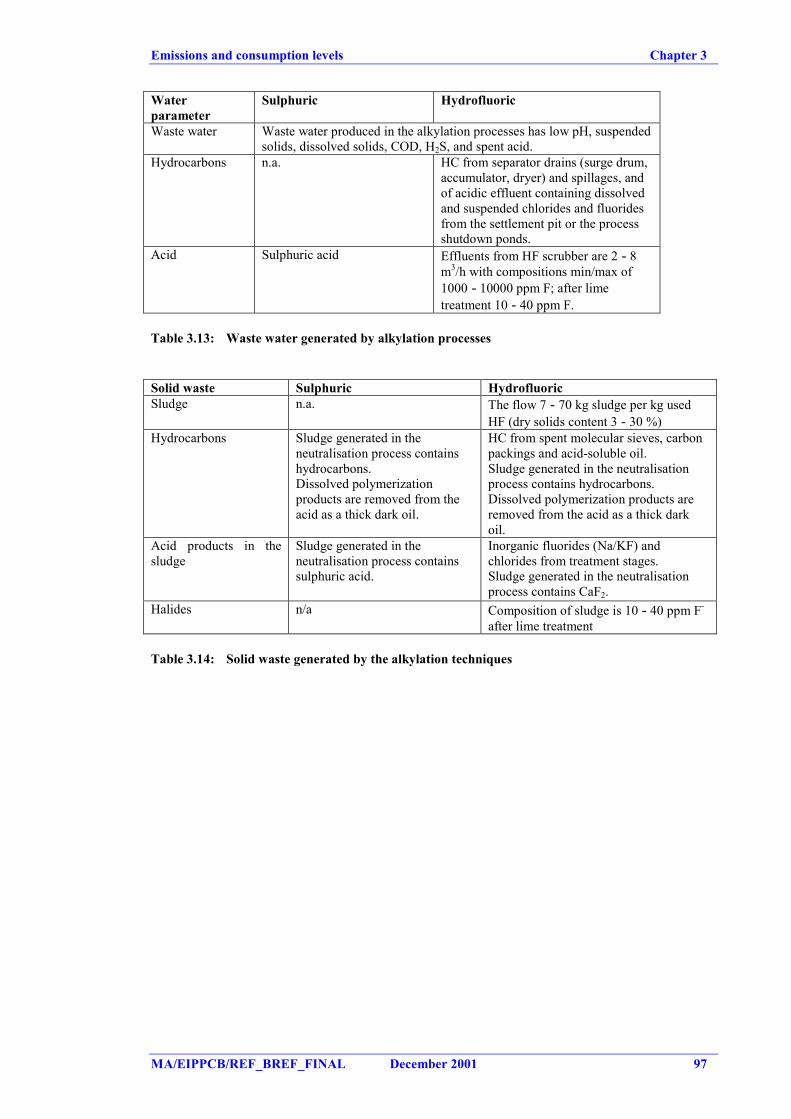
Emissions and consumption levels Chapter 3
MA/EIPPCB/REF_BREF_FINAL December 2001 97
Waterparameter
Sulphuric Hydrofluoric
Waste water Waste water produced in the alkylation processes has low pH, suspendedsolids, dissolved solids, COD, H2S, and spent acid.
Hydrocarbons n.a. HC from separator drains (surge drum,accumulator, dryer) and spillages, andof acidic effluent containing dissolvedand suspended chlorides and fluoridesfrom the settlement pit or the processshutdown ponds.
Acid Sulphuric acid Effluents from HF scrubber are 2 - 8m3/h with compositions min/max of1000 - 10000 ppm F; after limetreatment 10 - 40 ppm F.
Table 3.13: Waste water generated by alkylation processes
Solid waste Sulphuric HydrofluoricSludge n.a. The flow 7 - 70 kg sludge per kg used
HF (dry solids content 3 - 30 %)Hydrocarbons Sludge generated in the
neutralisation process containshydrocarbons.Dissolved polymerizationproducts are removed from theacid as a thick dark oil.
HC from spent molecular sieves, carbonpackings and acid-soluble oil.Sludge generated in the neutralisationprocess contains hydrocarbons.Dissolved polymerization products areremoved from the acid as a thick darkoil.
Acid products in thesludge
Sludge generated in theneutralisation process containssulphuric acid.
Inorganic fluorides (Na/KF) andchlorides from treatment stages.Sludge generated in the neutralisationprocess contains CaF2.
Halides n/a Composition of sludge is 10 - 40 ppm F-
after lime treatment
Table 3.14: Solid waste generated by the alkylation techniques
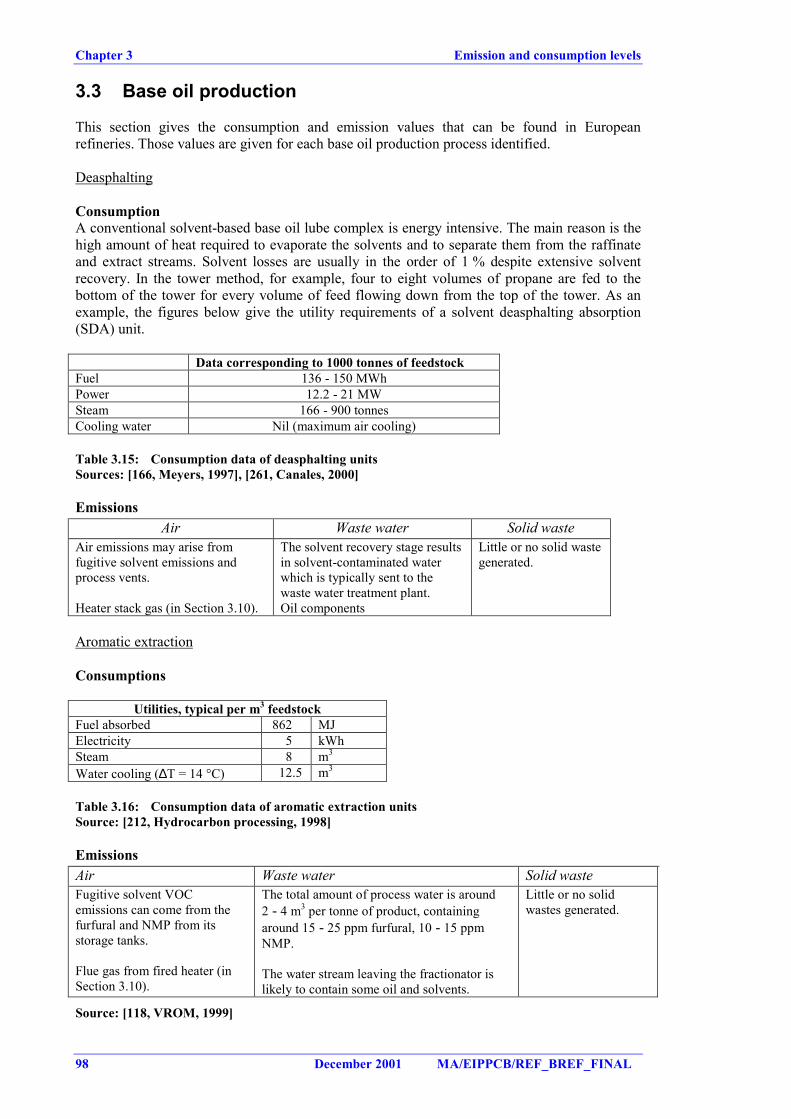
Chapter 3 Emission and consumption levels
98 December 2001 MA/EIPPCB/REF_BREF_FINAL
3.3 Base oil production
This section gives the consumption and emission values that can be found in Europeanrefineries. Those values are given for each base oil production process identified.
Deasphalting
ConsumptionA conventional solvent-based base oil lube complex is energy intensive. The main reason is thehigh amount of heat required to evaporate the solvents and to separate them from the raffinateand extract streams. Solvent losses are usually in the order of 1 % despite extensive solventrecovery. In the tower method, for example, four to eight volumes of propane are fed to thebottom of the tower for every volume of feed flowing down from the top of the tower. As anexample, the figures below give the utility requirements of a solvent deasphalting absorption(SDA) unit.
Data corresponding to 1000 tonnes of feedstockFuel 136 - 150 MWhPower 12.2 - 21 MWSteam 166 - 900 tonnesCooling water Nil (maximum air cooling)
Table 3.15: Consumption data of deasphalting unitsSources: [166, Meyers, 1997], [261, Canales, 2000]
EmissionsAir Waste water Solid waste
Air emissions may arise fromfugitive solvent emissions andprocess vents.
Heater stack gas (in Section 3.10).
The solvent recovery stage resultsin solvent-contaminated waterwhich is typically sent to thewaste water treatment plant.Oil components
Little or no solid wastegenerated.
Aromatic extraction
Consumptions
Utilities, typical per m3 feedstockFuel absorbed 862 MJElectricity 5 kWhSteam 8 m3
Water cooling (∆T = 14 °C) 12.5 m3
Table 3.16: Consumption data of aromatic extraction unitsSource: [212, Hydrocarbon processing, 1998]
EmissionsAir Waste water Solid wasteFugitive solvent VOCemissions can come from thefurfural and NMP from itsstorage tanks.
Flue gas from fired heater (inSection 3.10).
The total amount of process water is around2 - 4 m3 per tonne of product, containingaround 15 - 25 ppm furfural, 10 - 15 ppmNMP.
The water stream leaving the fractionator islikely to contain some oil and solvents.
Little or no solidwastes generated.
Source: [118, VROM, 1999]
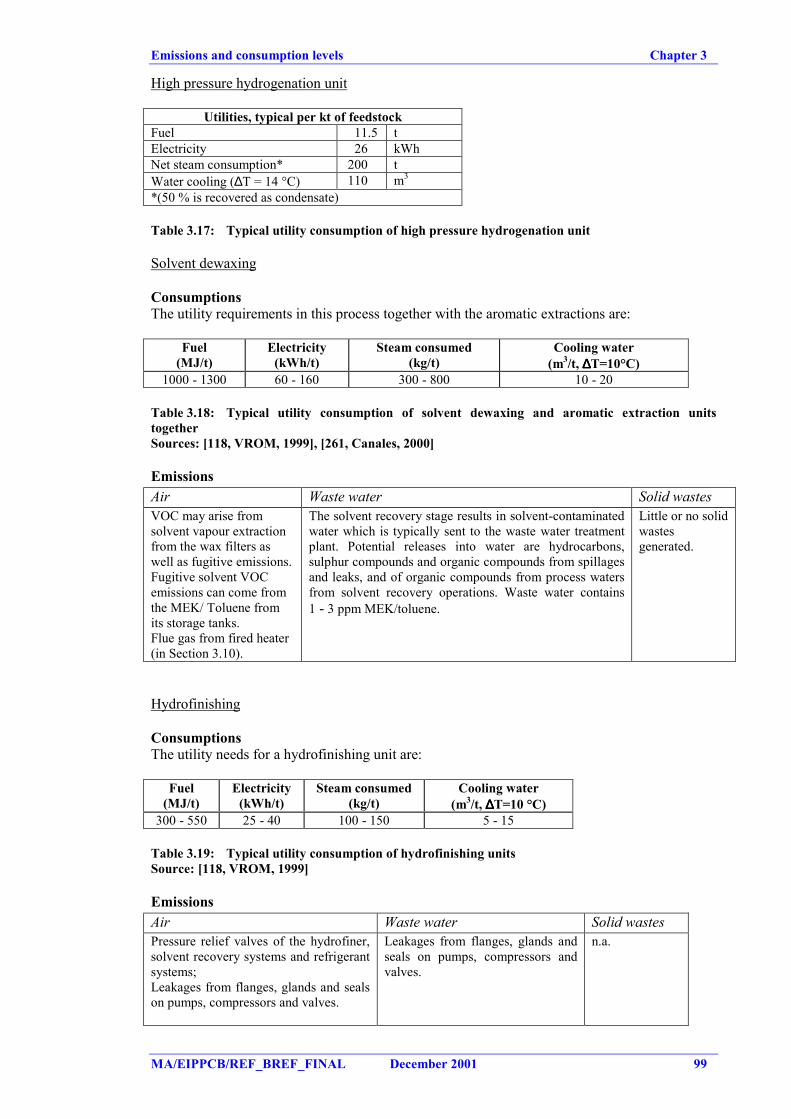
Emissions and consumption levels Chapter 3
MA/EIPPCB/REF_BREF_FINAL December 2001 99
High pressure hydrogenation unit
Utilities, typical per kt of feedstockFuel 11.5 tElectricity 26 kWhNet steam consumption* 200 tWater cooling (∆T = 14 °C) 110 m3
*(50 % is recovered as condensate)
Table 3.17: Typical utility consumption of high pressure hydrogenation unit
Solvent dewaxing
ConsumptionsThe utility requirements in this process together with the aromatic extractions are:
Fuel(MJ/t)
Electricity(kWh/t)
Steam consumed(kg/t)
Cooling water(m3/t, ∆∆∆∆T=10°C)
1000 - 1300 60 - 160 300 - 800 10 - 20
Table 3.18: Typical utility consumption of solvent dewaxing and aromatic extraction unitstogetherSources: [118, VROM, 1999], [261, Canales, 2000]
EmissionsAir Waste water Solid wastesVOC may arise fromsolvent vapour extractionfrom the wax filters aswell as fugitive emissions.Fugitive solvent VOCemissions can come fromthe MEK/ Toluene fromits storage tanks.Flue gas from fired heater(in Section 3.10).
The solvent recovery stage results in solvent-contaminatedwater which is typically sent to the waste water treatmentplant. Potential releases into water are hydrocarbons,sulphur compounds and organic compounds from spillagesand leaks, and of organic compounds from process watersfrom solvent recovery operations. Waste water contains1 - 3 ppm MEK/toluene.
Little or no solidwastesgenerated.
Hydrofinishing
ConsumptionsThe utility needs for a hydrofinishing unit are:
Fuel(MJ/t)
Electricity(kWh/t)
Steam consumed(kg/t)
Cooling water(m3/t, ∆∆∆∆T=10 °C)
300 - 550 25 - 40 100 - 150 5 - 15
Table 3.19: Typical utility consumption of hydrofinishing unitsSource: [118, VROM, 1999]
EmissionsAir Waste water Solid wastesPressure relief valves of the hydrofiner,solvent recovery systems and refrigerantsystems;Leakages from flanges, glands and sealson pumps, compressors and valves.
Leakages from flanges, glands andseals on pumps, compressors andvalves.
n.a.
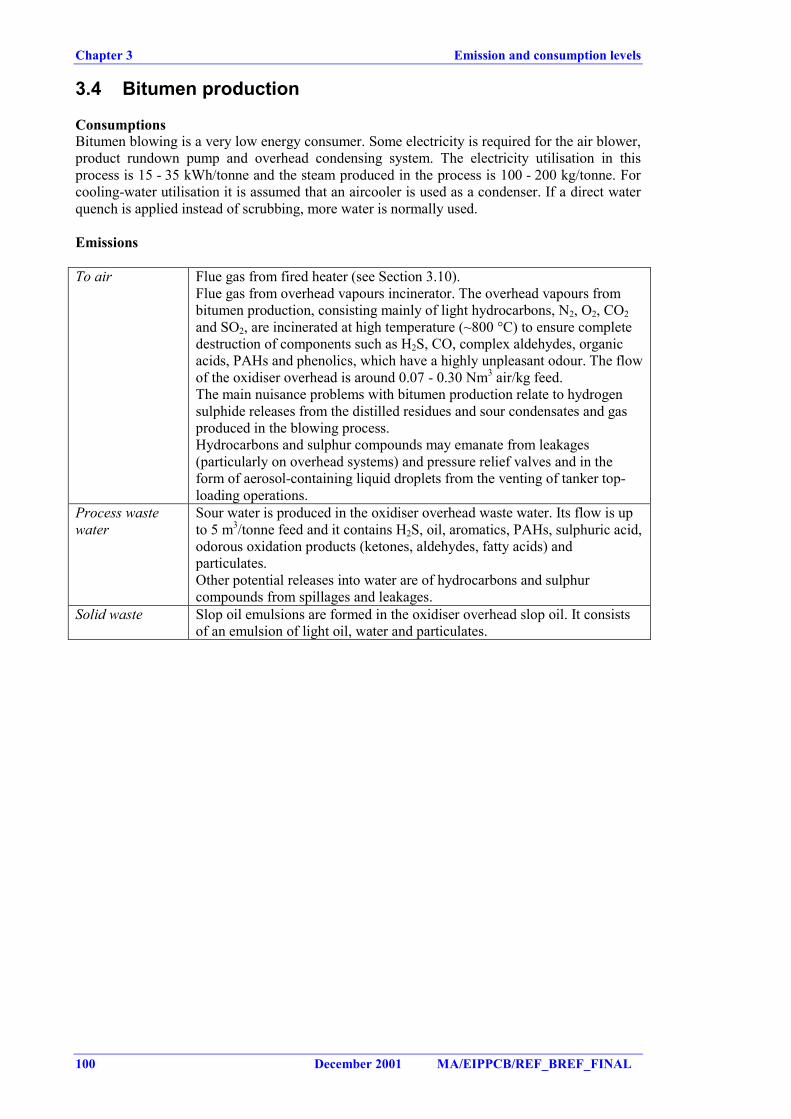
Chapter 3 Emission and consumption levels
100 December 2001 MA/EIPPCB/REF_BREF_FINAL
3.4 Bitumen production
ConsumptionsBitumen blowing is a very low energy consumer. Some electricity is required for the air blower,product rundown pump and overhead condensing system. The electricity utilisation in thisprocess is 15 - 35 kWh/tonne and the steam produced in the process is 100 - 200 kg/tonne. Forcooling-water utilisation it is assumed that an aircooler is used as a condenser. If a direct waterquench is applied instead of scrubbing, more water is normally used.
Emissions
To air Flue gas from fired heater (see Section 3.10).Flue gas from overhead vapours incinerator. The overhead vapours frombitumen production, consisting mainly of light hydrocarbons, N2, O2, CO2and SO2, are incinerated at high temperature (~800 °C) to ensure completedestruction of components such as H2S, CO, complex aldehydes, organicacids, PAHs and phenolics, which have a highly unpleasant odour. The flowof the oxidiser overhead is around 0.07 - 0.30 Nm3 air/kg feed.The main nuisance problems with bitumen production relate to hydrogensulphide releases from the distilled residues and sour condensates and gasproduced in the blowing process.Hydrocarbons and sulphur compounds may emanate from leakages(particularly on overhead systems) and pressure relief valves and in theform of aerosol-containing liquid droplets from the venting of tanker top-loading operations.
Process wastewater
Sour water is produced in the oxidiser overhead waste water. Its flow is upto 5 m3/tonne feed and it contains H2S, oil, aromatics, PAHs, sulphuric acid,odorous oxidation products (ketones, aldehydes, fatty acids) andparticulates.Other potential releases into water are of hydrocarbons and sulphurcompounds from spillages and leakages.
Solid waste Slop oil emulsions are formed in the oxidiser overhead slop oil. It consistsof an emulsion of light oil, water and particulates.
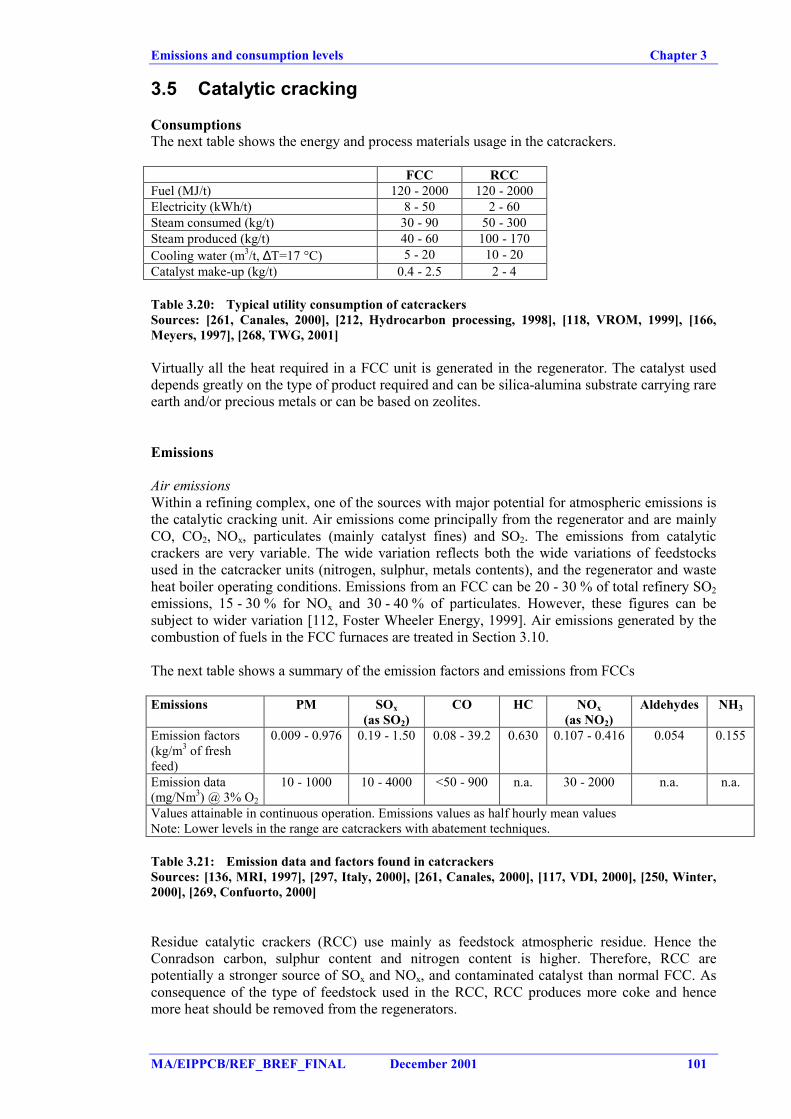
Emissions and consumption levels Chapter 3
MA/EIPPCB/REF_BREF_FINAL December 2001 101
3.5 Catalytic cracking
ConsumptionsThe next table shows the energy and process materials usage in the catcrackers.
FCC RCCFuel (MJ/t) 120 - 2000 120 - 2000Electricity (kWh/t) 8 - 50 2 - 60Steam consumed (kg/t) 30 - 90 50 - 300Steam produced (kg/t) 40 - 60 100 - 170Cooling water (m3/t, ∆T=17 °C) 5 - 20 10 - 20Catalyst make-up (kg/t) 0.4 - 2.5 2 - 4
Table 3.20: Typical utility consumption of catcrackersSources: [261, Canales, 2000], [212, Hydrocarbon processing, 1998], [118, VROM, 1999], [166,Meyers, 1997], [268, TWG, 2001]
Virtually all the heat required in a FCC unit is generated in the regenerator. The catalyst useddepends greatly on the type of product required and can be silica-alumina substrate carrying rareearth and/or precious metals or can be based on zeolites.
Emissions
Air emissionsWithin a refining complex, one of the sources with major potential for atmospheric emissions isthe catalytic cracking unit. Air emissions come principally from the regenerator and are mainlyCO, CO2, NOx, particulates (mainly catalyst fines) and SO2. The emissions from catalyticcrackers are very variable. The wide variation reflects both the wide variations of feedstocksused in the catcracker units (nitrogen, sulphur, metals contents), and the regenerator and wasteheat boiler operating conditions. Emissions from an FCC can be 20 - 30 % of total refinery SO2emissions, 15 - 30 % for NOx and 30 - 40 % of particulates. However, these figures can besubject to wider variation [112, Foster Wheeler Energy, 1999]. Air emissions generated by thecombustion of fuels in the FCC furnaces are treated in Section 3.10.
The next table shows a summary of the emission factors and emissions from FCCs
Emissions PM SOx(as SO2)
CO HC NOx(as NO2)
Aldehydes NH3
Emission factors(kg/m3 of freshfeed)
0.009 - 0.976 0.19 - 1.50 0.08 - 39.2 0.630 0.107 - 0.416 0.054 0.155
Emission data(mg/Nm3) @ 3% O2
10 - 1000 10 - 4000 <50 - 900 n.a. 30 - 2000 n.a. n.a.
Values attainable in continuous operation. Emissions values as half hourly mean valuesNote: Lower levels in the range are catcrackers with abatement techniques.
Table 3.21: Emission data and factors found in catcrackersSources: [136, MRI, 1997], [297, Italy, 2000], [261, Canales, 2000], [117, VDI, 2000], [250, Winter,2000], [269, Confuorto, 2000]
Residue catalytic crackers (RCC) use mainly as feedstock atmospheric residue. Hence theConradson carbon, sulphur content and nitrogen content is higher. Therefore, RCC arepotentially a stronger source of SOx and NOx, and contaminated catalyst than normal FCC. Asconsequence of the type of feedstock used in the RCC, RCC produces more coke and hencemore heat should be removed from the regenerators.
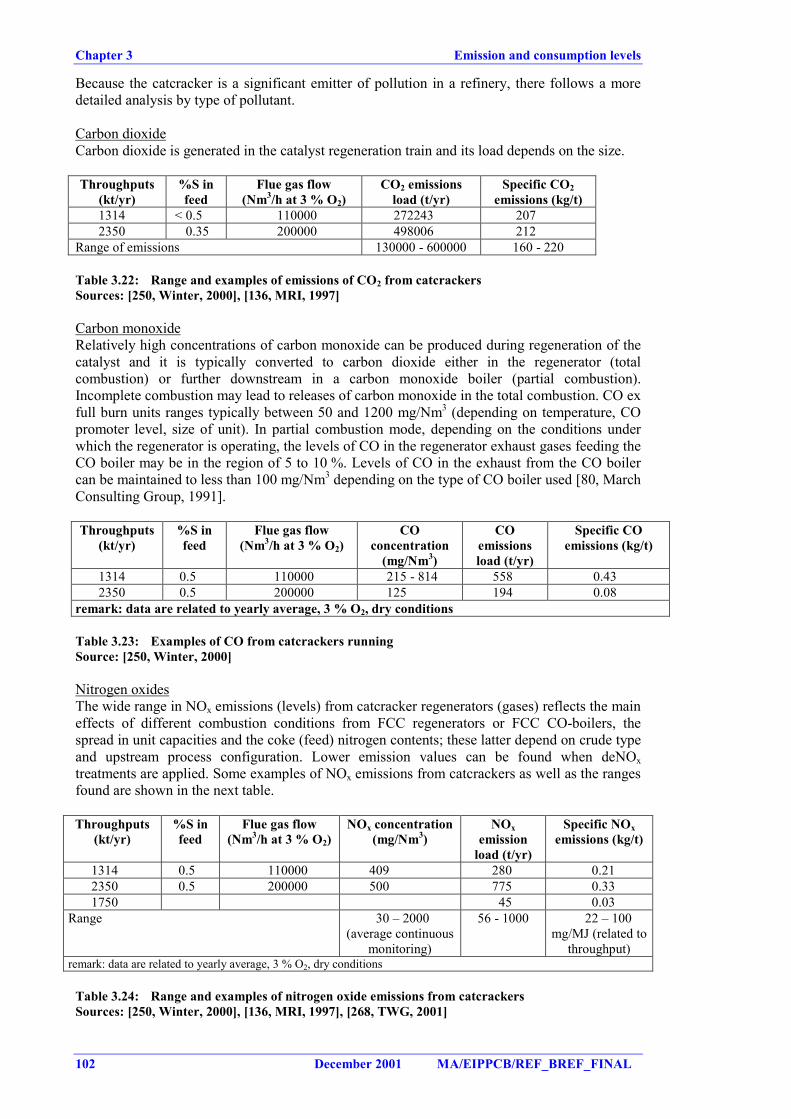
Chapter 3 Emission and consumption levels
102 December 2001 MA/EIPPCB/REF_BREF_FINAL
Because the catcracker is a significant emitter of pollution in a refinery, there follows a moredetailed analysis by type of pollutant.
Carbon dioxideCarbon dioxide is generated in the catalyst regeneration train and its load depends on the size.
Throughputs(kt/yr)
%S infeed
Flue gas flow(Nm3/h at 3 % O2)
CO2 emissionsload (t/yr)
Specific CO2emissions (kg/t)
1314 < 0.5 110000 272243 2072350 0.35 200000 498006 212
Range of emissions 130000 - 600000 160 - 220
Table 3.22: Range and examples of emissions of CO2 from catcrackersSources: [250, Winter, 2000], [136, MRI, 1997]
Carbon monoxideRelatively high concentrations of carbon monoxide can be produced during regeneration of thecatalyst and it is typically converted to carbon dioxide either in the regenerator (totalcombustion) or further downstream in a carbon monoxide boiler (partial combustion).Incomplete combustion may lead to releases of carbon monoxide in the total combustion. CO exfull burn units ranges typically between 50 and 1200 mg/Nm3 (depending on temperature, COpromoter level, size of unit). In partial combustion mode, depending on the conditions underwhich the regenerator is operating, the levels of CO in the regenerator exhaust gases feeding theCO boiler may be in the region of 5 to 10 %. Levels of CO in the exhaust from the CO boilercan be maintained to less than 100 mg/Nm3 depending on the type of CO boiler used [80, MarchConsulting Group, 1991].
Throughputs(kt/yr)
%S infeed
Flue gas flow(Nm3/h at 3 % O2)
COconcentration
(mg/Nm3)
COemissionsload (t/yr)
Specific COemissions (kg/t)
1314 0.5 110000 215 - 814 558 0.432350 0.5 200000 125 194 0.08
remark: data are related to yearly average, 3 % O2, dry conditions
Table 3.23: Examples of CO from catcrackers runningSource: [250, Winter, 2000]
Nitrogen oxidesThe wide range in NOx emissions (levels) from catcracker regenerators (gases) reflects the maineffects of different combustion conditions from FCC regenerators or FCC CO-boilers, thespread in unit capacities and the coke (feed) nitrogen contents; these latter depend on crude typeand upstream process configuration. Lower emission values can be found when deNOxtreatments are applied. Some examples of NOx emissions from catcrackers as well as the rangesfound are shown in the next table.
Throughputs(kt/yr)
%S infeed
Flue gas flow(Nm3/h at 3 % O2)
NOx concentration(mg/Nm3)
NOxemission
load (t/yr)
Specific NOxemissions (kg/t)
1314 0.5 110000 409 280 0.212350 0.5 200000 500 775 0.331750 45 0.03
Range 30 – 2000(average continuous
monitoring)
56 - 1000 22 – 100mg/MJ (related to
throughput)remark: data are related to yearly average, 3 % O2, dry conditions
Table 3.24: Range and examples of nitrogen oxide emissions from catcrackersSources: [250, Winter, 2000], [136, MRI, 1997], [268, TWG, 2001]
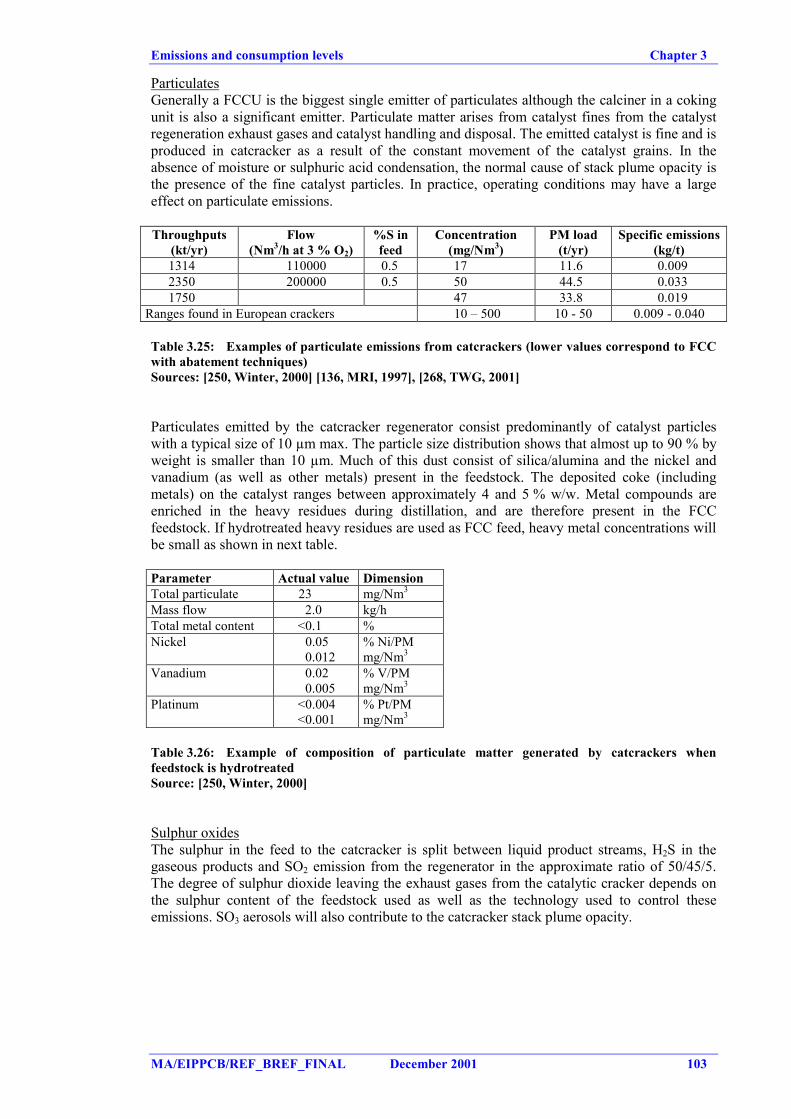
Emissions and consumption levels Chapter 3
MA/EIPPCB/REF_BREF_FINAL December 2001 103
ParticulatesGenerally a FCCU is the biggest single emitter of particulates although the calciner in a cokingunit is also a significant emitter. Particulate matter arises from catalyst fines from the catalystregeneration exhaust gases and catalyst handling and disposal. The emitted catalyst is fine and isproduced in catcracker as a result of the constant movement of the catalyst grains. In theabsence of moisture or sulphuric acid condensation, the normal cause of stack plume opacity isthe presence of the fine catalyst particles. In practice, operating conditions may have a largeeffect on particulate emissions.
Throughputs(kt/yr)
Flow(Nm3/h at 3 % O2)
%S infeed
Concentration(mg/Nm3)
PM load(t/yr)
Specific emissions(kg/t)
1314 110000 0.5 17 11.6 0.0092350 200000 0.5 50 44.5 0.0331750 47 33.8 0.019
Ranges found in European crackers 10 – 500 10 - 50 0.009 - 0.040
Table 3.25: Examples of particulate emissions from catcrackers (lower values correspond to FCCwith abatement techniques)Sources: [250, Winter, 2000] [136, MRI, 1997], [268, TWG, 2001]
Particulates emitted by the catcracker regenerator consist predominantly of catalyst particleswith a typical size of 10 µm max. The particle size distribution shows that almost up to 90 % byweight is smaller than 10 µm. Much of this dust consist of silica/alumina and the nickel andvanadium (as well as other metals) present in the feedstock. The deposited coke (includingmetals) on the catalyst ranges between approximately 4 and 5 % w/w. Metal compounds areenriched in the heavy residues during distillation, and are therefore present in the FCCfeedstock. If hydrotreated heavy residues are used as FCC feed, heavy metal concentrations willbe small as shown in next table.
Parameter Actual value DimensionTotal particulate 23 mg/Nm3
Mass flow 2.0 kg/hTotal metal content <0.1 %Nickel 0.05
0.012% Ni/PMmg/Nm3
Vanadium 0.020.005
% V/PMmg/Nm3
Platinum <0.004<0.001
% Pt/PMmg/Nm3
Table 3.26: Example of composition of particulate matter generated by catcrackers whenfeedstock is hydrotreatedSource: [250, Winter, 2000]
Sulphur oxidesThe sulphur in the feed to the catcracker is split between liquid product streams, H2S in thegaseous products and SO2 emission from the regenerator in the approximate ratio of 50/45/5.The degree of sulphur dioxide leaving the exhaust gases from the catalytic cracker depends onthe sulphur content of the feedstock used as well as the technology used to control theseemissions. SO3 aerosols will also contribute to the catcracker stack plume opacity.
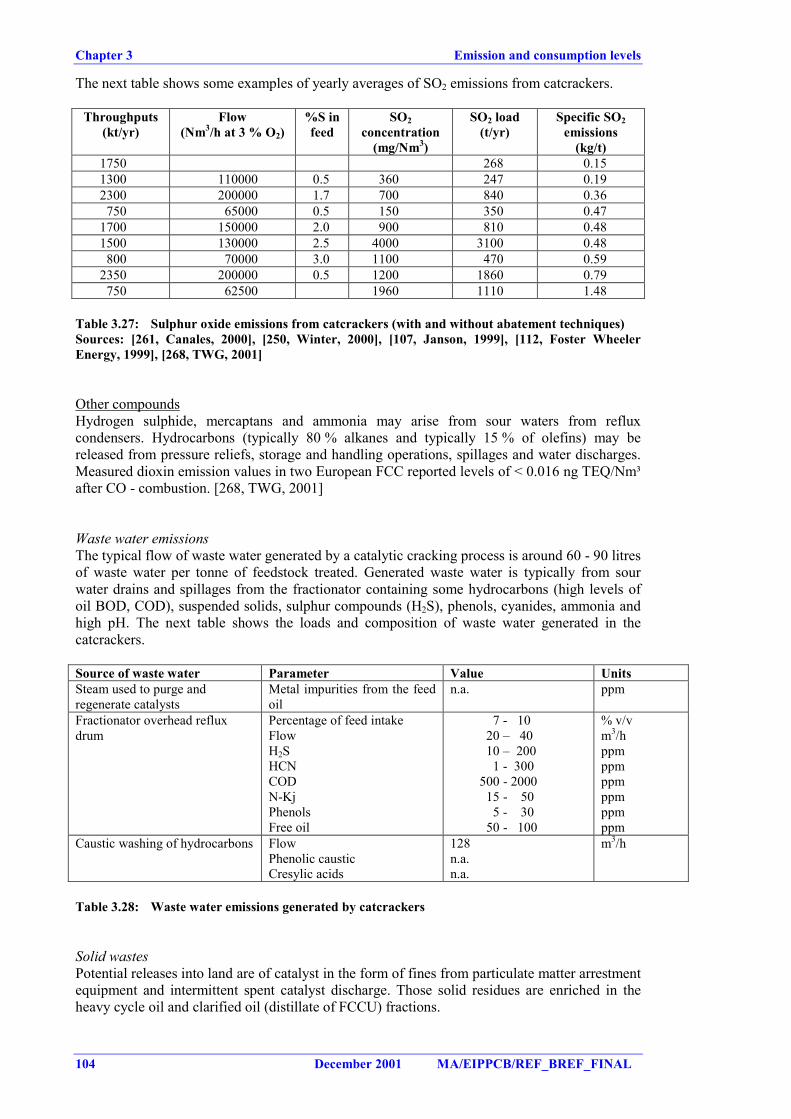
Chapter 3 Emission and consumption levels
104 December 2001 MA/EIPPCB/REF_BREF_FINAL
The next table shows some examples of yearly averages of SO2 emissions from catcrackers.
Throughputs(kt/yr)
Flow(Nm3/h at 3 % O2)
%S infeed
SO2concentration
(mg/Nm3)
SO2 load(t/yr)
Specific SO2emissions
(kg/t)1750 268 0.151300 110000 0.5 360 247 0.192300 200000 1.7 700 840 0.36
750 65000 0.5 150 350 0.471700 150000 2.0 900 810 0.481500 130000 2.5 4000 3100 0.48
800 70000 3.0 1100 470 0.592350 200000 0.5 1200 1860 0.79
750 62500 1960 1110 1.48
Table 3.27: Sulphur oxide emissions from catcrackers (with and without abatement techniques)Sources: [261, Canales, 2000], [250, Winter, 2000], [107, Janson, 1999], [112, Foster WheelerEnergy, 1999], [268, TWG, 2001]
Other compoundsHydrogen sulphide, mercaptans and ammonia may arise from sour waters from refluxcondensers. Hydrocarbons (typically 80 % alkanes and typically 15 % of olefins) may bereleased from pressure reliefs, storage and handling operations, spillages and water discharges.Measured dioxin emission values in two European FCC reported levels of < 0.016 ng TEQ/Nm³after CO - combustion. [268, TWG, 2001]
Waste water emissionsThe typical flow of waste water generated by a catalytic cracking process is around 60 - 90 litresof waste water per tonne of feedstock treated. Generated waste water is typically from sourwater drains and spillages from the fractionator containing some hydrocarbons (high levels ofoil BOD, COD), suspended solids, sulphur compounds (H2S), phenols, cyanides, ammonia andhigh pH. The next table shows the loads and composition of waste water generated in thecatcrackers.
Source of waste water Parameter Value UnitsSteam used to purge andregenerate catalysts
Metal impurities from the feedoil
n.a. ppm
Fractionator overhead refluxdrum
Percentage of feed intakeFlowH2SHCNCODN-KjPhenolsFree oil
7 - 1020 – 4010 – 200
1 - 300500 - 2000
15 - 505 - 30
50 - 100
% v/vm3/hppmppmppmppmppmppm
Caustic washing of hydrocarbons FlowPhenolic causticCresylic acids
128n.a.n.a.
m3/h
Table 3.28: Waste water emissions generated by catcrackers
Solid wastesPotential releases into land are of catalyst in the form of fines from particulate matter arrestmentequipment and intermittent spent catalyst discharge. Those solid residues are enriched in theheavy cycle oil and clarified oil (distillate of FCCU) fractions.
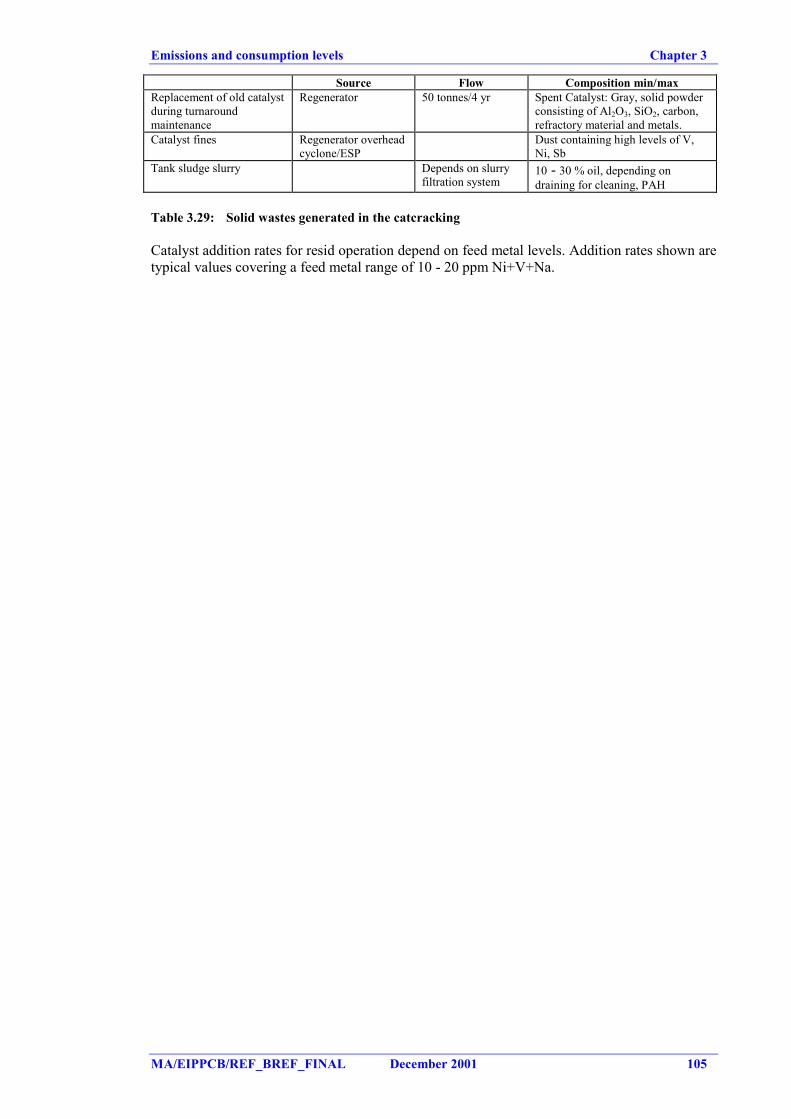
Emissions and consumption levels Chapter 3
MA/EIPPCB/REF_BREF_FINAL December 2001 105
Source Flow Composition min/maxReplacement of old catalystduring turnaroundmaintenance
Regenerator 50 tonnes/4 yr Spent Catalyst: Gray, solid powderconsisting of Al2O3, SiO2, carbon,refractory material and metals.
Catalyst fines Regenerator overheadcyclone/ESP
Dust containing high levels of V,Ni, Sb
Tank sludge slurry Depends on slurryfiltration system
10 - 30 % oil, depending ondraining for cleaning, PAH
Table 3.29: Solid wastes generated in the catcracking
Catalyst addition rates for resid operation depend on feed metal levels. Addition rates shown aretypical values covering a feed metal range of 10 - 20 ppm Ni+V+Na.
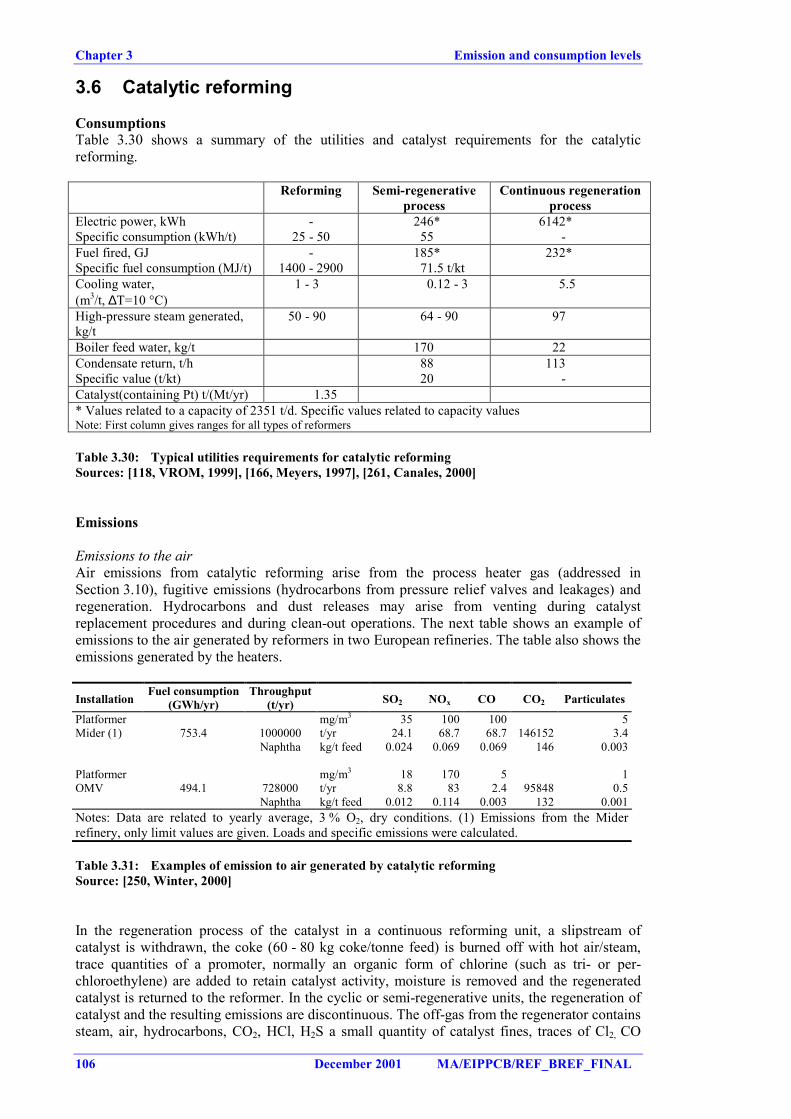
Chapter 3 Emission and consumption levels
106 December 2001 MA/EIPPCB/REF_BREF_FINAL
3.6 Catalytic reforming
ConsumptionsTable 3.30 shows a summary of the utilities and catalyst requirements for the catalyticreforming.
Reforming Semi-regenerativeprocess
Continuous regenerationprocess
Electric power, kWhSpecific consumption (kWh/t)
-25 - 50
246*55
6142*-
Fuel fired, GJSpecific fuel consumption (MJ/t)
-1400 - 2900
185*71.5 t/kt
232*
Cooling water,(m3/t, ∆T=10 °C)
1 - 3 0.12 - 3 5.5
High-pressure steam generated,kg/t
50 - 90 64 - 90 97
Boiler feed water, kg/t 170 22Condensate return, t/hSpecific value (t/kt)
8820
113-
Catalyst(containing Pt) t/(Mt/yr) 1.35* Values related to a capacity of 2351 t/d. Specific values related to capacity valuesNote: First column gives ranges for all types of reformers
Table 3.30: Typical utilities requirements for catalytic reformingSources: [118, VROM, 1999], [166, Meyers, 1997], [261, Canales, 2000]
Emissions
Emissions to the airAir emissions from catalytic reforming arise from the process heater gas (addressed inSection 3.10), fugitive emissions (hydrocarbons from pressure relief valves and leakages) andregeneration. Hydrocarbons and dust releases may arise from venting during catalystreplacement procedures and during clean-out operations. The next table shows an example ofemissions to the air generated by reformers in two European refineries. The table also shows theemissions generated by the heaters.
InstallationFuel consumption
(GWh/yr)Throughput
(t/yr) SO2 NOx CO CO2 Particulates
Platformer mg/m3 35 100 100 5Mider (1) 753.4 1000000 t/yr 24.1 68.7 68.7 146152 3.4
Naphtha kg/t feed 0.024 0.069 0.069 146 0.003
Platformer mg/m3 18 170 5 1OMV 494.1 728000 t/yr 8.8 83 2.4 95848 0.5
Naphtha kg/t feed 0.012 0.114 0.003 132 0.001Notes: Data are related to yearly average, 3 % O2, dry conditions. (1) Emissions from the Miderrefinery, only limit values are given. Loads and specific emissions were calculated.
Table 3.31: Examples of emission to air generated by catalytic reformingSource: [250, Winter, 2000]
In the regeneration process of the catalyst in a continuous reforming unit, a slipstream ofcatalyst is withdrawn, the coke (60 - 80 kg coke/tonne feed) is burned off with hot air/steam,trace quantities of a promoter, normally an organic form of chlorine (such as tri- or per-chloroethylene) are added to retain catalyst activity, moisture is removed and the regeneratedcatalyst is returned to the reformer. In the cyclic or semi-regenerative units, the regeneration ofcatalyst and the resulting emissions are discontinuous. The off-gas from the regenerator containssteam, air, hydrocarbons, CO2, HCl, H2S a small quantity of catalyst fines, traces of Cl2, CO
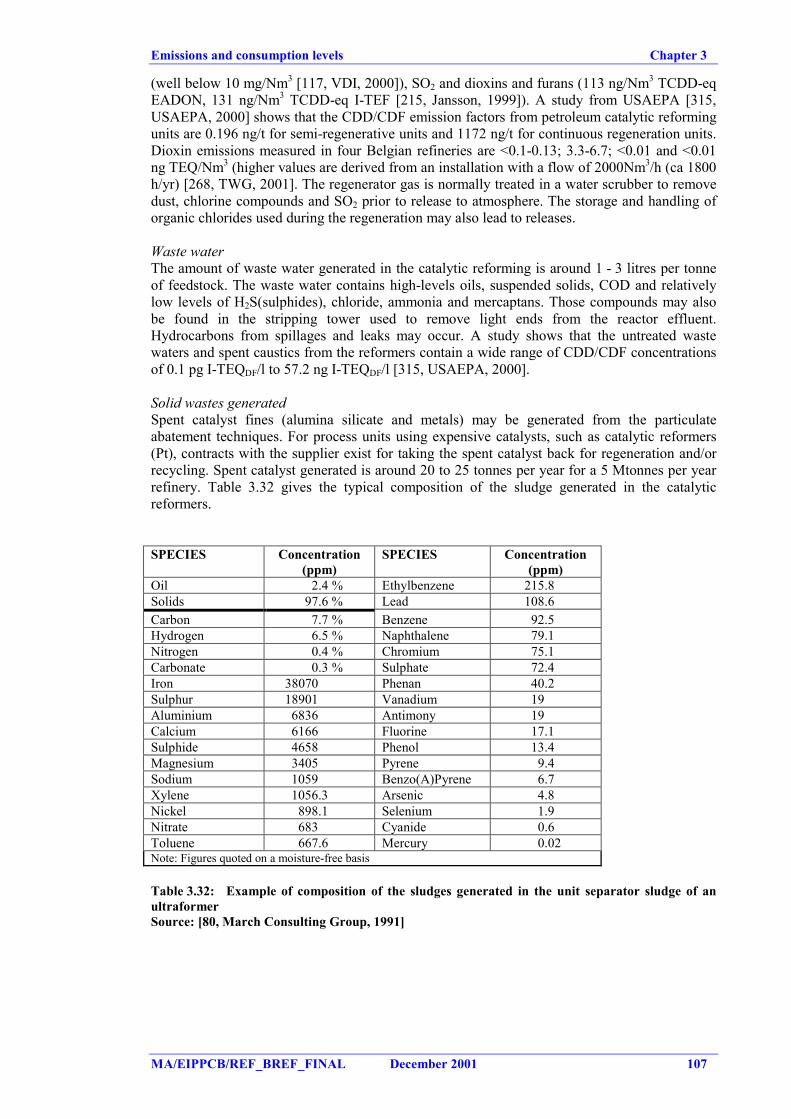
Emissions and consumption levels Chapter 3
MA/EIPPCB/REF_BREF_FINAL December 2001 107
(well below 10 mg/Nm3 [117, VDI, 2000]), SO2 and dioxins and furans (113 ng/Nm3 TCDD-eqEADON, 131 ng/Nm3 TCDD-eq I-TEF [215, Jansson, 1999]). A study from USAEPA [315,USAEPA, 2000] shows that the CDD/CDF emission factors from petroleum catalytic reformingunits are 0.196 ng/t for semi-regenerative units and 1172 ng/t for continuous regeneration units.Dioxin emissions measured in four Belgian refineries are <0.1-0.13; 3.3-6.7; <0.01 and <0.01ng TEQ/Nm3 (higher values are derived from an installation with a flow of 2000Nm3/h (ca 1800h/yr) [268, TWG, 2001]. The regenerator gas is normally treated in a water scrubber to removedust, chlorine compounds and SO2 prior to release to atmosphere. The storage and handling oforganic chlorides used during the regeneration may also lead to releases.
Waste waterThe amount of waste water generated in the catalytic reforming is around 1 - 3 litres per tonneof feedstock. The waste water contains high-levels oils, suspended solids, COD and relativelylow levels of H2S(sulphides), chloride, ammonia and mercaptans. Those compounds may alsobe found in the stripping tower used to remove light ends from the reactor effluent.Hydrocarbons from spillages and leaks may occur. A study shows that the untreated wastewaters and spent caustics from the reformers contain a wide range of CDD/CDF concentrationsof 0.1 pg I-TEQDF/l to 57.2 ng I-TEQDF/l [315, USAEPA, 2000].
Solid wastes generatedSpent catalyst fines (alumina silicate and metals) may be generated from the particulateabatement techniques. For process units using expensive catalysts, such as catalytic reformers(Pt), contracts with the supplier exist for taking the spent catalyst back for regeneration and/orrecycling. Spent catalyst generated is around 20 to 25 tonnes per year for a 5 Mtonnes per yearrefinery. Table 3.32 gives the typical composition of the sludge generated in the catalyticreformers.
SPECIES Concentration(ppm)
SPECIES Concentration(ppm)
Oil 2.4 % Ethylbenzene 215.8Solids 97.6 % Lead 108.6Carbon 7.7 % Benzene 92.5Hydrogen 6.5 % Naphthalene 79.1Nitrogen 0.4 % Chromium 75.1Carbonate 0.3 % Sulphate 72.4Iron 38070 Phenan 40.2Sulphur 18901 Vanadium 19Aluminium 6836 Antimony 19Calcium 6166 Fluorine 17.1Sulphide 4658 Phenol 13.4Magnesium 3405 Pyrene 9.4Sodium 1059 Benzo(A)Pyrene 6.7Xylene 1056.3 Arsenic 4.8Nickel 898.1 Selenium 1.9Nitrate 683 Cyanide 0.6Toluene 667.6 Mercury 0.02Note: Figures quoted on a moisture-free basis
Table 3.32: Example of composition of the sludges generated in the unit separator sludge of anultraformerSource: [80, March Consulting Group, 1991]
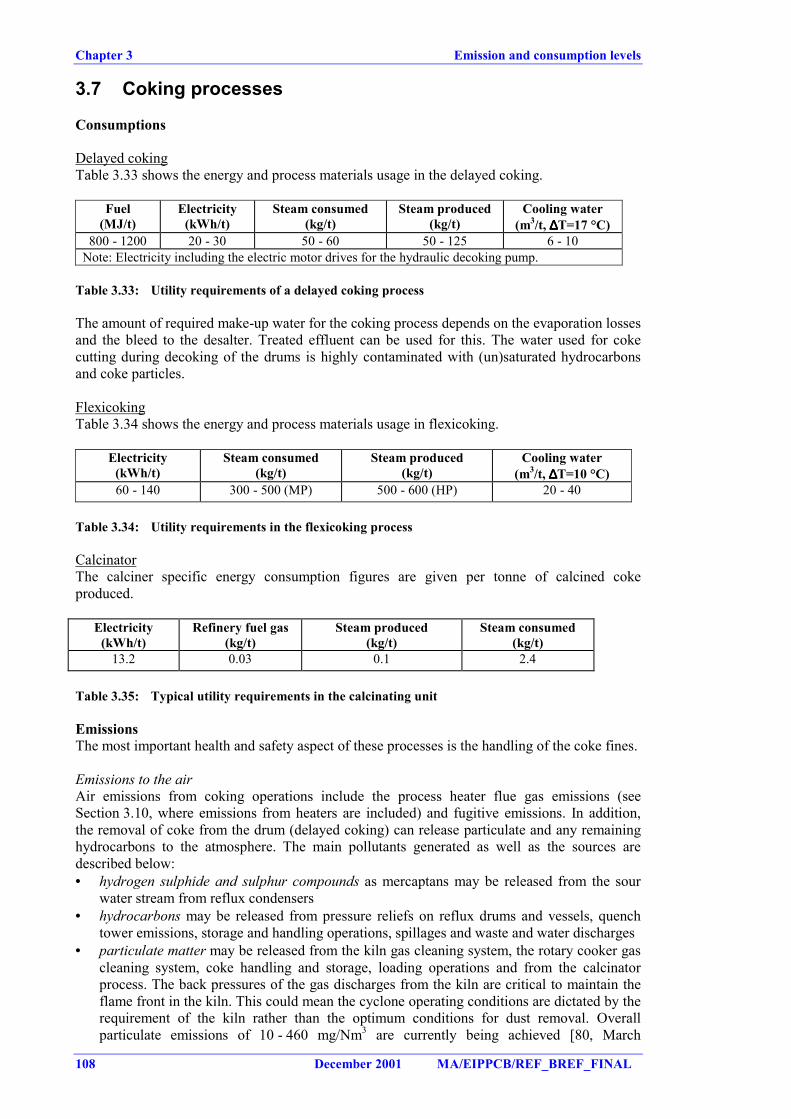
Chapter 3 Emission and consumption levels
108 December 2001 MA/EIPPCB/REF_BREF_FINAL
3.7 Coking processes
Consumptions
Delayed cokingTable 3.33 shows the energy and process materials usage in the delayed coking.
Fuel(MJ/t)
Electricity(kWh/t)
Steam consumed(kg/t)
Steam produced(kg/t)
Cooling water(m3/t, ∆∆∆∆T=17 °C)
800 - 1200 20 - 30 50 - 60 50 - 125 6 - 10Note: Electricity including the electric motor drives for the hydraulic decoking pump.
Table 3.33: Utility requirements of a delayed coking process
The amount of required make-up water for the coking process depends on the evaporation lossesand the bleed to the desalter. Treated effluent can be used for this. The water used for cokecutting during decoking of the drums is highly contaminated with (un)saturated hydrocarbonsand coke particles.
FlexicokingTable 3.34 shows the energy and process materials usage in flexicoking.
Electricity(kWh/t)
Steam consumed(kg/t)
Steam produced(kg/t)
Cooling water(m3/t, ∆∆∆∆T=10 °C)
60 - 140 300 - 500 (MP) 500 - 600 (HP) 20 - 40
Table 3.34: Utility requirements in the flexicoking process
CalcinatorThe calciner specific energy consumption figures are given per tonne of calcined cokeproduced.
Electricity(kWh/t)
Refinery fuel gas(kg/t)
Steam produced(kg/t)
Steam consumed(kg/t)
13.2 0.03 0.1 2.4
Table 3.35: Typical utility requirements in the calcinating unit
EmissionsThe most important health and safety aspect of these processes is the handling of the coke fines.
Emissions to the airAir emissions from coking operations include the process heater flue gas emissions (seeSection 3.10, where emissions from heaters are included) and fugitive emissions. In addition,the removal of coke from the drum (delayed coking) can release particulate and any remaininghydrocarbons to the atmosphere. The main pollutants generated as well as the sources aredescribed below:• hydrogen sulphide and sulphur compounds as mercaptans may be released from the sour
water stream from reflux condensers• hydrocarbons may be released from pressure reliefs on reflux drums and vessels, quench
tower emissions, storage and handling operations, spillages and waste and water discharges• particulate matter may be released from the kiln gas cleaning system, the rotary cooker gas
cleaning system, coke handling and storage, loading operations and from the calcinatorprocess. The back pressures of the gas discharges from the kiln are critical to maintain theflame front in the kiln. This could mean the cyclone operating conditions are dictated by therequirement of the kiln rather than the optimum conditions for dust removal. Overallparticulate emissions of 10 - 460 mg/Nm3 are currently being achieved [80, March
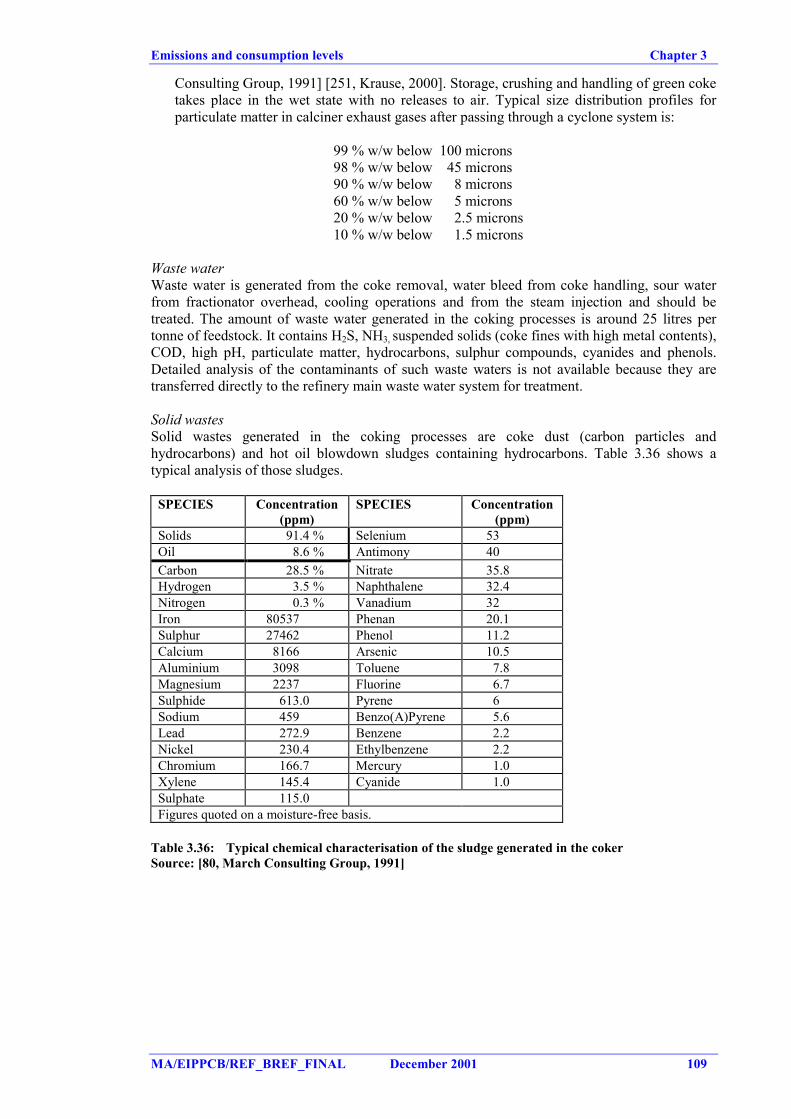
Emissions and consumption levels Chapter 3
MA/EIPPCB/REF_BREF_FINAL December 2001 109
Consulting Group, 1991] [251, Krause, 2000]. Storage, crushing and handling of green coketakes place in the wet state with no releases to air. Typical size distribution profiles forparticulate matter in calciner exhaust gases after passing through a cyclone system is:
99 % w/w below 100 microns98 % w/w below 45 microns90 % w/w below 8 microns60 % w/w below 5 microns20 % w/w below 2.5 microns10 % w/w below 1.5 microns
Waste waterWaste water is generated from the coke removal, water bleed from coke handling, sour waterfrom fractionator overhead, cooling operations and from the steam injection and should betreated. The amount of waste water generated in the coking processes is around 25 litres pertonne of feedstock. It contains H2S, NH3, suspended solids (coke fines with high metal contents),COD, high pH, particulate matter, hydrocarbons, sulphur compounds, cyanides and phenols.Detailed analysis of the contaminants of such waste waters is not available because they aretransferred directly to the refinery main waste water system for treatment.
Solid wastesSolid wastes generated in the coking processes are coke dust (carbon particles andhydrocarbons) and hot oil blowdown sludges containing hydrocarbons. Table 3.36 shows atypical analysis of those sludges.
SPECIES Concentration(ppm)
SPECIES Concentration(ppm)
Solids 91.4 % Selenium 53Oil 8.6 % Antimony 40Carbon 28.5 % Nitrate 35.8Hydrogen 3.5 % Naphthalene 32.4Nitrogen 0.3 % Vanadium 32Iron 80537 Phenan 20.1Sulphur 27462 Phenol 11.2Calcium 8166 Arsenic 10.5Aluminium 3098 Toluene 7.8Magnesium 2237 Fluorine 6.7Sulphide 613.0 Pyrene 6Sodium 459 Benzo(A)Pyrene 5.6Lead 272.9 Benzene 2.2Nickel 230.4 Ethylbenzene 2.2Chromium 166.7 Mercury 1.0Xylene 145.4 Cyanide 1.0Sulphate 115.0Figures quoted on a moisture-free basis.
Table 3.36: Typical chemical characterisation of the sludge generated in the cokerSource: [80, March Consulting Group, 1991]
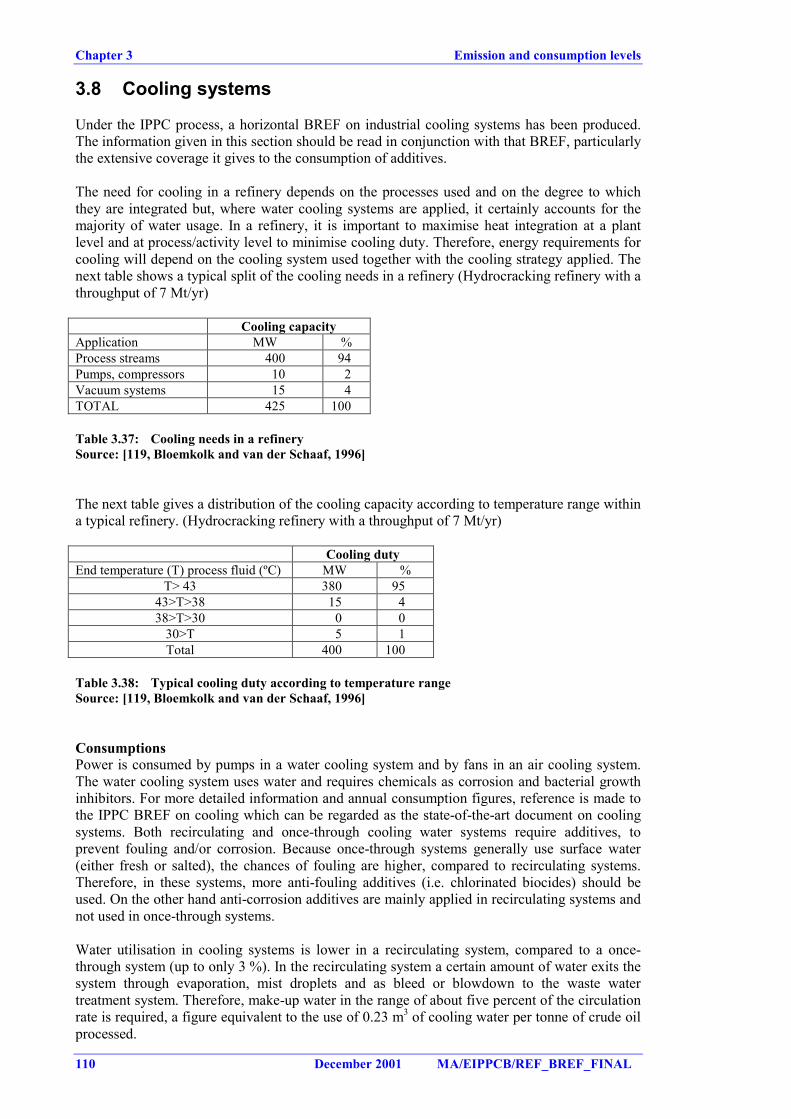
Chapter 3 Emission and consumption levels
110 December 2001 MA/EIPPCB/REF_BREF_FINAL
3.8 Cooling systems
Under the IPPC process, a horizontal BREF on industrial cooling systems has been produced.The information given in this section should be read in conjunction with that BREF, particularlythe extensive coverage it gives to the consumption of additives.
The need for cooling in a refinery depends on the processes used and on the degree to whichthey are integrated but, where water cooling systems are applied, it certainly accounts for themajority of water usage. In a refinery, it is important to maximise heat integration at a plantlevel and at process/activity level to minimise cooling duty. Therefore, energy requirements forcooling will depend on the cooling system used together with the cooling strategy applied. Thenext table shows a typical split of the cooling needs in a refinery (Hydrocracking refinery with athroughput of 7 Mt/yr)
Cooling capacityApplication MW %Process streams 400 94Pumps, compressors 10 2Vacuum systems 15 4TOTAL 425 100
Table 3.37: Cooling needs in a refinerySource: [119, Bloemkolk and van der Schaaf, 1996]
The next table gives a distribution of the cooling capacity according to temperature range withina typical refinery. (Hydrocracking refinery with a throughput of 7 Mt/yr)
Cooling dutyEnd temperature (T) process fluid (ºC) MW %
T> 43 380 9543>T>38 15 438>T>30 0 0
30>T 5 1Total 400 100
Table 3.38: Typical cooling duty according to temperature rangeSource: [119, Bloemkolk and van der Schaaf, 1996]
ConsumptionsPower is consumed by pumps in a water cooling system and by fans in an air cooling system.The water cooling system uses water and requires chemicals as corrosion and bacterial growthinhibitors. For more detailed information and annual consumption figures, reference is made tothe IPPC BREF on cooling which can be regarded as the state-of-the-art document on coolingsystems. Both recirculating and once-through cooling water systems require additives, toprevent fouling and/or corrosion. Because once-through systems generally use surface water(either fresh or salted), the chances of fouling are higher, compared to recirculating systems.Therefore, in these systems, more anti-fouling additives (i.e. chlorinated biocides) should beused. On the other hand anti-corrosion additives are mainly applied in recirculating systems andnot used in once-through systems.
Water utilisation in cooling systems is lower in a recirculating system, compared to a once-through system (up to only 3 %). In the recirculating system a certain amount of water exits thesystem through evaporation, mist droplets and as bleed or blowdown to the waste watertreatment system. Therefore, make-up water in the range of about five percent of the circulationrate is required, a figure equivalent to the use of 0.23 m3 of cooling water per tonne of crude oilprocessed.
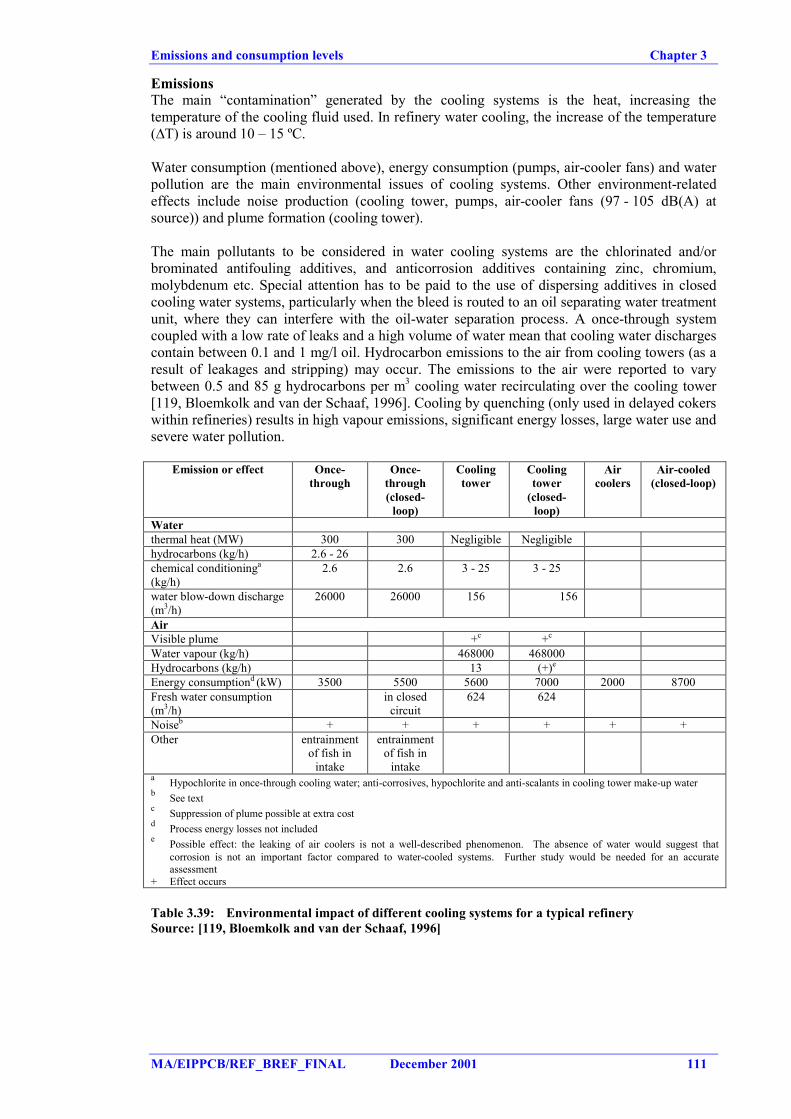
Emissions and consumption levels Chapter 3
MA/EIPPCB/REF_BREF_FINAL December 2001 111
EmissionsThe main “contamination” generated by the cooling systems is the heat, increasing thetemperature of the cooling fluid used. In refinery water cooling, the increase of the temperature(∆T) is around 10 – 15 ºC.
Water consumption (mentioned above), energy consumption (pumps, air-cooler fans) and waterpollution are the main environmental issues of cooling systems. Other environment-relatedeffects include noise production (cooling tower, pumps, air-cooler fans (97 - 105 dB(A) atsource)) and plume formation (cooling tower).
The main pollutants to be considered in water cooling systems are the chlorinated and/orbrominated antifouling additives, and anticorrosion additives containing zinc, chromium,molybdenum etc. Special attention has to be paid to the use of dispersing additives in closedcooling water systems, particularly when the bleed is routed to an oil separating water treatmentunit, where they can interfere with the oil-water separation process. A once-through systemcoupled with a low rate of leaks and a high volume of water mean that cooling water dischargescontain between 0.1 and 1 mg/l oil. Hydrocarbon emissions to the air from cooling towers (as aresult of leakages and stripping) may occur. The emissions to the air were reported to varybetween 0.5 and 85 g hydrocarbons per m3 cooling water recirculating over the cooling tower[119, Bloemkolk and van der Schaaf, 1996]. Cooling by quenching (only used in delayed cokerswithin refineries) results in high vapour emissions, significant energy losses, large water use andsevere water pollution.
Emission or effect Once-through
Once-through(closed-
loop)
Coolingtower
Coolingtower
(closed-loop)
Aircoolers
Air-cooled(closed-loop)
Waterthermal heat (MW) 300 300 Negligible Negligiblehydrocarbons (kg/h) 2.6 - 26chemical conditioninga
(kg/h)2.6 2.6 3 - 25 3 - 25
water blow-down discharge(m3/h)
26000 26000 156 156
AirVisible plume +c +c
Water vapour (kg/h) 468000 468000Hydrocarbons (kg/h) 13 (+)e
Energy consumptiond (kW) 3500 5500 5600 7000 2000 8700Fresh water consumption(m3/h)
in closedcircuit
624 624
Noiseb + + + + + +Other entrainment
of fish inintake
entrainmentof fish in
intakea Hypochlorite in once-through cooling water; anti-corrosives, hypochlorite and anti-scalants in cooling tower make-up waterb See textc Suppression of plume possible at extra costd Process energy losses not includede Possible effect: the leaking of air coolers is not a well-described phenomenon. The absence of water would suggest that
corrosion is not an important factor compared to water-cooled systems. Further study would be needed for an accurateassessment
+ Effect occurs
Table 3.39: Environmental impact of different cooling systems for a typical refinerySource: [119, Bloemkolk and van der Schaaf, 1996]
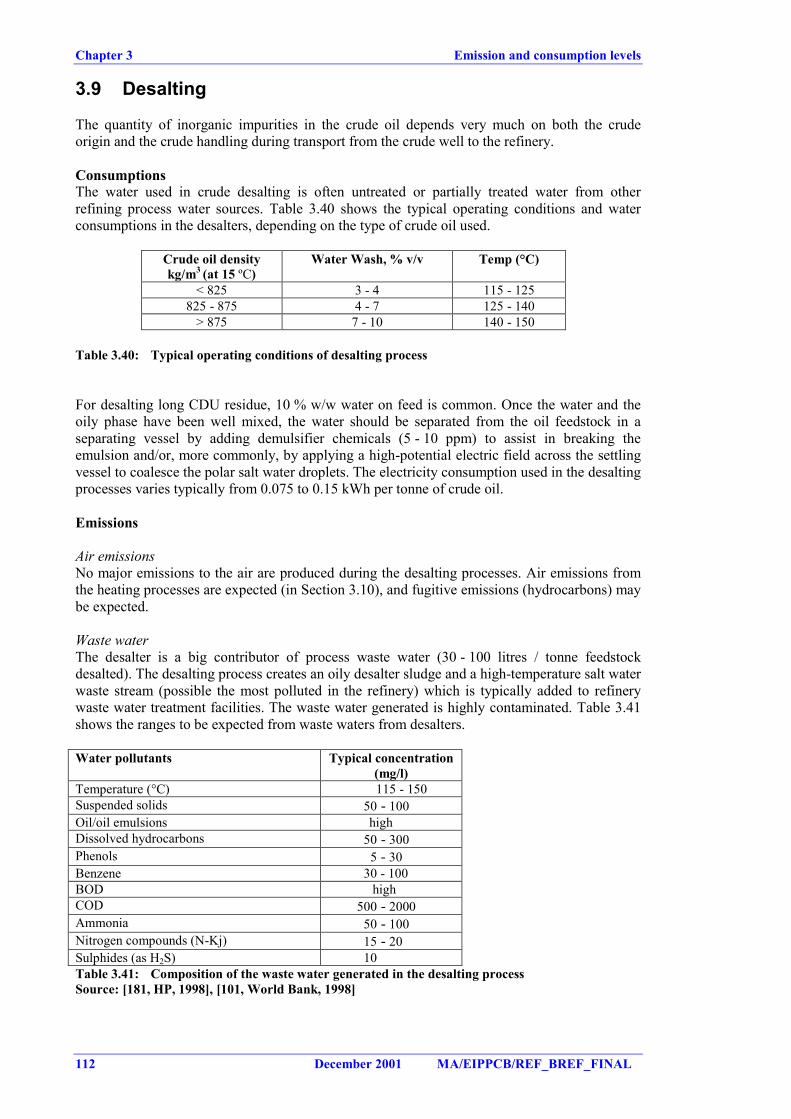
Chapter 3 Emission and consumption levels
112 December 2001 MA/EIPPCB/REF_BREF_FINAL
3.9 Desalting
The quantity of inorganic impurities in the crude oil depends very much on both the crudeorigin and the crude handling during transport from the crude well to the refinery.
ConsumptionsThe water used in crude desalting is often untreated or partially treated water from otherrefining process water sources. Table 3.40 shows the typical operating conditions and waterconsumptions in the desalters, depending on the type of crude oil used.
Crude oil densitykg/m3 (at 15 ºC)
Water Wash, % v/v Temp (°C)
< 825 3 - 4 115 - 125825 - 875 4 - 7 125 - 140
> 875 7 - 10 140 - 150
Table 3.40: Typical operating conditions of desalting process
For desalting long CDU residue, 10 % w/w water on feed is common. Once the water and theoily phase have been well mixed, the water should be separated from the oil feedstock in aseparating vessel by adding demulsifier chemicals (5 - 10 ppm) to assist in breaking theemulsion and/or, more commonly, by applying a high-potential electric field across the settlingvessel to coalesce the polar salt water droplets. The electricity consumption used in the desaltingprocesses varies typically from 0.075 to 0.15 kWh per tonne of crude oil.
Emissions
Air emissionsNo major emissions to the air are produced during the desalting processes. Air emissions fromthe heating processes are expected (in Section 3.10), and fugitive emissions (hydrocarbons) maybe expected.
Waste waterThe desalter is a big contributor of process waste water (30 - 100 litres / tonne feedstockdesalted). The desalting process creates an oily desalter sludge and a high-temperature salt waterwaste stream (possible the most polluted in the refinery) which is typically added to refinerywaste water treatment facilities. The waste water generated is highly contaminated. Table 3.41shows the ranges to be expected from waste waters from desalters.
Water pollutants Typical concentration(mg/l)
Temperature (°C) 115 - 150Suspended solids 50 - 100Oil/oil emulsions highDissolved hydrocarbons 50 - 300Phenols 5 - 30Benzene 30 - 100BOD highCOD 500 - 2000Ammonia 50 - 100Nitrogen compounds (N-Kj) 15 - 20Sulphides (as H2S) 10Table 3.41: Composition of the waste water generated in the desalting processSource: [181, HP, 1998], [101, World Bank, 1998]
Emissions and consumption levels Chapter 3
MA/EIPPCB/REF_BREF_FINAL December 2001 113
Solid wastes generatedThe quantities of desalter sludge generated depend on the solid content of the crude, theseparation efficiency and the applied desludging mode and frequency. Normally a desalterclean-out is done twice a year, yielding from 60 - 1500 t/yr oily sludge, dependent on thethroughput and efficiency of the process to capture solids. The sludge generated can containiron rust, clay, sand, water (5 - 10 %), emulsified oil and wax (20 - 50 % w/w) and metals.
Chapter 3 Emission and consumption levels
114 December 2001 MA/EIPPCB/REF_BREF_FINAL
3.10 Energy system
The energy system is an important if not the most important activity from the environmentalperspective. The energy (heat and power) necessary to transform the raw materials to productsare provided by the combustion of hydrocarbon fractions that generates mainly emissions to theair. As it was mentioned in Section 2.10, this section contains the emissions generated by theenergy system as a whole. As consequence of this, the emissions generated by furnaces or boilerof specific processes are integrated here and they are not considered in each of the otherSections.
3.10.1 Energy management
Energy efficiency in refineriesAs the name indicates, energy efficiency is an index for calculating a refinery’s energyefficiency. There are currently three methodologies in use in refineries briefly described below:
• specific energy consumption (SEC). This is the most simple index. It is calculated as theratio between the energy consumed by the refinery and the tonnes of feedstock processed.The specific energy consumption of European refineries ranges from 1 to more than 4 GJper tonne of throughput. Because it is a simple index, this ratio does not take account of thecomplexity of the refinery (more complex refineries tend to consume more energy).
• products method. [318, Phylipsen, Blok et al., 1998] This method considers the productsand internal energy products produced in the refinery, giving a specific energy consumptionbenchmark per tonne of energy product produced. Multiplying those specific energyconsumptions by the amount produced within the refinery and adding all those totals givesan energy consumption benchmark for that refinery. Some calculations indicate that the bestspecific energy consumption figures are between 2.4 and 2.9 GJ/tonnes whereas actualvalues are from 1 to 4.8. That means that some European refineries are doing better thanfigures that are considered a good benchmark.
• energy intensity index (EII) is a measure used to compare energy consumption in refineries.The standard energy use is based on the energy consumption at about 300 refineriesworldwide. The average EII obtained in a worldwide market survey (Solomon study, 1994)was 92, with a range from 62 to 165. [107, Janson, 1999]. More energy efficient refineriescorrespond to the lower values of EII. So, some refineries are almost three times as energyefficient as others. This index does reflect the types of processes and throughput of eachprocess in the refinery. This data is not available for all refineries and typically isconsidered confidential by refineries. 10 refineries have reported its figure and the valueshave been plotted against the complexity index. Lowest EII values are typically achievableunder local circumstances where low grade heat can be externally exchanged.
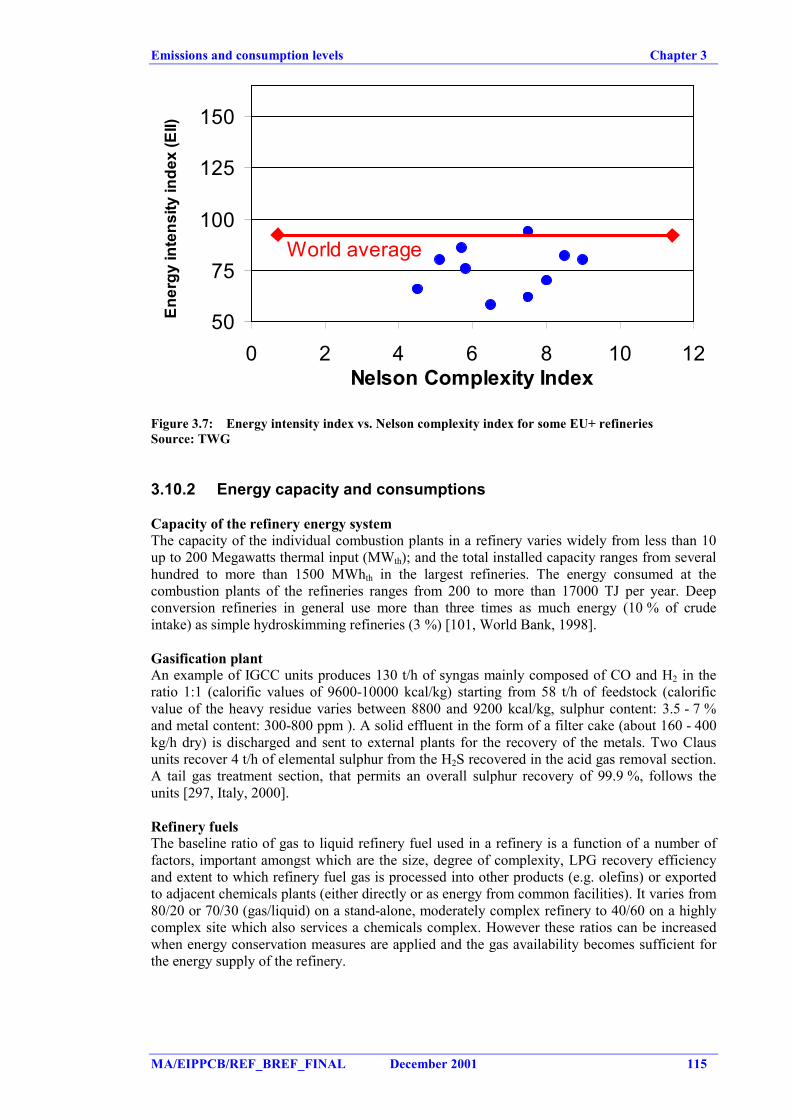
Emissions and consumption levels Chapter 3
MA/EIPPCB/REF_BREF_FINAL December 2001 115
50
75
100
125
150
0 2 4 6 8 10 12Nelson Complexity Index
Ener
gy in
tens
ity in
dex
(EII)
World average
Figure 3.7: Energy intensity index vs. Nelson complexity index for some EU+ refineriesSource: TWG
3.10.2 Energy capacity and consumptions
Capacity of the refinery energy systemThe capacity of the individual combustion plants in a refinery varies widely from less than 10up to 200 Megawatts thermal input (MWth); and the total installed capacity ranges from severalhundred to more than 1500 MWhth in the largest refineries. The energy consumed at thecombustion plants of the refineries ranges from 200 to more than 17000 TJ per year. Deepconversion refineries in general use more than three times as much energy (10 % of crudeintake) as simple hydroskimming refineries (3 %) [101, World Bank, 1998].
Gasification plantAn example of IGCC units produces 130 t/h of syngas mainly composed of CO and H2 in theratio 1:1 (calorific values of 9600-10000 kcal/kg) starting from 58 t/h of feedstock (calorificvalue of the heavy residue varies between 8800 and 9200 kcal/kg, sulphur content: 3.5 - 7 %and metal content: 300-800 ppm ). A solid effluent in the form of a filter cake (about 160 - 400kg/h dry) is discharged and sent to external plants for the recovery of the metals. Two Clausunits recover 4 t/h of elemental sulphur from the H2S recovered in the acid gas removal section.A tail gas treatment section, that permits an overall sulphur recovery of 99.9 %, follows theunits [297, Italy, 2000].
Refinery fuelsThe baseline ratio of gas to liquid refinery fuel used in a refinery is a function of a number offactors, important amongst which are the size, degree of complexity, LPG recovery efficiencyand extent to which refinery fuel gas is processed into other products (e.g. olefins) or exportedto adjacent chemicals plants (either directly or as energy from common facilities). It varies from80/20 or 70/30 (gas/liquid) on a stand-alone, moderately complex refinery to 40/60 on a highlycomplex site which also services a chemicals complex. However these ratios can be increasedwhen energy conservation measures are applied and the gas availability becomes sufficient forthe energy supply of the refinery.
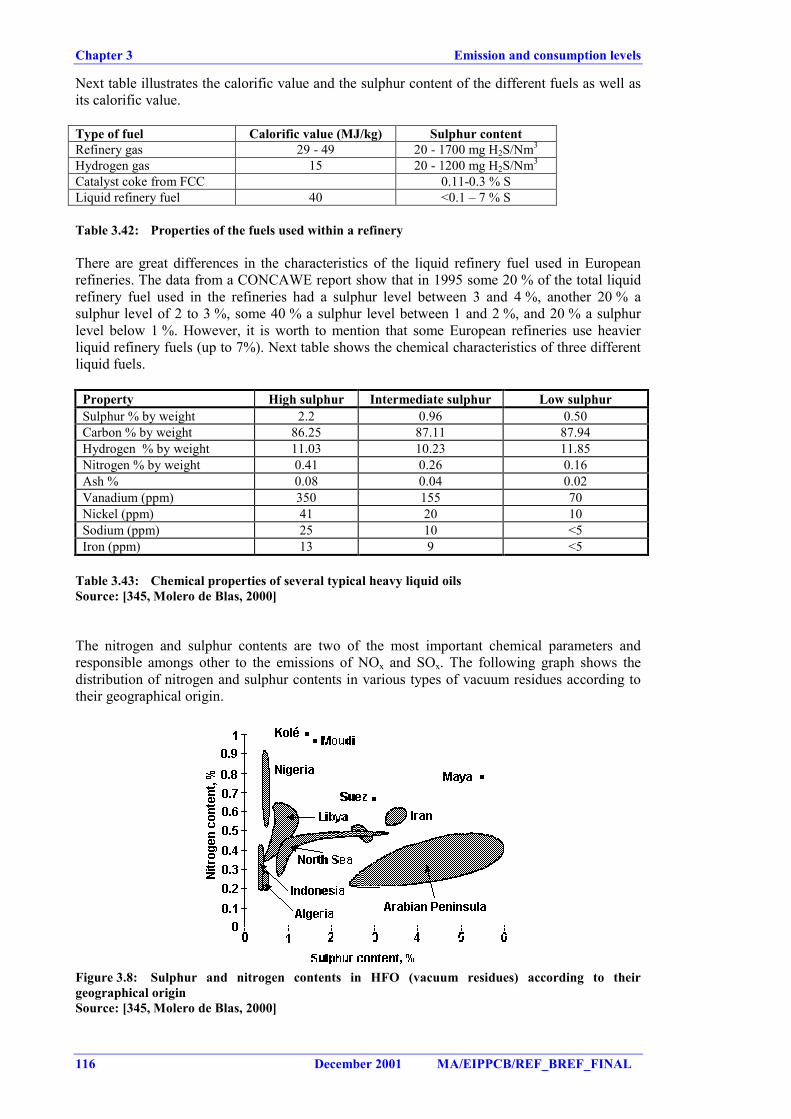
Chapter 3 Emission and consumption levels
116 December 2001 MA/EIPPCB/REF_BREF_FINAL
Next table illustrates the calorific value and the sulphur content of the different fuels as well asits calorific value.
Type of fuel Calorific value (MJ/kg) Sulphur contentRefinery gas 29 - 49 20 - 1700 mg H2S/Nm3
Hydrogen gas 15 20 - 1200 mg H2S/Nm3
Catalyst coke from FCC 0.11-0.3 % SLiquid refinery fuel 40 <0.1 – 7 % S
Table 3.42: Properties of the fuels used within a refinery
There are great differences in the characteristics of the liquid refinery fuel used in Europeanrefineries. The data from a CONCAWE report show that in 1995 some 20 % of the total liquidrefinery fuel used in the refineries had a sulphur level between 3 and 4 %, another 20 % asulphur level of 2 to 3 %, some 40 % a sulphur level between 1 and 2 %, and 20 % a sulphurlevel below 1 %. However, it is worth to mention that some European refineries use heavierliquid refinery fuels (up to 7%). Next table shows the chemical characteristics of three differentliquid fuels.
Property High sulphur Intermediate sulphur Low sulphurSulphur % by weight 2.2 0.96 0.50Carbon % by weight 86.25 87.11 87.94Hydrogen % by weight 11.03 10.23 11.85Nitrogen % by weight 0.41 0.26 0.16Ash % 0.08 0.04 0.02Vanadium (ppm) 350 155 70Nickel (ppm) 41 20 10Sodium (ppm) 25 10 <5Iron (ppm) 13 9 <5
Table 3.43: Chemical properties of several typical heavy liquid oilsSource: [345, Molero de Blas, 2000]
The nitrogen and sulphur contents are two of the most important chemical parameters andresponsible amongs other to the emissions of NOx and SOx. The following graph shows thedistribution of nitrogen and sulphur contents in various types of vacuum residues according totheir geographical origin.
Figure 3.8: Sulphur and nitrogen contents in HFO (vacuum residues) according to theirgeographical originSource: [345, Molero de Blas, 2000]
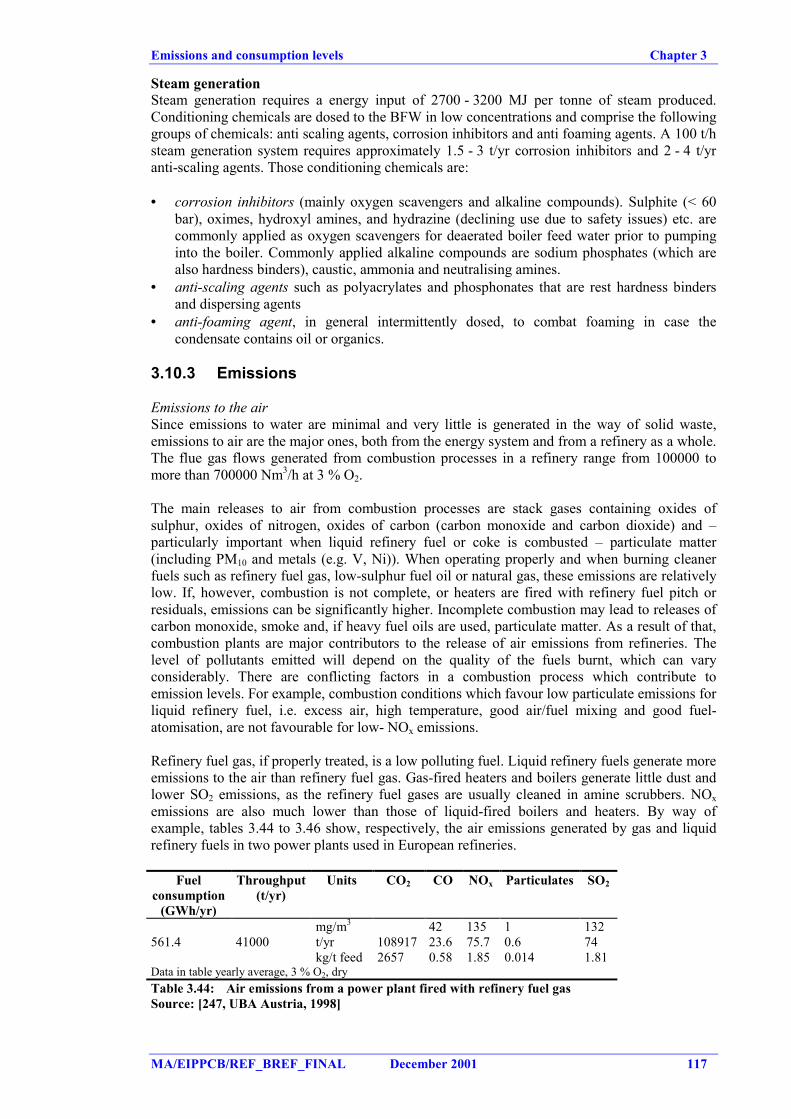
Emissions and consumption levels Chapter 3
MA/EIPPCB/REF_BREF_FINAL December 2001 117
Steam generationSteam generation requires a energy input of 2700 - 3200 MJ per tonne of steam produced.Conditioning chemicals are dosed to the BFW in low concentrations and comprise the followinggroups of chemicals: anti scaling agents, corrosion inhibitors and anti foaming agents. A 100 t/hsteam generation system requires approximately 1.5 - 3 t/yr corrosion inhibitors and 2 - 4 t/yranti-scaling agents. Those conditioning chemicals are:
• corrosion inhibitors (mainly oxygen scavengers and alkaline compounds). Sulphite (< 60bar), oximes, hydroxyl amines, and hydrazine (declining use due to safety issues) etc. arecommonly applied as oxygen scavengers for deaerated boiler feed water prior to pumpinginto the boiler. Commonly applied alkaline compounds are sodium phosphates (which arealso hardness binders), caustic, ammonia and neutralising amines.
• anti-scaling agents such as polyacrylates and phosphonates that are rest hardness bindersand dispersing agents
• anti-foaming agent, in general intermittently dosed, to combat foaming in case thecondensate contains oil or organics.
3.10.3 Emissions
Emissions to the airSince emissions to water are minimal and very little is generated in the way of solid waste,emissions to air are the major ones, both from the energy system and from a refinery as a whole.The flue gas flows generated from combustion processes in a refinery range from 100000 tomore than 700000 Nm3/h at 3 % O2.
The main releases to air from combustion processes are stack gases containing oxides ofsulphur, oxides of nitrogen, oxides of carbon (carbon monoxide and carbon dioxide) and –particularly important when liquid refinery fuel or coke is combusted – particulate matter(including PM10 and metals (e.g. V, Ni)). When operating properly and when burning cleanerfuels such as refinery fuel gas, low-sulphur fuel oil or natural gas, these emissions are relativelylow. If, however, combustion is not complete, or heaters are fired with refinery fuel pitch orresiduals, emissions can be significantly higher. Incomplete combustion may lead to releases ofcarbon monoxide, smoke and, if heavy fuel oils are used, particulate matter. As a result of that,combustion plants are major contributors to the release of air emissions from refineries. Thelevel of pollutants emitted will depend on the quality of the fuels burnt, which can varyconsiderably. There are conflicting factors in a combustion process which contribute toemission levels. For example, combustion conditions which favour low particulate emissions forliquid refinery fuel, i.e. excess air, high temperature, good air/fuel mixing and good fuel-atomisation, are not favourable for low- NOx emissions.
Refinery fuel gas, if properly treated, is a low polluting fuel. Liquid refinery fuels generate moreemissions to the air than refinery fuel gas. Gas-fired heaters and boilers generate little dust andlower SO2 emissions, as the refinery fuel gases are usually cleaned in amine scrubbers. NOxemissions are also much lower than those of liquid-fired boilers and heaters. By way ofexample, tables 3.44 to 3.46 show, respectively, the air emissions generated by gas and liquidrefinery fuels in two power plants used in European refineries.
Fuelconsumption
(GWh/yr)
Throughput(t/yr)
Units CO2 CO NOx Particulates SO2
mg/m3 42 135 1 132561.4 41000 t/yr 108917 23.6 75.7 0.6 74
kg/t feed 2657 0.58 1.85 0.014 1.81Data in table yearly average, 3 % O2, dryTable 3.44: Air emissions from a power plant fired with refinery fuel gasSource: [247, UBA Austria, 1998]
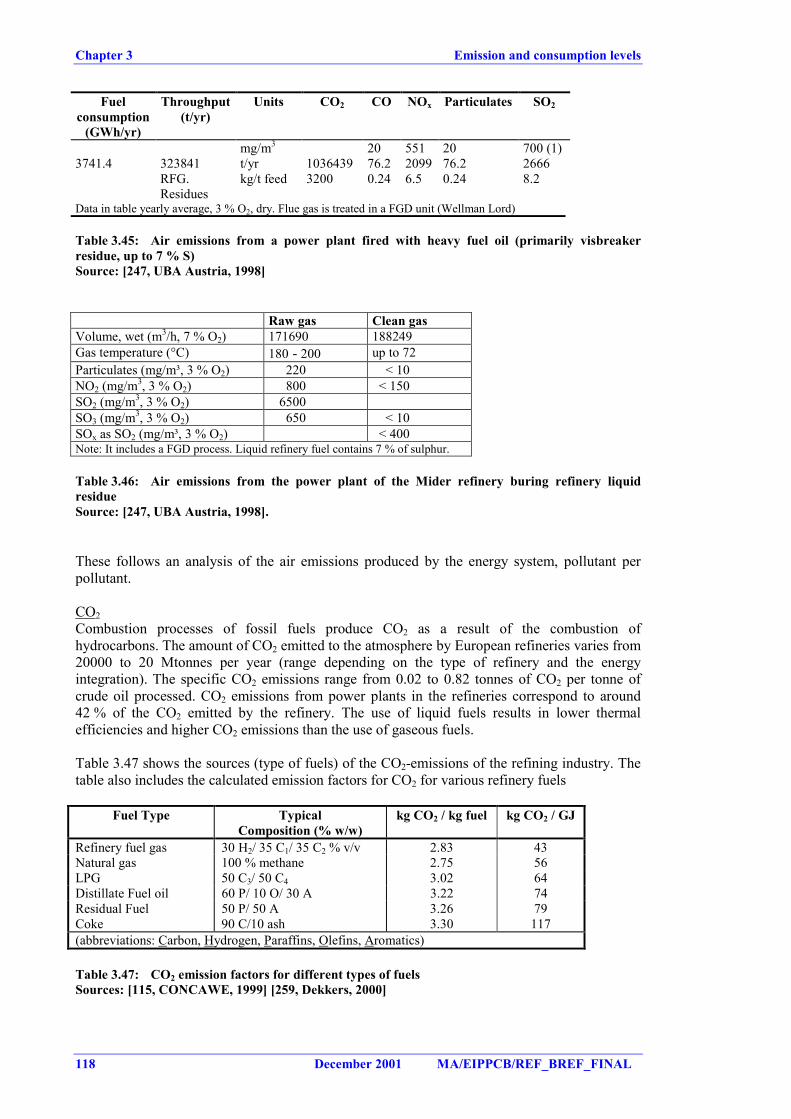
Chapter 3 Emission and consumption levels
118 December 2001 MA/EIPPCB/REF_BREF_FINAL
Fuelconsumption
(GWh/yr)
Throughput(t/yr)
Units CO2 CO NOx Particulates SO2
mg/m3 20 551 20 700 (1)3741.4 323841 t/yr 1036439 76.2 2099 76.2 2666
RFG.Residues
kg/t feed 3200 0.24 6.5 0.24 8.2
Data in table yearly average, 3 % O2, dry. Flue gas is treated in a FGD unit (Wellman Lord)
Table 3.45: Air emissions from a power plant fired with heavy fuel oil (primarily visbreakerresidue, up to 7 % S)Source: [247, UBA Austria, 1998]
Raw gas Clean gasVolume, wet (m3/h, 7 % O2) 171690 188249Gas temperature (°C) 180 - 200 up to 72Particulates (mg/m³, 3 % O2) 220 < 10NO2 (mg/m3, 3 % O2) 800 < 150SO2 (mg/m3, 3 % O2) 6500SO3 (mg/m3, 3 % O2) 650 < 10SOx as SO2 (mg/m³, 3 % O2) < 400Note: It includes a FGD process. Liquid refinery fuel contains 7 % of sulphur.
Table 3.46: Air emissions from the power plant of the Mider refinery buring refinery liquidresidueSource: [247, UBA Austria, 1998].
These follows an analysis of the air emissions produced by the energy system, pollutant perpollutant.
CO2Combustion processes of fossil fuels produce CO2 as a result of the combustion ofhydrocarbons. The amount of CO2 emitted to the atmosphere by European refineries varies from20000 to 20 Mtonnes per year (range depending on the type of refinery and the energyintegration). The specific CO2 emissions range from 0.02 to 0.82 tonnes of CO2 per tonne ofcrude oil processed. CO2 emissions from power plants in the refineries correspond to around42 % of the CO2 emitted by the refinery. The use of liquid fuels results in lower thermalefficiencies and higher CO2 emissions than the use of gaseous fuels.
Table 3.47 shows the sources (type of fuels) of the CO2-emissions of the refining industry. Thetable also includes the calculated emission factors for CO2 for various refinery fuels
Fuel Type TypicalComposition (% w/w)
kg CO2 / kg fuel kg CO2 / GJ
Refinery fuel gas 30 H2/ 35 C1/ 35 C2 % v/v 2.83 43Natural gas 100 % methane 2.75 56LPG 50 C3/ 50 C4 3.02 64Distillate Fuel oil 60 P/ 10 O/ 30 A 3.22 74Residual Fuel 50 P/ 50 A 3.26 79Coke 90 C/10 ash 3.30 117(abbreviations: Carbon, Hydrogen, Paraffins, Olefins, Aromatics)
Table 3.47: CO2 emission factors for different types of fuelsSources: [115, CONCAWE, 1999] [259, Dekkers, 2000]
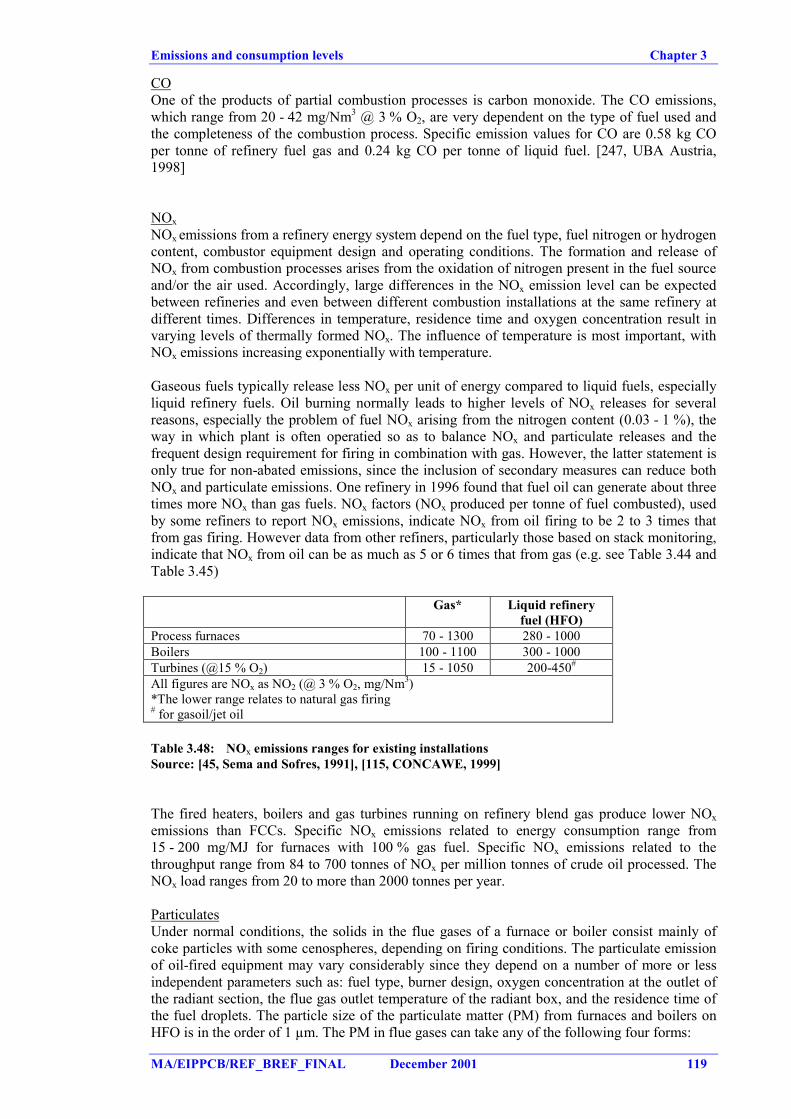
Emissions and consumption levels Chapter 3
MA/EIPPCB/REF_BREF_FINAL December 2001 119
COOne of the products of partial combustion processes is carbon monoxide. The CO emissions,which range from 20 - 42 mg/Nm3 @ 3 % O2, are very dependent on the type of fuel used andthe completeness of the combustion process. Specific emission values for CO are 0.58 kg COper tonne of refinery fuel gas and 0.24 kg CO per tonne of liquid fuel. [247, UBA Austria,1998]
NOxNOx emissions from a refinery energy system depend on the fuel type, fuel nitrogen or hydrogencontent, combustor equipment design and operating conditions. The formation and release ofNOx from combustion processes arises from the oxidation of nitrogen present in the fuel sourceand/or the air used. Accordingly, large differences in the NOx emission level can be expectedbetween refineries and even between different combustion installations at the same refinery atdifferent times. Differences in temperature, residence time and oxygen concentration result invarying levels of thermally formed NOx. The influence of temperature is most important, withNOx emissions increasing exponentially with temperature.
Gaseous fuels typically release less NOx per unit of energy compared to liquid fuels, especiallyliquid refinery fuels. Oil burning normally leads to higher levels of NOx releases for severalreasons, especially the problem of fuel NOx arising from the nitrogen content (0.03 - 1 %), theway in which plant is often operatied so as to balance NOx and particulate releases and thefrequent design requirement for firing in combination with gas. However, the latter statement isonly true for non-abated emissions, since the inclusion of secondary measures can reduce bothNOx and particulate emissions. One refinery in 1996 found that fuel oil can generate about threetimes more NOx than gas fuels. NOx factors (NOx produced per tonne of fuel combusted), usedby some refiners to report NOx emissions, indicate NOx from oil firing to be 2 to 3 times thatfrom gas firing. However data from other refiners, particularly those based on stack monitoring,indicate that NOx from oil can be as much as 5 or 6 times that from gas (e.g. see Table 3.44 andTable 3.45)
Gas* Liquid refineryfuel (HFO)
Process furnaces 70 - 1300 280 - 1000Boilers 100 - 1100 300 - 1000Turbines (@15 % O2) 15 - 1050 200-450#
All figures are NOx as NO2 (@ 3 % O2, mg/Nm3)*The lower range relates to natural gas firing# for gasoil/jet oil
Table 3.48: NOx emissions ranges for existing installationsSource: [45, Sema and Sofres, 1991], [115, CONCAWE, 1999]
The fired heaters, boilers and gas turbines running on refinery blend gas produce lower NOxemissions than FCCs. Specific NOx emissions related to energy consumption range from15 - 200 mg/MJ for furnaces with 100 % gas fuel. Specific NOx emissions related to thethroughput range from 84 to 700 tonnes of NOx per million tonnes of crude oil processed. TheNOx load ranges from 20 to more than 2000 tonnes per year.
ParticulatesUnder normal conditions, the solids in the flue gases of a furnace or boiler consist mainly ofcoke particles with some cenospheres, depending on firing conditions. The particulate emissionof oil-fired equipment may vary considerably since they depend on a number of more or lessindependent parameters such as: fuel type, burner design, oxygen concentration at the outlet ofthe radiant section, the flue gas outlet temperature of the radiant box, and the residence time ofthe fuel droplets. The particle size of the particulate matter (PM) from furnaces and boilers onHFO is in the order of 1 µm. The PM in flue gases can take any of the following four forms:
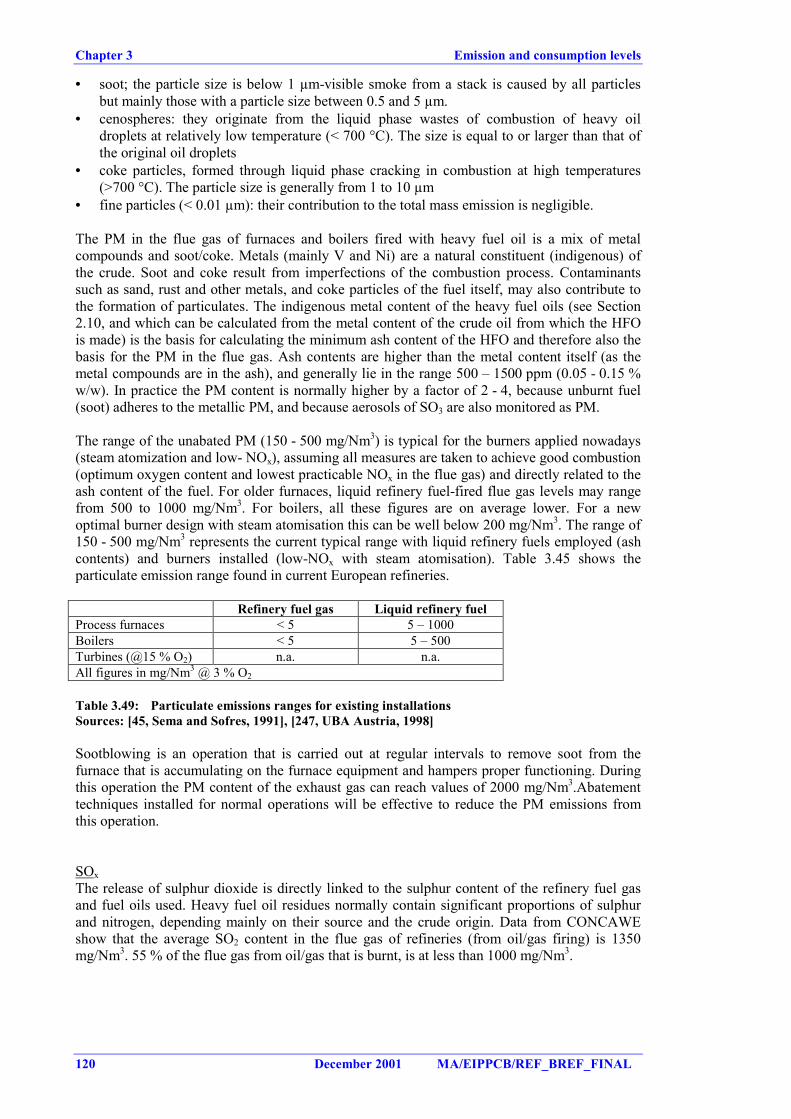
Chapter 3 Emission and consumption levels
120 December 2001 MA/EIPPCB/REF_BREF_FINAL
• soot; the particle size is below 1 µm-visible smoke from a stack is caused by all particlesbut mainly those with a particle size between 0.5 and 5 µm.
• cenospheres: they originate from the liquid phase wastes of combustion of heavy oildroplets at relatively low temperature (< 700 °C). The size is equal to or larger than that ofthe original oil droplets
• coke particles, formed through liquid phase cracking in combustion at high temperatures(>700 °C). The particle size is generally from 1 to 10 µm
• fine particles (< 0.01 µm): their contribution to the total mass emission is negligible.
The PM in the flue gas of furnaces and boilers fired with heavy fuel oil is a mix of metalcompounds and soot/coke. Metals (mainly V and Ni) are a natural constituent (indigenous) ofthe crude. Soot and coke result from imperfections of the combustion process. Contaminantssuch as sand, rust and other metals, and coke particles of the fuel itself, may also contribute tothe formation of particulates. The indigenous metal content of the heavy fuel oils (see Section2.10, and which can be calculated from the metal content of the crude oil from which the HFOis made) is the basis for calculating the minimum ash content of the HFO and therefore also thebasis for the PM in the flue gas. Ash contents are higher than the metal content itself (as themetal compounds are in the ash), and generally lie in the range 500 – 1500 ppm (0.05 - 0.15 %w/w). In practice the PM content is normally higher by a factor of 2 - 4, because unburnt fuel(soot) adheres to the metallic PM, and because aerosols of SO3 are also monitored as PM.
The range of the unabated PM (150 - 500 mg/Nm3) is typical for the burners applied nowadays(steam atomization and low- NOx), assuming all measures are taken to achieve good combustion(optimum oxygen content and lowest practicable NOx in the flue gas) and directly related to theash content of the fuel. For older furnaces, liquid refinery fuel-fired flue gas levels may rangefrom 500 to 1000 mg/Nm3. For boilers, all these figures are on average lower. For a newoptimal burner design with steam atomisation this can be well below 200 mg/Nm3. The range of150 - 500 mg/Nm3 represents the current typical range with liquid refinery fuels employed (ashcontents) and burners installed (low-NOx with steam atomisation). Table 3.45 shows theparticulate emission range found in current European refineries.
Refinery fuel gas Liquid refinery fuelProcess furnaces < 5 5 – 1000Boilers < 5 5 – 500Turbines (@15 % O2) n.a. n.a.All figures in mg/Nm3 @ 3 % O2
Table 3.49: Particulate emissions ranges for existing installationsSources: [45, Sema and Sofres, 1991], [247, UBA Austria, 1998]
Sootblowing is an operation that is carried out at regular intervals to remove soot from thefurnace that is accumulating on the furnace equipment and hampers proper functioning. Duringthis operation the PM content of the exhaust gas can reach values of 2000 mg/Nm3.Abatementtechniques installed for normal operations will be effective to reduce the PM emissions fromthis operation.
SOxThe release of sulphur dioxide is directly linked to the sulphur content of the refinery fuel gasand fuel oils used. Heavy fuel oil residues normally contain significant proportions of sulphurand nitrogen, depending mainly on their source and the crude origin. Data from CONCAWEshow that the average SO2 content in the flue gas of refineries (from oil/gas firing) is 1350mg/Nm3. 55 % of the flue gas from oil/gas that is burnt, is at less than 1000 mg/Nm3.
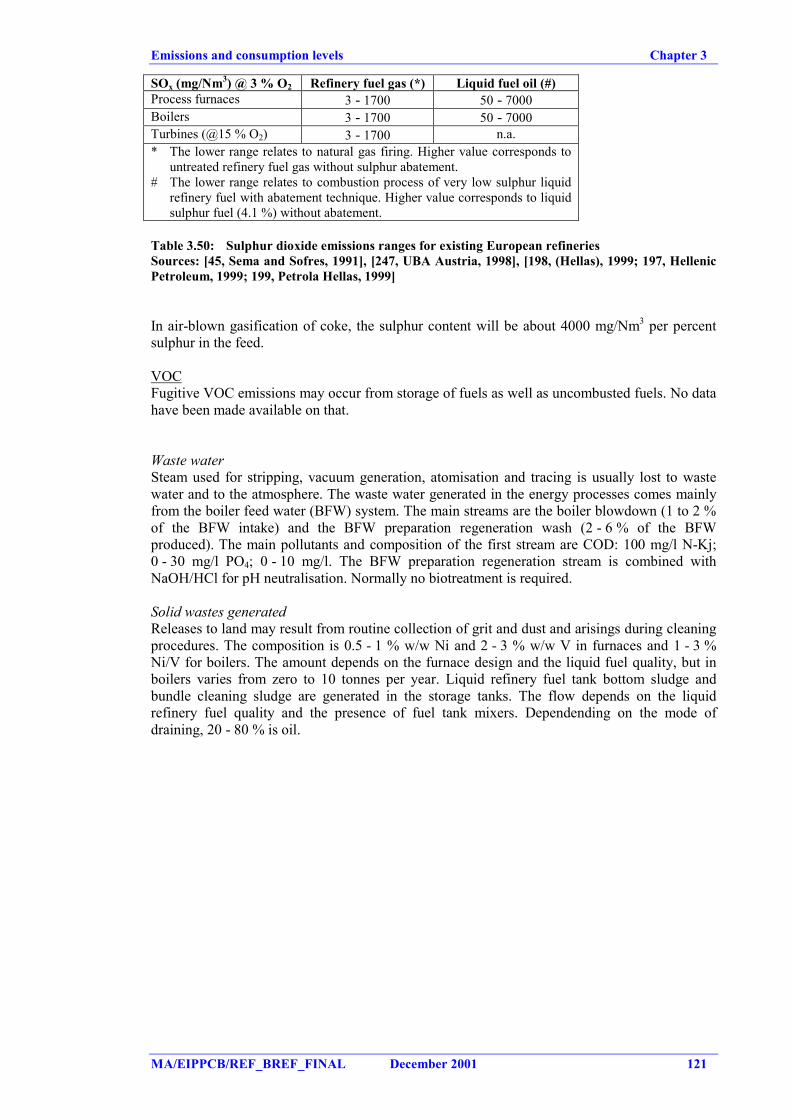
Emissions and consumption levels Chapter 3
MA/EIPPCB/REF_BREF_FINAL December 2001 121
SOx (mg/Nm3) @ 3 % O2 Refinery fuel gas (*) Liquid fuel oil (#)Process furnaces 3 - 1700 50 - 7000Boilers 3 - 1700 50 - 7000Turbines (@15 % O2) 3 - 1700 n.a.* The lower range relates to natural gas firing. Higher value corresponds to
untreated refinery fuel gas without sulphur abatement.# The lower range relates to combustion process of very low sulphur liquid
refinery fuel with abatement technique. Higher value corresponds to liquidsulphur fuel (4.1 %) without abatement.
Table 3.50: Sulphur dioxide emissions ranges for existing European refineriesSources: [45, Sema and Sofres, 1991], [247, UBA Austria, 1998], [198, (Hellas), 1999; 197, HellenicPetroleum, 1999; 199, Petrola Hellas, 1999]
In air-blown gasification of coke, the sulphur content will be about 4000 mg/Nm3 per percentsulphur in the feed.
VOCFugitive VOC emissions may occur from storage of fuels as well as uncombusted fuels. No datahave been made available on that.
Waste waterSteam used for stripping, vacuum generation, atomisation and tracing is usually lost to wastewater and to the atmosphere. The waste water generated in the energy processes comes mainlyfrom the boiler feed water (BFW) system. The main streams are the boiler blowdown (1 to 2 %of the BFW intake) and the BFW preparation regeneration wash (2 - 6 % of the BFWproduced). The main pollutants and composition of the first stream are COD: 100 mg/l N-Kj;0 - 30 mg/l PO4; 0 - 10 mg/l. The BFW preparation regeneration stream is combined withNaOH/HCl for pH neutralisation. Normally no biotreatment is required.
Solid wastes generatedReleases to land may result from routine collection of grit and dust and arisings during cleaningprocedures. The composition is 0.5 - 1 % w/w Ni and 2 - 3 % w/w V in furnaces and 1 - 3 %Ni/V for boilers. The amount depends on the furnace design and the liquid fuel quality, but inboilers varies from zero to 10 tonnes per year. Liquid refinery fuel tank bottom sludge andbundle cleaning sludge are generated in the storage tanks. The flow depends on the liquidrefinery fuel quality and the presence of fuel tank mixers. Dependending on the mode ofdraining, 20 - 80 % is oil.
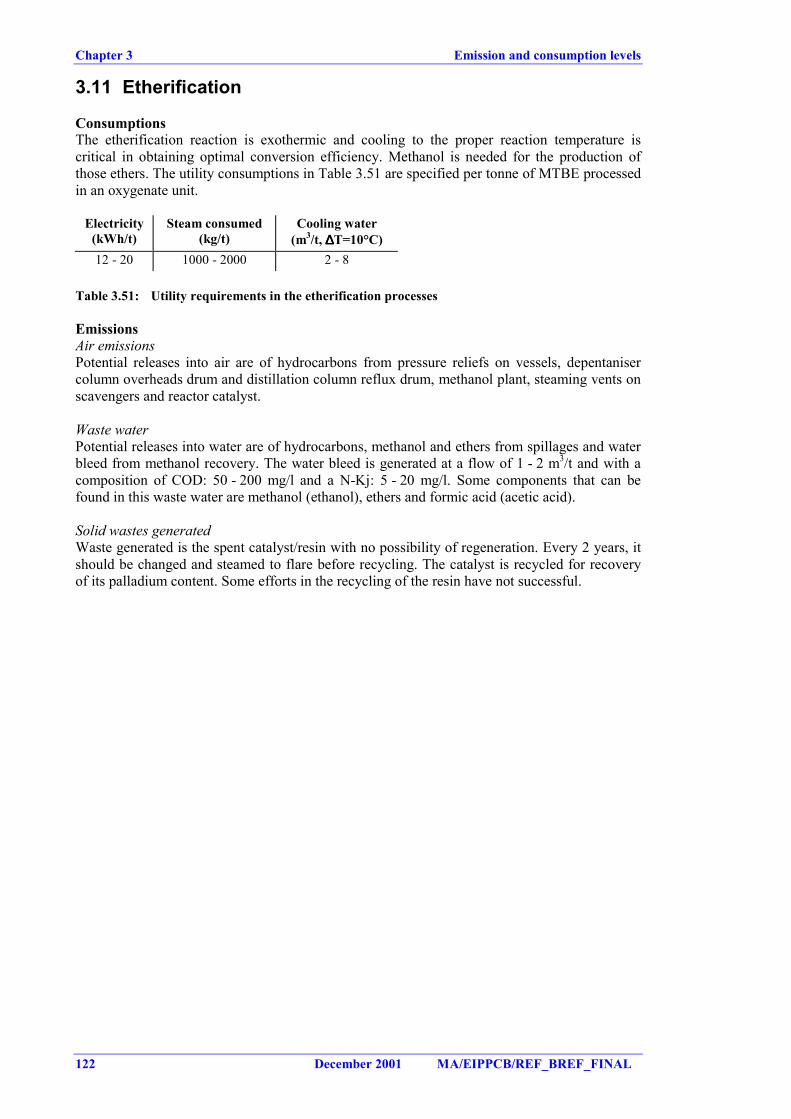
Chapter 3 Emission and consumption levels
122 December 2001 MA/EIPPCB/REF_BREF_FINAL
3.11 Etherification
ConsumptionsThe etherification reaction is exothermic and cooling to the proper reaction temperature iscritical in obtaining optimal conversion efficiency. Methanol is needed for the production ofthose ethers. The utility consumptions in Table 3.51 are specified per tonne of MTBE processedin an oxygenate unit.
Electricity(kWh/t)
Steam consumed(kg/t)
Cooling water(m3/t, ∆∆∆∆T=10°C)
12 - 20 1000 - 2000 2 - 8
Table 3.51: Utility requirements in the etherification processes
EmissionsAir emissionsPotential releases into air are of hydrocarbons from pressure reliefs on vessels, depentanisercolumn overheads drum and distillation column reflux drum, methanol plant, steaming vents onscavengers and reactor catalyst.
Waste waterPotential releases into water are of hydrocarbons, methanol and ethers from spillages and waterbleed from methanol recovery. The water bleed is generated at a flow of 1 - 2 m3/t and with acomposition of COD: 50 - 200 mg/l and a N-Kj: 5 - 20 mg/l. Some components that can befound in this waste water are methanol (ethanol), ethers and formic acid (acetic acid).
Solid wastes generatedWaste generated is the spent catalyst/resin with no possibility of regeneration. Every 2 years, itshould be changed and steamed to flare before recycling. The catalyst is recycled for recoveryof its palladium content. Some efforts in the recycling of the resin have not successful.
Emissions and consumption levels Chapter 3
MA/EIPPCB/REF_BREF_FINAL December 2001 123
3.12 Gas separation processes
ConsumptionsThe electricity demand of a gas separation process varies from 15 to 20 kWh per tonne offeedstock processed. Those processes also consume between 300 and 400 kg of steam per tonneof feedstock and between 1 and 2 m3/t of cooling water (∆T=10°C).
EmissionsAir emissionsPotential releases into air are of hydrocarbons from pressure reliefs on vessels, regeneration ventgas from molecular sieves, C1/C2 refinery fuel gas, refrigeration system leaks, storage andhandling operations.
Mercury if present in the feedstock of the refinery, will concentrate in overhead sections,particularly coolers. LPG, tops and naphtha coolers are most likely involved. Steaming thatcontaminated equipment may give mercury emissions to atmosphere. Upon opening equipmentfor inspection and maintenance mercury is sometimes found.
The final process in LPG production is the addition of some odorants. The odorants used aretypically volatile organic sulphur compounds, i.e. mercaptans and sulphides. Potential releasesinto air include leaks or spillages of odorant and vapours displaced during tank filling or fromthermal expansion of blanket gas. Also the products of incinerating or flaring displaced vapoursif these techniques use used, including a small release of sulphur dioxide from combustion ofthe odorant.
Waste waterPotential releases into water are spillages of hydrocarbons, H2S, NH3 and amines.
Solid wastes generatedPotential releases into land are of hydrocarbons from contaminated spent molecular sieves andfrom odorant addition including solid waste such as materials used to absorb odorant spillage.
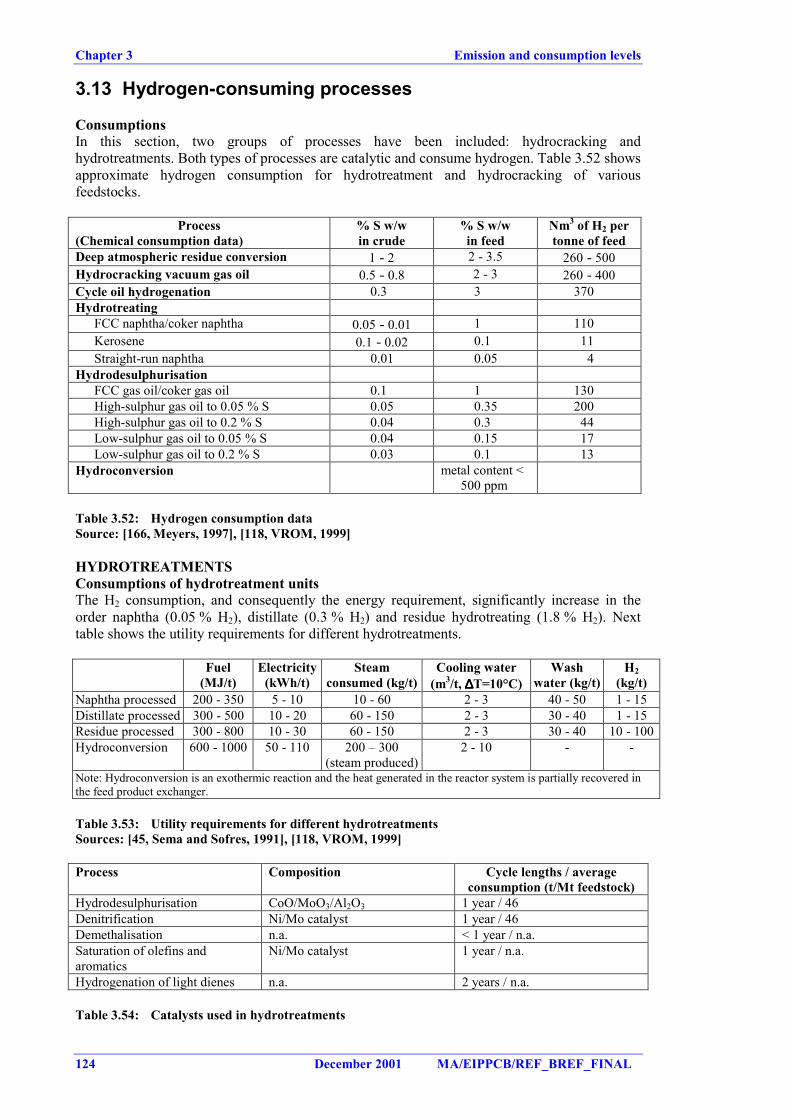
Chapter 3 Emission and consumption levels
124 December 2001 MA/EIPPCB/REF_BREF_FINAL
3.13 Hydrogen-consuming processes
ConsumptionsIn this section, two groups of processes have been included: hydrocracking andhydrotreatments. Both types of processes are catalytic and consume hydrogen. Table 3.52 showsapproximate hydrogen consumption for hydrotreatment and hydrocracking of variousfeedstocks.
Process(Chemical consumption data)
% S w/win crude
% S w/win feed
Nm3 of H2 pertonne of feed
Deep atmospheric residue conversion 1 - 2 2 - 3.5 260 - 500Hydrocracking vacuum gas oil 0.5 - 0.8 2 - 3 260 - 400Cycle oil hydrogenation 0.3 3 370Hydrotreating
FCC naphtha/coker naphtha 0.05 - 0.01 1 110Kerosene 0.1 - 0.02 0.1 11Straight-run naphtha 0.01 0.05 4
HydrodesulphurisationFCC gas oil/coker gas oil 0.1 1 130High-sulphur gas oil to 0.05 % S 0.05 0.35 200High-sulphur gas oil to 0.2 % S 0.04 0.3 44Low-sulphur gas oil to 0.05 % S 0.04 0.15 17Low-sulphur gas oil to 0.2 % S 0.03 0.1 13
Hydroconversion metal content <500 ppm
Table 3.52: Hydrogen consumption dataSource: [166, Meyers, 1997], [118, VROM, 1999]
HYDROTREATMENTSConsumptions of hydrotreatment unitsThe H2 consumption, and consequently the energy requirement, significantly increase in theorder naphtha (0.05 % H2), distillate (0.3 % H2) and residue hydrotreating (1.8 % H2). Nexttable shows the utility requirements for different hydrotreatments.
Fuel(MJ/t)
Electricity(kWh/t)
Steamconsumed (kg/t)
Cooling water(m3/t, ∆∆∆∆T=10°C)
Washwater (kg/t)
H2(kg/t)
Naphtha processed 200 - 350 5 - 10 10 - 60 2 - 3 40 - 50 1 - 15Distillate processed 300 - 500 10 - 20 60 - 150 2 - 3 30 - 40 1 - 15Residue processed 300 - 800 10 - 30 60 - 150 2 - 3 30 - 40 10 - 100Hydroconversion 600 - 1000 50 - 110 200 – 300
(steam produced)2 - 10 - -
Note: Hydroconversion is an exothermic reaction and the heat generated in the reactor system is partially recovered inthe feed product exchanger.
Table 3.53: Utility requirements for different hydrotreatmentsSources: [45, Sema and Sofres, 1991], [118, VROM, 1999]
Process Composition Cycle lengths / averageconsumption (t/Mt feedstock)
Hydrodesulphurisation CoO/MoO3/Al2O3 1 year / 46Denitrification Ni/Mo catalyst 1 year / 46Demethalisation n.a. < 1 year / n.a.Saturation of olefins andaromatics
Ni/Mo catalyst 1 year / n.a.
Hydrogenation of light dienes n.a. 2 years / n.a.
Table 3.54: Catalysts used in hydrotreatments
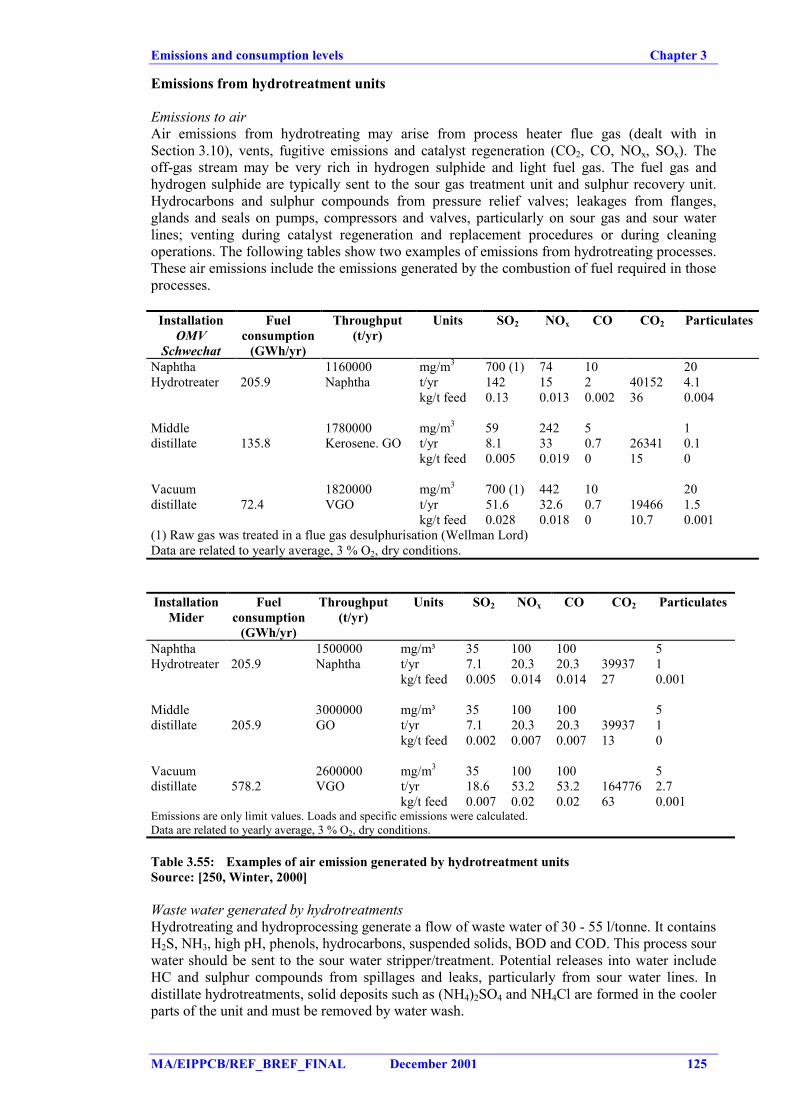
Emissions and consumption levels Chapter 3
MA/EIPPCB/REF_BREF_FINAL December 2001 125
Emissions from hydrotreatment units
Emissions to airAir emissions from hydrotreating may arise from process heater flue gas (dealt with inSection 3.10), vents, fugitive emissions and catalyst regeneration (CO2, CO, NOx, SOx). Theoff-gas stream may be very rich in hydrogen sulphide and light fuel gas. The fuel gas andhydrogen sulphide are typically sent to the sour gas treatment unit and sulphur recovery unit.Hydrocarbons and sulphur compounds from pressure relief valves; leakages from flanges,glands and seals on pumps, compressors and valves, particularly on sour gas and sour waterlines; venting during catalyst regeneration and replacement procedures or during cleaningoperations. The following tables show two examples of emissions from hydrotreating processes.These air emissions include the emissions generated by the combustion of fuel required in thoseprocesses.
InstallationOMV
Schwechat
Fuelconsumption
(GWh/yr)
Throughput(t/yr)
Units SO2 NOx CO CO2 Particulates
Naphtha 1160000 mg/m3 700 (1) 74 10 20Hydrotreater 205.9 Naphtha t/yr 142 15 2 40152 4.1
kg/t feed 0.13 0.013 0.002 36 0.004
Middle 1780000 mg/m3 59 242 5 1distillate 135.8 Kerosene. GO t/yr 8.1 33 0.7 26341 0.1
kg/t feed 0.005 0.019 0 15 0
Vacuum 1820000 mg/m3 700 (1) 442 10 20distillate 72.4 VGO t/yr 51.6 32.6 0.7 19466 1.5
kg/t feed 0.028 0.018 0 10.7 0.001(1) Raw gas was treated in a flue gas desulphurisation (Wellman Lord)Data are related to yearly average, 3 % O2, dry conditions.
InstallationMider
Fuelconsumption
(GWh/yr)
Throughput(t/yr)
Units SO2 NOx CO CO2 Particulates
Naphtha 1500000 mg/m³ 35 100 100 5Hydrotreater 205.9 Naphtha t/yr 7.1 20.3 20.3 39937 1
kg/t feed 0.005 0.014 0.014 27 0.001
Middle 3000000 mg/m³ 35 100 100 5distillate 205.9 GO t/yr 7.1 20.3 20.3 39937 1
kg/t feed 0.002 0.007 0.007 13 0
Vacuum 2600000 mg/m3 35 100 100 5distillate 578.2 VGO t/yr 18.6 53.2 53.2 164776 2.7
kg/t feed 0.007 0.02 0.02 63 0.001Emissions are only limit values. Loads and specific emissions were calculated.Data are related to yearly average, 3 % O2, dry conditions.
Table 3.55: Examples of air emission generated by hydrotreatment unitsSource: [250, Winter, 2000]
Waste water generated by hydrotreatmentsHydrotreating and hydroprocessing generate a flow of waste water of 30 - 55 l/tonne. It containsH2S, NH3, high pH, phenols, hydrocarbons, suspended solids, BOD and COD. This process sourwater should be sent to the sour water stripper/treatment. Potential releases into water includeHC and sulphur compounds from spillages and leaks, particularly from sour water lines. Indistillate hydrotreatments, solid deposits such as (NH4)2SO4 and NH4Cl are formed in the coolerparts of the unit and must be removed by water wash.
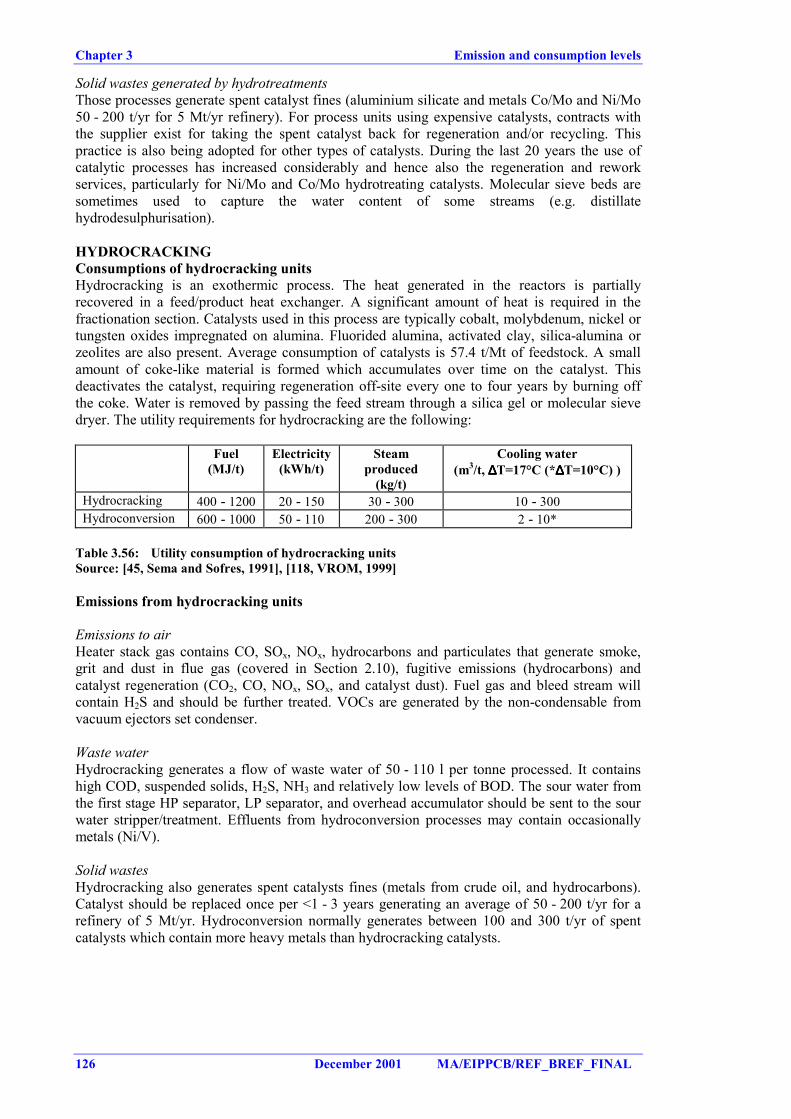
Chapter 3 Emission and consumption levels
126 December 2001 MA/EIPPCB/REF_BREF_FINAL
Solid wastes generated by hydrotreatmentsThose processes generate spent catalyst fines (aluminium silicate and metals Co/Mo and Ni/Mo50 - 200 t/yr for 5 Mt/yr refinery). For process units using expensive catalysts, contracts withthe supplier exist for taking the spent catalyst back for regeneration and/or recycling. Thispractice is also being adopted for other types of catalysts. During the last 20 years the use ofcatalytic processes has increased considerably and hence also the regeneration and reworkservices, particularly for Ni/Mo and Co/Mo hydrotreating catalysts. Molecular sieve beds aresometimes used to capture the water content of some streams (e.g. distillatehydrodesulphurisation).
HYDROCRACKINGConsumptions of hydrocracking unitsHydrocracking is an exothermic process. The heat generated in the reactors is partiallyrecovered in a feed/product heat exchanger. A significant amount of heat is required in thefractionation section. Catalysts used in this process are typically cobalt, molybdenum, nickel ortungsten oxides impregnated on alumina. Fluorided alumina, activated clay, silica-alumina orzeolites are also present. Average consumption of catalysts is 57.4 t/Mt of feedstock. A smallamount of coke-like material is formed which accumulates over time on the catalyst. Thisdeactivates the catalyst, requiring regeneration off-site every one to four years by burning offthe coke. Water is removed by passing the feed stream through a silica gel or molecular sievedryer. The utility requirements for hydrocracking are the following:
Fuel(MJ/t)
Electricity(kWh/t)
Steamproduced
(kg/t)
Cooling water(m3/t, ∆∆∆∆T=17°C (*∆∆∆∆T=10°C) )
Hydrocracking 400 - 1200 20 - 150 30 - 300 10 - 300Hydroconversion 600 - 1000 50 - 110 200 - 300 2 - 10*
Table 3.56: Utility consumption of hydrocracking unitsSource: [45, Sema and Sofres, 1991], [118, VROM, 1999]
Emissions from hydrocracking units
Emissions to airHeater stack gas contains CO, SOx, NOx, hydrocarbons and particulates that generate smoke,grit and dust in flue gas (covered in Section 2.10), fugitive emissions (hydrocarbons) andcatalyst regeneration (CO2, CO, NOx, SOx, and catalyst dust). Fuel gas and bleed stream willcontain H2S and should be further treated. VOCs are generated by the non-condensable fromvacuum ejectors set condenser.
Waste waterHydrocracking generates a flow of waste water of 50 - 110 l per tonne processed. It containshigh COD, suspended solids, H2S, NH3 and relatively low levels of BOD. The sour water fromthe first stage HP separator, LP separator, and overhead accumulator should be sent to the sourwater stripper/treatment. Effluents from hydroconversion processes may contain occasionallymetals (Ni/V).
Solid wastesHydrocracking also generates spent catalysts fines (metals from crude oil, and hydrocarbons).Catalyst should be replaced once per <1 - 3 years generating an average of 50 - 200 t/yr for arefinery of 5 Mt/yr. Hydroconversion normally generates between 100 and 300 t/yr of spentcatalysts which contain more heavy metals than hydrocracking catalysts.
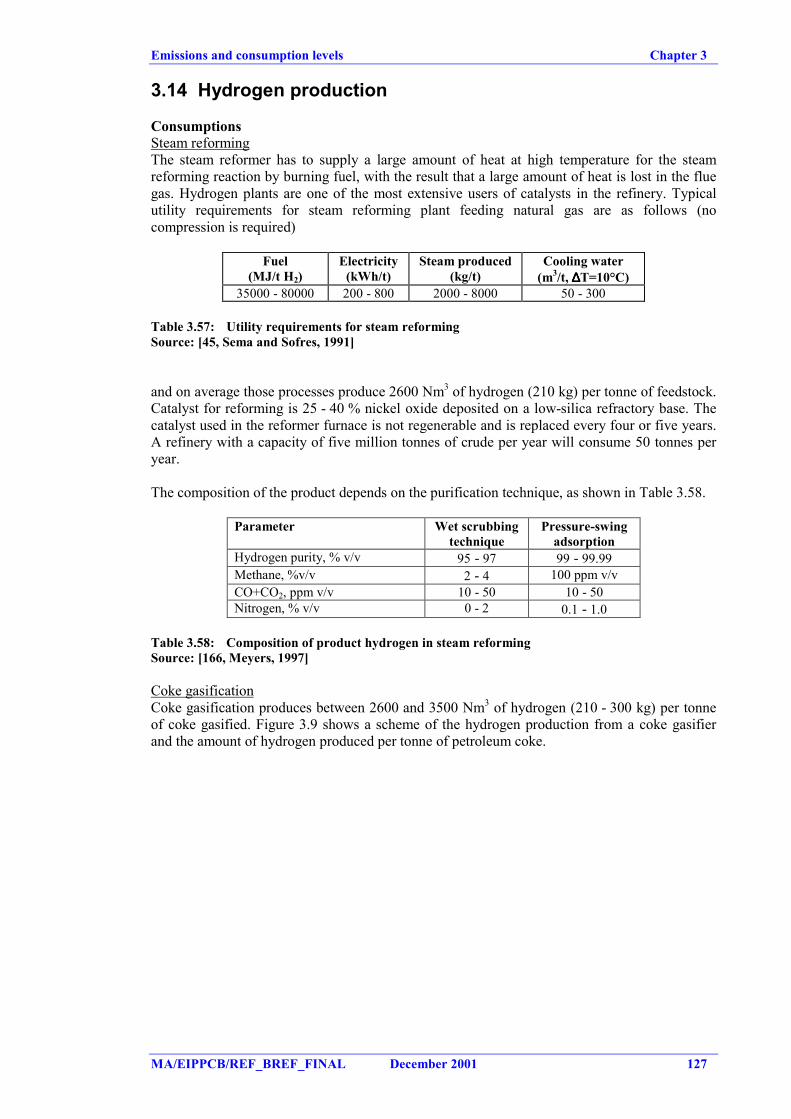
Emissions and consumption levels Chapter 3
MA/EIPPCB/REF_BREF_FINAL December 2001 127
3.14 Hydrogen production
ConsumptionsSteam reformingThe steam reformer has to supply a large amount of heat at high temperature for the steamreforming reaction by burning fuel, with the result that a large amount of heat is lost in the fluegas. Hydrogen plants are one of the most extensive users of catalysts in the refinery. Typicalutility requirements for steam reforming plant feeding natural gas are as follows (nocompression is required)
Fuel(MJ/t H2)
Electricity(kWh/t)
Steam produced(kg/t)
Cooling water(m3/t, ∆∆∆∆T=10°C)
35000 - 80000 200 - 800 2000 - 8000 50 - 300
Table 3.57: Utility requirements for steam reformingSource: [45, Sema and Sofres, 1991]
and on average those processes produce 2600 Nm3 of hydrogen (210 kg) per tonne of feedstock.Catalyst for reforming is 25 - 40 % nickel oxide deposited on a low-silica refractory base. Thecatalyst used in the reformer furnace is not regenerable and is replaced every four or five years.A refinery with a capacity of five million tonnes of crude per year will consume 50 tonnes peryear.
The composition of the product depends on the purification technique, as shown in Table 3.58.
Parameter Wet scrubbingtechnique
Pressure-swingadsorption
Hydrogen purity, % v/v 95 - 97 99 - 99.99Methane, %v/v 2 - 4 100 ppm v/vCO+CO2, ppm v/v 10 - 50 10 - 50Nitrogen, % v/v 0 - 2 0.1 - 1.0
Table 3.58: Composition of product hydrogen in steam reformingSource: [166, Meyers, 1997]
Coke gasificationCoke gasification produces between 2600 and 3500 Nm3 of hydrogen (210 - 300 kg) per tonneof coke gasified. Figure 3.9 shows a scheme of the hydrogen production from a coke gasifierand the amount of hydrogen produced per tonne of petroleum coke.
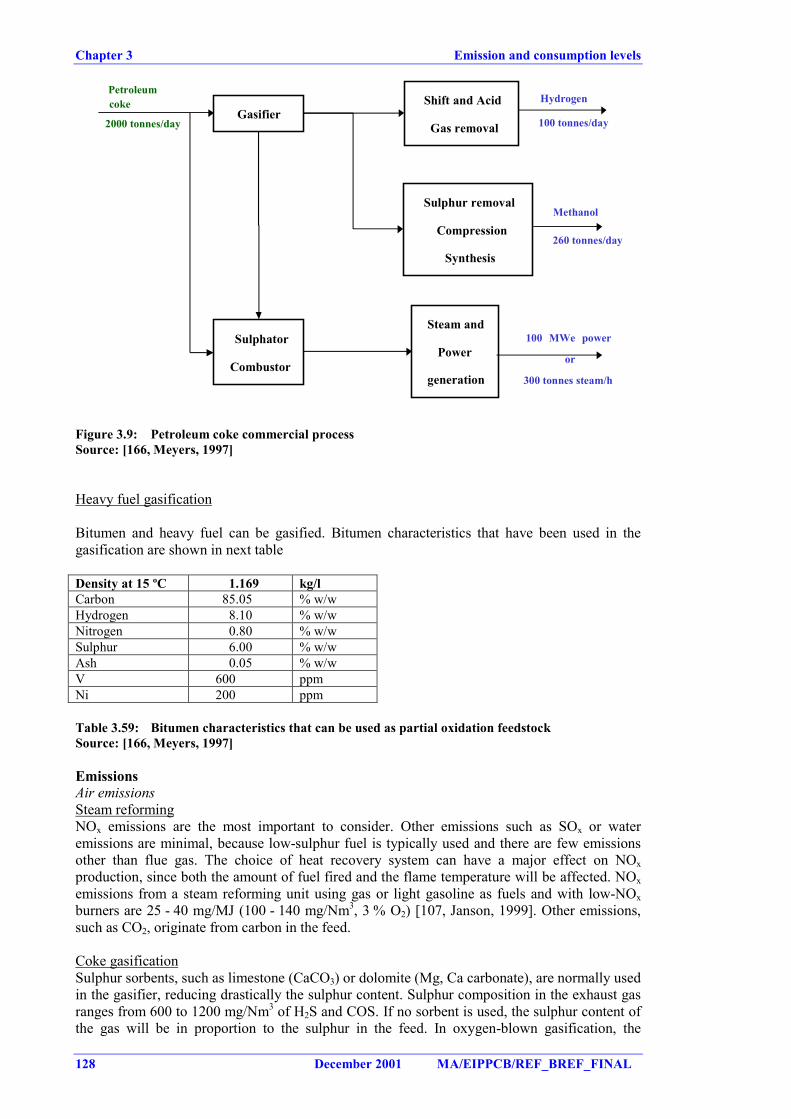
Chapter 3 Emission and consumption levels
128 December 2001 MA/EIPPCB/REF_BREF_FINAL
Gasifier
Sulphator
Combustor
Shift and Acid
Gas removal
Sulphur removal
Compression
Synthesis
Steam and
Power
generation
2000 tonnes/day
Petroleumcoke
100 tonnes/day
Hydrogen
260 tonnes/day
Methanol
100 MWe power
or
300 tonnes steam/h
Figure 3.9: Petroleum coke commercial processSource: [166, Meyers, 1997]
Heavy fuel gasification
Bitumen and heavy fuel can be gasified. Bitumen characteristics that have been used in thegasification are shown in next table
Density at 15 ºC 1.169 kg/lCarbon 85.05 % w/wHydrogen 8.10 % w/wNitrogen 0.80 % w/wSulphur 6.00 % w/wAsh 0.05 % w/wV 600 ppmNi 200 ppm
Table 3.59: Bitumen characteristics that can be used as partial oxidation feedstockSource: [166, Meyers, 1997]
EmissionsAir emissionsSteam reformingNOx emissions are the most important to consider. Other emissions such as SOx or wateremissions are minimal, because low-sulphur fuel is typically used and there are few emissionsother than flue gas. The choice of heat recovery system can have a major effect on NOxproduction, since both the amount of fuel fired and the flame temperature will be affected. NOxemissions from a steam reforming unit using gas or light gasoline as fuels and with low-NOxburners are 25 - 40 mg/MJ (100 - 140 mg/Nm3, 3 % O2) [107, Janson, 1999]. Other emissions,such as CO2, originate from carbon in the feed.
Coke gasificationSulphur sorbents, such as limestone (CaCO3) or dolomite (Mg, Ca carbonate), are normally usedin the gasifier, reducing drastically the sulphur content. Sulphur composition in the exhaust gasranges from 600 to 1200 mg/Nm3 of H2S and COS. If no sorbent is used, the sulphur content ofthe gas will be in proportion to the sulphur in the feed. In oxygen-blown gasification, the
Emissions and consumption levels Chapter 3
MA/EIPPCB/REF_BREF_FINAL December 2001 129
sulphur content will be about 10000 mg/Nm3 per percent sulphur in the feed. Ammonia isformed in the gasifier from the fuel-bound nitrogen. Ammonia in the product gas typicallycontained less than 5 % of the fuel-bound nitrogen when limestone was present in the gasifier.
Heavy fuel gasificationFor the Mider Refinery, data are available concerning air emissions of the partial oxidation unit:
Fuelconsumption(GWh/yr)
Throughput(t/yr)
Units SO2 NOx CO CO2 Particulates
mg/m3 35 158 100 52452.8 670000 t/yr 243.4 1099 695.5 475843 34.8
kg/t feed 0.363 1.64 1.038 710 0.052For the emissions only limit values are given. Loads and specific emissions were calculated.Data are related to yearly average, 3 % O2, dry conditions
Table 3.60: Example of air emissions generated by heavy fuel gasificationSource: [247, UBA Austria, 1998]
Solid wasteCoke gasificationThe solid waste from the process consists mainly of spent limestone and metals from thepetcoke. The particulates in product gas are removed in the barrier filter to a level of less than 5ppm. Volatile metals and alkalis tend to accumulate on the particulate as the gas is cooled. Theparticulates contain a high percentage of carbon and are usually sent with the ash to acombustor, where the remaining carbon is burned and the calcium sulphide is oxidised tosulphate. In this hot-gas clean-up system, there is no aqueous condensate produced, althoughsome may be produced in subsequent processing of the gas. The solid waste from the processconsists mainly of spent limestone and metals from the petcoke. After processing in thecombustor/sulphator, this material is send to disposal. Vanadium and nickel are found in mostpetroleum cokes in concentrations far greater than in coals or lignites. They remain in the ashproduct.
Hydrogen purificationSeveral adsorber beds are used, and the gas flow is periodically switched from one vessel toanother to allow regeneration of the adsorbent by pressure reduction and purging, thus releasingthe adsorbed components. The desorbed gas is normally accumulated in a vessel and used asfuel at a convenient location.
Chapter 3 Emission and consumption levels
130 December 2001 MA/EIPPCB/REF_BREF_FINAL
3.15 Integrated refinery management
Emissions from European Refineries as a wholeNext calculations are based on SO2 emissions from 76 European refineries (annual figures) in1998 (CONCAWE). The refinery emissions of 387 ktonnes comprise 7.4 % of the globalsulphur intake from feedstock (ranging from 2% to 10 %).
The breakdown of these annual emissions globally for the Western European sites is about:� 65 % from the combustion, representing a consumption of 28.5 % liquid fuel of 1.7 %S
content and 65 % of fuel gas� 13 % from the FCC units� 11 % from the sulphur recovery units� and the 11 complementary % from flare and miscellaneous sources.
Bubble values are based on calculated (*) yearly averages for all refineries participating: totalemissions divided by total (calculated stoichiometric required) flue gas emitted. Thus �(S unit1 +S unit 2 + S FCC + S SRU + S FLARE) divided by �(Volume flue gas resulting from burning differenttypes of fuels). The results are shown in next table:
Bubble values (mg/Nm3) European ATL area MED area NWE area OTH areaGlobal average 1600 > 2000 > 2200 < 700 < 400Combustion weightedaverage
1000 1290 1540 570 310
Geographical contributionof the areas 3(% FOE)
100 % 26 % 25 % 39 % 10 %
Expressed in term of “Global Average Bubble”, the mass of sulphur emitted per volume of flue gascalculated for the reporting sites represents an annual Western European average concentration of1600 mg/Nm3, all units of the refineries included for all types of refineries.
Expressed in term of “Combustion Bubble” - only due to fuels burned within the refinery site, thusexcluding FCC and SRU - the distribution of calculated annual value of each individual site isreported in a graph according to their respective and cumulative contribution to the total fuel use inEurope.
The geographical splitting in the three major zones confirms variation between areas,representative of these different operational conditions through Europe.
The results of last three surveys from years 1992, 1995 and 1998 are given in Figure 3.10 aweighted average for the annual bubble of 1000 mg/Nm3 is calculated representing a significantdecreases from previous surveys for which the average combustion bubble was 1350 mg/Nm3.
3 The four areas are :
- NWE - Northwest Europe (mainland France, United Kingdom, Belgium, the Netherlands, Germany andDenmark)- ATL - Atlantic (Ireland, Portugal and the Atlantic coasts of France and Spain)- MED - Mediterranean (Spain, the med coast of France, Italy and Greece)- OTH - “Others” (Norway, Sweden, Finland, Austria, Hungary and Switzerland).
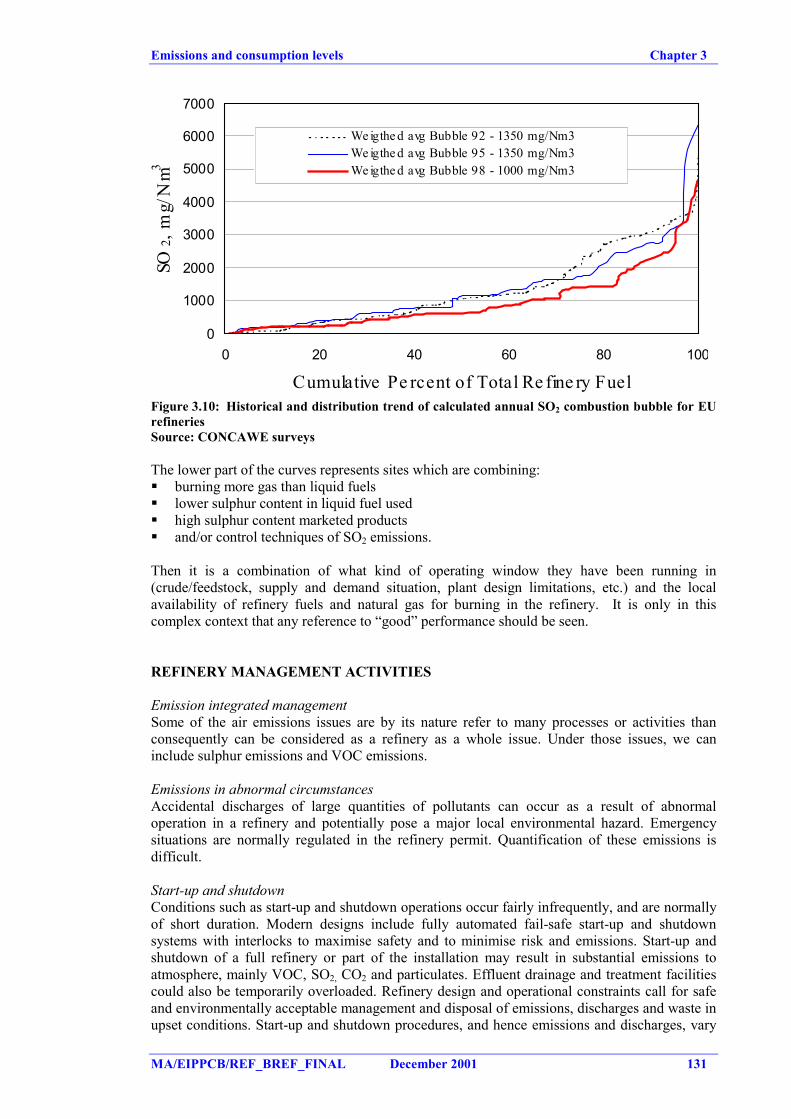
Emissions and consumption levels Chapter 3
MA/EIPPCB/REF_BREF_FINAL December 2001 131
0
1000
2000
3000
4000
5000
6000
7000
0 20 40 60 80 100
Cumulative Pe rcent of Total Re fine ry Fuel
SO2,
mg/
Nm3
We igthe d avg Bubble 92 - 1350 mg/Nm3We igthe d avg Bubble 95 - 1350 mg/Nm3We igthe d avg Bubble 98 - 1000 mg/Nm3
Figure 3.10: Historical and distribution trend of calculated annual SO2 combustion bubble for EUrefineriesSource: CONCAWE surveys
The lower part of the curves represents sites which are combining:� burning more gas than liquid fuels� lower sulphur content in liquid fuel used� high sulphur content marketed products� and/or control techniques of SO2 emissions.
Then it is a combination of what kind of operating window they have been running in(crude/feedstock, supply and demand situation, plant design limitations, etc.) and the localavailability of refinery fuels and natural gas for burning in the refinery. It is only in thiscomplex context that any reference to “good” performance should be seen.
REFINERY MANAGEMENT ACTIVITIES
Emission integrated managementSome of the air emissions issues are by its nature refer to many processes or activities thanconsequently can be considered as a refinery as a whole issue. Under those issues, we caninclude sulphur emissions and VOC emissions.
Emissions in abnormal circumstancesAccidental discharges of large quantities of pollutants can occur as a result of abnormaloperation in a refinery and potentially pose a major local environmental hazard. Emergencysituations are normally regulated in the refinery permit. Quantification of these emissions isdifficult.
Start-up and shutdownConditions such as start-up and shutdown operations occur fairly infrequently, and are normallyof short duration. Modern designs include fully automated fail-safe start-up and shutdownsystems with interlocks to maximise safety and to minimise risk and emissions. Start-up andshutdown of a full refinery or part of the installation may result in substantial emissions toatmosphere, mainly VOC, SO2, CO2 and particulates. Effluent drainage and treatment facilitiescould also be temporarily overloaded. Refinery design and operational constraints call for safeand environmentally acceptable management and disposal of emissions, discharges and waste inupset conditions. Start-up and shutdown procedures, and hence emissions and discharges, vary
Chapter 3 Emission and consumption levels
132 December 2001 MA/EIPPCB/REF_BREF_FINAL
according to the type of unit and the purpose of the shutdown. If a particular unit is only to bedepressurised and heavy components flushed out for a temporary stop, the emissions will be farless than if all equipment must be purged, steamed out and filled with air to allow workers toenter. Stringent safety and health care procedures are normal practice in present-day refineries.Not only own personnel but also contractors have to adhere to these procedures. Nevertheless,occasional accidents take place and safety precautions have to be practised regularly. Shut-downor blowdown can also have an impact on neighbouring dwellings (noise and light flaring).
Heat exchangers cleaningThe bundles of heat exchangers are cleaned periodically to remove accumulations of scale,sludge and any oily wastes. Because chromium has almost been eliminated as a cooling wateradditive, wastes generated from the cleaning of heat exchanger bundles no longer account for asignificant portion of the hazardous wastes generated at refining facilities. The sludge generated(oil, metals and suspended solids) may contain lead or chromium, although some refinerieswhich do not produce leaded gasoline and which use non-chrome corrosion inhibitors typicallydo not generate sludge that contains these constituents. Oily waste water is also generatedduring heat exchanger cleaning. VOC emissions may occur during those processes.
UTILITIES MANAGEMENT
1.- Water managementSurface water run-off is intermittent and will contain constituents from spills to the surface,leaks in equipment and any materials that may have collected in drains. Run-off surface wateralso includes water coming from crude and product storage tank roof drains.
The daily sanitary waste water production of an individual is about 120 litres, so the totalsanitary effluent of the refinery can be easily calculated. Normally this domestic effluent iscollected in a septic tank and then treated in the waste water treatment plant.
Ballast water is relevant to those refineries that have crude receipt facilities or handle bigproduct tankers or inland barges. This ballast water can be high in volume and salt content(seawater), and heavily polluted with oil. It can easily lead to an upset of existing effluenttreatment systems. The use of ballast water tanks is therefore an important equalisation tool forfeeding the water in a controlled way to either the process water system or the continuously oil-contaminated system, if the COD is lower than 100 ppm. As more and more tankers areequipped with segregated ballast tanks, the ballast water problem is slowly phasing out.
Water used in processing operations also accounts for a significant portion of the total wastewater. Process waste water arises from desalting crude oil, steam stripping operations, pumpgland cooling, product fractionator reflux drum drains and boiler blowdown. Because processwater often comes into direct contact with oil, it is usually highly contaminated.
The water usage depends both on purpose and complexity of the refinery. While there areusually opportunities to economise on waster use, the scope for major reductions in existingrefineries is sometimes limited. Data from 63 European refineries gave the following data onwater usage (data in annual averages).
Annual average fresh water usage: 4.2 million tonnes/yearRange 0.7 to 28 million tonnes/yearAverage refinery throughput: 6.9 million tonnes/yearAverage water usage per tonne throughput 0.62 tonne/tonne throughputRange 0.01 to 2.2 tonne/tonne throughput
Emissions and consumption levels Chapter 3
MA/EIPPCB/REF_BREF_FINAL December 2001 133
The fresh water consumption recorded is that taken from:� Potable (mains) water� River water� Privately extracted groundwater (including in some cases contaminated groundwater
extracted for purposes of treatment)
It does not include:� Recycled final effluent� Storm water� Ship’s ballast water� Waste water from adjoining facilities� Seawater
2.- Blowdown systemThe gaseous component of the blowdown system typically contains hydrocarbons, hydrogensulphide, ammonia, mercaptans, solvents and other constituents, and is either dischargeddirectly to the atmosphere or is combusted in a flare. The major air emissions from blowdownsystems are hydrocarbons in the case of direct discharge to the atmosphere and sulphur oxideswhen flared. The liquid is typically composed of mixtures of water and hydrocarbons containingsulphides, ammonia and other contaminants, which are sent to the waste water treatment plant.
Seal drum blowdown generates an effluent of 1 - 2 m3/h and 10 times as much in case ofemergency, with a composition of: COD, 500 - 2000 mg/l, H2S, 10 - 100mg/l, phenol, 5 - 30mg/l, NH3, oil and suspended solids, 50 - 100 mg/l
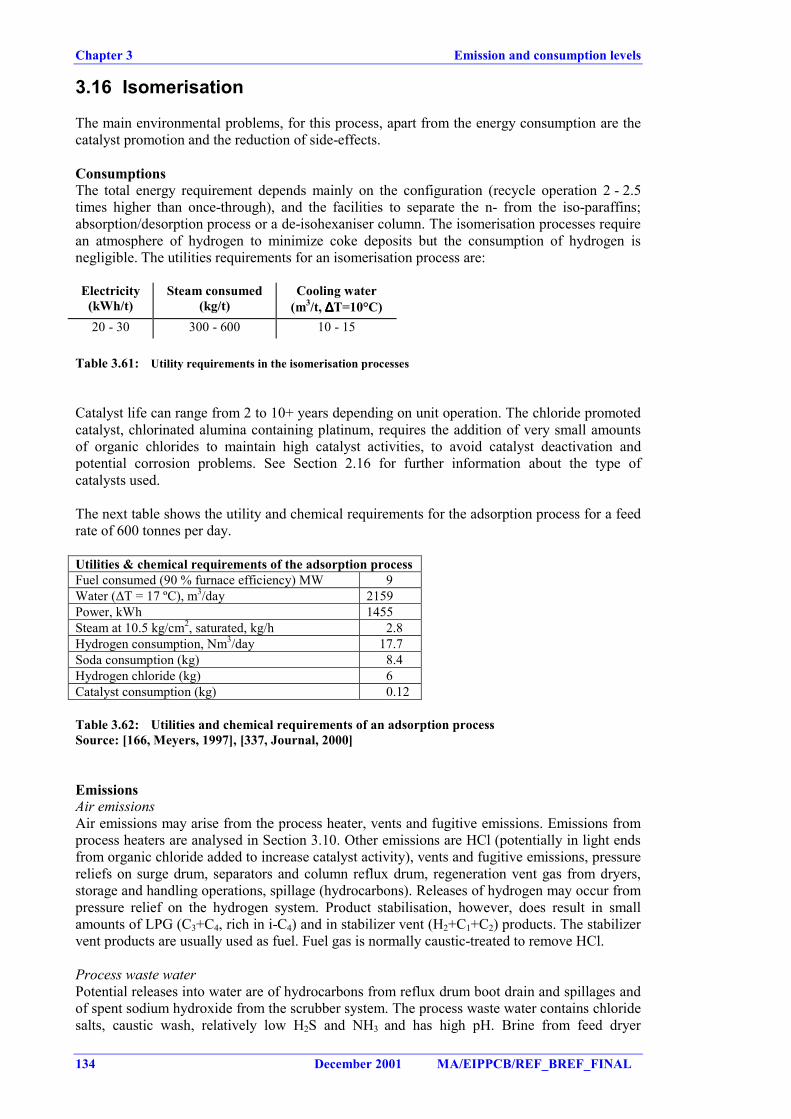
Chapter 3 Emission and consumption levels
134 December 2001 MA/EIPPCB/REF_BREF_FINAL
3.16 Isomerisation
The main environmental problems, for this process, apart from the energy consumption are thecatalyst promotion and the reduction of side-effects.
ConsumptionsThe total energy requirement depends mainly on the configuration (recycle operation 2 - 2.5times higher than once-through), and the facilities to separate the n- from the iso-paraffins;absorption/desorption process or a de-isohexaniser column. The isomerisation processes requirean atmosphere of hydrogen to minimize coke deposits but the consumption of hydrogen isnegligible. The utilities requirements for an isomerisation process are:
Electricity(kWh/t)
Steam consumed(kg/t)
Cooling water(m3/t, ∆∆∆∆T=10°C)
20 - 30 300 - 600 10 - 15
Table 3.61: Utility requirements in the isomerisation processes
Catalyst life can range from 2 to 10+ years depending on unit operation. The chloride promotedcatalyst, chlorinated alumina containing platinum, requires the addition of very small amountsof organic chlorides to maintain high catalyst activities, to avoid catalyst deactivation andpotential corrosion problems. See Section 2.16 for further information about the type ofcatalysts used.
The next table shows the utility and chemical requirements for the adsorption process for a feedrate of 600 tonnes per day.
Utilities & chemical requirements of the adsorption processFuel consumed (90 % furnace efficiency) MW 9Water (∆T = 17 ºC), m3/day 2159Power, kWh 1455Steam at 10.5 kg/cm2, saturated, kg/h 2.8Hydrogen consumption, Nm3/day 17.7Soda consumption (kg) 8.4Hydrogen chloride (kg) 6Catalyst consumption (kg) 0.12
Table 3.62: Utilities and chemical requirements of an adsorption processSource: [166, Meyers, 1997], [337, Journal, 2000]
EmissionsAir emissionsAir emissions may arise from the process heater, vents and fugitive emissions. Emissions fromprocess heaters are analysed in Section 3.10. Other emissions are HCl (potentially in light endsfrom organic chloride added to increase catalyst activity), vents and fugitive emissions, pressurereliefs on surge drum, separators and column reflux drum, regeneration vent gas from dryers,storage and handling operations, spillage (hydrocarbons). Releases of hydrogen may occur frompressure relief on the hydrogen system. Product stabilisation, however, does result in smallamounts of LPG (C3+C4, rich in i-C4) and in stabilizer vent (H2+C1+C2) products. The stabilizervent products are usually used as fuel. Fuel gas is normally caustic-treated to remove HCl.
Process waste waterPotential releases into water are of hydrocarbons from reflux drum boot drain and spillages andof spent sodium hydroxide from the scrubber system. The process waste water contains chloridesalts, caustic wash, relatively low H2S and NH3 and has high pH. Brine from feed dryer
Emissions and consumption levels Chapter 3
MA/EIPPCB/REF_BREF_FINAL December 2001 135
(desiccant, water free CaCl2) contains dissolved CaCl2 and hydrocarbons. Its flow depends onmoisture content and is usually drained to the effluent treatment plant.
Residual wastes generatedPotential releases into land are of hydrocarbons from spillages/contaminated molecular sievesand catalyst. Calcium chloride sludge (or other desiccants) is the waste generated in thisprocess. Catalyst used in these processes normally is regenerated by the catalyst manufacturers.Platinum is then recovered from the used catalyst off-site. Molecular sieves can be used as feeddrying agent. The flow and composition are plant-specific and the spent molecular sieves aredisposed of as non-regenerable solid waste.
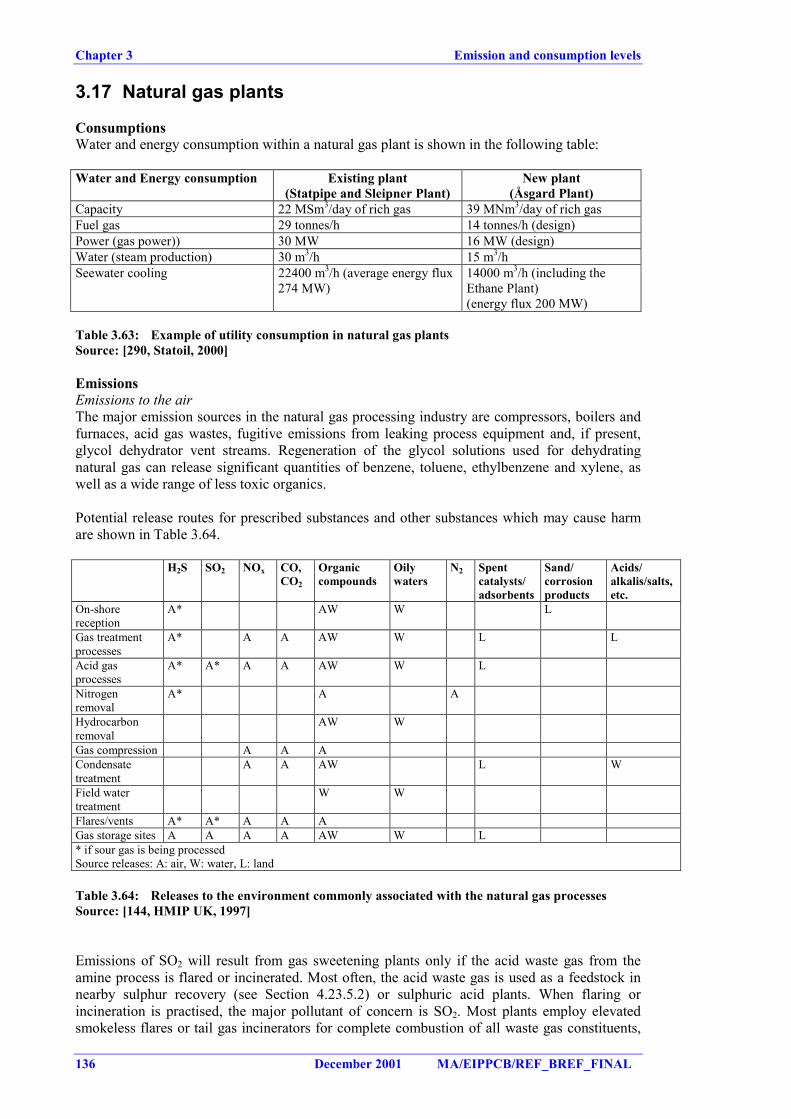
Chapter 3 Emission and consumption levels
136 December 2001 MA/EIPPCB/REF_BREF_FINAL
3.17 Natural gas plants
ConsumptionsWater and energy consumption within a natural gas plant is shown in the following table:
Water and Energy consumption Existing plant(Statpipe and Sleipner Plant)
New plant(Åsgard Plant)
Capacity 22 MSm3/day of rich gas 39 MNm3/day of rich gasFuel gas 29 tonnes/h 14 tonnes/h (design)Power (gas power)) 30 MW 16 MW (design)Water (steam production) 30 m3/h 15 m3/hSeewater cooling 22400 m3/h (average energy flux
274 MW)14000 m3/h (including theEthane Plant)(energy flux 200 MW)
Table 3.63: Example of utility consumption in natural gas plantsSource: [290, Statoil, 2000]
EmissionsEmissions to the airThe major emission sources in the natural gas processing industry are compressors, boilers andfurnaces, acid gas wastes, fugitive emissions from leaking process equipment and, if present,glycol dehydrator vent streams. Regeneration of the glycol solutions used for dehydratingnatural gas can release significant quantities of benzene, toluene, ethylbenzene and xylene, aswell as a wide range of less toxic organics.
Potential release routes for prescribed substances and other substances which may cause harmare shown in Table 3.64.
H2S SO2 NOx CO,CO2
Organiccompounds
Oilywaters
N2 Spentcatalysts/adsorbents
Sand/corrosionproducts
Acids/alkalis/salts,etc.
On-shorereception
A* AW W L
Gas treatmentprocesses
A* A A AW W L L
Acid gasprocesses
A* A* A A AW W L
Nitrogenremoval
A* A A
Hydrocarbonremoval
AW W
Gas compression A A ACondensatetreatment
A A AW L W
Field watertreatment
W W
Flares/vents A* A* A A AGas storage sites A A A A AW W L* if sour gas is being processedSource releases: A: air, W: water, L: land
Table 3.64: Releases to the environment commonly associated with the natural gas processesSource: [144, HMIP UK, 1997]
Emissions of SO2 will result from gas sweetening plants only if the acid waste gas from theamine process is flared or incinerated. Most often, the acid waste gas is used as a feedstock innearby sulphur recovery (see Section 4.23.5.2) or sulphuric acid plants. When flaring orincineration is practised, the major pollutant of concern is SO2. Most plants employ elevatedsmokeless flares or tail gas incinerators for complete combustion of all waste gas constituents,
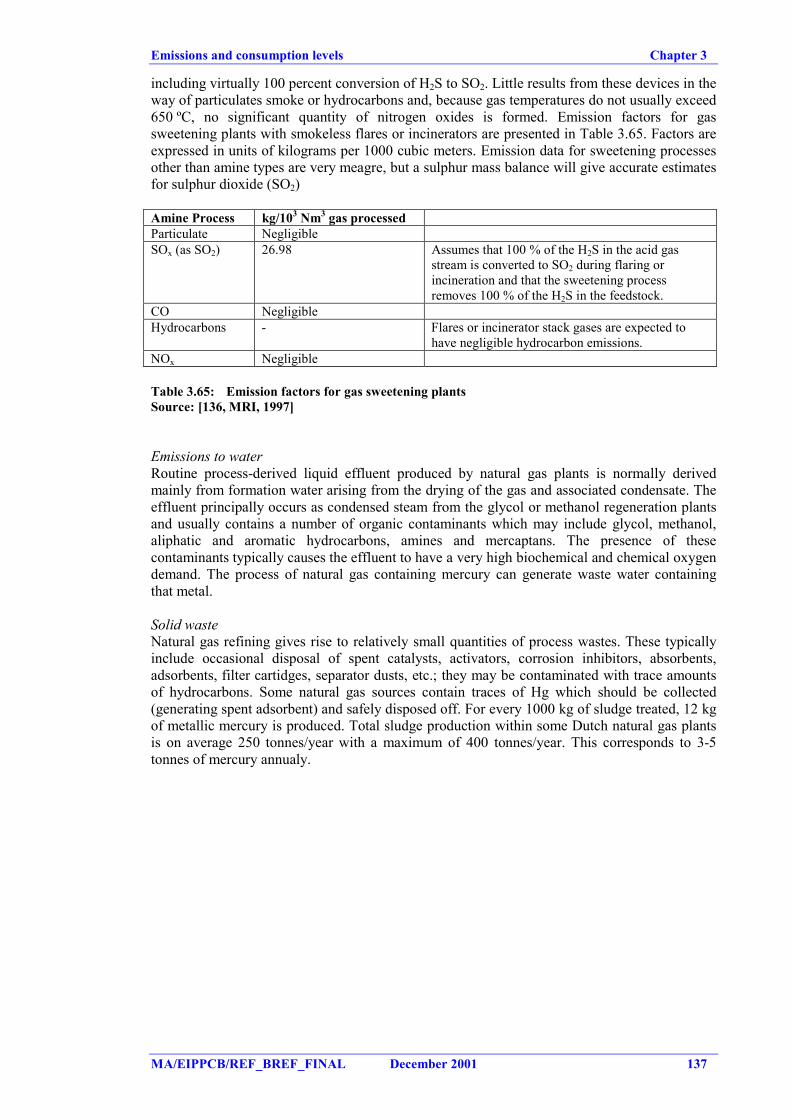
Emissions and consumption levels Chapter 3
MA/EIPPCB/REF_BREF_FINAL December 2001 137
including virtually 100 percent conversion of H2S to SO2. Little results from these devices in theway of particulates smoke or hydrocarbons and, because gas temperatures do not usually exceed650 ºC, no significant quantity of nitrogen oxides is formed. Emission factors for gassweetening plants with smokeless flares or incinerators are presented in Table 3.65. Factors areexpressed in units of kilograms per 1000 cubic meters. Emission data for sweetening processesother than amine types are very meagre, but a sulphur mass balance will give accurate estimatesfor sulphur dioxide (SO2)
Amine Process kg/103 Nm3 gas processedParticulate NegligibleSOx (as SO2) 26.98 Assumes that 100 % of the H2S in the acid gas
stream is converted to SO2 during flaring orincineration and that the sweetening processremoves 100 % of the H2S in the feedstock.
CO NegligibleHydrocarbons - Flares or incinerator stack gases are expected to
have negligible hydrocarbon emissions.NOx Negligible
Table 3.65: Emission factors for gas sweetening plantsSource: [136, MRI, 1997]
Emissions to waterRoutine process-derived liquid effluent produced by natural gas plants is normally derivedmainly from formation water arising from the drying of the gas and associated condensate. Theeffluent principally occurs as condensed steam from the glycol or methanol regeneration plantsand usually contains a number of organic contaminants which may include glycol, methanol,aliphatic and aromatic hydrocarbons, amines and mercaptans. The presence of thesecontaminants typically causes the effluent to have a very high biochemical and chemical oxygendemand. The process of natural gas containing mercury can generate waste water containingthat metal.
Solid wasteNatural gas refining gives rise to relatively small quantities of process wastes. These typicallyinclude occasional disposal of spent catalysts, activators, corrosion inhibitors, absorbents,adsorbents, filter cartidges, separator dusts, etc.; they may be contaminated with trace amountsof hydrocarbons. Some natural gas sources contain traces of Hg which should be collected(generating spent adsorbent) and safely disposed off. For every 1000 kg of sludge treated, 12 kgof metallic mercury is produced. Total sludge production within some Dutch natural gas plantsis on average 250 tonnes/year with a maximum of 400 tonnes/year. This corresponds to 3-5tonnes of mercury annualy.
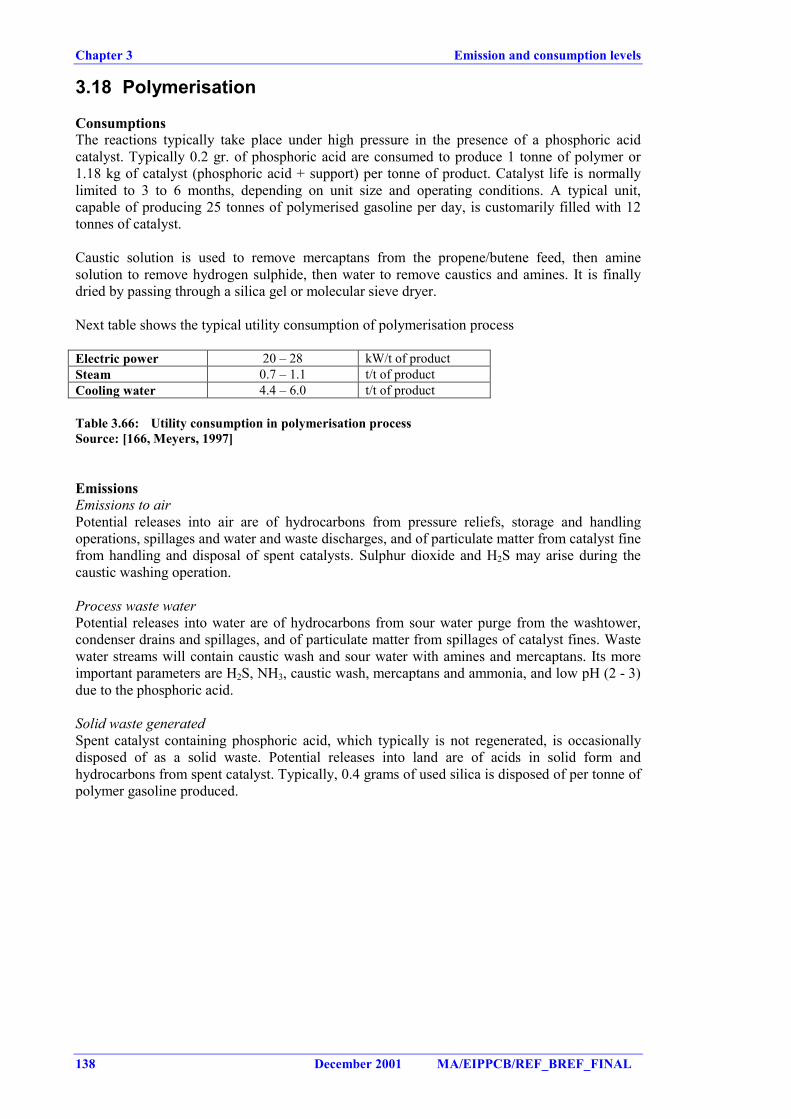
Chapter 3 Emission and consumption levels
138 December 2001 MA/EIPPCB/REF_BREF_FINAL
3.18 Polymerisation
ConsumptionsThe reactions typically take place under high pressure in the presence of a phosphoric acidcatalyst. Typically 0.2 gr. of phosphoric acid are consumed to produce 1 tonne of polymer or1.18 kg of catalyst (phosphoric acid + support) per tonne of product. Catalyst life is normallylimited to 3 to 6 months, depending on unit size and operating conditions. A typical unit,capable of producing 25 tonnes of polymerised gasoline per day, is customarily filled with 12tonnes of catalyst.
Caustic solution is used to remove mercaptans from the propene/butene feed, then aminesolution to remove hydrogen sulphide, then water to remove caustics and amines. It is finallydried by passing through a silica gel or molecular sieve dryer.
Next table shows the typical utility consumption of polymerisation process
Electric power 20 – 28 kW/t of productSteam 0.7 – 1.1 t/t of productCooling water 4.4 – 6.0 t/t of product
Table 3.66: Utility consumption in polymerisation processSource: [166, Meyers, 1997]
EmissionsEmissions to airPotential releases into air are of hydrocarbons from pressure reliefs, storage and handlingoperations, spillages and water and waste discharges, and of particulate matter from catalyst finefrom handling and disposal of spent catalysts. Sulphur dioxide and H2S may arise during thecaustic washing operation.
Process waste waterPotential releases into water are of hydrocarbons from sour water purge from the washtower,condenser drains and spillages, and of particulate matter from spillages of catalyst fines. Wastewater streams will contain caustic wash and sour water with amines and mercaptans. Its moreimportant parameters are H2S, NH3, caustic wash, mercaptans and ammonia, and low pH (2 - 3)due to the phosphoric acid.
Solid waste generatedSpent catalyst containing phosphoric acid, which typically is not regenerated, is occasionallydisposed of as a solid waste. Potential releases into land are of acids in solid form andhydrocarbons from spent catalyst. Typically, 0.4 grams of used silica is disposed of per tonne ofpolymer gasoline produced.
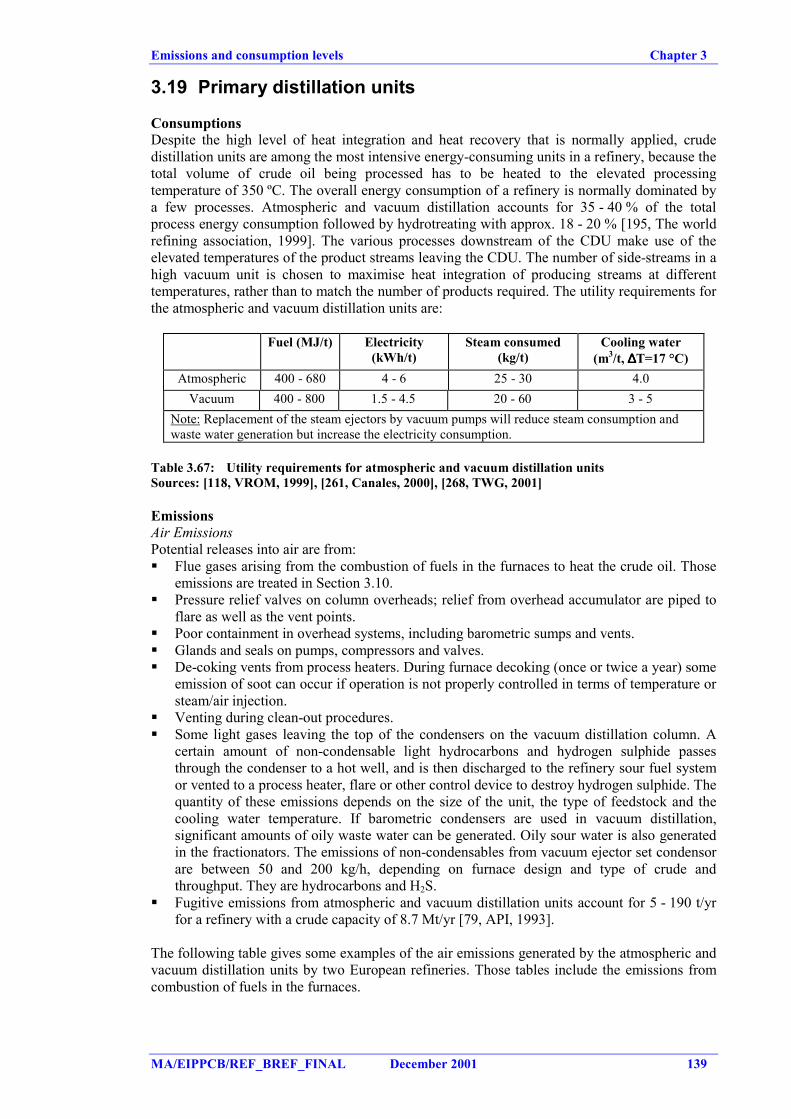
Emissions and consumption levels Chapter 3
MA/EIPPCB/REF_BREF_FINAL December 2001 139
3.19 Primary distillation units
ConsumptionsDespite the high level of heat integration and heat recovery that is normally applied, crudedistillation units are among the most intensive energy-consuming units in a refinery, because thetotal volume of crude oil being processed has to be heated to the elevated processingtemperature of 350 ºC. The overall energy consumption of a refinery is normally dominated bya few processes. Atmospheric and vacuum distillation accounts for 35 - 40 % of the totalprocess energy consumption followed by hydrotreating with approx. 18 - 20 % [195, The worldrefining association, 1999]. The various processes downstream of the CDU make use of theelevated temperatures of the product streams leaving the CDU. The number of side-streams in ahigh vacuum unit is chosen to maximise heat integration of producing streams at differenttemperatures, rather than to match the number of products required. The utility requirements forthe atmospheric and vacuum distillation units are:
Fuel (MJ/t) Electricity(kWh/t)
Steam consumed(kg/t)
Cooling water(m3/t, ∆∆∆∆T=17 °C)
Atmospheric 400 - 680 4 - 6 25 - 30 4.0Vacuum 400 - 800 1.5 - 4.5 20 - 60 3 - 5
Note: Replacement of the steam ejectors by vacuum pumps will reduce steam consumption andwaste water generation but increase the electricity consumption.
Table 3.67: Utility requirements for atmospheric and vacuum distillation unitsSources: [118, VROM, 1999], [261, Canales, 2000], [268, TWG, 2001]
EmissionsAir EmissionsPotential releases into air are from:� Flue gases arising from the combustion of fuels in the furnaces to heat the crude oil. Those
emissions are treated in Section 3.10.� Pressure relief valves on column overheads; relief from overhead accumulator are piped to
flare as well as the vent points.� Poor containment in overhead systems, including barometric sumps and vents.� Glands and seals on pumps, compressors and valves.� De-coking vents from process heaters. During furnace decoking (once or twice a year) some
emission of soot can occur if operation is not properly controlled in terms of temperature orsteam/air injection.
� Venting during clean-out procedures.� Some light gases leaving the top of the condensers on the vacuum distillation column. A
certain amount of non-condensable light hydrocarbons and hydrogen sulphide passesthrough the condenser to a hot well, and is then discharged to the refinery sour fuel systemor vented to a process heater, flare or other control device to destroy hydrogen sulphide. Thequantity of these emissions depends on the size of the unit, the type of feedstock and thecooling water temperature. If barometric condensers are used in vacuum distillation,significant amounts of oily waste water can be generated. Oily sour water is also generatedin the fractionators. The emissions of non-condensables from vacuum ejector set condensorare between 50 and 200 kg/h, depending on furnace design and type of crude andthroughput. They are hydrocarbons and H2S.
� Fugitive emissions from atmospheric and vacuum distillation units account for 5 - 190 t/yrfor a refinery with a crude capacity of 8.7 Mt/yr [79, API, 1993].
The following table gives some examples of the air emissions generated by the atmospheric andvacuum distillation units by two European refineries. Those tables include the emissions fromcombustion of fuels in the furnaces.
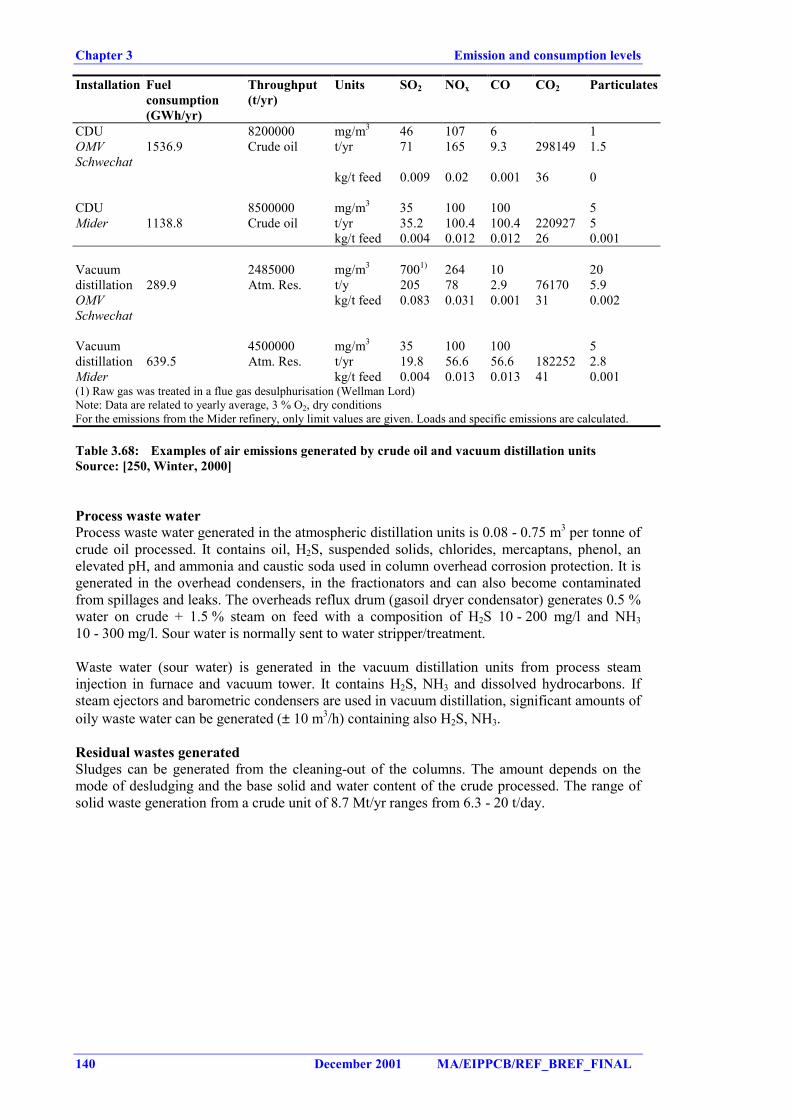
Chapter 3 Emission and consumption levels
140 December 2001 MA/EIPPCB/REF_BREF_FINAL
Installation Fuelconsumption(GWh/yr)
Throughput(t/yr)
Units SO2 NOx CO CO2 Particulates
CDU 8200000 mg/m3 46 107 6 1OMVSchwechat
1536.9 Crude oil t/yr 71 165 9.3 298149 1.5
kg/t feed 0.009 0.02 0.001 36 0
CDU 8500000 mg/m3 35 100 100 5Mider 1138.8 Crude oil t/yr 35.2 100.4 100.4 220927 5
kg/t feed 0.004 0.012 0.012 26 0.001
Vacuum 2485000 mg/m3 7001) 264 10 20distillation 289.9 Atm. Res. t/y 205 78 2.9 76170 5.9OMVSchwechat
kg/t feed 0.083 0.031 0.001 31 0.002
Vacuum 4500000 mg/m3 35 100 100 5distillation 639.5 Atm. Res. t/yr 19.8 56.6 56.6 182252 2.8Mider kg/t feed 0.004 0.013 0.013 41 0.001(1) Raw gas was treated in a flue gas desulphurisation (Wellman Lord)Note: Data are related to yearly average, 3 % O2, dry conditionsFor the emissions from the Mider refinery, only limit values are given. Loads and specific emissions are calculated.
Table 3.68: Examples of air emissions generated by crude oil and vacuum distillation unitsSource: [250, Winter, 2000]
Process waste waterProcess waste water generated in the atmospheric distillation units is 0.08 - 0.75 m3 per tonne ofcrude oil processed. It contains oil, H2S, suspended solids, chlorides, mercaptans, phenol, anelevated pH, and ammonia and caustic soda used in column overhead corrosion protection. It isgenerated in the overhead condensers, in the fractionators and can also become contaminatedfrom spillages and leaks. The overheads reflux drum (gasoil dryer condensator) generates 0.5 %water on crude + 1.5 % steam on feed with a composition of H2S 10 - 200 mg/l and NH310 - 300 mg/l. Sour water is normally sent to water stripper/treatment.
Waste water (sour water) is generated in the vacuum distillation units from process steaminjection in furnace and vacuum tower. It contains H2S, NH3 and dissolved hydrocarbons. Ifsteam ejectors and barometric condensers are used in vacuum distillation, significant amounts ofoily waste water can be generated (± 10 m3/h) containing also H2S, NH3.
Residual wastes generatedSludges can be generated from the cleaning-out of the columns. The amount depends on themode of desludging and the base solid and water content of the crude processed. The range ofsolid waste generation from a crude unit of 8.7 Mt/yr ranges from 6.3 - 20 t/day.
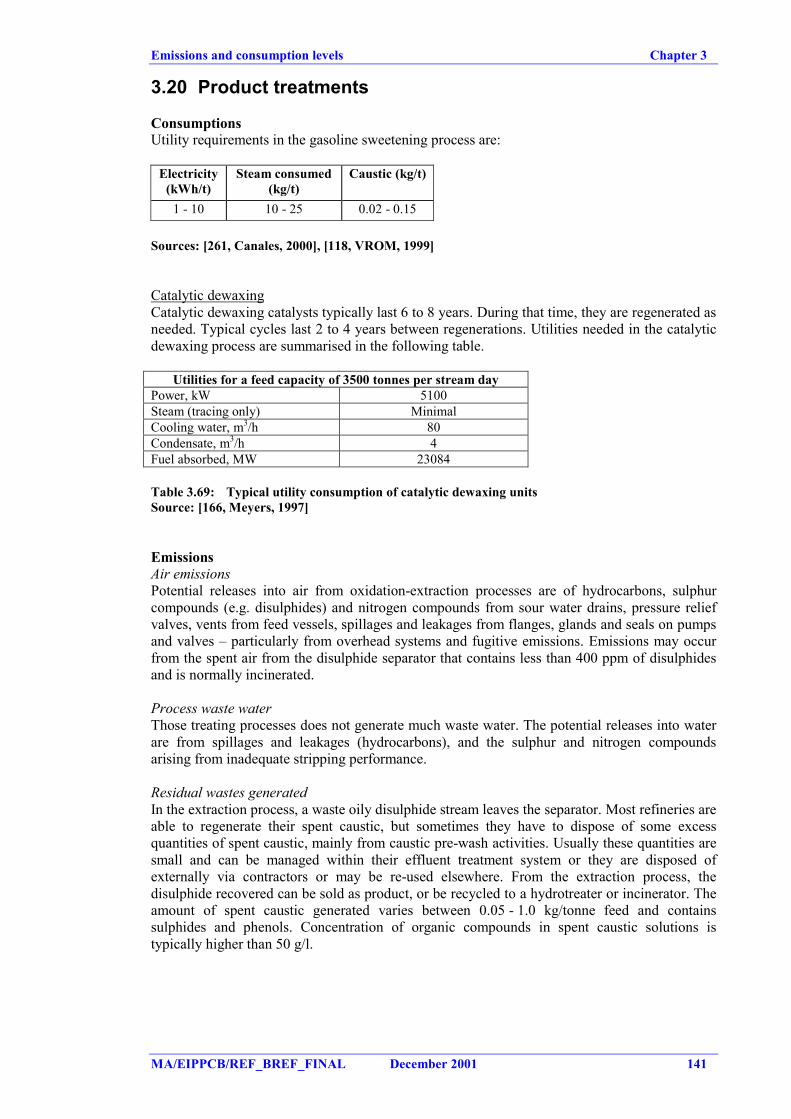
Emissions and consumption levels Chapter 3
MA/EIPPCB/REF_BREF_FINAL December 2001 141
3.20 Product treatments
ConsumptionsUtility requirements in the gasoline sweetening process are:
Electricity(kWh/t)
Steam consumed(kg/t)
Caustic (kg/t)
1 - 10 10 - 25 0.02 - 0.15
Sources: [261, Canales, 2000], [118, VROM, 1999]
Catalytic dewaxingCatalytic dewaxing catalysts typically last 6 to 8 years. During that time, they are regenerated asneeded. Typical cycles last 2 to 4 years between regenerations. Utilities needed in the catalyticdewaxing process are summarised in the following table.
Utilities for a feed capacity of 3500 tonnes per stream dayPower, kW 5100Steam (tracing only) MinimalCooling water, m3/h 80Condensate, m3/h 4Fuel absorbed, MW 23084
Table 3.69: Typical utility consumption of catalytic dewaxing unitsSource: [166, Meyers, 1997]
EmissionsAir emissionsPotential releases into air from oxidation-extraction processes are of hydrocarbons, sulphurcompounds (e.g. disulphides) and nitrogen compounds from sour water drains, pressure reliefvalves, vents from feed vessels, spillages and leakages from flanges, glands and seals on pumpsand valves – particularly from overhead systems and fugitive emissions. Emissions may occurfrom the spent air from the disulphide separator that contains less than 400 ppm of disulphidesand is normally incinerated.
Process waste waterThose treating processes does not generate much waste water. The potential releases into waterare from spillages and leakages (hydrocarbons), and the sulphur and nitrogen compoundsarising from inadequate stripping performance.
Residual wastes generatedIn the extraction process, a waste oily disulphide stream leaves the separator. Most refineries areable to regenerate their spent caustic, but sometimes they have to dispose of some excessquantities of spent caustic, mainly from caustic pre-wash activities. Usually these quantities aresmall and can be managed within their effluent treatment system or they are disposed ofexternally via contractors or may be re-used elsewhere. From the extraction process, thedisulphide recovered can be sold as product, or be recycled to a hydrotreater or incinerator. Theamount of spent caustic generated varies between 0.05 - 1.0 kg/tonne feed and containssulphides and phenols. Concentration of organic compounds in spent caustic solutions istypically higher than 50 g/l.
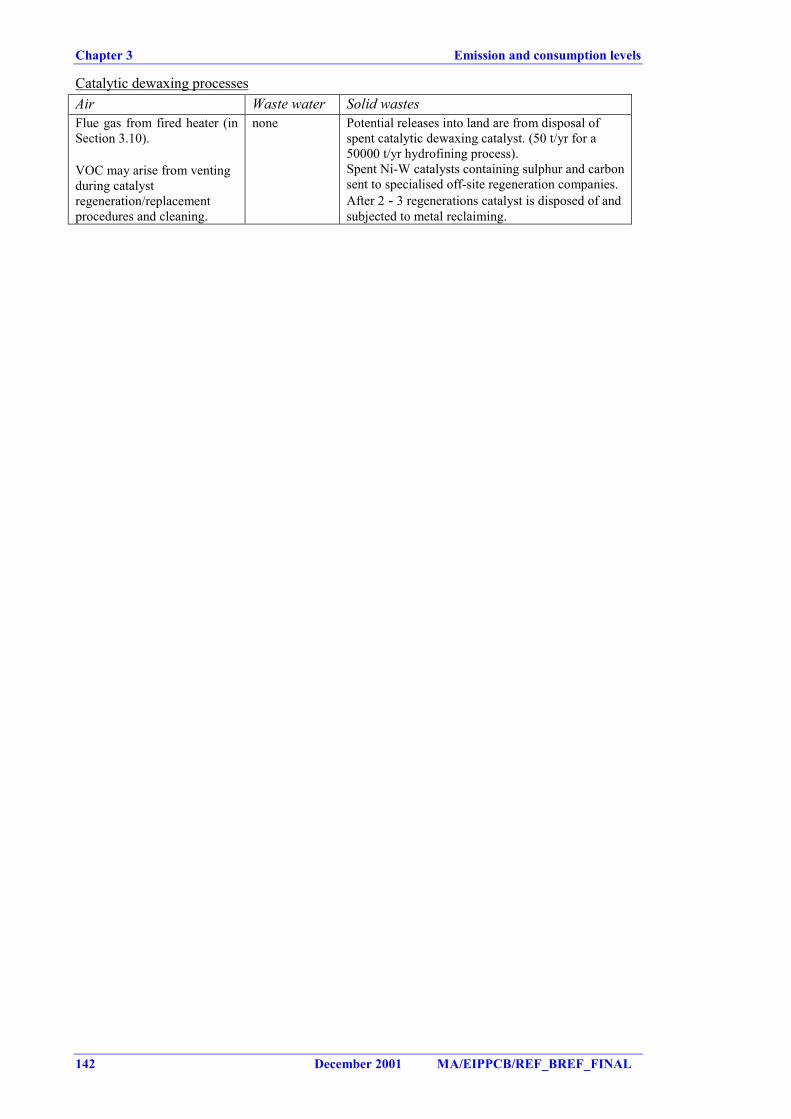
Chapter 3 Emission and consumption levels
142 December 2001 MA/EIPPCB/REF_BREF_FINAL
Catalytic dewaxing processesAir Waste water Solid wastesFlue gas from fired heater (inSection 3.10).
VOC may arise from ventingduring catalystregeneration/replacementprocedures and cleaning.
none Potential releases into land are from disposal ofspent catalytic dewaxing catalyst. (50 t/yr for a50000 t/yr hydrofining process).Spent Ni-W catalysts containing sulphur and carbonsent to specialised off-site regeneration companies.After 2 - 3 regenerations catalyst is disposed of andsubjected to metal reclaiming.
Emissions and consumption levels Chapter 3
MA/EIPPCB/REF_BREF_FINAL December 2001 143
3.21 Storage and handling of refinery materials
ConsumptionsNo energy or process material is required for balancing lines, double seals, floating roofs ontanks. However, some tanks need mixers (a heavy user of power) and some need heating too.Handling refinery materials also needs electricity for the pumps that move the materials throughthe pipes.
EmissionsAir EmissionsAir emissions, and more specifically VOC emissions, are the main emissions that occur duringthe storage and handling activities of refinery materials. Emissions from hydrocarbon liquids instorage occur because of evaporative loss of the liquid during storage and as a result of changesin the liquid level. Even if equipped with floating tops, storage tanks account for considerableVOC emissions at petroleum refineries. Moreover, fugitive emissions in storage systems aremainly from imperfect seals or from tank fittings. A study of petroleum refinery emissionsfound that the majority of tank losses occurred through tank seals on gasoline storage tanks[108, USAEPA, 1995]. However, it is generally the case that the amount of emissions dependsmuch more on the vapour pressure of the product (higher vapour pressure tend to producehigher VOC emissions) than on the type of tank.
VOC emissions from storage represent more than 40 % of the total VOC emissions and arenormally the biggest emitter in a refinery. The emissions from tanks have been estimated byusing API estimations [245, API, 1983/1989/1990]. These estimations suggests an annualemission of 320 tonnes per year from the storage systems, a much lower figure than the onecalculated from the DIAL measurements: 1900 tonnes per year for a refinery processing 11million tonnes per year [107, Janson, 1999]. However, API methods have been updated andstorage losses can be predicted with acceptable accuracy [259, Dekkers, 2000]. A CONCAWEstudy [229, Smithers, 1995] which was the only trial of DIAL where measurements wereconducted over a reasonably long period showed that there was good agreement between DIALand the latest API estimation methods when the test times were long enough.
When transferring liquids to vessels at atmospheric pressure, the vapour phase (often air, butalso inerts) in the receiving vessel is often emitted to atmosphere. Such loading operations arerecognised as having an impact on the environment due to the presence of VOC. VOCemissions from blending come from blending tanks, valves, pumps and mixing operations. Theamount depends on design and maintenance of the systems. Although barge loading is not afactor for all refineries, it is an important emissions source for many facilities. One of the largestsources of VOC emissions identified during the Amoco/USAEPA study was fugitive emissionsfrom loading of tanker barges. It has been estimated that during loading of products with highpartial pressure, 0.05 % of the throughput can be emitted to the air.
VOC emissions to the air from cavern storage of hydrocarbon materials can be preventedconnecting the gas spaces of several caverns. So the breathing gases when filling one cavern areleaded to the other caverns. In case of only one cavern the breathing gases must be leaded to theair. However the VOC-emissions in this case are low because the temperature of storage is low(5 - 10 ºC).
Waste waterLeaking flanges and valves may contaminate rainwater. The amount depends on themaintenance service. Liquid tank bottoms (primarily water and oil emulsions) are periodicallydrawn off to prevent their continued build up. That waste water is contaminated with tankproduct. Oil levels up to 5g/l in tank water bottoms can be found [101, World Bank, 1998].However, if the draw off rate of the water is too high, oil can be entrained with the water,thereby giving a false high reading of oil in the water.
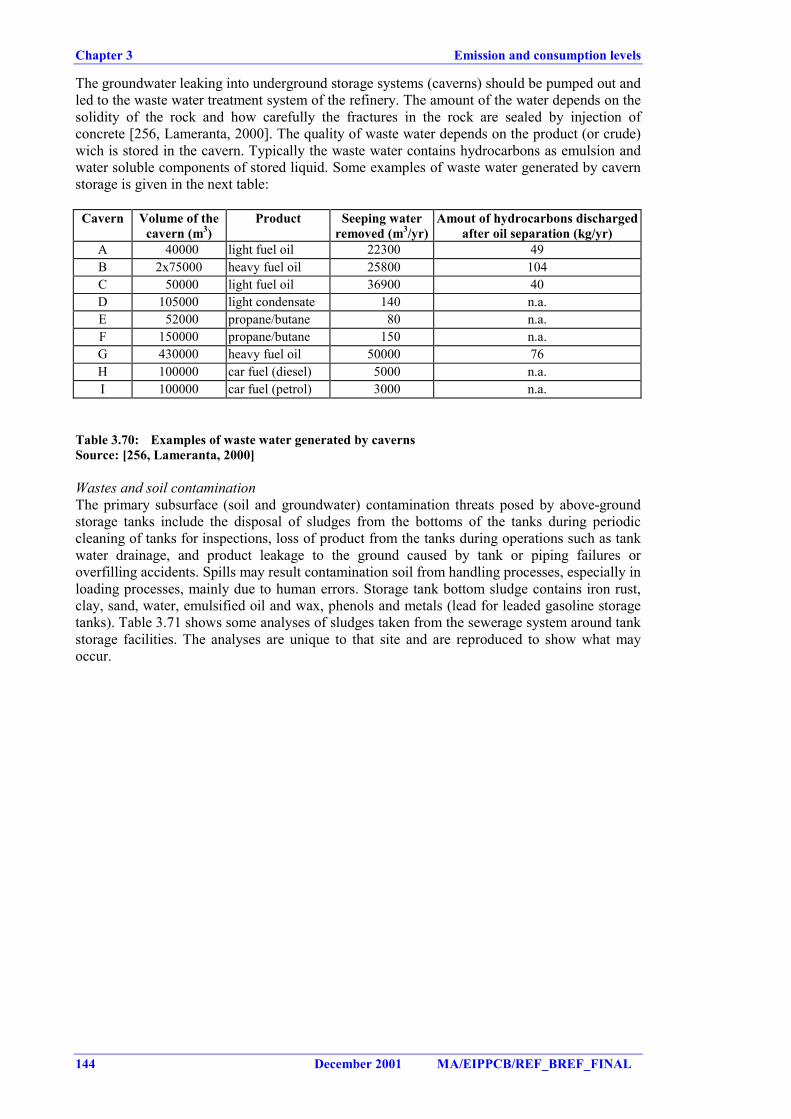
Chapter 3 Emission and consumption levels
144 December 2001 MA/EIPPCB/REF_BREF_FINAL
The groundwater leaking into underground storage systems (caverns) should be pumped out andled to the waste water treatment system of the refinery. The amount of the water depends on thesolidity of the rock and how carefully the fractures in the rock are sealed by injection ofconcrete [256, Lameranta, 2000]. The quality of waste water depends on the product (or crude)wich is stored in the cavern. Typically the waste water contains hydrocarbons as emulsion andwater soluble components of stored liquid. Some examples of waste water generated by cavernstorage is given in the next table:
Cavern Volume of thecavern (m3)
Product Seeping waterremoved (m3/yr)
Amout of hydrocarbons dischargedafter oil separation (kg/yr)
A 40000 light fuel oil 22300 49B 2x75000 heavy fuel oil 25800 104C 50000 light fuel oil 36900 40D 105000 light condensate 140 n.a.E 52000 propane/butane 80 n.a.F 150000 propane/butane 150 n.a.G 430000 heavy fuel oil 50000 76H 100000 car fuel (diesel) 5000 n.a.I 100000 car fuel (petrol) 3000 n.a.
Table 3.70: Examples of waste water generated by cavernsSource: [256, Lameranta, 2000]
Wastes and soil contaminationThe primary subsurface (soil and groundwater) contamination threats posed by above-groundstorage tanks include the disposal of sludges from the bottoms of the tanks during periodiccleaning of tanks for inspections, loss of product from the tanks during operations such as tankwater drainage, and product leakage to the ground caused by tank or piping failures oroverfilling accidents. Spills may result contamination soil from handling processes, especially inloading processes, mainly due to human errors. Storage tank bottom sludge contains iron rust,clay, sand, water, emulsified oil and wax, phenols and metals (lead for leaded gasoline storagetanks). Table 3.71 shows some analyses of sludges taken from the sewerage system around tankstorage facilities. The analyses are unique to that site and are reproduced to show what mayoccur.
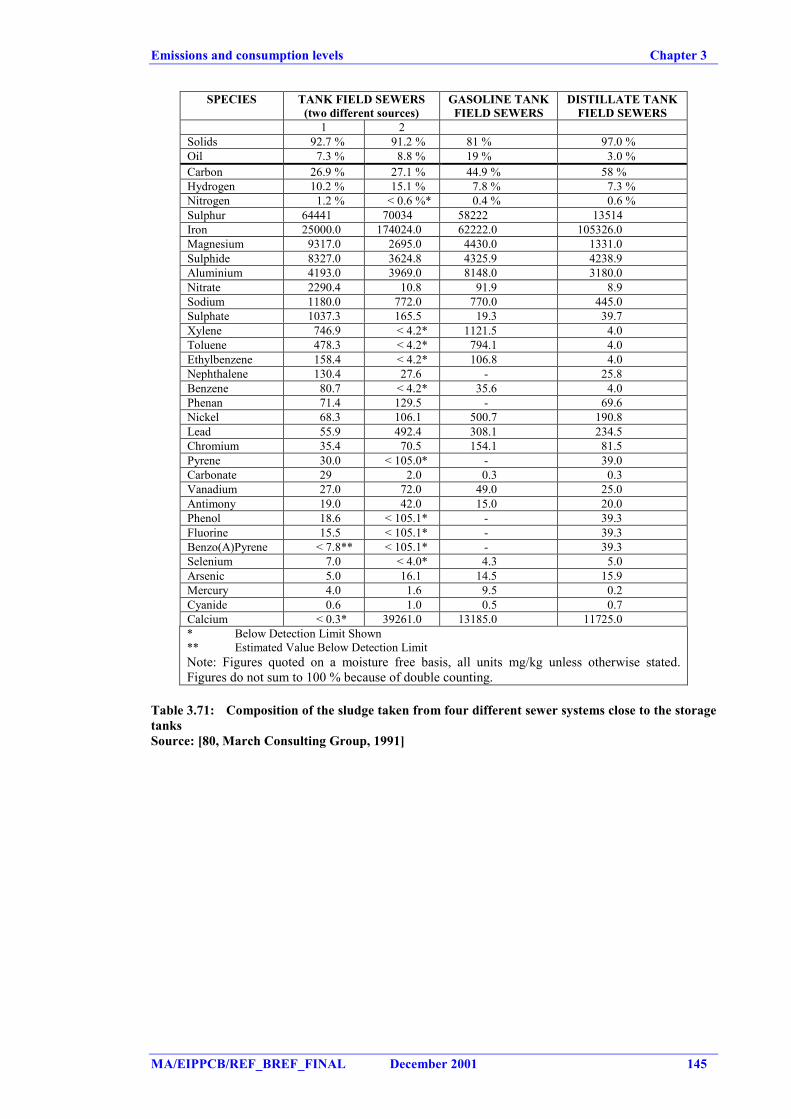
Emissions and consumption levels Chapter 3
MA/EIPPCB/REF_BREF_FINAL December 2001 145
SPECIES TANK FIELD SEWERS(two different sources)
GASOLINE TANKFIELD SEWERS
DISTILLATE TANKFIELD SEWERS
1 2Solids 92.7 % 91.2 % 81 % 97.0 %Oil 7.3 % 8.8 % 19 % 3.0 %Carbon 26.9 % 27.1 % 44.9 % 58 %Hydrogen 10.2 % 15.1 % 7.8 % 7.3 %Nitrogen 1.2 % < 0.6 %* 0.4 % 0.6 %Sulphur 64441 70034 58222 13514Iron 25000.0 174024.0 62222.0 105326.0Magnesium 9317.0 2695.0 4430.0 1331.0Sulphide 8327.0 3624.8 4325.9 4238.9Aluminium 4193.0 3969.0 8148.0 3180.0Nitrate 2290.4 10.8 91.9 8.9Sodium 1180.0 772.0 770.0 445.0Sulphate 1037.3 165.5 19.3 39.7Xylene 746.9 < 4.2* 1121.5 4.0Toluene 478.3 < 4.2* 794.1 4.0Ethylbenzene 158.4 < 4.2* 106.8 4.0Nephthalene 130.4 27.6 - 25.8Benzene 80.7 < 4.2* 35.6 4.0Phenan 71.4 129.5 - 69.6Nickel 68.3 106.1 500.7 190.8Lead 55.9 492.4 308.1 234.5Chromium 35.4 70.5 154.1 81.5Pyrene 30.0 < 105.0* - 39.0Carbonate 29 2.0 0.3 0.3Vanadium 27.0 72.0 49.0 25.0Antimony 19.0 42.0 15.0 20.0Phenol 18.6 < 105.1* - 39.3Fluorine 15.5 < 105.1* - 39.3Benzo(A)Pyrene < 7.8** < 105.1* - 39.3Selenium 7.0 < 4.0* 4.3 5.0Arsenic 5.0 16.1 14.5 15.9Mercury 4.0 1.6 9.5 0.2Cyanide 0.6 1.0 0.5 0.7Calcium < 0.3* 39261.0 13185.0 11725.0* Below Detection Limit Shown** Estimated Value Below Detection LimitNote: Figures quoted on a moisture free basis, all units mg/kg unless otherwise stated.Figures do not sum to 100 % because of double counting.
Table 3.71: Composition of the sludge taken from four different sewer systems close to the storagetanksSource: [80, March Consulting Group, 1991]
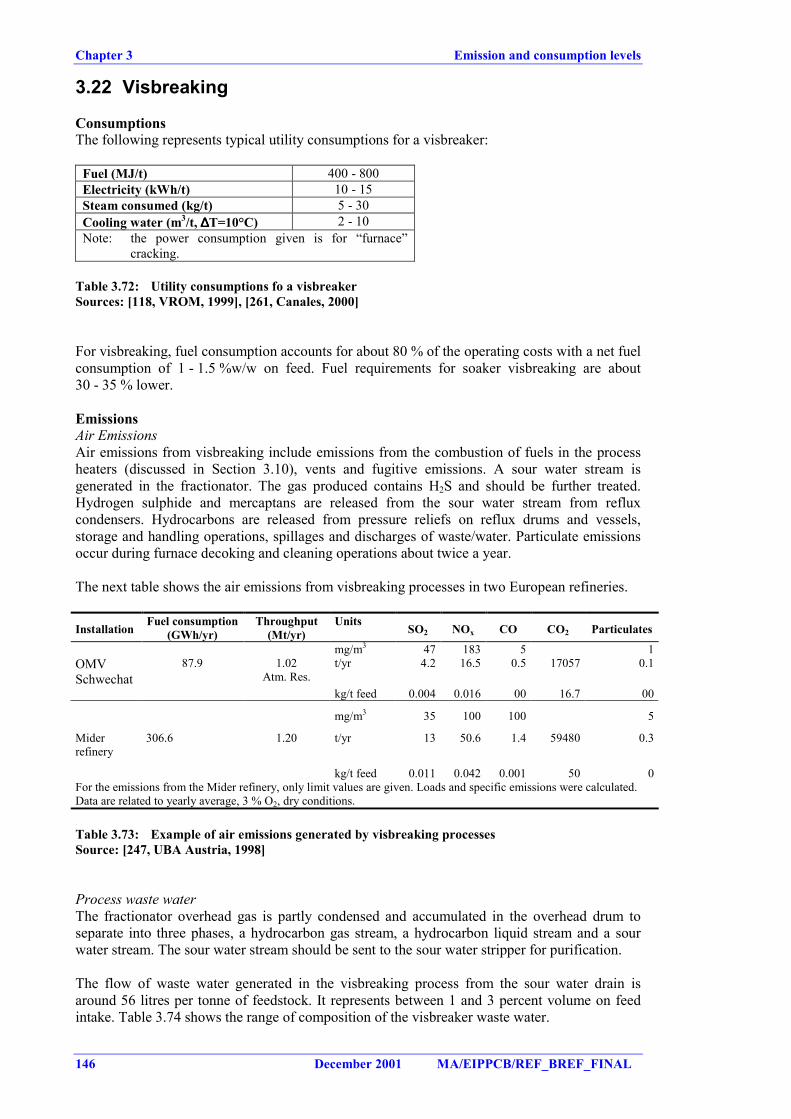
Chapter 3 Emission and consumption levels
146 December 2001 MA/EIPPCB/REF_BREF_FINAL
3.22 Visbreaking
ConsumptionsThe following represents typical utility consumptions for a visbreaker:
Fuel (MJ/t) 400 - 800Electricity (kWh/t) 10 - 15Steam consumed (kg/t) 5 - 30Cooling water (m3/t, ∆∆∆∆T=10°C) 2 - 10Note: the power consumption given is for “furnace”
cracking.
Table 3.72: Utility consumptions fo a visbreakerSources: [118, VROM, 1999], [261, Canales, 2000]
For visbreaking, fuel consumption accounts for about 80 % of the operating costs with a net fuelconsumption of 1 - 1.5 %w/w on feed. Fuel requirements for soaker visbreaking are about30 - 35 % lower.
EmissionsAir EmissionsAir emissions from visbreaking include emissions from the combustion of fuels in the processheaters (discussed in Section 3.10), vents and fugitive emissions. A sour water stream isgenerated in the fractionator. The gas produced contains H2S and should be further treated.Hydrogen sulphide and mercaptans are released from the sour water stream from refluxcondensers. Hydrocarbons are released from pressure reliefs on reflux drums and vessels,storage and handling operations, spillages and discharges of waste/water. Particulate emissionsoccur during furnace decoking and cleaning operations about twice a year.
The next table shows the air emissions from visbreaking processes in two European refineries.
InstallationFuel consumption
(GWh/yr)Throughput
(Mt/yr)Units
SO2 NOx CO CO2 Particulates
mg/m3 47 183 5 1OMVSchwechat
87.9 1.02Atm. Res.
t/yr 4.2 16.5 0.5 17057 0.1
kg/t feed 0.004 0.016 00 16.7 00
mg/m3 35 100 100 5
Miderrefinery
306.6 1.20 t/yr 13 50.6 1.4 59480 0.3
kg/t feed 0.011 0.042 0.001 50 0For the emissions from the Mider refinery, only limit values are given. Loads and specific emissions were calculated.Data are related to yearly average, 3 % O2, dry conditions.
Table 3.73: Example of air emissions generated by visbreaking processesSource: [247, UBA Austria, 1998]
Process waste waterThe fractionator overhead gas is partly condensed and accumulated in the overhead drum toseparate into three phases, a hydrocarbon gas stream, a hydrocarbon liquid stream and a sourwater stream. The sour water stream should be sent to the sour water stripper for purification.
The flow of waste water generated in the visbreaking process from the sour water drain isaround 56 litres per tonne of feedstock. It represents between 1 and 3 percent volume on feedintake. Table 3.74 shows the range of composition of the visbreaker waste water.
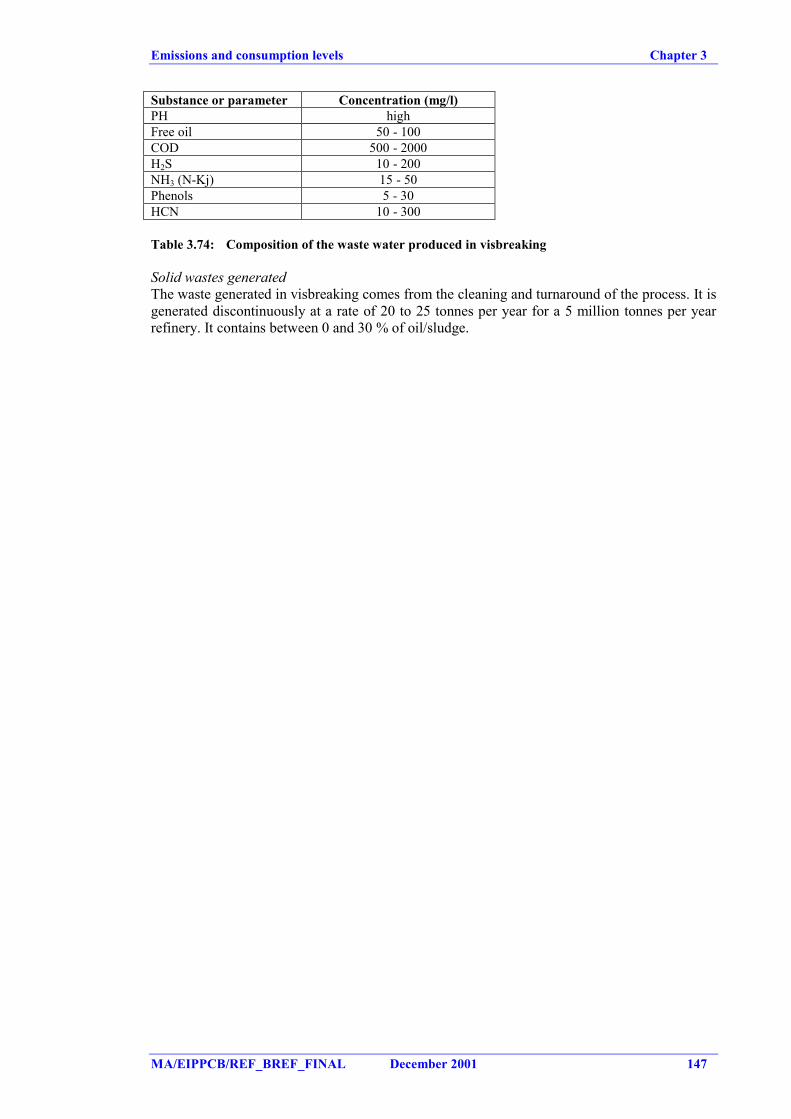
Emissions and consumption levels Chapter 3
MA/EIPPCB/REF_BREF_FINAL December 2001 147
Substance or parameter Concentration (mg/l)PH highFree oil 50 - 100COD 500 - 2000H2S 10 - 200NH3 (N-Kj) 15 - 50Phenols 5 - 30HCN 10 - 300
Table 3.74: Composition of the waste water produced in visbreaking
Solid wastes generatedThe waste generated in visbreaking comes from the cleaning and turnaround of the process. It isgenerated discontinuously at a rate of 20 to 25 tonnes per year for a 5 million tonnes per yearrefinery. It contains between 0 and 30 % of oil/sludge.
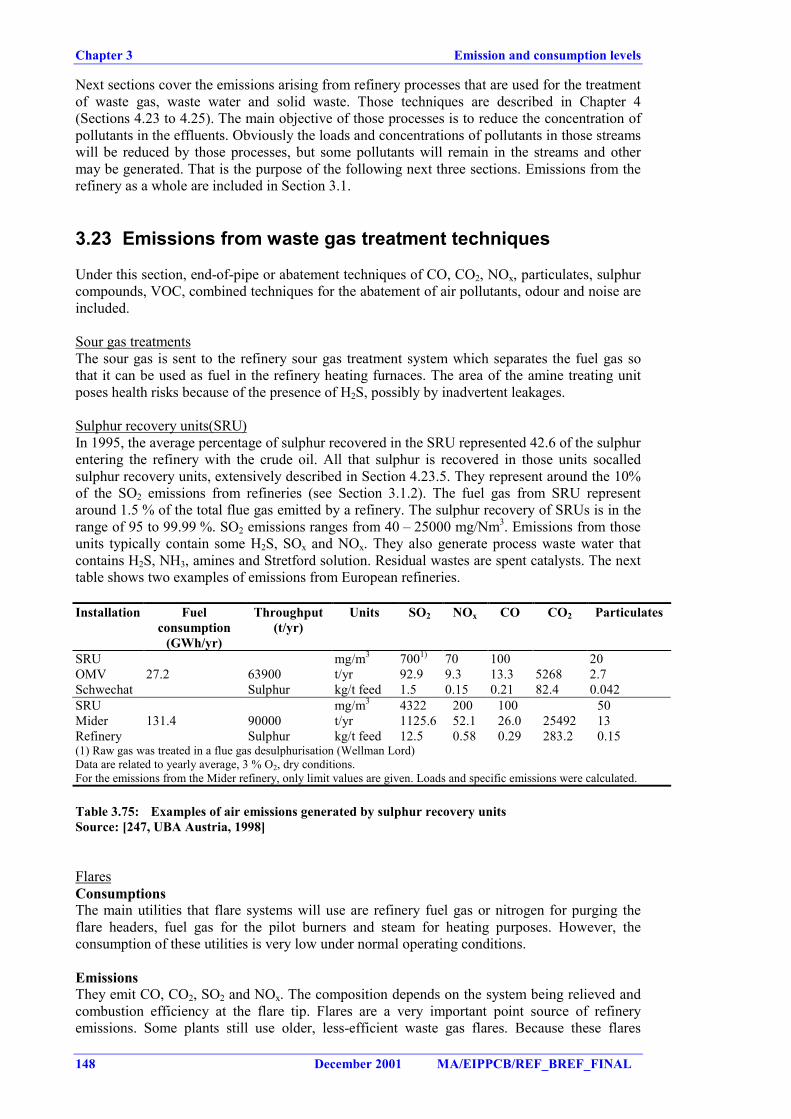
Chapter 3 Emission and consumption levels
148 December 2001 MA/EIPPCB/REF_BREF_FINAL
Next sections cover the emissions arising from refinery processes that are used for the treatmentof waste gas, waste water and solid waste. Those techniques are described in Chapter 4(Sections 4.23 to 4.25). The main objective of those processes is to reduce the concentration ofpollutants in the effluents. Obviously the loads and concentrations of pollutants in those streamswill be reduced by those processes, but some pollutants will remain in the streams and othermay be generated. That is the purpose of the following next three sections. Emissions from therefinery as a whole are included in Section 3.1.
3.23 Emissions from waste gas treatment techniques
Under this section, end-of-pipe or abatement techniques of CO, CO2, NOx, particulates, sulphurcompounds, VOC, combined techniques for the abatement of air pollutants, odour and noise areincluded.
Sour gas treatmentsThe sour gas is sent to the refinery sour gas treatment system which separates the fuel gas sothat it can be used as fuel in the refinery heating furnaces. The area of the amine treating unitposes health risks because of the presence of H2S, possibly by inadvertent leakages.
Sulphur recovery units(SRU)In 1995, the average percentage of sulphur recovered in the SRU represented 42.6 of the sulphurentering the refinery with the crude oil. All that sulphur is recovered in those units socalledsulphur recovery units, extensively described in Section 4.23.5. They represent around the 10%of the SO2 emissions from refineries (see Section 3.1.2). The fuel gas from SRU representaround 1.5 % of the total flue gas emitted by a refinery. The sulphur recovery of SRUs is in therange of 95 to 99.99 %. SO2 emissions ranges from 40 – 25000 mg/Nm3. Emissions from thoseunits typically contain some H2S, SOx and NOx. They also generate process waste water thatcontains H2S, NH3, amines and Stretford solution. Residual wastes are spent catalysts. The nexttable shows two examples of emissions from European refineries.
Installation Fuelconsumption
(GWh/yr)
Throughput(t/yr)
Units SO2 NOx CO CO2 Particulates
SRU mg/m3 7001) 70 100 20OMV 27.2 63900 t/yr 92.9 9.3 13.3 5268 2.7Schwechat Sulphur kg/t feed 1.5 0.15 0.21 82.4 0.042SRU mg/m3 4322 200 100 50Mider 131.4 90000 t/yr 1125.6 52.1 26.0 25492 13Refinery Sulphur kg/t feed 12.5 0.58 0.29 283.2 0.15(1) Raw gas was treated in a flue gas desulphurisation (Wellman Lord)Data are related to yearly average, 3 % O2, dry conditions.For the emissions from the Mider refinery, only limit values are given. Loads and specific emissions were calculated.
Table 3.75: Examples of air emissions generated by sulphur recovery unitsSource: [247, UBA Austria, 1998]
FlaresConsumptionsThe main utilities that flare systems will use are refinery fuel gas or nitrogen for purging theflare headers, fuel gas for the pilot burners and steam for heating purposes. However, theconsumption of these utilities is very low under normal operating conditions.
EmissionsThey emit CO, CO2, SO2 and NOx. The composition depends on the system being relieved andcombustion efficiency at the flare tip. Flares are a very important point source of refineryemissions. Some plants still use older, less-efficient waste gas flares. Because these flares
Emissions and consumption levels Chapter 3
MA/EIPPCB/REF_BREF_FINAL December 2001 149
usually burn at temperatures lower than necessary for complete combustion, larger emissions ofhydrocarbons and particulate, as well as H2S, can occur. No data are available to estimate themagnitude of these emissions. Emissions of VOC and soot are also present and they depend onthe system being relieved and combustion efficiency at the flare tip.
Chapter 3 Emission and consumption levels
150 December 2001 MA/EIPPCB/REF_BREF_FINAL
3.24 Emissions from waste water treatment techniques
Large volumes of waste water are produced by the petroleum refining industry. Waste watertreatment plants are advanced environmental protection systems for the control of surface waterpollution. Waste water treatment plants are a significant source of refinery air emissions, wateremissions and solid wastes. Sources of contamination of water with hydrocarbons are desalters(40 %), storage tanks (20 %), slop systems (15 %) and other processes (25 %).
Process effluent volume can be compared to the volumes of process effluent discharged(excluding once through cooling water). Although related, the values are not identical given thatthere are other sources of water to the effluent system including rainwater on plant surfaces,water separated from crude, ballast water etc. On the other hand, some water will evaporate, beused in chemical reactions, etc. Figures for effluent for 63 European refineries are (all in annualaverages):
� Annual average effluent volume 3.6 million m3/year� Range 0.07 to 21 million m3/year� Average effluent per tonne throughput 0.53 m3/tonne throughput� Range 0.09 to 1.6 m3/tonne throughput
EmissionsAir emissionsThe air emissions from waste water treatment plants stem from evaporation (hydrocarbons,benzene, H2S, NH3, mercaptans) from the numerous tanks, ponds and sewerage system drainsthat exposes its surfaces into air. The sewerage system and the waste water treatment in arefinery may be sources of odour nuisance, particularly from open drains and from oilseparators. VOCs are also emitted during air stripping in flotation units and in the biotreater.The HC emissions from the waste water systems can be determined by calculation from theexposed surface area of the oil-contaminated untreated water tank (API separator) and anempirical oil evaporation factor of [117, VDI, 2000]:
• 20 g/m2 per hour for open oil separator• 2 g/m2 per hour for covered oil separator• 2 g/m2 per hour for flotation• 0.2 g/m2 per hour for biological treatments
Emissions to waterPotential releases into water consist of the residual substances contained in the effluent aftertreatment. Depending on the nature of the refinery and the treatment efficiency, these includehydrocarbons (dissolved and suspended), organic compounds (notably phenols), sulphurcompounds (notably sulphides), ammonia/ammoniacal compounds and their derivatives aftertreatment. Traces of heavy metals are also likely to be present, arising from the desalting ofcrude oil feedstock and from caustic soda if this contains trace contaminants, notably mercury.More information in this subject is included in Section 3.1.3.
Solid wastes generatedSolid wastes are generated in the form of sludges from a number of the treatment units. Primarytreatments generate API separator sludge (phenols, metals and up to 10 % oil), chemicalprecipitation sludge (chemical coagulants, oil), DAF floats (up to 30 % oil), biological sludges(metals, < 0.5 % oil, suspended solids) and spent lime. Secondary treatment generates biomasswaste which is typically treated anaerobically and then dewatered. Flotation units andbiotreaters generate the largest quantities of sludges in the waste water treatment plants. DAFunits produce significant quantities of sludges. The limited information reported in the survey(for three units [115, CONCAWE, 1999]) indicated an annual sludge production of about 2400tonnes per year for a throughput of 600 m3/h. The induced air flotation generates 600 tonnes per
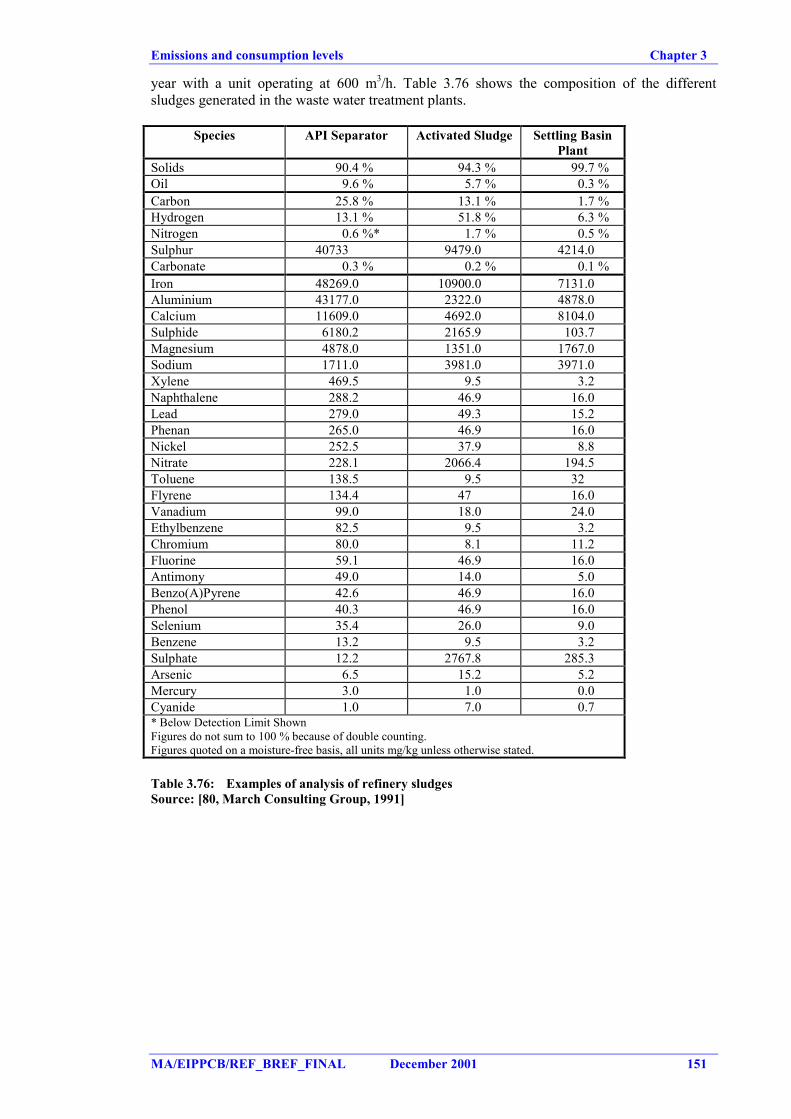
Emissions and consumption levels Chapter 3
MA/EIPPCB/REF_BREF_FINAL December 2001 151
year with a unit operating at 600 m3/h. Table 3.76 shows the composition of the differentsludges generated in the waste water treatment plants.
Species API Separator Activated Sludge Settling BasinPlant
Solids 90.4 % 94.3 % 99.7 %Oil 9.6 % 5.7 % 0.3 %Carbon 25.8 % 13.1 % 1.7 %Hydrogen 13.1 % 51.8 % 6.3 %Nitrogen 0.6 %* 1.7 % 0.5 %Sulphur 40733 9479.0 4214.0Carbonate 0.3 % 0.2 % 0.1 %Iron 48269.0 10900.0 7131.0Aluminium 43177.0 2322.0 4878.0Calcium 11609.0 4692.0 8104.0Sulphide 6180.2 2165.9 103.7Magnesium 4878.0 1351.0 1767.0Sodium 1711.0 3981.0 3971.0Xylene 469.5 9.5 3.2Naphthalene 288.2 46.9 16.0Lead 279.0 49.3 15.2Phenan 265.0 46.9 16.0Nickel 252.5 37.9 8.8Nitrate 228.1 2066.4 194.5Toluene 138.5 9.5 32Flyrene 134.4 47 16.0Vanadium 99.0 18.0 24.0Ethylbenzene 82.5 9.5 3.2Chromium 80.0 8.1 11.2Fluorine 59.1 46.9 16.0Antimony 49.0 14.0 5.0Benzo(A)Pyrene 42.6 46.9 16.0Phenol 40.3 46.9 16.0Selenium 35.4 26.0 9.0Benzene 13.2 9.5 3.2Sulphate 12.2 2767.8 285.3Arsenic 6.5 15.2 5.2Mercury 3.0 1.0 0.0Cyanide 1.0 7.0 0.7* Below Detection Limit ShownFigures do not sum to 100 % because of double counting.Figures quoted on a moisture-free basis, all units mg/kg unless otherwise stated.
Table 3.76: Examples of analysis of refinery sludgesSource: [80, March Consulting Group, 1991]
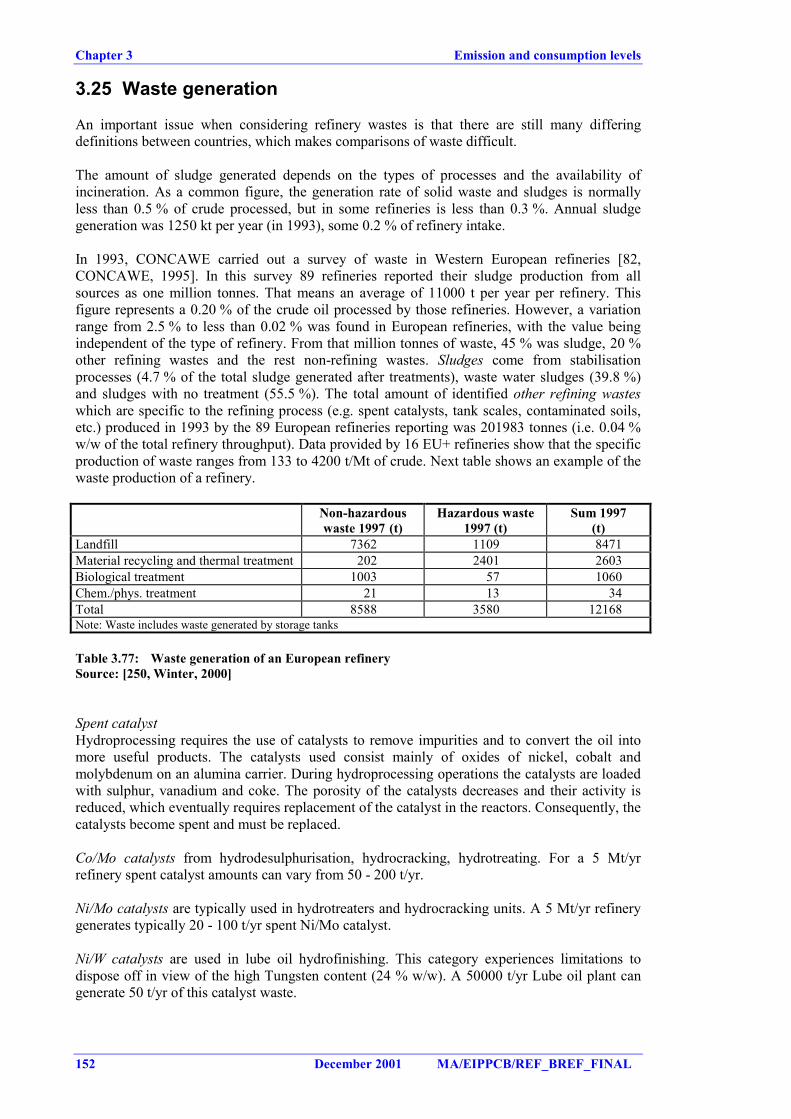
Chapter 3 Emission and consumption levels
152 December 2001 MA/EIPPCB/REF_BREF_FINAL
3.25 Waste generation
An important issue when considering refinery wastes is that there are still many differingdefinitions between countries, which makes comparisons of waste difficult.
The amount of sludge generated depends on the types of processes and the availability ofincineration. As a common figure, the generation rate of solid waste and sludges is normallyless than 0.5 % of crude processed, but in some refineries is less than 0.3 %. Annual sludgegeneration was 1250 kt per year (in 1993), some 0.2 % of refinery intake.
In 1993, CONCAWE carried out a survey of waste in Western European refineries [82,CONCAWE, 1995]. In this survey 89 refineries reported their sludge production from allsources as one million tonnes. That means an average of 11000 t per year per refinery. Thisfigure represents a 0.20 % of the crude oil processed by those refineries. However, a variationrange from 2.5 % to less than 0.02 % was found in European refineries, with the value beingindependent of the type of refinery. From that million tonnes of waste, 45 % was sludge, 20 %other refining wastes and the rest non-refining wastes. Sludges come from stabilisationprocesses (4.7 % of the total sludge generated after treatments), waste water sludges (39.8 %)and sludges with no treatment (55.5 %). The total amount of identified other refining wasteswhich are specific to the refining process (e.g. spent catalysts, tank scales, contaminated soils,etc.) produced in 1993 by the 89 European refineries reporting was 201983 tonnes (i.e. 0.04 %w/w of the total refinery throughput). Data provided by 16 EU+ refineries show that the specificproduction of waste ranges from 133 to 4200 t/Mt of crude. Next table shows an example of thewaste production of a refinery.
Non-hazardouswaste 1997 (t)
Hazardous waste1997 (t)
Sum 1997(t)
Landfill 7362 1109 8471Material recycling and thermal treatment 202 2401 2603Biological treatment 1003 57 1060Chem./phys. treatment 21 13 34Total 8588 3580 12168Note: Waste includes waste generated by storage tanks
Table 3.77: Waste generation of an European refinerySource: [250, Winter, 2000]
Spent catalystHydroprocessing requires the use of catalysts to remove impurities and to convert the oil intomore useful products. The catalysts used consist mainly of oxides of nickel, cobalt andmolybdenum on an alumina carrier. During hydroprocessing operations the catalysts are loadedwith sulphur, vanadium and coke. The porosity of the catalysts decreases and their activity isreduced, which eventually requires replacement of the catalyst in the reactors. Consequently, thecatalysts become spent and must be replaced.
Co/Mo catalysts from hydrodesulphurisation, hydrocracking, hydrotreating. For a 5 Mt/yrrefinery spent catalyst amounts can vary from 50 - 200 t/yr.
Ni/Mo catalysts are typically used in hydrotreaters and hydrocracking units. A 5 Mt/yr refinerygenerates typically 20 - 100 t/yr spent Ni/Mo catalyst.
Ni/W catalysts are used in lube oil hydrofinishing. This category experiences limitations todispose off in view of the high Tungsten content (24 % w/w). A 50000 t/yr Lube oil plant cangenerate 50 t/yr of this catalyst waste.
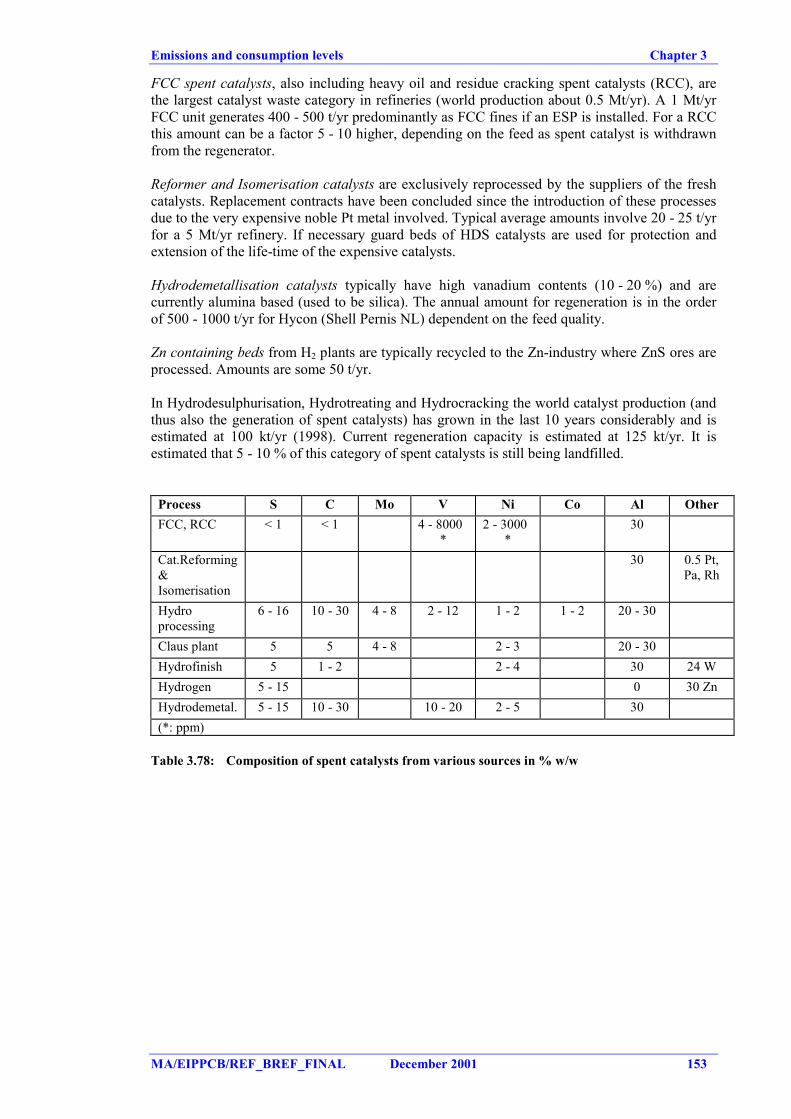
Emissions and consumption levels Chapter 3
MA/EIPPCB/REF_BREF_FINAL December 2001 153
FCC spent catalysts, also including heavy oil and residue cracking spent catalysts (RCC), arethe largest catalyst waste category in refineries (world production about 0.5 Mt/yr). A 1 Mt/yrFCC unit generates 400 - 500 t/yr predominantly as FCC fines if an ESP is installed. For a RCCthis amount can be a factor 5 - 10 higher, depending on the feed as spent catalyst is withdrawnfrom the regenerator.
Reformer and Isomerisation catalysts are exclusively reprocessed by the suppliers of the freshcatalysts. Replacement contracts have been concluded since the introduction of these processesdue to the very expensive noble Pt metal involved. Typical average amounts involve 20 - 25 t/yrfor a 5 Mt/yr refinery. If necessary guard beds of HDS catalysts are used for protection andextension of the life-time of the expensive catalysts.
Hydrodemetallisation catalysts typically have high vanadium contents (10 - 20 %) and arecurrently alumina based (used to be silica). The annual amount for regeneration is in the orderof 500 - 1000 t/yr for Hycon (Shell Pernis NL) dependent on the feed quality.
Zn containing beds from H2 plants are typically recycled to the Zn-industry where ZnS ores areprocessed. Amounts are some 50 t/yr.
In Hydrodesulphurisation, Hydrotreating and Hydrocracking the world catalyst production (andthus also the generation of spent catalysts) has grown in the last 10 years considerably and isestimated at 100 kt/yr (1998). Current regeneration capacity is estimated at 125 kt/yr. It isestimated that 5 - 10 % of this category of spent catalysts is still being landfilled.
Process S C Mo V Ni Co Al OtherFCC, RCC < 1 < 1 4 - 8000
*2 - 3000
*30
Cat.Reforming&Isomerisation
30 0.5 Pt,Pa, Rh
Hydroprocessing
6 - 16 10 - 30 4 - 8 2 - 12 1 - 2 1 - 2 20 - 30
Claus plant 5 5 4 - 8 2 - 3 20 - 30Hydrofinish 5 1 - 2 2 - 4 30 24 WHydrogen 5 - 15 0 30 ZnHydrodemetal. 5 - 15 10 - 30 10 - 20 2 - 5 30(*: ppm)
Table 3.78: Composition of spent catalysts from various sources in % w/w
Chapter 3 Emission and consumption levels
154 December 2001 MA/EIPPCB/REF_BREF_FINAL
3.26 Monitoring
There is an IPPC BREF and an expanding series of literature (e.g. HMIP Technical GuidanceNotes) on monitoring, containing information on theory and methodology, and providingtechnical information on monitoring techniques. It should be considered that the requirementsand frequency of sampling, analysis and type of monitoring requirements are site and/or processspecific, influenced by consideration of the anticipated volume and composition of the wastestreams and normally are included in the permits. Monitoring BREF includes guidances topermit writters as compliance assessment and environmental reporting. That document alsoencorage the comparability and reliability of monitoring data across Europe.
This section aims to give recommendations on the scope and frequency (continuously ordiscontinuously) of monitoring streams in a refinery. Monitoring should be undertaken duringcommissioning, start-up, normal operation, and shutdown unless it is agreed that it would beinappropriate to do so.
The monitoring system should allow adequate processing and emission control. Some elementsof a monitoring system could include:
� continuous monitoring of pollutants for high volume flows with a high variability inpollutant concentrations
� periodic monitoring or the use of emission relevant parameters for flows with a lowvariability
� regular calibrating of measurement equipment� periodic verification of measurement by simultaneous comparative measurements.
In order to have a good idea of the emissions generated by an installation (e.g. a refinery), theemissions need to be quantified. This will give to the refinery and permit writter the possibilityto know where the actions to reduce a certain pollutant may be more economical. Typicallyhigher emissions at high concentrations are more economic to be abate that lower emissions atlow concentrations. As consequence, a quantification of the emissions for each single refinery isthe first starting point in any environmental assessment. This quantification may contain a fullmass balance also considering other outpus (e.g. products).
Monitoring air emissionsIn many refineries the bubble concept is applied for some air pollutants. The concept is toconsider the refinery as a whole and to sum up concentrations and volumes of all the emissionsources. From this is calculated the average concentration of the pollutants regardless of thesource or stack. This type of concept is applied to sulphur dioxide and other air pollutants insome European countries and in the EU Large Combustion Plant Directive. More informationcan be found in 4.15.2.
SO2, NOx, particulate matter, and CO are typically monitored in continuous (on-line orpredictive) in the refineries. Records of the volumes are also required for the calculation of theload (tonnes of pollutant per year) or for the application of the bubble concept. Following tableshows the locations where the main air pollutants are typically continuous monitored in arefinery.
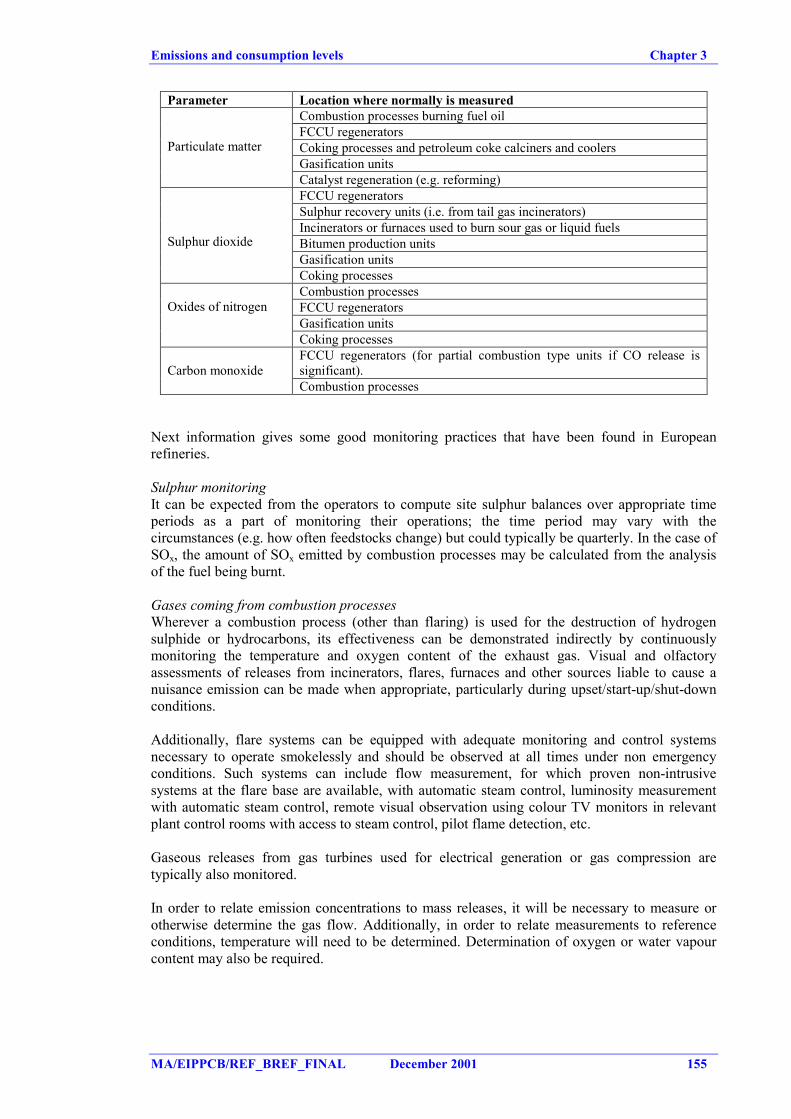
Emissions and consumption levels Chapter 3
MA/EIPPCB/REF_BREF_FINAL December 2001 155
Parameter Location where normally is measuredCombustion processes burning fuel oilFCCU regeneratorsCoking processes and petroleum coke calciners and coolersGasification units
Particulate matter
Catalyst regeneration (e.g. reforming)FCCU regeneratorsSulphur recovery units (i.e. from tail gas incinerators)Incinerators or furnaces used to burn sour gas or liquid fuelsBitumen production unitsGasification units
Sulphur dioxide
Coking processesCombustion processesFCCU regeneratorsGasification units
Oxides of nitrogen
Coking processesFCCU regenerators (for partial combustion type units if CO release issignificant).Carbon monoxideCombustion processes
Next information gives some good monitoring practices that have been found in Europeanrefineries.
Sulphur monitoringIt can be expected from the operators to compute site sulphur balances over appropriate timeperiods as a part of monitoring their operations; the time period may vary with thecircumstances (e.g. how often feedstocks change) but could typically be quarterly. In the case ofSOx, the amount of SOx emitted by combustion processes may be calculated from the analysisof the fuel being burnt.
Gases coming from combustion processesWherever a combustion process (other than flaring) is used for the destruction of hydrogensulphide or hydrocarbons, its effectiveness can be demonstrated indirectly by continuouslymonitoring the temperature and oxygen content of the exhaust gas. Visual and olfactoryassessments of releases from incinerators, flares, furnaces and other sources liable to cause anuisance emission can be made when appropriate, particularly during upset/start-up/shut-downconditions.
Additionally, flare systems can be equipped with adequate monitoring and control systemsnecessary to operate smokelessly and should be observed at all times under non emergencyconditions. Such systems can include flow measurement, for which proven non-intrusivesystems at the flare base are available, with automatic steam control, luminosity measurementwith automatic steam control, remote visual observation using colour TV monitors in relevantplant control rooms with access to steam control, pilot flame detection, etc.
Gaseous releases from gas turbines used for electrical generation or gas compression aretypically also monitored.
In order to relate emission concentrations to mass releases, it will be necessary to measure orotherwise determine the gas flow. Additionally, in order to relate measurements to referenceconditions, temperature will need to be determined. Determination of oxygen or water vapourcontent may also be required.
Chapter 3 Emission and consumption levels
156 December 2001 MA/EIPPCB/REF_BREF_FINAL
VOC monitoringVOC emissions come mainly from fugitive emissions. The site may be equipped to monitor allprocess vents and possible sources of fugitive losses. A Leak Detection and Repair (LDAR)programme can be implemented (see Section 4.23.6.1) in order to prevent those. An assessmentof the total hydrocarbon emissions from the site on a regular basis can be made. Records can bekept of the individual contributions to each total.
VOC emissions can be estimated by USAEPA Method 21 (emission factors for different type ofequipment) or by mass balance (feedstock – products). Perhaps one should add that another wayof monitoring HC emissions from all sources is through the mass balance between feed stockand products.Other methods have been developed and proven in recent years for the monitoringof VOC emissions as well as locating sources of VOC emissions, typically using laserabsorption techniques (DIAL) of considerable sophistication. Mobile versions are availablewhich can be used to plot pollutant concentration plumes and calculate pollutant flux, includingthree-dimensional resolution. Whilst having recognised limitations, they have been usedsuccessfully in the oil and gas industries. In most of this monitoring campaigns themeasurements have been divided into four areas: Process area, product tank farm, crude oil tankfarm and water treatment plant. DIAL method has been used in a number of refineries and inmany cases, the results appear to be higher than those derived from the API estimations.However, in these trials, the sampling period was very short. In the only trial where a long-termsurvey was conducted, the results gave reasonable agreement with the API estimations [229,Smithers, 1995]. Next paragraph gives an example of monitoring of VOC within a refinery aswell as the discrepancies that they have found using estimation method and DIAL measurement.
Before the measurements, it was estimated a VOC emissions of about 200 tonnes per year at acertain European refinery. The DIAL measurements and annualisation of the results suggesteda yearly emission exceeding 1000 tonnes. Especially emissions from tanks were higher thanexpected. In all cases, emissions estimates using API methods gave lower emissions thanestimates based on the DIAL monitoring. In some cases, the discrepancies are very large. Byusing the method for estimating fugitive emissions proposed by USAEPA [244, USAEPA, 1992]the emissions from the process area 1Mtonnes per year refinery have been estimated to 125tonnes per year. Extrapolations of the DIAL measurements to a yearly emission give emissionsof 500 - 600 tonnes per year [107, Janson, 1999]. For the total emission from the refinery, theuse of estimation methods suggests that the emissions are 600 - 1100 tonnes per year.Extrapolations of DIAL measurements indicate a yearly emission of 1600 - 2600 tonnes formedium refineries. During the same exercise of measurements it was also found that thedominating fraction of fugitive emissions was alkanes within interval C8 - C10. Aromaticscontributed to about 9 - 15 % of the total emission [107, Janson, 1999]. However, it is importantto notice that the composition of the vapour will depend heavily on refinery configuration andwhat happens to be leaking at the time of the measurement of the VOC.
Monitoring releases to waterContinuous monitoring and flow proportional sampling for releases to water are alwayspreferable but the use of a fixed interval or time proportional sampler for low flow rates (lessthan 1 litter per second) may be acceptable.
Monitoring of process effluents released to controlled waters and sewers will commonly bemade for the following: flow rate, pH, temperature, TOC (surrogate for COD/BOD). Samplesare also being monitored for appropriate other parameters such as COD, BOD, hydrocarbon oil,ammoniacal and total nitrogen, suspended solids, phenols, sulphides, dissolved oxygen,phosphates, nitrates, nitrites, metals (typically Cd, Hg, Cr, Ni, Zn, Cu, As). The periodicity canbe typically daily, weekly or monthly depending on risk assessment and on local circumstances.
Emissions and consumption levels Chapter 3
MA/EIPPCB/REF_BREF_FINAL December 2001 157
One problem about water discharge from refineries is analysis and especially analysis of oil.There are a number of different methods (e.g. IR one wave lengths, IR two wave lengths,gravimetric) which give completely different results. Another problem is the toxic substancesused in the COD analysis.
Losses of oil through leaks can also be minimised through continuous monitoring of the coolingwater system. At its simplest, this comprises monitoring of the cooling water separators for oilbuild-up. If this is observed, then it will be necessary to trace back through the system toidentify the source of the leak so that corrective action can be taken. Detailed system drawingsare essential for this activity. Fingerprinting of the oil can also speed up identification of theleak. A further refinement is to install oil in water monitors at various points in the coolingwater system. This allows leaks to be detected rapidly and corrective action taken. For thisprocedure to be effective, sparing of critical heat exchangers will be required.
In case of a once-through system the cooling fluid outlet system may be divided into a suspectsystem, where the process pressure is higher than the cooling system pressure and a cleansystem, where the cooling system pressure is higher than the process pressure. The suspectsystem needs to be monitored for contamination.
Monitoring solid wastesA record of the quantity and composition (including prescribed substances) of residuesgenerated is typically done. In addition the operator typically have written procedures whichensure that releases are handled, treated and disposed of in an approved manner, and specifyhow the accumulation and storage of waste are controlled. The frequency of analysis of thewaste is site and/or process specific.
Soil MonitoringQuoted costs for installation and operation of monitoring wells was highly variable rangingfrom 25000 EUR for 100 wells (250 EUR per well) to 140000 EUR for 50 boreholes(2800 EUR per well) but with a minimal operating cost. Costs of groundwater monitoringsystems were quoted as 1400 EUR per year for 18 wells (78 EUR per well) in one case to anaverage of 45000 EUR (including 7000 EUR for analysis) for three surveys at intervals of someyears.

Techniques to consider in the determination of BAT Chapter 4
MA/EIPPCB/REF_BREF_FINAL December 2001 159
4 TECHNIQUES TO CONSIDER IN THE DETERMINATION OFBAT
This chapter describes in detail the techniques that are considered to be most relevant fordetermining BAT. This chapter should be seen as the main background information for thedetermination of best available techniques in the refinery sector (Chapter 5). Techniques that aregenerally seen as obsolescent are not included. Moreover, it does not include all the techniquesapplied in the refinery sector and described in Chapter 2. Only techniques with goodenvironmental performance are included here.
Production, prevention, control, minimisation and re-cycling procedures/techniques areconsidered in this chapter. This can be done in many ways, such as using production techniquesthat pollute less than others, changing the operating conditions, reducing material inputs, re-engineering processes to re-use by-products, improving management practices or employingsubstitution of toxic chemicals. This chapter provides information on some both general andspecific pollution prevention and control advances that have been implemented within industryin general and in the refinery industry in particular.
As in previous Chapters 2 and 3, each section of this chapter deals with a refinery process oractivity and contains the process and abatement techniques worth considered in thedetermination of BAT. If different techniques may be applicable for one process/activity, theyare discussed there. Sections from 4.2 to 4.22 in this chapter have been structured internally inthe same way. Each of those sections contain first the pollution prevention techniquesapplicable in the process/activity section referred to and secondly the end-of-pipe techniquesthat may be applicable to reduce the emissions coming from the process/activity. Those end-of-pipe techniques are grouped in media/pollutant bases to clarify the sequence of techniquesapplicable as, in some cases, the number of EOP techniques that may be use is quite extensive.
At the end of this chapter, three sections appear containing the end-of-pipe (EOP) techniquesapplied to waste gas, waste water and waste management. Those sections contain thedescriptions of the EOP techniques that may be applicable to more than a refineryprocess/activity as well as some other EOP processes. Consequently, the descriptions of thoseEOP techniques that may appear in this chapter are included in Sections 4.23, 4.24 and 4.25 andnot in the activities/process sections.
Each technique (both preventive (including process techniques) and control) is well documentedand includes information on consumption and emission levels considered achievable by usingthe technique, some idea of the costs and the cross-media issues associated with the techniqueand the extent to which the technique is applicable to the range of installations requiring IPPCpermits, for example new, existing, large or small installations. Each technique in this chapter isanalysed in the same way in order to give a good background for the determination of BAT forthe refinery sector. That determination is done in the next chapter. Table 4.1 shows the structureof the information for each technique included in this chapter.
When possible, this chapter provides information from real activities that can be, or are being,implemented by this sector, including associated costs. When possible, information providedgives the context in which the technique can be used effectively.
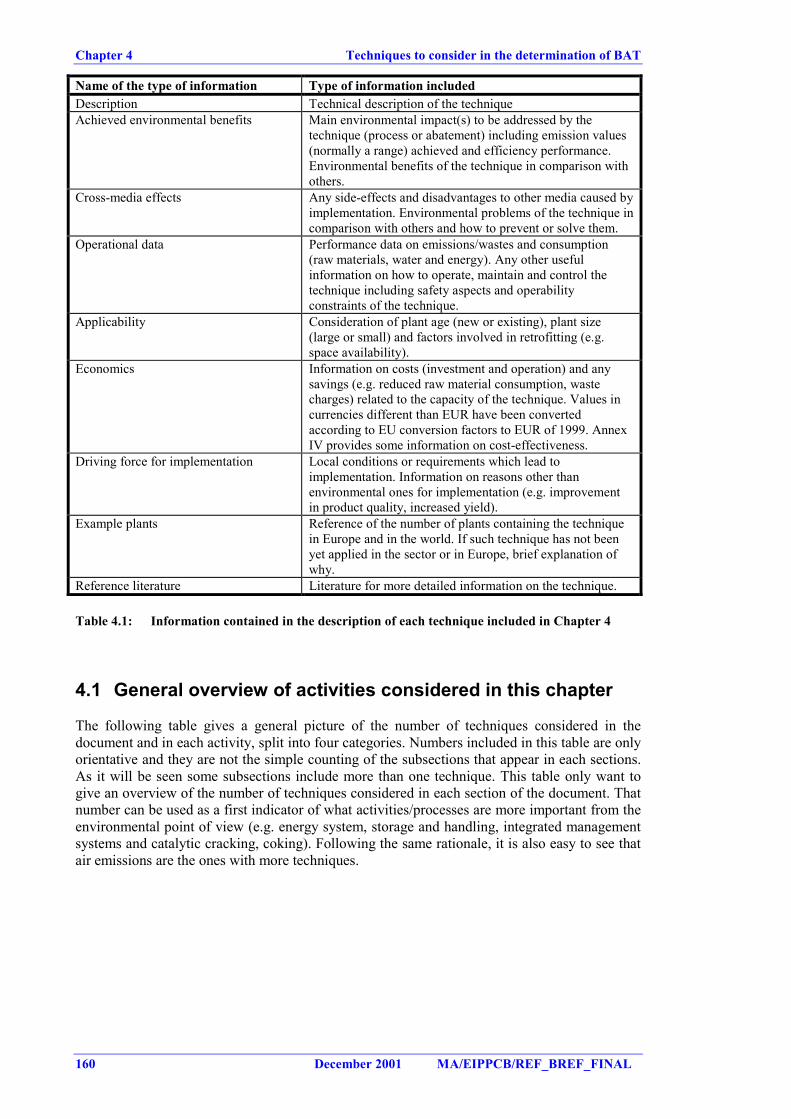
Chapter 4 Techniques to consider in the determination of BAT
160 December 2001 MA/EIPPCB/REF_BREF_FINAL
Name of the type of information Type of information includedDescription Technical description of the techniqueAchieved environmental benefits Main environmental impact(s) to be addressed by the
technique (process or abatement) including emission values(normally a range) achieved and efficiency performance.Environmental benefits of the technique in comparison withothers.
Cross-media effects Any side-effects and disadvantages to other media caused byimplementation. Environmental problems of the technique incomparison with others and how to prevent or solve them.
Operational data Performance data on emissions/wastes and consumption(raw materials, water and energy). Any other usefulinformation on how to operate, maintain and control thetechnique including safety aspects and operabilityconstraints of the technique.
Applicability Consideration of plant age (new or existing), plant size(large or small) and factors involved in retrofitting (e.g.space availability).
Economics Information on costs (investment and operation) and anysavings (e.g. reduced raw material consumption, wastecharges) related to the capacity of the technique. Values incurrencies different than EUR have been convertedaccording to EU conversion factors to EUR of 1999. AnnexIV provides some information on cost-effectiveness.
Driving force for implementation Local conditions or requirements which lead toimplementation. Information on reasons other thanenvironmental ones for implementation (e.g. improvementin product quality, increased yield).
Example plants Reference of the number of plants containing the techniquein Europe and in the world. If such technique has not beenyet applied in the sector or in Europe, brief explanation ofwhy.
Reference literature Literature for more detailed information on the technique.
Table 4.1: Information contained in the description of each technique included in Chapter 4
4.1 General overview of activities considered in this chapter
The following table gives a general picture of the number of techniques considered in thedocument and in each activity, split into four categories. Numbers included in this table are onlyorientative and they are not the simple counting of the subsections that appear in each sections.As it will be seen some subsections include more than one technique. This table only want togive an overview of the number of techniques considered in each section of the document. Thatnumber can be used as a first indicator of what activities/processes are more important from theenvironmental point of view (e.g. energy system, storage and handling, integrated managementsystems and catalytic cracking, coking). Following the same rationale, it is also easy to see thatair emissions are the ones with more techniques.
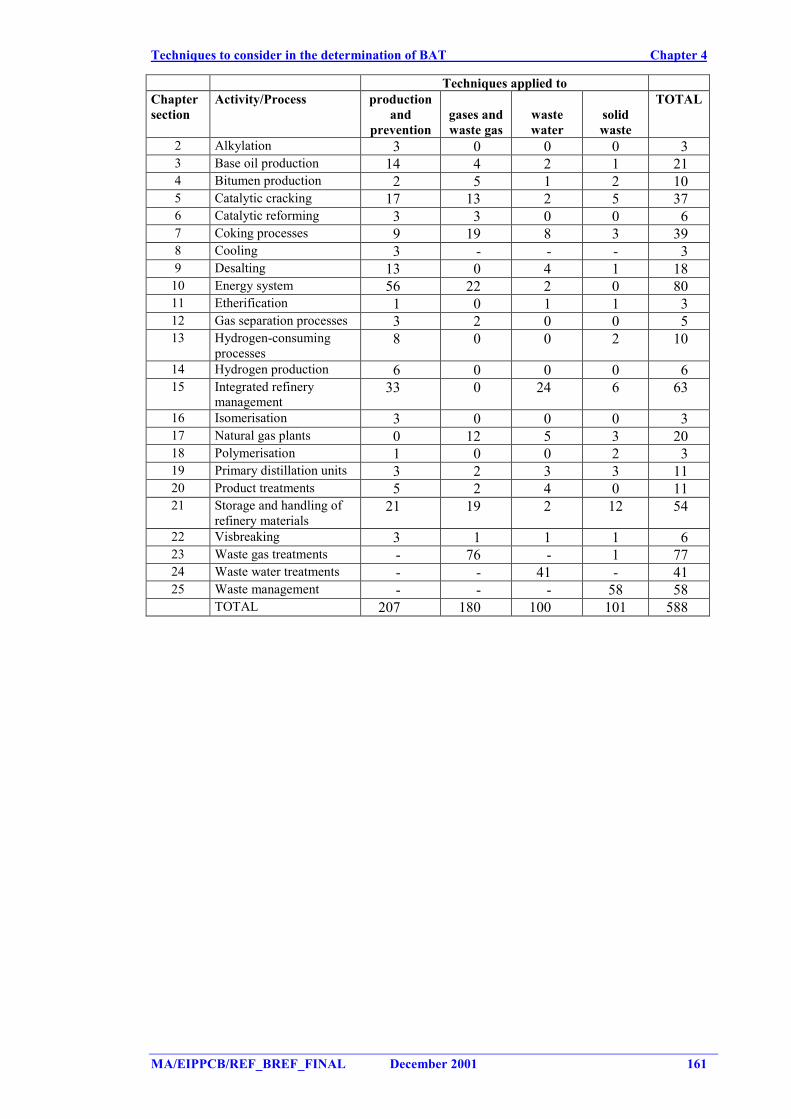
Techniques to consider in the determination of BAT Chapter 4
MA/EIPPCB/REF_BREF_FINAL December 2001 161
Techniques applied toChaptersection
Activity/Process productionand
preventiongases andwaste gas
wastewater
solidwaste
TOTAL
2 Alkylation 3 0 0 0 33 Base oil production 14 4 2 1 214 Bitumen production 2 5 1 2 105 Catalytic cracking 17 13 2 5 376 Catalytic reforming 3 3 0 0 67 Coking processes 9 19 8 3 398 Cooling 3 - - - 39 Desalting 13 0 4 1 18
10 Energy system 56 22 2 0 8011 Etherification 1 0 1 1 312 Gas separation processes 3 2 0 0 513 Hydrogen-consuming
processes8 0 0 2 10
14 Hydrogen production 6 0 0 0 615 Integrated refinery
management33 0 24 6 63
16 Isomerisation 3 0 0 0 317 Natural gas plants 0 12 5 3 2018 Polymerisation 1 0 0 2 319 Primary distillation units 3 2 3 3 1120 Product treatments 5 2 4 0 1121 Storage and handling of
refinery materials21 19 2 12 54
22 Visbreaking 3 1 1 1 623 Waste gas treatments - 76 - 1 7724 Waste water treatments - - 41 - 4125 Waste management - - - 58 58
TOTAL 207 180 100 101 588
Chapter 4 Techniques to consider in the determination of BAT
162 December 2001 MA/EIPPCB/REF_BREF_FINAL
4.2 Alkylation
The techniques considered in the determination of BAT for the alkylation process are thefollowing:
4.2.1 Hydrofluoric acid alkylation process
DescriptionA brief description of the process can be found in Section 2.2.
Achieved environmental benefitsThe main advantages of the HF-alkylation process in comparison with the sulphuric acidprocess are the regeneration of HF, which minimises waste formation and disposal, and thelower acid-catalyst consumption as well as the minor consumption of energy and cooling.
Cross-media effectsEffluent gases: Scrubber using alkaline solution (NaOH or KOH) is necessary to remove HFfrom the incondensable gas stream. The acid relief neutraliser is operated so as to minimise thehydrogen fluoride content of the incondensable gas stream. Emissions levels of <1mg HF/Nm3
can be achieved. The vent gas should pass to flare not to the refinery fuel gas system; adedicated flare/stack is normally retained for this. Fugitive emissions are also generated by thisprocess.
HF is a very dangerous compound because of its severe corrosive nature and burning effects ofboth liquid and fumes to skin, eyes and mucous membranes. Consequently, storage andhandling it should comply with all safety rules.
KF (or NaF) is formed during the neutralisation process. The spent solution is stored and thenrequires regeneration with lime (or alumina). The regenerated KOH (or NaOH) is recycled.CaF2 is regularly cleaned out and disposed of, usually to a landfill. If alumina is used instead oflime as the neutralising agent, then, recovery of the aluminium is possible by the aluminiumindustry. Fumes can originate in the unit’s neutralising basin. To prevent the discharge of theseodorous gases to the surroundings, the neutralising basins are tightly covered and equipped witha gas scrubber to remove any offensive agent.
Water: HF alkylation effluents are a potential cause of acid excursions in refinery effluents anda high standard of control should be exercised on the neutralisation treatment system, e.g. on-line pH monitoring. The effluent containing HF acid can be treated with lime (CaO-Ca(OH)2),AlCl3 or CaCl2 or it can be neutralised indirectly in a KOH system to produce the desired CaF2or AlF3 (insolubles) which is separated in a settlement basin. The supernatant liquor flows to thewater treatment process. KOH may be regenerated for re-use. After this treatment, thesupernadant contains still 10 – 40 ppm F and some hydrocarbons and is directed to the WWTP.KOH may be regenerated from the aqueous solution for re-use.
Wastes: The HF process also yields tars (polymeric material) but these are essentially free fromHF. HF-containing tars are neutralised (with lime or alumina) and disposed of by incineration orblended as a fuel-oil component in small amounts because its pronounced odours. However,technology and special operating techniques such as internal acid regeneration have virtuallyeliminated this liquid-waste stream.
Bad operation of the system (excessively cold acid, improper acid settler level, low reactorpressure, excessive acid recycle rate, low i-butane or acid concentration, high reactortemperature and improper mixing) increases the amount of waste generated.
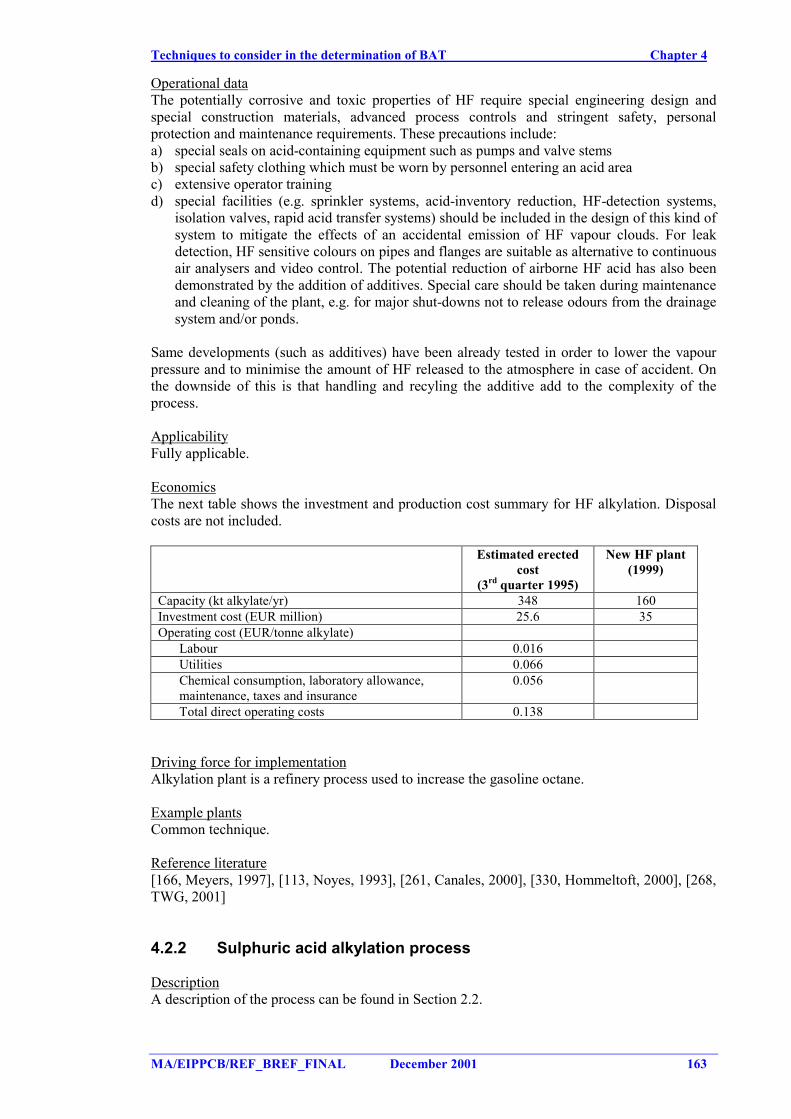
Techniques to consider in the determination of BAT Chapter 4
MA/EIPPCB/REF_BREF_FINAL December 2001 163
Operational dataThe potentially corrosive and toxic properties of HF require special engineering design andspecial construction materials, advanced process controls and stringent safety, personalprotection and maintenance requirements. These precautions include:a) special seals on acid-containing equipment such as pumps and valve stemsb) special safety clothing which must be worn by personnel entering an acid areac) extensive operator trainingd) special facilities (e.g. sprinkler systems, acid-inventory reduction, HF-detection systems,
isolation valves, rapid acid transfer systems) should be included in the design of this kind ofsystem to mitigate the effects of an accidental emission of HF vapour clouds. For leakdetection, HF sensitive colours on pipes and flanges are suitable as alternative to continuousair analysers and video control. The potential reduction of airborne HF acid has also beendemonstrated by the addition of additives. Special care should be taken during maintenanceand cleaning of the plant, e.g. for major shut-downs not to release odours from the drainagesystem and/or ponds.
Same developments (such as additives) have been already tested in order to lower the vapourpressure and to minimise the amount of HF released to the atmosphere in case of accident. Onthe downside of this is that handling and recyling the additive add to the complexity of theprocess.
ApplicabilityFully applicable.
EconomicsThe next table shows the investment and production cost summary for HF alkylation. Disposalcosts are not included.
Estimated erectedcost
(3rd quarter 1995)
New HF plant(1999)
Capacity (kt alkylate/yr) 348 160Investment cost (EUR million) 25.6 35Operating cost (EUR/tonne alkylate)
Labour 0.016Utilities 0.066Chemical consumption, laboratory allowance,maintenance, taxes and insurance
0.056
Total direct operating costs 0.138
Driving force for implementationAlkylation plant is a refinery process used to increase the gasoline octane.
Example plantsCommon technique.
Reference literature[166, Meyers, 1997], [113, Noyes, 1993], [261, Canales, 2000], [330, Hommeltoft, 2000], [268,TWG, 2001]
4.2.2 Sulphuric acid alkylation process
DescriptionA description of the process can be found in Section 2.2.
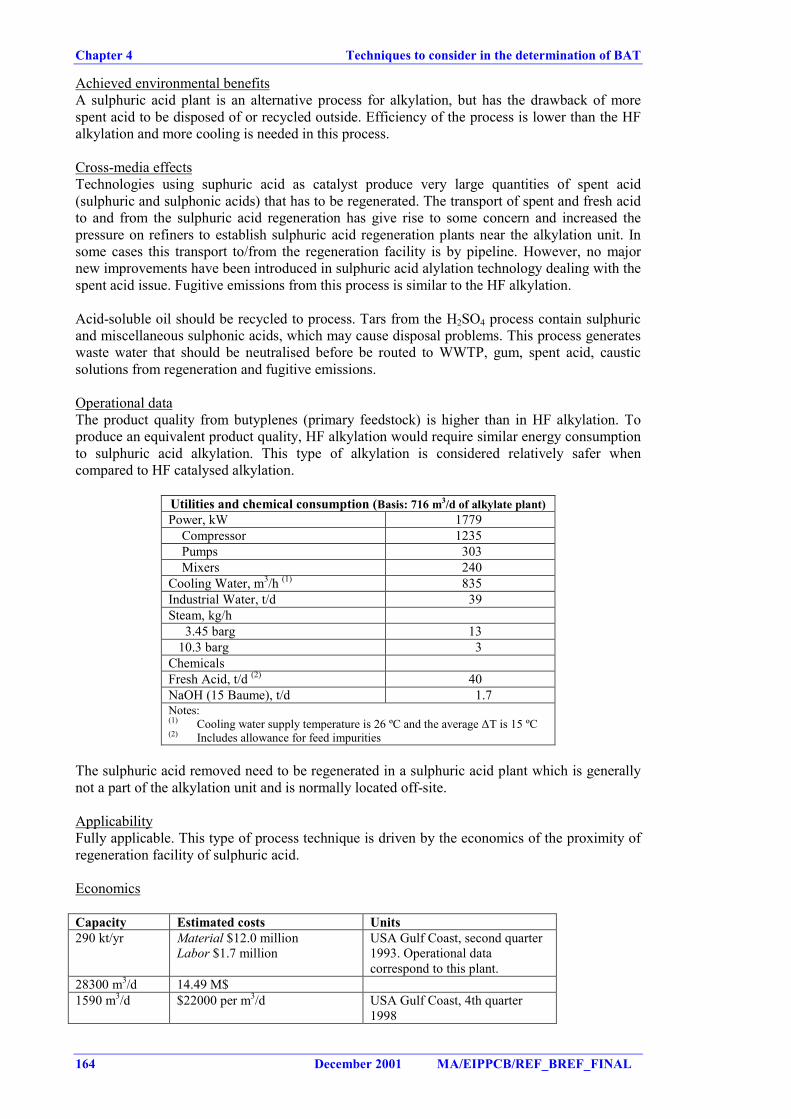
Chapter 4 Techniques to consider in the determination of BAT
164 December 2001 MA/EIPPCB/REF_BREF_FINAL
Achieved environmental benefitsA sulphuric acid plant is an alternative process for alkylation, but has the drawback of morespent acid to be disposed of or recycled outside. Efficiency of the process is lower than the HFalkylation and more cooling is needed in this process.
Cross-media effectsTechnologies using suphuric acid as catalyst produce very large quantities of spent acid(sulphuric and sulphonic acids) that has to be regenerated. The transport of spent and fresh acidto and from the sulphuric acid regeneration has give rise to some concern and increased thepressure on refiners to establish sulphuric acid regeneration plants near the alkylation unit. Insome cases this transport to/from the regeneration facility is by pipeline. However, no majornew improvements have been introduced in sulphuric acid alylation technology dealing with thespent acid issue. Fugitive emissions from this process is similar to the HF alkylation.
Acid-soluble oil should be recycled to process. Tars from the H2SO4 process contain sulphuricand miscellaneous sulphonic acids, which may cause disposal problems. This process generateswaste water that should be neutralised before be routed to WWTP, gum, spent acid, causticsolutions from regeneration and fugitive emissions.
Operational dataThe product quality from butyplenes (primary feedstock) is higher than in HF alkylation. Toproduce an equivalent product quality, HF alkylation would require similar energy consumptionto sulphuric acid alkylation. This type of alkylation is considered relatively safer whencompared to HF catalysed alkylation.
Utilities and chemical consumption (Basis: 716 m3/d of alkylate plant)Power, kW 1779 Compressor 1235 Pumps 303 Mixers 240Cooling Water, m3/h (1) 835Industrial Water, t/d 39Steam, kg/h 3.45 barg 13 10.3 barg 3ChemicalsFresh Acid, t/d (2) 40NaOH (15 Baume), t/d 1.7Notes:(1) Cooling water supply temperature is 26 ºC and the average ∆T is 15 ºC(2) Includes allowance for feed impurities
The sulphuric acid removed need to be regenerated in a sulphuric acid plant which is generallynot a part of the alkylation unit and is normally located off-site.
ApplicabilityFully applicable. This type of process technique is driven by the economics of the proximity ofregeneration facility of sulphuric acid.
Economics
Capacity Estimated costs Units290 kt/yr Material $12.0 million
Labor $1.7 millionUSA Gulf Coast, second quarter1993. Operational datacorrespond to this plant.
28300 m3/d 14.49 M$1590 m3/d $22000 per m3/d USA Gulf Coast, 4th quarter
1998
Techniques to consider in the determination of BAT Chapter 4
MA/EIPPCB/REF_BREF_FINAL December 2001 165
Driving force for implementationAlkylation plant is a refinery process used to increase the gasoline octane.
Example plantsCommonly used.
Reference literature[166, Meyers, 1997], [212, Hydrocarbon processing, 1998], [330, Hommeltoft, 2000], [268,TWG, 2001]
4.2.3 Upgrade feedstock by selective hydrogenation or isomerisation
DescriptionMore information about the processes can be found in Section 2.13, 4.13.5, 2.16 and 4.16.
Achieved environmental benefitsThe naphtha hydrotreatment or isomerisation (e.g. hydrogenation of butadiene, isomerisation of1-butene to 2-butene) helps the alkylation units to reduce the acid losses and consequently thewaste generation. As consequence, the amount caustic consumption is decreased. The reductionin acid and caustic consumption depends on the feed diene content, which varies widely atdifferent refineries.
Cross-media effectsDrawbacks for the implementation of such technique is the increased fuel/energy consumption,the increased fugitive emissions and need for spent catalyst handling used in such a processes.More information about those issues can be found in Sections 4.13 and 4.16.
Operational dataIt requires hydrogen and consumes energy.
ApplicabilityNo restrictions for application.
EconomicsSee Section 4.13 and 4.16.
Driving force for implementationBecause of increased demands for higher octane gasoline and the increased conversion ofheavier crudes to lighter products, there has been a relative decrease in the quality of alkylationfeed throughout the industry.
Reference literature[113, Noyes, 1993], [268, TWG, 2001]
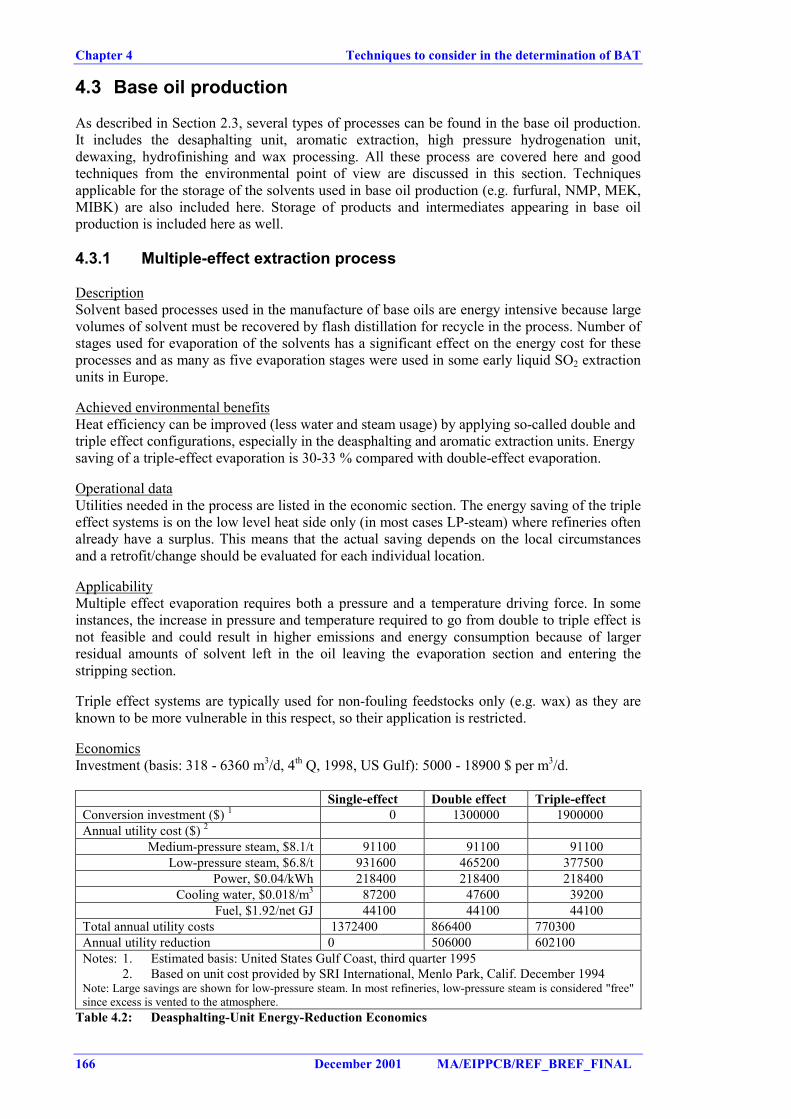
Chapter 4 Techniques to consider in the determination of BAT
166 December 2001 MA/EIPPCB/REF_BREF_FINAL
4.3 Base oil production
As described in Section 2.3, several types of processes can be found in the base oil production.It includes the desaphalting unit, aromatic extraction, high pressure hydrogenation unit,dewaxing, hydrofinishing and wax processing. All these process are covered here and goodtechniques from the environmental point of view are discussed in this section. Techniquesapplicable for the storage of the solvents used in base oil production (e.g. furfural, NMP, MEK,MIBK) are also included here. Storage of products and intermediates appearing in base oilproduction is included here as well.
4.3.1 Multiple-effect extraction process
DescriptionSolvent based processes used in the manufacture of base oils are energy intensive because largevolumes of solvent must be recovered by flash distillation for recycle in the process. Number ofstages used for evaporation of the solvents has a significant effect on the energy cost for theseprocesses and as many as five evaporation stages were used in some early liquid SO2 extractionunits in Europe.
Achieved environmental benefitsHeat efficiency can be improved (less water and steam usage) by applying so-called double andtriple effect configurations, especially in the deasphalting and aromatic extraction units. Energysaving of a triple-effect evaporation is 30-33 % compared with double-effect evaporation.
Operational dataUtilities needed in the process are listed in the economic section. The energy saving of the tripleeffect systems is on the low level heat side only (in most cases LP-steam) where refineries oftenalready have a surplus. This means that the actual saving depends on the local circumstancesand a retrofit/change should be evaluated for each individual location.
ApplicabilityMultiple effect evaporation requires both a pressure and a temperature driving force. In someinstances, the increase in pressure and temperature required to go from double to triple effect isnot feasible and could result in higher emissions and energy consumption because of largerresidual amounts of solvent left in the oil leaving the evaporation section and entering thestripping section.
Triple effect systems are typically used for non-fouling feedstocks only (e.g. wax) as they areknown to be more vulnerable in this respect, so their application is restricted.
EconomicsInvestment (basis: 318 - 6360 m3/d, 4th Q, 1998, US Gulf): 5000 - 18900 $ per m3/d.
Single-effect Double effect Triple-effectConversion investment ($) 1 0 1300000 1900000Annual utility cost ($) 2
Medium-pressure steam, $8.1/t 91100 91100 91100Low-pressure steam, $6.8/t 931600 465200 377500
Power, $0.04/kWh 218400 218400 218400Cooling water, $0.018/m3 87200 47600 39200
Fuel, $1.92/net GJ 44100 44100 44100Total annual utility costs 1372400 866400 770300Annual utility reduction 0 506000 602100Notes: 1. Estimated basis: United States Gulf Coast, third quarter 1995
2. Based on unit cost provided by SRI International, Menlo Park, Calif. December 1994Note: Large savings are shown for low-pressure steam. In most refineries, low-pressure steam is considered "free"since excess is vented to the atmosphere.
Table 4.2: Deasphalting-Unit Energy-Reduction Economics
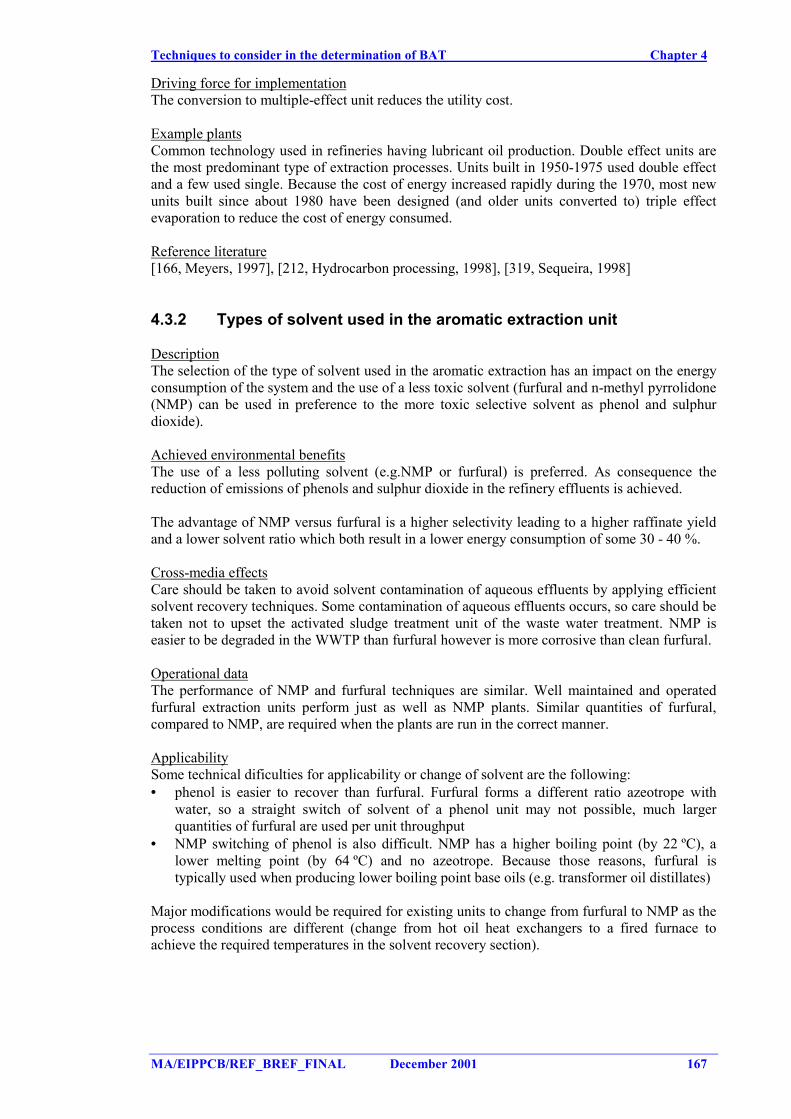
Techniques to consider in the determination of BAT Chapter 4
MA/EIPPCB/REF_BREF_FINAL December 2001 167
Driving force for implementationThe conversion to multiple-effect unit reduces the utility cost.
Example plantsCommon technology used in refineries having lubricant oil production. Double effect units arethe most predominant type of extraction processes. Units built in 1950-1975 used double effectand a few used single. Because the cost of energy increased rapidly during the 1970, most newunits built since about 1980 have been designed (and older units converted to) triple effectevaporation to reduce the cost of energy consumed.
Reference literature[166, Meyers, 1997], [212, Hydrocarbon processing, 1998], [319, Sequeira, 1998]
4.3.2 Types of solvent used in the aromatic extraction unit
DescriptionThe selection of the type of solvent used in the aromatic extraction has an impact on the energyconsumption of the system and the use of a less toxic solvent (furfural and n-methyl pyrrolidone(NMP) can be used in preference to the more toxic selective solvent as phenol and sulphurdioxide).
Achieved environmental benefitsThe use of a less polluting solvent (e.g.NMP or furfural) is preferred. As consequence thereduction of emissions of phenols and sulphur dioxide in the refinery effluents is achieved.
The advantage of NMP versus furfural is a higher selectivity leading to a higher raffinate yieldand a lower solvent ratio which both result in a lower energy consumption of some 30 - 40 %.
Cross-media effectsCare should be taken to avoid solvent contamination of aqueous effluents by applying efficientsolvent recovery techniques. Some contamination of aqueous effluents occurs, so care should betaken not to upset the activated sludge treatment unit of the waste water treatment. NMP iseasier to be degraded in the WWTP than furfural however is more corrosive than clean furfural.
Operational dataThe performance of NMP and furfural techniques are similar. Well maintained and operatedfurfural extraction units perform just as well as NMP plants. Similar quantities of furfural,compared to NMP, are required when the plants are run in the correct manner.
ApplicabilitySome technical dificulties for applicability or change of solvent are the following:• phenol is easier to recover than furfural. Furfural forms a different ratio azeotrope with
water, so a straight switch of solvent of a phenol unit may not possible, much largerquantities of furfural are used per unit throughput
• NMP switching of phenol is also difficult. NMP has a higher boiling point (by 22 ºC), alower melting point (by 64 ºC) and no azeotrope. Because those reasons, furfural istypically used when producing lower boiling point base oils (e.g. transformer oil distillates)
Major modifications would be required for existing units to change from furfural to NMP as theprocess conditions are different (change from hot oil heat exchangers to a fired furnace toachieve the required temperatures in the solvent recovery section).
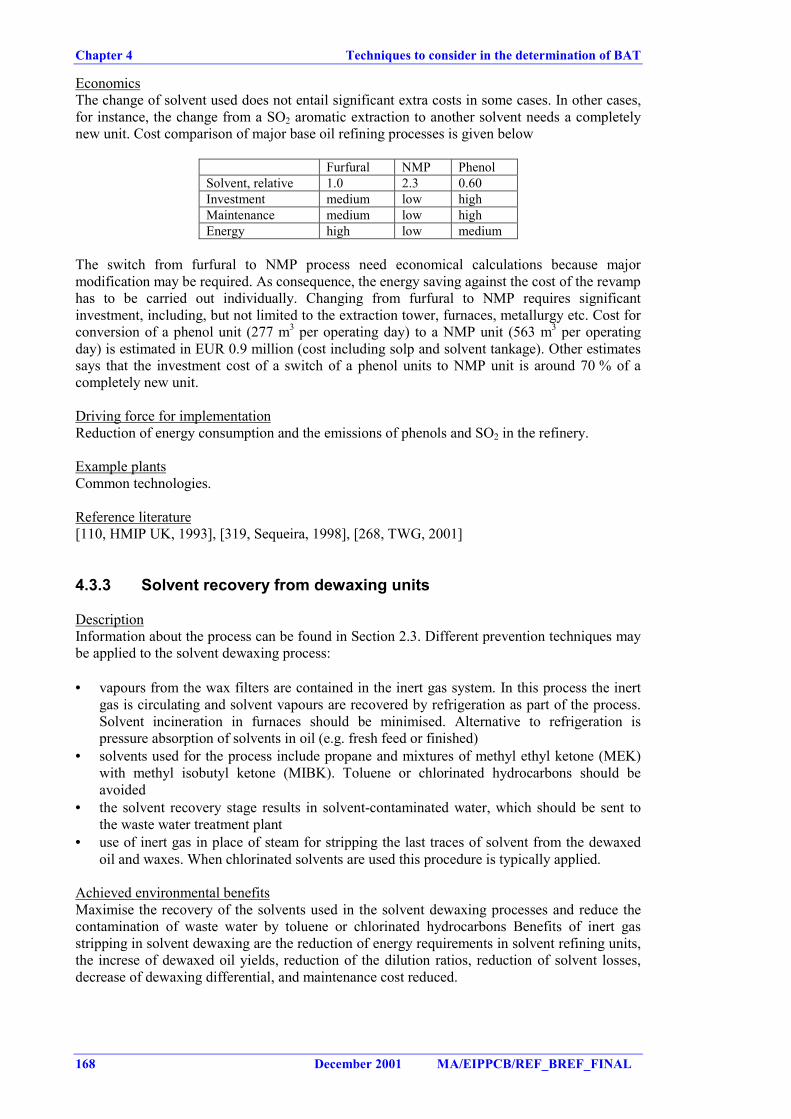
Chapter 4 Techniques to consider in the determination of BAT
168 December 2001 MA/EIPPCB/REF_BREF_FINAL
EconomicsThe change of solvent used does not entail significant extra costs in some cases. In other cases,for instance, the change from a SO2 aromatic extraction to another solvent needs a completelynew unit. Cost comparison of major base oil refining processes is given below
Furfural NMP PhenolSolvent, relative 1.0 2.3 0.60Investment medium low highMaintenance medium low highEnergy high low medium
The switch from furfural to NMP process need economical calculations because majormodification may be required. As consequence, the energy saving against the cost of the revamphas to be carried out individually. Changing from furfural to NMP requires significantinvestment, including, but not limited to the extraction tower, furnaces, metallurgy etc. Cost forconversion of a phenol unit (277 m3 per operating day) to a NMP unit (563 m3 per operatingday) is estimated in EUR 0.9 million (cost including solp and solvent tankage). Other estimatessays that the investment cost of a switch of a phenol units to NMP unit is around 70 % of acompletely new unit.
Driving force for implementationReduction of energy consumption and the emissions of phenols and SO2 in the refinery.
Example plantsCommon technologies.
Reference literature[110, HMIP UK, 1993], [319, Sequeira, 1998], [268, TWG, 2001]
4.3.3 Solvent recovery from dewaxing units
DescriptionInformation about the process can be found in Section 2.3. Different prevention techniques maybe applied to the solvent dewaxing process:
• vapours from the wax filters are contained in the inert gas system. In this process the inertgas is circulating and solvent vapours are recovered by refrigeration as part of the process.Solvent incineration in furnaces should be minimised. Alternative to refrigeration ispressure absorption of solvents in oil (e.g. fresh feed or finished)
• solvents used for the process include propane and mixtures of methyl ethyl ketone (MEK)with methyl isobutyl ketone (MIBK). Toluene or chlorinated hydrocarbons should beavoided
• the solvent recovery stage results in solvent-contaminated water, which should be sent tothe waste water treatment plant
• use of inert gas in place of steam for stripping the last traces of solvent from the dewaxedoil and waxes. When chlorinated solvents are used this procedure is typically applied.
Achieved environmental benefitsMaximise the recovery of the solvents used in the solvent dewaxing processes and reduce thecontamination of waste water by toluene or chlorinated hydrocarbons Benefits of inert gasstripping in solvent dewaxing are the reduction of energy requirements in solvent refining units,the increse of dewaxed oil yields, reduction of the dilution ratios, reduction of solvent losses,decrease of dewaxing differential, and maintenance cost reduced.
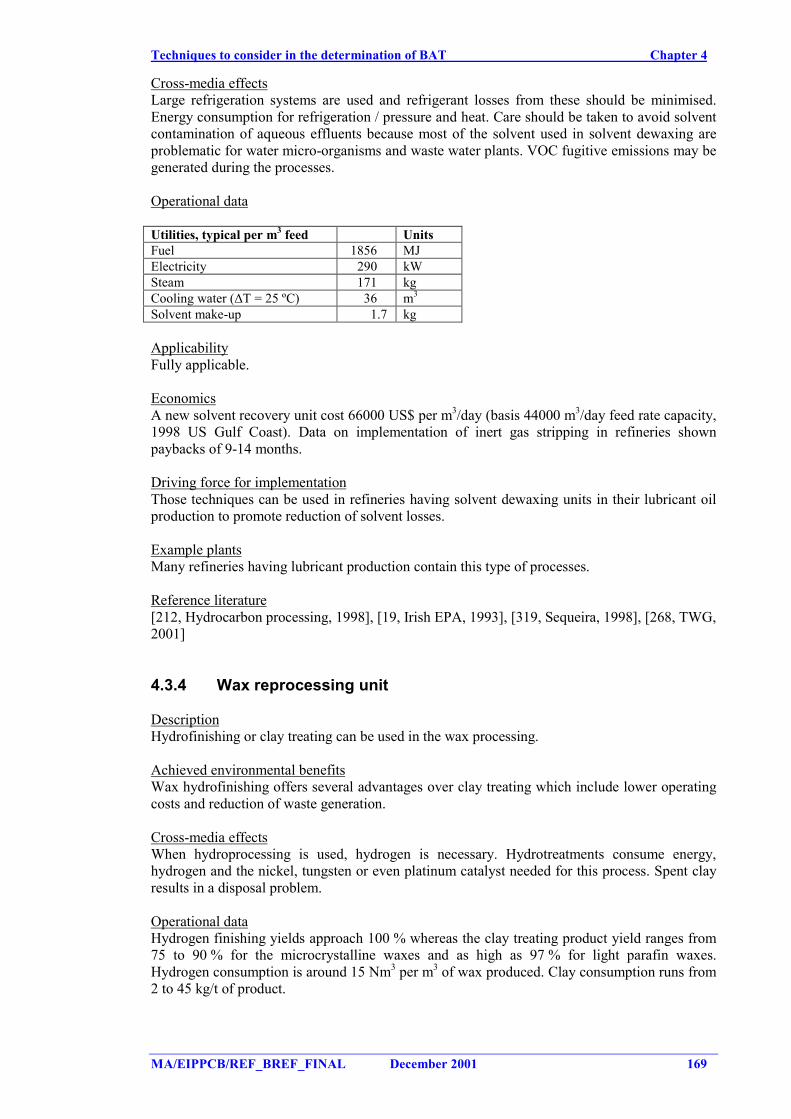
Techniques to consider in the determination of BAT Chapter 4
MA/EIPPCB/REF_BREF_FINAL December 2001 169
Cross-media effectsLarge refrigeration systems are used and refrigerant losses from these should be minimised.Energy consumption for refrigeration / pressure and heat. Care should be taken to avoid solventcontamination of aqueous effluents because most of the solvent used in solvent dewaxing areproblematic for water micro-organisms and waste water plants. VOC fugitive emissions may begenerated during the processes.
Operational data
Utilities, typical per m3 feed UnitsFuel 1856 MJElectricity 290 kWSteam 171 kgCooling water (∆T = 25 ºC) 36 m3
Solvent make-up 1.7 kg
ApplicabilityFully applicable.
EconomicsA new solvent recovery unit cost 66000 US$ per m3/day (basis 44000 m3/day feed rate capacity,1998 US Gulf Coast). Data on implementation of inert gas stripping in refineries shownpaybacks of 9-14 months.
Driving force for implementationThose techniques can be used in refineries having solvent dewaxing units in their lubricant oilproduction to promote reduction of solvent losses.
Example plantsMany refineries having lubricant production contain this type of processes.
Reference literature[212, Hydrocarbon processing, 1998], [19, Irish EPA, 1993], [319, Sequeira, 1998], [268, TWG,2001]
4.3.4 Wax reprocessing unit
DescriptionHydrofinishing or clay treating can be used in the wax processing.
Achieved environmental benefitsWax hydrofinishing offers several advantages over clay treating which include lower operatingcosts and reduction of waste generation.
Cross-media effectsWhen hydroprocessing is used, hydrogen is necessary. Hydrotreatments consume energy,hydrogen and the nickel, tungsten or even platinum catalyst needed for this process. Spent clayresults in a disposal problem.
Operational dataHydrogen finishing yields approach 100 % whereas the clay treating product yield ranges from75 to 90 % for the microcrystalline waxes and as high as 97 % for light parafin waxes.Hydrogen consumption is around 15 Nm3 per m3 of wax produced. Clay consumption runs from2 to 45 kg/t of product.
Chapter 4 Techniques to consider in the determination of BAT
170 December 2001 MA/EIPPCB/REF_BREF_FINAL
ApplicabilityHydrofinishing is fully applicable especially when hydrogen is available. However, in somecases, hydrofinishing processes cannot reach certain very special product quality specifications.
EconomicsInvestment cost for a wax hidrofinishing process is EUR 1 million for a feed capacity of 20000t/yr.
Driving force for implementationHydrotreating offers a lower operating cost.
Example plantsMany examples exists.
Reference literature[319, Sequeira, 1998], [268, TWG, 2001]
4.3.5 Lube oil clean-up
DescriptionA short description of the process can be found in Section 2.3. The use of hydrotreating orsulphuric acid and clay treatments are treatments used in the lube oil clean-up.
Achieved environmental benefitsThe use of hydrotreatment intead of the other cleaning techniques reduces waste generation.
Cross-media effectsHydrotreatments consume energy, hydrogen and the nickel, tungsten or even platinum catalystneeded for this process.
Operational dataIn stand-alone luboil refineries, the small amounts of H2S generated due to hydrotreatment arenormally incinerated because the erection of a Claus unit is not justified economically.
ApplicabilityFully applicable. However, in some cases, hydrofinishing processes cannot reach certain veryspecial product quality specifications.
Driving force for implementationTechnology that may be used in refineries having lubricant oil production for the production ofcleaner lubricants.
Example plantsSulphuric acid and clay treatments are typically used in old plants.
Reference literature[19, Irish EPA, 1993], [268, TWG, 2001]
4.3.6 Storage of base oil intermediates and products
DescriptionStorage of intermediates and products from base oil production is typically found in base oilproduction units.
Techniques to consider in the determination of BAT Chapter 4
MA/EIPPCB/REF_BREF_FINAL December 2001 171
Achieved environmental benefitsReduce risk of leaking and VOC emissions
4.3.7 Storage and benchmarking of solvents
DescriptionSolvent used in the solvent extraction of aromatics should be stored in blanketed tanks tominimise fugitive emissions of furfural, NMP and MEK/toluene. The practice of internal and/orexternal benchmarking may reduce the solvent consumption.
Achieved environmental benefitsReduce VOC emissions, leakage prevention and reduction of solvent consumption. Preventionof leakage of solvents soluble in water reduce the contamination of soil and groundwater.
ApplicabilityThose tehniques can be seen as part of the VOC abatement programme (4.23.6) or soilcontamination prevention programme (4.25.1).
Driving force for implementationToluene and MEK should be routinely nitrogen blanketed, mainly to reduce fire hazard ratherthan to prevent VOC emissions; higher boiling range solvents, such as furfural and NMP areless prone to VOC releases and may be blanketed mainly to prevent oxidative degradation(furfural) or to reduce nuisance odorous.
Example plantsBenchmarking of solvents and leakage prevention is widely applied in refineries.
Reference literature[297, Italy, 2000], [268, TWG, 2001]
4.3.8 Sulphur treatment from hydrogenation units
DescriptionHydrogenation processes generate H2S. As consequence off-gases containing H2S are recoveredin a sulphur recovery plant (See Section 4.23.5) or incinerated.
Achieved environmental benefitsReduction of sulphur and H2S emissions.
Cross-media effectsAmine recovery of H2S consumes energy and chemicals. Sulphur recovery units consumesenergy (see Section 4.23.5). Incineration requires fuel.
Operational dataSee Section 4.23.5
ApplicabilityIn stand-alone luboil refineries, the small amounts of H2S generated in this process are typicallyincinerated. Sulphur recovery is less commonly applied in those specialised refineries.
EconomicsSee Section 4.23.5. Data from EU refineries have found that the implementation SRU in stand-alone lubricant refineries producing more than 2 tonnes of sulphur per day is cost-effective.
Chapter 4 Techniques to consider in the determination of BAT
172 December 2001 MA/EIPPCB/REF_BREF_FINAL
Driving force for implementationReduction of sulphur oxide and H2S emissions.
Example plantsAt least one specialised European refinery has a SRU which recover 99.1 % of the sulphur inthe acid gas.
Reference literature[147, HMIP UK, 1995], [268, TWG, 2001]
4.3.9 Stripping of waste water from aromatic extraction
DescriptionStripping of waste water from aromatic extraction prior to sending to waste water treatmentplant. Other technique to consider is dehydration/settling.
Achieved environmental benefitsReduce the content of organic and sulphur compounds of waste water produced in the aromaticextraction. Other benefits are energy requirements reduced, dewaxed oil yield increased,dewaxing differential decreased, dilution ratios reduced, solvent losses reduced andmaintenance costs reduced.
Cross-media effectsStripping consumes energy.
Operational dataStripping consumes energy.
ApplicabilityFully applicable
Driving force for implementationEnergy consumption reduction and reduction of solvent losses.
Example plantsApplied in some refineries.
Reference literature[147, HMIP UK, 1995], [319, Sequeira, 1998], [268, TWG, 2001]
4.3.10 Hot oil system
DescriptionWhen the base oil production units have a single energy system, the introduction of clean-upfacilities in the flue gases is more cost-effective.
Achieved environmental benefitsReduction of SOx, NOx, particulates emissions from the energy system.
Cross-media effectsSee different cross-media for the abatement of SOx, NOx and particulates in Section 4.23
Operational dataSee Section 4.23
Techniques to consider in the determination of BAT Chapter 4
MA/EIPPCB/REF_BREF_FINAL December 2001 173
ApplicabilityThis technique may be very difficult to be applied to existing refineries.
EconomicsSee Section 4.23
Driving force for implementationReduction of SOx, NOx, particulates emissions from the energy system.
Example plantsSome stand-alone lubricant refineries have already applied this concept to reduce emissionscoming from the burning of liquid fuels.
Reference literature[268, TWG, 2001]
Chapter 4 Techniques to consider in the determination of BAT
174 December 2001 MA/EIPPCB/REF_BREF_FINAL
4.4 Bitumen production
4.4.1 Storage of bitumen products
DescriptionBitumen should be stored in proper storage tanks normally under heating conditions andinsulated. Bitumen is not handled as a solid because is too difficult and is very intensive in manpower. Loading and unloading of the tank is typically done as follow. When the tank is filled,nitrogen does not flow to the tank, and the pressure is lowered by letting part of the gas go to theatmosphere. When the tank is unloaded on a low speed, a little bit nitrogen is led to the tank.However when the speed of unload is higher, higher amounts of nitrogen must be used. If thetank would be equipped with some cleaning system, it must be mechanically very simple andeasy to clean.
Achieved environmental benefitsFor safety reasons, bitumen tanks are equipped with nitrogen blanketing and pressure/vacuumsafety valve. Those valves need maintenance due to the slime.
Cross-media effectsHydrocarbons and sulphur compounds may emanate from leakages (particularly in overheadsystems) and pressure relief valves and in the form of aerosol-containing liquid droplets fromthe venting of tanker top-loading operations.
Operational dataElectricity hot oil and low pressure steam can be used for heating. The heat exchanger can beinside the tank or outside the tank in which case bitumen is circulated through it. Difference intemperature should not be too high due to the surface temperature and coking.
ApplicabilityStorage of bitumen products is done in refineries that have bitumen production. Preventiontechniques as mentioned are typically applied.
Driving force for implementationFor safety reasons, bitumen tanks are equipped with nitrogen blanketing and pressure/vacuumsafety valve.
Example plantsSome refineries in Europe use those techniques mentioned here.
Reference literature[268, TWG, 2001]
4.4.2 Techniques to control emissions to the air
4.4.2.1 Treatment of the gaseous overheads
DescriptionOxidiser overhead can be routed to a scrubber rather than direct water quenching forcontaminant removal prior to incineration.
Achieved environmental benefitsReduction of H2S, SO2, SO3, CO, VOC, particulates, smoke and odour emissions.
Techniques to consider in the determination of BAT Chapter 4
MA/EIPPCB/REF_BREF_FINAL December 2001 175
Cross-media effectsAdditional contaminated water. Scrubber water is dirty and requires oil and solids separationprior to re-use as desalter wash water and/or biotreatment. The sour water from the scrubber isrouted to and stripped in a sour water stripper prior to re-use and/or purification.
ApplicabilityTypically applied to overheads from the bitumen blowing systems
Reference literature[147, HMIP UK, 1995]
4.4.2.2 Use the heat from incondensable products and condensates
Description• Both incondensable products and condensates from the separator, hydrocarbon and aqueous,
can be burnt in a purpose-designed incinerator, using support fuel as necessary or in processheaters.
• Oxidiser overhead slop oil can also be treated in the sludge processing or recycled in therefinery slop oil system.
Achieved environmental benefitsReduction of emulsion of light oil, water and particulates. Another environmental benefit is theremoval of foul smelling odorous incondensables difficult to treat elsewhere.
Cross-media effectsOn scrubbing, aerosols can give rise to plugging. Additional contaminated water streams. In awell operated unit, SO2 or odour from incineration of bitumen blowing incondensables do notpose any problem.
Operational dataThe incinerator should operate at a temperature of at least 800 ºC and the combustion chambersshould have a residence time of at least 0.5 second. The oxygen concentration at the combustionchamber outlet should be greater than 3 % v/v. Low-NOx burners can be fitted in thoseincinerators.
ApplicabilityWidely used to get rid of bitumen fumes. Incondensable and/or condensates can be burnt inprocess heaters. However they should be treated or scrubbed to remove compounds of sulphuror combustion products that may cause odours or other environmental problems.
Driving force for implementationReduction of odours, sludge and oily waste.
Example plantsMany bitumen oxidisers have associated facilities to handle gas and liquid wastes.
Reference literature[147, HMIP UK, 1995]
Chapter 4 Techniques to consider in the determination of BAT
176 December 2001 MA/EIPPCB/REF_BREF_FINAL
4.4.2.3 Treatment of vents from storage and handling bitumen materials
DescriptionTechniques that may be applied to prevent VOC emissions and odours are:• odorous gases vented during the storage of bitumens and the tank blending/filling operation
can be vented to an incinerator• the use of compact wet-type electrostatic precipitators has been proven capable of
successfully removing the liquid element of the aerosol generated during the top-loading oftankers.
Achieved environmental benefitsReduction of emissions of sulphur compounds, VOC, particulates, smoke and odour emissions.
Cross-media effectsEnergy consumption and in case of wet ESP waste generation.
Operational dataIn the waste gas of a cleaning unit, a mass concentration of VOC of a total of 150 mg/Nm³ canbe complied with. In the waste gas of a incineration plant, a mass concentration of VOC, givenas total C, of a total of 20 mg/Nm³ can be complied with (Half-hourly mean values attainable incontinuos operation).
ApplicabilityFully applicable.
Driving force for implementationReduction of emissions and nuissance.
Reference literature[147, HMIP UK, 1995], [117, VDI, 2000]
4.4.2.4 Sulphur dioxide abatement and sulphur recovery units
DescriptionSOx abatement techniques and SRU are techniques to reduce sulphur emissions. Those areextensivelly documented in Section 4.23.5.
Achieved environmental benefitsReduction of sulphur emission
Cross-media effectsSee Section 4.23.5 for the different techniques applicable.
Operational dataSee Section 4.23.5 for the different techniques applicable.
ApplicabilityThe implementation of those techniques are extremely linked to the rest of the refinery. Instand-alone bitumen refineries its application is more restricted.
EconomicsSee Section 4.23.5 for the different techniques applicable.
Driving force for implementationReduction of sulphur emissions
Techniques to consider in the determination of BAT Chapter 4
MA/EIPPCB/REF_BREF_FINAL December 2001 177
Example plantsThose techniques are applied in many refineries. However less applications are found in stand-alone bitumen production refineries.
Reference literature[268, TWG, 2001]
4.4.3 Techniques to control emissions to the waste water
DescriptionOxidiser overhead waste water accumulated in the overhead condensate collection drum can besent to a sour water stripper prior to sending it to the effluent water treatment facilities.
Achieved environmental benefitsThe stripping reduces the H2S, oil, aromatics, volatile PAHs, sulphuric acid and odorousoxidation products (ketones, aldehydes, fatty acids) in the sour waste water reducing the chargeto the central waste water system of the refinery.
Cross-media effectsIncrease of oil and particulates load to sour water stripper.
ApplicabilityTypically applied to waste water from bitumen blowing.
Driving force for implementationReduction of the pollutant charge to the refinery waste water treatment.
Reference literature[147, HMIP UK, 1995], [268, TWG, 2001]
4.4.4 Techniques for prevention of generation of waste
DescriptionIn the bitumen production facilities, including storage, leakages can be produced. Thoseleakages typically generate waste when mixed with other components as sand.
Achieved environmental benefitsReduction of waste production
Operational dataThis can be seen as a part of a waste management programme described in Section 4.25.1.
ApplicabilityFully applicable
Driving force for implementationReduction of waste and cleaning
Example plantsMany refineries apply those type of systems.
Reference literature[268, TWG, 2001]
Chapter 4 Techniques to consider in the determination of BAT
178 December 2001 MA/EIPPCB/REF_BREF_FINAL
4.4.5 Hot oil system
DescriptionWhen the bitumen production units have a single energy system, the introduction of clean-upfacilities in the flue gases is more cost-effective.
Achieved environmental benefitsReduction of SOx, NOx, particulates emissions from the energy system.
Cross-media effectsSee different cross-media for the abatement of SOx, NOx and particulates in Section 4.23
Operational dataSee Section 4.23
ApplicabilityThis technique may be very difficult to be applied to existing refineries.
EconomicsSee Section 4.23
Driving force for implementationReduction of SOx, NOx, particulates emissions from the energy system.
Example plantsSome stand-alone bitumen refineries have already applied this concept to reduce emissionscoming from the burning of liquid fuels.
Reference literature[268, TWG, 2001]
Techniques to consider in the determination of BAT Chapter 4
MA/EIPPCB/REF_BREF_FINAL December 2001 179
4.5 Catalytic cracking
Several types of techniques are considered in this section. The first group of techniques(Sections 4.5.1 to 4.5.3) corresponds to the types of catalytic cracking processes. Those sectionsgive the emission values that can be achieved without use of abatement techniques (where datais available). The remaining sections correspond to end-of pipe techniques applicable tocatcrackers.
4.5.1 Full combustion mode in regenerator
DescriptionThis section gives emission information from the FCC when it is run under favourableconditions and the regenerator in total combustion mode. Operational techniques that affect theemissions from the FCC are also discussed. A description of the process can be found in Section2.5.
Achieved environmental benefitsSome operating modes that can reduce the emission of pollutants from the FCC are thefollowing:• when operating a FCC in full combustion mode, and with an excess of oxygen greater than
2 %, the amount of CO produced can range from 35 to 250 mg/Nm3 (Value attainable incontinuous operation. Emissions values as half-hourly mean values)
• in full combustion mode, a CO oxidation promoter can be added to the regenerator tocatalyse the oxidation of CO. However, this promoter also catalyses the oxidation of thefuel nitrogen in the coke, increasing the NOx levels (especially NO). Platinum catalyst maypromote the generation of N2O. Consequently, the amount of CO promoter varies therelationship between the NOx emissions and CO emissions. However; values of 300 - 700mg/Nm3 of NOx (3 % O2) can be achieved
• minimisation of the use of aeration and purge steam can decrease particulate emissionssignificantly. Aeration/steam rates are based on achieving a stable catalyst circulation in thecatalyst lines between reactor and regenerator
• proper loading and pre-sulphiding procedures, good reactor temperature control and goodflow distribution can reduce catalyst losses
• stripping of catalyst before reaction or before regeneration helps to reduce the cokeformation
• temperature adjustment in the riser by injection of a recycle stream above the zone of thefresh feed injection.
• modification of the design and operation of regenerator especially to avoid high temperaturespots that tend to increase the NOx formation.
Cross-media effectsThe catcracker is the source of SO2 and NOx, CO2, CO, dust (particulates), N2O, SO3, metals,hydrocarbons (ex. aldehydes), ammonia emissions, as discussed in Section 3.5. For example,the basic design of a FCC includes two-stage cyclones in the regenerator vessel, which preventthe bulk of the fine catalyst used from escaping from the system. However, smaller catalystparticles, some of which are introduced with fresh catalyst and some created by attrition in thecirculating system, are not easily retained by the two-stage cyclone system. Consequently, inmany cases, other abatement techniques can be included to complement the process abatementtechniques discussed here. Next table gives a summary of the lowest emissions of pollutants tothe atmosphere due to an uncontrolled catcracker (No end-of-pipe technology is used to abateair emissions).
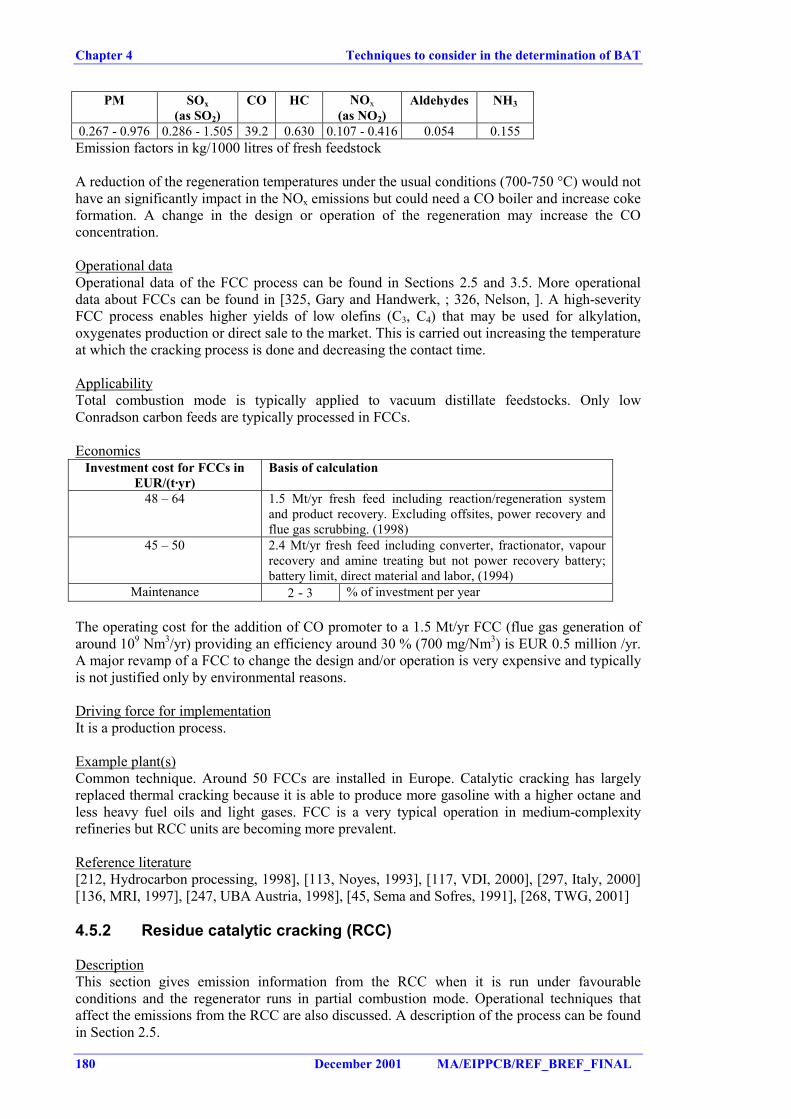
Chapter 4 Techniques to consider in the determination of BAT
180 December 2001 MA/EIPPCB/REF_BREF_FINAL
PM SOx(as SO2)
CO HC NOx(as NO2)
Aldehydes NH3
0.267 - 0.976 0.286 - 1.505 39.2 0.630 0.107 - 0.416 0.054 0.155Emission factors in kg/1000 litres of fresh feedstock
A reduction of the regeneration temperatures under the usual conditions (700-750 °C) would nothave an significantly impact in the NOx emissions but could need a CO boiler and increase cokeformation. A change in the design or operation of the regeneration may increase the COconcentration.
Operational dataOperational data of the FCC process can be found in Sections 2.5 and 3.5. More operationaldata about FCCs can be found in [325, Gary and Handwerk, ; 326, Nelson, ]. A high-severityFCC process enables higher yields of low olefins (C3, C4) that may be used for alkylation,oxygenates production or direct sale to the market. This is carried out increasing the temperatureat which the cracking process is done and decreasing the contact time.
ApplicabilityTotal combustion mode is typically applied to vacuum distillate feedstocks. Only lowConradson carbon feeds are typically processed in FCCs.
EconomicsInvestment cost for FCCs in
EUR/(t·yr)Basis of calculation
48 – 64 1.5 Mt/yr fresh feed including reaction/regeneration systemand product recovery. Excluding offsites, power recovery andflue gas scrubbing. (1998)
45 – 50 2.4 Mt/yr fresh feed including converter, fractionator, vapourrecovery and amine treating but not power recovery battery;battery limit, direct material and labor, (1994)
Maintenance 2 - 3 % of investment per year
The operating cost for the addition of CO promoter to a 1.5 Mt/yr FCC (flue gas generation ofaround 109 Nm3/yr) providing an efficiency around 30 % (700 mg/Nm3) is EUR 0.5 million /yr.A major revamp of a FCC to change the design and/or operation is very expensive and typicallyis not justified only by environmental reasons.
Driving force for implementationIt is a production process.
Example plant(s)Common technique. Around 50 FCCs are installed in Europe. Catalytic cracking has largelyreplaced thermal cracking because it is able to produce more gasoline with a higher octane andless heavy fuel oils and light gases. FCC is a very typical operation in medium-complexityrefineries but RCC units are becoming more prevalent.
Reference literature[212, Hydrocarbon processing, 1998], [113, Noyes, 1993], [117, VDI, 2000], [297, Italy, 2000][136, MRI, 1997], [247, UBA Austria, 1998], [45, Sema and Sofres, 1991], [268, TWG, 2001]
4.5.2 Residue catalytic cracking (RCC)
DescriptionThis section gives emission information from the RCC when it is run under favourableconditions and the regenerator runs in partial combustion mode. Operational techniques thataffect the emissions from the RCC are also discussed. A description of the process can be foundin Section 2.5.
Techniques to consider in the determination of BAT Chapter 4
MA/EIPPCB/REF_BREF_FINAL December 2001 181
Achieved environmental benefitsPossibility to upgrade heavier residues than with the FCC (e.g. vacuum residue or low addedvalue residues). As consequence, the RCC can provide positive environmental benefit to reducethe generation of residue in the refinery that otherwise may go to bunker and other heavy fuels.Those fuels may finally be used in combustion processes generating SO2, NOx and metals.Other operational benefits of the RCC over the FCC with environmental consequences are:• use of two-stage catalyst regeneration as alternative to a catalyst cooler so as to control the
heat release due to coke combustion and can process feeds up to 10 % w/w Conradsoncarbon
• stripping of catalyst before reaction or before regeneration helps to reduce the cokeformation
• temperature adjustment in the rise by injection of a recycle stream above the zone of thefresh feed injection
• CO boiler and expander benefits used in RCC are analysed in Section 4.5.5.
Cross-media effectsSome feedstocks may need hydrotreatment.
ApplicabilityFully applicable. FCC can be retrofitted to RCC. Medium Conradson carbon feeds would need aCO boiler and higher ones a catalyst cooler. Metal content (Ni, V) should be limited; residuedemetallisation/hydrotreating may extend the range of residual feedstocks. It can run withcarbon Conradson index lower than 6 - 8 % and the total metal content less than 20 ppm.Example plantsSeveral examples in Europe.
Reference literature[212, Hydrocarbon processing, 1998]
4.5.3 Partial combustion mode in the regenerator
DescriptionFCC regenerators are operated either in a complete (considered in this document as the basisoperational mode) or partial combustion mode. In the partial combustion mode considerable COis present in the flue gas and it is consumed downstream of the regenerator in a CO boiler, bothto recover the energy produced in a CO boiler and to meet environmental requirements. Thissystem can be seen as two stage regeneration in comparison with the total combustion mode,where a single regeneration step is present. Another technique to consider is the modification ofthe design and operation of regenerator especially to avoid high temperature spots that tend toincrease the NOx formation.
Achieved environmental benefitsThe use of partial combustion mode together with a CO boiler generates less CO and NOxemissions compared with full combustion. The use of a CO boiler or high-temperatureregeneration technology can significantly reduce the CO emissions. CO achieved emissions arefrom less than 50 - 400 mg/Nm3 (3 % O2 daily average). In the CO boiler, refinery fuel gasaddition is required to incinerate CO (~900 °C). The advantage of partial combustion coupledwith a CO boiler is lower NOx (100 - 500 mg/Nm3 (3 % O2, daily average, standard conditions)),ammonia and hydrocarbons emissions. Emissions of SOx and particulates are not affected bythis mode of operation.
The emission factors for a cracking unit with an electrostatic precipitator and a CO boiler areshown below.
Chapter 4 Techniques to consider in the determination of BAT
182 December 2001 MA/EIPPCB/REF_BREF_FINAL
Process PM SOx(as SO2)
CO HC NOx(as NO2)
Aldehydes NH3
FCC with ESP andCO boiler
0.020 - 0.428 0.286 - 1.505 Neg Neg 0.107 - 0.416 Neg Neg
Neg: Negligible
Table 4.3: Emission factors for cracking (units in kg/1000 litres of fresh feed)
Cross-media effectsFuel gas is needed for the incineration of CO. If fuel contains sulphur, emissions of SO2 mayoccur. Other benefits are greater throughputs and heat/power recovery.
Operational dataWhere a CO boiler is installed it should be carefully designed and operated to minimise CO andNOx releases.
ApplicabilityThis mode of combustion is fully applicable. In general it can be said that feed having aConradson carbon figure up to 2 - 3 % can be processed in a ‘standard’ FCC without CO boileras well as partial-burn FCC. A Conradson figure from 2 - 5 % would require a CO boiler andfrom 5 - 10 % a cat cooler would be needed. It should be noted that the above figures are onlyindicative and depend also on the severity of cracking.
EconomicsInvestment cost necessary to convert a FCC from total to partial combustion mode is aroundEUR 2.5 - 4 million. A major revamp of a FCC to change the design and/or operation is veryexpensive and typically is not justified only by environmental reasons.
Driving force for implementationProduction process.
Example plantsCarbon monoxide boiler is normally a standard practice in fluidised catalytic cracking units inthe USA. Many examples also in Europe and the rest of the world.
Reference literature[297, Italy, 2000], [316, TWG, 2000], [268, TWG, 2001]
4.5.4 Hydrotreatment of feed to the catcraker
DescriptionHydrotreatment of feed to the catcracker operates at similar conditions to those used for gasoiland atmospheric residue hydrotreatment (see Sections 2.13 and 4.13).
Achieved environmental benefitsFCC feed hydrotreatment can reduce the sulphur content to <0.1 – 0.5 % w/w (depending on thefeedstock). As a consequence of the hydrotreatment, emissions of SO2 from the regenerator canbe reduced by up to 90 % (flue gas concentration 200 - 600 mg/Nm3 (3 % O2) depending on thefeedstock) and nitrogen compounds can be reduced by up to 75 – 85 % (smaller percentage forthe partial combustion mode). Be aware that a percentage on reduction of nitrogen compoundsdoes not lead to equivalent NOx reduction. This process also reduces the metal emissions (e.g.Ni, V) to the air and prolongs the life of the catcracker catalyst. Other benefit of this techniqueis that hydrotreated mercaptane oxidation is not necessary. This reduces amount of used causticand emissions into water.
Techniques to consider in the determination of BAT Chapter 4
MA/EIPPCB/REF_BREF_FINAL December 2001 183
Cross-media effectsCross-media effects are the increase of energy consumption and the consequent increase in CO2emissions, due mainly to the hydrogen, as discussed in Section 3.14. As discussed in Section4.13, hydrotreatment processes generate catalyst for disposal and increase the H2S productionwith direct consequences for the sour water stripper and sulphur recovery units (which mayneed to be enlarged or replaced).
Operational dataInstallation of catcracker feed hydrotreatment (or a feed hydrocracker) will reduce the sulphurcontent in catcracker products and improve their quality, so that they require less finalprocessing. Hydrogen and energy are required for this process. The water used for the differentcatalytic sections yields 20 - 40 m3/h of sour water. The sulphur removal efficiency achieved byhydrotreatment depends on the boiling range of the catcracker feed. The heavier the feed, themore energy is required for the same sulphur removal efficiency.
ApplicabilityFully applicable. This process is more cost-effective when hydrogen, SWS and SRU capacitiesare available in the refinery.
EconomicsSize/capacity
ktonnes/yrTypical capital/installed cost (EUR million)
Costs include necessary interconnections to existing plant forintegration purposes.
Operating costEUR million/yr
1250 65 n.a.2500 106 183750 150 n.a.
Note: The cost assumes that there is adequate space and existing SRU (sulphur recovery units) and sourwater stripping capacity. If further hydrogen production is needed, a new hydrogen plant for a 2500 kt/yrFCCU feed hydrotreater or hydrocracker would typically cost in the range of EUR 60 - 75 millions
Table 4.4: Catalytic feed hydrotreatment (typical feeds being atmospheric residue and vacuumgas oil)Source: [112, Foster Wheeler Energy, 1999]
Distillate feeddesulphurisation
Residue feeddesulphurisation
Feedstock hydrotreating toreduce NOx
Capacity of process 1.5 Mt/yr 1.5 Mt/yr 1.5 Mt/yr FCCU with CO BoilerInvestmentexpenses(EUR million)
80 - 100 345 - 50 1,2
200 - 300 2,3 80 - 100
Operating expenses(EUR million/yr)
4 - 9 15 - 25 330 - 50 2
4 - 9
1 Excluding H2 production and H2S handling facilities2 [45, Sema and Sofres, 1991]3 [115, CONCAWE, 1999]
Driving force for implementationThe implementation of this technique is typically product specification driven because higherconversions are achieved with hydrotreated feedstocks. The majority of the products producedby the catcracker without previous hydrotreatment need further treatment to comply withproduct specifications. Moreover, the flue gas from the regenerator contributes significantly tothe overall refinery SOx / NOx emissions. Desulphurisation or mild hydrocracking of the feed isan option to reduce those emissions.
Example plantsMany examples.
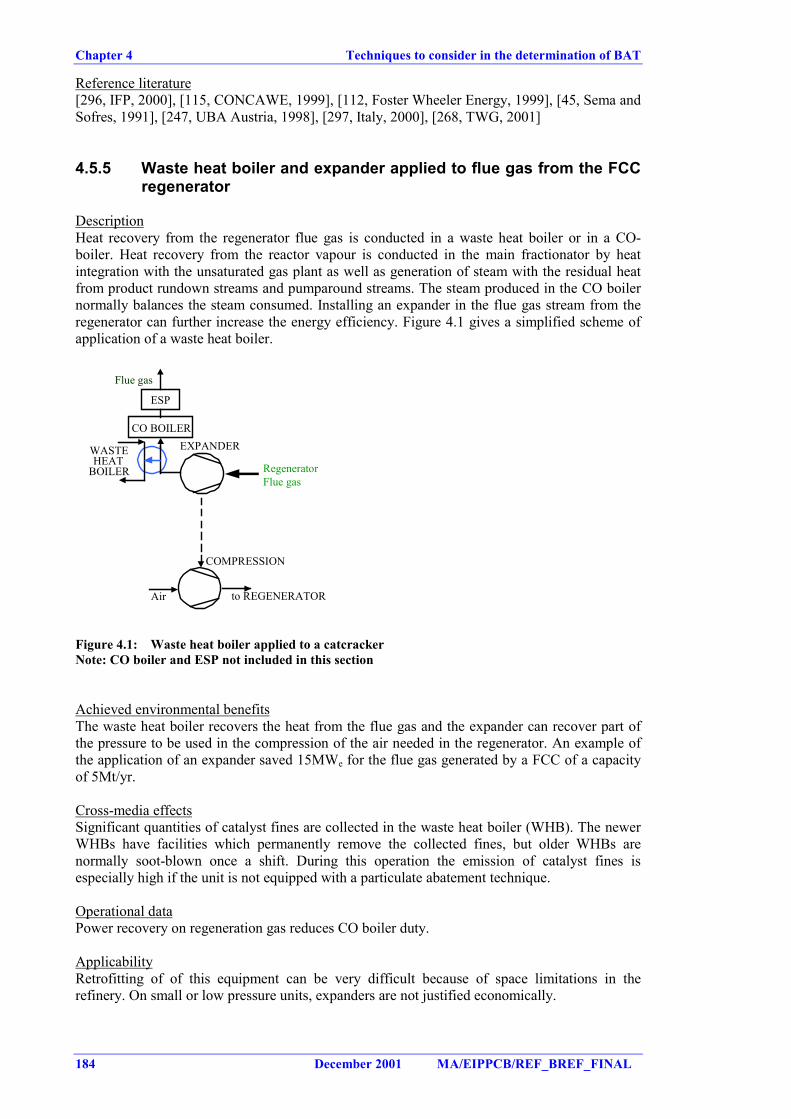
Chapter 4 Techniques to consider in the determination of BAT
184 December 2001 MA/EIPPCB/REF_BREF_FINAL
Reference literature[296, IFP, 2000], [115, CONCAWE, 1999], [112, Foster Wheeler Energy, 1999], [45, Sema andSofres, 1991], [247, UBA Austria, 1998], [297, Italy, 2000], [268, TWG, 2001]
4.5.5 Waste heat boiler and expander applied to flue gas from the FCCregenerator
DescriptionHeat recovery from the regenerator flue gas is conducted in a waste heat boiler or in a CO-boiler. Heat recovery from the reactor vapour is conducted in the main fractionator by heatintegration with the unsaturated gas plant as well as generation of steam with the residual heatfrom product rundown streams and pumparound streams. The steam produced in the CO boilernormally balances the steam consumed. Installing an expander in the flue gas stream from theregenerator can further increase the energy efficiency. Figure 4.1 gives a simplified scheme ofapplication of a waste heat boiler.
EXPANDERWASTEHEAT
BOILER
CO BOILER
Flue gas
RegeneratorFlue gas
Air
COMPRESSION
to REGENERATOR
ESP
Figure 4.1: Waste heat boiler applied to a catcrackerNote: CO boiler and ESP not included in this section
Achieved environmental benefitsThe waste heat boiler recovers the heat from the flue gas and the expander can recover part ofthe pressure to be used in the compression of the air needed in the regenerator. An example ofthe application of an expander saved 15MWe for the flue gas generated by a FCC of a capacityof 5Mt/yr.
Cross-media effectsSignificant quantities of catalyst fines are collected in the waste heat boiler (WHB). The newerWHBs have facilities which permanently remove the collected fines, but older WHBs arenormally soot-blown once a shift. During this operation the emission of catalyst fines isespecially high if the unit is not equipped with a particulate abatement technique.
Operational dataPower recovery on regeneration gas reduces CO boiler duty.
ApplicabilityRetrofitting of of this equipment can be very difficult because of space limitations in therefinery. On small or low pressure units, expanders are not justified economically.
Techniques to consider in the determination of BAT Chapter 4
MA/EIPPCB/REF_BREF_FINAL December 2001 185
EconomicsApplying expander on the regenerator gas could be costly because the additional particulatesystems under high temperature that they need. Turbo expanders are big cost items, and so arewaste heat recovery units.
Driving force for implementationRecovery of energy
Example plant(s)Energy recovery by utilising an expander in the regenerator flue gas is only applied in thelarger, more recently built units.
Reference literature[136, MRI, 1997], [268, TWG, 2001]
4.5.6 Catalyst selection
DescriptionTechniques to consider are:a) Use a higher quality FCC catalyst, process efficiencies can be increased while catalyst wastecan be reduced and rate of replacement reduced.b) Use of an attrition resistant catalyst to reduce the frequency of replacing catalyst and reduceemission of particulates from the regenerator.
Achieved environmental benefitsA good selection of the catalyst used in the FCC process can:• increase the FCC efficiency by up to 20 %, coke production can be decreased and catalyst
waste can be reduced• increase the recyclability of the catalyst• reduce the particulate content of flue gas before treatment to 300 mg/Nm3.
ApplicabilityA change in the catalyst may have an adversely effect to the performance of the FCC.
EconomicsInvestment expenses: none.Operating expenses: Negligible.
Driving force for implementationProcess requirements.
Reference literature[80, March Consulting Group, 1991], [115, CONCAWE, 1999]
4.5.7 Waste water management within FCCU
DescriptionSome techniques to consider are:a) Some catcracker designs contain a cascading overhead washing section designed to minimisewater usage.b) re-use waste water generated in FCCU within the refinery (e.g. desalters) or ultimately routeto WWTP.
Achieved environmental benefitsReduction of water usage and re-use of water within the refinery.
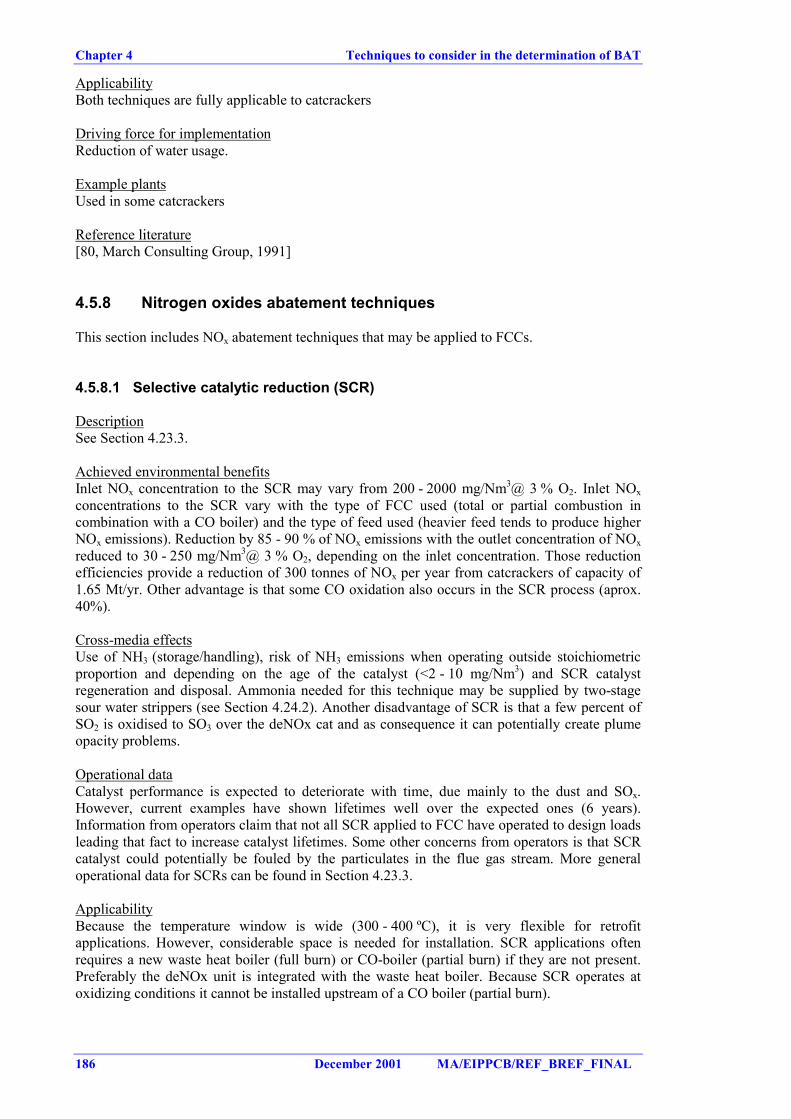
Chapter 4 Techniques to consider in the determination of BAT
186 December 2001 MA/EIPPCB/REF_BREF_FINAL
ApplicabilityBoth techniques are fully applicable to catcrackers
Driving force for implementationReduction of water usage.
Example plantsUsed in some catcrackers
Reference literature[80, March Consulting Group, 1991]
4.5.8 Nitrogen oxides abatement techniques
This section includes NOx abatement techniques that may be applied to FCCs.
4.5.8.1 Selective catalytic reduction (SCR)
DescriptionSee Section 4.23.3.
Achieved environmental benefitsInlet NOx concentration to the SCR may vary from 200 - 2000 mg/Nm3@ 3 % O2. Inlet NOxconcentrations to the SCR vary with the type of FCC used (total or partial combustion incombination with a CO boiler) and the type of feed used (heavier feed tends to produce higherNOx emissions). Reduction by 85 - 90 % of NOx emissions with the outlet concentration of NOxreduced to 30 - 250 mg/Nm3@ 3 % O2, depending on the inlet concentration. Those reductionefficiencies provide a reduction of 300 tonnes of NOx per year from catcrackers of capacity of1.65 Mt/yr. Other advantage is that some CO oxidation also occurs in the SCR process (aprox.40%).
Cross-media effectsUse of NH3 (storage/handling), risk of NH3 emissions when operating outside stoichiometricproportion and depending on the age of the catalyst (<2 - 10 mg/Nm3) and SCR catalystregeneration and disposal. Ammonia needed for this technique may be supplied by two-stagesour water strippers (see Section 4.24.2). Another disadvantage of SCR is that a few percent ofSO2 is oxidised to SO3 over the deNOx cat and as consequence it can potentially create plumeopacity problems.
Operational dataCatalyst performance is expected to deteriorate with time, due mainly to the dust and SOx.However, current examples have shown lifetimes well over the expected ones (6 years).Information from operators claim that not all SCR applied to FCC have operated to design loadsleading that fact to increase catalyst lifetimes. Some other concerns from operators is that SCRcatalyst could potentially be fouled by the particulates in the flue gas stream. More generaloperational data for SCRs can be found in Section 4.23.3.
ApplicabilityBecause the temperature window is wide (300 - 400 ºC), it is very flexible for retrofitapplications. However, considerable space is needed for installation. SCR applications oftenrequires a new waste heat boiler (full burn) or CO-boiler (partial burn) if they are not present.Preferably the deNOx unit is integrated with the waste heat boiler. Because SCR operates atoxidizing conditions it cannot be installed upstream of a CO boiler (partial burn).
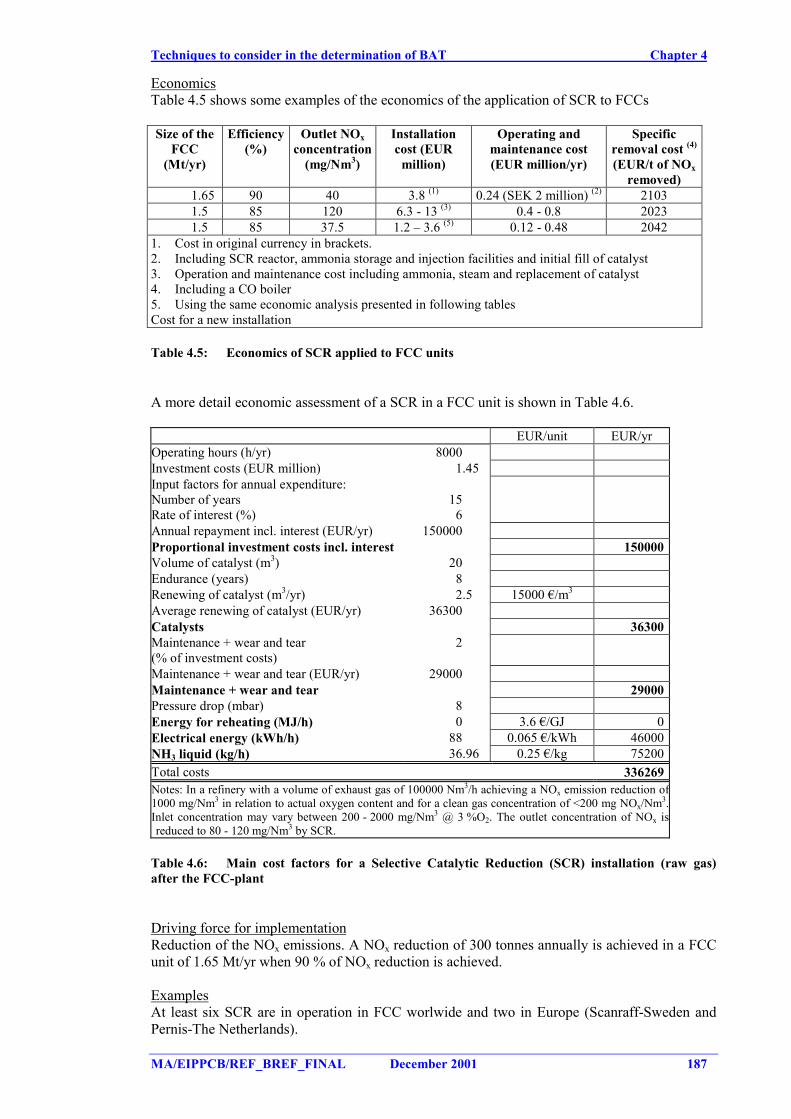
Techniques to consider in the determination of BAT Chapter 4
MA/EIPPCB/REF_BREF_FINAL December 2001 187
EconomicsTable 4.5 shows some examples of the economics of the application of SCR to FCCs
Size of theFCC
(Mt/yr)
Efficiency(%)
Outlet NOxconcentration
(mg/Nm3)
Installationcost (EUR
million)
Operating andmaintenance cost(EUR million/yr)
Specificremoval cost (4)
(EUR/t of NOxremoved)
1.65 90 40 3.8 (1) 0.24 (SEK 2 million) (2) 21031.5 85 120 6.3 - 13 (3) 0.4 - 0.8 20231.5 85 37.5 1.2 – 3.6 (5) 0.12 - 0.48 2042
1. Cost in original currency in brackets.2. Including SCR reactor, ammonia storage and injection facilities and initial fill of catalyst3. Operation and maintenance cost including ammonia, steam and replacement of catalyst4. Including a CO boiler5. Using the same economic analysis presented in following tablesCost for a new installation
Table 4.5: Economics of SCR applied to FCC units
A more detail economic assessment of a SCR in a FCC unit is shown in Table 4.6.
EUR/unit EUR/yrOperating hours (h/yr) 8000Investment costs (EUR million) 1.45Input factors for annual expenditure:Number of yearsRate of interest (%)
156
Annual repayment incl. interest (EUR/yr) 150000Proportional investment costs incl. interest 150000Volume of catalyst (m3) 20Endurance (years) 8Renewing of catalyst (m3/yr) 2.5 15000 €/m3
Average renewing of catalyst (EUR/yr) 36300Catalysts 36300Maintenance + wear and tear(% of investment costs)
2
Maintenance + wear and tear (EUR/yr) 29000Maintenance + wear and tear 29000Pressure drop (mbar) 8Energy for reheating (MJ/h) 0 3.6 €/GJ 0Electrical energy (kWh/h) 88 0.065 €/kWh 46000NH3 liquid (kg/h) 36.96 0.25 €/kg 75200Total costs 336269Notes: In a refinery with a volume of exhaust gas of 100000 Nm3/h achieving a NOx emission reduction of1000 mg/Nm3 in relation to actual oxygen content and for a clean gas concentration of <200 mg NOx/Nm3.Inlet concentration may vary between 200 - 2000 mg/Nm3 @ 3 %O2. The outlet concentration of NOx isreduced to 80 - 120 mg/Nm3 by SCR.
Table 4.6: Main cost factors for a Selective Catalytic Reduction (SCR) installation (raw gas)after the FCC-plant
Driving force for implementationReduction of the NOx emissions. A NOx reduction of 300 tonnes annually is achieved in a FCCunit of 1.65 Mt/yr when 90 % of NOx reduction is achieved.
ExamplesAt least six SCR are in operation in FCC worlwide and two in Europe (Scanraff-Sweden andPernis-The Netherlands).
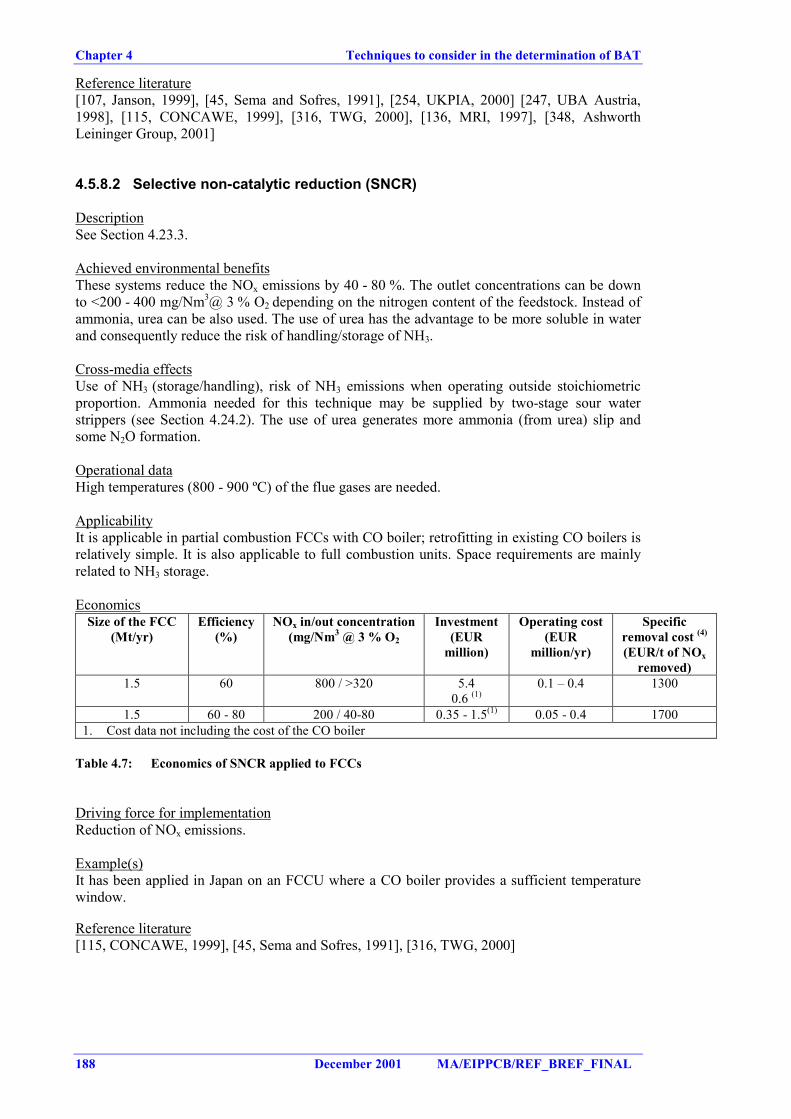
Chapter 4 Techniques to consider in the determination of BAT
188 December 2001 MA/EIPPCB/REF_BREF_FINAL
Reference literature[107, Janson, 1999], [45, Sema and Sofres, 1991], [254, UKPIA, 2000] [247, UBA Austria,1998], [115, CONCAWE, 1999], [316, TWG, 2000], [136, MRI, 1997], [348, AshworthLeininger Group, 2001]
4.5.8.2 Selective non-catalytic reduction (SNCR)
DescriptionSee Section 4.23.3.
Achieved environmental benefitsThese systems reduce the NOx emissions by 40 - 80 %. The outlet concentrations can be downto <200 - 400 mg/Nm3@ 3 % O2 depending on the nitrogen content of the feedstock. Instead ofammonia, urea can be also used. The use of urea has the advantage to be more soluble in waterand consequently reduce the risk of handling/storage of NH3.
Cross-media effectsUse of NH3 (storage/handling), risk of NH3 emissions when operating outside stoichiometricproportion. Ammonia needed for this technique may be supplied by two-stage sour waterstrippers (see Section 4.24.2). The use of urea generates more ammonia (from urea) slip andsome N2O formation.
Operational dataHigh temperatures (800 - 900 ºC) of the flue gases are needed.
ApplicabilityIt is applicable in partial combustion FCCs with CO boiler; retrofitting in existing CO boilers isrelatively simple. It is also applicable to full combustion units. Space requirements are mainlyrelated to NH3 storage.
EconomicsSize of the FCC
(Mt/yr)Efficiency
(%)NOx in/out concentration
(mg/Nm3 @ 3 % O2
Investment(EUR
million)
Operating cost(EUR
million/yr)
Specificremoval cost (4)
(EUR/t of NOxremoved)
1.5 60 800 / >320 5.40.6 (1)
0.1 – 0.4 1300
1.5 60 - 80 200 / 40-80 0.35 - 1.5(1) 0.05 - 0.4 17001. Cost data not including the cost of the CO boiler
Table 4.7: Economics of SNCR applied to FCCs
Driving force for implementationReduction of NOx emissions.
Example(s)It has been applied in Japan on an FCCU where a CO boiler provides a sufficient temperaturewindow.
Reference literature[115, CONCAWE, 1999], [45, Sema and Sofres, 1991], [316, TWG, 2000]
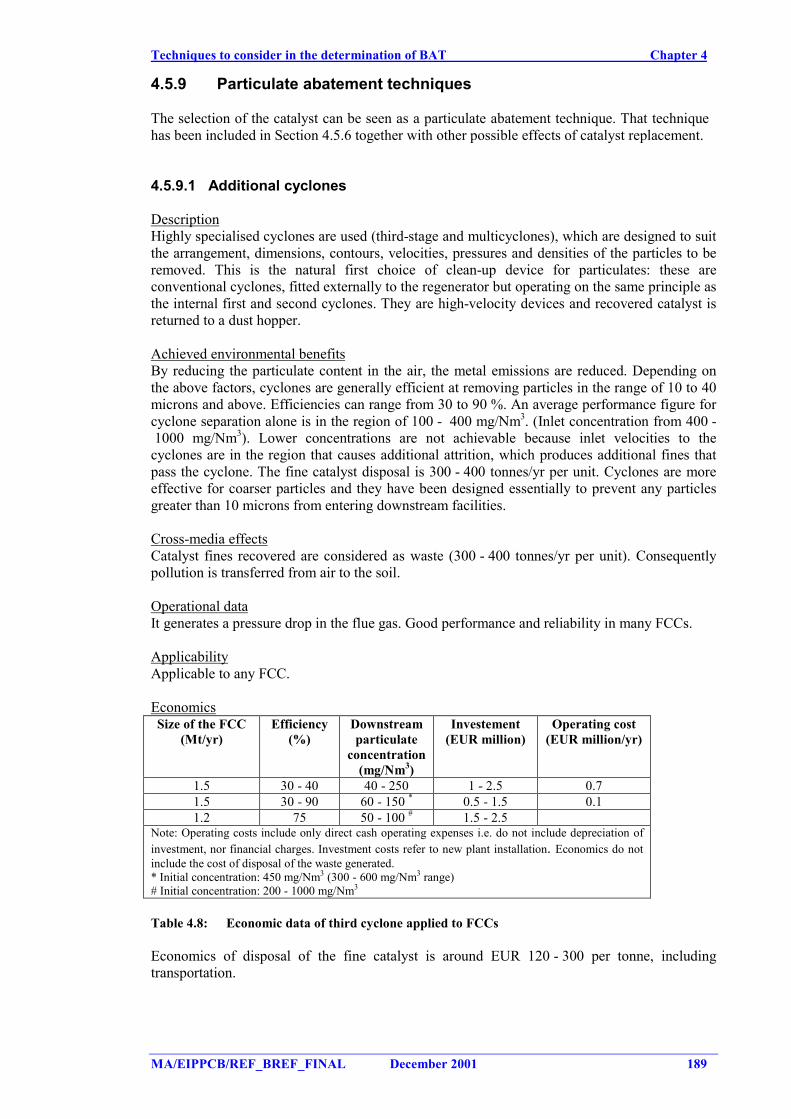
Techniques to consider in the determination of BAT Chapter 4
MA/EIPPCB/REF_BREF_FINAL December 2001 189
4.5.9 Particulate abatement techniques
The selection of the catalyst can be seen as a particulate abatement technique. That techniquehas been included in Section 4.5.6 together with other possible effects of catalyst replacement.
4.5.9.1 Additional cyclones
DescriptionHighly specialised cyclones are used (third-stage and multicyclones), which are designed to suitthe arrangement, dimensions, contours, velocities, pressures and densities of the particles to beremoved. This is the natural first choice of clean-up device for particulates: these areconventional cyclones, fitted externally to the regenerator but operating on the same principle asthe internal first and second cyclones. They are high-velocity devices and recovered catalyst isreturned to a dust hopper.
Achieved environmental benefitsBy reducing the particulate content in the air, the metal emissions are reduced. Depending onthe above factors, cyclones are generally efficient at removing particles in the range of 10 to 40microns and above. Efficiencies can range from 30 to 90 %. An average performance figure forcyclone separation alone is in the region of 100 - 400 mg/Nm3. (Inlet concentration from 400 - 1000 mg/Nm3). Lower concentrations are not achievable because inlet velocities to thecyclones are in the region that causes additional attrition, which produces additional fines thatpass the cyclone. The fine catalyst disposal is 300 - 400 tonnes/yr per unit. Cyclones are moreeffective for coarser particles and they have been designed essentially to prevent any particlesgreater than 10 microns from entering downstream facilities.
Cross-media effectsCatalyst fines recovered are considered as waste (300 - 400 tonnes/yr per unit). Consequentlypollution is transferred from air to the soil.
Operational dataIt generates a pressure drop in the flue gas. Good performance and reliability in many FCCs.
ApplicabilityApplicable to any FCC.
EconomicsSize of the FCC
(Mt/yr)Efficiency
(%)Downstreamparticulate
concentration(mg/Nm3)
Investement(EUR million)
Operating cost(EUR million/yr)
1.5 30 - 40 40 - 250 1 - 2.5 0.71.5 30 - 90 60 - 150 * 0.5 - 1.5 0.11.2 75 50 - 100 # 1.5 - 2.5
Note: Operating costs include only direct cash operating expenses i.e. do not include depreciation ofinvestment, nor financial charges. Investment costs refer to new plant installation. Economics do notinclude the cost of disposal of the waste generated.* Initial concentration: 450 mg/Nm3 (300 - 600 mg/Nm3 range)# Initial concentration: 200 - 1000 mg/Nm3
Table 4.8: Economic data of third cyclone applied to FCCs
Economics of disposal of the fine catalyst is around EUR 120 - 300 per tonne, includingtransportation.
Chapter 4 Techniques to consider in the determination of BAT
190 December 2001 MA/EIPPCB/REF_BREF_FINAL
Driving force for implementationTo improve control of emission of particulates. Tertiary cyclones can be also used to protectdownstream equipment such as heat or power recovery units (e.g. expander blades).
Example plantsMany FFC units are operating with these systems.
Reference literature[45, Sema and Sofres, 1991], [80, March Consulting Group, 1991], [297, Italy, 2000], [115,CONCAWE, 1999]
4.5.9.2 Electrostatic precipitators
DescriptionA short description of an electrostatic precipitator can be found in Section 4.23.4.
Achieved environmental benefitsTypical particulate emission levels achieved with electrostatic precipitators range from10 - <50 mg/Nm3 of particulate matter in the flue gas of the FCC regenerator. This level isbased on averaged continuous monitoring, excluding soot blowing. The range depends on thetype of catalysts, the mode of FCC operation and whether other pretreatment techniques areimplemented before the ESP. Particulate abatement measures in FCC with electrostaticprecipitators with efficiency greater than 99.8 %. Efficiency is not dependent on particulate sizeor on flue gas velocity and the pressure drop is very marginal. As a consequence of theparticulate reduction, the metals (Ni, Sb, V and their components) can be reduced to less than 1mg/Nm3 (given as Ni, Sb and V total) and, within that, Ni and its components can be reduced toless than 0.3 mg/Nm3 (given as Ni). (Half-hourly mean values attainable in continuousoperation and with soot blowing in the CO boiler). Particulate emissions from the FCC can thusbe reduced to 1.1 - 2.3 kg/h.
Cross-media effectsBecause these systems recover the fine particulates (mainly catalyst) coming from the FCC, therefinery may need extra facilities to manage the fine particulates recovered. ESPs also consumeelectricity.
Operational dataElectrostatic precipitators cause a very slight pressure drop. The extra energy consumption isrelatively low, but they consume electricity. They also require high maintenance to keep thecapture efficiency high. Continuous monitoring of particulates is not amongst the most reliablecontinuous monitoring systems. Information from a EU+ refinery shows that the use of deep-desulphurisation of the feedstock have a great impact of the electrostatic properties of theparticulates (because content of sulphur and metals are smaller) reducing the availability of theESP to catch those particulates. In those cases, they have reported that the best valuesachievable are 30 – 35 mg/Nm3.
ApplicabilityBecause the FCC outflows to be treated are large (1.5Mt/yr FCC generates 2.8 million Nm3/day)and the flow gas speeds should be low to increase the capture of particulates, these systemsrequire a lot of space. ESP may be difficult to apply if high electrical resistivity particulates areto be captured.
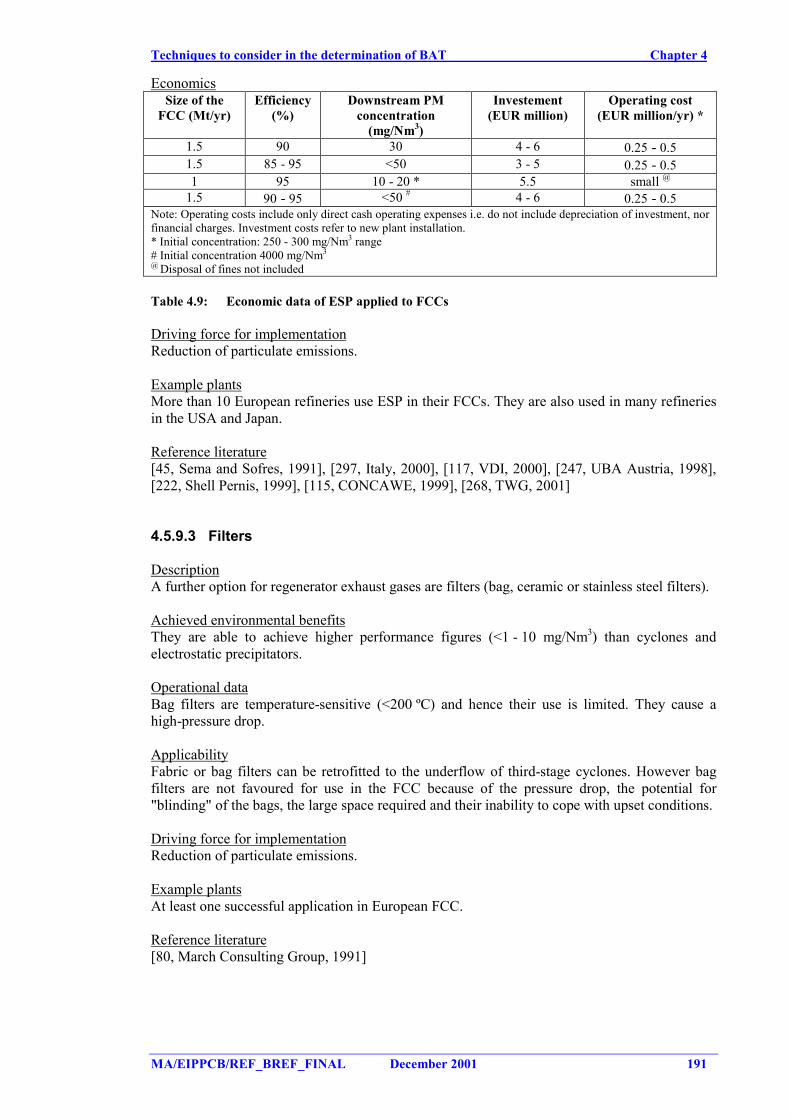
Techniques to consider in the determination of BAT Chapter 4
MA/EIPPCB/REF_BREF_FINAL December 2001 191
EconomicsSize of the
FCC (Mt/yr)Efficiency
(%)Downstream PM
concentration(mg/Nm3)
Investement(EUR million)
Operating cost(EUR million/yr) *
1.5 90 30 4 - 6 0.25 - 0.51.5 85 - 95 <50 3 - 5 0.25 - 0.51 95 10 - 20 * 5.5 small @
1.5 90 - 95 <50 # 4 - 6 0.25 - 0.5Note: Operating costs include only direct cash operating expenses i.e. do not include depreciation of investment, norfinancial charges. Investment costs refer to new plant installation.* Initial concentration: 250 - 300 mg/Nm3 range# Initial concentration 4000 mg/Nm3
@ Disposal of fines not included
Table 4.9: Economic data of ESP applied to FCCs
Driving force for implementationReduction of particulate emissions.
Example plantsMore than 10 European refineries use ESP in their FCCs. They are also used in many refineriesin the USA and Japan.
Reference literature[45, Sema and Sofres, 1991], [297, Italy, 2000], [117, VDI, 2000], [247, UBA Austria, 1998],[222, Shell Pernis, 1999], [115, CONCAWE, 1999], [268, TWG, 2001]
4.5.9.3 Filters
DescriptionA further option for regenerator exhaust gases are filters (bag, ceramic or stainless steel filters).
Achieved environmental benefitsThey are able to achieve higher performance figures (<1 - 10 mg/Nm3) than cyclones andelectrostatic precipitators.
Operational dataBag filters are temperature-sensitive (<200 ºC) and hence their use is limited. They cause ahigh-pressure drop.
ApplicabilityFabric or bag filters can be retrofitted to the underflow of third-stage cyclones. However bagfilters are not favoured for use in the FCC because of the pressure drop, the potential for"blinding" of the bags, the large space required and their inability to cope with upset conditions.
Driving force for implementationReduction of particulate emissions.
Example plantsAt least one successful application in European FCC.
Reference literature[80, March Consulting Group, 1991]
Chapter 4 Techniques to consider in the determination of BAT
192 December 2001 MA/EIPPCB/REF_BREF_FINAL
4.5.9.4 Control and re-use of the catalyst fines
DescriptionSignificant quantities of catalyst fines are often present around the FCCU catalyst hoppers,reactor and regeneration vessels as well as those collected by the abatement techniquesmentioned above. The fines can be collected and recycled before being washed to the sewers ormigrating off-site via the wind. Those techniques may be considered as a housekeepingmeasures, included in Section 4.15. Some techniques to consider are:� dry sweeping the catalyst fines and sending the solids to be recycled or disposed of as non-
hazardous waste.� use of vacuum ducts in dusty areas (and vacuum hoses for manual collection) which run to a
small baghouse for collection.� recycling opportunities for the fines (cement production).
Achieved environmental benefitsReduce the emission of particulates.
ApplicabilityFully applicable especially during catalyst loading/unloading processes.
Driving force for implementationReduction of soil contamination by particulates.
Example plantsTechniques already in use in USA refineries.
Reference literature[80, March Consulting Group, 1991]
4.5.9.5 Removal of catalyst from slurry decant oil
DescriptionTwo types of techniques have been applied to improve separation of catalyst from slurry decantoil from the slurry settler used in catcracker: a) One system incorporates high voltage electricfields to polarize and capture catalyst particles from decant oil. b) The amount of catalyst finesreaching the decant oil can be also be minimized by installing high-efficiency cyclones in thereactor to shift catalyst fines losses of the decant oil to the regenerator, where they can becollected by any particulate abatement technique.
Achieved environmental benefitsDecant oil sludge from the FCC can contain significant concentrations of catalyst fines. Thesefines often prevent the use of decant oil as a feedstock and require treatment which generates anoily catalyst sludge. Catalysts in the decant oil can be minimized by using a decant oil catalystremoval system.
Operational dataCatalyst fines suspended in the separator underflow are recycled back to the reactor.
ApplicabilityHydrocyclones are applied in many FCC units.
Driving force for implementationReduction of consumption of catalyst and reduction of the decant oil sludge.
Example plantsHydrocyclones, for removal of catalyst fines, are successfully applied in many FCCs.
Techniques to consider in the determination of BAT Chapter 4
MA/EIPPCB/REF_BREF_FINAL December 2001 193
Reference literature[316, TWG, 2000]
4.5.10 Sulphur oxides abatement techniques
This section contains sulphur oxides abatement techniques that may be applicable to FCCs.
4.5.10.1 DeSOx catalyst additive
DescriptionSulphur dioxide in the regenerator off-gas of an FCC unit can be reduced by using a catalyst(metal (e.g. Al/Mg, Ce) oxide) which transfers a significant portion of the sulphur associatedwith the coke on the catalyst to the reactor, where it is liberated as hydrogen sulphide. Thisleaves the reactor with the cracked vapour product for capture in the refinery’s amine scrubbingsystem and hence conversion of sulphur in the SRU. DeSOx is a 3-step process: a) oxidation ofSO2 to SO3 catalysed by cerium, b) adsorption of SO3 produced in the regenerator to give asulphate which, on return to the reactor, c) reverts to the oxide and releases hydrogen sulphideinto the product gas stream for recovery.
Achieved environmental benefitsThe amount of SOx removed is dependent on the amount of deSOx additive added to the unit,but removal efficiency is typically 20 - 60 % in full combustion mode. This technique canremove up to 30 % of SOx when used in the partial combustion mode. Typical downstreameffluent has a SO2 concentration of 1300 to 3000 mg/Nm3 @ 3 % O2 (initial concentration 4250mg/Nm3 @ 3 % O2, feedstock sulphur approximately 2.5 %).
Cross-media effectsDisadvantages of the process are:• deSOx additive is more efficient in full burn mode. However, full burn implies more SOx
and NOx formation than partial combustion mode• possible poorer yield of products from FCC unit• reduced FCC unit operating flexibility• other impacts are the increased energy consumption and the possibility of bottlenecks in the
H2S handling facilities.
ApplicabilityThis technique is sensitive to unit design, especially regenerator conditions. It operates mosteffectively under full oxidising conditions, when as much as 50 % of the sulphur in the fluegases can be removed. Unit performance may, however, be affected and transfer catalystreplacement rate may be significant.
EconomicsThere are no major investment costs required for this option, save for the dosing equipment forintroducing the additive to the catalyst system. Operating expenses are around 0.34 - 0.7 EUR/t(EUR 1 million/yr for a 1.5 Mt/yr FCC). Another reference gives a typical cost of EUR 3million/yr (1997) for the catalyst for a gas flow of 200000 Nm3/h (2.3 Mt/yr FCC). Cost ishighly dependent on the unit, the initial SO2 emissions and the SO2 target.
Driving force for implementationReduction of sulphur oxide emissions from the FCC.
Example plant(s)Many refineries have applied deSOx additives to the catalyst. The method is well establishedcommercially.
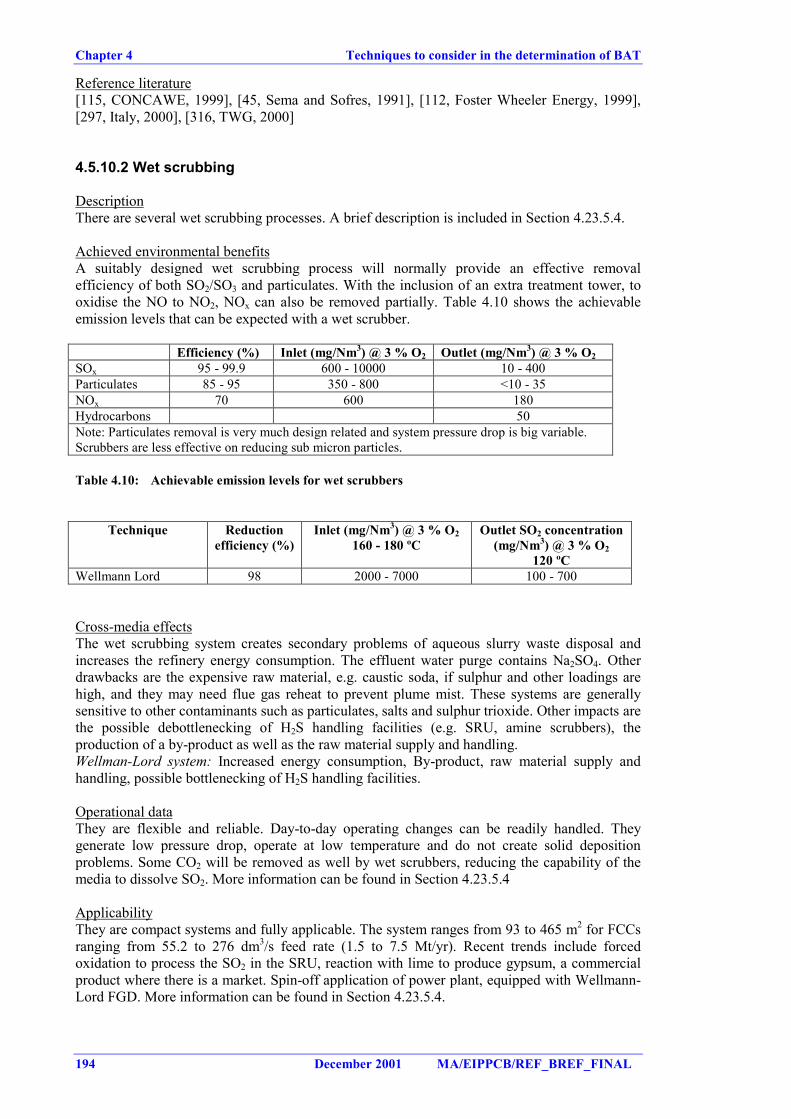
Chapter 4 Techniques to consider in the determination of BAT
194 December 2001 MA/EIPPCB/REF_BREF_FINAL
Reference literature[115, CONCAWE, 1999], [45, Sema and Sofres, 1991], [112, Foster Wheeler Energy, 1999],[297, Italy, 2000], [316, TWG, 2000]
4.5.10.2 Wet scrubbing
DescriptionThere are several wet scrubbing processes. A brief description is included in Section 4.23.5.4.
Achieved environmental benefitsA suitably designed wet scrubbing process will normally provide an effective removalefficiency of both SO2/SO3 and particulates. With the inclusion of an extra treatment tower, tooxidise the NO to NO2, NOx can also be removed partially. Table 4.10 shows the achievableemission levels that can be expected with a wet scrubber.
Efficiency (%) Inlet (mg/Nm3) @ 3 % O2 Outlet (mg/Nm3) @ 3 % O2SOx 95 - 99.9 600 - 10000 10 - 400Particulates 85 - 95 350 - 800 <10 - 35NOx 70 600 180Hydrocarbons 50Note: Particulates removal is very much design related and system pressure drop is big variable.Scrubbers are less effective on reducing sub micron particles.
Table 4.10: Achievable emission levels for wet scrubbers
Technique Reductionefficiency (%)
Inlet (mg/Nm3) @ 3 % O2160 - 180 ºC
Outlet SO2 concentration(mg/Nm3) @ 3 % O2
120 ºCWellmann Lord 98 2000 - 7000 100 - 700
Cross-media effectsThe wet scrubbing system creates secondary problems of aqueous slurry waste disposal andincreases the refinery energy consumption. The effluent water purge contains Na2SO4. Otherdrawbacks are the expensive raw material, e.g. caustic soda, if sulphur and other loadings arehigh, and they may need flue gas reheat to prevent plume mist. These systems are generallysensitive to other contaminants such as particulates, salts and sulphur trioxide. Other impacts arethe possible debottlenecking of H2S handling facilities (e.g. SRU, amine scrubbers), theproduction of a by-product as well as the raw material supply and handling.Wellman-Lord system: Increased energy consumption, By-product, raw material supply andhandling, possible bottlenecking of H2S handling facilities.
Operational dataThey are flexible and reliable. Day-to-day operating changes can be readily handled. Theygenerate low pressure drop, operate at low temperature and do not create solid depositionproblems. Some CO2 will be removed as well by wet scrubbers, reducing the capability of themedia to dissolve SO2. More information can be found in Section 4.23.5.4
ApplicabilityThey are compact systems and fully applicable. The system ranges from 93 to 465 m2 for FCCsranging from 55.2 to 276 dm3/s feed rate (1.5 to 7.5 Mt/yr). Recent trends include forcedoxidation to process the SO2 in the SRU, reaction with lime to produce gypsum, a commercialproduct where there is a market. Spin-off application of power plant, equipped with Wellmann-Lord FGD. More information can be found in Section 4.23.5.4.
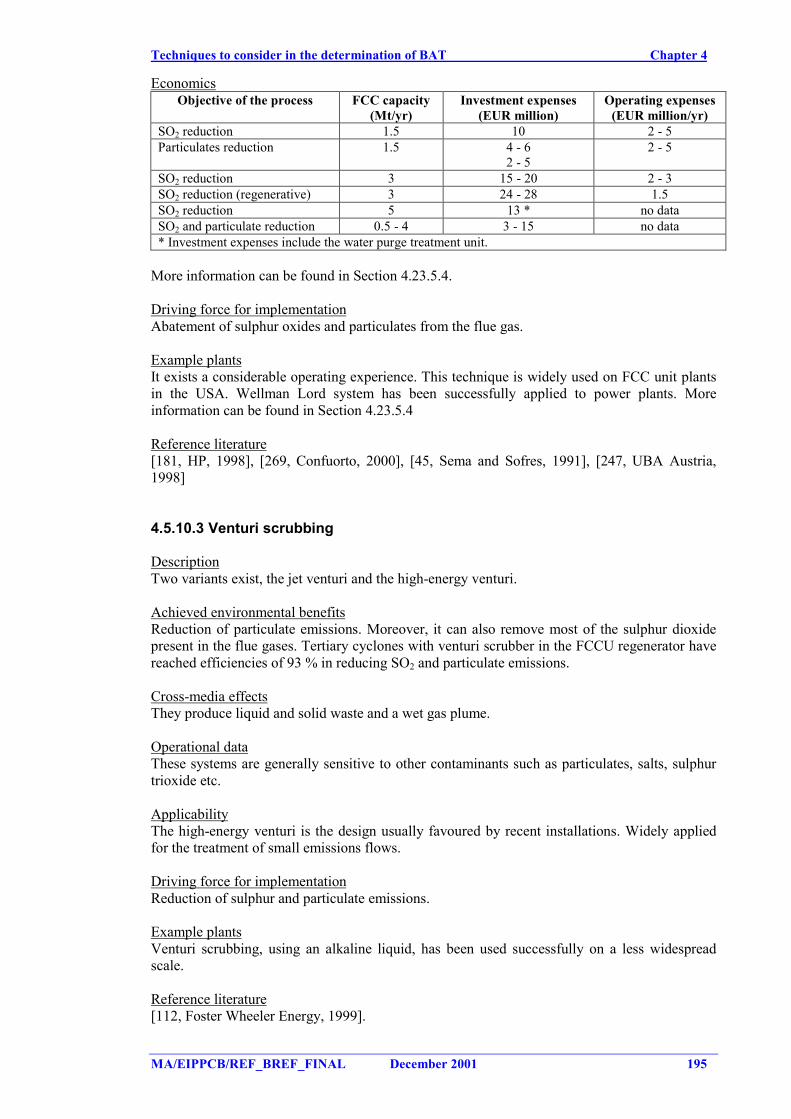
Techniques to consider in the determination of BAT Chapter 4
MA/EIPPCB/REF_BREF_FINAL December 2001 195
EconomicsObjective of the process FCC capacity
(Mt/yr)Investment expenses
(EUR million)Operating expenses
(EUR million/yr)SO2 reduction 1.5 10 2 - 5Particulates reduction 1.5 4 - 6
2 - 52 - 5
SO2 reduction 3 15 - 20 2 - 3SO2 reduction (regenerative) 3 24 - 28 1.5SO2 reduction 5 13 * no dataSO2 and particulate reduction 0.5 - 4 3 - 15 no data* Investment expenses include the water purge treatment unit.
More information can be found in Section 4.23.5.4.
Driving force for implementationAbatement of sulphur oxides and particulates from the flue gas.
Example plantsIt exists a considerable operating experience. This technique is widely used on FCC unit plantsin the USA. Wellman Lord system has been successfully applied to power plants. Moreinformation can be found in Section 4.23.5.4
Reference literature[181, HP, 1998], [269, Confuorto, 2000], [45, Sema and Sofres, 1991], [247, UBA Austria,1998]
4.5.10.3 Venturi scrubbing
DescriptionTwo variants exist, the jet venturi and the high-energy venturi.
Achieved environmental benefitsReduction of particulate emissions. Moreover, it can also remove most of the sulphur dioxidepresent in the flue gases. Tertiary cyclones with venturi scrubber in the FCCU regenerator havereached efficiencies of 93 % in reducing SO2 and particulate emissions.
Cross-media effectsThey produce liquid and solid waste and a wet gas plume.
Operational dataThese systems are generally sensitive to other contaminants such as particulates, salts, sulphurtrioxide etc.
ApplicabilityThe high-energy venturi is the design usually favoured by recent installations. Widely appliedfor the treatment of small emissions flows.
Driving force for implementationReduction of sulphur and particulate emissions.
Example plantsVenturi scrubbing, using an alkaline liquid, has been used successfully on a less widespreadscale.
Reference literature[112, Foster Wheeler Energy, 1999].
Chapter 4 Techniques to consider in the determination of BAT
196 December 2001 MA/EIPPCB/REF_BREF_FINAL
4.5.10.4 Dry and semi-dry scrubbers
DescriptionTwo types of techniques exist: dry and semi-dry. The key component of the semi-dry process isa spray dryer in which the hot flue gas is contacted with a spray of fine droplets of lime slurry.The SO2 is absorbed into the droplets, forming reaction products which are dried to a finepowder by the hot flue gas. Both dry and semi-dry processes require downstream dustarrestment systems, such as an electrostatic precipitator or bag filtration. More information canbe found in Section 4.23.5.4.
Achieved environmental benefitsReduction of the SO2 in the flue gas. Efficiency of the processes: 90 % sulphur removal withsemi-dry process and about 50 % removal with dry process. Dry process efficiency of 50 % isobtained with lime at relatively high temperature (about 400 ºC) when Ca/S=1 or at130 - 140 ºC with Ca/S=2. The Ca/S ratio has a major influence. With reactant such asNaHCO3, the abatement rate would be much higher. With lime, it is also possible to have atreatement at 900 ºC in a reactor big enough to have a reasonable residence time. The abatementin this case is 80 % with CaS= 2.1 and 90 % with Ca/S=3.
Cross-media effectsDeposition of solid waste results in case that the reaction products cannot fullfill the qualityneeded by consumers. Other drawbacks are:• high pressure drops across the bag filters if are used• increased dust load in gas stream; need for dust capture• operational difficulties in water/heat balance (spray dryers only)• possibly significant pressure drop across bag filter dust arrestment plant, e.g. bag filters• generation of solid waste: 1 tonne of SO2 reduction entails about 2.5 tonnes of solid wastes
being generated• with the dry- and semidry scrubbers a mixture of CaSO3, CaSO4, fly-ash and lime is
produced.
Operational dataThese systems are generally sensitive to other contaminants such as particulates, salts, sulphurtrioxide etc.
ApplicabilityOperate at low-temperature end of system. Waste generated can be difficult to re-use (no marketfor gypsum), and difficult to landfill (landfill use to be severely restricted in near future).
EconomicsDry process is a relatively low cost solution. Raw materials for those processes are cheap.Capital cost and operating costs typically less than wet scrubbing. Investment cost around EUR15 - 20 million, and operating cost around EUR 2 - 3 million/yr (lime cost + landfill wastedisposal).
Reference literature[112, Foster Wheeler Energy, 1999], [257, Gilbert, 2000], [45, Sema and Sofres, 1991], [297,Italy, 2000]
4.5.10.5 Seawater scrubbing
DescriptionThis scrubbing uses the natural alkalinity of the seawater to remove SO2. More information canbe found in Section 4.23.5.4.
Techniques to consider in the determination of BAT Chapter 4
MA/EIPPCB/REF_BREF_FINAL December 2001 197
Achieved environmental benefitsSO2 recovery can be as high as 99 %. In order to reduce the particulate emissions to theseawater, a particulate abatement technique should be included before the flue gas is treated inthe seawater scrubber. In this way, seawater scrubbing can be seen as a transfer of the remainingpollution from air to seawater.
Cross-media effectsParticulates containing metals (e.g. V, Ni, Sb) and other pollutants from the flue gas aretransferred to the seawater. The sulphur content of the effluent seawater from the process itselfis increased by only approximately 3 %.
Operational dataThe system needs electrical power (seawater pumps, aeration fans and flue gas fan) andseawater. It is feasible to use spent cooling water, for example, when seawater is used as coolingwater. The need for seawater is roughly 15000 - 20000 m3/h per tonne of sulphur removed.Special attention should be paid to minimise corrosion and the maintenance derived from it.
ApplicabilityThe feasibility of applying seawater scrubbing is site-dependent. The process needs access toseawater in large amounts at a competitive cost. Fully applied for fuels up to 1.5 % of sulphur.This system normally is applied after a particulate abatement technique to avoid contaminationof sea environment by particulates (containing metals).
EconomicsSeawater scrubber annual costs depend on size and SOx in/out. The cost is comparable to wetscrubbers. Typical investement cost is in the order of EUR 60 /net kWe output of the powerplant. The main operating cost is the electrical power for operation of the technique.
Driving force for implementationReduction of SO2 emissions.
Example plantsSystem applied to some power plants aroung the world and one proven commercial applicationin FCC, Norway.
Reference literature[278, Alstom Power, 2000]
4.5.10.6 Wet gas sulphuric acid process (WSA)
DescriptionSee Section 4.23.5.4.
Achieved environmental benefits99 % reduction of SO2 and some reduction of NOx. In combination with a SCR, simultaneousreduction of NOx 95 %.
Reference literature[247, UBA Austria, 1998]
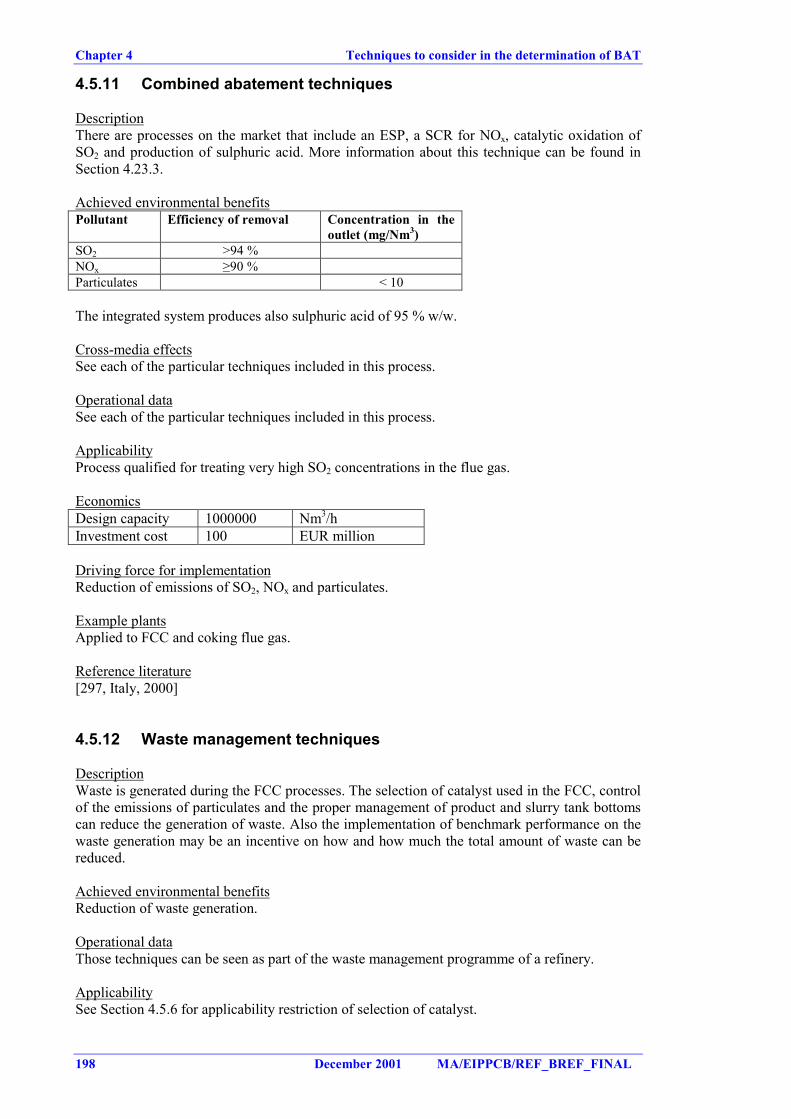
Chapter 4 Techniques to consider in the determination of BAT
198 December 2001 MA/EIPPCB/REF_BREF_FINAL
4.5.11 Combined abatement techniques
DescriptionThere are processes on the market that include an ESP, a SCR for NOx, catalytic oxidation ofSO2 and production of sulphuric acid. More information about this technique can be found inSection 4.23.3.
Achieved environmental benefitsPollutant Efficiency of removal Concentration in the
outlet (mg/Nm3)SO2 >94 %NOx ≥90 %Particulates < 10
The integrated system produces also sulphuric acid of 95 % w/w.
Cross-media effectsSee each of the particular techniques included in this process.
Operational dataSee each of the particular techniques included in this process.
ApplicabilityProcess qualified for treating very high SO2 concentrations in the flue gas.
EconomicsDesign capacity 1000000 Nm3/hInvestment cost 100 EUR million
Driving force for implementationReduction of emissions of SO2, NOx and particulates.
Example plantsApplied to FCC and coking flue gas.
Reference literature[297, Italy, 2000]
4.5.12 Waste management techniques
DescriptionWaste is generated during the FCC processes. The selection of catalyst used in the FCC, controlof the emissions of particulates and the proper management of product and slurry tank bottomscan reduce the generation of waste. Also the implementation of benchmark performance on thewaste generation may be an incentive on how and how much the total amount of waste can bereduced.
Achieved environmental benefitsReduction of waste generation.
Operational dataThose techniques can be seen as part of the waste management programme of a refinery.
ApplicabilitySee Section 4.5.6 for applicability restriction of selection of catalyst.

Techniques to consider in the determination of BAT Chapter 4
MA/EIPPCB/REF_BREF_FINAL December 2001 199
Driving force for implementationReduction of waste management cost and losses of catalyst.
Example plantsApplied in many refineries.
Reference literature[268, TWG, 2001]
Chapter 4 Techniques to consider in the determination of BAT
200 December 2001 MA/EIPPCB/REF_BREF_FINAL
4.6 Catalytic reforming
The first two techniques considered are process techniques and the rest are techniques for theprevention or control of emissions from the catalytic reforming processes.
4.6.1 Continuous catalytic reformer
DescriptionIn the continuous process, the catalyst is regenerated continuously and maintained at highactivity. Catalyst is regenerated in one external reactor. More information can be found inSection 3.6.
Achieved environmental benefitsThis process has a higher energy efficiency than semi-regenerative due to the heat recoveryfrom products, from pumparounds and due to integration with topping and vacuum.
Cross-media effectsIt generates more dioxins than semi-regenerative during the regeneration of the catalyst. Formore information, see Section 3.6.
Operational dataIt operates at lower pressures (6 - 14 bar) than and at the same temperature as semi-regenerativeprocesses. It uses bi-metallic catalysts (Pt-Re, Pt-Sn). Hydrogen is also produced in thoseprocesses. Continuous regeneration reformer produces around 350 Nm3 of hydrogen per tonneof feedstock. As increased coke laydown and thermodynamic equilibrium yields of reformateare both favoured by low-pressure operation, the ability to maintain high catalyst activities andselectivities by continuous catalyst regeneration is the major advantage of the continuous typeof unit.
ApplicabilityFully applicable.
EconomicsInvestment cost based in 3975 m3/d continuous octanizing unit, battery limits, erected cost, 1998Gulf Coast: 10000 USD per m3/d. The erected cost based in 3180 m3/d has been of USD 48.3million ($15200 per m3/d). In addition, catalyst costs add another USD 2.6 million. Costs are4Q95 US Gulf Coast.
Driving force for implementationProduction process. The biggest disadvantage for the future is the high content of aromatics(70 - 75 %) in CCR product. A lot of refineries will have great difficulty in reaching thegasoline specifications of 35 %v/v for aromatics as from 2005 onwards.
Example plant(s)Nowadays, only continuous catalytic reformer units are built.
Reference literature[212, Hydrocarbon processing, 1998], [166, Meyers, 1997], [268, TWG, 2001]
4.6.2 Semiregenerative reformer
DescriptionA brief description can be found in Section 2.6.
Techniques to consider in the determination of BAT Chapter 4
MA/EIPPCB/REF_BREF_FINAL December 2001 201
Achieved environmental benefitsHeat integration is lower than in the case of continuous reformers. However, manysemiregenerative units have applied better feed effluent exchange to minimise energyconsumption.
Cross-media effectsIn semi-regenerative reforming, the unit catalyst is regenerated at intervals of 3 to 24 months,depending upon the intensity of the process. The emission factor of dioxins per tonne offeedstock is much lower than in the case of continuous regeneration. For more information, seeSection 3.6.
Operational dataThe reactors operate at temperature in the range of 400 - 560º C and pressures in the range of20 - 50 bar. This type of process produces between 130 and 200 Nm3 of hydrogen per tonne offeedstock.
ApplicabilityFully applicable.
EconomicsThe erected cost of a semiregenerative unit of 3180 m3/d is 33 million USD (10400 $ per m3/d).In addition, catalyst costs add another 3.4 million USD. Costs are 4Q95 US Gulf Coast.
Driving force for implementationProduction process.
Example plantsMany applications exist in Europe as well as in the rest of the world.
Reference literature[261, Canales, 2000], [166, Meyers, 1997]
4.6.3 Type of catalyst promoter
DescriptionOzone depleting substances (e.g. carbon tetrachloride) are sometimes used during theregeneration of the catalyst of the reformer. Emissions of such substances should be avoided orat least minimized by using less harmful substitutes or by using them in confined compartments.
Achieved environmental benefitsOptimisation and reduction of use of catalyst promoters and ozone-depleting substances.
Cross-media effectsDue to the use of chlorinated compounds, the possibility of emissions of dioxins and furanesduring generation has been detected. Refer to Section 3.6.
Operational dataPromoters should be handled in enclosed systems.
Example plantsMost refiners have switched to lower ozone depleting substances such as perchloroethyleneduring the regeneration of the reforming catalyst.
Reference literature[80, March Consulting Group, 1991]
Chapter 4 Techniques to consider in the determination of BAT
202 December 2001 MA/EIPPCB/REF_BREF_FINAL
4.6.4 Cleaning of the regeneration flue gas
DescriptionRegenerator flue gas containing HCl, H2S, small quantities of catalyst fines, traces of Cl2, SO2and dioxins can be sent to a scrubber prior to to release to atmosphere. The storage and handlingof organic chlorides used during the regeneration may also lead to releases. In some reformers afurther filter trap of Cl2 (ZnO/NaCO3 or NaOH over alumina) is installed.
Achieved environmental benefitsReduction of particulates and volatile acids (HCl, H2S). It has been reported that Cl2 filter alsotraps dioxins.
Cross-media effectsThe recirculated and bleed streams from the regeneration flue gas wash should be sent to thewaste water treatment plant. Due to low pH of this waste water stream, neutralisation prior tobiological treatment may be necessary. The use of scrubber can move some dioxins from the airto a water emission.
ApplicabilityFully applicable. Cl2 trap has been used in continuous reformers.
Driving force for implementationReduction of air pollutants
Reference literature[112, Foster Wheeler Energy, 1999], [268, TWG, 2001]
4.6.5 Electrostatic precipitator in the regeneration flue gas
DescriptionRegenerator flue gas containing HCl, H2S, small quantities of catalyst fines, traces of Cl2, SO2and dioxins can be sent to an electrostatic precipitator prior to release to atmosphere. Otheractivities as venting during catalyst regeneration or replacement and plant cleaning may be sentto the ESP.
Achieved environmental benefitsReduction of particulate content in the flue gas coming from the regenerator.
Cross-media effectsSee Section 4.23.4.2
ApplicabilityEmissions from continuous regeneration sections require particular attention. The use of thistype of systems in semiregenerative units is less extended because almost no exists mechanismfor the generation of catalyst fines.
Driving force for implementationReduction of particulate emissions during the catalyst regeneration.
Reference literature[112, Foster Wheeler Energy, 1999], [268, TWG, 2001]
Techniques to consider in the determination of BAT Chapter 4
MA/EIPPCB/REF_BREF_FINAL December 2001 203
4.6.6 Dioxins formation in catalytic reforming units
DescriptionReferring to Sections 3.6 and sections in 4.6 on catalytic reforming, dioxins are typically formedin the three types (continuous, cyclic and semiregenerative) of catalytic reforming during theregeneration of the catalyst.
If the regenerator flue gas is treated in a water scrubber (e.g. Section 4.6.4), the dioxins havebeen appeared detectable in waste water from the scrubber, but they have not been detected afterthe WWTP, possibly because dilution effects.
In some other cases, because the use of other techniques as fixed bed filters have result in acombine reduction of chlorine and dioxins. In some cases, activated carbon has been used toremove dioxins. Other techniques that have been used is the recirculation of regeneration ventgases. However this last one is not clear how it can reduce the emission of dioxins.
The study of dioxins emissions from reformers and how the regeneration conditions may affectthose emission can be a good technique to start to understand and solve the problem.
Achieved environmental benefitsKnowledge of the problem and control of the dioxin emissions.
Cross-media effectsSome dioxins from the regenerator gases may be transferred to water via scrubbing.
Driving force for implementationKnowledge of the formation of dioxins in regeneration of the catalyts.
Example plantsSome EU+ refineries have already applied and monitored dioxins emission from catalyticreformers. Techniques as chlorine trap and recirculation of vents have not been reported thathave been applied to semiregenerative reformers.
Reference literature[268, TWG, 2001]
Chapter 4 Techniques to consider in the determination of BAT
204 December 2001 MA/EIPPCB/REF_BREF_FINAL
4.7 Coking processes
The first four techniques considered in this section are coking processes. The information givenis intended to help in assessing how well coking processes can perform from the environmentalpoint of view. The rest of the techniques are related to the cleaning of the coke gas, the use ofthe coking process to destroy solid residues/sludges and, finally, those techniques related withthe abatement of pollution generated by the coking processes.
4.7.1 Delayed coking
DescriptionA description of this process can be found in Section 2.7. The techniques that may be applied tothe delayed coker to prevent emissions are the following:1. uncondensable vapours generated in the coking processes should not pass to the flare
system2. pressure reliefs from the coke drums should pass to the quench tower3. techniques for coke drum quench tower arrestment train to include consideration of venting
the final emission to a flare header with the possible elimination of the second tower andblowdown pond
4. water use in the delayed coker is treated in Section 4.7.75. steam generated in this process can be used to heat up other refinery processes6. the delayed coking process itself has a low level of heat integration. The heat to maintain
the coke drums at coking temperature is supplied by heating the feed and the recycle streamin a furnace. However, the atmospheric residue and/or vacuum residue can be fed straightinto the delayed coking unit without intermediate cooling, which results in a high heat-integration level between the different units and saves a considerable amount of capital onheat exchangers
7. use of coking gas. The energy efficiency of the coker can be further increased if the cokegas is combusted in a gas turbine of a combined cycle unit. Extra information on theapplication of refinery fuel gas in combined cycle units appears in Section 4.10.
Achieved environmental benefitsReductions of VOC emissions, recovery of products and reduction of H2S emissions areachieved when applying some of the above-mentioned techniques. Water re-use is alsopromoted by the application of those techniques.
Operational dataSome operational data of delayed cokers can be found in Section 3.7.
ApplicabilityDelayed coking is fully applicable. It is normally applied when the production of petroleumcoke has a market or when high quality coke is required to produce anodes for the non-ferrousmetal industry.
EconomicsTypical investment of a full delayed coker (basis 1Mt/yr straight run vacuum residue feed, U.S.Gulf Coast 1998, fuel grade coke, includes vapour recovery): 136250 - 218000 USD per t/yr.
Driving force for implementationProduction process.
Example plantsMany delayed processes exist in Europe as well as in the rest of the world. Delayed coking isthe most commonly used technology in the refinery sector.
Techniques to consider in the determination of BAT Chapter 4
MA/EIPPCB/REF_BREF_FINAL December 2001 205
Reference literature[112, Foster Wheeler Energy, 1999], [19, Irish EPA, 1993], [118, VROM, 1999]
4.7.2 Fluid coking
DescriptionA description of this process can be found in Section 2.7. Another technique that can be used toprevent emissions or increase energy integration in the fluid cokig is to use the coking gas in agas turbine of a combined cycle unit. Extra information on the application of refinery fuel gas incombined cycle units appears in Section 4.10.
Achieved environmental benefitsEmission factors for coking (units in kg/1000 litres of fresh feed).
Process PM SOx(as SO2)
CO HC NOx(as NO2)
Aldehydes NH3
Fluid cokingunits uncontrolled
1.5 n.a. n.a. n.a. n.a. n.a. n.a.
Fluid coking withESP and COboiler
0.0196 n.a. Neg Neg n.a. Neg Neg
Neg: Negligible
Operational dataThis system operates under fluidised bed conditions.
ApplicabilityFully applicable. Although the coke from fluid coking is of a higher grade than the coke fromdelayed coking, it is not suitable for some specialist applications (e.g. carbon graphiteelectrodes).
EconomicsInvestment (U.S. Gulf Coast 1996): 10000 - 13200 USD per m3/d.
Driving force for implementationProduction process.
Example plantsSome examples exist around the world.
Reference literature[136, MRI, 1997]
4.7.3 Calcination process
DescriptionA brief description of this process can be found in Section 2.7. Certain techniques can beapplied to the calcination process to prevent emissions. Some of those considered to bebeneficial are the following:1. The kilns can be directly fuelled by coke gas or coke fines, driving off volatile matter and
burning it within the kiln.2. The hot stream of waste gas from the calcination of petroleum coke in rotary kilns contains
considerable quantities of particulate, which - possibly after heat recovery from the wastegas - is separated with suitable filter devices, e.g. high efficiency multi-cyclones, bag filtersand electrostatic precipitators (see also Chapter 4.7.8.2). During calcination in multiple-hearth furnaces, particulate abatement techniques are not usually used because of thecomparatively low emissions in the waste gases.
Chapter 4 Techniques to consider in the determination of BAT
206 December 2001 MA/EIPPCB/REF_BREF_FINAL
3. The unburnt gases from the calcinator are burned in an incinerator, then passed through awaste heat boiler before being released to the atmosphere via a dust collection system.
4. The calcined coke discharges to rotary cooler where it is cooled by direct water injection.Off-gases from the cooler pass to gas cleaning by multi-cyclones and water scrubber.
5. Collected fines from the dust abatement techniques should be conveyed to a silo with exitair filters. Collected cyclone fines may be recycled to product or may be used within therefinery or may be sold as product.
Achieved environmental benefitsSome of the techniques mentioned above increase the heat integration of the calciner, reducingthe consumption of fuel in the refinery. Others just decrease the amount of particulates emittedto the atmosphere, re-using the coke fines generated during the calcination process. Theemission values for petroleum coke production plants attainable in continuous operation arepresented in Table 4.13. Those values can be achieved by applying the techniques mentionedabove.
Emission component Values attainable in continuous operationEmissions values as half hourly mean values
mg/Nm3 @ 3 % O2Particulate (dust) emissions 20 - 100Particulate (dust) components: Ni, V and theircomponents (given as Ni and V total)
3 - 15
NOx (as NO2) 450 - 875SOx (as SO2) 1000 - 3000 (No SO2 abatement technique
included)CO 100HC (given as total carbon) 20
Table 4.11: Emission values for petroleum coke production plants (calcination of green coke)
Operational dataSome operational data of petroleum coke calciners can be found in Sections 2.7 and 3.7.
ApplicabilityApplied to coke produced by delayed cokers and fluid cokers.
Driving force for implementationProduction process. For certain applications, green coke produced by the delayed coker shouldbe calcinated before being used or sold.
Example plantsMany examples exist in Europe and around the world. Multiple-hearth furnaces have beenextensivelly applied to waste incineration. A majority of facilities that calcine coke utilise arotary kiln. The last two calcining facilities built in the world are rotary kilns.
Reference literature[117, VDI, 2000], [147, HMIP UK, 1995], [268, TWG, 2001], [347, Services, 2001]
4.7.4 Flexicoking
DescriptionA brief description of this production process can be found in Section 2.7. Some techniques thatmay be applied to prevent emission from the flexicoker are:
Techniques to consider in the determination of BAT Chapter 4
MA/EIPPCB/REF_BREF_FINAL December 2001 207
1. The flexicoking process has a high level of heat integration. The only source of heat in theFlexicoker process is the gasifier, where the coke is partially oxidised. The remainder of theheat in the coker gas is recovered by generating steam. The energy efficiency can be furtherincreased if the coke gas is combusted in a gas turbine of a combined cycle unit. SeeSection 4.10.
2. As coke cutting from drums is not needed, emissions and dirty effluent generation areavoided compared to delayed coking. Moreover, the sulphur components from the coke gasare easy to eliminate. Some 84 - 88 % w/w of the hydrocarbon feed is recovered ashydrocarbon product, the remainder is converted into CO, CO2 and H2O.
3. The coke gas from the heater is passed through a cyclone set to remove the coarser cokeparticles and is subsequently cooled by generation of high-pressure steam and by preheatingboiler feed water. About 75 % of coke fines which pass through the two stages of heatercyclones are recovered in tertiary cyclones. Almost all the coke fines which escape thetertiary cyclones are scrubbed out in the venturi scrubber. The water slurry from the venturiscrubber is steam stripped to remove absorbed hydrogen sulphide and ammonia.
Achieved environmental benefits1. Increases the energy efficiency of the flexicoking process.2. Generates less waste than delayed coking.3. Prevents particulate, hydrogen sulphide and ammonia emissions.
Operational dataSome operational data for flexicokers can be found in Sections 2.7. and 3.7.
ApplicabilityFully applicable. However, because the products from flexicoking are different than othercoking processes (e.g no coke is produced) the implementation of this option typically shouldconsider the refinery product requirements.
EconomicsInvestment (basis U.S. Gulf Coast 1996): 15100 - 19500 US$ per m3/d (typical).
Driving force for implementationProduction process.
Example plantsMany examples exist in Europe, USA and the rest of the world.
Reference literature[212, Hydrocarbon processing, 1998], [271, Martinez del Pozo, 2000]
4.7.5 Use of oily sludges and/or waste as coker feedstock
DescriptionIn refineries with a coker, oily sludges, sludges from the waste water treatment and waste can bedestroyed in the coker (delayed, fluid or flexicoker). In the case that coke is produced, the cokequality produced should remains acceptable (acceptable with respect to further use as fuelwithin/outside refinery or as material for other purposes). Many oily sludges can be sent to acoking unit where they become part of the refinery products. In the case of delayed coker, thesludge can be injected into the coke drum with the quench water, or injected into the cokerblowdown contactor used in separating the quenching products.
Achieved environmental benefitsReduction of the amount of sludge and/or waste produced in the refinery. In principle anyrefinery with a coker is able to reduce its oily sludge production to ‘zero’ with the exceptionwhere high quality coke requirements that restrict its use.
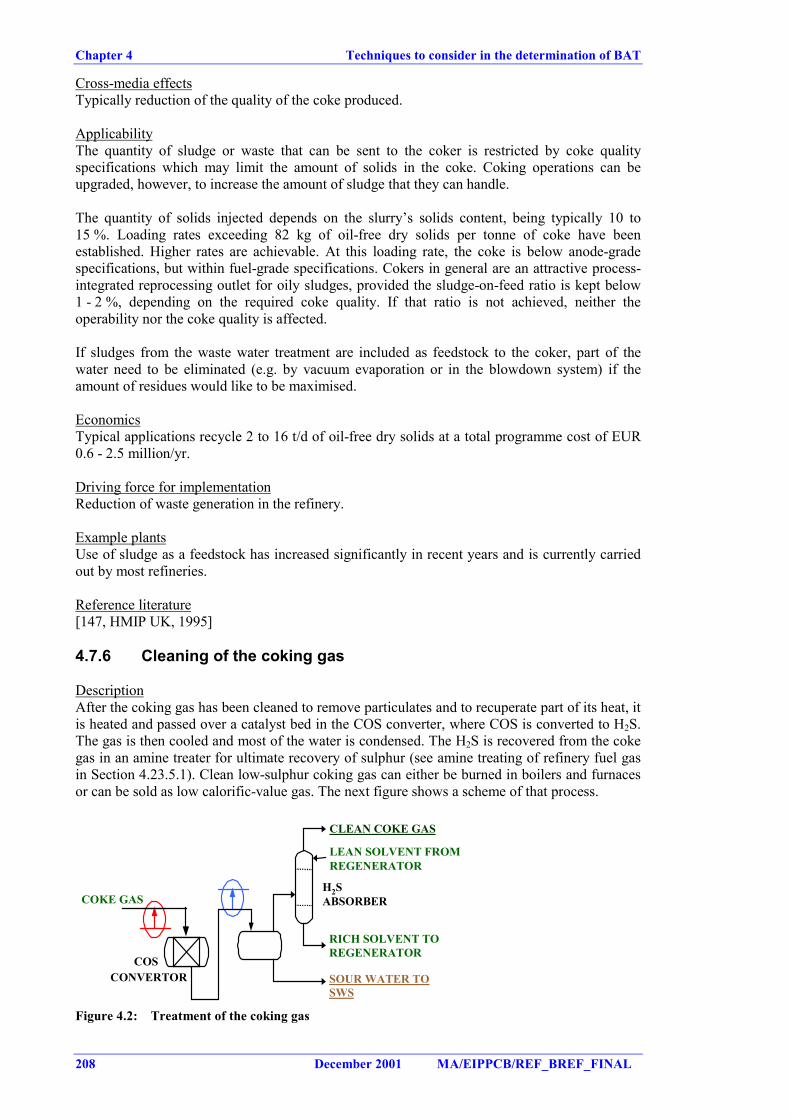
Chapter 4 Techniques to consider in the determination of BAT
208 December 2001 MA/EIPPCB/REF_BREF_FINAL
Cross-media effectsTypically reduction of the quality of the coke produced.
ApplicabilityThe quantity of sludge or waste that can be sent to the coker is restricted by coke qualityspecifications which may limit the amount of solids in the coke. Coking operations can beupgraded, however, to increase the amount of sludge that they can handle.
The quantity of solids injected depends on the slurry’s solids content, being typically 10 to15 %. Loading rates exceeding 82 kg of oil-free dry solids per tonne of coke have beenestablished. Higher rates are achievable. At this loading rate, the coke is below anode-gradespecifications, but within fuel-grade specifications. Cokers in general are an attractive process-integrated reprocessing outlet for oily sludges, provided the sludge-on-feed ratio is kept below1 - 2 %, depending on the required coke quality. If that ratio is not achieved, neither theoperability nor the coke quality is affected.
If sludges from the waste water treatment are included as feedstock to the coker, part of thewater need to be eliminated (e.g. by vacuum evaporation or in the blowdown system) if theamount of residues would like to be maximised.
EconomicsTypical applications recycle 2 to 16 t/d of oil-free dry solids at a total programme cost of EUR0.6 - 2.5 million/yr.
Driving force for implementationReduction of waste generation in the refinery.
Example plantsUse of sludge as a feedstock has increased significantly in recent years and is currently carriedout by most refineries.
Reference literature[147, HMIP UK, 1995]
4.7.6 Cleaning of the coking gas
DescriptionAfter the coking gas has been cleaned to remove particulates and to recuperate part of its heat, itis heated and passed over a catalyst bed in the COS converter, where COS is converted to H2S.The gas is then cooled and most of the water is condensed. The H2S is recovered from the cokegas in an amine treater for ultimate recovery of sulphur (see amine treating of refinery fuel gasin Section 4.23.5.1). Clean low-sulphur coking gas can either be burned in boilers and furnacesor can be sold as low calorific-value gas. The next figure shows a scheme of that process.
LEAN SOLVENT FROMREGENERATOR
COSCONVERTOR
CLEAN COKE GAS
H2SABSORBER
SOUR WATER TOSWS
RICH SOLVENT TOREGENERATOR
COKE GAS
Figure 4.2: Treatment of the coking gas
Techniques to consider in the determination of BAT Chapter 4
MA/EIPPCB/REF_BREF_FINAL December 2001 209
Achieved environmental benefitsReduction of the emissions of H2S (less than 100 ppm v/v) and COS.
Cross-media effectsIncreased use of the amine scrubbing system and increased energy consumption of the COSconvertor.
Operational dataFor amine scrubbing see Section 4.23.5.1.
ApplicabilityAmine scrubbing is applied to all types of cokers and COS convertor to flexicokers.
EconomicsEconomics of the amine absorption of H2S can be found in Section 4.23.5.1
Driving force for implementationCleaning of the coke gas. Coke gas forms a main refinery gas source (after dust removal, COSconversion and amine treating for H2S removal).
Example plantsThese systems can be found in many cokers.
Reference literature[118, VROM, 1999]
4.7.7 Water use in the cooling/cutting process
DescriptionThe water used in the cutting/cooling operations is continuously recirculated with a bleed-off tothe refinery waste water treatment. Settling and filtering over a vacuum filter enables the re-useof this water, resulting in a 'closed water loop'. For water make-up to the quenching and cuttingwater loop, various effluent streams can be used. For this duty treated effluent could be used.Collected water from any condenser, and for draining of wet green coke, should be re-used forcoke drum quenching or drilling. This type of cooling is not used in any other process in therefinery because of environmental concern. More information about direct cooling (quenching)is found in Section 2.8.
Achieved environmental benefitsReduce consumption of water in the refinery.
Cross-media effectsCutting and cooling process result in vapour emissions (partially recycled in the mainfractionator), significant energy losses, large water use and severe water pollution. Bleeding ofcutting water to the desalter has the potential to add solids to the effluent, so it is best to keepcoker waters separate.
Operational dataThe amount of required make-up water depends on the evaporation losses and the bleed to otherprocesses or to the waste water treatment plant and amounts to about 10 - 20 m3/h for a 106 t/yrdelayed coker unit.
ApplicabilityApplicable when delayed coking is used. Re-use of water is subjected to restrictions of cokequality.
Chapter 4 Techniques to consider in the determination of BAT
210 December 2001 MA/EIPPCB/REF_BREF_FINAL
Driving force for implementationTechnique typically used in the delayed coking process.
Example plantsMany examples of application exist in the world.
Reference literature[268, TWG, 2001]
4.7.8 Handling and storage of the coke
DescriptionSeveral techniques are suitable to reduce particulate emissions that may occur during thehandling of the coke (green and calcined):1. providing the green coke is kept wet, the handling between the discharge and the calciner
feed hopper is not problematic. There is the possibility of parts of the receiving pit dryingout although this is limited as the coke is very wet and is covered with residualhydrocarbons which tend to make it stick together. The construction of wind-breaks aroundthe pit might be considered. Careful design is essential, as bad design could make thesituation worse. Complete enclosure of the pit and associated handling facilities is anotherpossibility. The pits are very large and such an enclosure would be very expensive. Amonitoring programme should be carried out to evaluate if this option is in fact necessary ordesirable
2. cut the coke into a double-roll crusher, for example, and convey it to an intermediate storagesilo. The railway waggons are then loaded from the storage silo. This approach wouldcollect, filter, and dewater the coke prior to storage
3. spray the coke with a very fine layer of oil, which sticks the dust fines to the coke. The useof oil is limited by its acceptability in further processing. The oil option has the addedadvantage of reducing unloading problems
4. covered and de-pressurised conveyor belts5. aspiration systems to extract or collect dust6. use of an enclosed hot blowdown system7. loading areas could be enclosed and positive/negative pressures maintained, exhausting
through bag filters. As alternative dust extraction systems can be incorporated with loadingequipment.
8. collected fines from the cyclones are pneumatically conveyed to a silo with exit air filters.Dust collection systems are provided for handling, storage and loading, using bag filters.Collected fines are re-cycled to storage by enclosed means.
Achieved environmental benefitsEliminates releases to air of particulates (containing metals) from this part of the process duringroutine operation as well as from the storage of the coke. Achievable release level of particulatematter for solids handling is 25 mg/Nm3 (value based on averaged continuous monitoring).
Operational dataAdditionally, the storage silo provides a buffering capacity for process fluctuations and enablesa controlled loading of railway waggons.
Applicability3. Oling coke is sometimes practised in fluid and calcined coke, but is rarely applied withdelayed coke.8. That technique is mostly applicable to calciners, fluid cokers and flexicoking units.
EconomicsThe investment cost of about EUR 30 million for a typical coking unit with a capacity of 1.5Mt/yr may be expected for the storage system.
Techniques to consider in the determination of BAT Chapter 4
MA/EIPPCB/REF_BREF_FINAL December 2001 211
Driving force for implementationReduction of coke spillage. If the petroleum coke is cut directly from the coking units intorailway hopper waggons, it may cause overfilling of the waggons, degrading the quality of thespilled coke and increasing the amount of solids entering the waste water treatment system.Reduction of particulate emissions from the storage system of the coker.
Example plantsMany examples available in European refineries.
Reference literature[261, Canales, 2000], [80, March Consulting Group, 1991], [117, VDI, 2000], [268, TWG,2001]
4.7.9 Techniques to reduce air emissions
This chapter mentiones where the abatement techniques may be used and describes thetechniques used for abatement of air pollutants.
4.7.9.1 Particulate abatement in coking processes
DescriptionFlue gases and coke gas from coking processes normally contain coke particulates (includingmetals). Dust collection systems are then used in some parts of the coking processes.1. cleaning of coke gas2. cleaning of the gas produced during the coke cooling3. incinerated exhaust gases from the calcinator also produce coke fines. Hot flue gases pass
through a waste heat boiler and gas cleaning by a dust collection system.
In addition to the particulate abatement technique used in the FCC (Cyclones or ESP inSection 4.5.9) that may be also used here, bag filters can be used in this processes.
Achieved environmental benefitsAchievable release levels of particulate matter (values based on averaged continuousmonitoring) from calciners and coolers are 10 - 100 mg/Nm3.
Cross-media effectsSee Section 4.5.9.
Operational dataSee Section 4.5.9. The application of ESP for the control of particulate emission from petroleumcoke calciner have shown some difficulties to achieve the lower end of the range. The mainreason is that coke is a very good conductor of electricity and consequently its surface is verydifficult to be electrically charged and consequently difficult to be catch by the ESP.
ApplicabilitySee Section 4.5.9. The application of high efficiency cyclones are easier to be applied than ESP.
EconomicsBag filters can be used at a cost of about EUR 5 million EUR. Calciner boiler cyclones costEUR 225000 (1999). Economics for other type of systems are not available. An economic studydone in a EU+ refinery in 1992 shown that the cost for an ESP for a calciner was high.
Driving force for implementationReduce the particulate emissions from the calciner.
Chapter 4 Techniques to consider in the determination of BAT
212 December 2001 MA/EIPPCB/REF_BREF_FINAL
Example plantsMany examples are available in European refineries that have coking processes.
Reference literature[147, HMIP UK, 1995] [60, Balik and Koraido, 1991], [297, Italy, 2000], [272, Shawcross,2000], [117, VDI, 2000], [268, TWG, 2001]
4.7.9.2 SO2 abatement techniques
DescriptionSulphur oxides are emitted during the coking processes, especially during the calcinationprocesses. The principal option to reduce sulphur dioxide releases from the process is the use ofthe lowest possible sulphur-content feedstocks. In practice, low-sulphur feeds are typically usedfor product quality reasons, since a substantial part of the sulphur remains fixed in the product.However, this option is not always possible and emissions of SO2 may be significant, especiallyduring the calcining process. To control those sulphur oxide emissions, the same abatementtechniques that may be used in the FCC may be also used in this process (Section 4.5.10 and4.23.5.4) with the exception of the DeSOx catalyst additive.
Achieved environmental benefitsSO2 concentration of 25 - 300 mg/Nm3 is achieved when the techniques mentioned in theSection 4.5.10 are used.
Cross-media effectsSection 4.5.10
Operational dataSection 4.5.10
ApplicabilityNormally applied to calciner flue gases.
EconomicsSection 4.5.10
Driving force for implementationReduction of SO2 emissions.
Example plantsSome examples of these techniques can be seen in some European and worldwide refineries.
Reference literature[297, Italy, 2000] and references in Section 4.5.10
4.7.9.3 Combined abatement techniques
The same types of techniques used in the FCC can be used in the coker. More information canbe found in Section 4.5.11.
4.7.10 Techniques to prevent emissions to water
This chapter analyses the ways to prevent emissions to effluents. Techniques used in the finalcleaning of the waters generated in the coking processes are in Section 4.24.
Techniques to consider in the determination of BAT Chapter 4
MA/EIPPCB/REF_BREF_FINAL December 2001 213
4.7.10.1 Treatment of the waste water
In the coking processes, sour water is generated (steam condensate). Consequently, all waterfrom the coking process is send to the sour water stripper (Section 4.24.2) before being sent tothe waste water treatment plant.
4.7.10.2 Separation of the oil/coke fines from the coke-cutting water
DescriptionThe proposed pollution prevention alternative was to retrofit the sump where the oil/coke finesare collected with an inclined plate separator to increase the separation efficiency.
Achieved environmental benefitsCoke fines and water generated from the coke-cutting operation enter an in-ground sump wherethe solids and water are separated by gravity. A refinery study indicated that over twenty-fivetonnes a year of coke fines entered the sewer system from that separator.
EconomicsThe annual cost saving associated with the increased recovery of product (coke) and thereduction in oil/water separation solids was approximately EUR 300000 (7.5 Mt/yr refinery).
Driving force for implementationReduce the coke fines entering in the sewer system.
Reference literature[60, Balik and Koraido, 1991]
4.7.11 Techniques to reduce soil contamination
4.7.11.1 Control and re-use of the coke fines
DescriptionCoke fines are often present around the coker unit and coke storage areas. The coke fines can becollected and recycled before being washed to the sewers or migrating off-site via the wind.Collection techniques include dry sweeping the coke fines and sending the solids to be recycledor disposed of as non-hazardous waste. Another collection technique involves the use ofvacuum ducts in dusty areas (and vacuum hoses for manual collection) which run to a smallbaghouse for collection.
Achieved environmental benefitsReduced soil contamination by coke particulates (including metals). Coke fines can be recycledfor fuel use or can be sold outside (e.g. cement production).
Cross-media effectsElectricity consumption by vacuum ducts/hoses.
ApplicabilityFully applicable.
Driving force for implementationReduction of soil contamination.
Example plant(s)Techniques already in use on USA refineries.
Reference literature[60, Balik and Koraido, 1991]
Chapter 4 Techniques to consider in the determination of BAT
214 December 2001 MA/EIPPCB/REF_BREF_FINAL
4.8 Cooling systems
Under the IPPC process, a horizontal BREF on industrial cooling systems has been produced.The following topics of relevance to refineries are already described and analysed in that BREF:
1. Reduction of direct energy consumption2. Reduction of water requirements3. Reduction of entrainment4. Reduction of emissions to water5. Reduction of air emissions6. Reduction of noise emissions7. Reduction of risk of leakage8. Reduction of biological risk
The description and analysis includes an extensive discussion of environmental benefits ofsystems, cross-media effects, operational data, applicability and economics. To avoid repetition,therefore, this section on cooling addresses only topics not covered by that horizontal BREF.
4.8.1 Segregation of cooling and process waters
DescriptionBecause process waters are normally more contaminated than cooling waters, it is important tomaintain the segregation of the two. Only in cases where cooling waters need treatment(recirculation systems) should they be mixed, and then only at the right point (after the primarytreatment of the process waters).
Achieved environmental benefitsIt reduces the contamination of cooling water by oil coming from other waters. It increases therecovery of oil by the waste water plant.
Cross-media effectsNo cross-media effect has been found.
ApplicabilityWaste water treatment plant need to be sized to handle to the process water flow and the coolingwater flow. Segregation can be very costly in some parts of existing installations.
Driving force for implementationAvoid the contamination of cooling water by process waters, which are usually morecontaminated. Some of the topics dealing with pollution of water from cooling systems havealready been studied in the OSPAR and HELCOM processes (North sea and Baltic sea region).
Reference literature[107, Janson, 1999], OSPAR, HELCOM recommendations.
4.8.2 Air cooling
DescriptionSee Section 2.8 and BREF on cooling.
Achieved environmental benefitsThe major advantage of using air coolers is that no additional medium is required.
Techniques to consider in the determination of BAT Chapter 4
MA/EIPPCB/REF_BREF_FINAL December 2001 215
Cross-media effectsTend to produce more noise than water cooling. Noise production due to air cooler fan is97 - 105 dB(A) at source.
Operational dataA major disadvantage is, that normally a large plot is required when compared to water coolers(5 – 30 m2/MWth duty). It requires electricity but minimal maintenance cost
ApplicabilityAir cooling can be sufficient for the cooling needs in some parts of the refinery processes.Ambient conditions restrict the temperature levels that can be attained. Climatic conditions (hotclimates or temperatures below 0 ºC) typically restrict its use. However the plant location isindependent of water availability. They cannot be located near buildings because air short-circuiting may occur.
EconomicsAir coolers can be expensive. Minimal maintenance cost.
Example plantsMany examples exists in EU refineries.
Reference literature[316, TWG, 2000], [119, Bloemkolk and van der Schaaf, 1996]
4.8.3 Prevention of oil leakages into cooling water
DescriptionLooses of oil throught leaks can be minimised through continuous monitoring and a kind ofLeack Detection and Repare system (similar as that reference for VOC in Section 4.23.6.1). Atits simplest, this comprises monitoring of the cooling water separators for oil build-up. If this isobserved, then it will be necessary to trace back through the system to identify the source of theleak so that corrective action can be taken. Detailed system drawings are essential for thisactivity. Fingerprinting of the oil can also speed up identification of the leak. A furtherrefinement is to install oil in water monitors at various point in the cooling water sytem. Thisallows leaks to be detercted rapidly and corrective action taken. For this procedure to beeffective, sparing of critical heat exchangers will be required. More information in the coolingBREF.
Achieved environmental benefitsReduction of oil leakages into cooling water
Driving force for implementationDetect and correct oil leakages into cooling water.
Reference literature[316, TWG, 2000], [119, Bloemkolk and van der Schaaf, 1996]
Chapter 4 Techniques to consider in the determination of BAT
216 December 2001 MA/EIPPCB/REF_BREF_FINAL
4.9 Desalting
4.9.1 Good desalting practices
DescriptionA short description of desalters can be found in Section 2.9. Several good desalting designshave been included in this section:1. multistage desalters and the combined use of AC and DC fields provide high desalting
efficiencies as well as energy savings2. recycling, in multistage desalters, part of the brine effluent water of second desalters to the
previous one minimises the wash water quantity3. use a low shear mixing device to mix desalter wash water and crude4. avoid turbulence in desalter vessels by using lower water pressure.
Achieved environmental benefitsIncreased efficiency of desalters may reduce wash water usage. Other environmental benefitswould be limited to energy savings, if any, related to a more efficient electric field.
Operational dataTwo-stage processes achieve 99 % or better efficiency (more than 99 % of the salts/solids areremoved from the crude oil). This high efficiency provides process benefits because it allowsless corrosion in the topping units.
ApplicabilityTwo-stage or even three-stage desalting is used either if the crude oil salt content is higher than0.02 %w/w, or if heavy residue is further catalytically processed.
Driving force for implementationIncrease the efficiency of the desalting process.
Reference literature[113, Noyes, 1993], [297, Italy, 2000], [268, TWG, 2001]
4.9.2 Enhance the oil/water separation before discharge to the wastewater treatment plant
DescriptionTechniques that may be applied are:1. transfer the water effluent from desalting units to a settling drum where a further separation
between oil and water can be achieved. The oil can be directly recovered in the slop system2. choice of optimum interface level controllers. As a function of specific gravity and range of
crudes processed, it is possible to consider the most accurate level sensors amongdisplacers, capacitance probes or radio wave detectors. The accuracy of interface levelcontrol is fundamental for the good operation of a desalter.
3. a good improvement in water-oil separation can be achieved using “wetting”agents, whoseaim is to de-oil the solid contaminants that are usually responsible for a significantentrainment of oil in the water
4. use of non-toxic, biodegradable, safe to use, non-flamable specific demulsifying chemicalsto promote coalescense of the water droplets.
Achieved environmental benefitsSystems described above enhance the oil/water separation, reducing the charge of oil to thewaste water treatment and recycling it to the process as well as reductions in the oily sludgegeneration (see Section 4.9.3). With the application of the first technique mentioned above some
Techniques to consider in the determination of BAT Chapter 4
MA/EIPPCB/REF_BREF_FINAL December 2001 217
10 - 20 % less oil is sent to the API separators. The second one can separate off some 5 - 10 %oil from the water phase.
Cross-media effectsSome of the techniques proposed need the application of chemicals.
ApplicabilityFully applicable.
Driving force for implementationEnhance the oil/water separation
Reference literature[297, Italy, 2000]
4.9.3 Enhance the solid/water-oil separation
DescriptionSolids entering the crude distillation unit are likely eventually to attract more oil and produceadditional emulsions and sludges. The amount of solids removed from the desalting unit should,therefore, be maximized. Then the objective is to minimize solids leaving the desalter with thecrude oil. A number of techniques can be used such as:1. use low-shear mixing devices to mix desalter wash water and crude oil2. use low-pressure water in the desalter to avoid turbulence3. replace the water jets with mud rakes. They cause less turbulence when removing settled
solids4. the water phase (suspension) can be separated in a pressurised plate separator. Alternatively
a combination of a hydrocyclone desalter and a hydrocyclone de-oiler can be used5. evaluate the effectiveness of a sludge wash system. The sludge washing is a batch operation
meant to stir the water phase in the desalter to suspend and remove the solids accumulatedon the vessel bottom. This cleaning operation increases the efficiency of desalters duringnormal run, particularly for long cycle runs.
Achieved environmental benefitsWith the application of the techniques mentioned above, the content of oil in the generatedsludges can be decreased and the separation of the sludges from the water phase can beenhanced.
Cross-media effectsThe application of these techniques increases the sludge generation within the refinery. At abottom sediment content of the crude of 0.015 % w/w, theoretically 1500 t/yr sludge can becollected in a 10 Mt/yr refinery.
ApplicabilityWhere bottoms, sediments and water are critical in downstream process units, desalters areequipped with a bottom flushing system to remove settled solids.
Driving force for implementationEnhance the separation of solids from the oil and water phase.
Example plant(s)Desalters with desludging facilities are scarce. Atmospheric residue desalters are also few, butthe number is increasing with the increasing complexity of refineries with respect to residueconversion. In a few refineries, desalters have been equipped with a bottom flushing system(See design in Figure 2.10).
Chapter 4 Techniques to consider in the determination of BAT
218 December 2001 MA/EIPPCB/REF_BREF_FINAL
Reference literature[297, Italy, 2000]
4.9.4 Re-use of water for the desalter
DescriptionThe desalting process plays an important role in the waste water management in a refinery (seeSection 4.15.7). The water used in other processes can be re-used in the desalter. For instance, ifstripped sour water is used as desalter wash water, the ammonia, sulphides and phenols that itcontains can be reabsorbed by the crude to some extent.
The following process water streams can be suitable for use as desalter wash water:1. the accumulated water in the crude distillation unit overhead drum, usually 1 - 2 % w/w on
crude feed from steam injection2. the (unstripped) steam condensates from the light and heavy gasoil dryers and the vacuum
distiller overhead (about 3.5 % w/w on feed)3. stripped sour water and also other solid-free process water streams. Scrubber or quench
water is dirty and requires oil and solids separation prior to biotreatment and/or re-use asdesalter wash water. The sour water is routed to and stripped in a sour water stripper prior tore-use and/or final purification in effluent water treatment facilities
4. slowdowns from cooling water and boilers.
Achieved environmental benefitsBy using the water in this way, the refinery could reduce the hydraulic loading to the wastewater treatment units and reduce consumption of water.
Cross-media effectsRecycling of water streams that may form emulsions need to be avoided, because it results indeterioration of the oil/water phase separation in the desalter, which in turn leads to excessiveoil carry-over to water.
Operational dataThe scrubber water would be hard-piped to the desalter water storage tank without beingstripped first, in most cases.
ApplicabilityExamples of effluents that may form emulsions in the desalter are: bitumen blowing units,hydrocrackers, cokers (fines stabilise emulsions), other deep conversion facilities (insolublemetal sulphides that can stabilise emulsions) and HF-Alkylation units (corrosive fluoridedeposits). This option is fully applicable to new refineries and more difficult to apply in existingrefineries. This option is also limited in use when the salinity of the waste water may reachvalues that would negatively impinge on the Biox unit.
EconomicsThe costs of collecting, treating, pumping and piping these waters need to be considered.
Driving force for implementationThe refinery could reduce the hydraulic loading to the waste water treatment units and reduceconsumption of water.
Reference literature[79, API, 1993], [268, TWG, 2001]
Techniques to consider in the determination of BAT Chapter 4
MA/EIPPCB/REF_BREF_FINAL December 2001 219
4.9.5 Stripping of the desalter brine
DescriptionStrip desalter brine for hydrocarbons, sour components and ammonia removal before sendingbrine to waste water treatment. Recovered hydrocarbons can be blended with several refinerystreams. Acid injection can also be employed to enhance the stripping of oil from emulsions.
Achieved environmental benefitsReduction of the hydrocarbon, sulphur and ammonia content of the waste water generatedwithin the desalter. For example, phenol emissions can be reduced by 90 % and benzeneemissions by 95 %.
ApplicabilityPretreatment of desalter brine is normally applied when processing a very heavy crude. In onerefinery: 8.7 Mt/yr refinery produces a waste water flow in the crude unit of 1.3 m3 per minutecontaining 90 kg/day of phenols. The water discharge from the desalters contains a maximum of20 ppm benzene, and the quantity of desalter wash water is equivalent to 4 - 8 %v/v of the crudecharge. The discharge from the stripper bottoms, with benzene levels in the 20 ppb range, isthen routed to the waste water treatment system. A brine de-oling vessel is installed ahead of thestripping column to decant any free oil undercarry from the desalter. For the above-mentionedrefinery, with this system the phenols can be reduced to an annual emission of 3.29 kg/yr.
Reference literature[113, Noyes, 1993], [79, API, 1993]
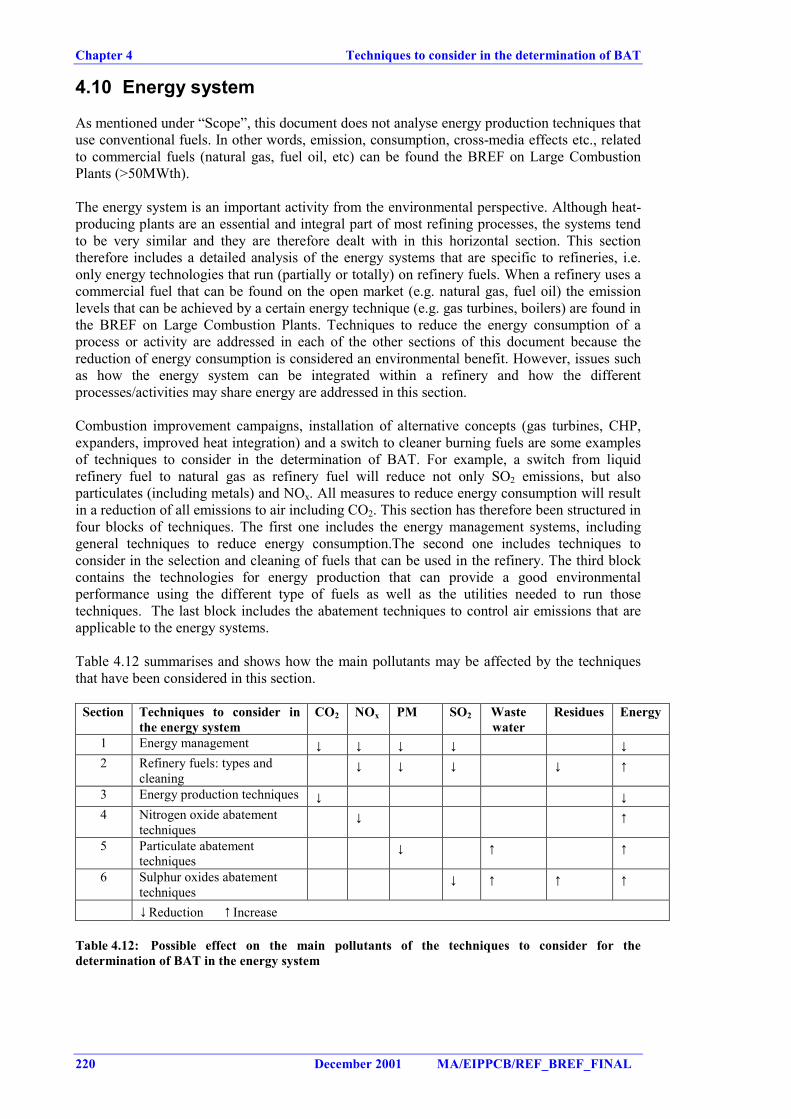
Chapter 4 Techniques to consider in the determination of BAT
220 December 2001 MA/EIPPCB/REF_BREF_FINAL
4.10 Energy system
As mentioned under “Scope”, this document does not analyse energy production techniques thatuse conventional fuels. In other words, emission, consumption, cross-media effects etc., relatedto commercial fuels (natural gas, fuel oil, etc) can be found the BREF on Large CombustionPlants (>50MWth).
The energy system is an important activity from the environmental perspective. Although heat-producing plants are an essential and integral part of most refining processes, the systems tendto be very similar and they are therefore dealt with in this horizontal section. This sectiontherefore includes a detailed analysis of the energy systems that are specific to refineries, i.e.only energy technologies that run (partially or totally) on refinery fuels. When a refinery uses acommercial fuel that can be found on the open market (e.g. natural gas, fuel oil) the emissionlevels that can be achieved by a certain energy technique (e.g. gas turbines, boilers) are found inthe BREF on Large Combustion Plants. Techniques to reduce the energy consumption of aprocess or activity are addressed in each of the other sections of this document because thereduction of energy consumption is considered an environmental benefit. However, issues suchas how the energy system can be integrated within a refinery and how the differentprocesses/activities may share energy are addressed in this section.
Combustion improvement campaigns, installation of alternative concepts (gas turbines, CHP,expanders, improved heat integration) and a switch to cleaner burning fuels are some examplesof techniques to consider in the determination of BAT. For example, a switch from liquidrefinery fuel to natural gas as refinery fuel will reduce not only SO2 emissions, but alsoparticulates (including metals) and NOx. All measures to reduce energy consumption will resultin a reduction of all emissions to air including CO2. This section has therefore been structured infour blocks of techniques. The first one includes the energy management systems, includinggeneral techniques to reduce energy consumption.The second one includes techniques toconsider in the selection and cleaning of fuels that can be used in the refinery. The third blockcontains the technologies for energy production that can provide a good environmentalperformance using the different type of fuels as well as the utilities needed to run thosetechniques. The last block includes the abatement techniques to control air emissions that areapplicable to the energy systems.
Table 4.12 summarises and shows how the main pollutants may be affected by the techniquesthat have been considered in this section.
Section Techniques to consider inthe energy system
CO2 NOx PM SO2 Wastewater
Residues Energy
1 Energy management ↓ ↓ ↓ ↓ ↓2 Refinery fuels: types and
cleaning↓ ↓ ↓ ↓ ↑
3 Energy production techniques ↓ ↓4 Nitrogen oxide abatement
techniques↓ ↑
5 Particulate abatementtechniques
↓ ↑ ↑
6 Sulphur oxides abatementtechniques
↓ ↑ ↑ ↑
↓Reduction ↑ Increase
Table 4.12: Possible effect on the main pollutants of the techniques to consider for thedetermination of BAT in the energy system
Techniques to consider in the determination of BAT Chapter 4
MA/EIPPCB/REF_BREF_FINAL December 2001 221
4.10.1 Energy management
Good design and management of energy systems are important aspects of minimising theenvironmental impact of a refinery, bearing in mind the highly integrated and interdependentnature of most processes. The normal aim is to match continuously the variable production andconsumption of fuels in processes and utilities at the lowest economic and environmental cost.This section should be seen as an integration of all techniques proposed below, since an increasein the energy efficiency of a refinery can be achieved through energy conservation techniqueand heat integration/recovery techniques.
4.10.1.1 Increasing energy efficiency
DescriptionSome techniques to improve and calculate the energy efficiency within the refinery arementioned below.
a) The continuous matching of consumption at lowest cost is to be performed at allorganisational levels and to be assured at the highest management level. By the adoption of aproper management system, this can be done in a similar way to practise in a number of otherfields, notably in the field of safety. In principle the ISO 14000 system series or EMAS [285,Demuynck, 1999] provide an adequate framework to develop an adequate Energy ManagementSystem. In order to ensure continuous improvement, formal reporting of energy consumptiondata to the authorities can be instigated. Energy audits are part of such a system and it is furtherrecommended that, in the pursuit of continuous improvement, refineries learn from best practiceby participating in ranking/benchmarking activities. An annual investment plan on energyconsumption reduction is also to be included as a technique to consider in the determination ofBAT.
b) Another way to match production and consumption is to try to improve the energy efficiencywithin the refinery. More efficient refineries make better use of the energy produced within therefinery. To evaluate that, several methodologies exist, including the Solomon energy efficiencyindex (the most detailed one), specific energy consumption and (less accurate and more simple)the index relating the energy consumption to the amount of feedstock processed (Methodsdescribed briefly in Section 3.10.1). Solomon data is also available in that section. Solomondata are available in a form, that only makes sense in its context, and one needs to understandcertain underlaying (benchmarking) concepts that are proprietary to Solomon.
Techniques to increase the energy efficiency are available in next sections of this chapter.
Achieved environmental benefitsAn increase in the energy efficiency of a refinery has a direct impact reducing the air emissionsand indirectly the generation of waste water and waste. Less consumption of fuels or moreenergy conservation, increasing the likelyhood that the refinery gas supply will be sufficient forthe whole refinery.
Cross-media effectsSome difficulties have been identified in the collection of Solomon energy efficiency data fromrefineries. The main reason is that the figure is considered as confidential by both refineries andthe provider of the market study (Solomon Associates). Futhermore, Solomon Associates hasnot provided to the TWG data on the methodology used to calculate the figures. Moreover, itwas identified that not all refineries participate in this benchmarking exercise because differentreasons (e.g. cost, confidence in their figures was not high). Also not all refineries participateevery year.
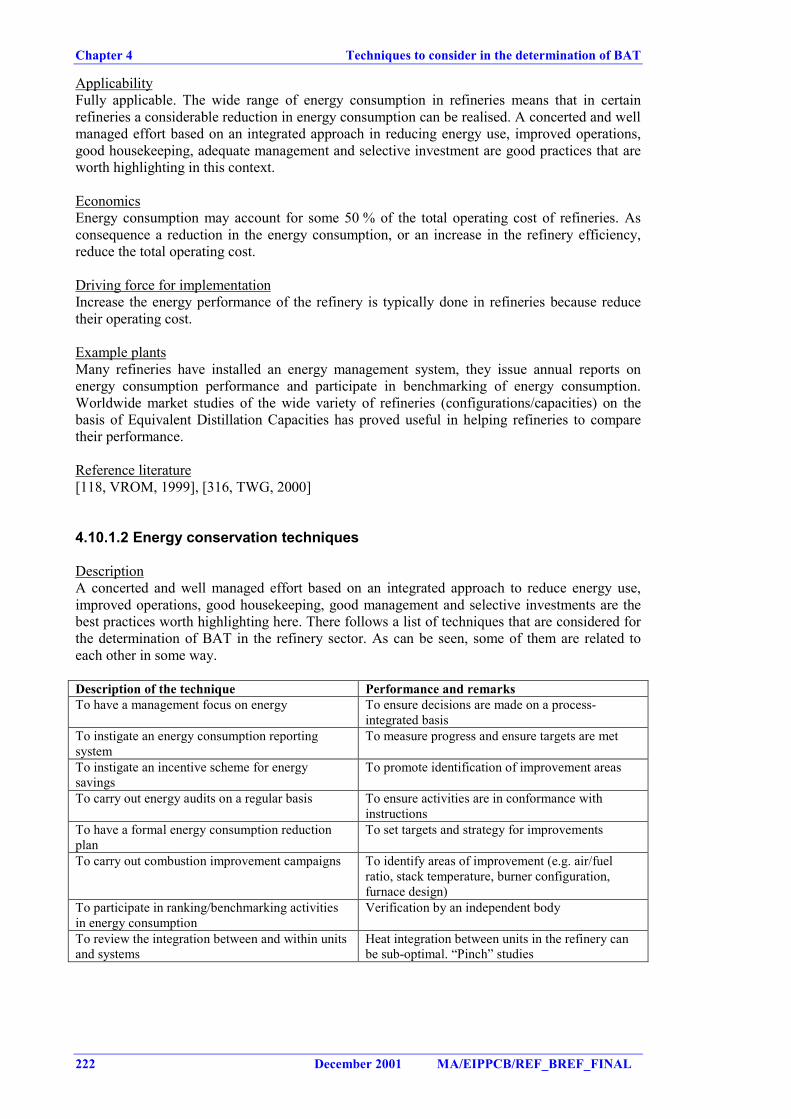
Chapter 4 Techniques to consider in the determination of BAT
222 December 2001 MA/EIPPCB/REF_BREF_FINAL
ApplicabilityFully applicable. The wide range of energy consumption in refineries means that in certainrefineries a considerable reduction in energy consumption can be realised. A concerted and wellmanaged effort based on an integrated approach in reducing energy use, improved operations,good housekeeping, adequate management and selective investment are good practices that areworth highlighting in this context.
EconomicsEnergy consumption may account for some 50 % of the total operating cost of refineries. Asconsequence a reduction in the energy consumption, or an increase in the refinery efficiency,reduce the total operating cost.
Driving force for implementationIncrease the energy performance of the refinery is typically done in refineries because reducetheir operating cost.
Example plantsMany refineries have installed an energy management system, they issue annual reports onenergy consumption performance and participate in benchmarking of energy consumption.Worldwide market studies of the wide variety of refineries (configurations/capacities) on thebasis of Equivalent Distillation Capacities has proved useful in helping refineries to comparetheir performance.
Reference literature[118, VROM, 1999], [316, TWG, 2000]
4.10.1.2 Energy conservation techniques
DescriptionA concerted and well managed effort based on an integrated approach to reduce energy use,improved operations, good housekeeping, good management and selective investments are thebest practices worth highlighting here. There follows a list of techniques that are considered forthe determination of BAT in the refinery sector. As can be seen, some of them are related toeach other in some way.
Description of the technique Performance and remarksTo have a management focus on energy To ensure decisions are made on a process-
integrated basisTo instigate an energy consumption reportingsystem
To measure progress and ensure targets are met
To instigate an incentive scheme for energysavings
To promote identification of improvement areas
To carry out energy audits on a regular basis To ensure activities are in conformance withinstructions
To have a formal energy consumption reductionplan
To set targets and strategy for improvements
To carry out combustion improvement campaigns To identify areas of improvement (e.g. air/fuelratio, stack temperature, burner configuration,furnace design)
To participate in ranking/benchmarking activitiesin energy consumption
Verification by an independent body
To review the integration between and within unitsand systems
Heat integration between units in the refinery canbe sub-optimal. “Pinch” studies
Techniques to consider in the determination of BAT Chapter 4
MA/EIPPCB/REF_BREF_FINAL December 2001 223
Achieved environmental benefitsAll measures to reduce energy consumption will result in a reduction of all emissions to airincluding CO2. Any energy conservation action has an impact on pollution due to the marginalfuel consumption.
ApplicabilityEspecially applicable to those refineries with very high specific energy consumption. The widerange of specific energy consumptions in refineries (by a factor of 4, see Section 3.10) meansthat in certain refineries a considerable reduction in energy consumption can be realised.
Reference literature[297, Italy, 2000], [118, VROM, 1999]
4.10.1.3 Heat integration/recovery
DescriptionActions that can be taken to improve integration and recovery of heat within a refinery toincrease efficiency can be (list do not try to be comprehensive):• general measures to reduce refinery CO2 emissions, such as optimised heat integration and
improved furnace efficiency combined with computer controlled combustion. This will leadto lower fuel consumption per tonne of crude processed
• installation of waste heat boiler in heaters• installation of expanders/power recovery• expanded heat exchanger areas in heat exchangers where cold streams are preheated by
warm product streams directly from processes• direct feed of “semiproducts” to processes without cooling and storage. It is always useful,
from an energy conservation point of view, to recover the waste heat of hot products of thecrude distillation unit, for instance, by later feeding them directly to the downstream units,rather than cooling them for storage and later feeding the downstream units from tankage
• balancing of vapour and refinery fuel gas systems• use of high-efficiency pumps and compressors• use of heat pumps• decreased film temperature and increased turbulence on heat transfer surfaces• waste heat delivery to adjacent buildings. The identification and use or opportunities for
synergy outside the refinery fence (e.g. district/industrial heating, power generation) mayreduce the cooling needs within the refinery and will reduce the consumption of fuelsomewhere else.
• application of advanced process control to optimise energy utilisation• insulation of buildings and process units (Minimisation of heat losses by thermal radiation)• optimisation of energy production (within 4.10.3).• optimise recycle gas rates, operating temperatures and pressures and steam pressure levels• minimising or even avoiding slops production and their necessary reprocessing• keeping heat exchanging surfaces clean or cleaning them regularly (good housekeeping)• repairing leaks and leaking steam traps• increase of heat exchanger surface areas of new sections of existing plants (so-called “add-
ons“). In the case more add-ons have been added to an existing plants: re-routing ofintermediate process streams and re-definition of the number of steam pressure levels andsteam duties
Achieved environmental benefitsHeat integration of process systems ensures that a substantial proportion of the heat required invarious processes is provided by exchanging heat between streams to be heated and streams tobe cooled. In a refinery, it is important to maximise heat integration in a plant to minimiseheating and cooling duty. This way, substantial amounts of products can be sold instead of
Chapter 4 Techniques to consider in the determination of BAT
224 December 2001 MA/EIPPCB/REF_BREF_FINAL
being burnt. Heat integration/recovery techniques directly result on lower emissions of CO2,NOx, particulates and SO2 (see Section 3.10.3 for air emissions from energy system).
Cross-media effectsThe interchange of heat between processes implies the transference of disturbances from oneprocess to another. This can affect safety, so stability control systems may be required.
ApplicabilityWaste heat is abundant at refineries, and so is low/medium-pressure, low-temperature steam.Any effort to recover waste heat as low-pressure/low-temperature steam is pointless if there isno additional use for the extra steam produced. Options for using that heat need to be carefullyquantified and qualified. Heat exchangers require space. The identification and use oropportunities for synergy outside the refinery fence is some times difficult and need thecompromise not only by the refinery but also for the other part.
EconomicsIt makes economic sense to maximise heat integration in a plant, and as a result minimiseheating requirements and the cooling system burden. Heat integration/recovery offers anopportunity for energy cost savings (50 % of total operating cost of refineries), but the cost ofheat exchangers and piping need to be considered when heat integration is analysed.
Driving force for implementationEconomics because they reduce the fuel consumption.
Example plantsTechniques widely applied in refineries.
Reference literature[107, Janson, 1999], [118, VROM, 1999], [268, TWG, 2001]
4.10.1.4 Steam management
DescriptionSeveral techniques have been considered:• steam used for stripping, vacuum generation, atomisation and tracing is usually lost to waste
water and to the atmosphere. Steam used for mechanical and/or electrical energy generationand heating is usually recovered as condensate in the HP-, MP-, and LP-condensate systemsand collected in the condensate storage tank. Reducing the amount of steam stripping is anoption to reduce the generation of waste water. Stripping steam is normally used to meetflash point specification and to improve front end fractionation and yields distribution. Inorder to reduce the sour water loads to SWS strippers and reduce chemical treatments in theoverhead systems, an option would be to strip sidedraw products, particularly the lightercuts, using reboiled sidestrippers instead of steamed strippers. However, the majority ofsteam is used to strip the column bottom, which could not be reboiled by any other means,so the reduction of condensed steam would be limited anyway; besides, the stripping is farbetter under vapour stream than under reboiling conditions, because the more volatilefraction distillates off
• where inert gas as N2 is available at an economic price, it can be an alternative to steam forstripping operations, especially for the lighter ends
• optimising steam production by waste heat recovery in waste heat boilers (WHB or CHP)from hot flue gases (e.g. stacks) and hot product streams (related to the techniques shown inSection 4.10.1.3).
Achieved environmental benefitsReducing steam stripping reduces waste water generation. Reduction of energy use in steamproduction will lead to a reduced energy requirement and therefore to lower emissions to air.
Techniques to consider in the determination of BAT Chapter 4
MA/EIPPCB/REF_BREF_FINAL December 2001 225
Driving force for implementationEnvironmental driving force
Example plantsApplications are found in some refineries
Reference literature[297, Italy, 2000]
4.10.2 Refinery fuels: types and cleaning
As mentioned above, this document offers a detailed analysis only of refinery fuels produced inthe refinery. Whist the use of marketable fuels such as LPG, commercial fuel oil and gasoil inrefineries is a technique to consider that may be included in this chapter of the BREF, such useis extensively analysed in the LCP BREF [317, EIPPCB, 2002], which also gives achievableemissions levels using those fuels.
4.10.2.1 Increase the use of gas
DescriptionAn alternative to reduce SO2, NOx, CO2 and metals emissions from a refinery would be toreplace or to decrease the use of liquid refinery fuel with LPG – often produce on site -, refineryfuel gas (produced by some conversion techniques) or natural gas. This increase of the use ofgas is typically accompanied with a balance and control of the RFG system between suitablepressure limits to give the system flexibility, with make-up available from clean fuels such asLPG or imported gas. In those cases, an state-of-the-art controls to optimise the performance ofthe RFG is necessary.
Achieved environmental benefitsA full switch to a 100% gas-fired refinery would reduce SO2 emissions by up to 99 %, CO2 by30 - 38 % and NOx by 30 - >50 %. Releases of heavy metals would also be slashed.Furthermore, the use of gas generates very little dust and very low SO2 emissions, as therefinery gases are usually cleaned in amine scrubbers (see next section). Sulphur emissions aresignificantly lower when clean refinery fuel gas is used instead of a distillate such as automotivegasoil, i.e. 10 - 20 times better than low-sulphur (1 %) conventional fuel oil. Because of the lowSO2 concentrations in the flue gases of gas fired boilers, the emission temperatures at the stackcan be lowered to 150 °C (dew point corrosion is less of or no longer a constraint). The lowerflue gas temperature represents a difference in energy efficiency and inherent CO2 emissionreduction. Gaseous fuels typically release less NOx per unit of energy compared to liquid fuels,especially liquid refinery fuels. For gaseous fuels usually only thermal NOx is relevant. Oilburning normally leads to higher levels of NOx releases for several reasons, especially theproblem of fuel NOx arising from the nitrogen content, the need to balance NOx and particulatereleases and the frequent design requirement for firing in combination with gas. More detailedinformation for achievable emission values can be found in Table 4.15 to Table 4.21.
As a matter of summary the benefits for a switch to 100% gas-fired refinery are:� SO2 emissions will be reduced to nil for the single unit and for the refinery bubble will
be given by the emissions from other sources (very small from refinery gas, from theSRU, from the FCCU, the flare etc)
� particulate emissions including heavy metals will be reduced� NOx will be reduced to the levels typical for natural gas firing for energy production
techniques, and consequently other sources as catcrackers will become predominantemitters in the refinery
Chapter 4 Techniques to consider in the determination of BAT
226 December 2001 MA/EIPPCB/REF_BREF_FINAL
� CO2 emission reduction is achieved mainly because of the lower carbon content of gas,its higher calorific value and in addition because of a higher attainable efficiency (Stackgases can be cooled further).
Cross-media effectsIt is acknowledged that the residual fuel replaced by gas results in a further surplus of residue,which has to be considered in any integrated solution for the fuel system of a refinery. It can bethe case that those residual fuels can be burned unproperly outside, so emissions produced bythat can be seen as an emission shift to outside the refinery. Furthermore, the conversion ofheavy fractions into light products and the targets for lower sulphur specifications of fuelsrequire considerable extra energy. This will lead to an inevitable increase in CO2 emissions. Asa first approximation, NOx emissions can be magnified by the use of hydrogen and residualfuels containing fuel bound nitrogen. High-hydrogen fuels result in higher flame temperatures,which typically lead to higher NOx levels. Although not all the fuel nitrogen ends up as NOxemissions, the fuel NOx contributions can range from non-existent, as in the case of natural gasfuelled equipment, to several times the thermal NOx contribution of the equipment for refineryfuels. Refinery fuel gas may contain amines (nitrogen compounds) and other compounds.Further information on conversion techniques of heavy fractions to refinery fuel gas can befound in Section 4.10.3.5, coking sections and hycroconversion processes.
Operational dataThe move from liquid to gas fuel would require process upgrades and gas grid connections.
ApplicabilitySome gases are used locally, i.e. in the process of origin or an adjacent process, but mostrefineries operate a common RFG main into which most RFG is fed and transferred to the gasusers. In a modern refinery the RFG main is carefully "balanced" with respect to supply anddemand; necessary flexibility is obtained by control of production (i.e. reformer throughput,LPG evaporation). The relationship to the refinery flare system is important and RFG willnormally include gas received from flare gas recovery. It may also release excess gas to flare ifthe upper limit pressure is exceeded. The application of energy conservation concepts (seeSection 4.10.1) can help refineries to meet all their needs with refinery gas produced in-house.
EconomicsThe cost of switching to gas can be up to EUR 30 million per year for a 10Mt/yr refinery.Use of LPG in lieu of fuel oil: Approximate capital cost is small (some reburnering) and theapproximate operating cost per year is 120EUR per tonne of fuel (cost differential between LPGand fuel oil). However, operating costs can vary significantly, depending on the season of theyear and on the price of LPG in the market.Use of natural gas in lieu of fuel oil: Approximate capital cost of installation is around GBP4 million. The approximate operating cost per year may vary from below 50 EUR per tonne toabove 100 EUR per tonne (cost differential between natural gas and fuel oil). Again, operatingcost can vary significantly, depending on the season of the year and on the market.
Driving force for implementationReduction of CO2, NOx, SO2 and particulate emissions (including metals)
Example plantsThe amount of refinery gas plus natural gas combusted by European refineries typically accountfrom 60 to 100 % (in terms of megawatts fired). However data from some single Europeanrefineries shows that the amount of heavy fuel oil fired can approach to 60 %.
Reference literature[118, VROM, 1999], [292, HMIP UK, 2000], [317, EIPPCB, 2002], [249, BMUJF, 1999], [268,TWG, 2001]
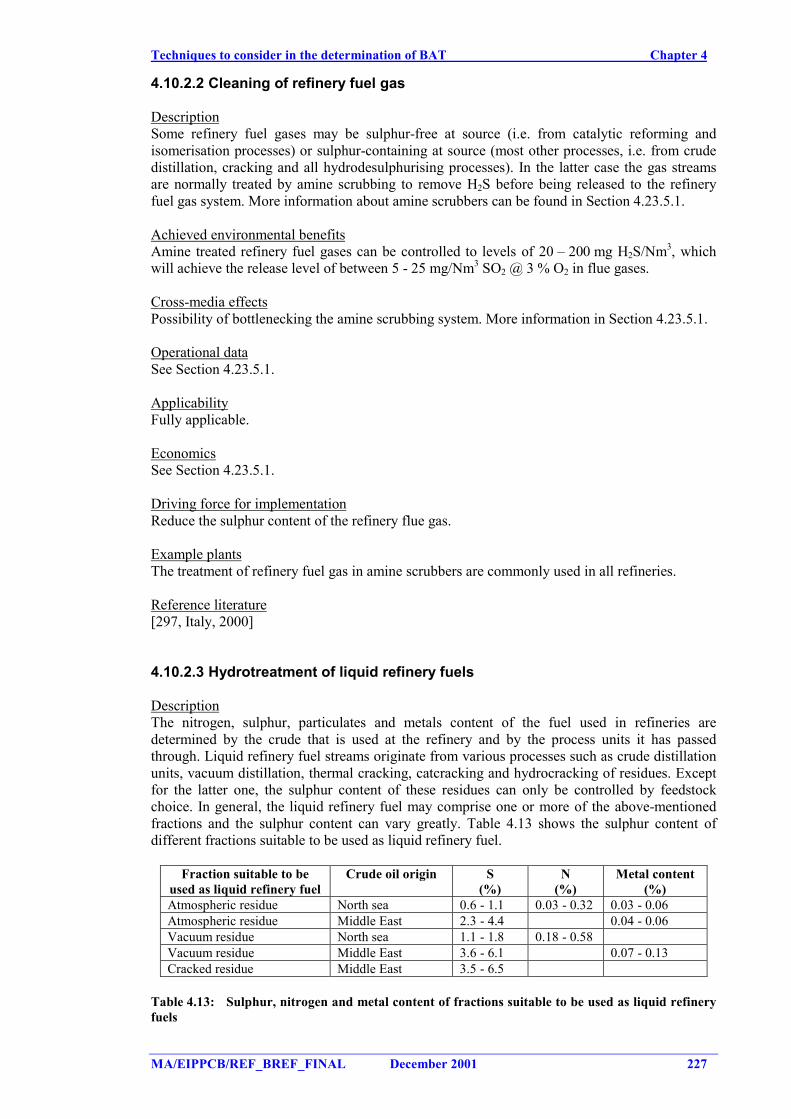
Techniques to consider in the determination of BAT Chapter 4
MA/EIPPCB/REF_BREF_FINAL December 2001 227
4.10.2.2 Cleaning of refinery fuel gas
DescriptionSome refinery fuel gases may be sulphur-free at source (i.e. from catalytic reforming andisomerisation processes) or sulphur-containing at source (most other processes, i.e. from crudedistillation, cracking and all hydrodesulphurising processes). In the latter case the gas streamsare normally treated by amine scrubbing to remove H2S before being released to the refineryfuel gas system. More information about amine scrubbers can be found in Section 4.23.5.1.
Achieved environmental benefitsAmine treated refinery fuel gases can be controlled to levels of 20 – 200 mg H2S/Nm3, whichwill achieve the release level of between 5 - 25 mg/Nm3 SO2 @ 3 % O2 in flue gases.
Cross-media effectsPossibility of bottlenecking the amine scrubbing system. More information in Section 4.23.5.1.
Operational dataSee Section 4.23.5.1.
ApplicabilityFully applicable.
EconomicsSee Section 4.23.5.1.
Driving force for implementationReduce the sulphur content of the refinery flue gas.
Example plantsThe treatment of refinery fuel gas in amine scrubbers are commonly used in all refineries.
Reference literature[297, Italy, 2000]
4.10.2.3 Hydrotreatment of liquid refinery fuels
DescriptionThe nitrogen, sulphur, particulates and metals content of the fuel used in refineries aredetermined by the crude that is used at the refinery and by the process units it has passedthrough. Liquid refinery fuel streams originate from various processes such as crude distillationunits, vacuum distillation, thermal cracking, catcracking and hydrocracking of residues. Exceptfor the latter one, the sulphur content of these residues can only be controlled by feedstockchoice. In general, the liquid refinery fuel may comprise one or more of the above-mentionedfractions and the sulphur content can vary greatly. Table 4.13 shows the sulphur content ofdifferent fractions suitable to be used as liquid refinery fuel.
Fraction suitable to beused as liquid refinery fuel
Crude oil origin S(%)
N(%)
Metal content(%)
Atmospheric residue North sea 0.6 - 1.1 0.03 - 0.32 0.03 - 0.06Atmospheric residue Middle East 2.3 - 4.4 0.04 - 0.06Vacuum residue North sea 1.1 - 1.8 0.18 - 0.58Vacuum residue Middle East 3.6 - 6.1 0.07 - 0.13Cracked residue Middle East 3.5 - 6.5
Table 4.13: Sulphur, nitrogen and metal content of fractions suitable to be used as liquid refineryfuels
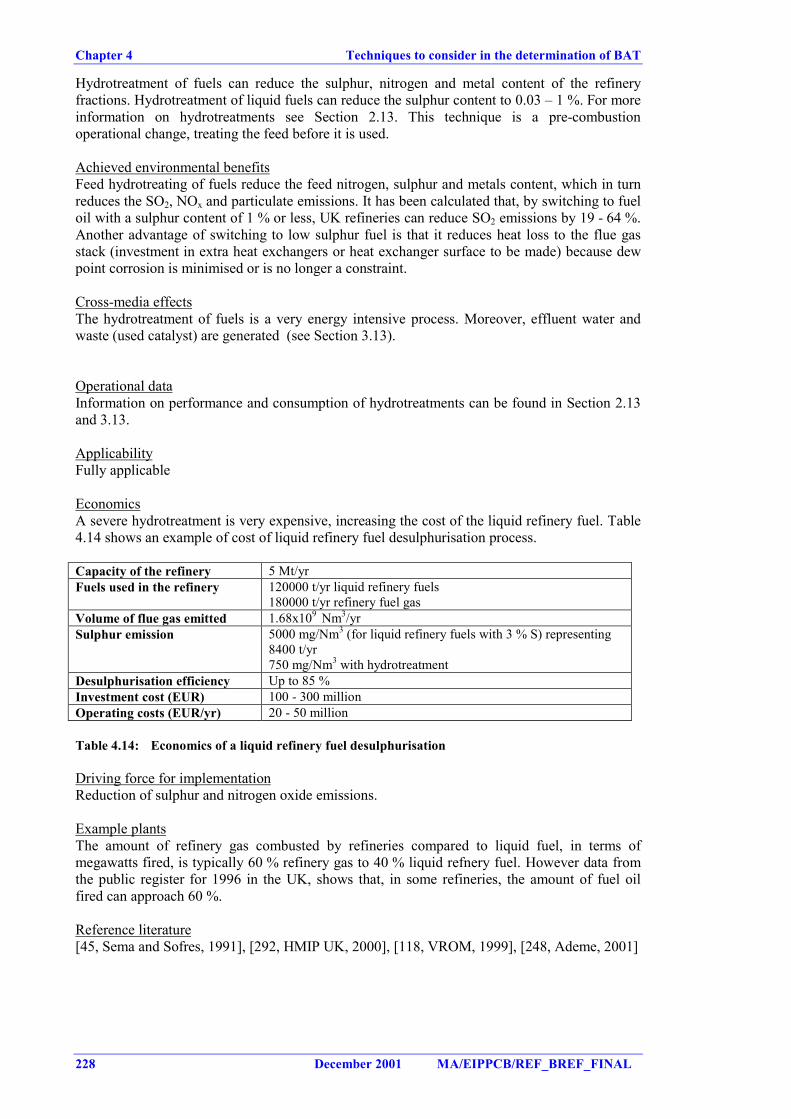
Chapter 4 Techniques to consider in the determination of BAT
228 December 2001 MA/EIPPCB/REF_BREF_FINAL
Hydrotreatment of fuels can reduce the sulphur, nitrogen and metal content of the refineryfractions. Hydrotreatment of liquid fuels can reduce the sulphur content to 0.03 – 1 %. For moreinformation on hydrotreatments see Section 2.13. This technique is a pre-combustionoperational change, treating the feed before it is used.
Achieved environmental benefitsFeed hydrotreating of fuels reduce the feed nitrogen, sulphur and metals content, which in turnreduces the SO2, NOx and particulate emissions. It has been calculated that, by switching to fueloil with a sulphur content of 1 % or less, UK refineries can reduce SO2 emissions by 19 - 64 %.Another advantage of switching to low sulphur fuel is that it reduces heat loss to the flue gasstack (investment in extra heat exchangers or heat exchanger surface to be made) because dewpoint corrosion is minimised or is no longer a constraint.
Cross-media effectsThe hydrotreatment of fuels is a very energy intensive process. Moreover, effluent water andwaste (used catalyst) are generated (see Section 3.13).
Operational dataInformation on performance and consumption of hydrotreatments can be found in Section 2.13and 3.13.
ApplicabilityFully applicable
EconomicsA severe hydrotreatment is very expensive, increasing the cost of the liquid refinery fuel. Table4.14 shows an example of cost of liquid refinery fuel desulphurisation process.
Capacity of the refinery 5 Mt/yrFuels used in the refinery 120000 t/yr liquid refinery fuels
180000 t/yr refinery fuel gasVolume of flue gas emitted 1.68x10⁹ Nm3/yrSulphur emission 5000 mg/Nm3 (for liquid refinery fuels with 3 % S) representing
8400 t/yr750 mg/Nm3 with hydrotreatment
Desulphurisation efficiency Up to 85 %Investment cost (EUR) 100 - 300 millionOperating costs (EUR/yr) 20 - 50 million
Table 4.14: Economics of a liquid refinery fuel desulphurisation
Driving force for implementationReduction of sulphur and nitrogen oxide emissions.
Example plantsThe amount of refinery gas combusted by refineries compared to liquid fuel, in terms ofmegawatts fired, is typically 60 % refinery gas to 40 % liquid refnery fuel. However data fromthe public register for 1996 in the UK, shows that, in some refineries, the amount of fuel oilfired can approach 60 %.
Reference literature[45, Sema and Sofres, 1991], [292, HMIP UK, 2000], [118, VROM, 1999], [248, Ademe, 2001]
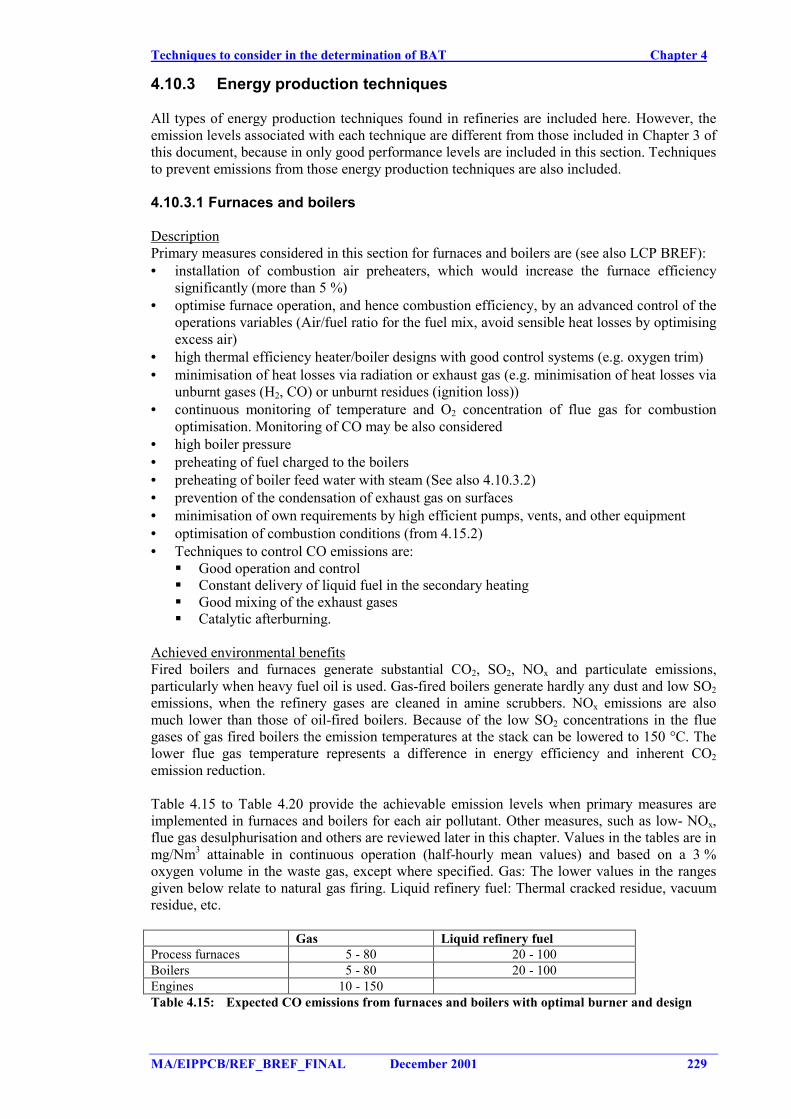
Techniques to consider in the determination of BAT Chapter 4
MA/EIPPCB/REF_BREF_FINAL December 2001 229
4.10.3 Energy production techniques
All types of energy production techniques found in refineries are included here. However, theemission levels associated with each technique are different from those included in Chapter 3 ofthis document, because in only good performance levels are included in this section. Techniquesto prevent emissions from those energy production techniques are also included.
4.10.3.1 Furnaces and boilers
DescriptionPrimary measures considered in this section for furnaces and boilers are (see also LCP BREF):• installation of combustion air preheaters, which would increase the furnace efficiency
significantly (more than 5 %)• optimise furnace operation, and hence combustion efficiency, by an advanced control of the
operations variables (Air/fuel ratio for the fuel mix, avoid sensible heat losses by optimisingexcess air)
• high thermal efficiency heater/boiler designs with good control systems (e.g. oxygen trim)• minimisation of heat losses via radiation or exhaust gas (e.g. minimisation of heat losses via
unburnt gases (H2, CO) or unburnt residues (ignition loss))• continuous monitoring of temperature and O2 concentration of flue gas for combustion
optimisation. Monitoring of CO may be also considered• high boiler pressure• preheating of fuel charged to the boilers• preheating of boiler feed water with steam (See also 4.10.3.2)• prevention of the condensation of exhaust gas on surfaces• minimisation of own requirements by high efficient pumps, vents, and other equipment• optimisation of combustion conditions (from 4.15.2)• Techniques to control CO emissions are:
� Good operation and control� Constant delivery of liquid fuel in the secondary heating� Good mixing of the exhaust gases� Catalytic afterburning.
Achieved environmental benefitsFired boilers and furnaces generate substantial CO2, SO2, NOx and particulate emissions,particularly when heavy fuel oil is used. Gas-fired boilers generate hardly any dust and low SO2emissions, when the refinery gases are cleaned in amine scrubbers. NOx emissions are alsomuch lower than those of oil-fired boilers. Because of the low SO2 concentrations in the fluegases of gas fired boilers the emission temperatures at the stack can be lowered to 150 °C. Thelower flue gas temperature represents a difference in energy efficiency and inherent CO2emission reduction.
Table 4.15 to Table 4.20 provide the achievable emission levels when primary measures areimplemented in furnaces and boilers for each air pollutant. Other measures, such as low- NOx,flue gas desulphurisation and others are reviewed later in this chapter. Values in the tables are inmg/Nm3 attainable in continuous operation (half-hourly mean values) and based on a 3 %oxygen volume in the waste gas, except where specified. Gas: The lower values in the rangesgiven below relate to natural gas firing. Liquid refinery fuel: Thermal cracked residue, vacuumresidue, etc.
Gas Liquid refinery fuelProcess furnaces 5 - 80 20 - 100Boilers 5 - 80 20 - 100Engines 10 - 150Table 4.15: Expected CO emissions from furnaces and boilers with optimal burner and design
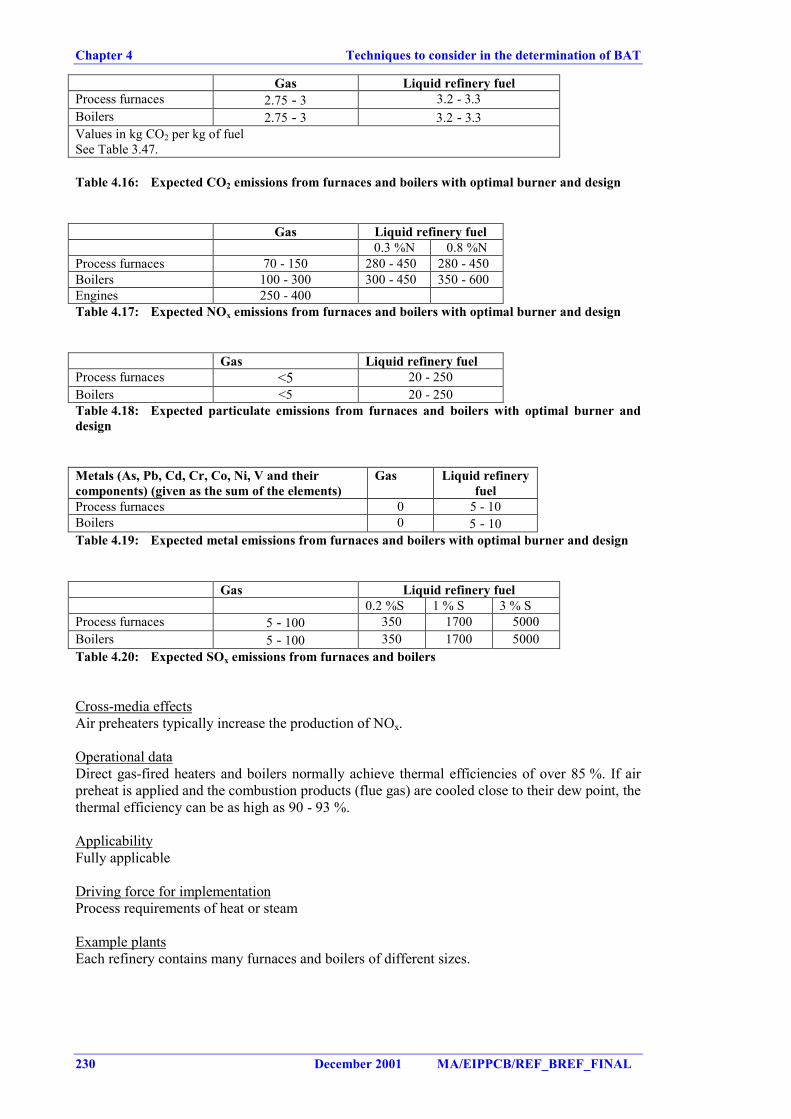
Chapter 4 Techniques to consider in the determination of BAT
230 December 2001 MA/EIPPCB/REF_BREF_FINAL
Gas Liquid refinery fuelProcess furnaces 2.75 - 3 3.2 - 3.3Boilers 2.75 - 3 3.2 - 3.3Values in kg CO2 per kg of fuelSee Table 3.47.
Table 4.16: Expected CO2 emissions from furnaces and boilers with optimal burner and design
Gas Liquid refinery fuel0.3 %N 0.8 %N
Process furnaces 70 - 150 280 - 450 280 - 450Boilers 100 - 300 300 - 450 350 - 600Engines 250 - 400Table 4.17: Expected NOx emissions from furnaces and boilers with optimal burner and design
Gas Liquid refinery fuelProcess furnaces <5 20 - 250Boilers <5 20 - 250Table 4.18: Expected particulate emissions from furnaces and boilers with optimal burner anddesign
Metals (As, Pb, Cd, Cr, Co, Ni, V and theircomponents) (given as the sum of the elements)
Gas Liquid refineryfuel
Process furnaces 0 5 - 10Boilers 0 5 - 10Table 4.19: Expected metal emissions from furnaces and boilers with optimal burner and design
Gas Liquid refinery fuel0.2 %S 1 % S 3 % S
Process furnaces 5 - 100 350 1700 5000Boilers 5 - 100 350 1700 5000Table 4.20: Expected SOx emissions from furnaces and boilers
Cross-media effectsAir preheaters typically increase the production of NOx.
Operational dataDirect gas-fired heaters and boilers normally achieve thermal efficiencies of over 85 %. If airpreheat is applied and the combustion products (flue gas) are cooled close to their dew point, thethermal efficiency can be as high as 90 - 93 %.
ApplicabilityFully applicable
Driving force for implementationProcess requirements of heat or steam
Example plantsEach refinery contains many furnaces and boilers of different sizes.
Techniques to consider in the determination of BAT Chapter 4
MA/EIPPCB/REF_BREF_FINAL December 2001 231
Reference literature[117, VDI, 2000]], [195, The world refining association, 1999], [45, Sema and Sofres, 1991],[317, EIPPCB, 2002], [249, BMUJF, 1999], [297, Italy, 2000], [118, VROM, 1999], [268,TWG, 2001]
4.10.3.2 Boiler feed water (BFW) production and re-use
DescriptionTechniques to consider for the BFW production and re-use are:1) the condensate tank is generally equipped with an oil detection system and an oil skimming
device2) to avoid corrosion in the steam and condensate systems, oxygen and carbon dioxide are
removed in de-aerators, and oxygen scavengers and corrosion inhibitors are added. Forfurther conditioning of BFW, dispersing, alkaline and sometimes anti-foaming agents aredosed
3) minimisation of heat losses via flue gas (unburnt gases, such as H2, CO), via residues(ignition loss), via ashes and slags, via thermal radiation
4) preheating of boiler feed water (to de-areator) by waste heat5) reduction of own energy requirement in the BFW production6) production of boiler feed water: common techniques are ion-exchange, microfiltration and
reversed osmosis. Unlike ion-exchange techniques, membrane processes do not generatewaste water containing high loads of salts. Technologies should be preferred which generaterecyclable residues (e.g. iron-containing sludges). Preferred use of non-toxic chemicals forwater preparation, which are easily degraded by micro-organisms. Use of mineral oil-freeflocculation agents. Use of chemicals with no or only low content of chloroorganiccompounds. Rejection of the following compounds: EDTA (and homologous compounds)and its salts; aminopolycarbonic acids and their salts; metal-organic compounds; chromates,nitrites, organic polyeletrolytes with a monomer content >0.1 % w/w. Treatment of wastewater from boiler feed water preparation in a well designed WWTP, especially in case ofregenerates that contain high amounts of NH3 derived from condensate recovery applyingion exchange. [317, EIPPCB, 2002]
7) conditioning of boiler feed water: Good operation is the combined operation with oxygendosage: By addition of ammonia the pH is adjusted to an alkaline milieu and a small amountof oxygen is added. With this measure, addition of hydracine (which is consideredcancinogenic substance) can be avoided and the demand for ammonia is decreased.Furthermore a protective layer of magnetite and haematite is formed on the inner surface ofthe pipes, which is less rough thereby decreasing the pressure drop within the pipes anddecreasing the energy demand of the pumps. Waste water from water conditioning need tobe neutralised and treated in a well designed WWTP [317, EIPPCB, 2002].
8) repeated reheating of steam
Achieved environmental benefitsThe BFW condensate has a very low pollutant content. The reduction in water actual usebecause of re-use is the most significant environmental benefit.
Cross-media effectsBiotreatment may be required if anti-foaming inhibitors are used. Corrosion inhibitors are notbiodegradable in the waste water treatment plant.
Operational dataBFW should not be recycled or routed to the desalter.
ApplicabilityWhen the re-use of condensate water as deareator feed water or preheating the BFW is applied,in some instances, where the condensate and the deareator are located far apart, their integrationis not always possible because economical reasons.
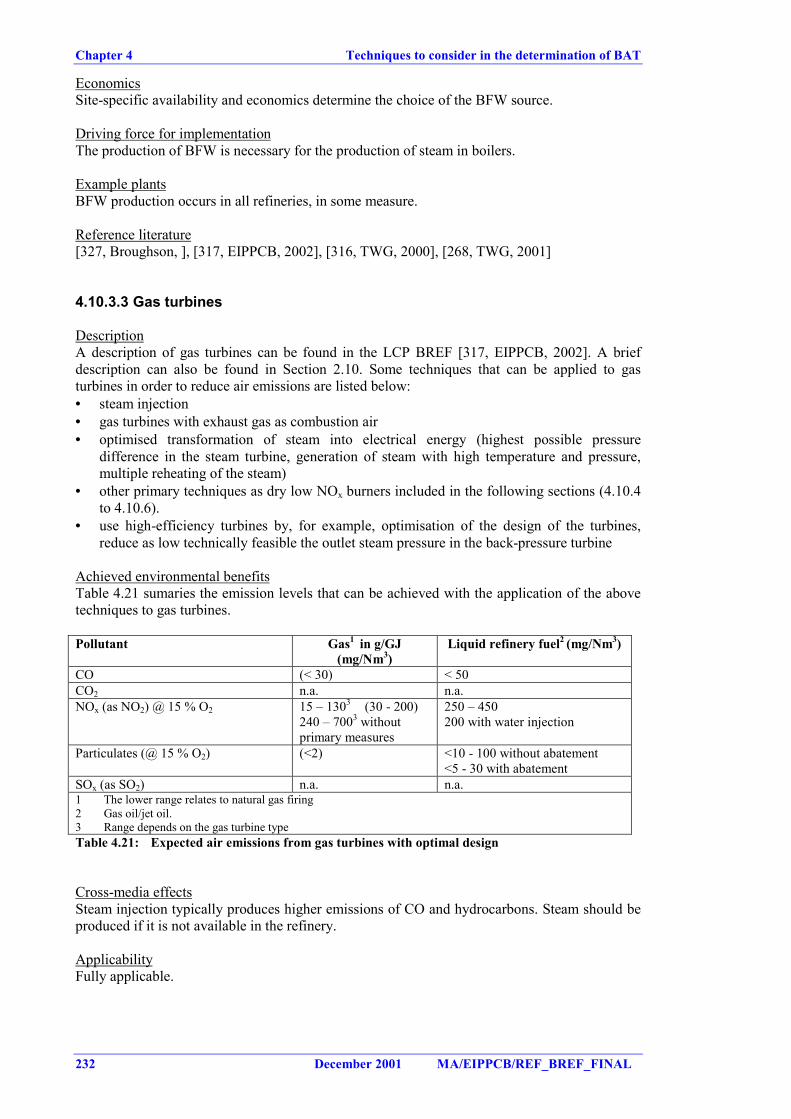
Chapter 4 Techniques to consider in the determination of BAT
232 December 2001 MA/EIPPCB/REF_BREF_FINAL
EconomicsSite-specific availability and economics determine the choice of the BFW source.
Driving force for implementationThe production of BFW is necessary for the production of steam in boilers.
Example plantsBFW production occurs in all refineries, in some measure.
Reference literature[327, Broughson, ], [317, EIPPCB, 2002], [316, TWG, 2000], [268, TWG, 2001]
4.10.3.3 Gas turbines
DescriptionA description of gas turbines can be found in the LCP BREF [317, EIPPCB, 2002]. A briefdescription can also be found in Section 2.10. Some techniques that can be applied to gasturbines in order to reduce air emissions are listed below:• steam injection• gas turbines with exhaust gas as combustion air• optimised transformation of steam into electrical energy (highest possible pressure
difference in the steam turbine, generation of steam with high temperature and pressure,multiple reheating of the steam)
• other primary techniques as dry low NOx burners included in the following sections (4.10.4to 4.10.6).
• use high-efficiency turbines by, for example, optimisation of the design of the turbines,reduce as low technically feasible the outlet steam pressure in the back-pressure turbine
Achieved environmental benefitsTable 4.21 sumaries the emission levels that can be achieved with the application of the abovetechniques to gas turbines.
Pollutant Gas1 in g/GJ(mg/Nm3)
Liquid refinery fuel2 (mg/Nm3)
CO (< 30) < 50CO2 n.a. n.a.NOx (as NO2) @ 15 % O2 15 – 1303 (30 - 200)
240 – 7003 withoutprimary measures
250 – 450200 with water injection
Particulates (@ 15 % O2) (<2) <10 - 100 without abatement<5 - 30 with abatement
SOx (as SO2) n.a. n.a.1 The lower range relates to natural gas firing2 Gas oil/jet oil.3 Range depends on the gas turbine typeTable 4.21: Expected air emissions from gas turbines with optimal design
Cross-media effectsSteam injection typically produces higher emissions of CO and hydrocarbons. Steam should beproduced if it is not available in the refinery.
ApplicabilityFully applicable.
Techniques to consider in the determination of BAT Chapter 4
MA/EIPPCB/REF_BREF_FINAL December 2001 233
EconomicsSteam injection applied to a 85MWe output turbine. Uncontrolled NOx emissions of 500mg/Nm3 @ 15 % O2. Down to 50 - 80 mg/Nm3 @ 15 % O2. Investment cost (1998) EURmillion 3.4 (including cost of steam production) Operating Cost: 0.8 EUR million (excludescapital charge).
Driving force for implementationProcess technique used for the production of electricity.
Example plantsMany examples exist in refineries. A number of refineries have, or are currently installing,combined cycle gas turbine (CCGT), designed to produce steam and power for the refinery.This is usually done to replace in whole or part old oil-fired boiler plant, to reduce operatingcosts and to decrease reliance on other power generators.
Reference literature[45, Sema and Sofres, 1991], [118, VROM, 1999], [115, CONCAWE, 1999].
4.10.3.4 Cogeneration plants (CHP)
DescriptionA brief description can be found in Section 2.10.
Achieved environmental benefitsFor the combination Refinery/Other Power Generators (OPG), the energy consumption and CO2emissions will be reduced by the application of the CHP concept. At the OPG, fuel consumptionand all related emissions will be reduced but, at the refinery, fuel consumption and emissionsmay increase. A refinery that generates its own steam and electricity (no import from the OPG)can benefit from (enhanced) co-generation. In these cases the environmental effect in reducedfuel use and its related emissions accrue completely to the refinery.
Cross-media effectsNo cross-media effects have been detected.
Operational dataMost turbines require a particularly stable mix of fuel in order to be sure of flame stability andare basically designed to burn natural gas. Refinery fuel gas components can vary considerably,especially when surplus hydrogen is produced, such as when a hydrotreatment unit istemporarily shut down, resulting in excess hydrogen being sent to the fuel gas system. However,these problems can usually be overcome, up to a limit of about 70 % hydrogen in the fuel.
ApplicabilityGenerally applicable. The steam and power cogeneration concept can be also be applied toboilers firing, for instance, liquid refinery fuel. They can be designed to generate high-pressuresteam and to let the pressure down over an expander/turbo-generator. Economisers and theoptimisation of air-to-fuel control are also techniques applicable in cogeneration plants.
Driving force for implementationProduction of steam and power to be used within or outside the refinery.
Example plantsA number of refineries have, or are currently installing, combined cycle gas turbine (CCGT) orCombined Heat and Power (CHP) plant, designed to produce steam and power for the refinery.This is usually done to replace in whole or part old oil-fired boiler plant, to reduce operatingcosts and to decrease reliance on other power generators.
Chapter 4 Techniques to consider in the determination of BAT
234 December 2001 MA/EIPPCB/REF_BREF_FINAL
Reference literature[118, VROM, 1999]
4.10.3.5 Gasification of heavy oils or coke (IGCC)
DescriptionIntegrated gasification combined cycle (IGCC) is another technique and its purpose is toproduce steam, hydrogen (optional) (see Section 2.14) and electric power from a variety of lowgrade fuel types with the highest conversion efficiency possible. More information can be foundin Section 2.10.
Achieved environmental benefitsSyngas produced in this process has a sulphur content of 0.01 - 0.05 % and could be used, asrefinery fuel gas for hydrogen, fuel or chemical production. Water containing the sootparticulates is filtered and the filter cake is subjected to a controlled burning process. Theprocess is in principle autothermic, the heat of combustion being sufficient to evaporate themoisture content of the filter cake.
The IGCC is a highly integrated and efficient process which can supply power, hydrogen andsteam. Furthermore, it offers in principle an acceptable outlet for heavy residues and feedstocksor even refinery sludges, provided the latter are less than 1 % of feed. Hot gas clean-up systemshave the potential to increase system efficiency and lower system costs. The achieved emissionsto the atmosphere from that system are: SO2 50 mg/Nm3, NOx 65 mg/Nm3 @ 3 % O2,particulate 5 mg/Nm3 and carbon monoxide 10 - 30 mg/Nm3.
The emissions from the IGCC show a significant decrease compared with conventionalpower/steam plants. The SO2 concentration in the refinery exhaust is reduced by 80 % but CO2emissions increase.
The use of by-product and residual streams to meet the fuel requirement of refineries cannotonly be cost-effective, but also is environmentally beneficial in that it makes use of what wouldotherwise be a waste refinery stream that would be flared without recovering the energy content.
Cross-media effectsIn some cases, some difficulties may occur in burning low calorific value gas produced. Watereffluent is normally sent to the existing waste water treatment plant of the refinery. It maycontain significant amounts of metals as V, Cr or Ni and PAHs.
Operational dataUtility requirements for the gasification processes are 1800 - 4900 kWh/t of power and 1140kg/t of steam consumption. The soot product is about 50 - 75 % w/w V2O5 residue, which canbe sold to metal reclaimers. The IGCC complex is also equipped with all the necessary auxiliarysystems, including cooling water (mixed system with an open seawater circuit for large usersand a closed clean water circuit for the other users), demi-water, air, nitrogen, water and fuel gasnetworks, fire fighting, flare, storage, electrical distribution, buildings, etc.
IGCC is a technology with high flexibility in start-up, shutdown and part-load operation,depending on the level of integration between the different sections. Typically, systems that useheat exchange equipment are more efficient than those using quench cooling; however, thecapital cost of the system with heat exchange is higher and there is a risk of fouling. Handling ofthe soot and filter cake should be done with care to avoid dust (even at 80 % moisture) due tothe toxic properties of the residue.
ApplicabilityThis technique can be seen as an alternative approach to removing sulphur using feedhydrotreatment (see Section 4.10.2.3). During normal refinery operation the gasifiers of the
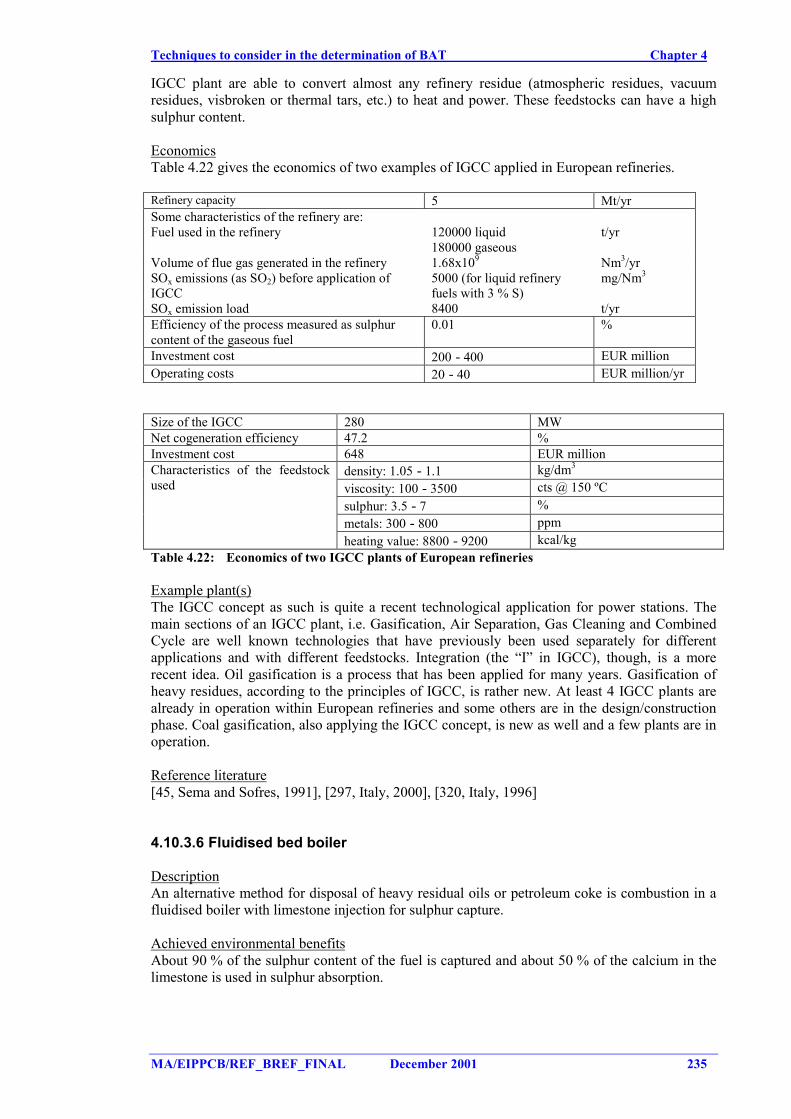
Techniques to consider in the determination of BAT Chapter 4
MA/EIPPCB/REF_BREF_FINAL December 2001 235
IGCC plant are able to convert almost any refinery residue (atmospheric residues, vacuumresidues, visbroken or thermal tars, etc.) to heat and power. These feedstocks can have a highsulphur content.
EconomicsTable 4.22 gives the economics of two examples of IGCC applied in European refineries.
Refinery capacity 5 Mt/yrSome characteristics of the refinery are:Fuel used in the refinery 120000 liquid
180000 gaseoust/yr
Volume of flue gas generated in the refinery 1.68x10⁹ Nm3/yrSOx emissions (as SO2) before application ofIGCC
5000 (for liquid refineryfuels with 3 % S)
mg/Nm3
SOx emission load 8400 t/yrEfficiency of the process measured as sulphurcontent of the gaseous fuel
0.01 %
Investment cost 200 - 400 EUR millionOperating costs 20 - 40 EUR million/yr
Size of the IGCC 280 MWNet cogeneration efficiency 47.2 %Investment cost 648 EUR million
density: 1.05 - 1.1 kg/dm3
viscosity: 100 - 3500 cts @ 150 ºCsulphur: 3.5 - 7 %metals: 300 - 800 ppm
Characteristics of the feedstockused
heating value: 8800 - 9200 kcal/kgTable 4.22: Economics of two IGCC plants of European refineries
Example plant(s)The IGCC concept as such is quite a recent technological application for power stations. Themain sections of an IGCC plant, i.e. Gasification, Air Separation, Gas Cleaning and CombinedCycle are well known technologies that have previously been used separately for differentapplications and with different feedstocks. Integration (the “I” in IGCC), though, is a morerecent idea. Oil gasification is a process that has been applied for many years. Gasification ofheavy residues, according to the principles of IGCC, is rather new. At least 4 IGCC plants arealready in operation within European refineries and some others are in the design/constructionphase. Coal gasification, also applying the IGCC concept, is new as well and a few plants are inoperation.
Reference literature[45, Sema and Sofres, 1991], [297, Italy, 2000], [320, Italy, 1996]
4.10.3.6 Fluidised bed boiler
DescriptionAn alternative method for disposal of heavy residual oils or petroleum coke is combustion in afluidised boiler with limestone injection for sulphur capture.
Achieved environmental benefitsAbout 90 % of the sulphur content of the fuel is captured and about 50 % of the calcium in thelimestone is used in sulphur absorption.
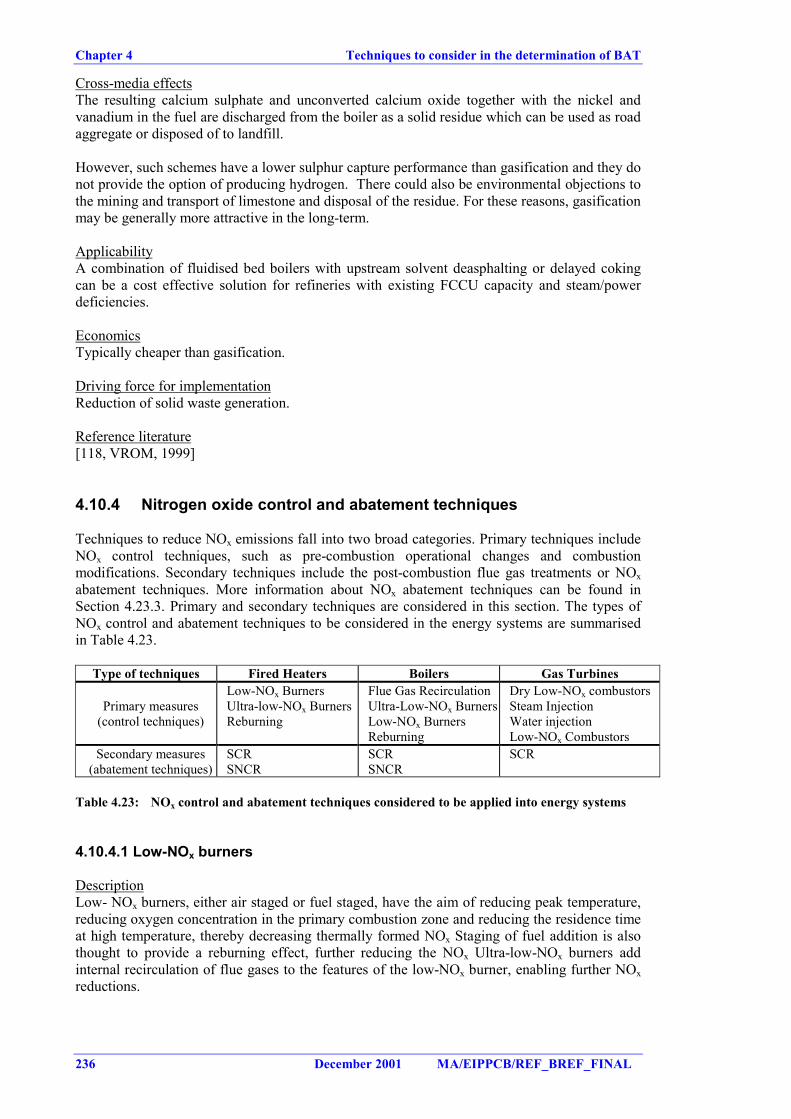
Chapter 4 Techniques to consider in the determination of BAT
236 December 2001 MA/EIPPCB/REF_BREF_FINAL
Cross-media effectsThe resulting calcium sulphate and unconverted calcium oxide together with the nickel andvanadium in the fuel are discharged from the boiler as a solid residue which can be used as roadaggregate or disposed of to landfill.
However, such schemes have a lower sulphur capture performance than gasification and they donot provide the option of producing hydrogen. There could also be environmental objections tothe mining and transport of limestone and disposal of the residue. For these reasons, gasificationmay be generally more attractive in the long-term.
ApplicabilityA combination of fluidised bed boilers with upstream solvent deasphalting or delayed cokingcan be a cost effective solution for refineries with existing FCCU capacity and steam/powerdeficiencies.
EconomicsTypically cheaper than gasification.
Driving force for implementationReduction of solid waste generation.
Reference literature[118, VROM, 1999]
4.10.4 Nitrogen oxide control and abatement techniques
Techniques to reduce NOx emissions fall into two broad categories. Primary techniques includeNOx control techniques, such as pre-combustion operational changes and combustionmodifications. Secondary techniques include the post-combustion flue gas treatments or NOxabatement techniques. More information about NOx abatement techniques can be found inSection 4.23.3. Primary and secondary techniques are considered in this section. The types ofNOx control and abatement techniques to be considered in the energy systems are summarisedin Table 4.23.
Type of techniques Fired Heaters Boilers Gas Turbines
Primary measures(control techniques)
Low-NOx BurnersUltra-low-NOx BurnersReburning
Flue Gas RecirculationUltra-Low-NOx BurnersLow-NOx BurnersReburning
Dry Low-NOx combustorsSteam InjectionWater injectionLow-NOx Combustors
Secondary measures(abatement techniques)
SCRSNCR
SCRSNCR
SCR
Table 4.23: NOx control and abatement techniques considered to be applied into energy systems
4.10.4.1 Low-NOx burners
DescriptionLow- NOx burners, either air staged or fuel staged, have the aim of reducing peak temperature,reducing oxygen concentration in the primary combustion zone and reducing the residence timeat high temperature, thereby decreasing thermally formed NOx Staging of fuel addition is alsothought to provide a reburning effect, further reducing the NOx Ultra-low-NOx burners addinternal recirculation of flue gases to the features of the low-NOx burner, enabling further NOxreductions.
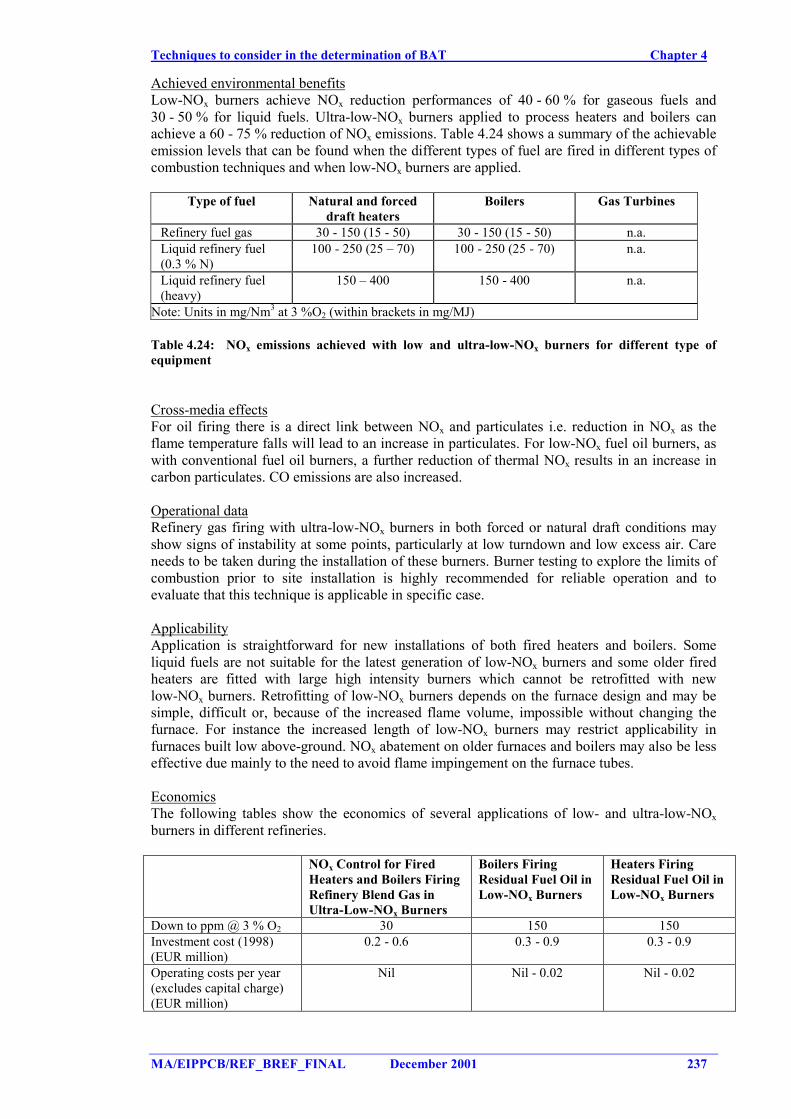
Techniques to consider in the determination of BAT Chapter 4
MA/EIPPCB/REF_BREF_FINAL December 2001 237
Achieved environmental benefitsLow-NOx burners achieve NOx reduction performances of 40 - 60 % for gaseous fuels and30 - 50 % for liquid fuels. Ultra-low-NOx burners applied to process heaters and boilers canachieve a 60 - 75 % reduction of NOx emissions. Table 4.24 shows a summary of the achievableemission levels that can be found when the different types of fuel are fired in different types ofcombustion techniques and when low-NOx burners are applied.
Type of fuel Natural and forceddraft heaters
Boilers Gas Turbines
Refinery fuel gas 30 - 150 (15 - 50) 30 - 150 (15 - 50) n.a.Liquid refinery fuel(0.3 % N)
100 - 250 (25 – 70) 100 - 250 (25 - 70) n.a.
Liquid refinery fuel(heavy)
150 – 400 150 - 400 n.a.
Note: Units in mg/Nm3 at 3 %O2 (within brackets in mg/MJ)
Table 4.24: NOx emissions achieved with low and ultra-low-NOx burners for different type ofequipment
Cross-media effectsFor oil firing there is a direct link between NOx and particulates i.e. reduction in NOx as theflame temperature falls will lead to an increase in particulates. For low-NOx fuel oil burners, aswith conventional fuel oil burners, a further reduction of thermal NOx results in an increase incarbon particulates. CO emissions are also increased.
Operational dataRefinery gas firing with ultra-low-NOx burners in both forced or natural draft conditions mayshow signs of instability at some points, particularly at low turndown and low excess air. Careneeds to be taken during the installation of these burners. Burner testing to explore the limits ofcombustion prior to site installation is highly recommended for reliable operation and toevaluate that this technique is applicable in specific case.
ApplicabilityApplication is straightforward for new installations of both fired heaters and boilers. Someliquid fuels are not suitable for the latest generation of low-NOx burners and some older firedheaters are fitted with large high intensity burners which cannot be retrofitted with newlow-NOx burners. Retrofitting of low-NOx burners depends on the furnace design and may besimple, difficult or, because of the increased flame volume, impossible without changing thefurnace. For instance the increased length of low-NOx burners may restrict applicability infurnaces built low above-ground. NOx abatement on older furnaces and boilers may also be lesseffective due mainly to the need to avoid flame impingement on the furnace tubes.
EconomicsThe following tables show the economics of several applications of low- and ultra-low-NOxburners in different refineries.
NOx Control for FiredHeaters and Boilers FiringRefinery Blend Gas inUltra-Low-NOx Burners
Boilers FiringResidual Fuel Oil inLow-NOx Burners
Heaters FiringResidual Fuel Oil inLow-NOx Burners
Down to ppm @ 3 % O2 30 150 150Investment cost (1998)(EUR million)
0.2 - 0.6 0.3 - 0.9 0.3 - 0.9
Operating costs per year(excludes capital charge)(EUR million)
Nil Nil - 0.02 Nil - 0.02
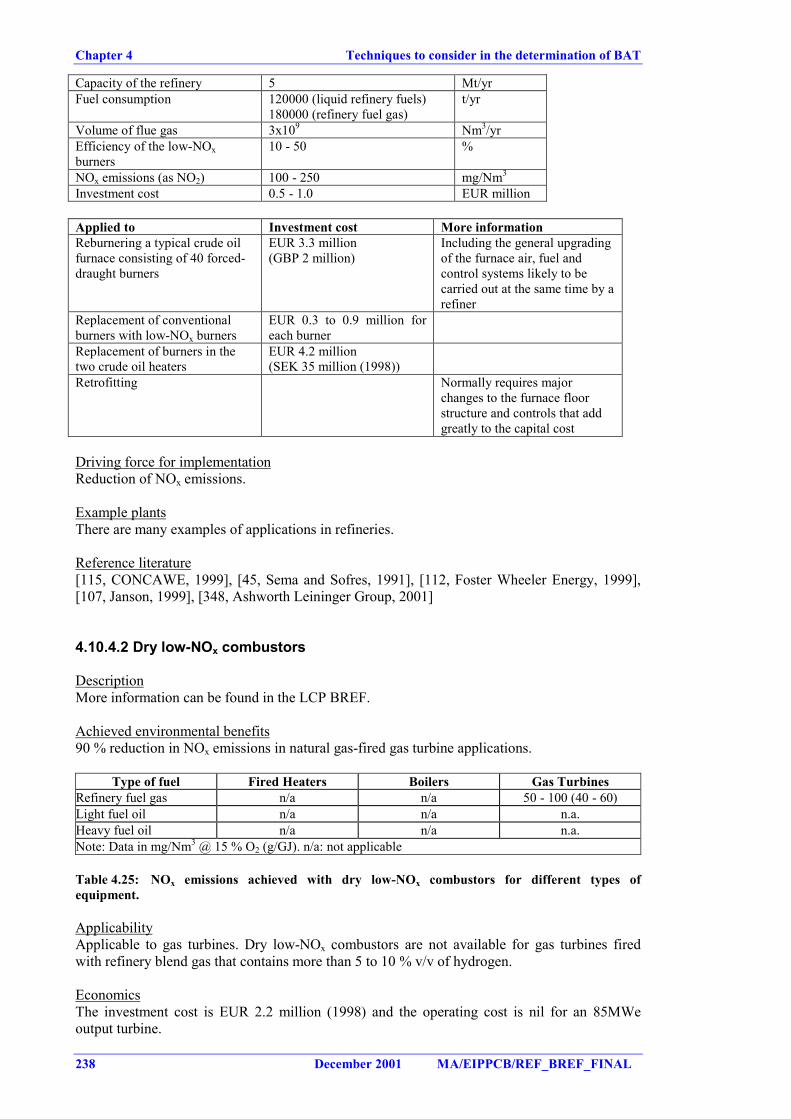
Chapter 4 Techniques to consider in the determination of BAT
238 December 2001 MA/EIPPCB/REF_BREF_FINAL
Capacity of the refinery 5 Mt/yrFuel consumption 120000 (liquid refinery fuels)
180000 (refinery fuel gas)t/yr
Volume of flue gas 3x10⁹ Nm3/yrEfficiency of the low-NOxburners
10 - 50 %
NOx emissions (as NO2) 100 - 250 mg/Nm3
Investment cost 0.5 - 1.0 EUR million
Applied to Investment cost More informationReburnering a typical crude oilfurnace consisting of 40 forced-draught burners
EUR 3.3 million(GBP 2 million)
Including the general upgradingof the furnace air, fuel andcontrol systems likely to becarried out at the same time by arefiner
Replacement of conventionalburners with low-NOx burners
EUR 0.3 to 0.9 million foreach burner
Replacement of burners in thetwo crude oil heaters
EUR 4.2 million(SEK 35 million (1998))
Retrofitting Normally requires majorchanges to the furnace floorstructure and controls that addgreatly to the capital cost
Driving force for implementationReduction of NOx emissions.
Example plantsThere are many examples of applications in refineries.
Reference literature[115, CONCAWE, 1999], [45, Sema and Sofres, 1991], [112, Foster Wheeler Energy, 1999],[107, Janson, 1999], [348, Ashworth Leininger Group, 2001]
4.10.4.2 Dry low-NOx combustors
DescriptionMore information can be found in the LCP BREF.
Achieved environmental benefits90 % reduction in NOx emissions in natural gas-fired gas turbine applications.
Type of fuel Fired Heaters Boilers Gas TurbinesRefinery fuel gas n/a n/a 50 - 100 (40 - 60)Light fuel oil n/a n/a n.a.Heavy fuel oil n/a n/a n.a.Note: Data in mg/Nm3 @ 15 % O2 (g/GJ). n/a: not applicable
Table 4.25: NOx emissions achieved with dry low-NOx combustors for different types ofequipment.
ApplicabilityApplicable to gas turbines. Dry low-NOx combustors are not available for gas turbines firedwith refinery blend gas that contains more than 5 to 10 % v/v of hydrogen.
EconomicsThe investment cost is EUR 2.2 million (1998) and the operating cost is nil for an 85MWeoutput turbine.
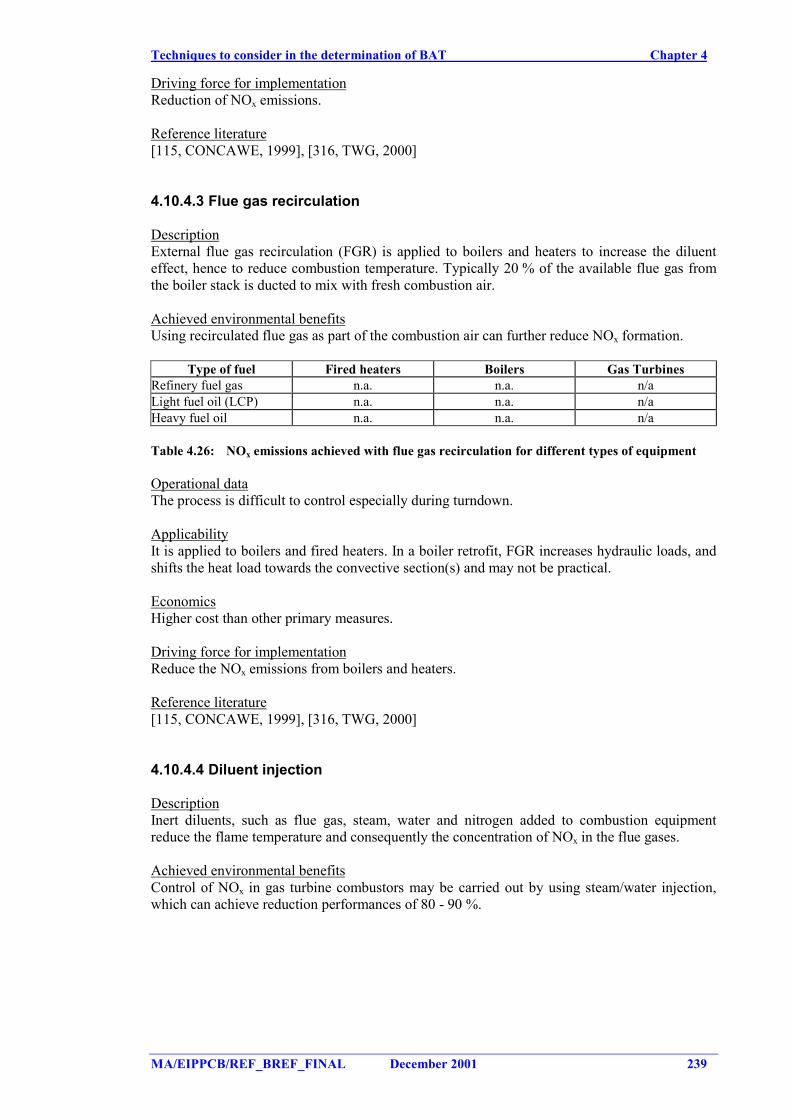
Techniques to consider in the determination of BAT Chapter 4
MA/EIPPCB/REF_BREF_FINAL December 2001 239
Driving force for implementationReduction of NOx emissions.
Reference literature[115, CONCAWE, 1999], [316, TWG, 2000]
4.10.4.3 Flue gas recirculation
DescriptionExternal flue gas recirculation (FGR) is applied to boilers and heaters to increase the diluenteffect, hence to reduce combustion temperature. Typically 20 % of the available flue gas fromthe boiler stack is ducted to mix with fresh combustion air.
Achieved environmental benefitsUsing recirculated flue gas as part of the combustion air can further reduce NOx formation.
Type of fuel Fired heaters Boilers Gas TurbinesRefinery fuel gas n.a. n.a. n/aLight fuel oil (LCP) n.a. n.a. n/aHeavy fuel oil n.a. n.a. n/a
Table 4.26: NOx emissions achieved with flue gas recirculation for different types of equipment
Operational dataThe process is difficult to control especially during turndown.
ApplicabilityIt is applied to boilers and fired heaters. In a boiler retrofit, FGR increases hydraulic loads, andshifts the heat load towards the convective section(s) and may not be practical.
EconomicsHigher cost than other primary measures.
Driving force for implementationReduce the NOx emissions from boilers and heaters.
Reference literature[115, CONCAWE, 1999], [316, TWG, 2000]
4.10.4.4 Diluent injection
DescriptionInert diluents, such as flue gas, steam, water and nitrogen added to combustion equipmentreduce the flame temperature and consequently the concentration of NOx in the flue gases.
Achieved environmental benefitsControl of NOx in gas turbine combustors may be carried out by using steam/water injection,which can achieve reduction performances of 80 - 90 %.
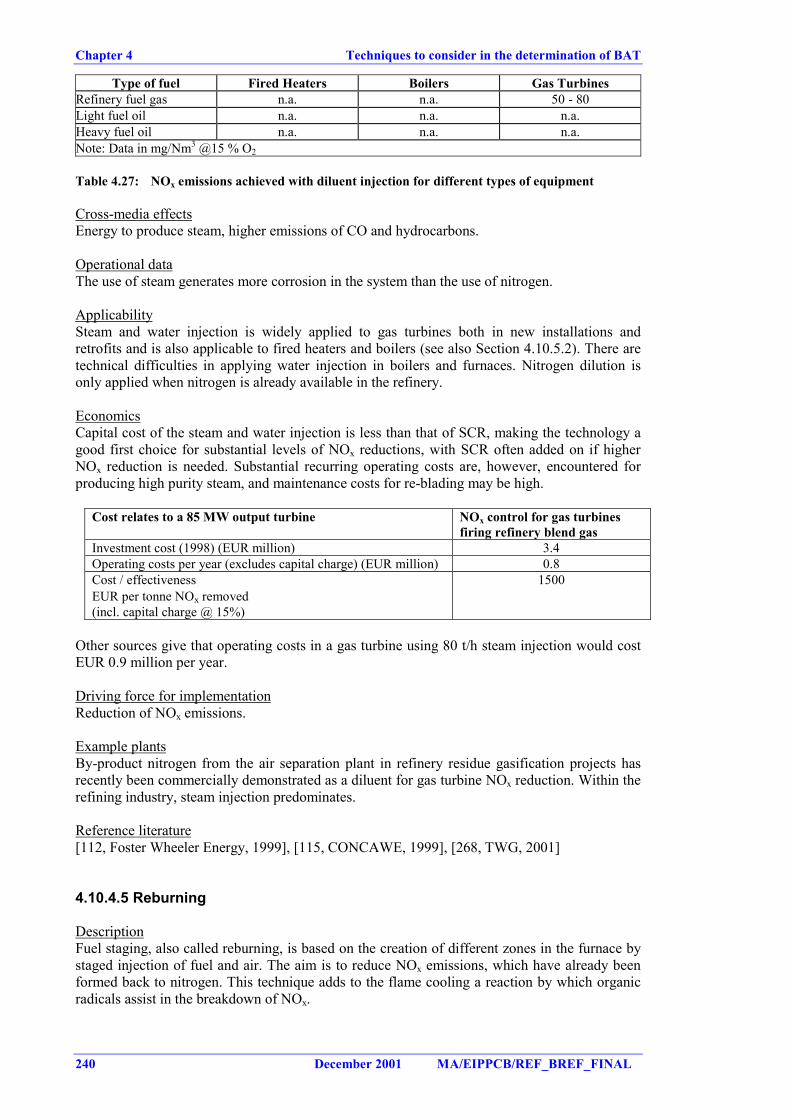
Chapter 4 Techniques to consider in the determination of BAT
240 December 2001 MA/EIPPCB/REF_BREF_FINAL
Type of fuel Fired Heaters Boilers Gas TurbinesRefinery fuel gas n.a. n.a. 50 - 80Light fuel oil n.a. n.a. n.a.Heavy fuel oil n.a. n.a. n.a.Note: Data in mg/Nm3 @15 % O2
Table 4.27: NOx emissions achieved with diluent injection for different types of equipment
Cross-media effectsEnergy to produce steam, higher emissions of CO and hydrocarbons.
Operational dataThe use of steam generates more corrosion in the system than the use of nitrogen.
ApplicabilitySteam and water injection is widely applied to gas turbines both in new installations andretrofits and is also applicable to fired heaters and boilers (see also Section 4.10.5.2). There aretechnical difficulties in applying water injection in boilers and furnaces. Nitrogen dilution isonly applied when nitrogen is already available in the refinery.
EconomicsCapital cost of the steam and water injection is less than that of SCR, making the technology agood first choice for substantial levels of NOx reductions, with SCR often added on if higherNOx reduction is needed. Substantial recurring operating costs are, however, encountered forproducing high purity steam, and maintenance costs for re-blading may be high.
Cost relates to a 85 MW output turbine NOx control for gas turbinesfiring refinery blend gas
Investment cost (1998) (EUR million) 3.4Operating costs per year (excludes capital charge) (EUR million) 0.8Cost / effectivenessEUR per tonne NOx removed(incl. capital charge @ 15%)
1500
Other sources give that operating costs in a gas turbine using 80 t/h steam injection would costEUR 0.9 million per year.
Driving force for implementationReduction of NOx emissions.
Example plantsBy-product nitrogen from the air separation plant in refinery residue gasification projects hasrecently been commercially demonstrated as a diluent for gas turbine NOx reduction. Within therefining industry, steam injection predominates.
Reference literature[112, Foster Wheeler Energy, 1999], [115, CONCAWE, 1999], [268, TWG, 2001]
4.10.4.5 Reburning
DescriptionFuel staging, also called reburning, is based on the creation of different zones in the furnace bystaged injection of fuel and air. The aim is to reduce NOx emissions, which have already beenformed back to nitrogen. This technique adds to the flame cooling a reaction by which organicradicals assist in the breakdown of NOx.
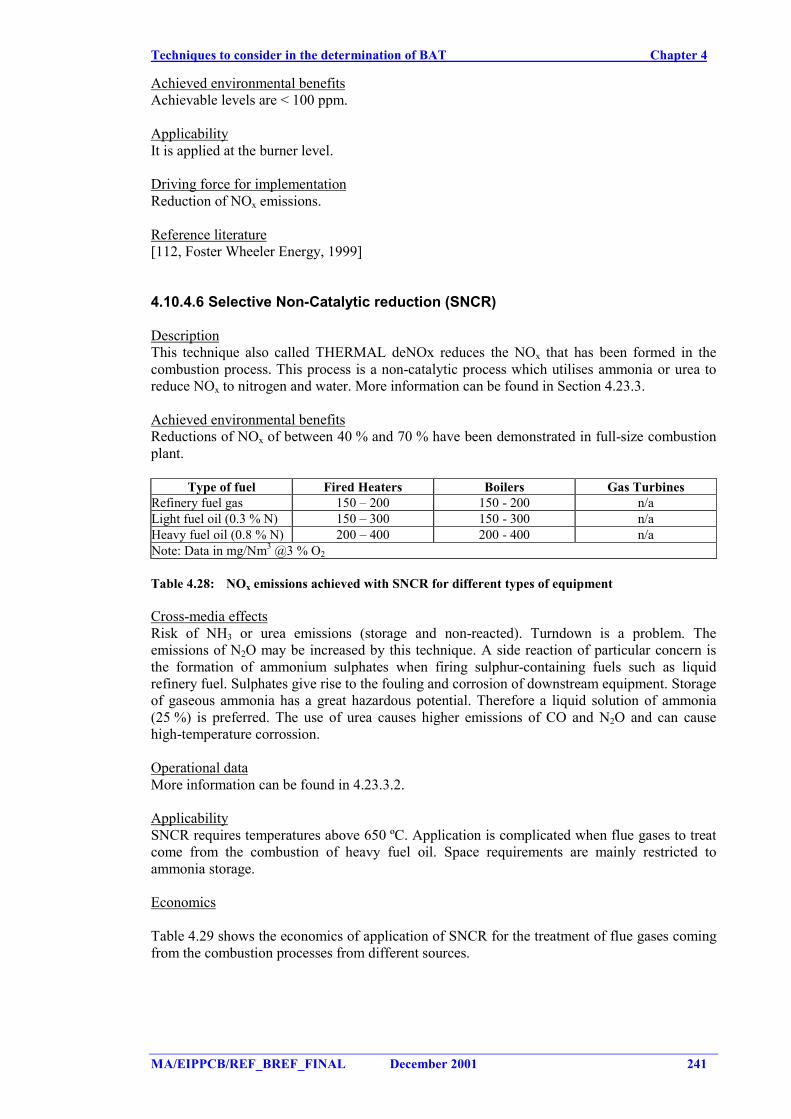
Techniques to consider in the determination of BAT Chapter 4
MA/EIPPCB/REF_BREF_FINAL December 2001 241
Achieved environmental benefitsAchievable levels are < 100 ppm.
ApplicabilityIt is applied at the burner level.
Driving force for implementationReduction of NOx emissions.
Reference literature[112, Foster Wheeler Energy, 1999]
4.10.4.6 Selective Non-Catalytic reduction (SNCR)
DescriptionThis technique also called THERMAL deNOx reduces the NOx that has been formed in thecombustion process. This process is a non-catalytic process which utilises ammonia or urea toreduce NOx to nitrogen and water. More information can be found in Section 4.23.3.
Achieved environmental benefitsReductions of NOx of between 40 % and 70 % have been demonstrated in full-size combustionplant.
Type of fuel Fired Heaters Boilers Gas TurbinesRefinery fuel gas 150 – 200 150 - 200 n/aLight fuel oil (0.3 % N) 150 – 300 150 - 300 n/aHeavy fuel oil (0.8 % N) 200 – 400 200 - 400 n/aNote: Data in mg/Nm3 @3 % O2
Table 4.28: NOx emissions achieved with SNCR for different types of equipment
Cross-media effectsRisk of NH3 or urea emissions (storage and non-reacted). Turndown is a problem. Theemissions of N2O may be increased by this technique. A side reaction of particular concern isthe formation of ammonium sulphates when firing sulphur-containing fuels such as liquidrefinery fuel. Sulphates give rise to the fouling and corrosion of downstream equipment. Storageof gaseous ammonia has a great hazardous potential. Therefore a liquid solution of ammonia(25 %) is preferred. The use of urea causes higher emissions of CO and N2O and can causehigh-temperature corrossion.
Operational dataMore information can be found in 4.23.3.2.
ApplicabilitySNCR requires temperatures above 650 ºC. Application is complicated when flue gases to treatcome from the combustion of heavy fuel oil. Space requirements are mainly restricted toammonia storage.
Economics
Table 4.29 shows the economics of application of SNCR for the treatment of flue gases comingfrom the combustion processes from different sources.
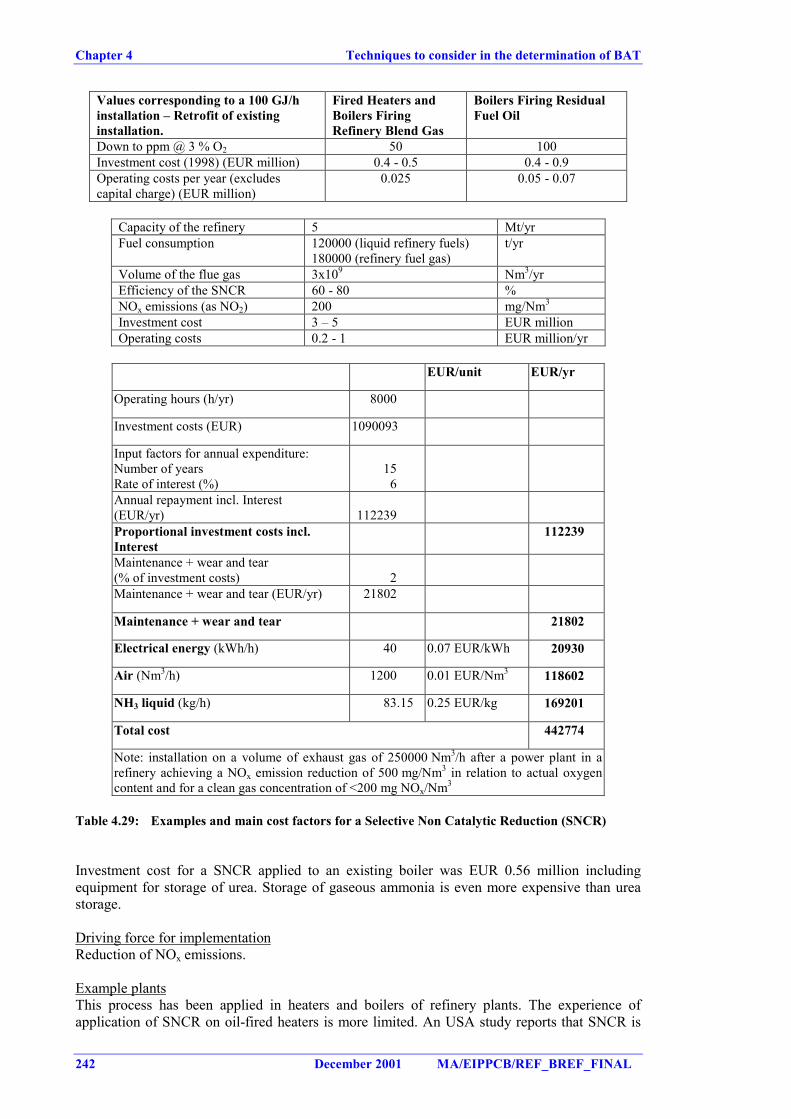
Chapter 4 Techniques to consider in the determination of BAT
242 December 2001 MA/EIPPCB/REF_BREF_FINAL
Values corresponding to a 100 GJ/hinstallation – Retrofit of existinginstallation.
Fired Heaters andBoilers FiringRefinery Blend Gas
Boilers Firing ResidualFuel Oil
Down to ppm @ 3 % O2 50 100Investment cost (1998) (EUR million) 0.4 - 0.5 0.4 - 0.9Operating costs per year (excludescapital charge) (EUR million)
0.025 0.05 - 0.07
Capacity of the refinery 5 Mt/yrFuel consumption 120000 (liquid refinery fuels)
180000 (refinery fuel gas)t/yr
Volume of the flue gas 3x10⁹ Nm3/yrEfficiency of the SNCR 60 - 80 %NOx emissions (as NO2) 200 mg/Nm3
Investment cost 3 – 5 EUR millionOperating costs 0.2 - 1 EUR million/yr
EUR/unit EUR/yr
Operating hours (h/yr) 8000
Investment costs (EUR) 1090093
Input factors for annual expenditure:Number of yearsRate of interest (%)
156
Annual repayment incl. Interest(EUR/yr) 112239Proportional investment costs incl.Interest
112239
Maintenance + wear and tear(% of investment costs) 2Maintenance + wear and tear (EUR/yr) 21802
Maintenance + wear and tear 21802
Electrical energy (kWh/h) 40 0.07 EUR/kWh 20930
Air (Nm3/h) 1200 0.01 EUR/Nm3 118602
NH3 liquid (kg/h) 83.15 0.25 EUR/kg 169201
Total cost 442774
Note: installation on a volume of exhaust gas of 250000 Nm3/h after a power plant in arefinery achieving a NOx emission reduction of 500 mg/Nm3 in relation to actual oxygencontent and for a clean gas concentration of <200 mg NOx/Nm3
Table 4.29: Examples and main cost factors for a Selective Non Catalytic Reduction (SNCR)
Investment cost for a SNCR applied to an existing boiler was EUR 0.56 million includingequipment for storage of urea. Storage of gaseous ammonia is even more expensive than ureastorage.
Driving force for implementationReduction of NOx emissions.
Example plantsThis process has been applied in heaters and boilers of refinery plants. The experience ofapplication of SNCR on oil-fired heaters is more limited. An USA study reports that SNCR is
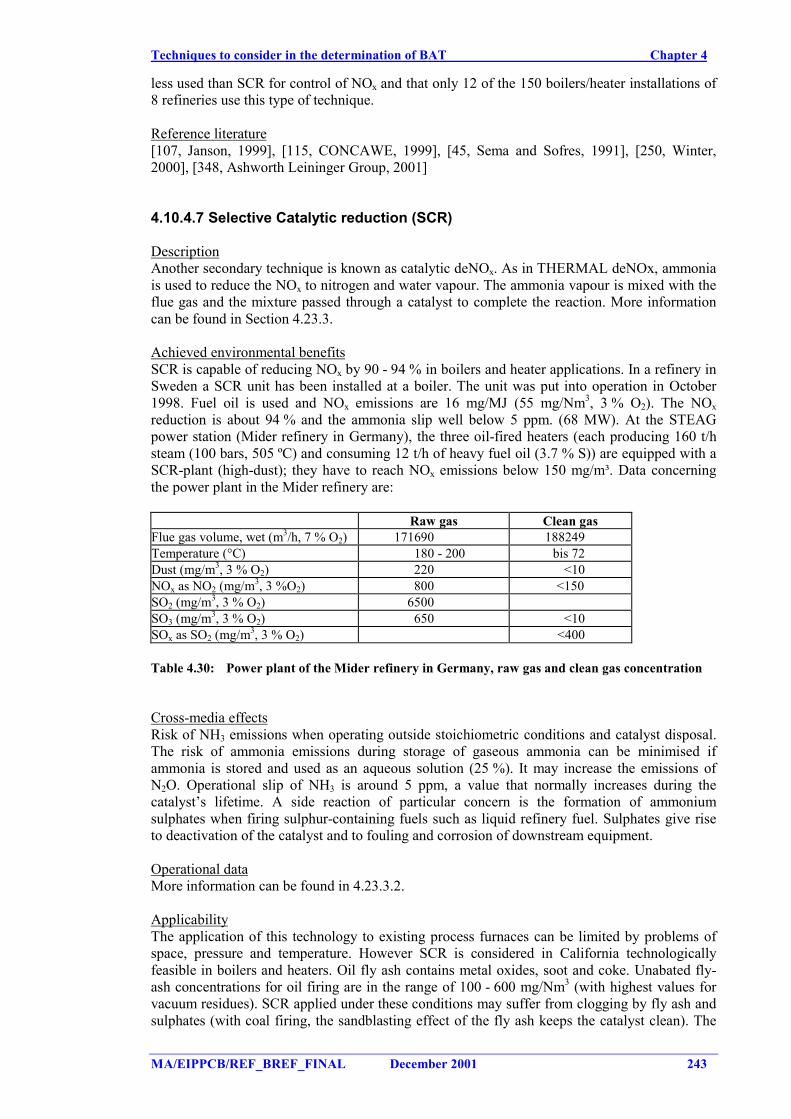
Techniques to consider in the determination of BAT Chapter 4
MA/EIPPCB/REF_BREF_FINAL December 2001 243
less used than SCR for control of NOx and that only 12 of the 150 boilers/heater installations of8 refineries use this type of technique.
Reference literature[107, Janson, 1999], [115, CONCAWE, 1999], [45, Sema and Sofres, 1991], [250, Winter,2000], [348, Ashworth Leininger Group, 2001]
4.10.4.7 Selective Catalytic reduction (SCR)
DescriptionAnother secondary technique is known as catalytic deNOx. As in THERMAL deNOx, ammoniais used to reduce the NOx to nitrogen and water vapour. The ammonia vapour is mixed with theflue gas and the mixture passed through a catalyst to complete the reaction. More informationcan be found in Section 4.23.3.
Achieved environmental benefitsSCR is capable of reducing NOx by 90 - 94 % in boilers and heater applications. In a refinery inSweden a SCR unit has been installed at a boiler. The unit was put into operation in October1998. Fuel oil is used and NOx emissions are 16 mg/MJ (55 mg/Nm3, 3 % O2). The NOxreduction is about 94 % and the ammonia slip well below 5 ppm. (68 MW). At the STEAGpower station (Mider refinery in Germany), the three oil-fired heaters (each producing 160 t/hsteam (100 bars, 505 ºC) and consuming 12 t/h of heavy fuel oil (3.7 % S)) are equipped with aSCR-plant (high-dust); they have to reach NOx emissions below 150 mg/m³. Data concerningthe power plant in the Mider refinery are:
Raw gas Clean gasFlue gas volume, wet (m3/h, 7 % O2) 171690 188249Temperature (°C) 180 - 200 bis 72Dust (mg/m3, 3 % O2) 220 <10NOx as NO2 (mg/m3, 3 %O2) 800 <150SO2 (mg/m3, 3 % O2) 6500SO3 (mg/m3, 3 % O2) 650 <10SOx as SO2 (mg/m3, 3 % O2) <400
Table 4.30: Power plant of the Mider refinery in Germany, raw gas and clean gas concentration
Cross-media effectsRisk of NH3 emissions when operating outside stoichiometric conditions and catalyst disposal.The risk of ammonia emissions during storage of gaseous ammonia can be minimised ifammonia is stored and used as an aqueous solution (25 %). It may increase the emissions ofN2O. Operational slip of NH3 is around 5 ppm, a value that normally increases during thecatalyst’s lifetime. A side reaction of particular concern is the formation of ammoniumsulphates when firing sulphur-containing fuels such as liquid refinery fuel. Sulphates give riseto deactivation of the catalyst and to fouling and corrosion of downstream equipment.
Operational dataMore information can be found in 4.23.3.2.
ApplicabilityThe application of this technology to existing process furnaces can be limited by problems ofspace, pressure and temperature. However SCR is considered in California technologicallyfeasible in boilers and heaters. Oil fly ash contains metal oxides, soot and coke. Unabated fly-ash concentrations for oil firing are in the range of 100 - 600 mg/Nm3 (with highest values forvacuum residues). SCR applied under these conditions may suffer from clogging by fly ash andsulphates (with coal firing, the sandblasting effect of the fly ash keeps the catalyst clean). The
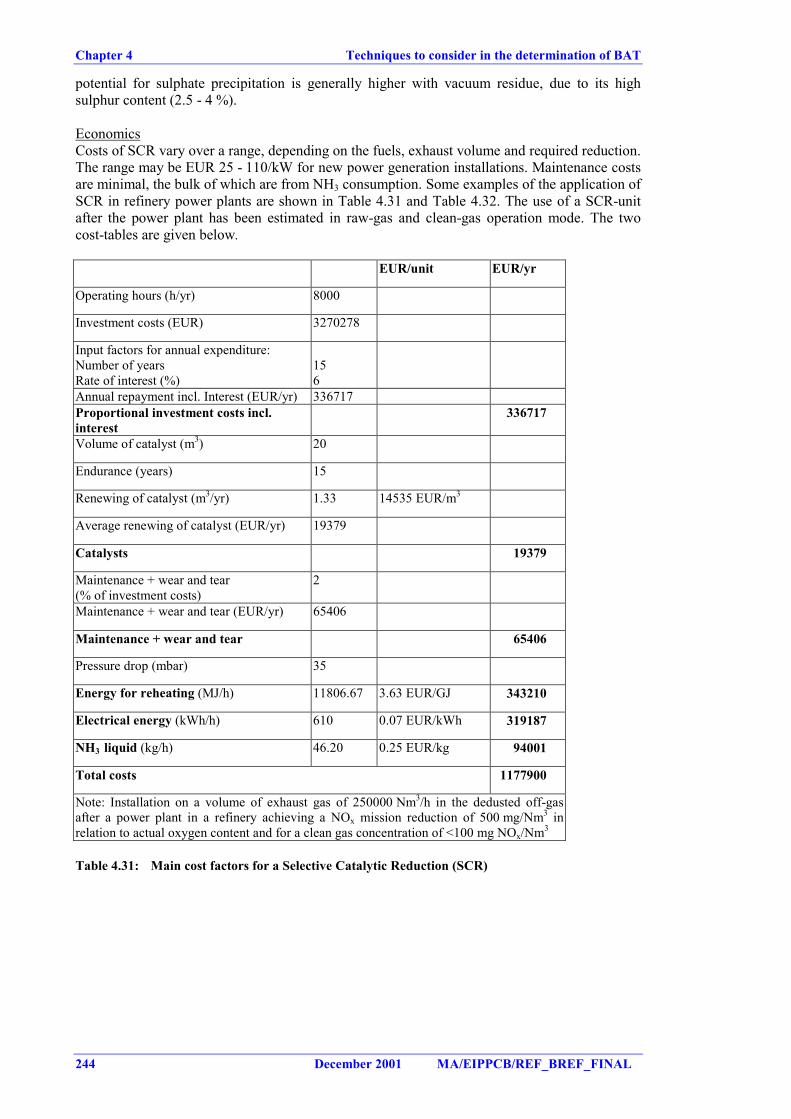
Chapter 4 Techniques to consider in the determination of BAT
244 December 2001 MA/EIPPCB/REF_BREF_FINAL
potential for sulphate precipitation is generally higher with vacuum residue, due to its highsulphur content (2.5 - 4 %).
EconomicsCosts of SCR vary over a range, depending on the fuels, exhaust volume and required reduction.The range may be EUR 25 - 110/kW for new power generation installations. Maintenance costsare minimal, the bulk of which are from NH3 consumption. Some examples of the application ofSCR in refinery power plants are shown in Table 4.31 and Table 4.32. The use of a SCR-unitafter the power plant has been estimated in raw-gas and clean-gas operation mode. The twocost-tables are given below.
EUR/unit EUR/yr
Operating hours (h/yr) 8000
Investment costs (EUR) 3270278
Input factors for annual expenditure:Number of yearsRate of interest (%)
156
Annual repayment incl. Interest (EUR/yr) 336717Proportional investment costs incl.interest
336717
Volume of catalyst (m3) 20
Endurance (years) 15
Renewing of catalyst (m3/yr) 1.33 14535 EUR/m3
Average renewing of catalyst (EUR/yr) 19379
Catalysts 19379
Maintenance + wear and tear(% of investment costs)
2
Maintenance + wear and tear (EUR/yr) 65406
Maintenance + wear and tear 65406
Pressure drop (mbar) 35
Energy for reheating (MJ/h) 11806.67 3.63 EUR/GJ 343210
Electrical energy (kWh/h) 610 0.07 EUR/kWh 319187
NH3 liquid (kg/h) 46.20 0.25 EUR/kg 94001
Total costs 1177900
Note: Installation on a volume of exhaust gas of 250000 Nm3/h in the dedusted off-gasafter a power plant in a refinery achieving a NOx mission reduction of 500 mg/Nm3 inrelation to actual oxygen content and for a clean gas concentration of <100 mg NOx/Nm3
Table 4.31: Main cost factors for a Selective Catalytic Reduction (SCR)
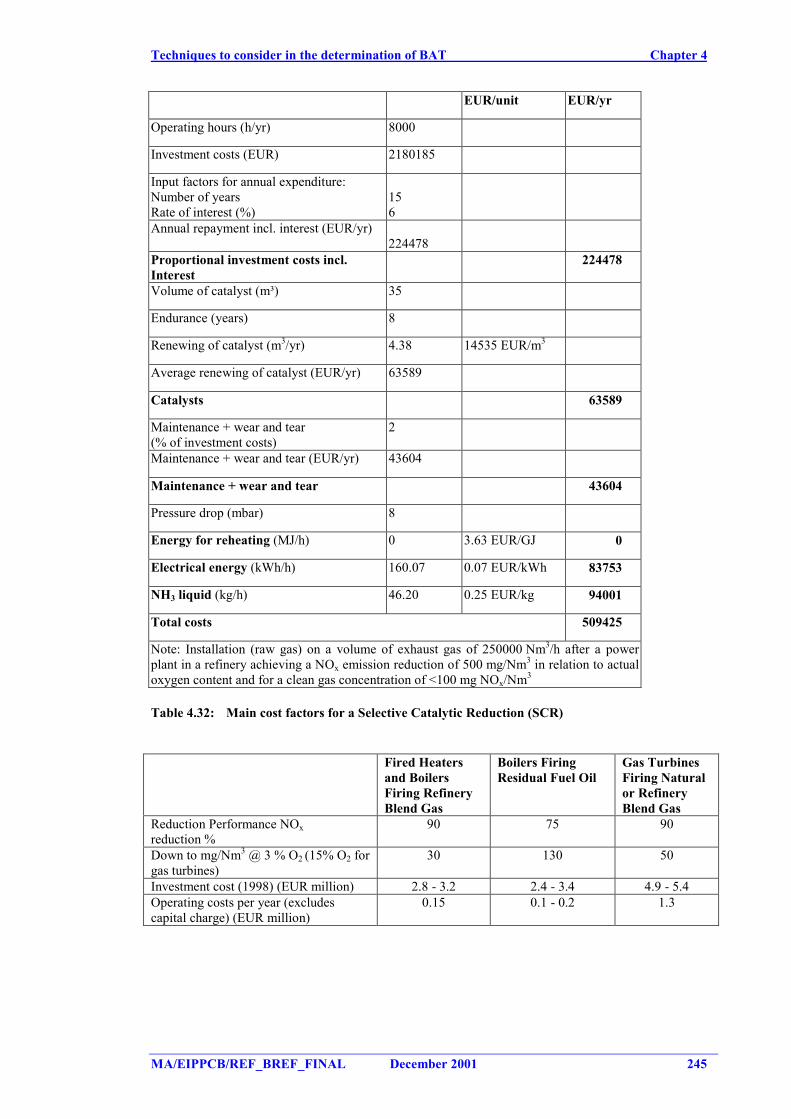
Techniques to consider in the determination of BAT Chapter 4
MA/EIPPCB/REF_BREF_FINAL December 2001 245
EUR/unit EUR/yr
Operating hours (h/yr) 8000
Investment costs (EUR) 2180185
Input factors for annual expenditure:Number of yearsRate of interest (%)
156
Annual repayment incl. interest (EUR/yr)224478
Proportional investment costs incl.Interest
224478
Volume of catalyst (m³) 35
Endurance (years) 8
Renewing of catalyst (m3/yr) 4.38 14535 EUR/m3
Average renewing of catalyst (EUR/yr) 63589
Catalysts 63589
Maintenance + wear and tear(% of investment costs)
2
Maintenance + wear and tear (EUR/yr) 43604
Maintenance + wear and tear 43604
Pressure drop (mbar) 8
Energy for reheating (MJ/h) 0 3.63 EUR/GJ 0
Electrical energy (kWh/h) 160.07 0.07 EUR/kWh 83753
NH3 liquid (kg/h) 46.20 0.25 EUR/kg 94001
Total costs 509425
Note: Installation (raw gas) on a volume of exhaust gas of 250000 Nm3/h after a powerplant in a refinery achieving a NOx emission reduction of 500 mg/Nm3 in relation to actualoxygen content and for a clean gas concentration of <100 mg NOx/Nm3
Table 4.32: Main cost factors for a Selective Catalytic Reduction (SCR)
Fired Heatersand BoilersFiring RefineryBlend Gas
Boilers FiringResidual Fuel Oil
Gas TurbinesFiring Naturalor RefineryBlend Gas
Reduction Performance NOxreduction %
90 75 90
Down to mg/Nm3 @ 3 % O2 (15% O2 forgas turbines)
30 130 50
Investment cost (1998) (EUR million) 2.8 - 3.2 2.4 - 3.4 4.9 - 5.4Operating costs per year (excludescapital charge) (EUR million)
0.15 0.1 - 0.2 1.3
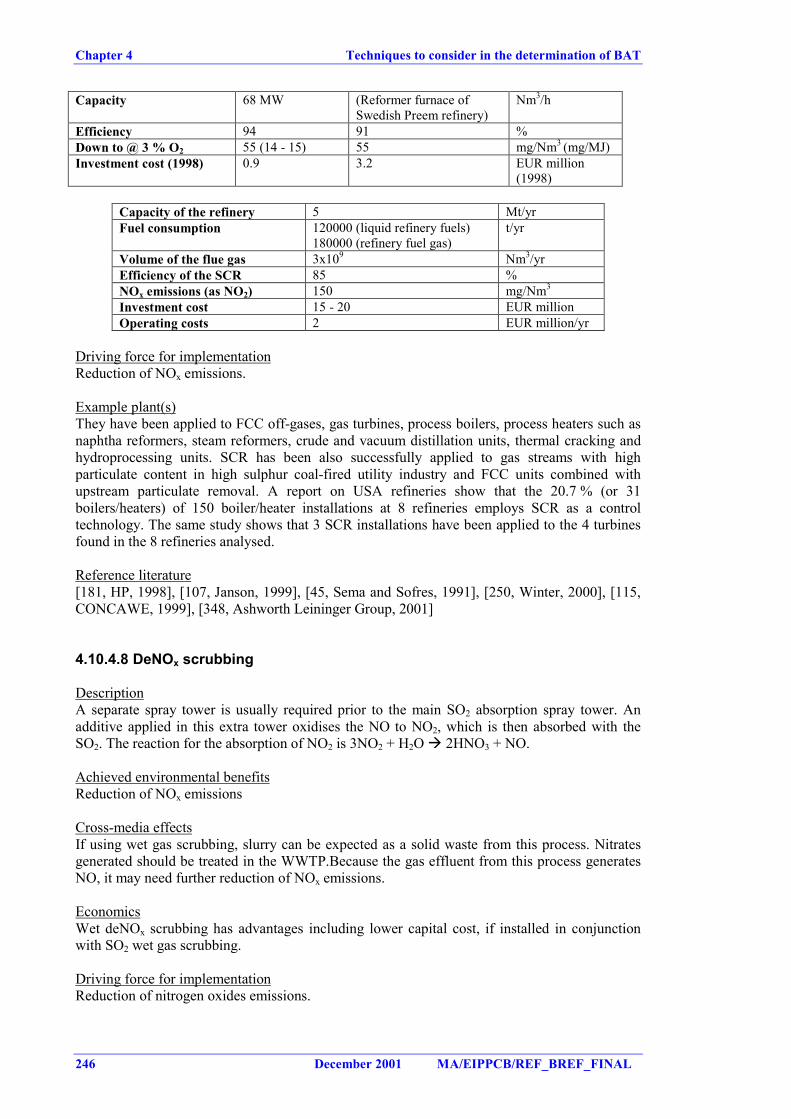
Chapter 4 Techniques to consider in the determination of BAT
246 December 2001 MA/EIPPCB/REF_BREF_FINAL
Capacity 68 MW (Reformer furnace ofSwedish Preem refinery)
Nm3/h
Efficiency 94 91 %Down to @ 3 % O2 55 (14 - 15) 55 mg/Nm3 (mg/MJ)Investment cost (1998) 0.9 3.2 EUR million
(1998)
Capacity of the refinery 5 Mt/yrFuel consumption 120000 (liquid refinery fuels)
180000 (refinery fuel gas)t/yr
Volume of the flue gas 3x10⁹ Nm3/yrEfficiency of the SCR 85 %NOx emissions (as NO2) 150 mg/Nm3
Investment cost 15 - 20 EUR millionOperating costs 2 EUR million/yr
Driving force for implementationReduction of NOx emissions.
Example plant(s)They have been applied to FCC off-gases, gas turbines, process boilers, process heaters such asnaphtha reformers, steam reformers, crude and vacuum distillation units, thermal cracking andhydroprocessing units. SCR has been also successfully applied to gas streams with highparticulate content in high sulphur coal-fired utility industry and FCC units combined withupstream particulate removal. A report on USA refineries show that the 20.7 % (or 31boilers/heaters) of 150 boiler/heater installations at 8 refineries employs SCR as a controltechnology. The same study shows that 3 SCR installations have been applied to the 4 turbinesfound in the 8 refineries analysed.
Reference literature[181, HP, 1998], [107, Janson, 1999], [45, Sema and Sofres, 1991], [250, Winter, 2000], [115,CONCAWE, 1999], [348, Ashworth Leininger Group, 2001]
4.10.4.8 DeNOx scrubbing
DescriptionA separate spray tower is usually required prior to the main SO2 absorption spray tower. Anadditive applied in this extra tower oxidises the NO to NO2, which is then absorbed with theSO2. The reaction for the absorption of NO2 is 3NO2 + H2O � 2HNO3 + NO.
Achieved environmental benefitsReduction of NOx emissions
Cross-media effectsIf using wet gas scrubbing, slurry can be expected as a solid waste from this process. Nitratesgenerated should be treated in the WWTP.Because the gas effluent from this process generatesNO, it may need further reduction of NOx emissions.
EconomicsWet deNOx scrubbing has advantages including lower capital cost, if installed in conjunctionwith SO2 wet gas scrubbing.
Driving force for implementationReduction of nitrogen oxides emissions.
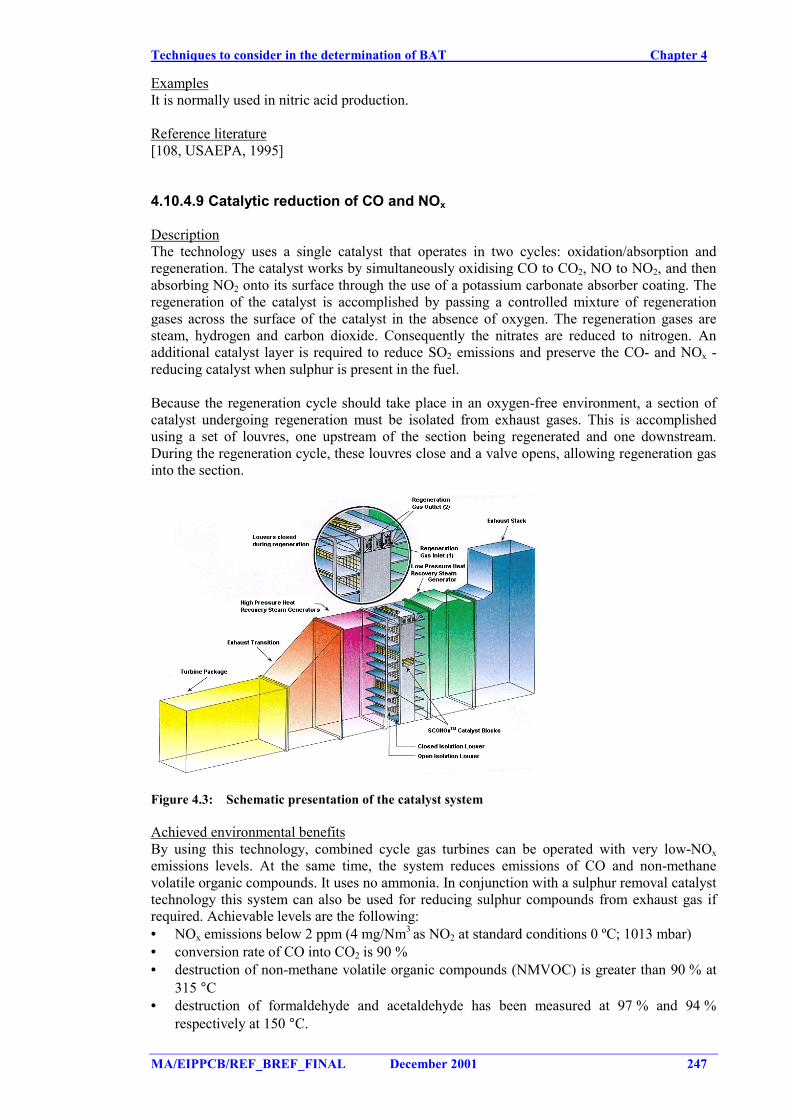
Techniques to consider in the determination of BAT Chapter 4
MA/EIPPCB/REF_BREF_FINAL December 2001 247
ExamplesIt is normally used in nitric acid production.
Reference literature[108, USAEPA, 1995]
4.10.4.9 Catalytic reduction of CO and NOx
DescriptionThe technology uses a single catalyst that operates in two cycles: oxidation/absorption andregeneration. The catalyst works by simultaneously oxidising CO to CO2, NO to NO2, and thenabsorbing NO2 onto its surface through the use of a potassium carbonate absorber coating. Theregeneration of the catalyst is accomplished by passing a controlled mixture of regenerationgases across the surface of the catalyst in the absence of oxygen. The regeneration gases aresteam, hydrogen and carbon dioxide. Consequently the nitrates are reduced to nitrogen. Anadditional catalyst layer is required to reduce SO2 emissions and preserve the CO- and NOx -reducing catalyst when sulphur is present in the fuel.
Because the regeneration cycle should take place in an oxygen-free environment, a section ofcatalyst undergoing regeneration must be isolated from exhaust gases. This is accomplishedusing a set of louvres, one upstream of the section being regenerated and one downstream.During the regeneration cycle, these louvres close and a valve opens, allowing regeneration gasinto the section.
Figure 4.3: Schematic presentation of the catalyst system
Achieved environmental benefitsBy using this technology, combined cycle gas turbines can be operated with very low-NOxemissions levels. At the same time, the system reduces emissions of CO and non-methanevolatile organic compounds. It uses no ammonia. In conjunction with a sulphur removal catalysttechnology this system can also be used for reducing sulphur compounds from exhaust gas ifrequired. Achievable levels are the following:• NOx emissions below 2 ppm (4 mg/Nm3 as NO2 at standard conditions 0 ºC; 1013 mbar)• conversion rate of CO into CO2 is 90 %• destruction of non-methane volatile organic compounds (NMVOC) is greater than 90 % at
315 °C• destruction of formaldehyde and acetaldehyde has been measured at 97 % and 94 %
respectively at 150 °C.
Chapter 4 Techniques to consider in the determination of BAT
248 December 2001 MA/EIPPCB/REF_BREF_FINAL
Cross-media effectsThe system emits CO2, H2O, N2 and trace levels of SO2 to the stack. Due to masking andpoisoning of the catalyst, annual catalyst cleaning is required with de-ionised water and apotassium carbonate solution (K2CO3). The spent cleaning fluids can be neutralised anddisposed of through the sewerage system and are harmless to the water and soil. Precious metalson the spent catalyst have residual value and can be reclaimed. There is no waste disposal issuecaused by spent catalyst.
Operational dataThis system requires electricity for control systems, valves and actuators, natural gas forregeneration gas production and steam both for regeneration gas production and as a dilutioncarrier. The typical pressure drop is between 8.5 mbar and 15 mbar. The system can operateeffectively at temperatures ranging from 150 °C to 370 °C. The utility requirements for a 25MW gas turbine are steam (333 to 389 ºC): 1590 kg/h and natural gas: 14 kg/h.
ApplicabilityApplicable to both new and retrofit applications, the system can operate effectively attemperatures ranging from 150 °C to 370 °C and does not limit gas turbine performance. Suchunit can be installed at the back of the boiler or in the Heat Recovery Steam Generator withinthe same envelope reserved for a conventional SCR system.
EconomicsThe estimated cost numbers presented refer to a typical 400 MW size combined-cycle gas-firedpower plant. The cost estimate numbers below are based on 8000 h/yr of operation and a NOxreduction from 25 ppm to 5 ppm (50 to 10 mg/Nm3 as NO2 at standard conditions 0 ºC; 1013mbar), which equals approx. 666 tonnes annually of NOx removed. Included in the numbers areinvestment cost, operation & maintenance cost and indirect annual costs.
Cost EUR million IncludingInvestment cost 19.2 Delivery, erection and commissioning/start-upOperation & Maintenancecost
1.6 General maintenanceSteam and natural gas consumption in theregeneration cyclePressure drop across the unit (approx. 10 mbars)(converted to power consumption)Average cost/year for catalyst replacement (7 yearcatalyst life for leading row)Catalyst disposal/refund
Additional indirect annual costs to the contractor are not included.
A reduction of NOx from 25 ppm to 2 ppm (50 to 4 mg/Nm3 as NO2 at standard conditions 0 ºC;1013 mbar) will contribute to an increase in the investment cost due to the need for additionalcatalyst. It will also somewhat increase the operation & maintenance cost-due to increasedconsumption of natural gas and steam and increased pressure drop.
A second example gives an installation cost of EUR 6.2 million for the application of thistechnique to a gas turbine of 25 MW. The operating costs are estimated to be approximatelyEUR 0.42 million/yr, including maintenance, steam and natural gas, pressure drop through thesystem, and the cost of catalyst replacement.
Driving force for implementationDemands for very low NOx emissions and limitations of air pollution control equipmentutilising ammonia, especially for plants situated in densely populated areas.
Example plantsThere are example applications in USA in small gas power plants.
Techniques to consider in the determination of BAT Chapter 4
MA/EIPPCB/REF_BREF_FINAL December 2001 249
Reference literature[276, Alstom Power, 2000], [268, TWG, 2001]
4.10.4.10 Combinations of NOx control and abatement techniques
The next table provides some examples of combination of NOx control and abatementtechniques that may be applicable to refineries.
ENERGY PRODUCTIONTECHNOLOGY
Fired Heaters and Boilers firingRefinery Blend Gas
Gas Turbinesfiring
RefineryBlend Gas
Gas Turbinesfiring Natural
Gas
DeNOx technologyFlue Gas
Recirculation plusLow-NOx Burner
Ultra-Low-NOxBurner plus SCR
SteamInjection plus
SCR
Dry Low-NOxCombustors
plus SCRNOx reduction performance (%) 70 90+ 98 - 99 98
Down to ppm @ 3 % O2 45 10 3 - 6 5
Investment cost (1998)(EUR million)
0.9 2.1 - 3.5 8.3 7.2
Operating costs per year(excludes capital charge)
(EUR million)
0.08 0.15 - 0.26 2.1 1.2
Cost effectivenessEUR/tonne NOx removed
(incl. capital charge @ 15%)
2000 – 4300 9100-10500
9000
9100 – 10500
9000
Other impacts Add energy forfans
Risk of NH3emissions,
catalyst disposal/regeneration,potentially
reduces heat duty
Risk of NH3emissions,
catalystdisposal/
regeneration
Energy toproduce steam,risk of NH3 and
higher COemissions,
catalystdisposal/
regeneration
Reference literature[115, CONCAWE, 1999], [268, TWG, 2001]
4.10.5 Particulate abatement techniques
Particulate loads (containing metals) from refinery combustion plant are normally fairly lowunless heavy residues are burnt. Those particulates may be abated using a number of methodsincluding electrostatic precipitators (ESP), bag filters and wet scrubbing, as already described inSection 4.23.4.
4.10.5.1 Switching to low ash content fuels
DescriptionRefinery fuel gas and hydrotreated liquid refinery fuels contain less particulate loads than heavyliquid refinery fuels. Switching to those fuels has a positive impact in the reduction ofparticulates emissions. The achieved emission particulate levels as well as cross-media effects,operational data, applicability and economics have already been described in Section 4.10.2
Chapter 4 Techniques to consider in the determination of BAT
250 December 2001 MA/EIPPCB/REF_BREF_FINAL
4.10.5.2 Steam injection
DescriptionSteam injection together with the liquid refinery fuel to lower the particulate concentration.
Achieved environmental benefitsIn the flue gas of older furnaces firing liquid refinery fuel, PM content may range from500 - 1000 mg/Nm3. For new optimal burner design with steam atomisation this can be wellbelow 200 mg/Nm3. For boilers, all these figures are on average lower. The range of 150 - 500mg/Nm3 represents the current typical range with liquid fuels employed (ash contents) andburners installed (low NOx with steam atomisation).
ApplicabilitySteam injection in fired furnaces/boilers is widely practised with liquid fuel.
Driving force for implementationReduction of particulate emissions.
Reference literature[118, VROM, 1999]
4.10.5.3 Filters
DescriptionSee Section 4.23.4.
Achieved environmental benefitsSee Section 4.23.4. PM values of less than 5 mg/Nm3 can be achieved.
Cross-media effectsPressure drop. Filter material life is limited and may add to disposal problem.
Operational dataLimited utilities (e.g. compressed air) are needed. For more information see Section 4.23.4.
ApplicabilityBag blinding can arise from "sticky" soot particles from boilers when burning fuel oil. Filtersare normally used for cleaning flue gases with flows below 50000 Nm3/h.
EconomicsInvestment cost details depend on installation. Operating costs are low, but the filters normallyneed to be changed every 1 - 2 years.
Example plantsThere are many power plants in Europe operating with bag filters.
Reference literature[250, Winter, 2000], [118, VROM, 1999]
4.10.5.4 Electrostatic precipitator (ESP)
DescriptionFor more information see Section 4.23.4.
Techniques to consider in the determination of BAT Chapter 4
MA/EIPPCB/REF_BREF_FINAL December 2001 251
Achieved environmental benefitsThey can achieve dust emissions of 5 - 50 mg/Nm3 with up to 95 % of reduction. Sootblowingis an operation that is carried out at regular intervals to remove soot that is accumulating on thefurnace equipment and hampers proper functioning. During this operation the PM content of theexhaust gas can reach values of 2000 mg/Nm3. ESPs and similar dust removal techniquesinstalled for normal operations will be effective to reduce the PM emissions to the acceptedlevel. Thus, ESPs working on process furnaces normally yield higher average concentrationsdue to that fact of sootblowing.
Cross-media effectsElectricity consumption. More information in Section 4.23.4
Operational dataESPs consume electricity. More information in Section 4.23.4
ApplicabilityESPs are widely applied in FCCs, in thermal power plants and incinerators. They can beinstalled both in new and existing plants. They require space for their application.
EconomicsTypical installed capital costs for ESPs are from 1 - 3.8 EUR million.
Driving force for implementationReduce particulates and metal emissions.
ExamplesWet ESPs are the most common type used for the abatement of particulates in heavy fuel oilcombustion processes.
Reference literature[247, UBA Austria, 1998], [45, Sema and Sofres, 1991]
4.10.6 Sulphur oxides abatement techniques
The release of sulphur dioxide is directly linked to the sulphur content of the refinery fuel gasand fuel oils used. Techniques to reduce sulphur oxide emissions are fuel optimisation(described in the 4.10.1), fuel desulphurisation (hydrotreatments described in Section 4.10.2.3)or flue gas desulphurisation. The lower the sulphur content of the fuel, the lower the emission ofsulphur dioxide. In this section, techniques for the capture of SO2 from the flue gas aftercombustion or flue gas desulphurisation techniques and the use of additives are included. Moregeneric information on those techniques is given in Section 4.23.5.4.
4.10.6.1 Additives to fuels
DescriptionUse of lime or limestone as additive to fuels to capture the sulphur oxides.
Achieved environmental benefitsThis technique would abate the SO2 release by about 90 %. Limestone 100 % in excess of thestoichiometric quantity would be required.
Cross-media effectsLimestone/ gypsum mixture has to be disposed of.
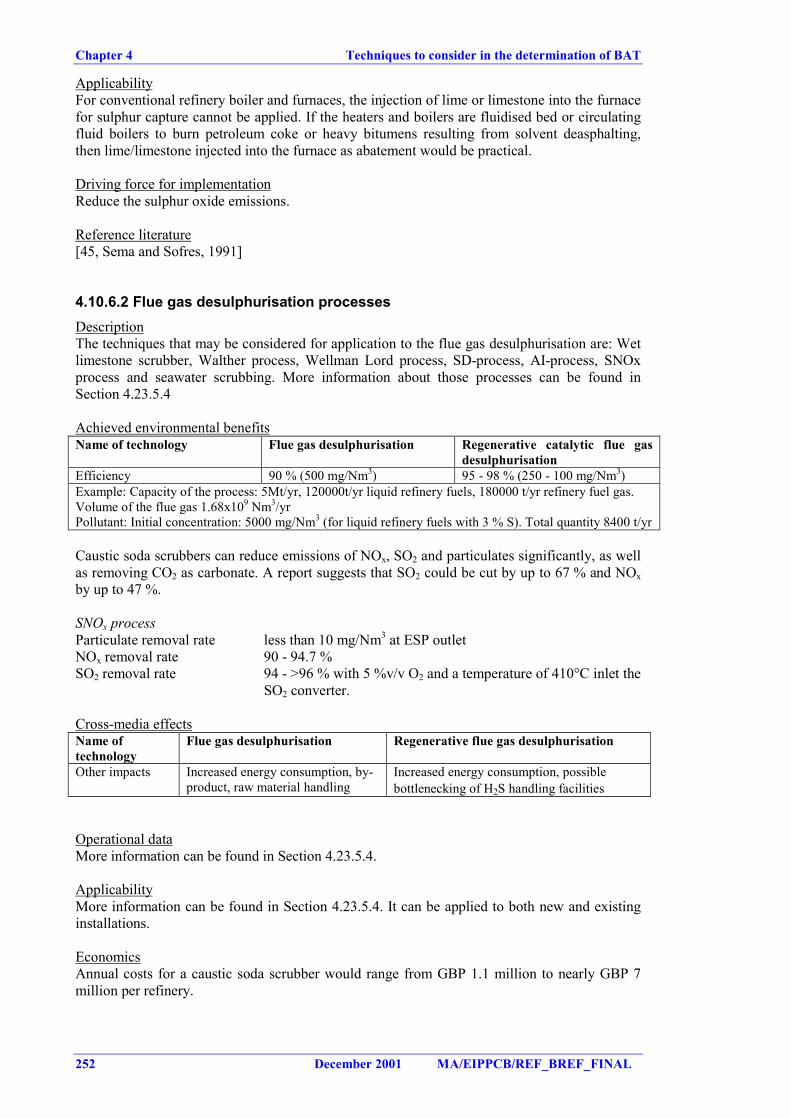
Chapter 4 Techniques to consider in the determination of BAT
252 December 2001 MA/EIPPCB/REF_BREF_FINAL
ApplicabilityFor conventional refinery boiler and furnaces, the injection of lime or limestone into the furnacefor sulphur capture cannot be applied. If the heaters and boilers are fluidised bed or circulatingfluid boilers to burn petroleum coke or heavy bitumens resulting from solvent deasphalting,then lime/limestone injected into the furnace as abatement would be practical.
Driving force for implementationReduce the sulphur oxide emissions.
Reference literature[45, Sema and Sofres, 1991]
4.10.6.2 Flue gas desulphurisation processesDescriptionThe techniques that may be considered for application to the flue gas desulphurisation are: Wetlimestone scrubber, Walther process, Wellman Lord process, SD-process, AI-process, SNOxprocess and seawater scrubbing. More information about those processes can be found inSection 4.23.5.4
Achieved environmental benefitsName of technology Flue gas desulphurisation Regenerative catalytic flue gas
desulphurisationEfficiency 90 % (500 mg/Nm3) 95 - 98 % (250 - 100 mg/Nm3)Example: Capacity of the process: 5Mt/yr, 120000t/yr liquid refinery fuels, 180000 t/yr refinery fuel gas.Volume of the flue gas 1.68x10⁹ Nm3/yrPollutant: Initial concentration: 5000 mg/Nm3 (for liquid refinery fuels with 3 % S). Total quantity 8400 t/yr
Caustic soda scrubbers can reduce emissions of NOx, SO2 and particulates significantly, as wellas removing CO2 as carbonate. A report suggests that SO2 could be cut by up to 67 % and NOxby up to 47 %.
SNOx processParticulate removal rate less than 10 mg/Nm3 at ESP outletNOx removal rate 90 - 94.7 %SO2 removal rate 94 - >96 % with 5 %v/v O2 and a temperature of 410°C inlet the
SO2 converter.
Cross-media effectsName oftechnology
Flue gas desulphurisation Regenerative flue gas desulphurisation
Other impacts Increased energy consumption, by-product, raw material handling
Increased energy consumption, possiblebottlenecking of H2S handling facilities
Operational dataMore information can be found in Section 4.23.5.4.
ApplicabilityMore information can be found in Section 4.23.5.4. It can be applied to both new and existinginstallations.
EconomicsAnnual costs for a caustic soda scrubber would range from GBP 1.1 million to nearly GBP 7million per refinery.
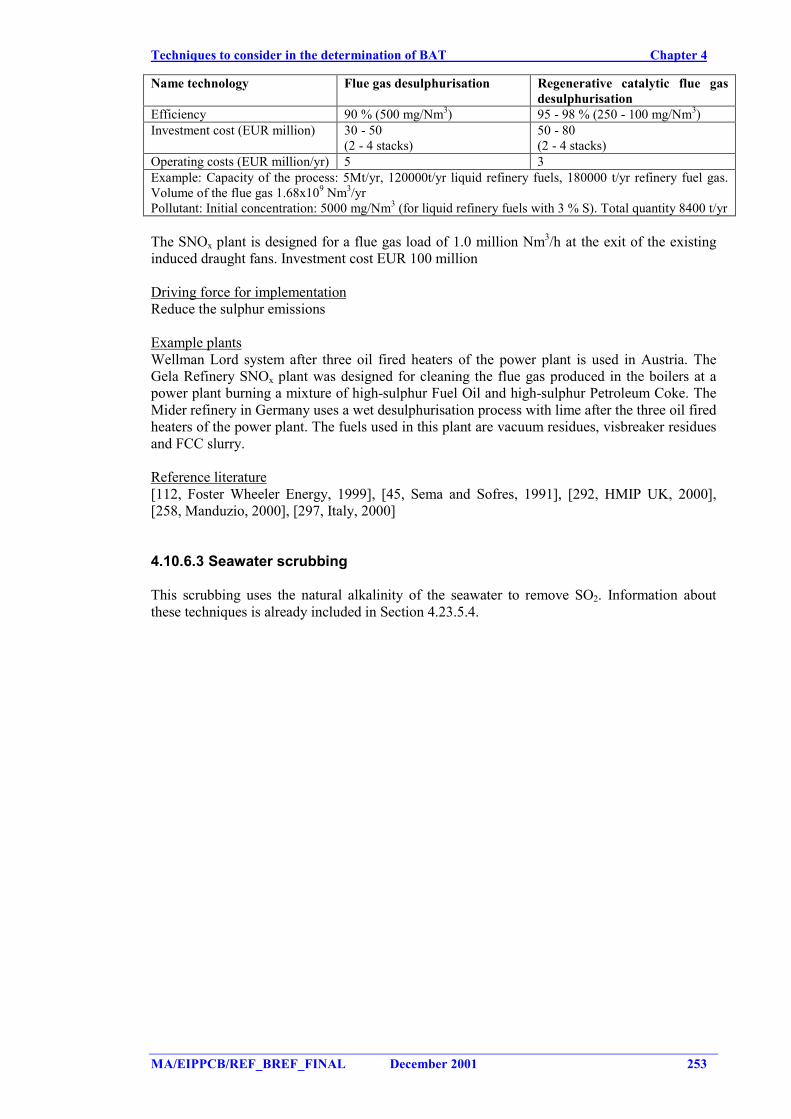
Techniques to consider in the determination of BAT Chapter 4
MA/EIPPCB/REF_BREF_FINAL December 2001 253
Name technology Flue gas desulphurisation Regenerative catalytic flue gasdesulphurisation
Efficiency 90 % (500 mg/Nm3) 95 - 98 % (250 - 100 mg/Nm3)Investment cost (EUR million) 30 - 50
(2 - 4 stacks)50 - 80(2 - 4 stacks)
Operating costs (EUR million/yr) 5 3Example: Capacity of the process: 5Mt/yr, 120000t/yr liquid refinery fuels, 180000 t/yr refinery fuel gas.Volume of the flue gas 1.68x10⁹ Nm3/yrPollutant: Initial concentration: 5000 mg/Nm3 (for liquid refinery fuels with 3 % S). Total quantity 8400 t/yr
The SNOx plant is designed for a flue gas load of 1.0 million Nm3/h at the exit of the existinginduced draught fans. Investment cost EUR 100 million
Driving force for implementationReduce the sulphur emissions
Example plantsWellman Lord system after three oil fired heaters of the power plant is used in Austria. TheGela Refinery SNOx plant was designed for cleaning the flue gas produced in the boilers at apower plant burning a mixture of high-sulphur Fuel Oil and high-sulphur Petroleum Coke. TheMider refinery in Germany uses a wet desulphurisation process with lime after the three oil firedheaters of the power plant. The fuels used in this plant are vacuum residues, visbreaker residuesand FCC slurry.
Reference literature[112, Foster Wheeler Energy, 1999], [45, Sema and Sofres, 1991], [292, HMIP UK, 2000],[258, Manduzio, 2000], [297, Italy, 2000]
4.10.6.3 Seawater scrubbing
This scrubbing uses the natural alkalinity of the seawater to remove SO2. Information aboutthese techniques is already included in Section 4.23.5.4.
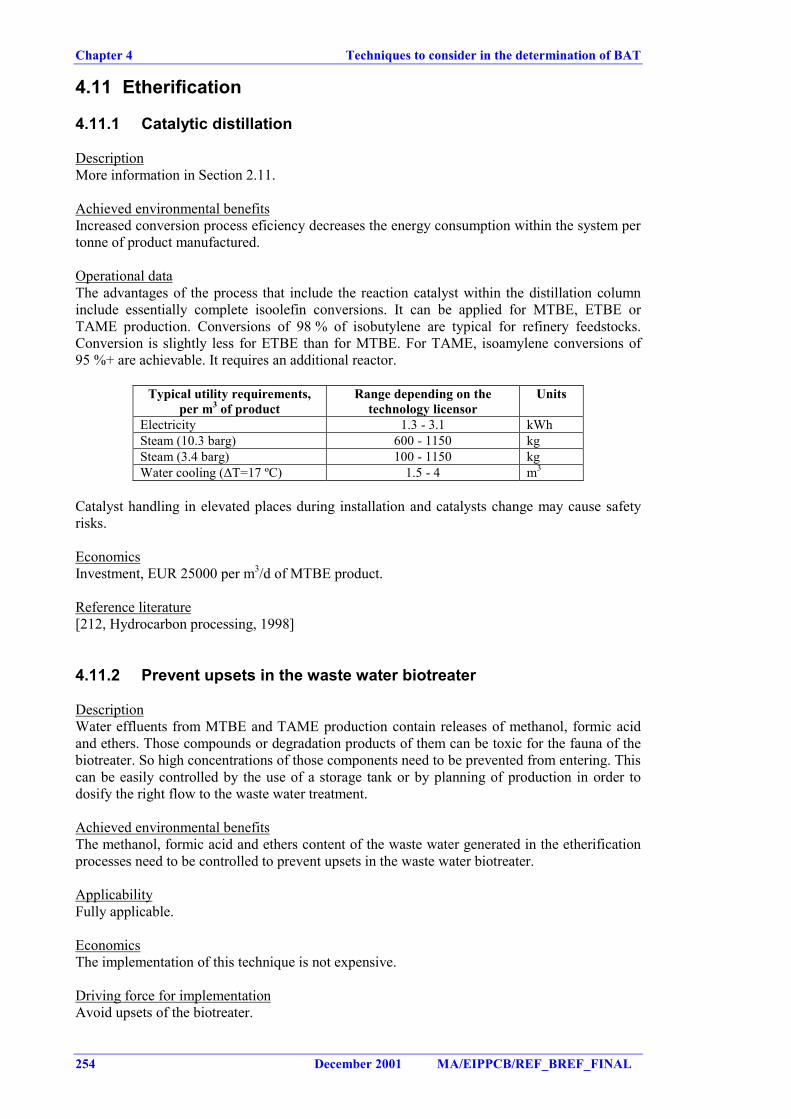
Chapter 4 Techniques to consider in the determination of BAT
254 December 2001 MA/EIPPCB/REF_BREF_FINAL
4.11 Etherification
4.11.1 Catalytic distillation
DescriptionMore information in Section 2.11.
Achieved environmental benefitsIncreased conversion process eficiency decreases the energy consumption within the system pertonne of product manufactured.
Operational dataThe advantages of the process that include the reaction catalyst within the distillation columninclude essentially complete isoolefin conversions. It can be applied for MTBE, ETBE orTAME production. Conversions of 98 % of isobutylene are typical for refinery feedstocks.Conversion is slightly less for ETBE than for MTBE. For TAME, isoamylene conversions of95 %+ are achievable. It requires an additional reactor.
Typical utility requirements,per m3 of product
Range depending on thetechnology licensor
Units
Electricity 1.3 - 3.1 kWhSteam (10.3 barg) 600 - 1150 kgSteam (3.4 barg) 100 - 1150 kgWater cooling (∆T=17 ºC) 1.5 - 4 m3
Catalyst handling in elevated places during installation and catalysts change may cause safetyrisks.
EconomicsInvestment, EUR 25000 per m3/d of MTBE product.
Reference literature[212, Hydrocarbon processing, 1998]
4.11.2 Prevent upsets in the waste water biotreater
DescriptionWater effluents from MTBE and TAME production contain releases of methanol, formic acidand ethers. Those compounds or degradation products of them can be toxic for the fauna of thebiotreater. So high concentrations of those components need to be prevented from entering. Thiscan be easily controlled by the use of a storage tank or by planning of production in order todosify the right flow to the waste water treatment.
Achieved environmental benefitsThe methanol, formic acid and ethers content of the waste water generated in the etherificationprocesses need to be controlled to prevent upsets in the waste water biotreater.
ApplicabilityFully applicable.
EconomicsThe implementation of this technique is not expensive.
Driving force for implementationAvoid upsets of the biotreater.
Techniques to consider in the determination of BAT Chapter 4
MA/EIPPCB/REF_BREF_FINAL December 2001 255
Reference literature[272, Shawcross, 2000]
4.11.3 Prevent leaking of water soluble compounds
DescriptionEthers produced in the etherification processes are very soluble in water. If they leak maycontaminate the soil, raining water and ground water. It can be seen as a part of a programmefor prevention, detection and control of the soil and groundwater (See Section 4.25.1)
Achieved environmental benefitsReduce the risk of contamination of water by ethers and alcohols used in these processes.
Driving force for implementationAvoid contamination of ground water and surface water by ethers.
Reference literature[349, Finnish Environmental Institute, 2001]
Chapter 4 Techniques to consider in the determination of BAT
256 December 2001 MA/EIPPCB/REF_BREF_FINAL
4.12 Gas separation processes
4.12.1 Increase the heat integration with upstream plants
DescriptionThe gas plant is a relatively simple process and the temperature levels are not high enough tocreate the opportunity for steam generation. No great efficiency improvements are to beexpected within a gas plant, but heat integration with upstream plants will normally make use ofe.g. reboiling heat available from upstream plant streams, saving direct heating capacity in thegas separation plant.
Achieved environmental benefitsReduced energy consumption in the gas plant and therefore in the refinery as a whole.
Cross-media effectsNo cross-media effects.
Driving force for implementationReduced energy consumption within the refinery.
Example plantsTechnique widely applied.
Reference literature[282, Conoco, 2000]
4.12.2 Improve the condensate knock-out system
DescriptionRe-sizing/improving condensate knock-out system on gas streams & on-site recycling.
Achieved environmental benefitsAppreciable waste minimisation.
ApplicabilityRelatively minor modifications.
Driving force for implementationReduction of waste generation.
Reference literature[115, CONCAWE, 1999]
4.12.3 Fugitive emissions minimisation
DescriptionGas plants process light compounds and are consequently more likely to produce fugitiveemissions. The use of double mechanical seals on pumps, compressors and agitators can reduceVOC emissions. Use of low-leaking valves also can contribute to reduce VOC emissions. Thistopic is described as an integrated measure within Section 4.23.6.1 because fugitives occur in allrefinery processes, but it is mentioned here explicitly because the light compounds used lead toa relatively high level of fugitive emissions.
Techniques to consider in the determination of BAT Chapter 4
MA/EIPPCB/REF_BREF_FINAL December 2001 257
Achieved environmental benefitsApplying those techniques, fugitive emissions such as VOC, H2S and other sulphur compoundscan be reduced considerably.
Cross-media effectsSection 4.23.6.1.
Operational dataSection 4.23.6.1.
ApplicabilitySection 4.23.6.1.
EconomicsSection 4.23.6.1.
Driving force for implementationReduction of product loss.
Example plantsProgrammes of minimisation of VOC emissions can be found in many European and non-European refineries.
Reference literatureSection 4.23.6.1.
4.12.4 Re-use of the fuel gas used in LPG production
DescriptionMolecular sieve dryers used in LPG production are regenerated using hot fuel gas.
Achieved environmental benefitsThe fuel gas can be vented to fuel gas drums to be re-used instead of being flared.
ApplicabilityEasily applicable.
Driving force for implementationReduced flaring.
Example plantsMany examples exist.
Reference literature[18, Irish EPA, 1992]
4.12.5 Prevention of emissions of LPG odorant
Storage and handling of odorants used in the LPG production is going to be covered in thehorizontal BREF on Storage. However the dosing of odorant to the LPG product need to behandled in a proper way to prevent emissions to the environment. This technique is included inthe Section 4.21.21.
Chapter 4 Techniques to consider in the determination of BAT
258 December 2001 MA/EIPPCB/REF_BREF_FINAL
4.13 Hydrogen-consuming processes
4.13.1 Hydrotreating
DescriptionSee Section 2.13. Another technique that can be used is the use of heat recovery from high-temperature process streams in WHB and power recovery in the high-pressure units (lettingdown liquid) to increase the heat integration.
Achieved environmental benefitsReduction of sulphur, nitrogen, aromatics and particulate emissions. Hydrotreatment, inaddition to removing sulphur compounds, will remove nitrogen compounds by about 15 - 40 %(Very severe hydrotreating might achieve higher percentage removals).
Cross-media effectsSee next technique in this chapter.
Operational dataSee Section 2.13.
ApplicabilityFully applicable.
EconomicsThe investment associated with the installation of a hydrotreating unit depends on the feedcharacteristics and the product specifications. Generally speaking, as the feed gets heavier or theindividual product specifications are reduced, the processing requirements are increased. Thesemore severe processing conditions can result in more pieces of equipment, larger equipment,and higher operating pressure, all of which increase the cost of the unit. The required capitalinvestment for a hydrotreating unit can vary from EUR12 to EUR48 per tonne per year ofcapacity.
Type of hydrotreater Capacity(Mt/yr)
Typical capital/installed cost1997 million EUR
Typical operatingcost million EUR
per year1.3 501.7 58
Naphtha hydrotreatment
2.2 681.1 702.2 113 20
Catalytic feed hydrotreatment(typical feeds being atmosphericresidue and vacuum gas oil) 3.2 160
1.1 90 16Vacuum residue2.2 150
Driving force for implementationReduction of sulphur and aromatic content of the feedstock.
Example plantsMany examples exist in refineries.
Reference literature[166, Meyers, 1997], [112, Foster Wheeler Energy, 1999], [212, Hydrocarbon processing, 1998]
Techniques to consider in the determination of BAT Chapter 4
MA/EIPPCB/REF_BREF_FINAL December 2001 259
4.13.2 Hydrodesulphurisation processes
DescriptionSee Section 2.13. Another technique that can be used is the use of heat recovery from high-temperature process streams in WHB and power recovery in the high-pressure units (lettingdown liquid) to increase the heat integration.
Achieved environmental benefitsReduction of sulphur content of the different fractions. Modern techniques can reduce thesulphur content of distillates to less than 10 ppm. For example, the application of one-stephydration by means of a Co/Mo catalyst (30 - 40 bar) to middle distillates reduces the sulphurcontent by more than 90 % (down to some 100 ppm) depending on the product, the S-content ofthe feed and the reaction conditions. If demand for diesel fuel increases, additional compounds(e.g. LCO from the FCC) have to be used in its production. However these feedstocks contain avariety of aromatic compounds, which have to be hydrated under severe conditions (hightemperature, high pressure, highly active catalysts, two step processes).
New diesel specifications can be met in conventional single-stage hydrotreating units bylowering Liquid Hourly Space Velocity (LHSV) from 3.7 in conventional units to 0.8 - 1.1 byimplementing a reactor in series to the existing ones and applying the latest catalyst generationavailable for gasoil hydrotreating units. Processing Russian export blend with 1.3 % w/w S andan intermediate sulphur content ahead of the final desulphurisation unit of 0.12 % S, a finalsulphur content of 8 ppm S in the raffinate can be achieved during normal operation.
Cross-media effectsEnergy consumption, waste generation, effluent water and air emissions.
Operational dataGasoil hydrotreating units need the additional measure of a high-pressure amine washer in thehydrogen recycle stream to avoid recombination of H2S from the recycle hydrogen stream withhydrocarbons from fresh feed. The unit will operate at 45 bar, utilizing 40 Nm³ Hydrogen/t ofgasoil feed and anticipating a run length of 30 months.
ApplicabilityApplicable to distillates from naphtha to heavy residues.
EconomicsThe estimated erected cost for a reduced-crude desulphurisation process (basis 132 m3/h unit)unit is EUR 47 millions. Another estimated investment summary for residue desulphurisationsystem hydrotreater to prepare residue fluid catalytic cracking feed is shown below.
Feed Rate, Mt/yr 3.8Run length, days 335Operating factor 0.92On-plot investment, million EUR 272Total off-plot cost(30 % of on-plot), million EUR 82Catalyst cost per charge, million EUR 10Basis: second quarter 1995 US Gulf Coast
Driving force for implementationReduce sulphur content of the feedstock. Deep desulphurisation is an important techniqueapplied for compliance with Auto-Oil Programme II. Costly two-stage hydrotreating unitsapplying a noble metal catalyst in the second stage of hydrodesulphurisation are not needed tomeet Auto-Oil Programme II or German diesel specifications. But, depending on the finalspecification on cetane of diesel issued by the European parliament, two-stage units maybecome mandatory for refiners being short in cetane index in their diesel pool. Normally those
Chapter 4 Techniques to consider in the determination of BAT
260 December 2001 MA/EIPPCB/REF_BREF_FINAL
refiners do not operate a hydrocracker unit. Two-stage units are also mandatory for refiners whoneed to lower the aromatics content and/or the CFPP in their gasoil pool.
Example plantsMany desulphurisation processes exist in refineries.
Reference literature[166, Meyers, 1997].
4.13.3 Catalytic distillation
DescriptionCatalytic distillation for desulphurisation of gasoline in a two stage process.
Achieved environmental benefitsReduction of 95 % of sulphur content in FCC-gasoline containing 1800 ppm of sulphur havebeen achieved. This type of technique consumes less energy than traditional desulphurisationprocesses.
Cross-media effectsEnergy consumption, waste generation, effluent water and air emissions.
ApplicabilityFully applicable. This technique may also be used for the reduction of benzene in the reformate.
EconomicsA two-stage process is designed to treat 7950 m3/d of FCC-gasoline containing 1800 ppm ofsulphur. Its efficiency has been of 95 % and its investment costs are approximately EUR 20millions.
Driving force for implementationSince the sulphur content of gasoline will be reduced to 50 ppm by law, techniques for thereduction of sulphur content will become more used.
Example plantsAt least one catalytic distillation plant for desulphurisation of 7950 m3/d of FCC-gasoline isavailable in Europe.
Reference literature[247, UBA Austria, 1998]
4.13.4 On-stream catalyst replacement technology for processing high-metal feeds
DescriptionWhile the main objective of this process is to extend catalyst life in a down-stream fixed-bedreactor by maintaining high hydrodemetallisation performance, the catalyst also achieves highhydrodesulphurisation/hydrodemetallisation and hydrodesulphurisation Conradson carbonremoval/hydrodemetallisation activity ratios.
Achieved environmental benefitsOn-stream catalyst replacement technology improves the residual desulphurisation in therefinery, thereby decreasing the waste generation.
Techniques to consider in the determination of BAT Chapter 4
MA/EIPPCB/REF_BREF_FINAL December 2001 261
Operational dataReactor typically operates at 390 ºC and 2000 psia.
ApplicabilityFully applicable.
Driving force for implementationExtend the catalyst life of the hydrotreatment processes.
Example plantsTill 1997, there were 15 on-stream worldwide.
Reference literature[166, Meyers, 1997]
4.13.5 Hydrogenation of light dienes
DescriptionThe hydrogenation of light dienes serves the purpose of producing a more stable refinery streamreducing upstream, gum formation. The process converts dienes to useful olefins. Moreinformation in Section 2.13.
Achieved environmental benefitsThe process helps reduce acid losses in downstream processes (e.g. alkylation). Typical productdiene levels from the selective hydrogenation process unit may range from 25 to 1 ppm.
Cross-media effectsLow energy consumption.
Operational dataLow temperature, liquid-phase operation means that no utilities are required in most cases if thefeed and hydrogen are both available at suitable conditions. Heating or cooling duties arelimited to cases with relatively high diene concentrations in the feed. Commercial operation fora period of more than two years without the need to regenerate or replace the catalyst is typical.
ApplicabilityThe design of the units is simple. Most of the units are designed for diene reduction to less than5 ppm in the product.
EconomicsThe design of the units is simple and requires low capital and nominal operating costs. The costof the catalyst is low compared with the installation cost. The capital investment, includingcatalyst, for the unit is small, usually within the range of EUR 0.6 - 1.2 million. The investmentbase on recent projects is of some EUR 3 millions for a plant of 100000 t/yr capacity.
Driving force for implementationReduce gum formation in downstream operations. The flexibility and minimal cost of thistechnology make the unit a valuable processing tool.
Reference literature[166, Meyers, 1997], [261, Canales, 2000]
Chapter 4 Techniques to consider in the determination of BAT
262 December 2001 MA/EIPPCB/REF_BREF_FINAL
4.13.6 Hydrocracker
DescriptionHydrocracking is an exothermic process and heat integration techniques can be applied. Formore information on hydrocrackers see Section 2.13. Some techniques to consider are:a) The heat generated in the reactors can be partially recovered in a feed/product heat
exchanger. A furnace heats the feed to its required temperature. The reactor temperature iscontrolled via the injection of cold hydrogen between the catalyst beds.
b) A significant amount of heat is required in the fractionation section. Heat integration isapplied to minimise heat consumption.
c) The energy efficiency can further be increased by applying a four-stage separator system.The feed to the fractionation section is in that case rendered significantly hotter, andconsequently less heat is required in the fractionation section.
d) The use of heat recovery from high-temperature process streams in WHB and powerrecovery in the high-pressure units (letting down liquid)
Achieved environmental benefitsReduced hydrocracker energy consumption.
Cross-media effectsNo cross-media effects known.
Operational dataControl system need to be enhanced.
ApplicabilityIn some cases, the heat integration can be difficult to apply. Replacement of existinghydrocrackers by new and highly heat integrated hydrocrakers is in many cases not justifiedenvironmentally and economically.
EconomicsThe cost of a hydrocracker with heat integration varies from 36 - 84 EUR/(t/yr). Annualoperating cost varies between 0.6 and 1 % of the investment cost. In many cases the economicsof the process do not justify the replacement of an existing hydrocracker, because paybackperiod can be very long.
Driving force for implementationReduction of energy consumption.
Reference literature[166, Meyers, 1997], [212, Hydrocarbon processing, 1998], [112, Foster Wheeler Energy,1999], [268, TWG, 2001]
4.13.7 Residue hydroprocessing
DescriptionSee Section 2.13. Another technique that can be used is the use of heat recovery from high-temperature process streams in WHB and power recovery in the high-pressure units (lettingdown liquid) to increase the heat integration.
Achieved environmental benefitsUpgrading of fuel oil in lighter products, and reduction of sulphur, nitrogen and metal contentsin the fuel oil and other products.
Techniques to consider in the determination of BAT Chapter 4
MA/EIPPCB/REF_BREF_FINAL December 2001 263
Cross-media effectsCross-media effects are increased energy consumption and a consequent increase in CO2emissions, due mainly to the hydrogen. As discussed in Section 3.14, the production ofhydrogen is very energy-intensive, generating large quantities of CO2. As discussed in Section4.13, hydrotreatment processes generate catalyst for disposal and increase H2S production withdirect consequences (enlargement or new) for the sour water stripper and sulphur recovery units.Other cross-media effects are the increase of waste generation (catalysts) and effluent wastewater (containing H2S).
Operational dataHydroconversion is an exothermic reaction, the heat generated in the reactor system beingpartially recovered in the feed product exchanger. Normally a high level of heat integration andheat recovery is applied in the fractionation section. The amount of hydrogen required dependson feed (heavier feeds tend to increase hydrogen consumption) and process objectives (lowersulphur, nitrogen, aromatics content in the products, higher hydrogen consumption). In mostcases extra energy is required.
ApplicabilityCommercial experiences range from low-sulphur atmospheric residues to high-metal, high-sulphur vacuum residues with over 300 ppm metals.
EconomicsInvestment costs for the various options depend strongly on the feed properties and processobjectives of the residue hydroprocessing unit. Investment costs for a typical new single string5000 t/day unit will range from 200 - 300 million US$, the higher figure including an integratedhydrocracker.
Driving force for implementationResidue hydroprocessing is used for the upgrading of fuel oil into lighter products.
Example plant(s)Many different concepts of residue hydroconversion processes are licensed. The selection of thetype of process depends on feedstock quality (metal content and Concarbon number) and therequired conversion and product quality.
Reference literature[115, CONCAWE, 1999], [212, Hydrocarbon processing, 1998]
Chapter 4 Techniques to consider in the determination of BAT
264 December 2001 MA/EIPPCB/REF_BREF_FINAL
4.14 Hydrogen production
As mentioned in Section 2.14, the production of hydrogen it is not exclusive to the refinerysector. Therefore this chapter should also be seen as applicable to other industrial sectors wherehydrogen production is necessary (e.g. ammonia production, chemical industry etc).
4.14.1 Gas Heated Steam Reformer Technology
Description• Gas Heated Steam reforming replaces the reformer furnace: the reforming heatload is
provided by cooling the exit gas from a secondary reformer which uses oxygen. The feedconsists of natural gas or light naphtha.
• The steam reformer has to supply a large amount of heat at high temperature for the steamreforming reaction by burning fuel, with the result that a large amount of heat is lost in theflue gas. In order to minimise the amount of heat lost in the stack, a large heat recoverysystem is used. A large proportion of the recovered heat is by raising and superheatingsteam. Some heat integration is possible around the solvent absorber and the methanator.
Achieved environmental benefits• Gas heated steam reforming reduces the energy consumption of the reforming process.• Recovery of heat from flue gas can be used elsewhere in the refinery, reducing consumption
elsewhere.
Cross-media effectsThe environmental regulations with the most impact on plant design are typically NOxlimitations. Other impacts, such as SOx or water emissions, are minimal, because low-sulphurfuel is typically used and there are few emissions other than flue gas. The choice of heatrecovery system can have a major effect on NOx production, since both the amount of fuel firedand the flame temperature will be affected. Preheating combustion air will reduce firing, butsince NOx formation is strongly influenced by flame temperature, there will be an overallincrease in NOx formation. Other methods of reducing firing, such as pre-reforming or heatexchange reforming, do not affect the flame temperature and will therefore reduce NOxproduction. The production of CO2 is also important. Each tonne of H2 produced also producesa minimum of 12 tonnes of CO2 (7.5 tonnes if related to the steam generation).
Operational dataThe combination of high temperature and pressure imposes severe demands on the steamreformer tubes, which must have thick walls to withstand the stresses and must be fabricatedfrom expensive alloys. The furnace box must be large to obtain the high rates of heat transferfrom the fluegas to the tubes. These combined factors make the steam reformer the largest andmost expensive single item of equipment in a hydrogen plant. The large size of the unit meansthat it takes a long time to heat up and cool down, and this makes it the most time-consumingpart of the start-up and shutdown procedure. The large thermal inertia makes it liable to damageduring plant upsets.
ApplicabilityFully applicable.
EconomicsRelative hydrogen production costs of the two processes are primarily a function of feedstockcost. A new hydrogen plant for a 7950 m3/day FCCU feed hydrotreater or hydrocraker wouldtypically cost in range of EUR 60 - 75 millions (1997).
Driving force for implementationProduction process. Hydrogen is needed for the hydrotreatments in the refinery.
Techniques to consider in the determination of BAT Chapter 4
MA/EIPPCB/REF_BREF_FINAL December 2001 265
Example plantsA new alternative, already proved commercially for ammonia and methanol production, is theGas Heated Steam Reformer Technology.
Reference literature[112, Foster Wheeler Energy, 1999]
4.14.2 Coke and heavy oils gasification
DescriptionThe IGCC plant can also function as a hydrogen supplier, in which case hydrogen is removedfrom the syngas (after the sulphur removal). For more information see Section 2.14, 2.10 and4.10.3.5.
Achieved environmental benefitsCoke gasificationA fixed-bed desulphurisation system using regenerable zinc ferrite as the sorbent has beentested as a continuation of the gasification exhaust gases treatment. Sulphur levels of 10 - 20ppm in the treated gas were achieved in this system. The product gas also contains traces ofammonia (less than 5 %) and hydrogen cyanide (HCN), derivatives of the nitrogen in the feed.Using limestone in the gasifier tends to reduce the level of these components. Ammonia is notremoved by zinc ferrite in the external desulphurisation process. If there is any alkali in the feed,some of it may vaporise in the gasifier and may have to be removed by an alkali sorbent or bycooling the gas going to the filter. The particulates in product gas are removed in the barrierfilter to a level of less than 5 ppm.Heavy oil gasificationAnother environmental benefit of gasification is that it reduces heavy oils that, used in anotherway may pollute the environment much more. See also 4.10.3.5.
Cross-media effectsPartial oxidation requires an oxygen plant (95 - 99 % purity), which increases costs.
Operational dataNormally, an IGCC plant includes a water purification section with the following units:• soot recovery either by washing with naphtha and recycle of naphtha/soot mixture to
gasification section and/or by filtration.• water pretreatment to remove solids (carbon, metals, salts) by filtration before final
treatment in biological plant (GTW)
The grey water treatment (GWT) is designed to treat water blowdown from a carbon extractionunit with syngas condensate and possibly the amine regeneration overhead system; water fromgrey water treatment is finally sent to biological treatment. The GWT may employ physical andchemical treatment for cyanides destruction and removal of heavy metals followed by a sourwater stripper, which removes sulphides, ammonia, and carbon dioxide from the water.
The gaseous streams are totally washed to remove any contaminant and the process normallyincludes the following ancillary units for gas purification:• washing with water and sometimes oil to remove soot and particulate• reactor for COS or cyanides by hydrolysis• sour gas absorbing with amine or equivalent system and production of elemental sulphur
from H2S in Claus unit.
ApplicabilityRelative hydrogen production costs are primarily a function of feedstock cost. The mainproblem with investment in gasification plant is its capital and operating cost. To be attractivecommercially it usually needs to be undertaken on a large scale. Typical requirement for

Chapter 4 Techniques to consider in the determination of BAT
266 December 2001 MA/EIPPCB/REF_BREF_FINAL
chemicals production are the generation of more than 200 MWe of electrical power throughIGCC or the use of hydrogen, carbon monoxide and steam on a large scale.
EconomicsGenerally accepted investment costs for an oil gasification based combined cycle plant in the200+ MWe range are 1300 - 1700EUR per kW installed, with a thermal efficiency of around40 % and close to 99 % sulphur emission abatement. As average electrical demand in a refineryis usually less than 80 MWe, the investment in IGCC often depends on the opportunity to exportthe surplus of electrical power generated. However high pressure steam can also be a valuablegasification product and there are examples of much smaller gasification units that fit in wellwith a refinery.
Relative hydrogen production costs of the process are primarily a function of feedstock cost.Steam reforming of methane usually produces hydrogen at lower costs than partial oxidation offuel oil, if the cost of methane is less than about 65 % of fuel oil cost on an energy basis.
Driving force for implementationProduction of hydrogen, reduction of the production of heavy oils, power export and productionof synthesis gas as feed for petrochemistry.
Example plantsAt least five gasification processes are currently running in European refineries.
Reference literature[166, Meyers, 1997], [297, Italy, 2000]
4.14.3 Purification of hydrogen
DescriptionInformation about the processes can be found in Section 2.14. Some techniques that may beapplied to the hydrogen purification units to achieve better environmental performance are:• several adsorber beds are used, and the gas flow is periodically switched from one vessel to
another to allow regeneration of the adsorbent by pressure reduction and purging, thusreleasing the adsorbed components. The desorbed gas is normally accumulated in a vesseland used as fuel at a convenient location
• one technique to reduce air emissions is to use PSA systems only for purification ofhydrogen
• use the PSA purge gas as refinery fuel gas in the reforming furnace instead of higher C/Hratio fuels.
Achieved environmental benefitsRe-use of waste fuel gas as fuel within the process.
Cross-media effectsBecause of loss of hydrogen to the PSA tail gas, the reformer and front end of a PSA plant arelarger than in a wet scrubbing plant. However, a PSA plant uses less process steam and does notrequire heat for the reboiler. PSA is a high energy consumer due to the high vacuum/pressuresystems that it uses.
Operational dataThe PSA system is completely automatic and offers a higher purity product. The PSA unit issimpler to operate than a wet scrubbing system, since it has no rotating equipment or circulatingsolutions. The conventional process produces a hydrogen product of maximum 97 - 98 % v/vpurity, while the pressure swing adsorption process produces a very pure hydrogen productbetween 99.9 % v/v and 99.999 % v/v. The residual constituents of the product gas are mainlymethane and less than 10 ppm CO. Some data on the utility consumption of the PSA system are:
Techniques to consider in the determination of BAT Chapter 4
MA/EIPPCB/REF_BREF_FINAL December 2001 267
3700 Nm3/h with a H2 content of at least 85 % and a pressure between 37 and 47 bar. Product-stream: 2400 Nm3/h purified H2 with a concentration of at least 99.5 %, Temperature: 45°C,Pressure: 35 bar; waste gas: 1300 Nm3/h, P: 3 bar, T: 30°C, contains 60 % H2, 1.4 %H2S and40 % C1 - C6 compounds with higher boiling points.
Driving force for implementationProduction process to purify the hydrogen. The choice between the PSA system and thescrubbing system depends on product purity required, reliability and process economics. Theextra investment for the PSA system for large plant capacities can normally be offset by thelower operating cost. Also a PSA system will yield a higher H2 purity.
Example plantsMany examples exist.
Reference literature[166, Meyers, 1997], [297, Italy, 2000], [211, Ecker, 1999]
Chapter 4 Techniques to consider in the determination of BAT
268 December 2001 MA/EIPPCB/REF_BREF_FINAL
4.15 Integrated refinery management
This section structured in the same way as Chapter 2 and 3, contains those integrated refinerymanagement activities that are not included in other sections. The first techniques to considerare environmental management activities and other utility management techniques.
4.15.1 Environmental management tools
DescriptionAn environmental management system (EMS) can contain the following elements:• the implementation and adherence to international accepted system such as those from the
ISO 14000 series or to EMAS. Those systems ensure the continuous improvements,complaints handling training, performance reporting, process control and improvementplanning etc.
• proof can be enhance by e.g. internal and/or external auditing, certification.• EMS does not stand in isolation from the other systems (safety, maintenance, finance etc.)
but is to be integrated with the other systems where relevant and beneficial. Morespecifically the management systems for Energy and Environment can be combined, whichis in line with the fact that a reduction in energy consumption goes hand in hand withimprovement of environmental performance.
• the preparation and publication of an annual environmental performance report, to beexternally verified. Such a report will also enable the dissemination of improvements toothers, and will be a vehicle for information exchange (to neighbouring environments, toauthorities etc).
• The delivery to stakeholders on an annual basis of an environmental performanceimprovement plan. Continuous improvement is assured by such a plan.
• It is common practice in the quest for continuous improvement to compare ownperformance with that of others in the field, and to identify the current “best practices”.Taking these “best practices” from others to heart and applying them will lead toenvironmental performance improvements. Systems are available for comparing ownperformance with others for energy, for efficiency, for maintenance, in which performancesof refineries with different capacities and complexity are normalized. (e.g quivalentDistilling Capacity). This technique of performance measurement, comparisons with othersand identification of “best practices” and the adoption in one’s own workplace is also called“benchmarking”. This technique has scope for application in a number of areas ofenvironmental performance improvements as well.
• practise of such benchmarking on a continuous basis, including energy efficiency andenergy conservation activities, emissions to air (SO2, NOx, VOC, and particulates),discharges to water and generation of waste. Benchmarking for energy efficiency typicallyinvolve an internal system of energy efficiency improvements, or intra- and inter-companyenergy efficiency benchmarking exercises, aiming for continuous improvements andlearning lessons.
• perform an Environmental Impact Assessment (EIA) for major new activities.� mass balance data on sulphur input and output via emissions and products (including low-
grade and off-spec products and further use and fate), to be reported on an annual basis.
Achieved environmental benefitsThose systems typically ensure the continuous improvements, complaints handling training,performance reporting, process control and improvement planning.
ApplicabilityThose techniques can be typically applied to all refineries
Example plantsMany of those techniques are applied in many refineries
Techniques to consider in the determination of BAT Chapter 4
MA/EIPPCB/REF_BREF_FINAL December 2001 269
Reference literature[118, VROM, 1999], [285, Demuynck, 1999]
4.15.2 The bubble concept
DescriptionThe bubble concept usually refers to air emissions of SO2, but can also be applied to NOx, dust,CO and metals (Ni, V). The bubble concept is a regulatory tool applied in several EU countries.As represented in the picture below, the bubble approach for emissions to air reflects a “virtualsingle stack” for the whole refinery. The treatment of process water in the refinery is typicallydone in a single waste water treatment plant (for technical and economical reasons) andconceptually can be regarded as a similar approach to the “bubble concept”4 for air.
Figure 4.4: The bubble concept
Why is it applied to refineries?The bubble concept is used for refineries because it is recognised that they meet some or all oftheir energy needs with a variety of gaseous and liquid fuels that are by-products of the variousprocesses. In this respect, refineries differ from other industries that generally buy all theirspecified fuels from outside.
The technical justification of the bubble concept in refineries is the complexity of theinstallation. Aspects of this complexity include the number of emission points and the technicaland economic interrelationships in a modern refinery between feedstock, types of processes andthe variations in different operating conditions in relation to product slate and product qualityrequirements.
The economic justification is that the refinery should be allowed to use, at different plants and atdifferent times, the various fuels it produces in-house. At the same time, it enables the operatorto:
4 The requirements on a refinery to reduce its discharges to water can be also conceived as a bubble approach.
Water from various process units is collected into one water treatment system. The load in g/tonne crude oilprocessed in the refinery can be defined in terms of a “bubble”, aimed at the minimisation of water consumption,re-use of water in different processes and BAT at the waste water treatment unit in an integrated way and for allprocesses together with the objective to reach as low a load as is technically and economically feasible for thewhole refinery.
Chapter 4 Techniques to consider in the determination of BAT
270 December 2001 MA/EIPPCB/REF_BREF_FINAL
� choose the most cost-effective place to reduce emissions� respond to opportunities in the crude oil market and the supply & demand situation for oil
products� operate effectively in a competitive environment.
The environmental justification is that the authority should be allowed to define emissionconditions in line with its environmental targets while allowing the refinery operator flexibilityin the operation of its processing units and in the selection of the various technical andeconomic options to fulfil the energy requirements of the refinery in competitive marketconditions. Moreover, it allows easy comparison of the emission performance of a refinery andbetween refineries.
Definition and applicabilityFor the application of the bubble concept, the associated emission levels need to be given in atransparent way. This includes:1. the pollutants involved2. the approach used to define the bubble (concentration bubble and load bubble). (See below)3. a comprehensive list of installations included in the bubble concept (see below)4. the corresponding flue gas volumes and their measurement conditions (e.g. under standard
conditions, dry)5. reference data (oxygen content and averaging time (daily, monthly, yearly, 3-yearly)) (see
below)
Follows explanations of the above points:
1. Self-explanatory (See Description in this Section)
2. Different approaches (point 2 above) can be used to define the bubble, i.e:� in a concentration units of the flue gas emitted by the refinery, whereby the complexity
of the refinery is reflected in the energy consumption of the refinery, or� in a annual load per tonne of crude oil processed which can be combined with the
complexity factor (Nelson index) of the refinery
The load bubble includes energy efficiency of a refinery and the concentration approachdoes not. This is the major advantage of the load bubble. There are simplified factors (SeeTable 3.2) for switching between the two approaches. It should be notised that such a factorcalculated on an average European energy consumption value could, however, bemisleading because energy efficiencies in European refineries vary greatly (SeeSection 3.10.1). The conversion between the two approaches in each specific refinery ismore accurate.
Other methods may be used. It is more a question of convenience and custom than ofprinciple how and in which units of measurement the bubble is defined, as long as it is clearwhich approach is used, which methodology is used to define the unit of measurement andwhich units are included.
3. There are different interpretations in various countries of the units to be considered (e.g.combustion only, including or excluding FCC and/or SRU and/or flares). As an example, aMember State has reported that for an existing EU+ refinery the bubble concentrationincreases by 20% when flares are included in the bubble. Another example was given byConcawe were the calculated average of the SO2 fuel bubble was 1000 whereas the averagewas 1600 if all installations are included within the bubble.
4. Self-explanatory
5. When the short averaging time is defined (e.g. daily, monthly), additional flexibility foroutages, changes of feedstock and other technical problems may be granted by allowing the
Techniques to consider in the determination of BAT Chapter 4
MA/EIPPCB/REF_BREF_FINAL December 2001 271
high values in the current period to be corrected by lower values in the next period, whenthe technical problems have been sorted out. The mass bubble limit (g/tonne crude oilprocessed) is typically defined over a long period (e.g. one year). In one EU+ refinery, aperiod of three years is applied. Also, it has been recognised by the TWG that the averagingtime may depend on the pollutant. (e.g. environmental and health effects of NOx and SOxare different). The averaging period is also related to the stringency of the bubble emissionlevel (the more stringent the levels, the longer the averaging period, to allow flexibility).
The above paragraphs imply that a large amount of data is needed to continuously calculatethe bubble value. For example, for SO2:� RFG sulphur contents need to be continually measured (e.g. by mass spectrometer) and
hourly values produced; SO2 is then calculated by recording hourly fuel flows tofurnaces and boilers.
� Fuel oil S content is measured daily.� FCCU figures are estimated based on a percentage of the S feed to the unit (the daily
flow of feed to the unit; the S content is measured after any change of crude slate). Thisneeds months of data collection to establish a relationship.
� SRUs, calciners etc all have different algorithms to estimate releases continously basedon data collection.
� Data are also needed to continuously estimate moisture and O2 content in the flue gasesto correct to the reference conditions.
The last paragraph indicates the scope for considerable variability in the way refinerscalculate the bubble and thus in the accuracy and reliability of the data when comparingbubble values. However when a good sample schedule is establish together with anapproved calculation method, the follow up of the emissions become very easy.
Environmental concernsAs in some situations refineries are physically or logistically connected to a nearby chemicalplant, there may be a temptation to extend the bubble to the “non-refinery” processes which thenmay create misuse of the bubble concept because of dilution effects. These dilution effects canoccur due to the high volumes of flue gases generated by some non-refinery processes thattypically contain low levels of SO2 and NOx. An example of such dilution was submitted by aMember State where a refinery bubble profits from a large chemical plant and the bubbleconcentration is reduced by 50% (included in the LVOC BREF). Dilution effects do not affectthe load approach.
A second concern may be that the concentration bubble is defined as a relative standard, directlyrelated to the fuel use in the refinery, and therefore not enhancing efficient use of energy in therefinery. This can be addressed by defining the bubble according to a load per tonne of crude oilprocessed or by defining an absolute ceiling (in tonnes/year), in addition to emission values inmg/Nm3 flue gas in the bubble. However, there is a possible trade-off between the stringency ofthe environmental requirements and the need for flexibility in the operation of a refinery.Special care should be taken not to introduce additional complexity into the regulatory system,thereby losing part of the attractiveness of the bubble concept. For example, in a MS a 3-yearaverage is chosen for the SO2 bubble (load) for the refinery. In the case of NOx, however, thedifferences in long-term environmental and health effects of SO2 and NOx need to be borne inmind.
Another possible environmental concern with this concept, is the possibility of high emissionsat the lower stacks (e.g. SRU). This can easily be redressed by requiring that the flue gases ofthe cleaner fuels be discharged at the lower stacks and the high stacks are used to avoid highconcentrations of pollutants at ground level, affecting workers and the neighbourhood. Ofcourse, the regulator should be aware that traditional measures used to ensure that ground levelconcentrations of hazardous pollutants are within Air Quality Standards are still required whenusing the bubble concept. This comment can be extended to all legislation, because the use of
Chapter 4 Techniques to consider in the determination of BAT
272 December 2001 MA/EIPPCB/REF_BREF_FINAL
the bubble concept as a regulatory tool does not prevent other existing/new limit values forspecific units/facilities within the refinery for being applied.
Establishing associated emission values in the bubble conceptIf the bubble concept is to be used as an instrument to enforce the application of BAT in therefinery, then the emission values defined in the refinery bubble should be such that they indeedreflect BAT performance for the refinery as a whole. The most important notion is then to:� identify the total fuel use of the refinery;� assess the contribution of each of the fuels to the total fuel consumption of the refinery;� quantify the emissions from process units implicated in such emissions (e.g. FCC, SRU);� review the applicability of BAT to each of these fuels and/or the process units� combine this information with the technical and economical constraints in using these
techniques.
This may imply different emission values associated with the use of BAT, depending on thetype of fuels used and their contribution to the total refinery fuel use, together with emissions ofprocess units such as the FCC and the SRU and their contribution to the total refinery emissions.
Associated emission values in the case of a gas-fired refinery will be inherently lower than theemissions in a situation where a major part of the fuel use of the refinery is provided by liquidfuels. In this latter case BAT may be defined by assessing the emissions associated with thegaseous fuels used in combination with the emissions associated with using liquid residual fuelsand flue gas treatment, or using clean liquid fuels, i.e. gas oil with limited S-content. If deemednecessary, these emission values for a bubble based on concentrations can easily be translatedinto a yearly or monthly load bubble, i.e. tonne of SO2 and/or NOx per million tonnes of crudeoil processed.
In Annex V, several examples show how, emission values for the bubble concept can be definedwhich reflect the SO2 and NOx performance that is technically feasible for the refinery as awhole. The assessment of BAT-associated emission values involves however also an economicand an environmental assessment of these values. The investment decision to convert anexisting refinery into a full conversion, gas-fired refinery involves much more technical,economic and environmental considerations than only the SO2 and NOx emissions from therefinery itself. Similarly, the decision to invest in flue gas desulphurisation and/or NOxabatement via SCR may also involve the concentration of liquid fuel firing of the refinery in oneor two larger combustion plants, which will have major implications on the way the refinerywill be able to respond to commercial pressures. The same holds true for the other technicaloptions that a refinery will be faced with. However, maximum flexibility will be high on theagenda in assessing the various technical considerations open to the refinery. By definingemission values in the bubble that respect this need for operational flexibility, the permittingauthority can support the proper environmental outcome of the investment decision process bythe refinery
The bubble concept is an environmental regulatory instrument that may be used to enforce theapplication of BAT in the refinery without becoming entangled in the complex technical-economic interrelationships in the refinery. As mentioned before, there is a link to the BATconcept provided that the bubble is set at a level that reflects BAT performance of the refineryas a whole.
ExamplesTWG has provided some reference numbers when bubble concept is applied to refineries. Datahas been divided in two groups. One group represents actual performance of refineries and thesecond one represents proposals provided by different TWG member(s).
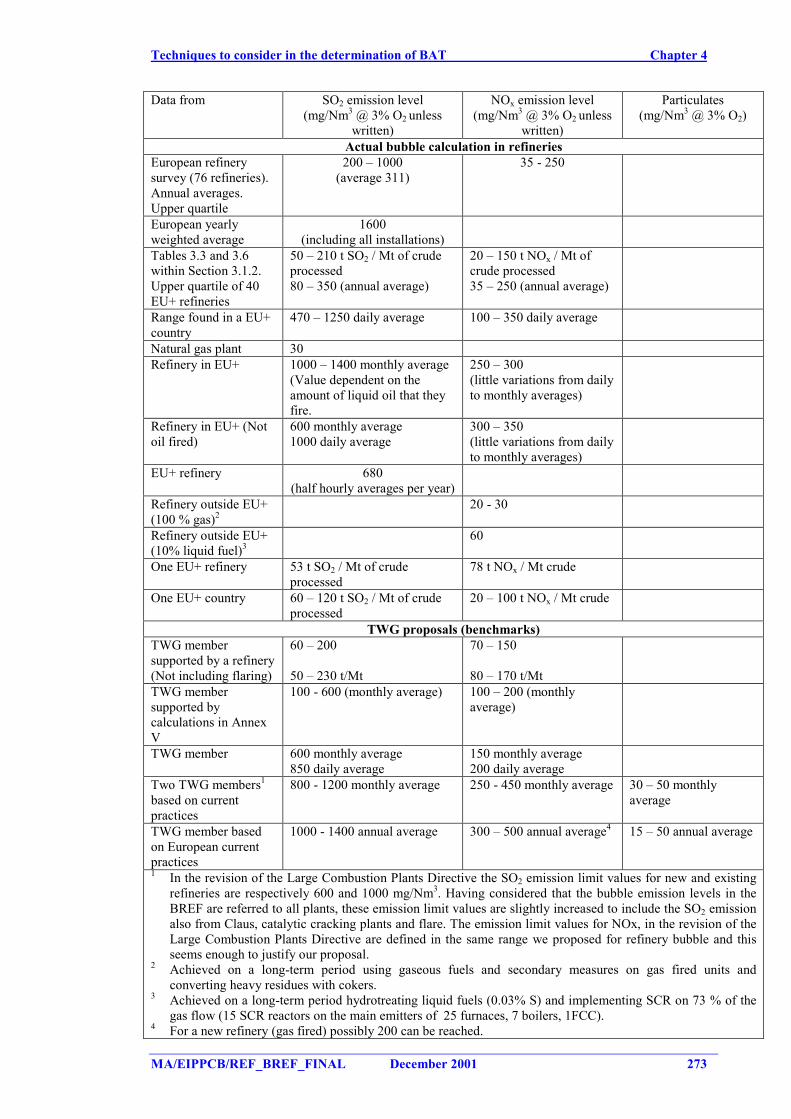
Techniques to consider in the determination of BAT Chapter 4
MA/EIPPCB/REF_BREF_FINAL December 2001 273
Data from SO2 emission level(mg/Nm3 @ 3% O2 unless
written)
NOx emission level(mg/Nm3 @ 3% O2 unless
written)
Particulates(mg/Nm3 @ 3% O2)
Actual bubble calculation in refineriesEuropean refinerysurvey (76 refineries).Annual averages.Upper quartile
200 – 1000(average 311)
35 - 250
European yearlyweighted average
1600(including all installations)
Tables 3.3 and 3.6within Section 3.1.2.Upper quartile of 40EU+ refineries
50 – 210 t SO2 / Mt of crudeprocessed80 – 350 (annual average)
20 – 150 t NOx / Mt ofcrude processed35 – 250 (annual average)
Range found in a EU+country
470 – 1250 daily average 100 – 350 daily average
Natural gas plant 30Refinery in EU+ 1000 – 1400 monthly average
(Value dependent on theamount of liquid oil that theyfire.
250 – 300(little variations from dailyto monthly averages)
Refinery in EU+ (Notoil fired)
600 monthly average1000 daily average
300 – 350(little variations from dailyto monthly averages)
EU+ refinery 680(half hourly averages per year)
Refinery outside EU+(100 % gas)2
20 - 30
Refinery outside EU+(10% liquid fuel)3
60
One EU+ refinery 53 t SO2 / Mt of crudeprocessed
78 t NOx / Mt crude
One EU+ country 60 – 120 t SO2 / Mt of crudeprocessed
20 – 100 t NOx / Mt crude
TWG proposals (benchmarks)TWG membersupported by a refinery(Not including flaring)
60 – 200
50 – 230 t/Mt
70 – 150
80 – 170 t/MtTWG membersupported bycalculations in AnnexV
100 - 600 (monthly average) 100 – 200 (monthlyaverage)
TWG member 600 monthly average850 daily average
150 monthly average200 daily average
Two TWG members1
based on currentpractices
800 - 1200 monthly average 250 - 450 monthly average 30 – 50 monthlyaverage
TWG member basedon European currentpractices
1000 - 1400 annual average 300 – 500 annual average4 15 – 50 annual average
1 In the revision of the Large Combustion Plants Directive the SO2 emission limit values for new and existingrefineries are respectively 600 and 1000 mg/Nm3. Having considered that the bubble emission levels in theBREF are referred to all plants, these emission limit values are slightly increased to include the SO2 emissionalso from Claus, catalytic cracking plants and flare. The emission limit values for NOx, in the revision of theLarge Combustion Plants Directive are defined in the same range we proposed for refinery bubble and thisseems enough to justify our proposal.
2 Achieved on a long-term period using gaseous fuels and secondary measures on gas fired units andconverting heavy residues with cokers.
3 Achieved on a long-term period hydrotreating liquid fuels (0.03% S) and implementing SCR on 73 % of thegas flow (15 SCR reactors on the main emitters of 25 furnaces, 7 boilers, 1FCC).
4 For a new refinery (gas fired) possibly 200 can be reached.
Chapter 4 Techniques to consider in the determination of BAT
274 December 2001 MA/EIPPCB/REF_BREF_FINAL
Data on legislation applying bubble concept in some countries are provided in Annex I.
Reference literatureAustria, Belgium, Concawe, France, Greece, Italy, Netherlands, Norway, Spain, Sweden, UK,[248, Ademe, 2001]
4.15.3 Good housekeeping
DescriptionThis section includes good practices applied to maintenance, cleaning and other horizontalissues within refineries. What was considered “good housekeeping” in the past may nowadaysseem self-evident, as it is embedded in day-to-day refinery practice. New measures, based onexperience gained, are however included over time. “Good housekeeping” is often used in thebroader context of good management and conduct of the business. Quite a number of businessperformance parameters, such as safety, maintenance, efficiency (of energy and manpower),product quality, information, unit/equipment reliability, human resources and finance requireapproaches that start with a concept of “good housekeeping”. For refineries, safety providesnumerous examples of this approach, often grouped under the heading Safety Management.Similarly, Product Quality Management stands for a well-developed approach to assurecustomer satisfaction and Maintenance Management for improved unit reliability/on-streamtime and maintenance effectiveness. There are also systems for the other business parameters.All these systems are in place to assure that the correct practices are adopted, and that the“lessons learned” are reflected in these systems (e.g. ISO 9000 series).
The more traditional aspects of good housekeeping are included in this section. These systemscan also be regarded as the tools to ensure that the right procedures are adhered to in order tosafeguard the proper functioning of the refinery hardware. The following techniques areconsidered to be good environmental practices within the industrial sectors.
• Planning and carrying-out of maintenance by:� all plant and equipment should be subject to regular preventive maintenance
programmes, in line with operational requirements, to ensure continued optimumperformance.
� prompt clean-up of minor spillages with adsorbents.
• Regular cleaning of equipment and refinery premises. Cleaning, by its nature, generateswaste. By choosing the right procedure and technique this waste may be minimised or itsnature altered so as to make it more easily disposable:� drain equipment to the maximum� recycle "spent" rinse water� use high pressure water cleaning rather than detergents or chemicals� use on-site pretreatment whenever possible, e.g. wash/steam filter material (e.g. filter
clays) prior to dumping� minimise tank sludge prior to cleaning (solvent & mixers)� during cleaning, vents and vessel steaming to be directed to flare. This technique may
raise serious safety issues if oxygen is present. In addition when Hg is present –particularly when steaming overhead coolers- mercury emissions may occur.
� in many refineries, using high-pressure water to clean heat exchanger bundlesgenerates and releases water and entrained solids to the refinery waste water treatmentsystem. Exchanger solids may then attract oil as they move through the sewer systemand may produce finer solids and stabilized emulsions that are more difficult toremove. Solids can be removed at the heat exchanger cleaning pad by installingconcrete overflow weirs around the surface drains or by covering drains with a screen.Other ways to reduce solids generation are by using anti-foulants on the heatexchanger bundles to prevent scaling and by cleaning with reusable cleaningchemicals that also allow for the easy removal of oil
Techniques to consider in the determination of BAT Chapter 4
MA/EIPPCB/REF_BREF_FINAL December 2001 275
� cleaning at designated places in order to have control over run-off material andcontaminted water
� prompt clean-up of minor spillages with adsorbents.� install weirs at cleaning places, in order to hold back solids, which otherwise might
attract oil in CPI separators� minimise and re-use cleaning chemicals.
• Use techniques in common industrial equipment (pumps, compressors, etc.) that can reducethe environmental impact as for example:� implementation of operational improvements in new designs� equipment reliability improvement� use lubrication technique based on the lubrication by an oil mist The technique
consists of a vortex generator, which generates, with the help of dry pressurised air, amixture of air and lubricant oil, This mixture is called oil mist, and lubricates thedynamic equipment. Once lubricated the air is recirculated to the vortex.
Some techniques that may be considered as good housekeeping techniques are already includedin other sections. Those include for example:• application of advanced process control (see Section 4.15.5) that can include the on-line
continuous (equipment and process) performance measurement, the measurement ofperformance and comparison with targets
• prevention of soil contamination (see Section 4.25.1)• leak detection and repair (LDAR) (see Section 4.23.6)• minimisation and prevention of spillage of hydrocarbons (see Section 4.23.6)• minimisation of waste generation (included in each of the process sections).
Achieved environmental benefitsThe lubricant technique can reduce the use and subsequent waste of lubricant oil up to 75% andreduce the electrical consumption within the electrical motors.
Operational dataThese systems are dynamic; they are kept alive by the incorporation of continuous improvementopportunities.
ApplicabilityThe lubricant technique can be applied to lubrication of dynamic equipment with lubricatedbearings, e.g. centrifuge pumps, electrical engines, gears assemblies, intermediate supports.
EconomicsLess than two years pay-off is claimed by the technology provider in the lubricant technique.
Example plantsThe lubricant technique has been already used by the main petrochemical companies
Reference literature[118, VROM, 1999], [285, Demuynck, 1999], [19, Irish EPA, 1993], [316, TWG, 2000], [324,Sicelub, 2001]
4.15.4 Training
Staff training plays an important role in the prevention of contamination within the refinery.Some important aspects are:
Chapter 4 Techniques to consider in the determination of BAT
276 December 2001 MA/EIPPCB/REF_BREF_FINAL
• include environmental concern and environmental issues in the training of the refinery staff• train staff to reduce solids in sewers. A facility training programme which emphasizes the
importance of keeping solids out of the sewerage systems will help reduce that portion ofwaste water treatment plant sludge arising from the everyday activities of refinery staff
• train staff to prevent soil contamination. Contaminated soil can be reduced by educatingstaff on how to avoid leaks and spills.
Reference literature[118, VROM, 1999], [256, Lameranta, 2000]
4.15.5 Production planning and control
DescriptionSome techniques to consider in this respect are:• pollution control equipment should, in general, be kept running during start-up and
shutdown, for as long as is necessary to ensure compliance of authorisations, provided noother safety or operating considerations prevent it
• reduce the start-ups and shutdowns to a minimum. Proper production planning can reducethe frequency and duration of process shutdown
• implemention of advanced process control for the planning and control of production• advanced process control to optimise energy use within the refinery (related to 4.10.1.2).
Reference literature[118, VROM, 1999]
4.15.6 Safety management
Safety is an important cross effect of environmental measures. Any direct relation of influenceexists. Measures may affect safety in a:� positive way. Closed loop sampling minimizes accidental releases of material� no way. The process water recycle to desalters has no relevant impact on safety� negative way. Gas recovery systems often have to deal with explosive atmospheres, where
the untreated offgases are outside the explosibility limits. Negative impacts on plant safetycan reach such an extend, that the additional dangers exceed what a plant is willing tohandle. Even by others reasons promising techniques may lose applicability by that criterion– at least, until significant improvements of the safety properties of such techniques aredeveloped.
Some techniques to consider are the following:• prepare a safety report and practise risk management• use of results obtained from risk analyses
� identified risks are assessed with reference to the acceptance criteria for risk in theactivities in order to identify the dimension of accidental events
� dimensioning accidental events form the basis for a systematic selection of thetechnical, operational and/or organizational risk-reducing measures to be implemented.Risk-reducing measures consist of probability-reducing and consequence-reducingmeasures, including contingency measures
� the effect of the risk reducing measures to be implemented is documented, assessedboth individually and in a wider perspective
� implementation of the risk reducing measures and of the basic assumptions made in therisk analysis is systematically followed up in order to ensure that safety in the activitiesis maintained within the defined acceptance criteria for risk
� results from of risk analyses are communicated to the employees and shall be usedactively in preventive safety efforts.
Techniques to consider in the determination of BAT Chapter 4
MA/EIPPCB/REF_BREF_FINAL December 2001 277
Reference literature[118, VROM, 1999], [285, Demuynck, 1999], [302, UBA Germany, 2000], [260, Sandgrind,2000]
4.15.7 Water management
4.15.7.1 Water stream integration
Studies for the optimisation of water, effluent and drainage are often relevant. Similar to theidentification of energy saving opportunities, water pinch studies can be carried out to identifyprocess water integration options and water reduction and re-use opportunities. In mostrefineries some internal water streams are already used as desalter wash water, such ascondensate water and steam-stripped sour water. There is scope for increased water reductionand re-use in refineries, which will lead to reduced size and costs of both water make up andend-of-pipe treatment facilities.
Purpose and principleThe purpose of water stream integration (WSI) is the reduction of process water produced forfinal treatment prior to discharge in order to save operation costs. It saves high quality potableand demineralised water, which can be expensive at some locations; it reduces the size,investment costs and running costs of water supply and effluent treatment facilities. Moreover,it reduces the size and the environmental impact of effluent discharges.
The principle of WSI is maximising prevention, reduction, recycling and re-use of processwater, rainwater, cooling water and sometimes contaminated ground water with the aim ofminimising the amount of process water for end-of-pipe treatment. WSI need to be carried outas part of a Water Masterplan for the refinery. This plan aims at optimisation of the use and re-use of all water streams in the refinery. For greenfield refineries and in existing refineries, whennew treatment installations are installed, a win-win situation is created when the amount ofimported water, the size of effluent treatment facilities and the discharge are all minimised.Ideally it may become feasible to use treated effluent as a source for make-up of process water,cooling water and/or boiler feed water. Every refinery has its specific optimum WSI scheme.
Reduction of fresh water use is a goal for most refineries for two main reasons. Firstly, freshwater, particularly high quality water, is a valuable resource which in many parts of Europe isbecoming increasingly scarce. Where water of lower quality is used, treatment to acceptablestandards also requires the use of energy and chemicals. Secondly, water used has to bedischarged. Minimising the volume of water discharged reduces the size of effluent treatmentplant required, the amount of energy and chemicals used, and the quantity of pollutantsdischarged to the environment. Data on actual fresh water usage is included in Section 3.15. Asa general guide, approximately 0.1 - 5 m3 of waste water (process waste water, cooling waterand sanitary waste water) per tonne of crude is generated when cooling water is recycled. Theprocess water generated in a refinery is of the magnitude of 0.1 to 0.2 m3 per tonne of crude oilinput. Some techniques to consider for the minimisation of fresh water consumption, can be thefollowing:
• by substitution of wet cooling processes by dry processes• recirculation of cooling water• use of treated process water as cooling water• use of condensates as process water• use of rainwater as process water• other measures are: Use of production techniques which allow recovery and re-use of
rawmaterials, process- and product aids (e.g. use of regenerable extraction agents,desulphurisation by hydrotreatment). Use of process- and product aids with low hazardouspotential and substitution of hazardous chemicals by less hazardous ones.
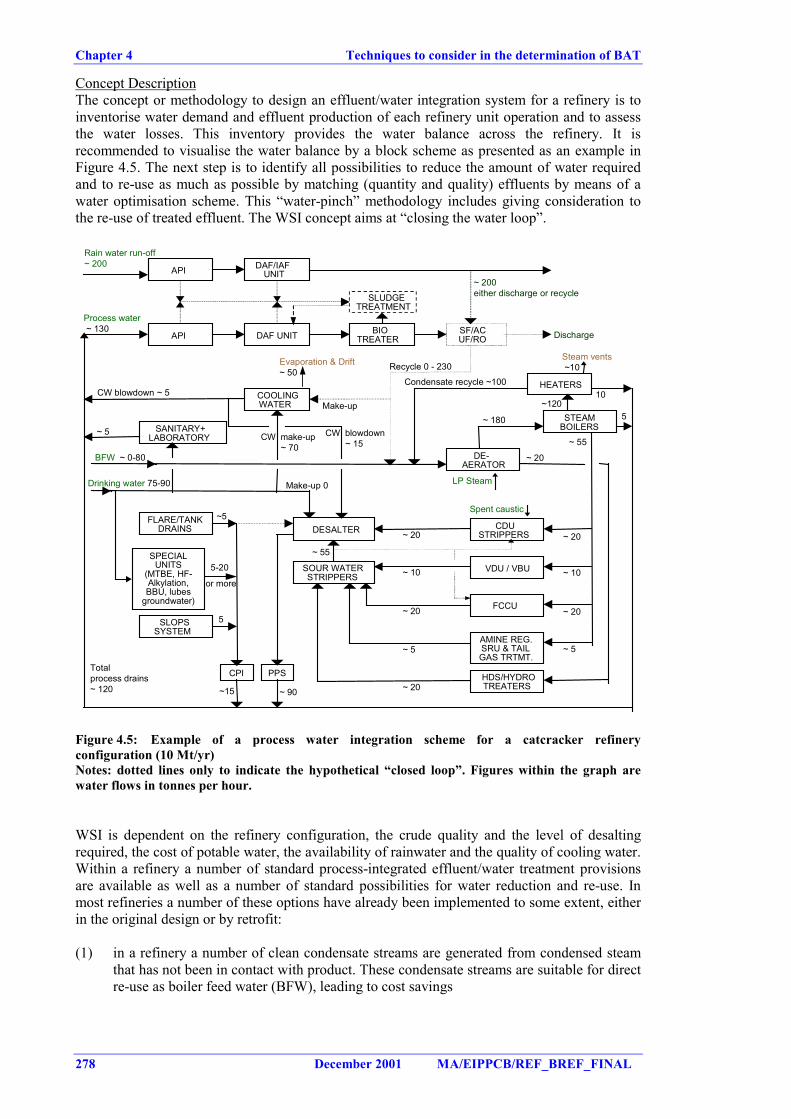
Chapter 4 Techniques to consider in the determination of BAT
278 December 2001 MA/EIPPCB/REF_BREF_FINAL
Concept DescriptionThe concept or methodology to design an effluent/water integration system for a refinery is toinventorise water demand and effluent production of each refinery unit operation and to assessthe water losses. This inventory provides the water balance across the refinery. It isrecommended to visualise the water balance by a block scheme as presented as an example inFigure 4.5. The next step is to identify all possibilities to reduce the amount of water requiredand to re-use as much as possible by matching (quantity and quality) effluents by means of awater optimisation scheme. This “water-pinch” methodology includes giving consideration tothe re-use of treated effluent. The WSI concept aims at “closing the water loop”.
Rain water run-off~ 200
~ 200either discharge or recycle
Process water ~ 130
Discharge
Recycle 0 - 230 Steam vents ~10
Condensate recycle ~100 CW blowdown ~ 5 10
~120 5
~ 5 ~ 55
BFW ~ 0-80 ~ 20
CW make-up ~ 70
Drinking water 75-90
Spent caustic
~ 20
~ 55
~ 10
~ 20 5
~ 5
Totalprocess drains~ 120 ~15
DESALTER
SOUR WATERSTRIPPERS
CDUSTRIPPERS
VDU / VBU
FCCU
AMINE REG.SRU & TAILGAS TRTMT.
HDS/HYDROTREATERS
FLARE/TANKDRAINS
SPECIALUNITS
(MTBE, HF-Alkylation,BBU, lubes
groundwater)
DE-AERATOR
STEAMBOILERS
HEATERS
API DAF/IAFUNIT
BIOTREATER
SF/ACUF/ROAPI DAF UNIT
COOLINGWATER
SANITARY+LABORATORY
SLUDGETREATMENT
SLOPSSYSTEM
PPS CPI
CW blowdown ~ 15
Make-up
Evaporation & Drift~ 50
~ 180
LP Steam
~5
~ 20
5-20
or more~ 10
~ 20
~ 5
~ 20 ~ 90
Make-up 0
Figure 4.5: Example of a process water integration scheme for a catcracker refineryconfiguration (10 Mt/yr)Notes: dotted lines only to indicate the hypothetical “closed loop”. Figures within the graph arewater flows in tonnes per hour.
WSI is dependent on the refinery configuration, the crude quality and the level of desaltingrequired, the cost of potable water, the availability of rainwater and the quality of cooling water.Within a refinery a number of standard process-integrated effluent/water treatment provisionsare available as well as a number of standard possibilities for water reduction and re-use. Inmost refineries a number of these options have already been implemented to some extent, eitherin the original design or by retrofit:
(1) in a refinery a number of clean condensate streams are generated from condensed steamthat has not been in contact with product. These condensate streams are suitable for directre-use as boiler feed water (BFW), leading to cost savings
Techniques to consider in the determination of BAT Chapter 4
MA/EIPPCB/REF_BREF_FINAL December 2001 279
(2) the standard provisions for process water treatment are the sour water stripper (SWS, totreat the sour water produced in various process units) and the desalter, which is a majorwater consuming unit whereas the water quality requirement in the desalter does notconstrain the use of SWS effluents. Sour water is produced if wash water and/or steamcomes into contact with hydrocarbon products which contain H2S and NH3. In the SWSthe H2S and NH3 are largely eliminated. This renders a treated effluent into a suitablequality wash water for the desalter
(3) the re-use of stripped sour water as wash water for crude desalting is a first step in anyWSI. A crude desalter uses 5 - 10 % water on crude, dependent on the crude quality andthe level of desalting required
(4) process units that produce significant quantities of waste water are the Crude DistillationUnit (CDU) and the Fluid Catalytic Cracker (FCC). In the CDU overhead, 2 - 3 % wastewater on crude intake is produced as steam condensate. This water does not require SWStreatment but can be directly routed as wash water in the desalter. An FCC-unit, if presentin the refinery, also produces significant quantities of waste water in the range of 5 - 10 %on feed. This amount can be reduced to 2 - 4 % if cascading of wash water isaccomplished. Stripped sour water can in principle be used as wash water and, on theother hand, the FCC wash water can either be recycled to the SWS or used as desalterwash water. Depending on the quantities of effluent generated, optimisation of waterintegration is possible
(5) boiler blowdowns, cooling water blow downs and treated rainwater run-off are waterstreams that may be suitable for desalter wash water as well, dependent on the saltconcentration
(6) a site-specific Water Masterplan can be designed, applying the concept of WSI. It will bedependent on and will take account of the location and site-specific elements such asclimate/rainfall, river/sea, existing segregation, availability of two desalters/SWS,specific refinery units, fresh water costs, groundwater situation, etc
(7) use of phenolic spent caustic for stripped water neutralisation and subsequent desalterwash to allow phenols resorption into the crude
(8) if the stream generated in the boiler feed water production is not recycled to the desalter,biotreatment is required because of anti-foaming agents and corrosion inhibitors
(9) refinery waste water need to be properly segregated to ensure the most effective treatmentor re-use. A typical segregation scheme for a petroleum refinery would provide a “clean”water sewer, an oily water sewer, and a highly-contaminated water sewer
(10) water pinch or water optimisation studies(11) water coolers/condensors may be replaced by air coolers (closed cooling water systems)
(reference to cooling section)(12) air cooling, reduced cooling water blowdown, using hydrocracking and hydrotreating
processes that produce less waste water than older processes; and using improved drying,sweetening and finishing procedures to minimise the generation of spent caustics andacids, water washes and filter solids; recycling and re-using waste water elsewhere in therefinery
(13) treated waste water that can be re-used in make-up to process and pump cooling systems,washdown water and water from fire control systems
(14) use of vacuum liquid ring compression instead of steam ejectors to minimize waterconsumption; use waste water free vacuum technique (recirculation of water) if otherwiseharmful substances are transfered to the environment
Energy and process materials utilisationThe steam boilers and steam system require corrosion inhibitors and oxygen scavengers and thede-aerator uses LP steam. The DAF unit and the sludge work-up require poly-electrolytes. Thebiotreater requires nutrients (phosphor) if no sanitary waste water or cooling water blow down(which could contain phosphates as corrosion inhibitor) is co-treated. A comprehensive WSIwill result in minimisation of these expensive chemicals and in minimum pollution anddischarge levies.
Chapter 4 Techniques to consider in the determination of BAT
280 December 2001 MA/EIPPCB/REF_BREF_FINAL
Environmental aspectsThe environmental implications of the conceptual approach of a process water integrationscheme are favourable. Enclosed systems and closed water loops limit the hydrocarbonemissions to air and discharges to surface water, and also lead to reduced generation of waste inthe form of sludges.
Quantification of the reductions of the water used (and products lost) vary from location tolocation but can be substantial (>50 %). A newly built refinery in Thailand generates only 40 t/hprocess water at a crude throughput of 8 Mt/yr due to such an approach. Values of 0.5 m3 pertonne of crude oil have been also achieved within Europe.
Reference literature[118, VROM, 1999], [113, Noyes, 1993], [268, TWG, 2001], [117, VDI, 2000]
4.15.7.2 Water and drainage system
Purpose and principleThe ideal for a water and drainage system is to create the flexibility to cope with changingcircumstances such as sudden rainfall, process upsets, process changes, additional plants,capacity extensions and new legislation. It would also provide a basis for integrated watermanagement, including spill prevention and potential re-use of water streams without or aftertreatment. The principle is based on a thorough qualitative and quantitative analysis of thevarious water and effluent streams, the assessment for re-use potential with maximum reliabilityand environmental protection. A flexible water and drainage design allows for water integrationand allows for short-term and long-term changes at optimised cost. Enclosed sewerage systemsfor transfer of contaminated water from tanks and processes to separation facilities is also atechnique to consider.
System descriptionA modern and optimised water and drainage system of an industrial site is a result of aconceptual design of many unit operations lined up in such a way that water management can beoptimised. The basis of the concept is segregation of the different water streams into oil-freewater streams, accidentally oil-contaminated (AOC) streams and continuously oil-contaminated(COC) streams. The latter need to be subdivided into low and high BOD streams with thepossibility for biotreatment, effluent polishing and re-use.
The application of a segregation concept takes a certain level of housekeeping and operationaldiscipline into account. The decision to choose a different route for a certain type of effluentwould be based on monitoring of water qualities, both internal streams and the collectivedischarge. The environmental performance and the effluent management of the refinery requiresa constant level of alertness and dedication, sufficient training and motivating instructions andan extensive monitoring (sampling and analysis) scheme. The first flush principle entails thecollection, separation and treatment of the first charge of rainwater from the potentiallycontaminated refinery surface. After the first flush the rest of the rainwater is collected, analysedand discharged without treatment, if acceptable.
Energy and process materials utilisationEnergy requirements are mainly for pumping the waste waters and are system and site-dependent.
ApplicationA number of elements of the current design philosophy for a new water and drainage system canbe considered for implementation in existing refineries, and more particularly in cases where theold effluent and drainage system has become obsolete.
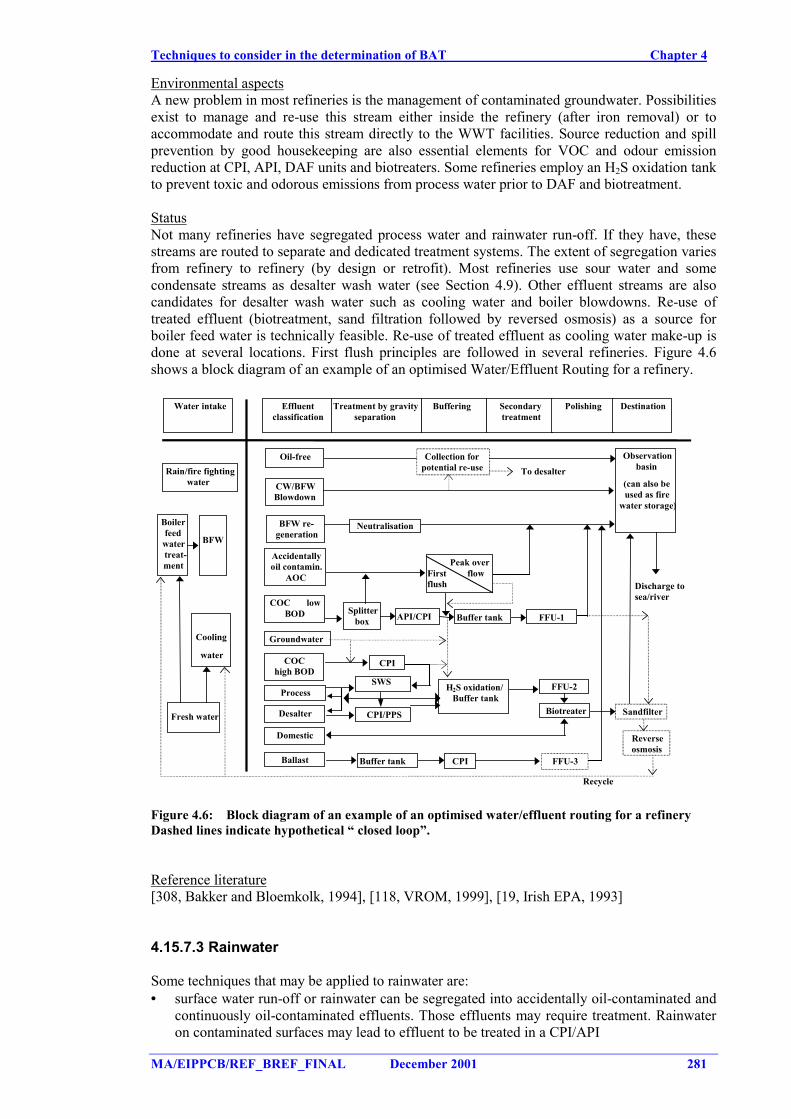
Techniques to consider in the determination of BAT Chapter 4
MA/EIPPCB/REF_BREF_FINAL December 2001 281
Environmental aspectsA new problem in most refineries is the management of contaminated groundwater. Possibilitiesexist to manage and re-use this stream either inside the refinery (after iron removal) or toaccommodate and route this stream directly to the WWT facilities. Source reduction and spillprevention by good housekeeping are also essential elements for VOC and odour emissionreduction at CPI, API, DAF units and biotreaters. Some refineries employ an H2S oxidation tankto prevent toxic and odorous emissions from process water prior to DAF and biotreatment.
StatusNot many refineries have segregated process water and rainwater run-off. If they have, thesestreams are routed to separate and dedicated treatment systems. The extent of segregation variesfrom refinery to refinery (by design or retrofit). Most refineries use sour water and somecondensate streams as desalter wash water (see Section 4.9). Other effluent streams are alsocandidates for desalter wash water such as cooling water and boiler blowdowns. Re-use oftreated effluent (biotreatment, sand filtration followed by reversed osmosis) as a source forboiler feed water is technically feasible. Re-use of treated effluent as cooling water make-up isdone at several locations. First flush principles are followed in several refineries. Figure 4.6shows a block diagram of an example of an optimised Water/Effluent Routing for a refinery.
Discharge tosea/river
Recycle
Boilerfeed
watertreat-ment
Water intake
Rain/fire fightingwater
Effluentclassification
Treatment by gravityseparation
Buffering Secondarytreatment
Polishing Destination
BFW
Cooling
water
Fresh water
Oil-free Observationbasin
(can also beused as fire
water storage)
CW/BFWBlowdown
BFW re-generation
Neutralisation
Accidentallyoil contamin.
AOC Peak over
First flowflush
COC lowBOD
COChigh BOD
Process
Desalter
Domestic
Ballast
Splitterbox API/CPI Buffer tank
CPI
SWS
CPI/PPS
H2S oxidation/Buffer tank
FFU-1
FFU-2
Biotreater
Buffer tank CPI FFU-3
Sandfilter
Groundwater
Reverseosmosis
Collection forpotential re-use To desalter
Figure 4.6: Block diagram of an example of an optimised water/effluent routing for a refineryDashed lines indicate hypothetical “ closed loop”.
Reference literature[308, Bakker and Bloemkolk, 1994], [118, VROM, 1999], [19, Irish EPA, 1993]
4.15.7.3 Rainwater
Some techniques that may be applied to rainwater are:• surface water run-off or rainwater can be segregated into accidentally oil-contaminated and
continuously oil-contaminated effluents. Those effluents may require treatment. Rainwateron contaminated surfaces may lead to effluent to be treated in a CPI/API
Chapter 4 Techniques to consider in the determination of BAT
282 December 2001 MA/EIPPCB/REF_BREF_FINAL
• in specific situations rainwater may be a useful source of rawwater for the preparation ofprocess water make-up, boiler feed water and cooling water
• some refineries have segregated effluent and drainage systems. In modern refineries thewater and drainage system includes a segregation of process water, condensate blowdowns,rainwater and cooling water in order to minimise the environmental impact of effluentdischarges at minimum cost. Moreover, adequate process water integration and watermanagement measures will include a review of all options to recycle water streams with theaim of achieving a significant reduction of end-of-pipe treatment. Segregation of the processwater discharges, surface water run-off, cooling water and boiler feed water blowdowns andother effluents may be considered. Separation of storm water and other effluents of differentorigin in order to permit appropriate treatment options. In some cases, retroffiting cost canbe very high.
Reference literature[118, VROM, 1999], [113, Noyes, 1993]
4.15.7.4 Use of sanitary waste water
Sanitary waste water effluent is collected in a septic tank. As this stream is small compared tothe total waste water of a refinery, and contains sufficient nutrients (micronutrients andphosphorus) required for an industrial biotreater, this effluent can be usefully combined with theprocess water to a dissolved air flotation-unit preceding a biotreater.
4.15.7.5 Ballast water
Ballast water is typically discharged at a very high rate provoking generation of high volumewaste water peaks. That waste water contains high salt concentrations (seawater), and areheavily polluted with oil. It can easily lead to an upset of existing effluent treatment systems.Therefore the use of ballast water tanks is an important equalisation tool for feeding the water ina controlled way to either the process water system or the COC system, if the COD is lowerthan 100 ppm. Because of this, (and because jetties are often remote from the rest of therefinery) ballast water is often treated in a separate dedicated plant. As more and more crudetankers are equipped with double hulls, the ballast water problem is slowly phasing out.
4.15.7.6 Fire-fighting water
Some techniques to consider are:• The fire-fighting water system can sometimes be a water re-use sink within the refinery.• Provision should be made to collect fire fighting water in a lagoon. Serious pollution has
been caused by the release of firefighting water in an emergency. Design of ContainmentSystems for the Prevention of Water Pollution from Industrial Accidents can be found inConstruction Industry Research and Information Association Report 164 1996.
4.15.7.7 Blowdown systems
The blowdown liquid system is typically composed of mixtures of water and hydrocarbonscontaining sulphides, ammonia, and other contaminants, which are sent to the waste watertreatment plant.
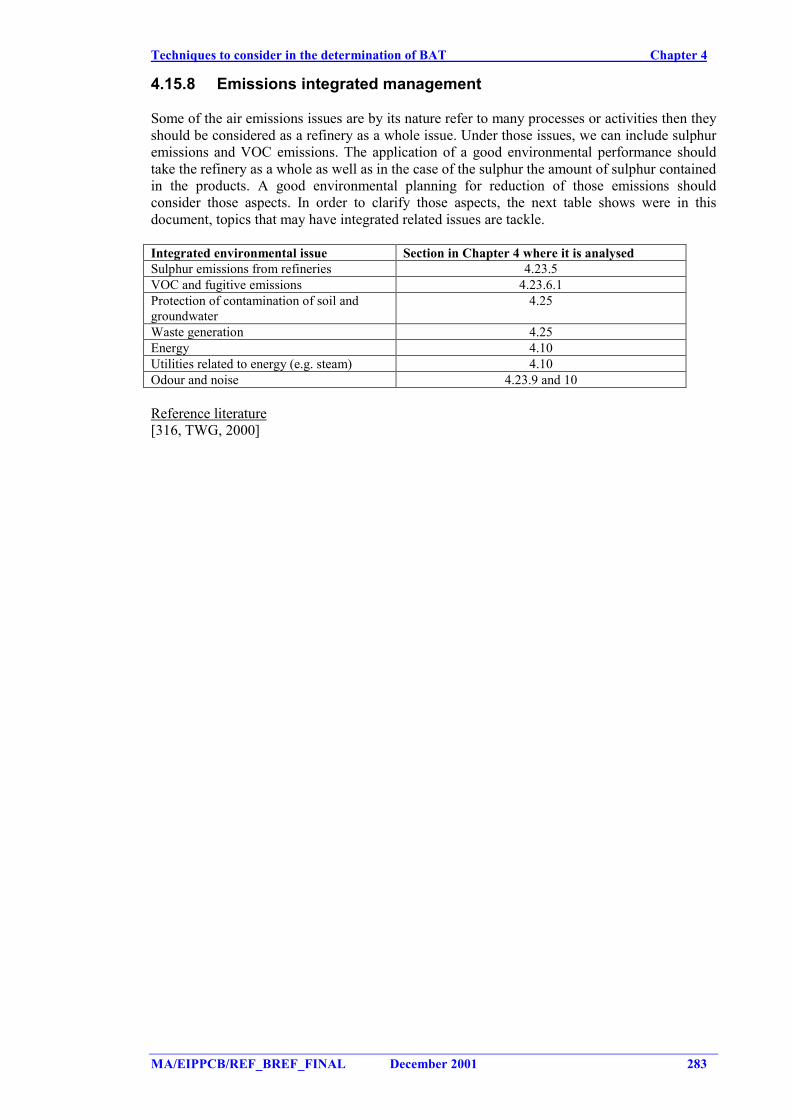
Techniques to consider in the determination of BAT Chapter 4
MA/EIPPCB/REF_BREF_FINAL December 2001 283
4.15.8 Emissions integrated management
Some of the air emissions issues are by its nature refer to many processes or activities then theyshould be considered as a refinery as a whole issue. Under those issues, we can include sulphuremissions and VOC emissions. The application of a good environmental performance shouldtake the refinery as a whole as well as in the case of the sulphur the amount of sulphur containedin the products. A good environmental planning for reduction of those emissions shouldconsider those aspects. In order to clarify those aspects, the next table shows were in thisdocument, topics that may have integrated related issues are tackle.
Integrated environmental issue Section in Chapter 4 where it is analysedSulphur emissions from refineries 4.23.5VOC and fugitive emissions 4.23.6.1Protection of contamination of soil andgroundwater
4.25
Waste generation 4.25Energy 4.10Utilities related to energy (e.g. steam) 4.10Odour and noise 4.23.9 and 10
Reference literature[316, TWG, 2000]
Chapter 4 Techniques to consider in the determination of BAT
284 December 2001 MA/EIPPCB/REF_BREF_FINAL
4.16 Isomerisation
4.16.1 Active chloride promoted catalyst isomerisation process
DescriptionMore information in Section 2.16.
Achieved environmental benefitsHigher process efficiencies compared with the zeolitic catalsyts and lower reaction temperatures(less energy consumed).
Cross-media effectsThe chloride promoted, chlorinated alumina catalyst (containing platinum) requires the additionof very small amounts of organic chlorides to maintain high catalyst activities. This is convertedto hydrogen chloride in the reactor. The chloride promoted catalyst cannot be regenerated.
Operational dataThe highly active chloride promoted catalyst, chlorinated alumina catalyst (containingplatinum), operates at a relatively low temperature (190 - 210 °C and 20 barg) and gives thehighest octane improvement. In such a reactor, the feed must be free of oxygen sources,including water to avoid deactivation and corrosion problems. The desorption process consumesutilities and energy.
ApplicabilityThis catalyst is very sensitive to sulphur, so deep desulphurisation of the feed to 0.5 ppm isrequired.
EconomicsInvestment estimated (basis ISBL, USA Gulf Coast 1998) 4150 - 10400 EUR per m3/d.Investment erected cost (basis: 2Q98 USA Gulf Coast) were evaluated for 1590 m3/d of freshfeed capacity EUR 8.8 millions (±50 %).
Driving force for implementationProduction process.
Reference literature[212, Hydrocarbon processing, 1998], [316, TWG, 2000]
4.16.2 Zeolitic isomerisation process
DescriptionMore information in Section 2.16. Some refiners need more octane from the light straight runnaphtha fraction than is possible from the O-T zeolitic isomerisation process. Adsorptiontechnology can then be used to remove the unconverted normal paraffins. The utilities needs forthat process are quite low.
Achieved environmental benefitsNo chloride compounds are used in this type of processes. The zeolite and sulphated zirconiacatalyst can be regenerated several times before sending the catalyst to a reclaimer to recoverthe platinum.
Cross-media effectsHigher temperature of the process, requiring more heating.
Techniques to consider in the determination of BAT Chapter 4
MA/EIPPCB/REF_BREF_FINAL December 2001 285
Operational dataThe zeolite catalyst operates at significantly higher temperatures (250 - 275°C and 28 barg) andis much more tolerant to contaminants, though the resulting octane improvement is lower.
ApplicabilityThe zeolite catalyst is mainly used for non hydrotreated feedstreams. Lower reactiontemperatures are preferred to higher temperatures because the equilibrium conversion to isomersis enhanced at the lower temperatures.
Refiners with idle hydroprocessing equipment, such as old catalytic reformers orhydrodesulphurisation units, can consider converting this equipment to the once-through zeoliticisomerisation process. With isomerisation, a 10 to 12 octane-number increase for the C5 - 71 ºClight naphtha can be achieved.
EconomicsEstimated cost of the reaction process is EUR 4654 per m3/d. For the absoprtion process, theinvestment is EUR 18900 - 25160 per m3/d. The catalyst and adsorbent cost is around EUR1700 per m3/d.
Driving force for implementationProduction process. Selection of a once-through or recycle scheme depends on factors such asquantity of light naphtha to be blended in the gasoline pool, the required octane number of thegasoline pool and the availability of other high octane gasoline blend components. If theisomerate product has an octane number exceeding 87, a recycle scheme is the only option.Selection of a fractionation-based scheme or an absorption based scheme is dependent on feedcomposition and to a certain extent on the product requirements. In general it can be said thatthe fractionation based scheme is lower in investment cost but significantly higher in operatingcost as a result of high energy requirements.
Reference literature[166, Meyers, 1997], [212, Hydrocarbon processing, 1998], [316, TWG, 2000]
4.16.3 Increase of the cyclic hexanes in the isomerisation feedstream
DescriptionAs the benzene content in the gasoline pool is being reduced by new specifications, the practicewill be to fully dehexanise the reformer feed, leaving in the cyclic hexanes to pass to theisomerisation unit (preventing their conversion to benzene in the reformer).
Achieved environmental benefitsReduced benzene content in the gasoline out of the reformer.
Reference literature[247, UBA Austria, 1998]
Chapter 4 Techniques to consider in the determination of BAT
286 December 2001 MA/EIPPCB/REF_BREF_FINAL
4.17 Natural gas plants
As mentioned in the Scope section and in Section 2.17, the processes treated in this section arethose used in the refining of natural gas. As with mineral oil refineries, the processes used onproduction platforms are not included in this BREF.
4.17.1 Amine sweetening of natural gas
DescriptionThe reaction occouring in the process is given below and the process is illustrated in Figure 4.10of Section 4.23.5.1
2 R-NH2 +H2S -� (R-NH3)2S R = mono, di, or tri-ethanol
If the recovered H2S gas stream is not to be used as a feedstock for commercial applications, thegas is usually passed to a tail gas incinerator in which the H2S is oxidized to SO2 and is thenpassed to the atmosphere via a stack. More information can be found in Section 4.23.5.1.
Achieved environmental benefitsReduction of H2S concentration in natural gas.
Cross-media effectsSection 4.23.5.1.
Operational dataThe recovered hydrogen sulphide gas stream may be: (1) vented, (2) flared in waste gas flares ormodern smokeless flares, (3) incinerated, or (4) used for the production of elemental sulphur orsulphuric acid.
ApplicabilityFully applicable.
EconomicsSection 4.23.5.1.
Driving force for implementationComply with sulphur specifications of natural gas.
Example plantsAt present, the amine process (also known as the Girdler process) is the most widely usedmethod for H2S removal.
Reference literature[136, MRI, 1997], [144, HMIP UK, 1997]
4.17.2 Sulphur recovery unit
Extensive information can be found in Section 4.23.5.2.
Techniques to consider in the determination of BAT Chapter 4
MA/EIPPCB/REF_BREF_FINAL December 2001 287
4.17.3 Re-use of carbon dioxide
DescriptionAcid gas streams containing carbon dioxide free from sulphur and hydrocarbon compounds maybe vented directly to air, although this may require heating of the stream to air dispersion.However, carbon dioxide can be used for other purposes. If the CO2 stream has a significanthydrocarbon content, it can be used within combustion processes, e.g. mixed into site fuel gas orused in a utility designed to burn gas of low flame stability.
Reference literature[144, HMIP UK, 1997]
4.17.4 Techniques to reduce VOC emissions
During routine operation of natural gas terminals and other processes, the aim need to be toprevent releases to air of natural gas. Techniques to consider to reduce those emissions include:• minimise frequency of pig/sphere use by operating sea-lines at high velocity, ie use “mist
flow”conditions• minimise recovery of spheres by use of receivers holding several devices• vent receivers of high-pressure gas to a low-pressure part of the process for gas recovery by
recompression, before opening for access to pig/spheres• the occasional shutdown and venting of process plant is necessary, e.g. for maintenance,
upset and changeover purposes. This need to be minimised by appropriate plant selectionand design
• avoid the use of refrigerants for gas dew point control that are of significant environmentalconcern (CFCs)
• overheads and any gas vented from storage and glycol and methanol regeneration unitsshould be condensed and incinerated
• leak detection and repair programme. More information can be found in Section 4.23.6.1.• VOC emissions, including fugitives, can be maintained within a range of 200 to 250 kg/h
(300 - 350 kg/MNm3)
Reference literature[144, HMIP UK, 1997], [268, TWG, 2001]
4.17.5 Techniques to reduce NOx emissions
NOx emissions come from the combustion processes applied in the natural gas plant. Thetechniques that can be applied for control and abatement of NOx are the same as those applied torefinery fuel gas. See Section 4.10.4 and 4.23.3 for a detailed explanation.
4.17.6 Techniques to reduce water emissions
DescriptionPrevention techniques that may be applied to reduce the releases to water can be:• if possible, the quantity and contamination level of waste water to be treated on-shore need
to be minimised and controlled “at source”, i.e. wste water coming from off-shore activities• a three-phase separator can be used on the liquids from the slug cutcher to control and
minimise hydrocarbon content of the aqueous phase• sour water can be treated in a sour water stripper unit. See Section 4.24.2• process effluent from glycol or methanol regeneration plants and any other high BOD/COD
effluents should be kept separate from other streams, e.g. surface water, and treated beforedischarge to the site effluent system
• water management techniques. See Section 4.15.7.
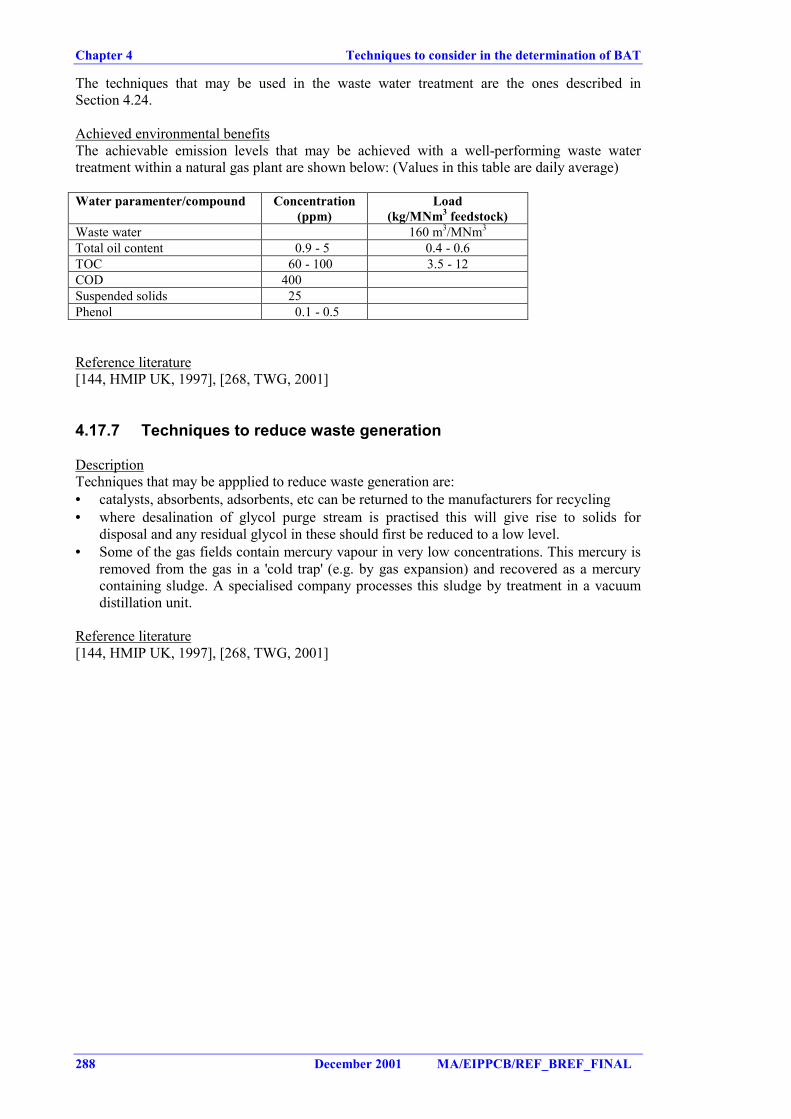
Chapter 4 Techniques to consider in the determination of BAT
288 December 2001 MA/EIPPCB/REF_BREF_FINAL
The techniques that may be used in the waste water treatment are the ones described inSection 4.24.
Achieved environmental benefitsThe achievable emission levels that may be achieved with a well-performing waste watertreatment within a natural gas plant are shown below: (Values in this table are daily average)
Water paramenter/compound Concentration(ppm)
Load(kg/MNm3 feedstock)
Waste water 160 m3/MNm3
Total oil content 0.9 - 5 0.4 - 0.6TOC 60 - 100 3.5 - 12COD 400Suspended solids 25Phenol 0.1 - 0.5
Reference literature[144, HMIP UK, 1997], [268, TWG, 2001]
4.17.7 Techniques to reduce waste generation
DescriptionTechniques that may be appplied to reduce waste generation are:• catalysts, absorbents, adsorbents, etc can be returned to the manufacturers for recycling• where desalination of glycol purge stream is practised this will give rise to solids for
disposal and any residual glycol in these should first be reduced to a low level.• Some of the gas fields contain mercury vapour in very low concentrations. This mercury is
removed from the gas in a 'cold trap' (e.g. by gas expansion) and recovered as a mercurycontaining sludge. A specialised company processes this sludge by treatment in a vacuumdistillation unit.
Reference literature[144, HMIP UK, 1997], [268, TWG, 2001]
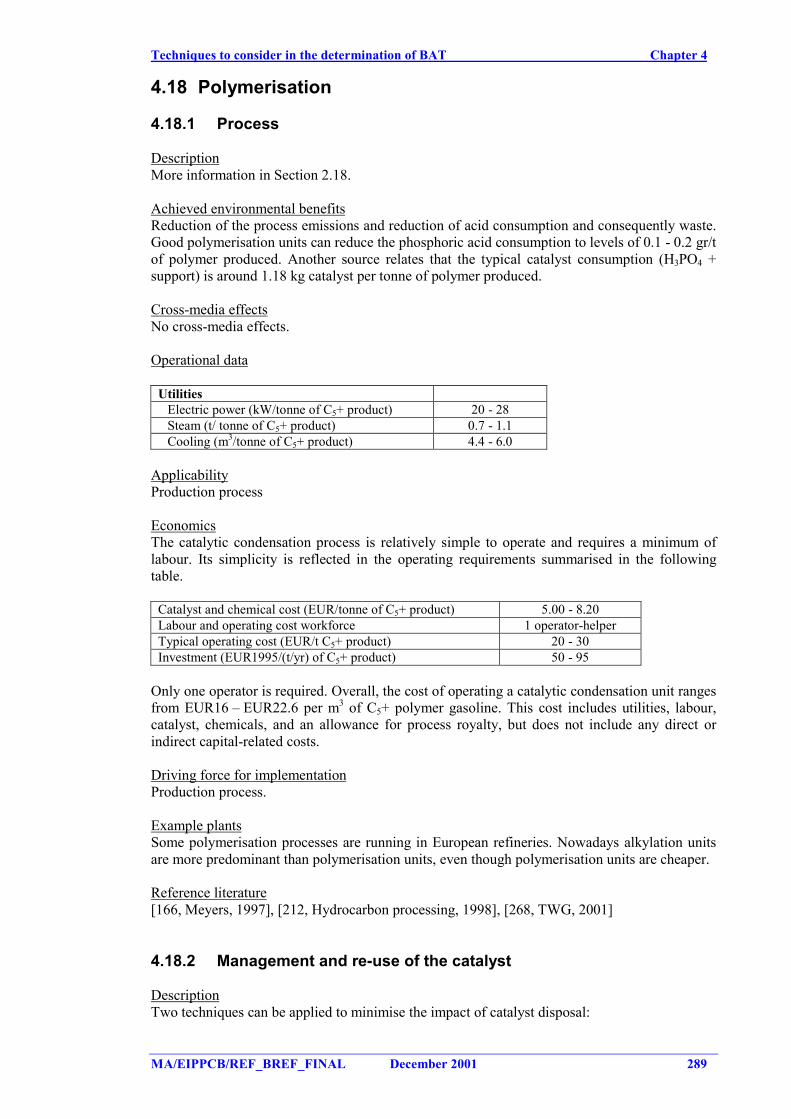
Techniques to consider in the determination of BAT Chapter 4
MA/EIPPCB/REF_BREF_FINAL December 2001 289
4.18 Polymerisation
4.18.1 Process
DescriptionMore information in Section 2.18.
Achieved environmental benefitsReduction of the process emissions and reduction of acid consumption and consequently waste.Good polymerisation units can reduce the phosphoric acid consumption to levels of 0.1 - 0.2 gr/tof polymer produced. Another source relates that the typical catalyst consumption (H3PO4 +support) is around 1.18 kg catalyst per tonne of polymer produced.
Cross-media effectsNo cross-media effects.
Operational data
UtilitiesElectric power (kW/tonne of C5+ product) 20 - 28Steam (t/ tonne of C5+ product) 0.7 - 1.1Cooling (m3/tonne of C5+ product) 4.4 - 6.0
ApplicabilityProduction process
EconomicsThe catalytic condensation process is relatively simple to operate and requires a minimum oflabour. Its simplicity is reflected in the operating requirements summarised in the followingtable.
Catalyst and chemical cost (EUR/tonne of C5+ product) 5.00 - 8.20Labour and operating cost workforce 1 operator-helperTypical operating cost (EUR/t C5+ product) 20 - 30Investment (EUR1995/(t/yr) of C5+ product) 50 - 95
Only one operator is required. Overall, the cost of operating a catalytic condensation unit rangesfrom EUR16 – EUR22.6 per m3 of C5+ polymer gasoline. This cost includes utilities, labour,catalyst, chemicals, and an allowance for process royalty, but does not include any direct orindirect capital-related costs.
Driving force for implementationProduction process.
Example plantsSome polymerisation processes are running in European refineries. Nowadays alkylation unitsare more predominant than polymerisation units, even though polymerisation units are cheaper.
Reference literature[166, Meyers, 1997], [212, Hydrocarbon processing, 1998], [268, TWG, 2001]
4.18.2 Management and re-use of the catalyst
DescriptionTwo techniques can be applied to minimise the impact of catalyst disposal:
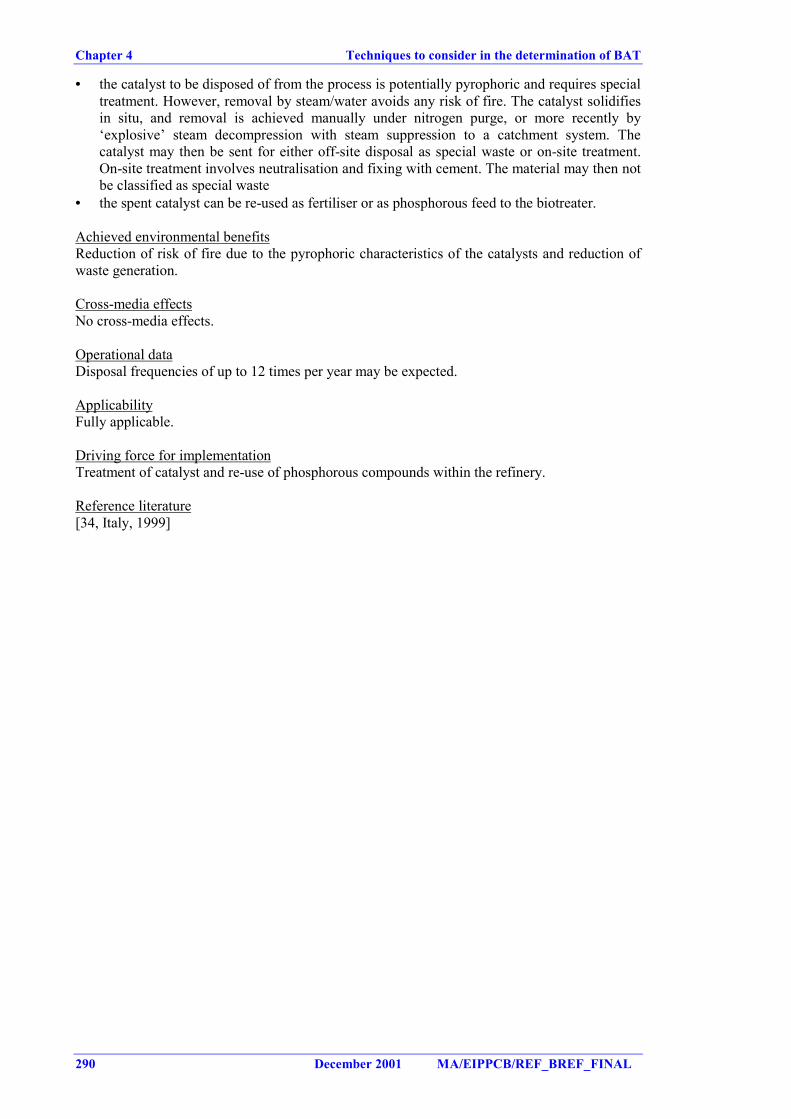
Chapter 4 Techniques to consider in the determination of BAT
290 December 2001 MA/EIPPCB/REF_BREF_FINAL
• the catalyst to be disposed of from the process is potentially pyrophoric and requires specialtreatment. However, removal by steam/water avoids any risk of fire. The catalyst solidifiesin situ, and removal is achieved manually under nitrogen purge, or more recently by‘explosive’ steam decompression with steam suppression to a catchment system. Thecatalyst may then be sent for either off-site disposal as special waste or on-site treatment.On-site treatment involves neutralisation and fixing with cement. The material may then notbe classified as special waste
• the spent catalyst can be re-used as fertiliser or as phosphorous feed to the biotreater.
Achieved environmental benefitsReduction of risk of fire due to the pyrophoric characteristics of the catalysts and reduction ofwaste generation.
Cross-media effectsNo cross-media effects.
Operational dataDisposal frequencies of up to 12 times per year may be expected.
ApplicabilityFully applicable.
Driving force for implementationTreatment of catalyst and re-use of phosphorous compounds within the refinery.
Reference literature[34, Italy, 1999]
Techniques to consider in the determination of BAT Chapter 4
MA/EIPPCB/REF_BREF_FINAL December 2001 291
4.19 Primary distillation units
As mentioned in Section 3.19, the atmospheric and vacuum distillation units are largeconsumers of heat. The techniques to consider for application to the crude oil furnaces are thosedescribed in the section dealing with the energy system 4.10.
4.19.1 Progressive distillation unit
DescriptionA progressive distillation unit with integrated CDU/HVU, which saves up to 30 % on totalenergy consumption for these units. The technology includes atmospheric distillation (topping),vacuum distillation, gasoline fractionation, naphtha stabilizer if required and gas plant.
2bar 125 °C
1 bar 131°C
CrudeOil
HEATER
1 bar 154 °C
357°C
90°C 90 - 120°C
HEATER
416 °C Vacuum
unit
Hydrotreaterfeed
Petro naphtha
Kerosene
Light gasoil
Heavy gasoil
Light vac.gasoil
Medium vac.gasoil
Heavy vac.gasoil
VacuumresidueFuel
Fuel
Flue gas
Flue gas
120 - 160 °C
Figure 4.7: Process flow diagram of a progressive distillation unit
Achieved environmental benefitsThe heater process duty (MW/100 tonnes of crude) of a distillation capacity of 10 milliontonnes per year is around 17.3 for an Arabian light crude. Using progressive crude distillation itis reduced to 10.1. The specific energy consumption (overall energy consumption in tonnes offuel equivalent per 100 tonnes of crude) for a distillation capacity of 10 million tonnes per yearis 1.7 - 2.0 for an Arabian light crude, whereas using the progressive distillation unit onlyconsumes 1.15. The energy savings for a 9700000 tonnes/year refinery is in the range of 50000tonnes heavy fuel compared to conventional technology.
Total primary energy consumptionFor Arabian light or Russian export blend: 1.25 tonnes of fuel per 100 tonnes of crudeFor Arabian heavy: 1.15 tonnes of fuel per 100 tonnes of crude.
Progressive distillation is the extreme of heat integration between atmospheric and vacuumdistillation. It also avoids superheating of light cuts to temperatures higher than strictlynecessary for their separation and it avoids degrading the thermal levels associated with thedrawing-off of heavy cuts.
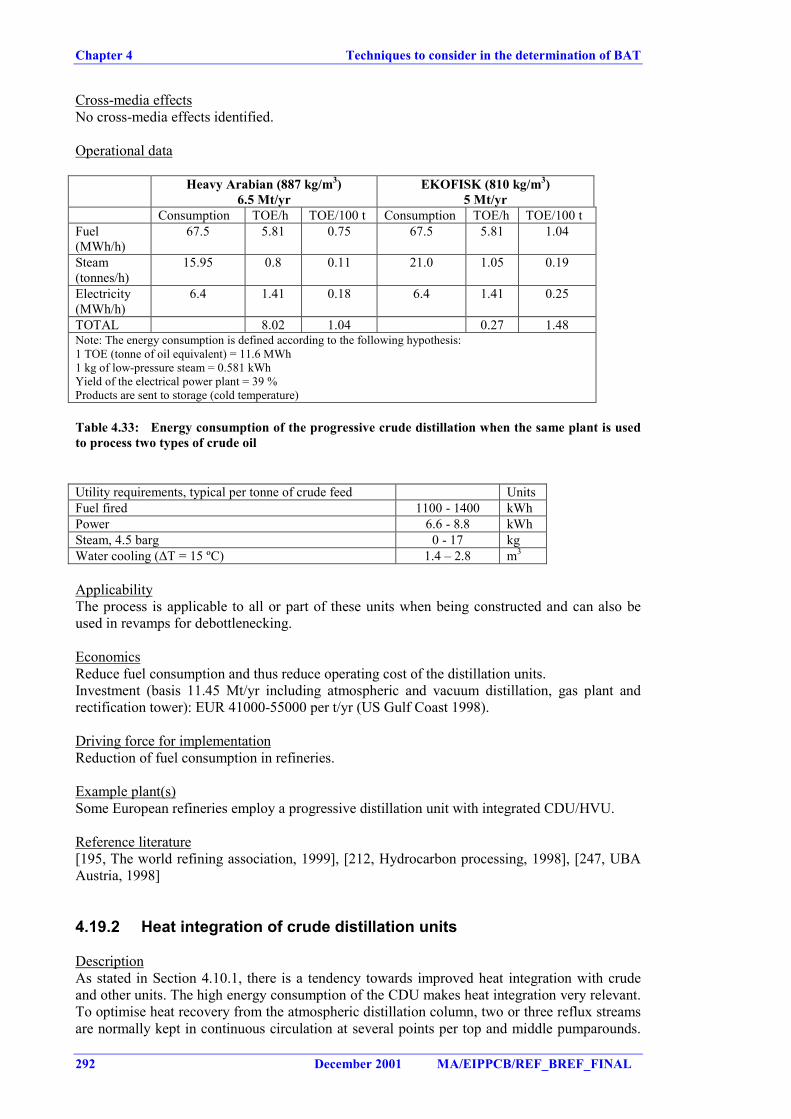
Chapter 4 Techniques to consider in the determination of BAT
292 December 2001 MA/EIPPCB/REF_BREF_FINAL
Cross-media effectsNo cross-media effects identified.
Operational data
Heavy Arabian (887 kg/m3)6.5 Mt/yr
EKOFISK (810 kg/m3)5 Mt/yr
Consumption TOE/h TOE/100 t Consumption TOE/h TOE/100 tFuel(MWh/h)
67.5 5.81 0.75 67.5 5.81 1.04
Steam(tonnes/h)
15.95 0.8 0.11 21.0 1.05 0.19
Electricity(MWh/h)
6.4 1.41 0.18 6.4 1.41 0.25
TOTAL 8.02 1.04 0.27 1.48Note: The energy consumption is defined according to the following hypothesis:1 TOE (tonne of oil equivalent) = 11.6 MWh1 kg of low-pressure steam = 0.581 kWhYield of the electrical power plant = 39 %Products are sent to storage (cold temperature)
Table 4.33: Energy consumption of the progressive crude distillation when the same plant is usedto process two types of crude oil
Utility requirements, typical per tonne of crude feed UnitsFuel fired 1100 - 1400 kWhPower 6.6 - 8.8 kWhSteam, 4.5 barg 0 - 17 kgWater cooling (∆T = 15 ºC) 1.4 – 2.8 m3
ApplicabilityThe process is applicable to all or part of these units when being constructed and can also beused in revamps for debottlenecking.
EconomicsReduce fuel consumption and thus reduce operating cost of the distillation units.Investment (basis 11.45 Mt/yr including atmospheric and vacuum distillation, gas plant andrectification tower): EUR 41000-55000 per t/yr (US Gulf Coast 1998).
Driving force for implementationReduction of fuel consumption in refineries.
Example plant(s)Some European refineries employ a progressive distillation unit with integrated CDU/HVU.
Reference literature[195, The world refining association, 1999], [212, Hydrocarbon processing, 1998], [247, UBAAustria, 1998]
4.19.2 Heat integration of crude distillation units
DescriptionAs stated in Section 4.10.1, there is a tendency towards improved heat integration with crudeand other units. The high energy consumption of the CDU makes heat integration very relevant.To optimise heat recovery from the atmospheric distillation column, two or three reflux streamsare normally kept in continuous circulation at several points per top and middle pumparounds.
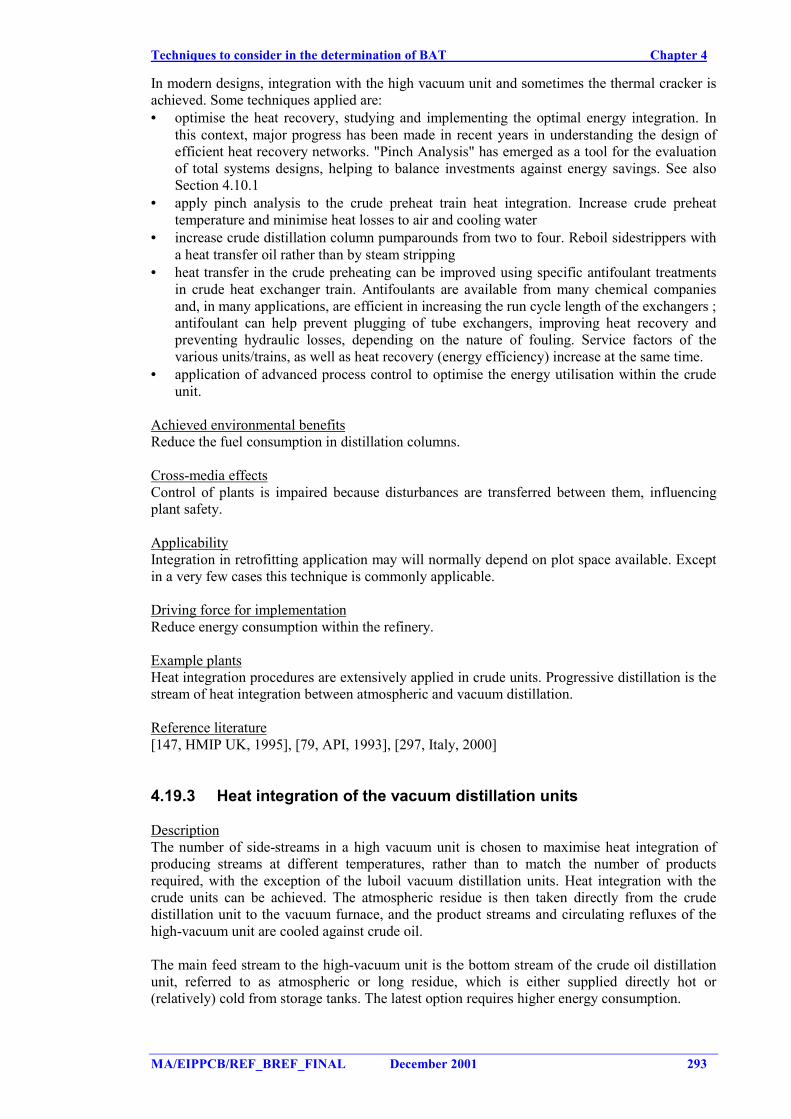
Techniques to consider in the determination of BAT Chapter 4
MA/EIPPCB/REF_BREF_FINAL December 2001 293
In modern designs, integration with the high vacuum unit and sometimes the thermal cracker isachieved. Some techniques applied are:• optimise the heat recovery, studying and implementing the optimal energy integration. In
this context, major progress has been made in recent years in understanding the design ofefficient heat recovery networks. "Pinch Analysis" has emerged as a tool for the evaluationof total systems designs, helping to balance investments against energy savings. See alsoSection 4.10.1
• apply pinch analysis to the crude preheat train heat integration. Increase crude preheattemperature and minimise heat losses to air and cooling water
• increase crude distillation column pumparounds from two to four. Reboil sidestrippers witha heat transfer oil rather than by steam stripping
• heat transfer in the crude preheating can be improved using specific antifoulant treatmentsin crude heat exchanger train. Antifoulants are available from many chemical companiesand, in many applications, are efficient in increasing the run cycle length of the exchangers ;antifoulant can help prevent plugging of tube exchangers, improving heat recovery andpreventing hydraulic losses, depending on the nature of fouling. Service factors of thevarious units/trains, as well as heat recovery (energy efficiency) increase at the same time.
• application of advanced process control to optimise the energy utilisation within the crudeunit.
Achieved environmental benefitsReduce the fuel consumption in distillation columns.
Cross-media effectsControl of plants is impaired because disturbances are transferred between them, influencingplant safety.
ApplicabilityIntegration in retrofitting application may will normally depend on plot space available. Exceptin a very few cases this technique is commonly applicable.
Driving force for implementationReduce energy consumption within the refinery.
Example plantsHeat integration procedures are extensively applied in crude units. Progressive distillation is thestream of heat integration between atmospheric and vacuum distillation.
Reference literature[147, HMIP UK, 1995], [79, API, 1993], [297, Italy, 2000]
4.19.3 Heat integration of the vacuum distillation units
DescriptionThe number of side-streams in a high vacuum unit is chosen to maximise heat integration ofproducing streams at different temperatures, rather than to match the number of productsrequired, with the exception of the luboil vacuum distillation units. Heat integration with thecrude units can be achieved. The atmospheric residue is then taken directly from the crudedistillation unit to the vacuum furnace, and the product streams and circulating refluxes of thehigh-vacuum unit are cooled against crude oil.
The main feed stream to the high-vacuum unit is the bottom stream of the crude oil distillationunit, referred to as atmospheric or long residue, which is either supplied directly hot or(relatively) cold from storage tanks. The latest option requires higher energy consumption.
Chapter 4 Techniques to consider in the determination of BAT
294 December 2001 MA/EIPPCB/REF_BREF_FINAL
The application of advanced process control to optimise the energy utilisation within the crudeunit.
Achieved environmental benefitsReduce fuel consumption in the refinery.
Cross-media effectsControl of plants is impaired because disturbances are transferred between them, influencingplant safety.
ApplicabilityIntegration in retrofitting application may will normally depend on plot space available. Exceptin a very few cases this technique is commonly applicable.
Driving force for implementationReduce fuel consumption in the refinery.
Example plantsHeat integration procedures are extensively applied in vacuum units. Progressive distillation isthe stream of heat integration between atmospheric and vacuum distillation.
Reference literature[147, HMIP UK, 1995], [79, API, 1993], [297, Italy, 2000]
4.19.4 Use of vacuum pumps and surface condensers
DescriptionVacuum liquid ring compressors instead of steam ejectors.
Achieved environmental benefitsVacuum pumps and surface condensers have largely replaced barometric condensers in manyrefineries to eliminate this oily waste water stream. Replacing the steam ejectors by vacuumpumps will reduce the sour water flow from 10 to 2 m3/h. The vacuum may be generated by acombination of vacuum pumps and ejectors to optimise energy efficiency. Other benefits arecross linked with cross-media effects.
Cross-media effectsReplacement of the steam ejectors by vacuum pumps will increase the electricity consumptionfor vacuum generation, but will reduce the heat consumption, the cooling water consumption,the electricity consumed for cooling pumps and the consumption of agents used for conditioningof cooling water. Within the refinery there are many processes where surplus steam canrecovered and be used for the production of vacuum. However, an energy management analysiswill help to decide, whether use of surplus steam for steam ejection instead of applying vacuumpumps is more efficient than using surplus steam for other purposes.
Operational dataThe use of vacuum pumps consumes electricity.
ApplicabilityFully applicable.
Driving force for implementationReduction of production of waste water.
Example plantsAt present, vacuum pumps are used more often than ejector sets.
Techniques to consider in the determination of BAT Chapter 4
MA/EIPPCB/REF_BREF_FINAL December 2001 295
Reference literature[79, API, 1993], [268, TWG, 2001]
4.19.5 Reduction of the vacuum pressure in the vacuum distillation unit
DescriptionLowering the vacuum pressure, e.g. down to 20 - 25 mm Hg, will allow a reduction in thefurnace outlet temperature, while maintaining the same target cut point of the vacuum residue.
Achieved environmental benefitsThis technique would provide some benefits, both in terms of energy conservation and ofpollution. The environmental benefits are:• a lowered potential for cracking or coking at furnace tubes• a reduced cracking of feed to lighter products• a lowered furnace fired duty and hence lowered fuel consumption.
Cross-media effectsEnergy (electricity or steam) is necessary to generate the vacuum.
ApplicabilityIt is limited usually by tower capacity, condensing fluid temperature or material restrictions.
Driving force for implementationReduce the heat duty of the vacuum distillation process.
Reference literature[297, Italy, 2000], [79, API, 1993]
4.19.6 Treatment of non-condensables from vacuum ejector setcondensor
DescriptionTechniques for controlling releases from vacuum units include scrubbing, compression intorefinery fuel gas and burning in adjacent process furnaces, or combinations thereof. The gasesfrom some units may contain significant amounts of air and such gases are normally bestcombusted locally. Amine scrubbing techniques may need to be applied carefully ashydrocarbon contamination may cause foaming problems in amine regeneration units.
Incondensables from overhead condensers can be passed to light ends treatment or recoverysystems or refinery fuel gas systems; sour incondensable gases vented from sealed barometricpumps of vacuum distillation units should be extracted and dealt with in a manner appropriate tothe nature of the sour gas.
A control technique applicable to the non-condensable emissions vented from the vacuumejectors or pumps consisting of venting into blowdown systems or refinery fuel gas systems,and incineration in furnaces or waste heat boilers.
Achieved environmental benefitsVacuum distillation column condensers may emit 0.14 kg/m3 of vacuum feed and can bereduced to negligible levels if they are vented to heater or incinerator. Pollution reduction isachieved if vacuum gaseous streams (vent gas) are routed to an appropriate amine scrubbingunit instead of being directly burned in the process heater. Vacuum vent gas routing toscrubbing requires significant investment due to compressor costs.The efficiency of incineration control techniques is generally greater than 99 % as regardsNMVOC emissions.
Chapter 4 Techniques to consider in the determination of BAT
296 December 2001 MA/EIPPCB/REF_BREF_FINAL
Cross-media effectsIn the incineration technique, the combustion products have to be accounted for.
ApplicabilityFully applicable.
Driving force for implementationReduce the emissions of pollutants.
Example plantsApplied in some European refineries.
Reference literature[136, MRI, 1997], [127, UN/ECE, 1998]
4.19.7 Waste water treatment and re-use
DescriptionThis topic is also treated in Section 4.15.7. Two techniques are considered in this section:• the overhead reflux drum generates some waste water. That water can be re-used as a
desalter wash water• sour water from atmospheric and vacuum unit condensates should pass to a sour water
stripper in enclosed systems• optimise water re-use by application of side-stream softening to blowdown streams.
Achieved environmental benefitsReduce water consumption and reabsorb pollutants.
ApplicabilityFully applicable.
Driving force for implementationReduce the water consumption.
Reference literature[79, API, 1993]
4.19.8 Other techniques to consider in the atmospheric units
DescriptionSome other techniques to consider are the following:(1) where applied, ammonia injection should be handled in enclosed systems. Alternative
neutralising techniques are available and can reduce the ammonia/ammonium load on sourwater and sulphur recovery systems
(2) de-coking vents need to be provided with suitable knock-out and dust suppressionfacilities;suitable methods of preventing emissions during clean-out procedures need to beused
(3) many oily sludges can be sent the crude distillation (or in alternative to the coking unit. See4.7.5) where they become part of the refinery products. This technique typically imply tosend the light slops to floating roof tanks (double sealed), and the heavy slops typically tofix roof tank. Typically the heavy slop after setting is blend with liquid fuel. The blendedlight slops after enough setting may be also blent to liquid fuel or sent to the crudedistillation at a mixing rate to avoid fouling.
(4) Pressure relief valves on column overheads; relief from overhead accumulator should bepiped to flare as well as the vent points.
(5) Use of spent caustic instead of fresh caustic for corrosion control on distillation unit. (Moreinformation in Section 4.20.2
Techniques to consider in the determination of BAT Chapter 4
MA/EIPPCB/REF_BREF_FINAL December 2001 297
Operational dataThe process of oily sludges in the crude distillation may generate problems in the desalter ormay foul up the heat exchangers of the distillation column.
Reference literature[79, API, 1993], [268, TWG, 2001]
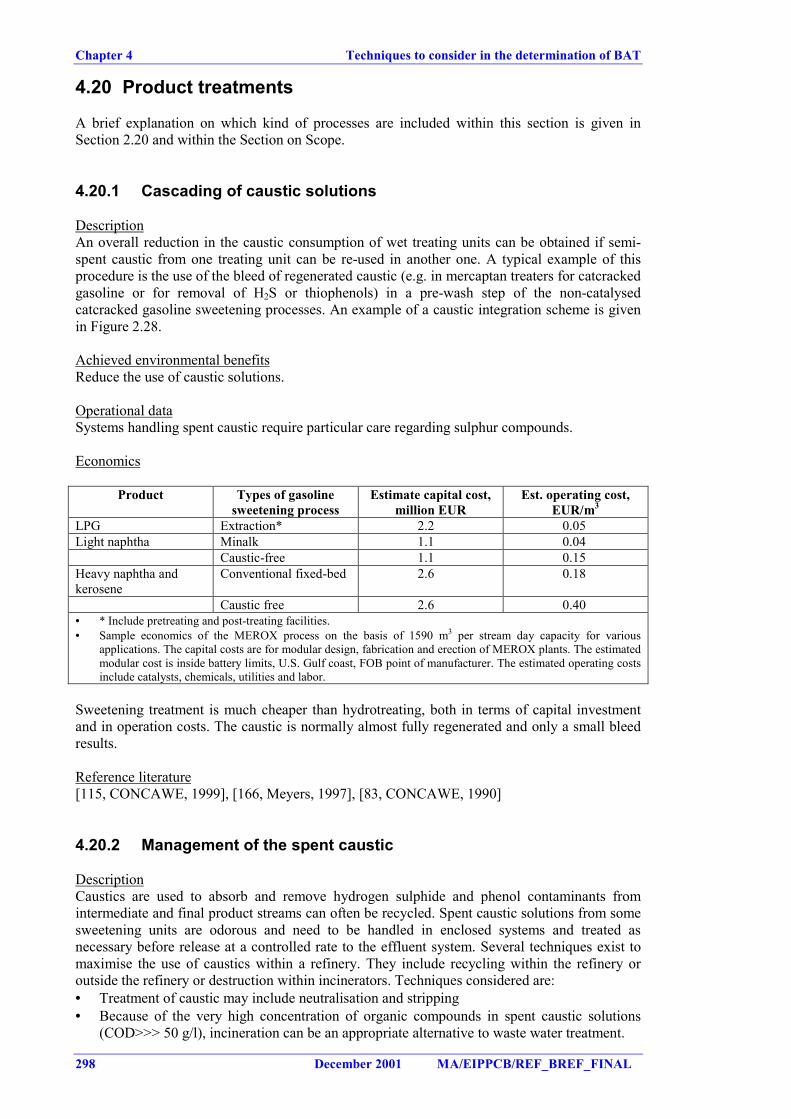
Chapter 4 Techniques to consider in the determination of BAT
298 December 2001 MA/EIPPCB/REF_BREF_FINAL
4.20 Product treatments
A brief explanation on which kind of processes are included within this section is given inSection 2.20 and within the Section on Scope.
4.20.1 Cascading of caustic solutions
DescriptionAn overall reduction in the caustic consumption of wet treating units can be obtained if semi-spent caustic from one treating unit can be re-used in another one. A typical example of thisprocedure is the use of the bleed of regenerated caustic (e.g. in mercaptan treaters for catcrackedgasoline or for removal of H2S or thiophenols) in a pre-wash step of the non-catalysedcatcracked gasoline sweetening processes. An example of a caustic integration scheme is givenin Figure 2.28.
Achieved environmental benefitsReduce the use of caustic solutions.
Operational dataSystems handling spent caustic require particular care regarding sulphur compounds.
Economics
Product Types of gasolinesweetening process
Estimate capital cost,million EUR
Est. operating cost,EUR/m3
LPG Extraction* 2.2 0.05Light naphtha Minalk 1.1 0.04
Caustic-free 1.1 0.15Heavy naphtha andkerosene
Conventional fixed-bed 2.6 0.18
Caustic free 2.6 0.40• * Include pretreating and post-treating facilities.• Sample economics of the MEROX process on the basis of 1590 m3 per stream day capacity for various
applications. The capital costs are for modular design, fabrication and erection of MEROX plants. The estimatedmodular cost is inside battery limits, U.S. Gulf coast, FOB point of manufacturer. The estimated operating costsinclude catalysts, chemicals, utilities and labor.
Sweetening treatment is much cheaper than hydrotreating, both in terms of capital investmentand in operation costs. The caustic is normally almost fully regenerated and only a small bleedresults.
Reference literature[115, CONCAWE, 1999], [166, Meyers, 1997], [83, CONCAWE, 1990]
4.20.2 Management of the spent caustic
DescriptionCaustics are used to absorb and remove hydrogen sulphide and phenol contaminants fromintermediate and final product streams can often be recycled. Spent caustic solutions from somesweetening units are odorous and need to be handled in enclosed systems and treated asnecessary before release at a controlled rate to the effluent system. Several techniques exist tomaximise the use of caustics within a refinery. They include recycling within the refinery oroutside the refinery or destruction within incinerators. Techniques considered are:• Treatment of caustic may include neutralisation and stripping• Because of the very high concentration of organic compounds in spent caustic solutions
(COD>>> 50 g/l), incineration can be an appropriate alternative to waste water treatment.
Techniques to consider in the determination of BAT Chapter 4
MA/EIPPCB/REF_BREF_FINAL December 2001 299
• Spent catalyst/caustic need to be handled and disposed of in a manner that avoids dustgeneration. They should not be disposed of to the land.
• Some techniques are available to re-use spent caustic within the refinery:(1) corrosion control on crude distillation units using spent caustic rather than fresh caustic.
Ustable chloridic (magnesium) salts that are not extracted from the crude oil in thedesalter will decompose upon heating to the crude distiller and cause chloridiccorrosion. To prevent corrosion of the exposed equipment, small quantities of caustic(sodium) are injected in the crude oil feed by which the chloridic components areneutralised due to the formation of stable sodium chloride. For this purpose ofneutralisation of chloridic decomposition products often spent caustic can be used,which is recommended as well to minimize waste generation.
(2) recycle to crude desalter or sour water strippers(3) addition to biotreaters for pH control.(4) Caustics containing phenols can also be recycled on-site by reducing the pH of the
caustic until the phenols become insoluble thereby allowing physical separation. Thecaustic can then be treated in the refinery waste water system.
• Re-use spent caustic outside refinery:(1) in paper mills (sulphidic caustic only)(2) as raw material for Na2SO3, cresylics and Na2CO3 (may require segregation of
sulphidic, cresylic and naphthenic caustics).(3) Spent caustics may be saleable to chemical recovery companies if concentrations of
phenol or hydrogen sulphide are high enough. Process changes in the refinery may beneeded to raise the concentration of phenols in the caustic to make recovery of thecontaminants economical.
• Measures to regenerate or oxidise spent caustic are:(1) Hydrogen peroxide(2) Fixed bed catalyst(3) Pressurised air: 120 - 320°C; 1.4 - 20.4 MPa(4) Biological system
Achieved environmental benefitsReduce odour emissions and caustic use.
Cross-media effectsThe cross-media effects found in the different techniques mentioned above are:(2) the addition of caustic within the desalter or within the crude unit may enhance the coke
formation within later units.(3) it adds phenols and BTX to waste water treatment. As a consequence, the degradation
efficiency of the biotreater can be adversely affected or the emissions from the waste watertreatment plant for these components can increase.
Operational dataSystems handling spent caustic require particular care regarding sulphur compounds.
Driving force for implementationReduce caustic use.
Example plantsMost refineries are able to regenerate their spent caustic, but sometimes they have to dispose ofsome excess quantities, mainly from caustic pre-wash activities. Usually these quantities aresmall and can be managed within their effluent treatment system or, if this is not the case, theyare disposed of via contractors for use as a bleaching agent in the paper and pulp industry. Somerefineries sell their concentrated phenolic caustic for the recovery of cresylic acids. Somerefineries work up the phenolic caustics themselves. From the extraction process the disulphiderecovered can be sold as product, or be recycles to a hydrometer or incinerator.
Chapter 4 Techniques to consider in the determination of BAT
300 December 2001 MA/EIPPCB/REF_BREF_FINAL
Reference literature[115, CONCAWE, 1999], [259, Dekkers, 2000], [268, TWG, 2001]
4.20.3 Incineration of foul air vented from sweetening
DescriptionFour air vented from sweetening process contain sulphur compounds that typically have strongodour. The range of quantity of sulphur in the foul air vented from sweetening processes isaround 0.7 – 7 kg/day (disulphide concentration can be as high as 400 ppm) for a 10000 t/dcrude unit and the percentage contribution it makes to the stack gases where it is incinerated hasbeen estimated to 0.16 – 2.48 %. For this reason, the abatement previous an incineration is notjustified and the foul air vented from sweetening processes is incinerated in local furnaces.
Reference literature[268, TWG, 2001]
4.20.4 Replace clay filtration with hydrotreating
DescriptionWhere a need to remove colour bodies and olefins exists, hydrotreating is replacing clayfiltration as the method of choice. Hydrotreating does a better job of improving colour andincreasing stability against oxidation, and has no yield loss (the oil measured in the spent filterclay represents a loss of some of the most valuable products produced in a refinery). It alsoeliminates the problem of spent clay disposal.
Achieved environmental benefitsReduction of waste generation.
Cross-media effectsNeed for hydrogen and energy consumption. See Section 4.13.1.
Operational dataSee Section 4.13.1.
EconomicsSee Section 4.13.1.
Driving force for implementationProduct requirements.
Reference literature[113, Noyes, 1993]
4.20.5 Treating
DescriptionTreating gas, LPGs, butanes, gasolines, kerosenes and diesels with caustic, amines, water andacid to remove amines, caustic contaminants, H2S, COS and mercaptans. Dry adsorbents suchas molecular sieves, activated carbon, iron sponge and zinc oxide may also be used to reachspecification (LPG) and prevent odour problems. (See also.4.23.9)
Reference literature[212, Hydrocarbon processing, 1998]
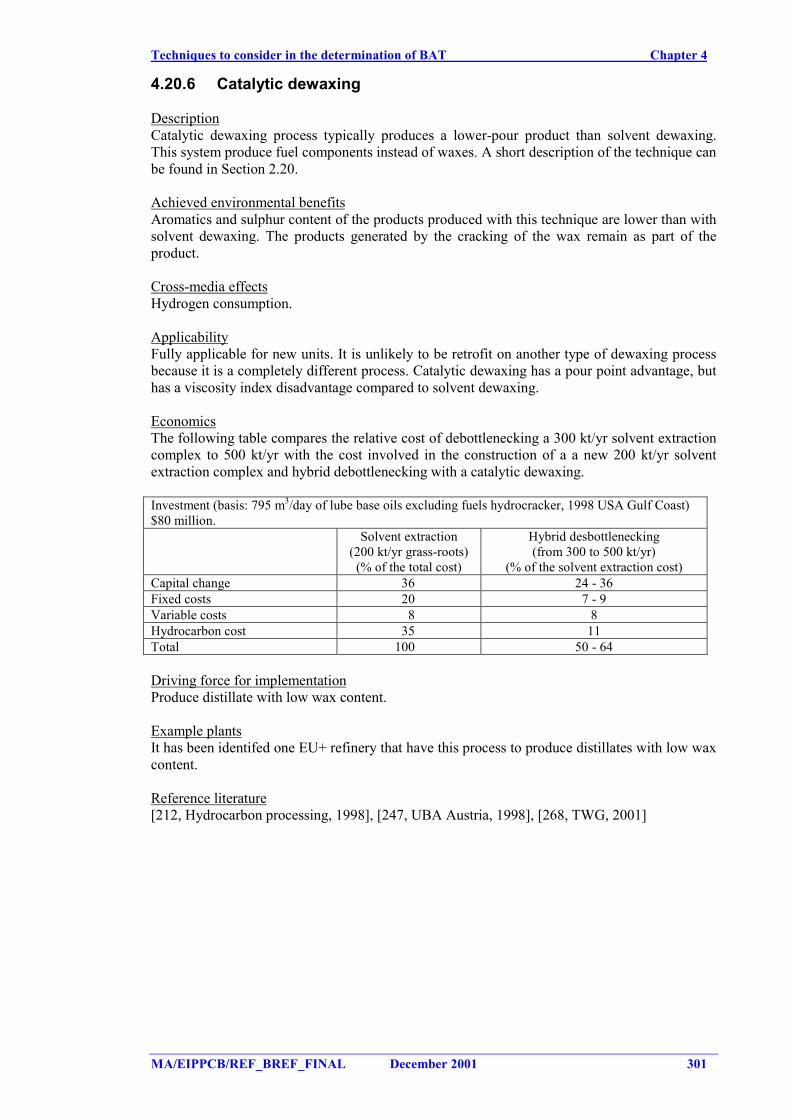
Techniques to consider in the determination of BAT Chapter 4
MA/EIPPCB/REF_BREF_FINAL December 2001 301
4.20.6 Catalytic dewaxing
DescriptionCatalytic dewaxing process typically produces a lower-pour product than solvent dewaxing.This system produce fuel components instead of waxes. A short description of the technique canbe found in Section 2.20.
Achieved environmental benefitsAromatics and sulphur content of the products produced with this technique are lower than withsolvent dewaxing. The products generated by the cracking of the wax remain as part of theproduct.
Cross-media effectsHydrogen consumption.
ApplicabilityFully applicable for new units. It is unlikely to be retrofit on another type of dewaxing processbecause it is a completely different process. Catalytic dewaxing has a pour point advantage, buthas a viscosity index disadvantage compared to solvent dewaxing.
EconomicsThe following table compares the relative cost of debottlenecking a 300 kt/yr solvent extractioncomplex to 500 kt/yr with the cost involved in the construction of a a new 200 kt/yr solventextraction complex and hybrid debottlenecking with a catalytic dewaxing.
Investment (basis: 795 m3/day of lube base oils excluding fuels hydrocracker, 1998 USA Gulf Coast)$80 million.
Solvent extraction(200 kt/yr grass-roots)
(% of the total cost)
Hybrid desbottlenecking(from 300 to 500 kt/yr)
(% of the solvent extraction cost)Capital change 36 24 - 36Fixed costs 20 7 - 9Variable costs 8 8Hydrocarbon cost 35 11Total 100 50 - 64
Driving force for implementationProduce distillate with low wax content.
Example plantsIt has been identifed one EU+ refinery that have this process to produce distillates with low waxcontent.
Reference literature[212, Hydrocarbon processing, 1998], [247, UBA Austria, 1998], [268, TWG, 2001]
Chapter 4 Techniques to consider in the determination of BAT
302 December 2001 MA/EIPPCB/REF_BREF_FINAL
4.21 Storage and handling of materials
As has been mentioned more information can be found in the Horizontal BREF on Storage[264, EIPPCB, 2001].
4.21.1 Underground caverns
DescriptionMore information in Section 2.21.
Achieved environmental benefits• VOC emissions from underground storage caverns are very low or non-existent. The main
reasons are: the temperature of the cavern is low and stable, the product is under pressure,the breathing gases from the cavern are not led to atmosphere but to an other cavern
• the land above caverns is free for other purposes• improve safety.
Cross-media effectsGround water leaking into the cavern must be removed and treated with other oily waters.
ApplicabilityThe geology of the site should be adequate to install a cavern: non porous rock.
EconomicsThe construction costs of storage caverns are markedly smaller than for above-ground tankfarms. In Finland, profitability begins at 50000 m3 under favourable conditions (depends highlyon the rock type). Maintenance costs have been calculated to be one-sixth those of above-ground tanks.
Driving force for implementationAvoidance of visual intrusion, the reduction of energy consumption, saving of land surface andeconomic for large storage systems.
Example plantsUsed in some European countries.
Reference literature[256, Lameranta, 2000]
4.21.2 Internal floating roof tanks
DescriptionInternal floating roof tank (IFRT)s. Emissions primarily occur during standing storage, with anadditional contribution from withdrawal emissions. In addition to the rim seal area and rooffitting penetrations, sources of standing loss from internal floating roof tanks include boltedseams in the floating roof. More information in Section 2.21. Some techniques that might beapplied to IFRT are:• the replacement of primary/secondary seals with tighter seals, which can also reduce the
VOC emissions• drain design on floating roof tanks to avoid hydrocarbon contamination of rainwater.
Achieved environmental benefitsReduction of VOC emissions. Conversion of fixed roof tanks to internal floating roof and sealsto minimise evaporation of the product being stored. The control efficiency of this method
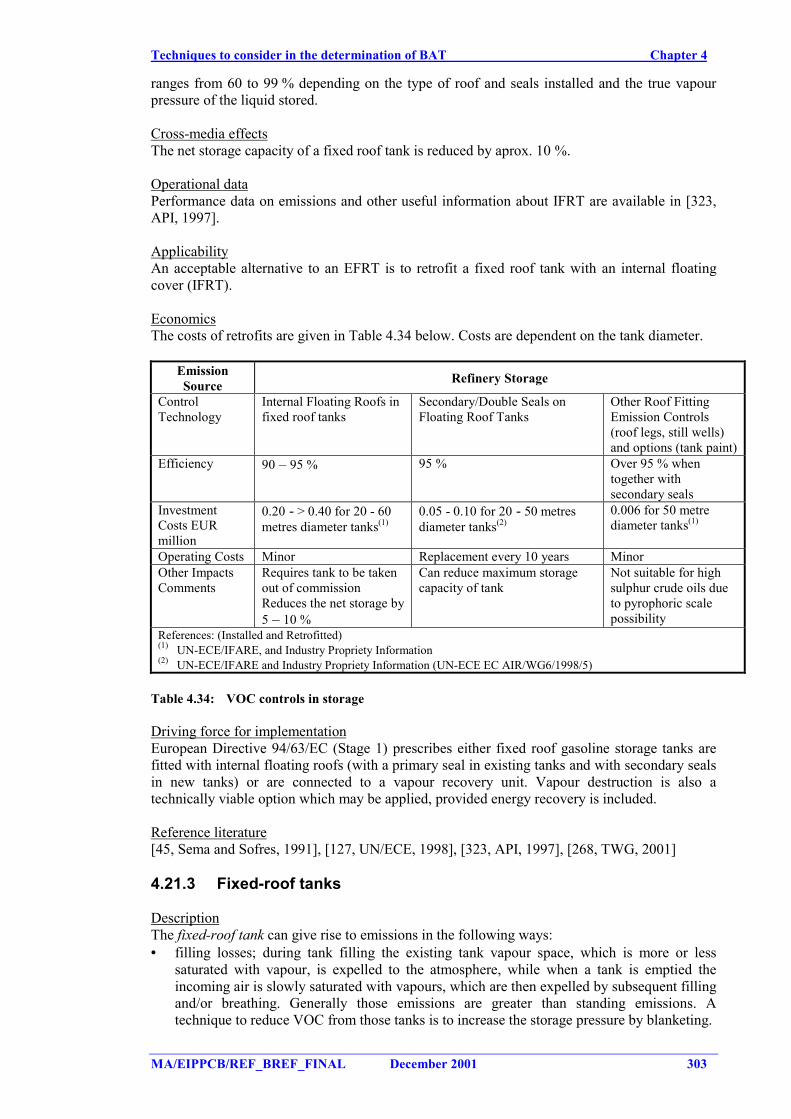
Techniques to consider in the determination of BAT Chapter 4
MA/EIPPCB/REF_BREF_FINAL December 2001 303
ranges from 60 to 99 % depending on the type of roof and seals installed and the true vapourpressure of the liquid stored.
Cross-media effectsThe net storage capacity of a fixed roof tank is reduced by aprox. 10 %.
Operational dataPerformance data on emissions and other useful information about IFRT are available in [323,API, 1997].
ApplicabilityAn acceptable alternative to an EFRT is to retrofit a fixed roof tank with an internal floatingcover (IFRT).
EconomicsThe costs of retrofits are given in Table 4.34 below. Costs are dependent on the tank diameter.
EmissionSource Refinery Storage
ControlTechnology
Internal Floating Roofs infixed roof tanks
Secondary/Double Seals onFloating Roof Tanks
Other Roof FittingEmission Controls(roof legs, still wells)and options (tank paint)
Efficiency 90 – 95 % 95 % Over 95 % whentogether withsecondary seals
InvestmentCosts EURmillion
0.20 - > 0.40 for 20 - 60metres diameter tanks(1)
0.05 - 0.10 for 20 - 50 metresdiameter tanks(2)
0.006 for 50 metrediameter tanks(1)
Operating Costs Minor Replacement every 10 years MinorOther ImpactsComments
Requires tank to be takenout of commissionReduces the net storage by5 – 10 %
Can reduce maximum storagecapacity of tank
Not suitable for highsulphur crude oils dueto pyrophoric scalepossibility
References: (Installed and Retrofitted)(1) UN-ECE/IFARE, and Industry Propriety Information(2) UN-ECE/IFARE and Industry Propriety Information (UN-ECE EC AIR/WG6/1998/5)
Table 4.34: VOC controls in storage
Driving force for implementationEuropean Directive 94/63/EC (Stage 1) prescribes either fixed roof gasoline storage tanks arefitted with internal floating roofs (with a primary seal in existing tanks and with secondary sealsin new tanks) or are connected to a vapour recovery unit. Vapour destruction is also atechnically viable option which may be applied, provided energy recovery is included.
Reference literature[45, Sema and Sofres, 1991], [127, UN/ECE, 1998], [323, API, 1997], [268, TWG, 2001]
4.21.3 Fixed-roof tanks
DescriptionThe fixed-roof tank can give rise to emissions in the following ways:• filling losses; during tank filling the existing tank vapour space, which is more or less
saturated with vapour, is expelled to the atmosphere, while when a tank is emptied theincoming air is slowly saturated with vapours, which are then expelled by subsequent fillingand/or breathing. Generally those emissions are greater than standing emissions. Atechnique to reduce VOC from those tanks is to increase the storage pressure by blanketing.
Chapter 4 Techniques to consider in the determination of BAT
304 December 2001 MA/EIPPCB/REF_BREF_FINAL
• breathing losses; during storage of the liquid there will be vapour emissions from tankbreathing caused by the difference in night and day temperatures and by changes inatmospheric pressure. To a certain extent, pressure controllers and insulation can preventbreathing losses
• vapours released during water draining.
The techniques that are considered to reduce emissions from fixed roof tanks are:• a technique to reduce VOC from those tanks is to blanket them• installation of an internal floating roof.
Achieved environmental benefitsThe installation of an internal floating roof in fixed-roof tanks can reduce VOC emissions up to90 %.
Cross-media effectsThe installation of an internal floating roof in a fixed roof tank requires the tank to be taken outof commission and reduces the net storage by 5 - 10 %.
Operational dataPerformance data on emissions and other useful information about EFRT are available in [323,API, 1997]
ApplicabilityFixed roof tanks are typically used for low or non volatile products e.g. kerosene, heating oil,with TVP less than 14 kPa. These tanks can be retrofitted to internal floating roof tanks. But arenot suitable for all products, e.g. bitumen tank with an internal floating roof will not work due tobitumen solidifying in the flaw between wall and internal floating roof.
EconomicsThe investment cost of installing internal floating roofs in fixed roof tanks can be 0.2 - 0.4 EURmillion for tanks 20 - 60 meters in diameter.
Driving force for implementationReduction of VOC emissions.
Reference literature[107, Janson, 1999], [115, CONCAWE, 1999], [323, API, 1997], [268, TWG, 2001]
4.21.4 External floating roofs
DescriptionExternal Floating roof tanks (EFRT). Filling and breathing losses are greatly diminished incomparison with fixed roof tanks, but the following vapour losses are inherent to this type oftank:• standing storage emissions from floating roof tanks include rim seal and roof-fitting
emissions, which result from stock vapour pressure changes due to temperature, andpressure variations but more importantly wind effects as well as openings in the roof. Theinfluence of wind effects is not a factor on internal floating roof tanks. Standing emissionson external floating roof tanks are generally much more significant than withdrawalemissions
• wetting losses; by evaporation of liquid from the wet wall, when the level of the liquid islowered by discharge
• vapours released during water draining• in many cases, for an external floating roof tank, the emissions through fittings can exceed
the rim seal losses especially on tanks with secondary seals. In terms of fitting losses, themajor source is from the slotted stillwell (sample well or dipping well).
Techniques to consider in the determination of BAT Chapter 4
MA/EIPPCB/REF_BREF_FINAL December 2001 305
External floating roof tanks are used to store crudes, light products and intermediate stockshaving a vapour pressure of more than 14kPa but less than 86 kPa at normal storagetemperature. More information can be found in Section 2.21. Techniques to minimise emissionsthere include:• installing wipers at the floating deck• sleeves around the pipe, incorporating still well wipers• floats with wipers inside the slotted pipe• land as infrequently as possible the floating roof tanks to avoid unnecesary vapour releases.
Achieved environmental benefitsFor the same substance, e.g. gasoline, EFRTs have the advantage over fixed roof tanks ofsignificantly lower emissions to the atmosphere of VOCs. An EFRT can avoid 95 % of thelosses from a fixed roof. Product savings give operating benefits.
Cross-media effectsThey have potentially more emissions to water than fixed roof tanks, since it is possible forrainwater to enter the tank past the roof seal. Any such water needs to be drained beforedespatch of the product to a customer since the quality of the product can be seriouslyjeopardised.
Operational dataPerformance data on emissions and other useful information about EFRT are available in [323,API, 1997].
ApplicabilityIn retrofit situations where a change in the service of the tank is desired, an acceptablealternative to an EFRT is to retrofit a fixed roof tank with an internal floating cover.
EconomicsInvestment cost for the retrofitting of a fixed rood tank to a EFRT is EUR 0.26 million per tankdiameter 20 m. Operator is necessary for tank draining, giving rise to some operating cost.
Driving force for implementationThe Directive 94/63/EC (Annex 1) defines an appropriate floating roof tank as one having atleast a VOC release efficiency of 95 % as compared with a fixed roof one.
Reference literature[45, Sema and Sofres, 1991], [252, CONCAWE, 2000], [258, Manduzio, 2000], [323, API,1997], [268, TWG, 2001]
4.21.5 Pressurised vesselsPressurised vessels such as bullets and spheres are often fitted with pressure relief valves, whichvent to atmosphere or flare. VOC emissions can occur if these valves or by-pass block valveshave internal leaks.
4.21.6 Double and secondary seals
DescriptionTwo seals at the floating roof rim provide a double barrier to control VOC emissions fromstorage tanks. Fitting secondary roof rim seals is an accepted technology for emission reduction.Rim-mounted seals (as opposed to shoe-mounted seals) are favoured, since the former offeremission control if the primary seal fails.
Chapter 4 Techniques to consider in the determination of BAT
306 December 2001 MA/EIPPCB/REF_BREF_FINAL
Achieved environmental benefitsVOC emissions can be significantly reduced by installing secondary seals on storage tanks. TheAmoco/USAEPA joint study estimated that VOC losses from storage tanks could be reduced by75 to 95 %. When they are applied in EFRT, secondary seals also reduce the likelihood ofrainwater ingress into the tank. Secondary seals for gasoline storage can reduce VOC emissionsby up to 95 %.
Cross-media effectsRetrofitting seals usually results a loss of operating capacity of about 5 %.
Operational dataPerformance data on emissions and other useful informations about rim seals are available in[323, API, 1997].
ApplicabilityThey can be readily installed in new units (named double seals) and generally retrofitted(secondary seals).
EconomicsEquipping an average tank with a secondary seal system was estimated to cost about $20000(1991). Investment costs: EUR 0.05 - 0.10 million for tanks 20 - 50 metre diameter.Operating costs: Replacement likely every 10 years.
Driving force for implementationEuropean Directive 94/63/EC (Stage 1) prescribes secondary seals for external floating rooftanks and for new internal floating roof tanks for gasoline storage in refineries and terminals.
Example plantsIn common use world-wide.
Reference literature[45, Sema and Sofres, 1991], [252, CONCAWE, 2000], [323, API, 1997], [268, TWG, 2001]
4.21.7 Storage strategy
DescriptionThe need for certain tanks can often be eliminated through improved production planning andmore continuous operations. This technique is closely related to Section 4.15.5. An example isthe implementation of an in-line blending system. See Section 4.21.14.
Achieved environmental benefitsSince storage tanks are one of the largest sources of VOC emissions, a reduction in their numbercontributes to a reduction of VOC emissions. By minimizing the number of storage tanks, tankbottom solids and decanted waste water may also be reduced.
ApplicabilityThe reduction of number of tanks typically requires a full change in the management of productand intermediates. As consequence this technique is easier to be applied to new units.
Driving force for implementationSpace usage can be improved by reducing the number of storage tanks in operation.
Reference literature[268, TWG, 2001]
Techniques to consider in the determination of BAT Chapter 4
MA/EIPPCB/REF_BREF_FINAL December 2001 307
4.21.8 Prevention of leakage through tank bottoms
It follows techniques to consider in the determination of BAT for prevention of leakage throughtank bottoms. This topic is well documented in EEMUA pub 183 "Guide for the Prevention ofBottom Leakage from Vertical, Cylindrical, Steel Storage Tanks”.
4.21.8.1 Double tank bottoms
DescriptionDouble bottoms can either be retrofitted in existing tanks or incorporated into the design of newtanks. If retrofitted, the existing tank bottom is normally used as the secondary flooring, andsand, gravel or concrete can be installed between the new primary and the secondary floors. Inthis case, it is general practice to keep the interstitial space to a minimum and therefore thesecondary bottom should slope the same way as the primary bottom. The slopes to the base oftanks can be either straight, cone-up (sloping from the centre down to the tank perimeter) orcone-down (sloping downward from the tank perimeter). Nearly all tank floors are made ofcarbon steel. If a double bottom is to be installed (either retrofit or new build), there are choicesin material selection for the new floor. A second carbon steel floor can be utilised or a morecorrosion-resistant stainless steel floor can be installed. A third choice is to use a glass fibre-reinforced epoxy coating over the steel.
The use of double bottom tanks allows a vacuum system to be installed, and in this case thespace between the lower and upper floor is not filled, but retained as an air space using steelspacers (which can typically be a steel reinforcement mesh). In this more recent system, thespace between the floors is kept under a vacuum that is continuously monitored. Any leak inthe primary or secondary floor will dissipate the vacuum and trigger an alarm. A further test ofthe extracted air will indicate an upper floor failure if product or vapours are present, or a lowerfloor failure if neither product nor vapour is present (subject to any previous underfloorcontamination).
Achieved environmental benefitsInstalling a second impervious bottom to a tank provides a measure of protection against non-catastrophic releases due to corrosion, faulty weld joints, or flaws in the bottom material or theconstruction details. In addition to containment, the secondary bottom provides a means ofallowing detection of a bottom leak which is not obviously visible to an operator, as a similarshell defect would be.
Cross-media effectsIn the case of retrofitting, the application of this technique may prolong the outage time of tanksduring installation of the double bottom. Its application can reduce the capacity of the tank.
Operational dataBy installing double bottoms, the time between inside inspections and the the number of theannual tank cleaning procedures are decreased.
ApplicabilityEither retrofit or new-build tanks.
EconomicsTypical retrofit costs for double bottoms, as quoted from German or Swiss suppliers, are asfollows and include provision of a vacuum leak detection system:• carbon steel: 110 EUR/m2
• stainless steel: 190 EUR/m2
• glass fibre-reinforced epoxy: 175 EUR/m2
An UK refinery reported that the actual cost of installing a double bottom on a 10340 m3 tankwas 600000 EUR.
Chapter 4 Techniques to consider in the determination of BAT
308 December 2001 MA/EIPPCB/REF_BREF_FINAL
Driving force for implementationPrevention of leaks from storage tanks.
Reference literature[253, MWV, 2000], [112, Foster Wheeler Energy, 1999]
4.21.8.2 Impervious membrane liners
DescriptionThe impervious membrane liner is a continuous leak barrier under the entire bottom surface ofthe tanks. It can be an alternative to a double bottom or it can be added as an extra measure ofsafety below the double bottom. Like the double bottom, it is primarily intended to arrest thesmall but persistent leak rather than address a catastrophic failure of the entire tank. The key toan effective liner is that the seams need to be liquid-tight against either the steel shell of the tankor the concrete wall that supports and surrounds the tank. The minimum thickness of theflexible membrane is 1 mm, although 1.5 to 2 mm thick sheets are commonly used. Themembrane need to be chemically resistant to the product stored in the tank.
Achieved environmental benefitsPrevention of leak from storage tanks.
Cross-media effectsProlonged tank outage if liner has to be retrofitted to existing tank.
ApplicabilityThey can be installed either in a new-build design or as a retrofit and they generally include aleak detection system.
EconomicsThe cost of retrofitting a liner is slightly higher than installing a double bottom as it involvesjacking-up the existing tank to install the membrane and leak detection system. An indicativecost is of the order of 200 EUR/m2. As new-build construction, an impervious liner may becheaper than a double bottom, but it may have a higher life cycle cost. This is because anyfuture failures of the liner would require re-lifting the tank or reverting to a new double bottomsolution.
The following are costs per unit for placing the following materials on the ground:• concrete: 30 EUR/m2
• asphalt: 24 EUR/m2
• HD polyethylene: 23 EUR/m2
• bentonite: 18 EUR/m2
• clay: 11-17 EUR/m2
This costs exclude the cost of lifting the tank for installation. However, costs of placing suchmaterials in the floors of bunds would be of this order. An additional cost arises from movingany pipework in the bunds.
For comparison of the installed costs of such a liner, one refinery reported that since 1994, ithad installed a clay bottom liner under each lifted tank during maintenance. A leak detectionsystem was installed at the same time. The cost of this was about 20000 to 30000 EUR per tankwith the cost of the clay liner being 11 to 17 EUR/m2. The total cost for 14 tanks amounted to350000 EUR. A similar cost (35000 EUR) was quoted in another installation of an imperviousliner (plus leak detection) for a 12000 m3 concrete tank.
Driving force for implementationPreventing soil contamination.
Techniques to consider in the determination of BAT Chapter 4
MA/EIPPCB/REF_BREF_FINAL December 2001 309
Example plant(s)Impervious membrane liners are used in lieu of double bottoms in a number of non-Europeancountries.
Reference literature[45, Sema and Sofres, 1991], [268, TWG, 2001]
4.21.8.3 Leak detection
DescriptionAs with sewers, one way to protect against soil and groundwater contamination is by detectingleaks at an early stage. Leaks through a tank bottom can be detected by a leak detection system.Conventional systems include inspection ports, inventory control and inspection wells. Moreadvanced systems include electronic sensing probes or energy pulse cables whereby product thatcomes into contact with the probe or cable will alter its impedance and trip an alarm. Inaddition, it is common practice to use a variety of inspection procedures on tanks at intervals toprove their integrity. See also Section 4.23.6.1 LDAR programme. Some techniques to considerare:• Equipping storage tanks with overflow alarms and automatic pump shut-offs.• Installing double bottoms with integrated leak detection systems on tanks where practicable.
Relief valves on pressurised storage should undergo periodic checks for internal leaks. This canbe carried out using portable acoustic monitors or, if venting to atmosphere with an accessibleopen end, tested with a hydrocarbon analyser as part of an LDAR programme.
Achieved environmental benefitsAvoid soil and groundwater contamination.
ApplicabilityProbes and cables have to be packed pretty densely if the leak to be detected is small.Consequently, inspection, where possible, may in some cases be more reliable than probes.
EconomicsOne refinery reported that the installation of a leak detection system on a group of four 12 mdiameter tanks cost a total of 55000 EUR with an operating cost of 4000 EUR per year. Theroutine inspection of tanks at another refinery was quoted as 2000 EUR/tank/year.
Driving force for implementationAvoid soil and groundwater contamination.
Reference literature[253, MWV, 2000]
4.21.8.4 Cathodic protection
DescriptionTo avoid corrosion on the underside of the tank bottom, tanks can be equipped with cathodiccorrosion protection.
Achieved environmental benefitsAvoid soil and groundwater contamination and air emissions due to the prevention of corrosion.
Cross-media effectsElectricity is needed.
Chapter 4 Techniques to consider in the determination of BAT
310 December 2001 MA/EIPPCB/REF_BREF_FINAL
Driving force for implementationAvoid corrosion of tanks and pipes, reducing the maintenance cost.
Reference literature[253, MWV, 2000]
4.21.9 Tank farm bund containment
DescriptionWhereas double bottoms or impervious liners protect against the small but incessant leak, animpermeable tank farm bund is designed to contain large spills (for safety as well asenvironmental reasons), such as caused by a shell rupture or a large spill from overfilling. Thebund consists of a wall or dike around the outside of the tank to contain all or part of the tankcontents in the event of a spill, and (in some cases) an impermeable ground barrier between thetank and the dike to prevent infiltration of the product into the ground. The dike is typicallyconstructed of well-compacted earth or reinforced concrete. The height is normally sized toaccommodate the maximum contents of the largest tank within the volume enclosed by the dike.However this philosophy of total capture is flawed if the ground between the tank and dike ispermeable. Oil can permeate downward and under the dike in these situations. Asphalt, concretesurface or high density polyethylene (HDPE) liner are some of the possibilities.
Achieved environmental benefitsContainment of large spills from liquid storage tanks.
Cross-media effectsThis technique might call for the soil to be compacted, which may be seen as negative impact. Astudy in the United States has concluded that the effectiveness of liners in protecting theenvironment is limited because of their unreliability and the difficulty in inspecting or testingtheir integrity. Also, there are few releases that would be contained by such liners, andmoreover, they are expensive to install. Because of this, it was concluded that otherpreventative measures are more effective in protecting the environment and are more cost-effective in the long run.
ApplicabilityIn some cases, retrofitting may not be possible.
EconomicsSome refineries have quoted the total cost for installing concrete paving under 6 big tanks atEUR 1.3 millions (0.22 per tank), the cost of sealing bund dike walls with asphalt (around 10tanks) at EUR 0.8 million, and the cost of concrete paving bunds at 70 - 140 EUR/m2. Onerefinery quoted the cost of installing 200m of impermeable HDPE barrier along the siteboundary at 150000 EUR (750 EUR/m).
Driving force for implementationContainment of large spills that may occur from liquid storage tanks is normally regulated bynational laws. In Italy, current legislation foresees for some liquids a volume of the bund lessthan 100 % of the tank volume.
Reference literature[147, HMIP UK, 1995]
Techniques to consider in the determination of BAT Chapter 4
MA/EIPPCB/REF_BREF_FINAL December 2001 311
4.21.10 Reduce the generation of tank bottoms
DescriptionMinimization of tank bottoms can be carried out through careful separation of the oil and waterremaining in the tank bottom. Filters and centrifuges can also be used to recover the oil forrecycling. Other techniques to consider are the installation of side entry or jet mixers on tanks orthe use of chemicals. This means that basic sediment and water is passed on to the receivingrefineries.
Achieved environmental benefitsTank bottoms from crude oil storage tanks constitute a large percentage of refinery solid wasteand pose a particularly difficult disposal problem due to the presence of heavy metals. Tankbottoms are comprised of heavy hydrocarbons, solids, water, rust and scale.
Cross-media effectsPassing the sediments and water from the crude oil tanks to the refinery means that they willmost probably show up in the desalter.
Reference literature[147, HMIP UK, 1995]
4.21.11 Tank cleaning procedures
DescriptionFor routine internal tank inspections and for the purpose of repair, crude oil and product tankshave to be emptied, cleaned and rendered gas-free. A technique to clean tank bottoms include todissolve the majority of the tank bottoms (>90%) with hot diesel fraction at temperatures ofaround 50 ºC where it disolve most of the tank bottoms and they can be blended after filtrationto the crude tanks.
Achieved environmental benefitsEmissions during the cleaning of tanks arise during natural or mechanical ventilation. A varietyof cleaning methods has been developed for the cleaning of crude oil tanks. Knowledge of thetechnology for cleaning crude oil tanks has improved, so that with primary measures emissionsof VOC less than 0.5 kg/m2 tank bottom area can be achieved. With secondary measures, e.g.installation of mobile flares, which are currently under development for cleaning crude oil andproduct tanks, further emission reductions of VOC of up to 90 % can be expected.
Cross-media effectsIf the refinery operates its own sludge incineration plant, cleaning residues can supplied to it.
Operational dataThe emission arising during the cleaning of crude oil tanks and the reduction of these emissionsare exhaustively described in [302, UBA Germany, 2000]. The use of hot diesel to clean up thetank bottoms require heating.
ApplicabilityFully applicable.
Driving force for implementationReduce VOC emissions and tank bottoms.
Example plantsExamples exist of applications in many EU+ refineries and tank farms.
Chapter 4 Techniques to consider in the determination of BAT
312 December 2001 MA/EIPPCB/REF_BREF_FINAL
Reference literature[117, VDI, 2000], [316, TWG, 2000], [302, UBA Germany, 2000], [122, REPSOL, 2001]
4.21.12 Colour of tanks
DescriptionIt is preferable to paint tanks containing volatile materials in a light colour to prevent a)increasing the evaporation because of increased product temperature and b) increasing thebreathing rate of fixed roof tanks.
Achieved environmental benefitsReduction of VOC emissions.
Cross-media effectsPainting in light colours can result in tanks being more "visible" which can have negative visualeffect.
ApplicabilityPainting of the roof and the upper part of the shell of a tank in the middle of a tank farm can beas effective as painting the entire tank.
Driving force for implementationAlso a requirement of 94/63/EC for gasoline tanks, except there are derogations for visuallysensitive areas.
Reference literature[262, Jansson, 2000], [268, TWG, 2001], [302, UBA Germany, 2000]
4.21.13 Other good storage practices
DescriptionProper material handling and storage minimises the possibility of spills, leaks and other losseswhich result in waste, air emissions and emissions to water. Some good storage practices are:
• use larger containers instead of drums. Larger containers are reusable when equippedfor top and bottom discharge, whereas drums have to be recycled or disposed of aswaste. Bulk storage can minimize the chances of leaks and spills as compared to drums.Applicability: Safe disposal of un-refillable large containers can be a problem.
• reduce generation of empty oil drums. Bulk purchasing (via tank truck) of frequentlyused oils and filling tote bins as intermediate storage. Personnel could then transfer theoils from the tote bin to reusable drums, buckets, or other containers. This would reducethe generation of empty drums and their associated handling costs
• storage of drums off the floor to prevent corrosion through spills or concrete 'sweating'• keeping containers closed except when removing material• practise corrosion monitoring, prevention and control in underground piping and tank
bottoms (Related with 4.21.8 and 4.21.22)• tanks for storage of ballast water may cause large VOC emissions. They can be
therefore equipped with a floating roof. Those tanks are also relevant as equalizingtanks for the waste water treatment system
• vents from sulphur storage tanks to pass to sour gas or other arrestment systems• vent collection and ducting from tank farms to central abatement sytems.• install self-sealing hose connections or implement line draining procedures• install barriers and/or interlock systems to prevent damage to equipment from the
accidental movement or driving away of vehicles (road or rail tank cars) during loadingoperations
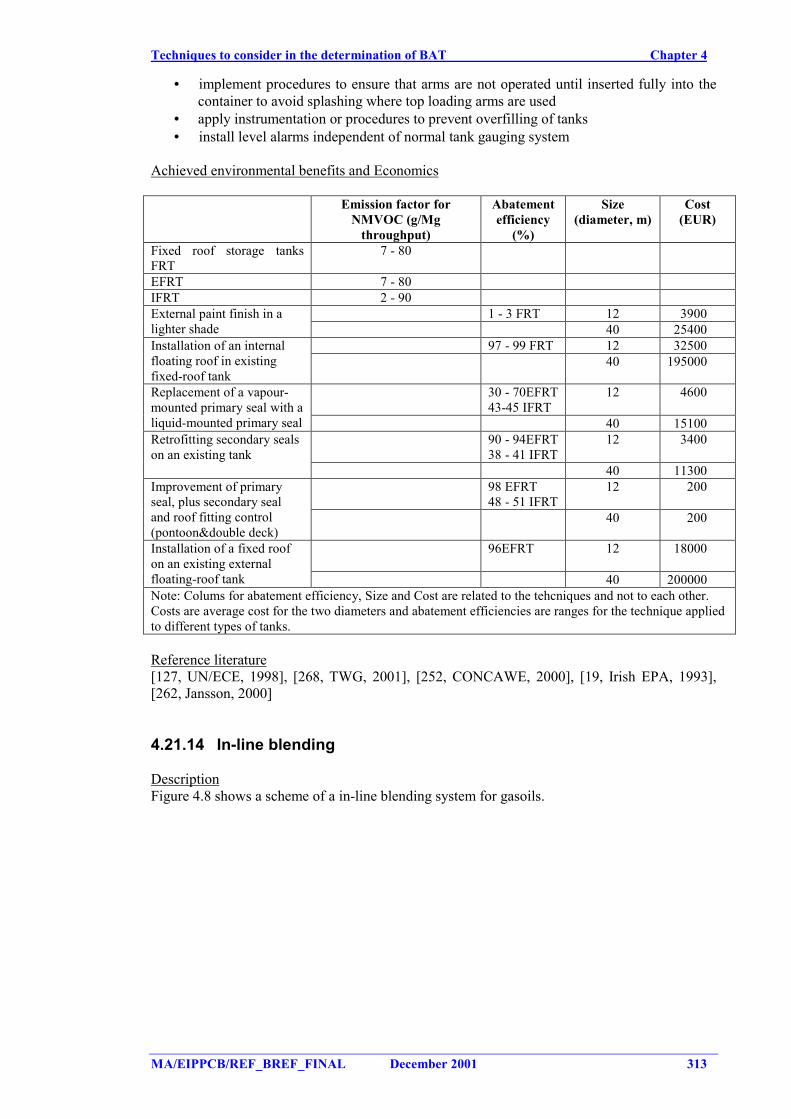
Techniques to consider in the determination of BAT Chapter 4
MA/EIPPCB/REF_BREF_FINAL December 2001 313
• implement procedures to ensure that arms are not operated until inserted fully into thecontainer to avoid splashing where top loading arms are used
• apply instrumentation or procedures to prevent overfilling of tanks• install level alarms independent of normal tank gauging system
Achieved environmental benefits and Economics
Emission factor forNMVOC (g/Mg
throughput)
Abatementefficiency
(%)
Size(diameter, m)
Cost(EUR)
Fixed roof storage tanksFRT
7 - 80
EFRT 7 - 80IFRT 2 - 90
1 - 3 FRT 12 3900External paint finish in alighter shade 40 25400
97 - 99 FRT 12 32500Installation of an internalfloating roof in existingfixed-roof tank
40 195000
30 - 70EFRT43-45 IFRT
12 4600Replacement of a vapour-mounted primary seal with aliquid-mounted primary seal 40 15100
90 - 94EFRT38 - 41 IFRT
12 3400Retrofitting secondary sealson an existing tank
40 1130098 EFRT48 - 51 IFRT
12 200Improvement of primaryseal, plus secondary sealand roof fitting control(pontoon&double deck)
40 200
96EFRT 12 18000Installation of a fixed roofon an existing externalfloating-roof tank 40 200000Note: Colums for abatement efficiency, Size and Cost are related to the tehcniques and not to each other.Costs are average cost for the two diameters and abatement efficiencies are ranges for the technique appliedto different types of tanks.
Reference literature[127, UN/ECE, 1998], [268, TWG, 2001], [252, CONCAWE, 2000], [19, Irish EPA, 1993],[262, Jansson, 2000]
4.21.14 In-line blending
DescriptionFigure 4.8 shows a scheme of a in-line blending system for gasoils.
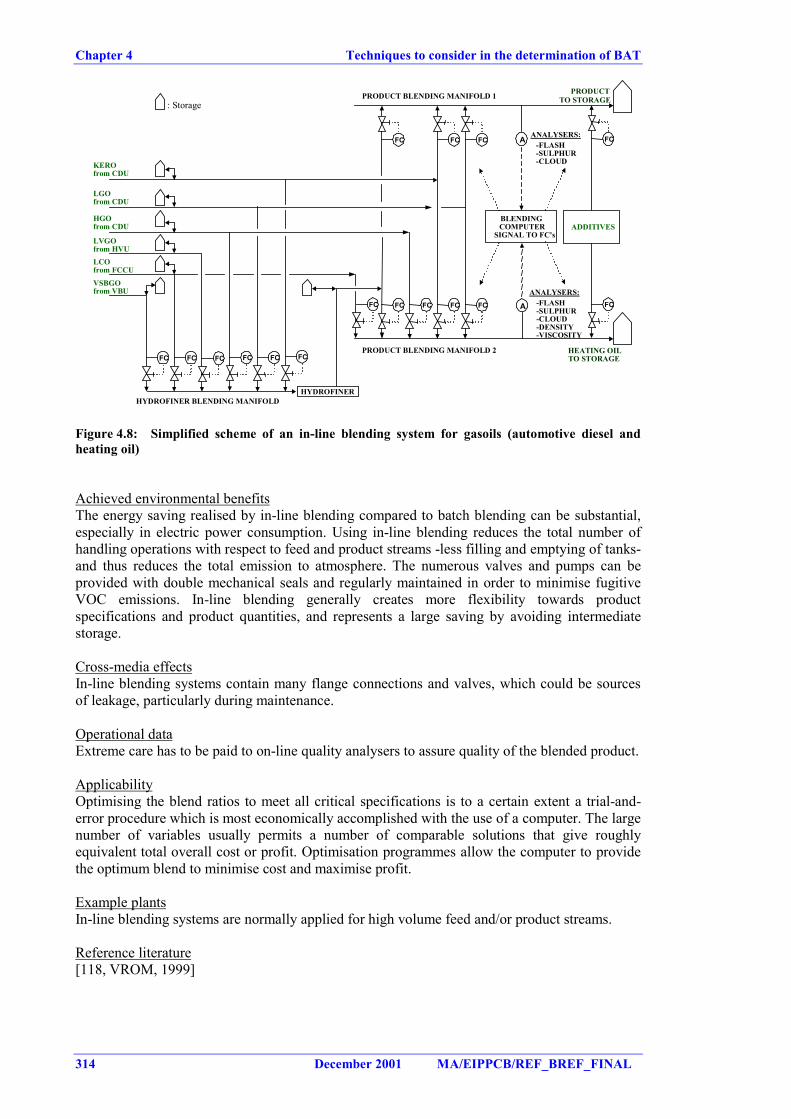
Chapter 4 Techniques to consider in the determination of BAT
314 December 2001 MA/EIPPCB/REF_BREF_FINAL
KEROfrom CDU
LGOfrom CDU
HGOfrom CDU
PRODUCTTO STORAGE
HEATING OILTO STORAGE
PRODUCT BLENDING MANIFOLD 1
PRODUCT BLENDING MANIFOLD 2
FC FC FC
FC FC
LVGOfrom HVULCOfrom FCCU
VSBGOfrom VBU
ADDITIVES
FC
FC
BLENDINGCOMPUTER
SIGNAL TO FC's
FC
FC
FC
FC FC FC FC FC FC
HYDROFINER BLENDING MANIFOLDHYDROFINER
A
A ANALYSERS:-FLASH-SULPHUR-CLOUD
ANALYSERS:-FLASH-SULPHUR-CLOUD-DENSITY-VISCOSITY
: Storage
Figure 4.8: Simplified scheme of an in-line blending system for gasoils (automotive diesel andheating oil)
Achieved environmental benefitsThe energy saving realised by in-line blending compared to batch blending can be substantial,especially in electric power consumption. Using in-line blending reduces the total number ofhandling operations with respect to feed and product streams -less filling and emptying of tanks-and thus reduces the total emission to atmosphere. The numerous valves and pumps can beprovided with double mechanical seals and regularly maintained in order to minimise fugitiveVOC emissions. In-line blending generally creates more flexibility towards productspecifications and product quantities, and represents a large saving by avoiding intermediatestorage.
Cross-media effectsIn-line blending systems contain many flange connections and valves, which could be sourcesof leakage, particularly during maintenance.
Operational dataExtreme care has to be paid to on-line quality analysers to assure quality of the blended product.
ApplicabilityOptimising the blend ratios to meet all critical specifications is to a certain extent a trial-and-error procedure which is most economically accomplished with the use of a computer. The largenumber of variables usually permits a number of comparable solutions that give roughlyequivalent total overall cost or profit. Optimisation programmes allow the computer to providethe optimum blend to minimise cost and maximise profit.
Example plantsIn-line blending systems are normally applied for high volume feed and/or product streams.
Reference literature[118, VROM, 1999]
Techniques to consider in the determination of BAT Chapter 4
MA/EIPPCB/REF_BREF_FINAL December 2001 315
4.21.15 Batch blending
DescriptionSee Section 2.21
ApplicabilityThe reasons for batch blending are the minimum storage requirements for strategic reasons,fiscal and tax control, operating flexibility and tank dimensions.
Example plantsFor a variety of reasons given under applicability, batch blending of feed and product is stilldone to a certain extent.
4.21.16 Vapour recovery
Vapour recovery/destruction systems and vapour return during loading applied to storage areincluded in Section 4.23.6.2.
DescriptionVapour recovery systems, used for the reduction of hydrocarbon emissions from storage andloading facilities of gasoline and other highly volatile products. Displaced vapour containingair/gas from loading of volatile products (such as gasoline or products of similar vapourpressure) into vessels and barges should ideally be recycled or routed through a vapour recoveryunit. The pressure swing adsorption technique is one of a number of techniques to recoverchemical compounds from vapour streams. Examples of these vapour streams are process vents,refinery fuel gas, flare or incinerator feed streams. The units can recover organic compoundsfrom gaseous streams. More information in Section 4.23.6.
Achieved environmental benefitsIt has been estimated that VOC emissions from barge loading can be reduced by 98 % byinstalling a marine vapour loss control system. A vapour recovery unit used in fixed tanks canreduce VOC emissions by 93 - 99 % (down to 10 g/Nm3). Table 4.35 provides some data on theefficiency and environmental performance of vapour recovery units
VOC recovery technique Emission reduction (%) down to (g/Nm3)Single stage 93 - 99 10
Lean oil absorption 90 - 95Activated carbon as adsorbent 95 - 99
Condensation with liquid nitrogen 90Membrane 99
Double stage near 100 % 0.10 - 0.15
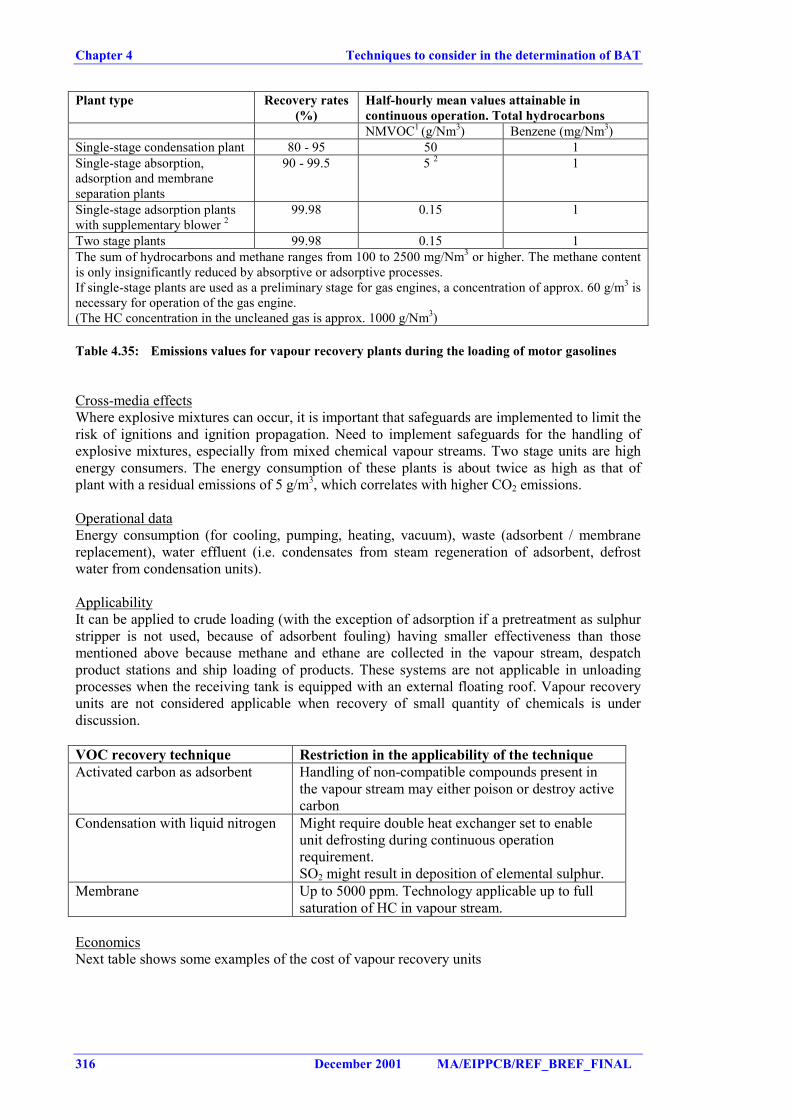
Chapter 4 Techniques to consider in the determination of BAT
316 December 2001 MA/EIPPCB/REF_BREF_FINAL
Plant type Recovery rates(%)
Half-hourly mean values attainable incontinuous operation. Total hydrocarbonsNMVOC1 (g/Nm3) Benzene (mg/Nm3)
Single-stage condensation plant 80 - 95 50 1Single-stage absorption,adsorption and membraneseparation plants
90 - 99.5 5 2 1
Single-stage adsorption plantswith supplementary blower 2
99.98 0.15 1
Two stage plants 99.98 0.15 1The sum of hydrocarbons and methane ranges from 100 to 2500 mg/Nm3 or higher. The methane contentis only insignificantly reduced by absorptive or adsorptive processes.If single-stage plants are used as a preliminary stage for gas engines, a concentration of approx. 60 g/m3 isnecessary for operation of the gas engine.(The HC concentration in the uncleaned gas is approx. 1000 g/Nm3)
Table 4.35: Emissions values for vapour recovery plants during the loading of motor gasolines
Cross-media effectsWhere explosive mixtures can occur, it is important that safeguards are implemented to limit therisk of ignitions and ignition propagation. Need to implement safeguards for the handling ofexplosive mixtures, especially from mixed chemical vapour streams. Two stage units are highenergy consumers. The energy consumption of these plants is about twice as high as that ofplant with a residual emissions of 5 g/m3, which correlates with higher CO2 emissions.
Operational dataEnergy consumption (for cooling, pumping, heating, vacuum), waste (adsorbent / membranereplacement), water effluent (i.e. condensates from steam regeneration of adsorbent, defrostwater from condensation units).
ApplicabilityIt can be applied to crude loading (with the exception of adsorption if a pretreatment as sulphurstripper is not used, because of adsorbent fouling) having smaller effectiveness than thosementioned above because methane and ethane are collected in the vapour stream, despatchproduct stations and ship loading of products. These systems are not applicable in unloadingprocesses when the receiving tank is equipped with an external floating roof. Vapour recoveryunits are not considered applicable when recovery of small quantity of chemicals is underdiscussion.
VOC recovery technique Restriction in the applicability of the techniqueActivated carbon as adsorbent Handling of non-compatible compounds present in
the vapour stream may either poison or destroy activecarbon
Condensation with liquid nitrogen Might require double heat exchanger set to enableunit defrosting during continuous operationrequirement.SO2 might result in deposition of elemental sulphur.
Membrane Up to 5000 ppm. Technology applicable up to fullsaturation of HC in vapour stream.
EconomicsNext table shows some examples of the cost of vapour recovery units
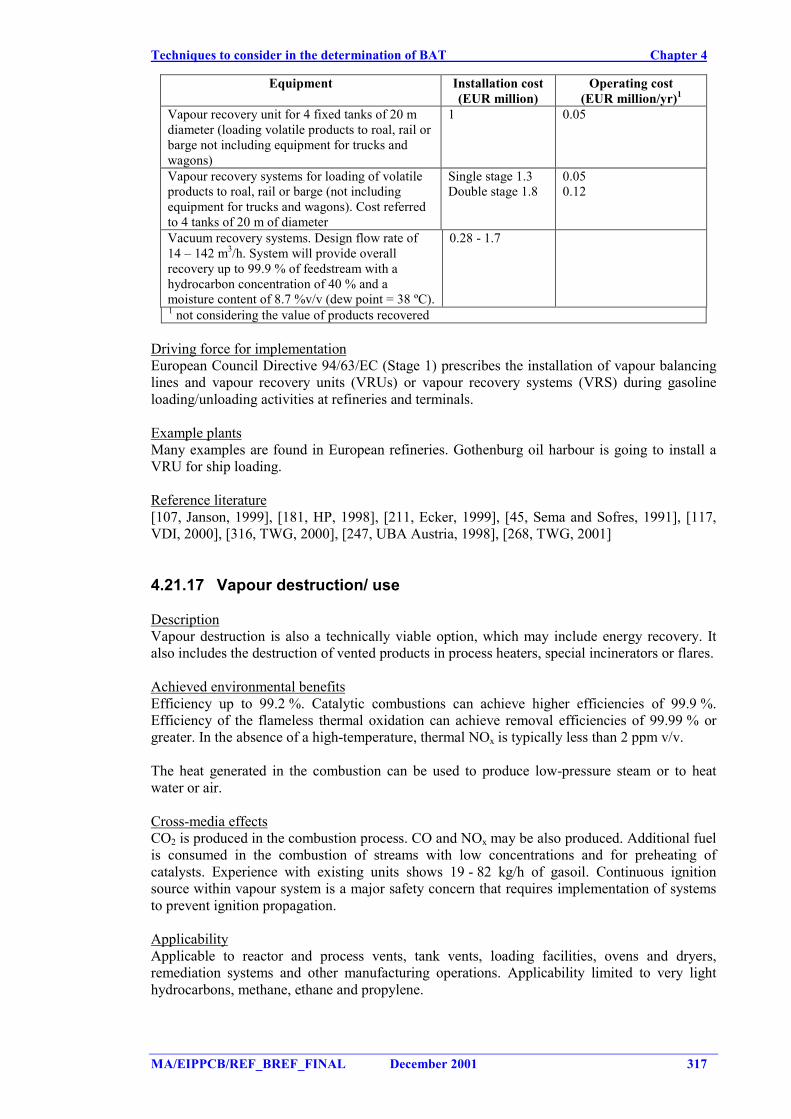
Techniques to consider in the determination of BAT Chapter 4
MA/EIPPCB/REF_BREF_FINAL December 2001 317
Equipment Installation cost(EUR million)
Operating cost(EUR million/yr)1
Vapour recovery unit for 4 fixed tanks of 20 mdiameter (loading volatile products to roal, rail orbarge not including equipment for trucks andwagons)
1 0.05
Vapour recovery systems for loading of volatileproducts to roal, rail or barge (not includingequipment for trucks and wagons). Cost referredto 4 tanks of 20 m of diameter
Single stage 1.3Double stage 1.8
0.050.12
Vacuum recovery systems. Design flow rate of14 – 142 m3/h. System will provide overallrecovery up to 99.9 % of feedstream with ahydrocarbon concentration of 40 % and amoisture content of 8.7 %v/v (dew point = 38 ºC).
0.28 - 1.7
1 not considering the value of products recovered
Driving force for implementationEuropean Council Directive 94/63/EC (Stage 1) prescribes the installation of vapour balancinglines and vapour recovery units (VRUs) or vapour recovery systems (VRS) during gasolineloading/unloading activities at refineries and terminals.
Example plantsMany examples are found in European refineries. Gothenburg oil harbour is going to install aVRU for ship loading.
Reference literature[107, Janson, 1999], [181, HP, 1998], [211, Ecker, 1999], [45, Sema and Sofres, 1991], [117,VDI, 2000], [316, TWG, 2000], [247, UBA Austria, 1998], [268, TWG, 2001]
4.21.17 Vapour destruction/ use
DescriptionVapour destruction is also a technically viable option, which may include energy recovery. Italso includes the destruction of vented products in process heaters, special incinerators or flares.
Achieved environmental benefitsEfficiency up to 99.2 %. Catalytic combustions can achieve higher efficiencies of 99.9 %.Efficiency of the flameless thermal oxidation can achieve removal efficiencies of 99.99 % orgreater. In the absence of a high-temperature, thermal NOx is typically less than 2 ppm v/v.
The heat generated in the combustion can be used to produce low-pressure steam or to heatwater or air.
Cross-media effectsCO2 is produced in the combustion process. CO and NOx may be also produced. Additional fuelis consumed in the combustion of streams with low concentrations and for preheating ofcatalysts. Experience with existing units shows 19 - 82 kg/h of gasoil. Continuous ignitionsource within vapour system is a major safety concern that requires implementation of systemsto prevent ignition propagation.
ApplicabilityApplicable to reactor and process vents, tank vents, loading facilities, ovens and dryers,remediation systems and other manufacturing operations. Applicability limited to very lighthydrocarbons, methane, ethane and propylene.
Chapter 4 Techniques to consider in the determination of BAT
318 December 2001 MA/EIPPCB/REF_BREF_FINAL
EconomicsInvestment Costs (EUR million) 2 - 25 and 3.2 - 16 for marine loading (0.1 - 0.22 EUR million/ship for conversion).Operating Costs: 0.02 - 1.1 EUR millionRetrofit costs are very site-specific.
Driving force for implementationReduce VOC emissions.
Example plantsCatalytic combution processes have been applied in the chemical industry.
Reference literature[181, HP, 1998], [118, VROM, 1999], [268, TWG, 2001]
4.21.18 Vapour balancing during loading processes
DescriptionIn order to prevent emissions to atmosphere from loading operations, several options areavailable. Where loading takes place from fixed roof tanks, a balance line can be used. Theexpelled mixture is then returned to the liquid supply tank and so replaces the pumped-outvolume. Vapours expelled during loading operations may be returned to the loading tank, if it isof the fixed roof type, where it can be stored prior to vapour recovery or destruction. Thissystem can also be used for vessels and barges.
Achieved environmental benefitsThis reduces greatly the vapour volumes expelled to atmosphere. It can reduce emissions by upto 80 % of the VOC emitted.
Cross-media effectsDue to evaporation in the receiving vessel during transfer (vapour evolution by splashing), thereis usually a surplus volume of vapours compared to the displaced liquid volume. The balancingline is not considered an efficient means of VOC-abatement for the most volatile liquids.
Operational dataWhere explosive mixtures can occur, it is important that safeguards are implemented to limit therisk of ignitions and ignition propagation. Tanks should remain closed to prevent emissions, sothey may operate under a low pressure and ullaging and sampling should not be undertakenthrough open dipatches. Detonation arresters require regular cleaning when vapours containparticulates (e.g. soot from badly operated cargo tank inerting systems).
ApplicabilityNot all vapours can be collected. May affect loading rates and operational flexibility. Tankswhich may contain incompatible vapours cannot be linked.
EconomicsInvestment costs are 0.08 EUR million per tank and the operating costs are low.
Driving force for implementationReduce the VOC emissions.
Example plant(s)LPG loading. Subsequent loading of transport containers is carried out by means such as closedloop systems or by venting and release to the refinery fuel gas system.
Techniques to consider in the determination of BAT Chapter 4
MA/EIPPCB/REF_BREF_FINAL December 2001 319
Reference literature[115, CONCAWE, 1999], [268, TWG, 2001]
4.21.19 Bottom loading measures
DescriptionThe loading/unloading pipe is flange-connected to a nozzle situated at the lowest point of thetank. A vent pipe on the tank can be connected to a gas balancing line, VRU or to a vent. In thelast case VOC emissions can occur. The flange connection in the filling line has a special design("dry connection") which enables it to be disconnected with minimum spillage/emissions.
Achieved environmental benefitsIt reduces VOC emissions
Driving force for implementationEuropean Directive 94/63/EC (Stage 1) prescribes for gasoline loading for road tankers.
Reference literature[80, March Consulting Group, 1991], [268, TWG, 2001]
4.21.20 Tightly-sealed floors
DescriptionHandling of materials used in the refinery may result in spills that contaminate soil or rainwater.This technique paves and kerbs the area where materials are handled, for the collection of thepossible spilled material.
Achieved environmental benefitsAvoid soil pollution and direct any spillage of product to slops.This would minimise the volume of waste generated and allow for the collection andreclamation of the material.
Driving force for implementationAvoid soil and rainwater contamination.
Example plantsMany examples can be found in European refineries.
Reference literature[80, March Consulting Group, 1991]
4.21.21 LPG odorant plant
DescriptionThe design and operation of odorising facilities should be to a very high standard whichminimises the risk of odorant leaks or spillages. To an extent, the operational aspects of this arefacilitated by the ease of detection of even the smallest odorant release, but this need to be usedas an aid to vigilance, not as a reason for lax control.
Odorising plants should be designed to minimise the potential for leaks, e.g. by having theminimum number of pumps/valves/filters/tank connections, etc, by using welded, not flanged,connections wherever possible and by protecting the plant from possible impact damage. Allsuch items used need to be designed to a very high standard of sealing efficiency. Devices suchas automatic self-sealing couplings for loading lines are preferred.
Chapter 4 Techniques to consider in the determination of BAT
320 December 2001 MA/EIPPCB/REF_BREF_FINAL
Plants should be designed to deal with the high vapour pressure of odorants and should use inertor pressure controlled natural gas blanketing of the vapour spaces above stored odorant. Duringdeliveries into tanks any displaced vapour need to be returned to the delivery vehicle, adsorbedon activated carbon or incinerated. The use of demountable semi-bulk containers avoids thegeneration of displaced vapours and is preferred where appropriate.
Achieved environmental benefitsIn view of the nature and power of the odorants used there should be no normal release ofodorant to any environmental medium.
Reference literature[18, Irish EPA, 1992]
4.21.22 Overground pipelines and transfer lines
DescriptionIn overground pipelines is easier to detect leakings
Achieved environmental benefitsDecrease the soil contamination
ApplicabilityIts implementation is easier in new installations.
EconomicsThe replacement of existing underground pipelines is typically very expensive.
Reference literature[19, Irish EPA, 1993]
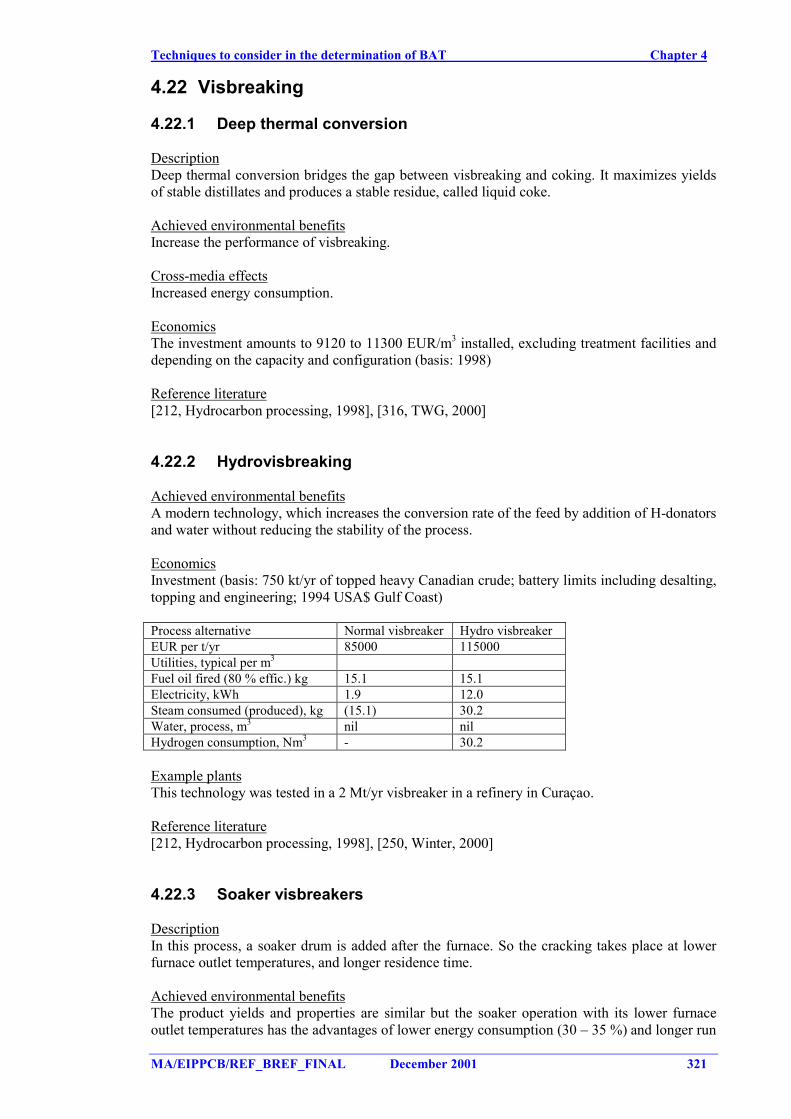
Techniques to consider in the determination of BAT Chapter 4
MA/EIPPCB/REF_BREF_FINAL December 2001 321
4.22 Visbreaking
4.22.1 Deep thermal conversion
DescriptionDeep thermal conversion bridges the gap between visbreaking and coking. It maximizes yieldsof stable distillates and produces a stable residue, called liquid coke.
Achieved environmental benefitsIncrease the performance of visbreaking.
Cross-media effectsIncreased energy consumption.
EconomicsThe investment amounts to 9120 to 11300 EUR/m3 installed, excluding treatment facilities anddepending on the capacity and configuration (basis: 1998)
Reference literature[212, Hydrocarbon processing, 1998], [316, TWG, 2000]
4.22.2 Hydrovisbreaking
Achieved environmental benefitsA modern technology, which increases the conversion rate of the feed by addition of H-donatorsand water without reducing the stability of the process.
EconomicsInvestment (basis: 750 kt/yr of topped heavy Canadian crude; battery limits including desalting,topping and engineering; 1994 USA$ Gulf Coast)
Process alternative Normal visbreaker Hydro visbreakerEUR per t/yr 85000 115000Utilities, typical per m3
Fuel oil fired (80 % effic.) kg 15.1 15.1Electricity, kWh 1.9 12.0Steam consumed (produced), kg (15.1) 30.2Water, process, m3 nil nilHydrogen consumption, Nm3 - 30.2
Example plantsThis technology was tested in a 2 Mt/yr visbreaker in a refinery in Curaçao.
Reference literature[212, Hydrocarbon processing, 1998], [250, Winter, 2000]
4.22.3 Soaker visbreakers
DescriptionIn this process, a soaker drum is added after the furnace. So the cracking takes place at lowerfurnace outlet temperatures, and longer residence time.
Achieved environmental benefitsThe product yields and properties are similar but the soaker operation with its lower furnaceoutlet temperatures has the advantages of lower energy consumption (30 – 35 %) and longer run
Chapter 4 Techniques to consider in the determination of BAT
322 December 2001 MA/EIPPCB/REF_BREF_FINAL
times before shutting down to remove coke from the furnace tubes (run times of 6 - 18 monthsversus 3 - 6 months in coil cracking).
Cross-media effectsThe above apparent advantage to reduce the number of clean-ups for soaker visbreakers is atleast partially balanced by the greater difficulty in cleaning the soaking drum.
Operational dataRun times of 3 - 6 months are common for furnace visbreakers and 6 - 18 months for soakervisbreakers. Fuel consumption is around 11 kg FOE/t. Power and steam consumption is similarto the coil one. Operating temperature is 400 - 420 ºC.
Example plantsSome soaker visbreakers exists in European refineries.
Reference literature[297, Italy, 2000], [268, TWG, 2001]
4.22.4 Sour gas and waste water management
DescriptionThe gas generated in the visbreaking may be sour and contain sulphur compounds, in whichcase a gas sweetening operation, typically amine scrubbing, should be applied before the gas isrecovered into products or used as refinery fuel gas. Visbreaking gas, apart from being aminescrubbed to remove H2S, is further treated to remove approximately 400 to 600 mg/Nm3 ofmercaptan sulphur (depending on feed) in order to meet the refinery fuel gas sulphur-contentspecification.The aqueous condensate is usually sour, and should pass to the sour water stripper in anenclosed system.
Achieved environmental benefitsReduce sulphur content of products.
Cross-media effectsNeed for chemicals and utilities to run the processes.
Driving force for implementationSulphur specifications of the products.
Example plantsThose techniques are applied in many refineries.
Reference literature[316, TWG, 2000]
4.22.5 Reduction of coke formation in visbreakers
DescriptionDuring the thermal cracking some coke formation is produced and deposits in the furnace tubes.The coke should be cleaned when necessary. It exist in the market additives to control thesodium content within the feedstock. Also the control of the addition of caustics to the feedstockupstream can be also used.
Achieved environmental benefitsReduction of the coke formation and as consequence reduction of cleaning waste.

Techniques to consider in the determination of BAT Chapter 4
MA/EIPPCB/REF_BREF_FINAL December 2001 323
Driving force for implementationThis technique is typically applied to prevent cleaning.
Reference literature[268, TWG, 2001]
Chapter 4 Techniques to consider in the determination of BAT
324 December 2001 MA/EIPPCB/REF_BREF_FINAL
4.23 Waste gas treatments
This section together with the following two sections (namely Sections 4.24 and 4.25) aredealing with the end-of-pipe processes that appear in a refinery. Deeper information about thetechniques included in this section and next one can be found in the Common waste water andwastegas treatments BREF. The reason why those techniques are appearing here is to give anoverall description of the techniques and to avoid repetition. Description of end-of-pipetechniques does not appear in the previous sections. In this Sections (23 and 24), generalinformation on environmental benefits, cross-media effects, operational data, applicability isdescribed here. However, the application of those techniques to a certain activity refinery mayvary its operational data, its cost, its performance etc. Consequently the data included in thesesections is broader and more general than the one appearing within the activities.Complementing those techniques that may appear within the production activities, this sectionand the next one also contains end-of-pipe processes applied and that are techniques to considerin the determination of BAT for refineries. Under this category folds the sulphur recovery units,flares, amine treatment or the waste water treatments. Those techniques are only discussed here.
4.23.1 CO abatement techniques
DescriptionCO boilers and catalyst reduction of CO (and NOx). Good primary measures for the COreduction are:• good operation control• constant delivery of liquid fuel in the secondary heating• good mixing of the exhaust gases• catalytic afterburning• catalysts with oxidation promoters.
Achieved environmental benefitsReduction of CO emissions. Emissions after the CO boiler: < 100 mg/Nm3. In the case ofconventional firings a CO concentration below 50 mg/Nm3 is achievable at temperatures above800 °C, at sufficient air delivery and sufficient retention time.
ApplicabilityFCC and in heavy residues fired. (Section 4.10.4.9 and 4.5.5)
Reference literature[316, TWG, 2000]
4.23.2 CO2 emission control options
DescriptionUnlike SO2, NOx or particulates treatment of flue gases, as a feasible abatement technology forCO2 is not available. CO2 separation techniques are available but the problem is the storage andthe recycling of the CO2. Options for the refiner to reduce CO2 emissions are:I. effective energy management (topic discussed in Section 4.10.1) including:
• improving heat exchange between refinery streams• integration of refinery processes to avoid intermediate cooling of components (e.g.
4.19.1 Progressive distillation unit)• recovery of waste gases and their use as fuels (e.g. flare gas recovery)• use of the heat content of flue gases.
II. use of fuels with high hydrogen contents (topic discussed in Section 4.10.2)III. effective energy production techniques (see Section 4.10.3). It means the highest
possible recovery of energy from fuel combustion.
Techniques to consider in the determination of BAT Chapter 4
MA/EIPPCB/REF_BREF_FINAL December 2001 325
Achieved environmental benefitsReduction of CO2 emissions
Cross-media effectsUse of fuels with high hydrogen contents reduce CO2 emissions from the refineries but overallwill not reduce CO2 as these fuels will not then be available for other uses.
Operational dataRational energy use needs good operation to maximise heat recovery and process control (e.g.:O2 excess, heat balances between reflux, product temperature to storage, equipment survey andcleaning). To get optimum results repeated operator training and clear instructions arenecessary.
Reference literature[252, CONCAWE, 2000], [268, TWG, 2001]
4.23.3 NOx abatement techniques
The NOx emission level of an oil refinery or a natural gas plant is influenced by the refiningscheme, the type of fuels used and the abatement techniques implemented. As the number ofemission sources and their contribution to the overall emission level may vary greatly, one ofthe first techniques to consider is the precise quantification and characterisation of the emissionsources in each specific case. For more information see Section 3.26.
4.23.3.1 Low-temperature NOx oxidation
DescriptionThe low-temperature oxidation process injects ozone into a flue gas stream at optimaltemperatures below 200 ºC, to oxidise insoluble NO and NO2 to highly soluble N2O5. The N2O5is removed in a wet scrubber by forming a dilute nitric acid waste water that can be used inplant processes or neutralised for release. General information about this technique can be foundin Waste water and wastegas BREF [312, EIPPCB, 2001]
Achieved environmental benefitsIt can achieve 90 - 95 % removal of NOx, with consistent NOx levels as low as 5 ppm.Additional benefits are the heat-recovery fuel savings. The entire process is controlled toproduce no secondary gaseous emissions. Because ozone is used as oxidant agent, emissions ofCO, VOC and ammonia are also reduced.
Cross-media effectsOzone should be produced on site, on demand, from stored O2. Risk of ozone slip. The systemcan increase nitrate concentration in the waste water.
Operational dataThe use of ozone and the low optimal temperatures of the process provide stable treatmentconditions. Energy consumption for the production of ozone range from 7 - 10 MJ/kg (2 – 2.8kWh/kg) of ozone produced with a concentration of 1-3 % w/w with dry oxygen feed.Temperature should be below 160 ºC to minimise ozone decomposition. Heavy particulateladen fuels may require additional equipment.
ApplicabilityIt can be used as a stand-alone treatment system or can follow other combustion modificationsand post-combustion treatment systems, such as low-NOx burners, SCR or SOx removal, as afinal polish step. The process can be used either as a “stand alone”treatment system or as a
Chapter 4 Techniques to consider in the determination of BAT
326 December 2001 MA/EIPPCB/REF_BREF_FINAL
retrofit to existing plant. It can also be used as a polishing system to other NOx removaltechnologies and for the treatment of ammonia slips.
EconomicsIt requires low maintenance and low operator interface. The relative capital cost and operatingcosts given by technology providers claim that are equal to, or less than SCR-type systems.
Example plantsThe process is in use on USA commercial installation for sectors as acid pickling, steam boilersand coal fired boilers. A demonstration is currently planned on a refinery FCCU.
Driving force for implementationReduce the NOx emissions.
Reference literature[181, HP, 1998], [344, Crowther, 2001], [268, TWG, 2001]
4.23.3.2 Selective Non-Catalytic Reduction (SNCR)
DescriptionSNCR is a non-catalytic process for removing oxides of nitrogen from the flue gas by gas phasereaction of ammonia or urea at high temperature. General information about this technique canbe found in Waste water and wastegas BREF [312, EIPPCB, 2001]
Achieved environmental benefitsReductions of 40 - 70 % can be achieved giving values of less than 200 mg/Nm3 by the use ofthis technique. Higher reduction figures (up to 80 %) can only be achieved under optimalconditions.
Cross-media effectsAmmonia injection produces significantly less N2O and CO emissions than other reagents.When the temperature lower it is needed to reheat-up the flue gas with the consequent use ofenergy. The systems also need the equipment necessary for the storage of ammonia or urea.Disadvantages are also NH3 slip (5 - 40 mg/Nm3) and possible side reactions (N2O). The U.S.EPA identified ammonia as the single largest precursor of fine particulate (2.5 microns in sizeand smaller) air pollution in the country.
Operational dataSNCR process needs to achieve temperatures of 800 ºC to 1200 ºC for efficient conversion.With the injection of hydrogen along with the NH3 and carrier, optimum temperatures can beshifted to as low as 700 ºC. To achieve good mixing, the small amount of reactant is injectedalong with a carrier gas, usually air or steam. The ammonia produced in the sour water stripping(see Section 4.24.2) can be used as denox agent. The effectiveness of this process is verytemperature dependent.
ApplicabilityIt is typically applied to flue gases from heaters and boilers. No or very small spacerequirements. Space requirements are mainly restricted to NH3 storage.
EconomicsCost considerations include the initial capital costs for modifying the furnace or boiler, piping toinject the reactant, the reactant supply system and a recurring cost for ammonia or urea to reactwith the NOx. Cost estimates for the use of an SNCR after a power plant are reported in theSection 4.10.4.6. The following table gives cost effectiveness of the use of SNCR underdifferent conditions
Techniques to consider in the determination of BAT Chapter 4
MA/EIPPCB/REF_BREF_FINAL December 2001 327
SNCR on Cost effectiveness EUR/tonne NOxremoved (includes capital charge 15%)
Fired heaters and boilers firing refinery blend gas 2000-25001800-4300
Boilers firing Residual fuel oil 1500-28001500-4300
Fluid catalytic cracking units 1900Details on the conditions are given in Annex IV
Driving force for implementationReduction of nitrogen oxide emissions
Example plantsApplied to FCCs and boilers
Reference literature[211, Ecker, 1999], [302, UBA Germany, 2000], [115, CONCAWE, 1999], [181, HP, 1998],[247, UBA Austria, 1998], [268, TWG, 2001]
4.23.3.3 Selective catalytic reduction (SCR)
DescriptionA further deNOx technique is known as catalytic deNOx. The ammonia vapour is mixed with theflue gas through an injection grid before being passed through a catalyst to complete thereaction. Various catalyst formulations are available for different temperature ranges: zeolitesfor 300 - 500 °C, traditional base metals employed between 200 - 400 °C, for low temperatureapplications 150 - 300 °C metals and activated carbon are used. More information about thistechnique can be found in the Waste gas BREF [312, EIPPCB, 2001]
Achieved environmental benefitsIt is especially suitable for situations where emission standards are strict. With SCR removalefficiencies of 80 to 95 % can be obtained. Residual NOx stack levels of 10 - 20 mg/Nm3 can beobtained by application of SCR in gas fired boilers and furnaces. When firing heavy residuesemissions of < 100 mg/Nm3 (3% O2, half hourly mean value, efficiencies up to 90 %) can beachieved.
Cross-media effectsSCR has some cross-media effects as NH3 slip of less than <2 – 20 mg/Nm3 depending on theapplication and requirements or sulphate aerosols are controllable to very low levels. SCRoperation at the end of its catalyst life may also entail bigger slip of NH3. This means aconstraint in conversion efficiency. The U.S. EPA identified ammonia as the single largestprecursor of fine particulate (2.5 microns in size and smaller) air pollution in the country. N2Ogeneration can occur with some catalysts. At the end of its life, some components of the catalystcan be recycled and the other are dispose.
Operational dataThe ammonia produced in the sour water stripping (see Section 4.24.2) can be used as denoxagent. The catalytic deNOx, process operates at low temperatures (250 ºC to 450 ºC). Operatorand maintenance requirements are low for clean gas applications. More attention is required forapplications where fouling substances like SO3 and soot or dust are present in the off-gas. Thepresence of SO3 will lead to formation of ammonium sulphates, which have a detrimental effecton the activity of the catalyst and lead to fouling of downstream heat exchangers. Howeversulphate deactivation can be avoided with a relevant temperature control. Reactivation of thecatalyst can be executed by heating at 400°C, to counteract fouling a water washing step isgenerally applied. Soot has to be removed by blowing of the catalyst with steam or inert gas
Chapter 4 Techniques to consider in the determination of BAT
328 December 2001 MA/EIPPCB/REF_BREF_FINAL
(e.g. nitrogen), while a ‘dummy’ layer can optionally be applied for extra protection of thecatalyst. If the flue gas contain particulates containing metals, metal deactivation may occur.The NH3 consumption is directly related to the NOx concentration in the flue gas and amounts toabout 0.4 tonne NH3 per tonne of NOx removed. The amount of ammonia is normally dosify ina 10 % more than the stoquiometric needs. The catalyst has a lifetime of 4 to 7 years for oilfiring, for gas firing 7 to 10 years. The pressure drop of the catalyst bed will lead to a minoramount of additional power consumption from fans in the system or loss of efficiency in case ofa gasturbine application (equivalent to 0.5 - 1 % of the heat-input). Additional fuel in the eventof reheating the flue gas is necessary, corresponding to a loss of energy efficiency of 1 - 2 %.Common safety precautions need to be taken when using pure NH3. To avoid elaborate safetymeasures (required for larger volumes of NH3) the trend is towards using aqueous NH3 or urea.The NH3 storage also varies in size allowing 1 - 3 week operational hold-up.
When a so-called tail-end configuration is preferred (e.g. where the SCR is projected behind awet scrubber, or at the end of a gasfired unit where the flue gas has reached a temperature ofless than 150°C), it may be necessary to reheat the flue gases to have an adequate temperaturefor the reduction reaction. For these applications in-line burners are required. If the requiredtemperature rise is larger than 70 - 100°C heat recuperation by means of a gas-to-gas heatexchanger could be cost-effective.
ApplicabilitySelective catalytic reduction (SCR) has been applied to combustion flue gases or process off-gases (e.g. FCC). The introduction of an SCR-system into an existing installation is a challengedue to space, pressure and temperature problems. Creative solutions can often be found toreduce the retrofit costs. Higher operating temperatures reduce the catalyst size and costs butintroduce retrofit complexity. Lower operating temperatures increase the required catalystvolume and costs but often allow a simple retrofit.
Sofar, predominantly operating temperatures between 200 and 450°C prevail. Thesetemperatures are normally available before the economiser section or the air preheater of aboiler. Gas fired refinery furnaces generally have a stack temperature of 150 - 300°C.Dependent on the flue gas sulphur content a medium (MT) or low temperature (LT) catalystscan be applied in tail-end configuration. Zeolite type catalysts have reached the market place. Inthe USA a number of gas turbines have been fitted with these catalysts, some other applicationsalso exist (the DESONOX process, a combined technique for SO2 and NOx removal, has suchcatalyst). As for oil firing, only MT catalysts can be applied, because of the presence of sulphurand particulates. MT catalysts have been widely applied in coal fired power plantspredominantly at conditions where the flue gas still contain all the fly-ash and SO2 from theboiler. Two other configurations are low dust / high SO2 level and low dust / low SO2 level (tail-end configuration). There is little experience with the use of SCR for units applying vacuumresidue as fuel. However, the power plant of the refinery Mider in Germany uses vacuumresidue, visbreaker residue and FCC-slurry as fuel in its three oil-fired heaters. A SCR-plant inhigh dust configuration is installed after the heaters, cleaning the gas of NOx to concentrationless than 150 mg/Nm3. The particular difference oil firing represent, lies in the nature of its flyash. In contrast to coal, the fly ash is extremely fine (> 90 % fall in the category of PM2.5),though the quantity is much less. The composition is also quite different. Coal fly ashpredominantly consists of silica compounds, with a minimum of unburnt HCs. Oil fly ashcontains metal oxides, soot and coke. Unabated fly-ash concentrations for oil firing are in therange of 100 - 600 mg/Nm3 (with highest values for vacuum residues). SCR applied under theseconditions may suffer from clogging by fly ash and sulphates (at coal firing the fly ash by itssandblasting effect keeps the catalyst clean). The potential for sulphate precipitation is generallyhigher with vacuum residue, due to its high sulphur content (2.5 - 4 %).
Pressure drop can be an important consideration as to whether SCR can be applied to a flue gassystem. For this reason natural draft furnaces could probably not be fitted with it.
See Section 4.23.8 for combined flue gas desulphurisation and deNOxing.
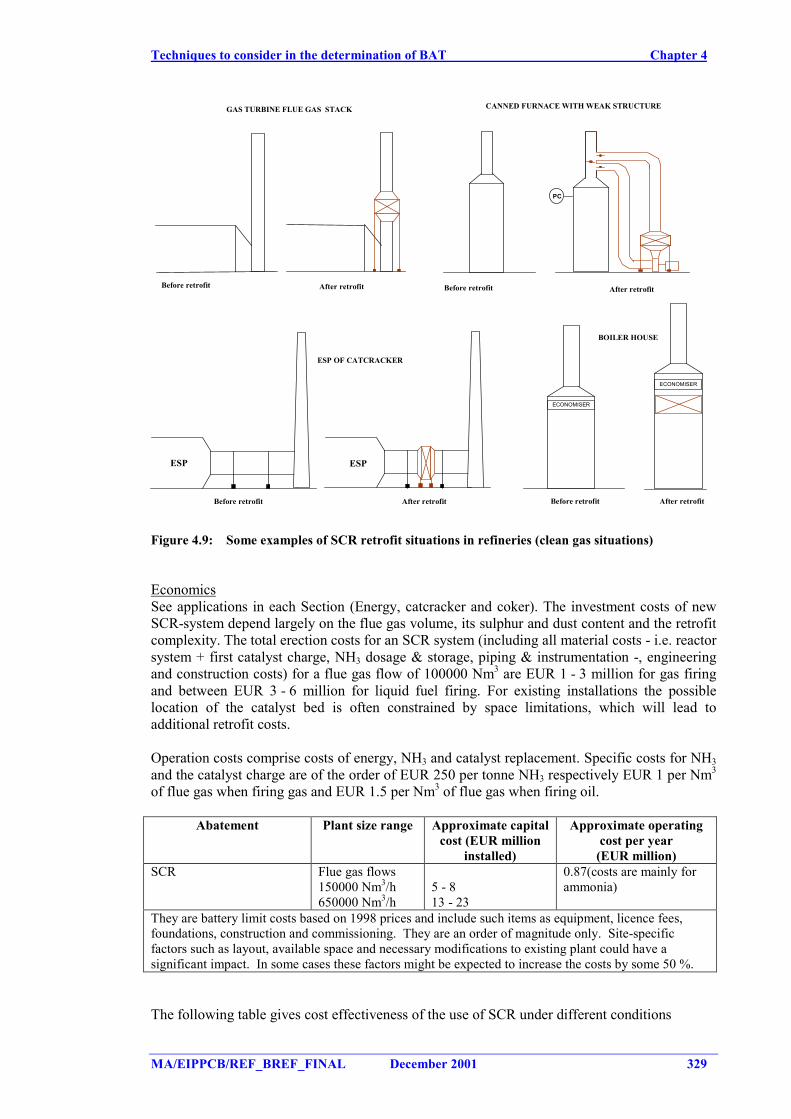
Techniques to consider in the determination of BAT Chapter 4
MA/EIPPCB/REF_BREF_FINAL December 2001 329
CANNED FURNACE WITH WEAK STRUCTUREGAS TURBINE FLUE GAS STACK
After retrofitBefore retrofit
PC
After retrofitBefore retrofit
ESP OF CATCRACKER
ESP
After retrofitBefore retrofit
ECONOMISER
ECONOMISER
BOILER HOUSE
After retrofitBefore retrofit
ESP
Figure 4.9: Some examples of SCR retrofit situations in refineries (clean gas situations)
EconomicsSee applications in each Section (Energy, catcracker and coker). The investment costs of newSCR-system depend largely on the flue gas volume, its sulphur and dust content and the retrofitcomplexity. The total erection costs for an SCR system (including all material costs - i.e. reactorsystem + first catalyst charge, NH3 dosage & storage, piping & instrumentation -, engineeringand construction costs) for a flue gas flow of 100000 Nm3 are EUR 1 - 3 million for gas firingand between EUR 3 - 6 million for liquid fuel firing. For existing installations the possiblelocation of the catalyst bed is often constrained by space limitations, which will lead toadditional retrofit costs.
Operation costs comprise costs of energy, NH3 and catalyst replacement. Specific costs for NH3and the catalyst charge are of the order of EUR 250 per tonne NH3 respectively EUR 1 per Nm3
of flue gas when firing gas and EUR 1.5 per Nm3 of flue gas when firing oil.
Abatement Plant size range Approximate capitalcost (EUR million
installed)
Approximate operatingcost per year
(EUR million)SCR Flue gas flows
150000 Nm3/h650000 Nm3/h
5 - 813 - 23
0.87(costs are mainly forammonia)
They are battery limit costs based on 1998 prices and include such items as equipment, licence fees,foundations, construction and commissioning. They are an order of magnitude only. Site-specificfactors such as layout, available space and necessary modifications to existing plant could have asignificant impact. In some cases these factors might be expected to increase the costs by some 50 %.
The following table gives cost effectiveness of the use of SCR under different conditions
Chapter 4 Techniques to consider in the determination of BAT
330 December 2001 MA/EIPPCB/REF_BREF_FINAL
SCR Cost effectiveness EUR/tonne NOx removed(includes capital charge 15%)
Fired heaters and boilers firing refinery blend gas 8300-980012000
4200-9000Boilers firing Residual fuel oil 5000-8000
4500-10200Gas Turbines firing Natural or refinery blend gas 1700-8000
Fluid catalytic cracking units 2800-3300Details on the conditions are given in Annex IV
Driving force for implementationReduction of NOx emissions
Example plantsIt has been applied to FCC off-gases, gas turbines, process boilers, process heaters. SCR hasbeen applied successfully on a large variety of applications: coal and oil fired power plants,waste incineration plants, diesel and gas engines, gas turbine plants, steam boilers and refineryfurnaces (such us naphtha reformers, steam reformers, crude and vacuum distillations units,thermal cracking and hydroprocessing units) and FCC plants. Some examples are shown inFigure 4.9. Less experience is available with flue gas from firing high-sulphur residual oil.
SCR is used extensively on power plant in Japan, Germany, Austria and on gas turbine plant inNetherlands, California in the USA- SCR are also widely used in waste incineration plants. Todate, SCR has been sucessfully applied worldwide in refinery processes as power plants and theFCCs. For example, at refineries in Japan, SCR applications are common. In Europeanrefineries, more than 6 applications have been found (Austria, the Netherlands and Sweden).
Reference literature[302, UBA Germany, 2000], [211, Ecker, 1999], [118, VROM, 1999], [257, Gilbert, 2000],[175, Constructors, 1998], [181, HP, 1998], [115, CONCAWE, 1999], [268, TWG, 2001]
4.23.4 Particulates
PM emissions from refinery units entail particles present in the flue gas from furnaces,particularly soot, catalyst fines emitted from FCC regeneration units and other catalyst basedprocesses, the handling of coke and coke fines and ash generated during incineration of sludges.Particulates generated in the refinery contain metals. Then, a reduction in the particules contentreduces the metal emissions from the refinery. The particles may range in size from largemolecules, measuring a few tenths of a nanometer, to the coarse dusts arising from the attritionof catalyst. Distinction is usually made between aerosols, < 1 - 3 µm and larger dust particles.The avoidance of fine particulates < 10 µm (PM10) is particularly important for health reasons.
The available dust removal techniques can be subdivided into dry and wet techniques or acombination of the two. The usually at refineries applied techniques for dust emission reductionare briefly discussed below. Dry techniques are cyclones, electrofilters and filtration and wettechniques are wet scrubbers and washers. More information can be found in the waste gasBREF [312, EIPPCB, 2001].
Techniques to consider in the determination of BAT Chapter 4
MA/EIPPCB/REF_BREF_FINAL December 2001 331
4.23.4.1 Cyclones
DescriptionThe principle of cyclone separation is based on centrifugal force, whereby the particle isseparated from the carrier gas. More information can be found in the waste gas BREF [312,EIPPCB, 2001].
Achieved environmental benefitsCyclones are used to reduce dust concentrations to the 100 - 500 mg/Nm3 range. A novelcyclone design, called the rotating particulate separator (RPS), is able to effectively removeparticles > 1 µm, this design, however, has a limited capacity compared to the conventionalcyclone. Third cyclone achieve 90 % reduction of particulate emissions (100 - 400 mg/Nm3).Modern multicyclones used as third stage cyclones achieves 80 % reduction of particulateemissions to about 50 mg/m3. Particulate concentrations below 50 mg/Nm3 are only achievablein combination with specific catalysts.
Cross-media effectsA reduction of the environmental impact is best achieved if a useful outlet is found for thecollected solid dust material. Dust collection is essentially a shift of an air emission problem to awaste problem.
Operational dataCyclones can be designed for high temperature and pressure operation. Dust collectionequipment is normally simple to operate and fully automated. For the dry separation no utilitiesare needed. For dust removal normally no additives are used. Sometimes the collected dustneeds rewetting to avoid spreading of dust during handling.
ApplicabilityMulti-cyclones as employed in FCC-units, cokers are not able to remove fine particulate matter(PM10 = dust <10 µm) and therefore they are mainly used as pre-separation step.
Driving force for implementationProcess gas streams must often be cleaned up to prevent contamination of catalysts or products,and to avoid damage to equipment, such as compressors. Toxic and other hazardous substances(e.g. coke fines and heavy metal containing cat fines) have to be removed to comply with air-pollution regulations and for reasons of hygiene.
Example plantsIn refineries multi-cyclones and ESPs are employed in FCC-, heavy oil and residue crackerunits.
Reference literature[250, Winter, 2000], [118, VROM, 1999]
4.23.4.2 Electrofilters (ESP)
DescriptionThe basic principle of operation of electrofilters (Electro-Static Precipitator, ESP) is simple. Thegas is ionised in passing between a high-voltage electrode and an earthed (grounded) electrode;the dust particles become charged and are attracted to the earthed electrode. The precipitateddust is removed from the electrodes mechanically, usually by vibration, or by washing in socalled wet electrofilters.
Chapter 4 Techniques to consider in the determination of BAT
332 December 2001 MA/EIPPCB/REF_BREF_FINAL
Achieved environmental benefitsESP are capable of collecting bulk quantities of dust including very fine particles, <2 µm, athigh efficiencies. ESP can achieve values of 5 - 50 mg/Nm3 (95 % reduction or higher withhigher inlet concentration only)
Cross-media effectsHigh voltage in an ESP introduces a new safety risk in refineries. A reduction of theenvironmental impact is best achieved if a useful outlet is found for the collected solid dustmaterial. Dust collection is essentially a shift of an air emission problem to a waste problem.
Operational dataAn ESP uses some electricity. For dust removal normally no additives are used. Sometimes thecollected dust needs rewetting to avoid spreading of dust during handling.
ApplicabilityApplication of ESPs can be found in FCC-units, FGD processes, power plants and incinerators.It may not be applicable for some particulates with high electric resistance. They typically canbe installed in new and existing plants.
EconomicsAbatement Plant size range Approximate capital
cost (EUR millioninstalled)
Approximate operatingcost per year
(EUR million)Electrostatic precipitator Flue gas flows
150000 Nm3/h650000 Nm3/h
1.94.4
0.16
They are battery limit costs based on 1998 prices and include such items as equipment, licence fees,foundations, contruction and commissioning. They are an order of magnitude only. Site-specific factorssuch as layout, available space and necessary modifications to existing plant could have a significantimpact. In some cases these factors might be expected to increase the costs by some 50 %.
Operating costs are in the order of EUR0.5 to 10 per 1000 Nm3 treated flue gas. Inclusion offines disposal costs gives figures 2.5 - 3 times higher than the ones specified in the above tableand 10 times higher the operating cost.
Driving force for implementationProcess gas streams must often be cleaned up to prevent contamination of catalysts or products,and to avoid damage to equipment, such as compressors. Toxic and other hazardous substances(e.g. coke fines and heavy metal containing cat fines) have to be removed to comply with air-pollution regulations and for reasons of hygiene.
Example plantsIn refineries multi-cyclones and ESPs are employed in FCC-, heavy oil and residue crackerunits.
Reference literature[250, Winter, 2000], [118, VROM, 1999]
4.23.4.3 Filtration
DescriptionFabric filters
Achieved environmental benefitsFabric filters can achieve values less than 5 mg/Nm3
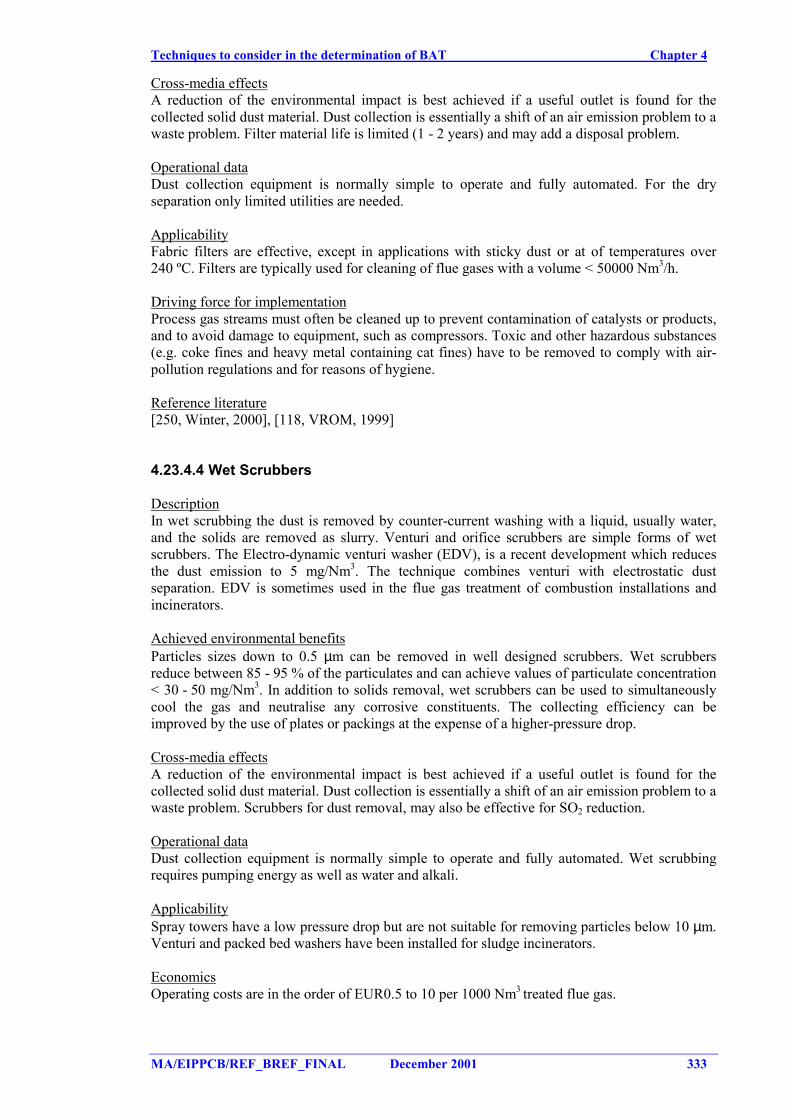
Techniques to consider in the determination of BAT Chapter 4
MA/EIPPCB/REF_BREF_FINAL December 2001 333
Cross-media effectsA reduction of the environmental impact is best achieved if a useful outlet is found for thecollected solid dust material. Dust collection is essentially a shift of an air emission problem to awaste problem. Filter material life is limited (1 - 2 years) and may add a disposal problem.
Operational dataDust collection equipment is normally simple to operate and fully automated. For the dryseparation only limited utilities are needed.
ApplicabilityFabric filters are effective, except in applications with sticky dust or at of temperatures over240 ºC. Filters are typically used for cleaning of flue gases with a volume < 50000 Nm3/h.
Driving force for implementationProcess gas streams must often be cleaned up to prevent contamination of catalysts or products,and to avoid damage to equipment, such as compressors. Toxic and other hazardous substances(e.g. coke fines and heavy metal containing cat fines) have to be removed to comply with air-pollution regulations and for reasons of hygiene.
Reference literature[250, Winter, 2000], [118, VROM, 1999]
4.23.4.4 Wet Scrubbers
DescriptionIn wet scrubbing the dust is removed by counter-current washing with a liquid, usually water,and the solids are removed as slurry. Venturi and orifice scrubbers are simple forms of wetscrubbers. The Electro-dynamic venturi washer (EDV), is a recent development which reducesthe dust emission to 5 mg/Nm3. The technique combines venturi with electrostatic dustseparation. EDV is sometimes used in the flue gas treatment of combustion installations andincinerators.
Achieved environmental benefitsParticles sizes down to 0.5 µm can be removed in well designed scrubbers. Wet scrubbersreduce between 85 - 95 % of the particulates and can achieve values of particulate concentration< 30 - 50 mg/Nm3. In addition to solids removal, wet scrubbers can be used to simultaneouslycool the gas and neutralise any corrosive constituents. The collecting efficiency can beimproved by the use of plates or packings at the expense of a higher-pressure drop.
Cross-media effectsA reduction of the environmental impact is best achieved if a useful outlet is found for thecollected solid dust material. Dust collection is essentially a shift of an air emission problem to awaste problem. Scrubbers for dust removal, may also be effective for SO2 reduction.
Operational dataDust collection equipment is normally simple to operate and fully automated. Wet scrubbingrequires pumping energy as well as water and alkali.
ApplicabilitySpray towers have a low pressure drop but are not suitable for removing particles below 10 µm.Venturi and packed bed washers have been installed for sludge incinerators.
EconomicsOperating costs are in the order of EUR0.5 to 10 per 1000 Nm3 treated flue gas.
Chapter 4 Techniques to consider in the determination of BAT
334 December 2001 MA/EIPPCB/REF_BREF_FINAL
Driving force for implementationProcess gas streams must often be cleaned up to prevent contamination of catalysts or products,and to avoid damage to equipment, such as compressors. Toxic and other hazardous substances(e.g. coke fines and heavy metal containing cat fines) have to be removed to comply with air-pollution regulations and for reasons of hygiene.
Example plantsSome FCC-units are equipped with scrubbers.
Reference literature[250, Winter, 2000], [118, VROM, 1999]
4.23.4.5 Washers
DescriptionVentury washers.Centrifugal washers combine the cyclone principle and an intensive contact with water, like theventuri washer.
Achieved environmental benefitsDust emissions can be reduced to 50 mg/Nm3 and below if very large quantities of water areused such as in an absorber used in a two stage scrubbing system.Dependent on the operating pressure and the construction, dust emissions can be reduced below10 mg/Nm3 with centrifugal washers or ventury washers.
Operational dataDust collection equipment is normally simple to operate and fully automated.Venturi washers, need to be operated at sufficient pressure and at full water saturation of the gasphase to reduce the dust emission.
ApplicabilityWash columns, or absorbers with packing are applied in various processes.
Driving force for implementationProcess gas streams must often be cleaned up to prevent contamination of catalysts or products,and to avoid damage to equipment, such as compressors. Toxic and other hazardous substances(e.g. coke fines and heavy metal containing cat fines) have to be removed to comply with air-pollution regulations and for reasons of hygiene.
Example plantsVentury washers: they are mostly applied for removal of a combination of dust, acidiccomponents (HCl and HF) at for example cokers and incinerators. For SO2 removal scrubbing atpH ± 6 with caustic or lime is necessary.
Reference literature[118, VROM, 1999]
4.23.4.6 Combination of particulate abatement techniques
Often a combination of techniques is applied, such as cyclone/ESP, ESP/venturi/wash columnor a cyclone/venturi/absorber leading to >99 % dust elimination.
Techniques to consider in the determination of BAT Chapter 4
MA/EIPPCB/REF_BREF_FINAL December 2001 335
4.23.5 Sulphur management system
Sulphur is an inherent component of crude oil. Part of this sulphur leaves the refinery in itsproducts, part of it is emitted to the atmosphere (already described in all the processes) and partof it is recovered by some processes located in the refinery for this purpose (more informationabout the sulphur split in a refinery in Section 1.4.1). Sulphur is an environmental issue thatcannot be addressed in an integrated manner if sulphur coming out with the products is notconsidered. In other words, decreasing emissions from a refinery may result in the production offuels (products) that may later be burned in a way that is not environmentally efficient, therebyjeopardising the environmental effort made in refineries.
Because it is such an integrated issue, proper sulphur management (See Annex VI) should alsoconsider other topics that are not within the objectives of this document. For example, a globalenvironmental impact assessment of sulphur dioxide emissions should contain:
1. Atmospheric emissions from processes generating SOx (furnaces, boilers, FCC, etc.). Thoseissues are in fact included in this document in each of the process sections.
2. Atmospheric emissions from sulphur recovery units or of gases containing sulphur in anH2S form before incineration. This category of sulphur is normally recovered, as shown inSection 4.23.5.2.
3. Atmospheric emissions generated by sulphur contained in products for which morestringent specifications already exist, such as gasolines, gasoils, etc. Those emissions cannotbe considered here because they do not fall within the scope of IPPC legislation, but theyshould be considered as part of an integrated approach.
4. Atmospheric emissions generated by products with less stringent specifications (bunkers,coke, heavy fuel oil). Typically, those products (heavy residues) contain high quantities ofsulphur. If they are not used in a proper way from the environmental point of view, theemissions can jeopardise the integrated approach to reducing sulphur emissions from therefinery sector. Another threat to this integrated approach is the exporting of those productsto countries with less environmental control.
5. Sulphur contained in non-fuel products such as bitumen or lubricants is typically notidentified as a problem.
In principle refiners have the following options and combinations thereof to reduce the SO2emissions of the refinery:• increase the use of non sulphur containing gas (LPG, natural gas, etc.) discussed in
Section 4.10 Energy system• to lower the sulphur content of the fuels used (reduce the H2S content in the refinery fuel
gas with amine treating Section 4.23.5.1, gasification of heavy fuels Section 4.10,hydrotreatment of fuels in Section 4.13.2 )
• to use low sulphur crudes discussed in Sections 4.10 Energy system• increase the efficiency of the SRU discussed in Section 4.23.5.2 Sulphur recovery units
(SRU)• to apply end-of-pipe techniques to capture the SO2 from the fumes (namely flue gas
desulphurisation(FGD)) (those techniques are the ones discussed in Section 4.23.5.4andhave been considered in Sections 4.5 Catalytic cracking and 4.10 Energy system).
• reduce SO2 emission from typically small contributors whey they become significantpart of the total emission. For example in the case of gas refineries, the overall picture ofthe sulphur emissions change because small contributors in liquid-fired refineriesbecome significant.
In this section, only those processes dealing with the recovery of sulphur is going to beconsidered. Between 17 to 53 % (average 36 %) of the sulphur is recovered in European
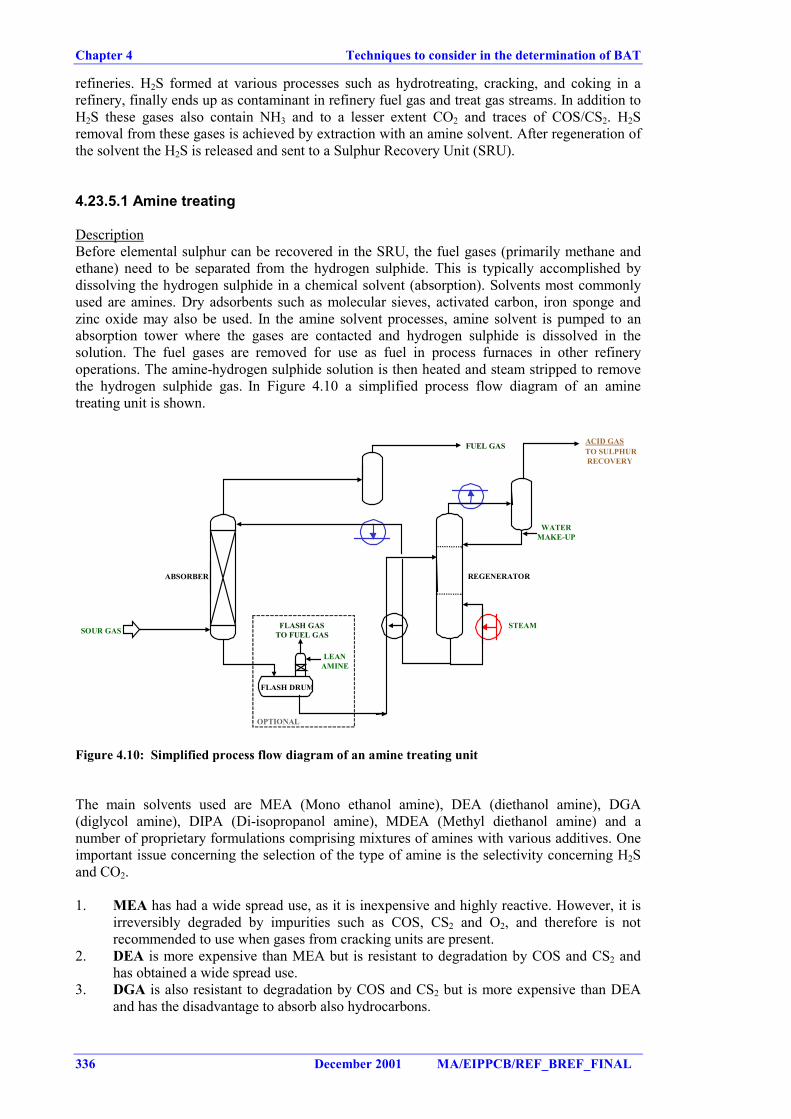
Chapter 4 Techniques to consider in the determination of BAT
336 December 2001 MA/EIPPCB/REF_BREF_FINAL
refineries. H2S formed at various processes such as hydrotreating, cracking, and coking in arefinery, finally ends up as contaminant in refinery fuel gas and treat gas streams. In addition toH2S these gases also contain NH3 and to a lesser extent CO2 and traces of COS/CS2. H2Sremoval from these gases is achieved by extraction with an amine solvent. After regeneration ofthe solvent the H2S is released and sent to a Sulphur Recovery Unit (SRU).
4.23.5.1 Amine treating
DescriptionBefore elemental sulphur can be recovered in the SRU, the fuel gases (primarily methane andethane) need to be separated from the hydrogen sulphide. This is typically accomplished bydissolving the hydrogen sulphide in a chemical solvent (absorption). Solvents most commonlyused are amines. Dry adsorbents such as molecular sieves, activated carbon, iron sponge andzinc oxide may also be used. In the amine solvent processes, amine solvent is pumped to anabsorption tower where the gases are contacted and hydrogen sulphide is dissolved in thesolution. The fuel gases are removed for use as fuel in process furnaces in other refineryoperations. The amine-hydrogen sulphide solution is then heated and steam stripped to removethe hydrogen sulphide gas. In Figure 4.10 a simplified process flow diagram of an aminetreating unit is shown.
STEAM
REGENERATOR
WATERMAKE-UP
FUEL GAS ACID GASTO SULPHUR RECOVERY
FLASH DRUM
LEANAMINE
FLASH GASTO FUEL GASSOUR GAS
ABSORBER
OPTIONAL
Figure 4.10: Simplified process flow diagram of an amine treating unit
The main solvents used are MEA (Mono ethanol amine), DEA (diethanol amine), DGA(diglycol amine), DIPA (Di-isopropanol amine), MDEA (Methyl diethanol amine) and anumber of proprietary formulations comprising mixtures of amines with various additives. Oneimportant issue concerning the selection of the type of amine is the selectivity concerning H2Sand CO2.
1. MEA has had a wide spread use, as it is inexpensive and highly reactive. However, it isirreversibly degraded by impurities such as COS, CS2 and O2, and therefore is notrecommended to use when gases from cracking units are present.
2. DEA is more expensive than MEA but is resistant to degradation by COS and CS2 andhas obtained a wide spread use.
3. DGA is also resistant to degradation by COS and CS2 but is more expensive than DEAand has the disadvantage to absorb also hydrocarbons.
Techniques to consider in the determination of BAT Chapter 4
MA/EIPPCB/REF_BREF_FINAL December 2001 337
4. DIPA, which is used in the ADIP process, licensed by Shell. It can be used for selectiveH2S removal in the presence of CO2 and is also effective in removing COS and CS2.
5. MDEA is nowadays most widely used, MDEA has a similar characteristic as DIPA, i.e. ithas a high selectivity to H2S, but not to CO2. As MDEA is used as a 40 - 50 % solution(activated MDEA) in water, this has also potential energy savings. Because of the lowselectivity for CO2 absorption DIPA and MDEA are very suitable for use in Claus Tailgasamine absorbers, as these do not tend to recycle CO2 over the Claus unit. MDEA isapplied as a single solvent or as in proprietary formulation comprising mixtures.
Achieved environmental benefitsSulphur is removed from a number of refinery process off-gas streams (sour gas or acid gas) inorder to meet the SOx emissions limits of the applicable regulation and to recover saleableelemental sulphur. The amine treating unit produces two streams for further use/processing indownstream units:• The treated gas stream usually can contain between 20 and 200 mg/Nm3 H2S (H2S content
depends on absorber operating pressure; at only 3.5 bar H2S level is 80 – 140. At higherpressures as 20 bars the H2S level is around 20).
• The concentrated H2S/acid gas stream is routed to the SRU for sulphur recovery (discussedin next Section 4.23.5.2).
Cross-media effects
Source Flow Composition CommentsEffluent:amineblow down
Amineregenerator
10 - 50 t/yrfor a 5 Mt/yrrefinery
Decomposed amine upto 50 % in water
In order not to disturb thebiotreater operation and tomeet effluent dischargespecifications on N-Kj anstorage tank or productionplanning can be used tocontrol very small flow to theWWTP
Waste 1: Amine filtercleaning residue
plantspecific
FeS and salt deposits Removed by skid mountedunit operated by a specialisedcontractor (usually the filtersupplier)
Waste 2: Saturatedactivated carbonfrom skidmounted unit
plantspecific
Decompositionproducts, heavy endsand amine emulsions
The saturated activated carbonfilling has to be replacedoccasionally for disposal orregeneration
Operational dataThe use of selective amines should be considered, e.g. for a stream containing carbon dioxide.Measures should be taken to minimise hydrocarbons entering the sulphur recovery system;operation of regenerator feed drums should be controlled to prevent hydrocarbon accumulationin, and sudden release from, the amine regenerator as this is likely to lead to an emergency shut-down of the SRU.
Utility consumption per tonne of H2S removed in an amine treating unit is approximately:
Electricity (kWh/t) Steam consumed (kg/t) Cooling water (m3/t, ∆T =10°C)70 – 80 1500 - 3000 25 - 35
Usually a fresh solvent make up rate of 10 - 50 t/yr is required to maintain solvent strength for a5 Mt/yr refinery.
Amine solutions should be re-used wherever possible and where necessary, suitably treatedbefore disposal which should not be to land. Recycling of monoethanoleamine-solutions:
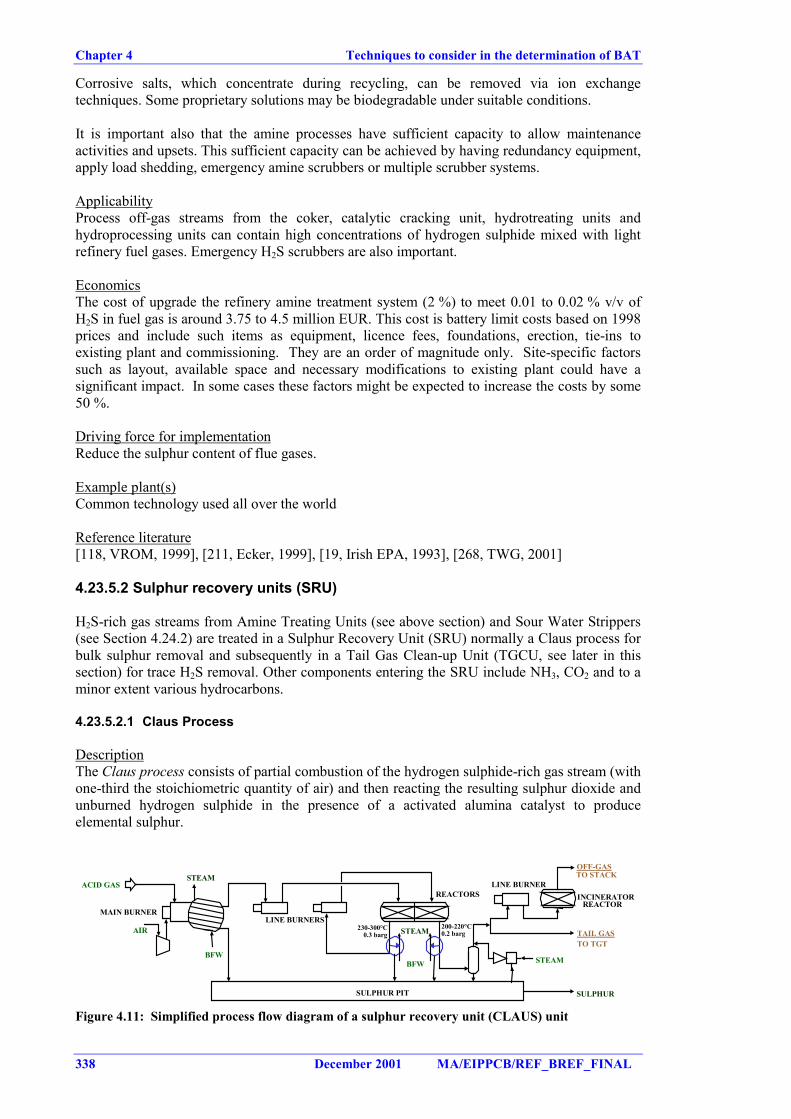
Chapter 4 Techniques to consider in the determination of BAT
338 December 2001 MA/EIPPCB/REF_BREF_FINAL
Corrosive salts, which concentrate during recycling, can be removed via ion exchangetechniques. Some proprietary solutions may be biodegradable under suitable conditions.
It is important also that the amine processes have sufficient capacity to allow maintenanceactivities and upsets. This sufficient capacity can be achieved by having redundancy equipment,apply load shedding, emergency amine scrubbers or multiple scrubber systems.
ApplicabilityProcess off-gas streams from the coker, catalytic cracking unit, hydrotreating units andhydroprocessing units can contain high concentrations of hydrogen sulphide mixed with lightrefinery fuel gases. Emergency H2S scrubbers are also important.
EconomicsThe cost of upgrade the refinery amine treatment system (2 %) to meet 0.01 to 0.02 % v/v ofH2S in fuel gas is around 3.75 to 4.5 million EUR. This cost is battery limit costs based on 1998prices and include such items as equipment, licence fees, foundations, erection, tie-ins toexisting plant and commissioning. They are an order of magnitude only. Site-specific factorssuch as layout, available space and necessary modifications to existing plant could have asignificant impact. In some cases these factors might be expected to increase the costs by some50 %.
Driving force for implementationReduce the sulphur content of flue gases.
Example plant(s)Common technology used all over the world
Reference literature[118, VROM, 1999], [211, Ecker, 1999], [19, Irish EPA, 1993], [268, TWG, 2001]
4.23.5.2 Sulphur recovery units (SRU)
H2S-rich gas streams from Amine Treating Units (see above section) and Sour Water Strippers(see Section 4.24.2) are treated in a Sulphur Recovery Unit (SRU) normally a Claus process forbulk sulphur removal and subsequently in a Tail Gas Clean-up Unit (TGCU, see later in thissection) for trace H2S removal. Other components entering the SRU include NH3, CO2 and to aminor extent various hydrocarbons.
4.23.5.2.1 Claus Process
DescriptionThe Claus process consists of partial combustion of the hydrogen sulphide-rich gas stream (withone-third the stoichiometric quantity of air) and then reacting the resulting sulphur dioxide andunburned hydrogen sulphide in the presence of a activated alumina catalyst to produceelemental sulphur.
ACID GAS
AIR
MAIN BURNER
BFW
STEAM
LINE BURNERS
REACTORSLINE BURNER
TAIL GAS TO TGT
STEAM
SULPHURSULPHUR PIT
STEAM
BFW
230-300°C0.3 barg
200-220°C0.2 barg
INCINERATORREACTOR
OFF-GASTO STACK
Figure 4.11: Simplified process flow diagram of a sulphur recovery unit (CLAUS) unit
Techniques to consider in the determination of BAT Chapter 4
MA/EIPPCB/REF_BREF_FINAL December 2001 339
The capacity of the Claus plants can be increased with the use of oxygen instead of air(OxyClaus process) however this has not any beneficial effect in the efficiency of the Clausplant. Use of this process increase capacity up to 200 % in existing Claus sulphur recoveryunits, or for a more economical design of Claus sulphur units.
Achieved environmental benefits
Number of Claus reactors Efficiency (%H2S converted)1 902 94 - 963 97 - 98
Table 4.36: Efficiencies of the Claus process
Cross-media effects
Emissions based on 20000 t/yr SRUSource Flow Composition
min/maxComments
Emissions:CO2, SO2,NOx
Incineratoroff-gas
0.2 % of totalH2S-load tothe SRU
SO2 1500mg/Nm3 Throughpresence of NH3non-catalyticdeNOxing takesplace
Amount of SO2 released dependson total sulphur production andoverall sulphur recovery
Effluent: Knock-out drum forwater in SWS off-gas
0.02 m3/h H2S: 50 mg/l;Phenol: 100 mg/l;NH3: 2000 mg/l
To be treated in the SWS
Waste Spent SRU catalyst plant specific Mainly Al2O3
The reduction of SO2 leads to an increase of the CO2 emission. For example for a 100 t/dsulphur claus plant, the application of three reactors would lead to an emission of 4.8 tonnes ofsulphur per day at a cost of 8.5 tonnes of CO2 per day.
Operational data• Feed/air ratio control, temperature control of the furnace, reactors and condensers and good
demisting of liquid sulphur, especially from the final condenser exit gas stream areimportant parameters in obtaining maximum sulphur recovery. Good control andavailability is crucial as a technique, to deliver any design targets. In this line, the use ofstate-of-the-art control and monitoring systems can be seen as an important technique. Useof a tail gas analyser linked to the process control system (feedback control) will aidoptimum conversion during all plant operating conditions, including changes to sulphurthroughput
• To have a SRU configuration with sufficient capacity for the H2S feed to the unit includingthe sourest crude oil to be used is important. The duplication of the SRU capacity isimportant to consider to obtain low sulphur emissions. This enough capacity also shouldconsider to allow the scheduled maintenance activity to proceed every two years, without asignificant increase of sulphur emissions.
• To have utilisation factors close to 100% increase how efficient the units are used. Thosecapacity factors should plan also major turnaround maintenance.
• use a good furnace burning-zone design and effective furnace temperature and oxygencontrol systems where sour water stripper off-gases are a feed stream, because the processmust also be designed and operated to complete the destruction of ammonia. Ammoniabreakthrough may lead to deposition and blockages of catalyst beds by ammonium salts (egcarbonate/sulphate) and these SRUs need to be monitored for evidence of this.
The utilities necessary in the SRU are summarised in next table
Chapter 4 Techniques to consider in the determination of BAT
340 December 2001 MA/EIPPCB/REF_BREF_FINAL
Fuel (MJ/t) Electricity(kWh/t)
Steam produced(kg/t)
Cooling water(m3/t, ∆T=10 °C)
1000 – 1600 60 - 75 1500 - 2000 0 - 20
In some cases, the SRU need a pilot flame when the H2S concentration is so low that a stableflame cannot be achieved.
ApplicabilityFully applicable
EconomicsAbatement Plant size
rangeApproximatecapital cost
(EUR millioninstalled)
Approximateoperating cost peryear (EUR million)
Upgrade SRU with O2 enrichment toincrease throughput from100 t/d to 170 t/d.
100 t/d 2.1 - 5.3 1.6 (costs are foroxygen)
They are battery limit costs based on 1998 prices and include such items as equipment, licence fees,foundations, erection, tie-ins to existing plant and commissioning. They are an order of magnitude only.Site-specific factors such as layout, available space and necessary modifications to existing plant couldhave a significant impact. In some cases these factors might be expected to increase the costs by some50 %.
Another example of the upgrade of SRU with oxygen enrichment (Oxyclaus)Economics: For a reference 200 tpd sulphur recovery unit (Claus and tail gas unit) requiring99.9 % overall sulphur recovery, capital cost savings of $2 - 3 million are achievable withoxygen enrichment as compared to an air only design. Based on typical pipeline oxygen costs of$35 per tonne, even if oxygen enrichment were used 100 % of the time, it would take over8 years for oxygen costs to equal the increamental capital saving.
Example of the economics of the installation of a third Claus reactor.Capacity of process: 30000 t/yr sulphur production (sulphur recovery efficiency 94 - 96 % for atwo stage unit); Volume of gas: 60 million m3/yr; Pollutant initial concentration: 34000 mgSO2/m3 (1.2 % molar or 2.3 % weight, rest considered as air) The investment cost to build a newthird reactors is between EUR 2 and 3 millions and the operating cost around EUR 0.1 millionper year.
Driving force for implementationReduction of sulphur emissions
Example plantsIn the market, it exists more than 5 licensors of this process. The Claus process is public domainand virtually applied at any refinery. Two stages Claus process is the most common in Europe.More than 30 Oxyclaus systems are in operation in the world.
Reference literature[250, Winter, 2000], [258, Manduzio, 2000], [115, CONCAWE, 1999], [45, Sema and Sofres,1991], [181, HP, 1998], [114, Ademe, 1999]
4.23.5.2.2 Tail Gas Treatment Unit (TGTU)
DescriptionCurrent methods for removing sulphur from the hydrogen sulphide gas streams are typically acombination of two processes: the Claus process (See section above) followed by a tail gasclean-up or treatment unit. Since the Claus process by itself removes about 96 % (2 stages) ofthe hydrogen sulphide in the gas stream, the TGTU processes are often used to further recoversulphur.
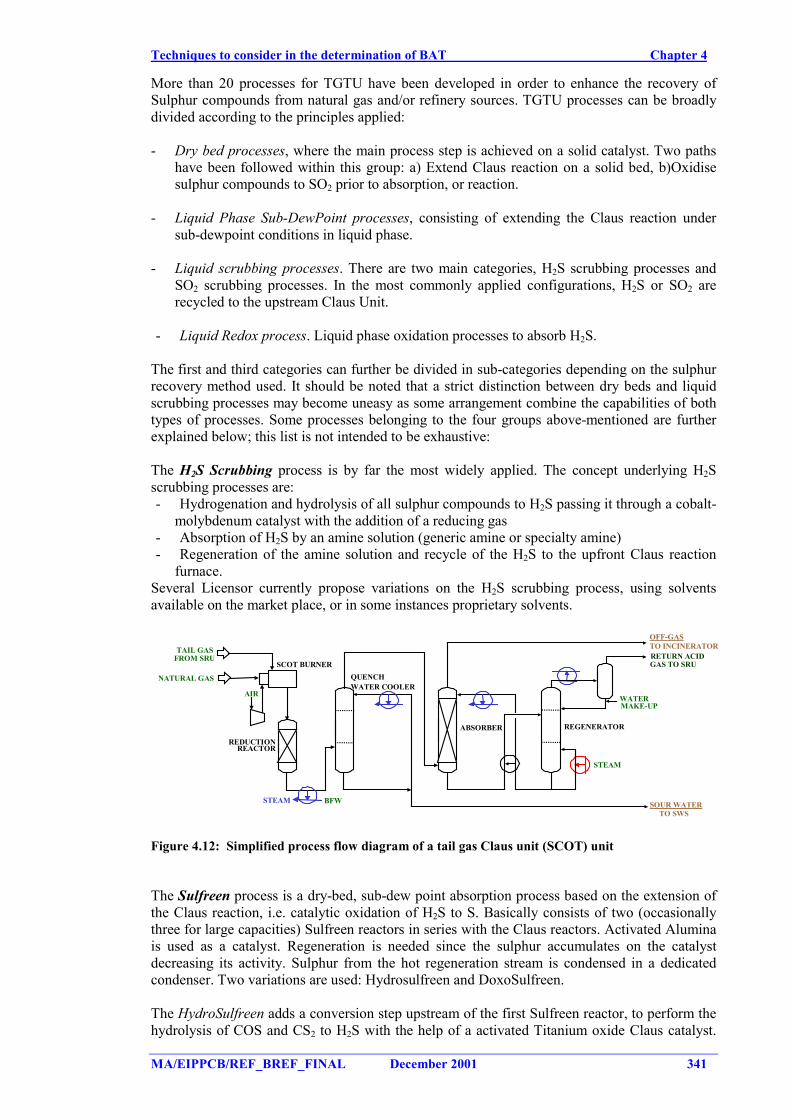
Techniques to consider in the determination of BAT Chapter 4
MA/EIPPCB/REF_BREF_FINAL December 2001 341
More than 20 processes for TGTU have been developed in order to enhance the recovery ofSulphur compounds from natural gas and/or refinery sources. TGTU processes can be broadlydivided according to the principles applied:
- Dry bed processes, where the main process step is achieved on a solid catalyst. Two pathshave been followed within this group: a) Extend Claus reaction on a solid bed, b)Oxidisesulphur compounds to SO2 prior to absorption, or reaction.
- Liquid Phase Sub-DewPoint processes, consisting of extending the Claus reaction undersub-dewpoint conditions in liquid phase.
- Liquid scrubbing processes. There are two main categories, H2S scrubbing processes andSO2 scrubbing processes. In the most commonly applied configurations, H2S or SO2 arerecycled to the upstream Claus Unit.
- Liquid Redox process. Liquid phase oxidation processes to absorb H2S.
The first and third categories can further be divided in sub-categories depending on the sulphurrecovery method used. It should be noted that a strict distinction between dry beds and liquidscrubbing processes may become uneasy as some arrangement combine the capabilities of bothtypes of processes. Some processes belonging to the four groups above-mentioned are furtherexplained below; this list is not intended to be exhaustive:
The H2S Scrubbing process is by far the most widely applied. The concept underlying H2Sscrubbing processes are:- Hydrogenation and hydrolysis of all sulphur compounds to H2S passing it through a cobalt-
molybdenum catalyst with the addition of a reducing gas- Absorption of H2S by an amine solution (generic amine or specialty amine)- Regeneration of the amine solution and recycle of the H2S to the upfront Claus reaction
furnace.Several Licensor currently propose variations on the H2S scrubbing process, using solventsavailable on the market place, or in some instances proprietary solvents.
STEAM
ABSORBER REGENERATOR
WATERMAKE-UP
RETURN ACIDGAS TO SRU
QUENCHWATER COOLER
REDUCTIONREACTOR
STEAM BFW
TAIL GASFROM SRU
SCOT BURNER
OFF-GASTO INCINERATOR
AIR
SOUR WATERTO SWS
NATURAL GAS
Figure 4.12: Simplified process flow diagram of a tail gas Claus unit (SCOT) unit
The Sulfreen process is a dry-bed, sub-dew point absorption process based on the extension ofthe Claus reaction, i.e. catalytic oxidation of H2S to S. Basically consists of two (occasionallythree for large capacities) Sulfreen reactors in series with the Claus reactors. Activated Aluminais used as a catalyst. Regeneration is needed since the sulphur accumulates on the catalystdecreasing its activity. Sulphur from the hot regeneration stream is condensed in a dedicatedcondenser. Two variations are used: Hydrosulfreen and DoxoSulfreen.
The HydroSulfreen adds a conversion step upstream of the first Sulfreen reactor, to perform thehydrolysis of COS and CS2 to H2S with the help of a activated Titanium oxide Claus catalyst.
Chapter 4 Techniques to consider in the determination of BAT
342 December 2001 MA/EIPPCB/REF_BREF_FINAL
The Claus reaction takes place in the HydroSulfreen reactor and produced sulphur is condensedin a dedicated condenser
The DoxoSulfreen concept is based on two ideas: the upstream units are operated to get a slightexcess of H2S, compared to the quantity necessary to maintain the Claus ratio, therefore a nearlytotal SO2 conversion takes place on the conventional Sulfreen catalyst; then the remaining H2Sis directly oxidised to elemental Sulphur
In the Beaven process, the hydrogen sulphide in the relatively low concentration gas streamfrom the Claus process can be almost completely removed by absorption in a quinone solution.The dissolved hydrogen sulphide is oxidized to form a mixture of elemental sulphur and hydro-quinone. The solution is injected with air or oxygen to oxidize the hydro-quinone back toquinone. The solution is then filtered or centrifuged to remove the sulphur and the quinone isthen re-used. The Beaven process is also effective in removing small amounts of sulphurdioxide, carbonyl sulphide, and carbon disulphide that are not affected by the Claus process.These compounds are first converted to hydrogen sulphide at elevated temperatures in a cobaltmolybdate catalyst prior to being fed to the Beaven unit.
The CBA (cold bed absorption), process is very similar to the Sulfreen process except in thefact that the CBA process uses a hot process stream indigenous to the Claus process toaccomplish regeneration of the sulphur loaded catalyst bed. The hot process stream is part of theeffluent of the first Claus reactor. Several configurations are available depending on the numberof Claus converters.
The Clauspol is a process where the tail gas is put in contact with a solvent (polyethyleneglycol) and the reaction of H2S and SO2 is catalysed by a dissolved catalysts. (sodium salt of aninorganic acid) which is a solvent for H2S and SO2, but not for liquid sulphur.The Claus reactioncan therefore proceed at low temperature (120 °C) and is shifted further to the right as theproduced sulphur is removed from the reaction medium, as it is not soluble and separates.
The Superclaus process is based on two principles:- Operating the Claus plant with excess H2S to minimise the SO2 content in the Claus tail gas.
This feature simplifies and makes more flexible the air ratio control.- Selective oxidation of the remaining H2S in the Claus tail gas by means of specific catalyst
which efficiently convert the remaining H2S in the presence of water vapour and excessoxygen to elemental sulphur only.
This reaction takes place in a specific converter (oxidation reactor), downstream of a two orthree reactors traditional Claus unit. The catalyst used is an alumina based catalyst coated withiron oxide and chromium oxide layers.
The LO-CAT process. Absorption and regeneration are performed in a single vessel divided intwo sections: the centerwell and the outer space where aeration with air is performed. Thepurpose of the Centerwell is to separate the sulphite ions from air in order to minimize by-product formation (e.g. thiosulphate). The difference in aeration (and therefore of density)between the centerwell and the outer space give sufficient driving force for solution circulationbetween the absorption and the regeneration zones without the need of a specific pump. The lasttype of processing scheme is called the “aerobic unit” and is used to treat air contaminated withH2S. All reactions take place in the same vessel, at the expense of increased by-productformation, but with the advantage of a reduced capital cost.
The SO2 abatement from the Claus plant is a process that uses a physical scrubbing mechanismto remove SO2 from the incinerated tail gas of a Claus plant. The recovered SO2 is recycled tothe inlet of the Claus plant unit.
Achieved environmental benefitsTail gas treatment units increase the overall recovery of H2S decreasing the sulphur emissionsfrom the refinery. For example, if a refinery has a 100 t/d SRU, with a two stage Claus reactor
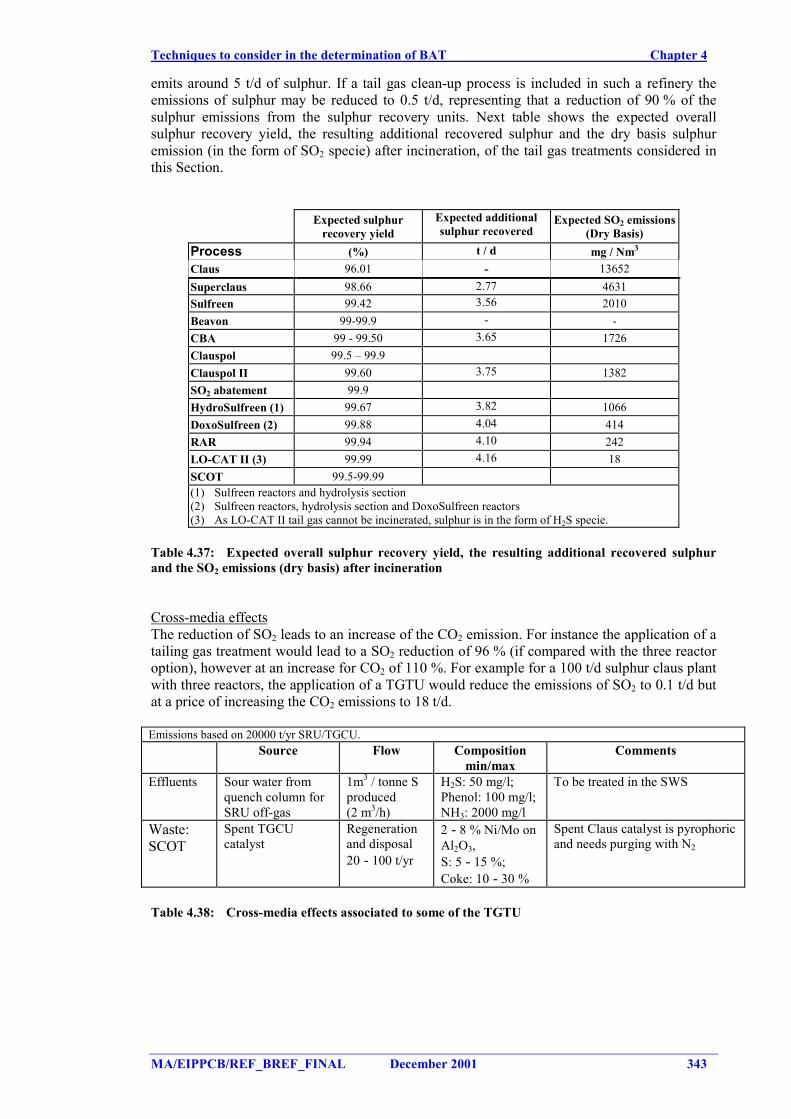
Techniques to consider in the determination of BAT Chapter 4
MA/EIPPCB/REF_BREF_FINAL December 2001 343
emits around 5 t/d of sulphur. If a tail gas clean-up process is included in such a refinery theemissions of sulphur may be reduced to 0.5 t/d, representing that a reduction of 90 % of thesulphur emissions from the sulphur recovery units. Next table shows the expected overallsulphur recovery yield, the resulting additional recovered sulphur and the dry basis sulphuremission (in the form of SO2 specie) after incineration, of the tail gas treatments considered inthis Section.
Expected sulphurrecovery yield
Expected additionalsulphur recovered
Expected SO2 emissions(Dry Basis)
Process (%) t / d mg / Nm3
Claus 96.01 - 13652Superclaus 98.66 2.77 4631Sulfreen 99.42 3.56 2010Beavon 99-99.9 - -CBA 99 - 99.50 3.65 1726Clauspol 99.5 – 99.9Clauspol II 99.60 3.75 1382SO2 abatement 99.9HydroSulfreen (1) 99.67 3.82 1066DoxoSulfreen (2) 99.88 4.04 414RAR 99.94 4.10 242LO-CAT II (3) 99.99 4.16 18SCOT 99.5-99.99(1) Sulfreen reactors and hydrolysis section(2) Sulfreen reactors, hydrolysis section and DoxoSulfreen reactors(3) As LO-CAT II tail gas cannot be incinerated, sulphur is in the form of H2S specie.
Table 4.37: Expected overall sulphur recovery yield, the resulting additional recovered sulphurand the SO2 emissions (dry basis) after incineration
Cross-media effectsThe reduction of SO2 leads to an increase of the CO2 emission. For instance the application of atailing gas treatment would lead to a SO2 reduction of 96 % (if compared with the three reactoroption), however at an increase for CO2 of 110 %. For example for a 100 t/d sulphur claus plantwith three reactors, the application of a TGTU would reduce the emissions of SO2 to 0.1 t/d butat a price of increasing the CO2 emissions to 18 t/d.
Emissions based on 20000 t/yr SRU/TGCU.Source Flow Composition
min/maxComments
Effluents Sour water fromquench column forSRU off-gas
1m3 / tonne Sproduced(2 m3/h)
H2S: 50 mg/l;Phenol: 100 mg/l;NH3: 2000 mg/l
To be treated in the SWS
Waste:SCOT
Spent TGCUcatalyst
Regenerationand disposal20 - 100 t/yr
2 - 8 % Ni/Mo onAl2O3,S: 5 - 15 %;Coke: 10 - 30 %
Spent Claus catalyst is pyrophoricand needs purging with N2
Table 4.38: Cross-media effects associated to some of the TGTU
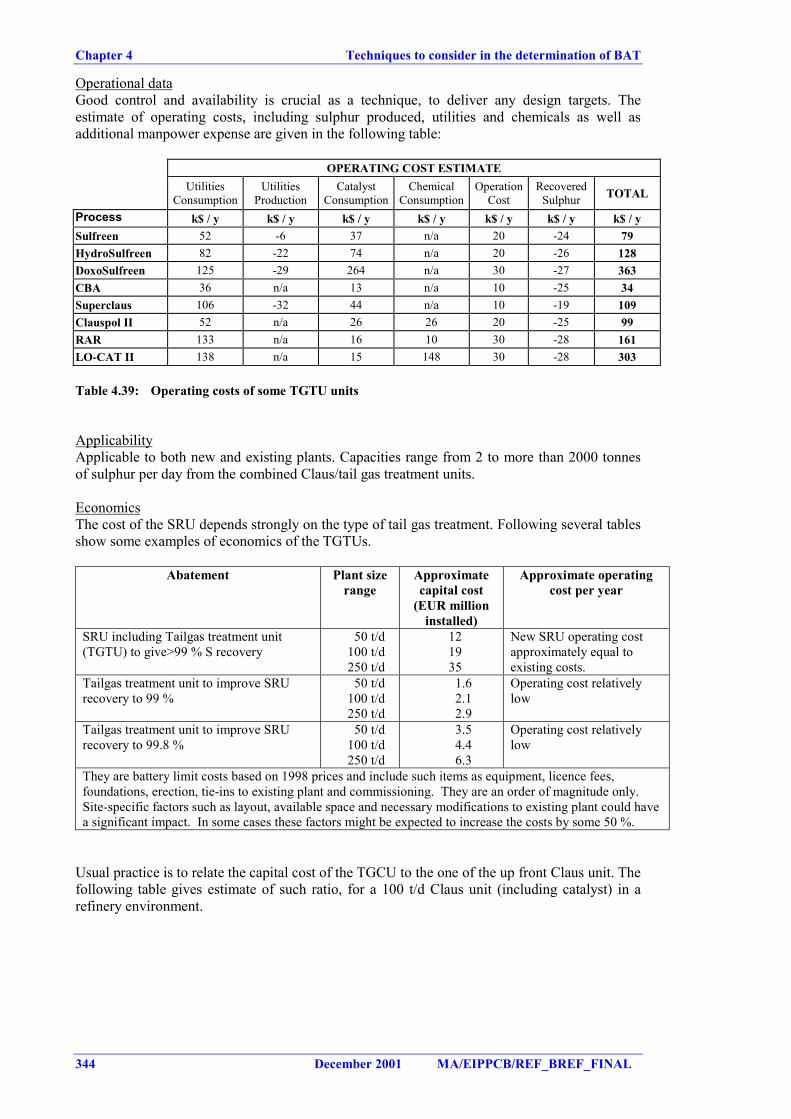
Chapter 4 Techniques to consider in the determination of BAT
344 December 2001 MA/EIPPCB/REF_BREF_FINAL
Operational dataGood control and availability is crucial as a technique, to deliver any design targets. Theestimate of operating costs, including sulphur produced, utilities and chemicals as well asadditional manpower expense are given in the following table:
OPERATING COST ESTIMATEUtilities
ConsumptionUtilities
ProductionCatalyst
ConsumptionChemical
ConsumptionOperation
CostRecovered
Sulphur TOTAL
Process k$ / y k$ / y k$ / y k$ / y k$ / y k$ / y k$ / ySulfreen 52 -6 37 n/a 20 -24 79HydroSulfreen 82 -22 74 n/a 20 -26 128DoxoSulfreen 125 -29 264 n/a 30 -27 363CBA 36 n/a 13 n/a 10 -25 34Superclaus 106 -32 44 n/a 10 -19 109Clauspol II 52 n/a 26 26 20 -25 99RAR 133 n/a 16 10 30 -28 161LO-CAT II 138 n/a 15 148 30 -28 303
Table 4.39: Operating costs of some TGTU units
ApplicabilityApplicable to both new and existing plants. Capacities range from 2 to more than 2000 tonnesof sulphur per day from the combined Claus/tail gas treatment units.
EconomicsThe cost of the SRU depends strongly on the type of tail gas treatment. Following several tablesshow some examples of economics of the TGTUs.
Abatement Plant sizerange
Approximatecapital cost
(EUR millioninstalled)
Approximate operatingcost per year
SRU including Tailgas treatment unit(TGTU) to give>99 % S recovery
50 t/d100 t/d250 t/d
121935
New SRU operating costapproximately equal toexisting costs.
Tailgas treatment unit to improve SRUrecovery to 99 %
50 t/d100 t/d250 t/d
1.62.12.9
Operating cost relativelylow
Tailgas treatment unit to improve SRUrecovery to 99.8 %
50 t/d100 t/d250 t/d
3.54.46.3
Operating cost relativelylow
They are battery limit costs based on 1998 prices and include such items as equipment, licence fees,foundations, erection, tie-ins to existing plant and commissioning. They are an order of magnitude only.Site-specific factors such as layout, available space and necessary modifications to existing plant could havea significant impact. In some cases these factors might be expected to increase the costs by some 50 %.
Usual practice is to relate the capital cost of the TGCU to the one of the up front Claus unit. Thefollowing table gives estimate of such ratio, for a 100 t/d Claus unit (including catalyst) in arefinery environment.
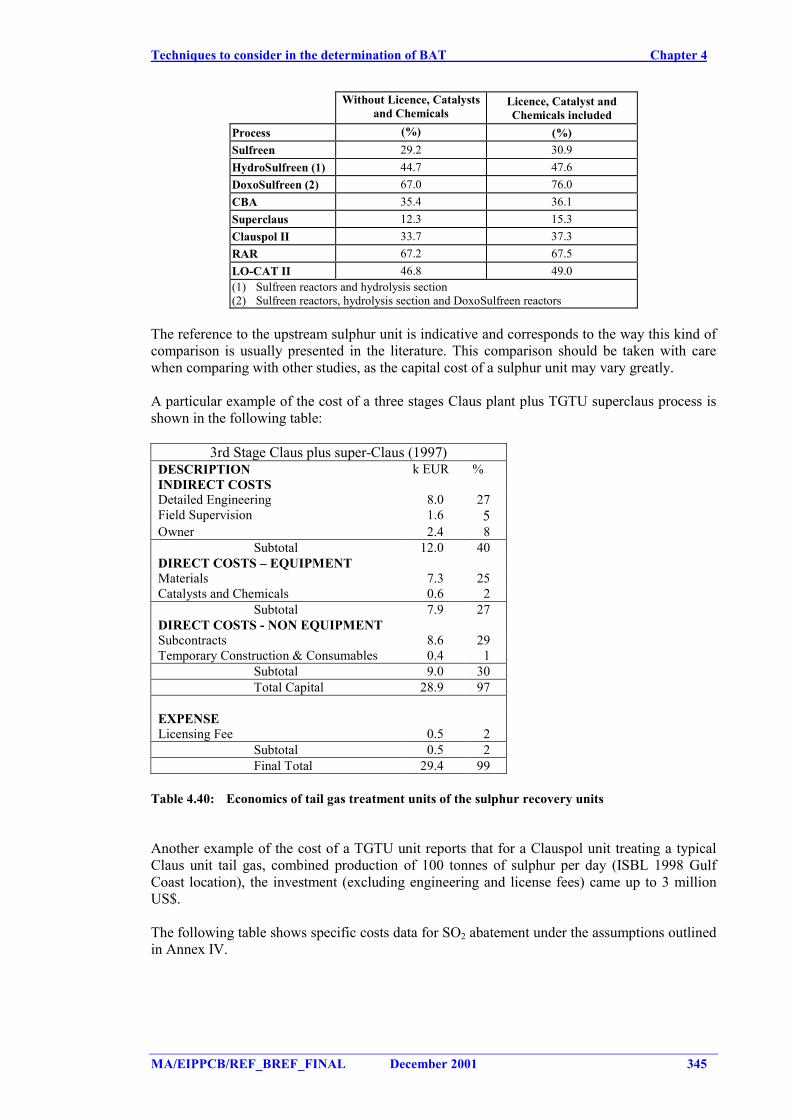
Techniques to consider in the determination of BAT Chapter 4
MA/EIPPCB/REF_BREF_FINAL December 2001 345
Without Licence, Catalystsand Chemicals
Licence, Catalyst andChemicals included
Process (%) (%)Sulfreen 29.2 30.9HydroSulfreen (1) 44.7 47.6DoxoSulfreen (2) 67.0 76.0CBA 35.4 36.1Superclaus 12.3 15.3Clauspol II 33.7 37.3RAR 67.2 67.5LO-CAT II 46.8 49.0(1) Sulfreen reactors and hydrolysis section(2) Sulfreen reactors, hydrolysis section and DoxoSulfreen reactors
The reference to the upstream sulphur unit is indicative and corresponds to the way this kind ofcomparison is usually presented in the literature. This comparison should be taken with carewhen comparing with other studies, as the capital cost of a sulphur unit may vary greatly.
A particular example of the cost of a three stages Claus plant plus TGTU superclaus process isshown in the following table:
3rd Stage Claus plus super-Claus (1997)DESCRIPTION k EUR %INDIRECT COSTSDetailed Engineering 8.0 27Field Supervision 1.6 5Owner 2.4 8
Subtotal 12.0 40DIRECT COSTS – EQUIPMENTMaterials 7.3 25Catalysts and Chemicals 0.6 2
Subtotal 7.9 27DIRECT COSTS - NON EQUIPMENTSubcontracts 8.6 29Temporary Construction & Consumables 0.4 1
Subtotal 9.0 30Total Capital 28.9 97
EXPENSELicensing Fee 0.5 2
Subtotal 0.5 2Final Total 29.4 99
Table 4.40: Economics of tail gas treatment units of the sulphur recovery units
Another example of the cost of a TGTU unit reports that for a Clauspol unit treating a typicalClaus unit tail gas, combined production of 100 tonnes of sulphur per day (ISBL 1998 GulfCoast location), the investment (excluding engineering and license fees) came up to 3 millionUS$.
The following table shows specific costs data for SO2 abatement under the assumptions outlinedin Annex IV.
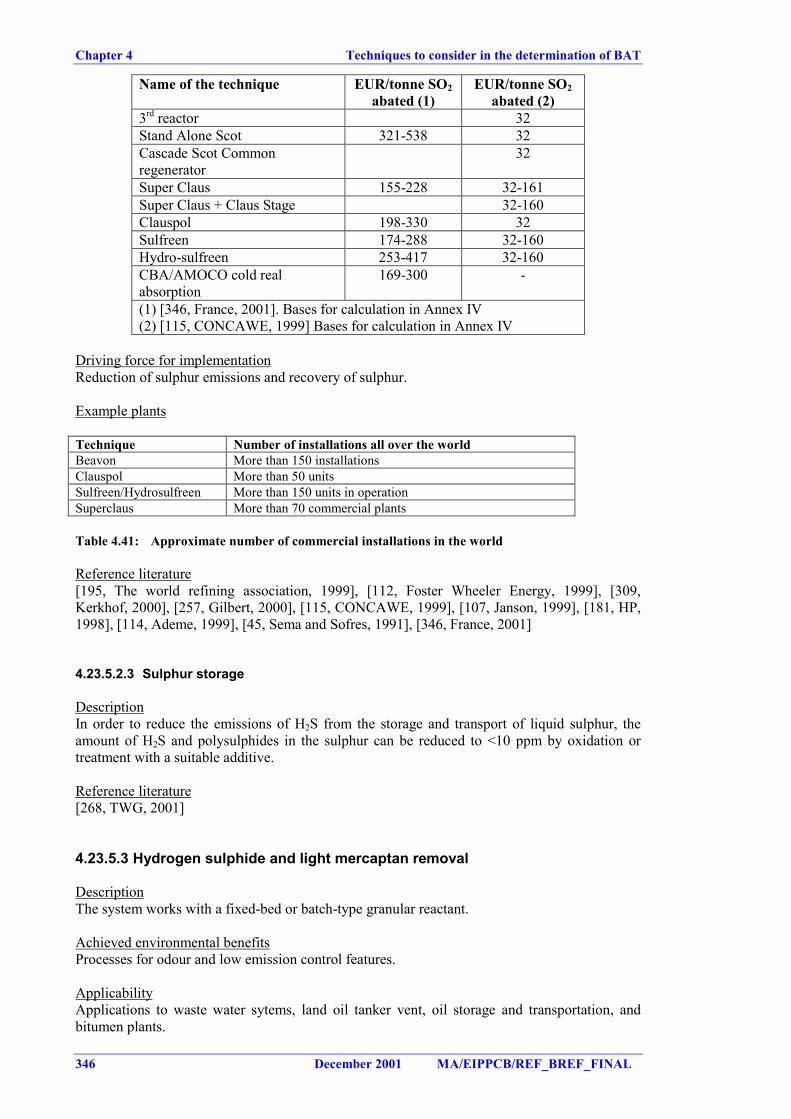
Chapter 4 Techniques to consider in the determination of BAT
346 December 2001 MA/EIPPCB/REF_BREF_FINAL
Name of the technique EUR/tonne SO2abated (1)
EUR/tonne SO2abated (2)
3rd reactor 32Stand Alone Scot 321-538 32Cascade Scot Commonregenerator
32
Super Claus 155-228 32-161Super Claus + Claus Stage 32-160Clauspol 198-330 32Sulfreen 174-288 32-160Hydro-sulfreen 253-417 32-160CBA/AMOCO cold realabsorption
169-300 -
(1) [346, France, 2001]. Bases for calculation in Annex IV(2) [115, CONCAWE, 1999] Bases for calculation in Annex IV
Driving force for implementationReduction of sulphur emissions and recovery of sulphur.
Example plants
Technique Number of installations all over the worldBeavon More than 150 installationsClauspol More than 50 unitsSulfreen/Hydrosulfreen More than 150 units in operationSuperclaus More than 70 commercial plants
Table 4.41: Approximate number of commercial installations in the world
Reference literature[195, The world refining association, 1999], [112, Foster Wheeler Energy, 1999], [309,Kerkhof, 2000], [257, Gilbert, 2000], [115, CONCAWE, 1999], [107, Janson, 1999], [181, HP,1998], [114, Ademe, 1999], [45, Sema and Sofres, 1991], [346, France, 2001]
4.23.5.2.3 Sulphur storage
DescriptionIn order to reduce the emissions of H2S from the storage and transport of liquid sulphur, theamount of H2S and polysulphides in the sulphur can be reduced to <10 ppm by oxidation ortreatment with a suitable additive.
Reference literature[268, TWG, 2001]
4.23.5.3 Hydrogen sulphide and light mercaptan removal
DescriptionThe system works with a fixed-bed or batch-type granular reactant.
Achieved environmental benefitsProcesses for odour and low emission control features.
ApplicabilityApplications to waste water sytems, land oil tanker vent, oil storage and transportation, andbitumen plants.
Techniques to consider in the determination of BAT Chapter 4
MA/EIPPCB/REF_BREF_FINAL December 2001 347
Driving force for implementationProcesses for odour and emission control features.
Example plantsMore than 1000 applications worldwide.
Reference literature[181, HP, 1998]
4.23.5.4 Sulphur dioxide abatement techniques
Flue gas desulphurisation is a technique by which SO2 is removed from flue gases or otherwaste gases. The process often involves an alkaline sorbent which captures SO2 and transformsit to a solid product. SO2 in refinery waste gases may have unabated concentration levels of1500 - 7500 mg/m3. Various FGD methods exist with varying SO2 removal efficiencies. TheFGD market is dominated by the so-called wet lime/limestone process followed by spray dryscrubbers, and the application of sorbent injection and regenerable processes. More informationcan be found in the Waste gas waste water BREF [312, EIPPCB, 2001].
Systems either of the regenerable or the non-regenerable type, do exist for SOx removal only,but also for simultaneous removal of dust and NOx. Most of these combined processes are stillin the development phase, but some are commercially available already. They are or maybecome competitive with systems consisting of separate units for SO2 elimination (i.e. wetscrubbers) and NOx removal (i.e. SCR).
DescriptionAdditive injection (AI) and Spray Dry Absorber (SD) are scrubbing processes that remove SO2according to the same principle as WS (reacting with a Ca-based sorbent) however, without thecomplicating requirements for producing a high-grade gypsum by-product (i.e. prescrubbingand oxidising). The by-product is a mixture of sulphites, sulphates and fly-ash for which thereare few or no useful applications.
The AI-process provides moderate SO2 removal at relative low sulphur loads. A dry sorbent isinjected in the furnace. The sorbent used is limestone or hydrated lime (for small boilers, moreactive sodium bicarbonate (NaHCO3) is injected in the flue gas duct).
The SNOX process combines high removal of SO2, NOx and particulates. More information seeSection 4.23.8
The seawater scrubbing process uses the natural alkaline - bicarbonates - of seawater to removeSO2. This implies a potential for high removal efficiencies. The discharge will contain sulphateand chlorine ions - which are a natural constituent of seawater.
In the Walther (WA)-process, SO2 is absorbed by spray injection of aqueous ammonia, yieldingammonium sulphite. The sulphite is subsequently oxidised to sulphate. The ammonium saltsolution from the scrubbing section is concentrated in an evaporation unit and granulated. Theend-product is a marketable fertiliser.
The Wellman Lord (WL)-process is the most widely used regenerable process. The process isbased on sodium sulphite/bisulphite equilibrium.
Present-day Wet Limestone Scrubber (WS)-systems are very much improved and less complexthan the earlier systems. Generally a limestone/water slurry is used as the sorbent. Gypsum isproduced by oxidation (aeration) in the sump of the absorber.
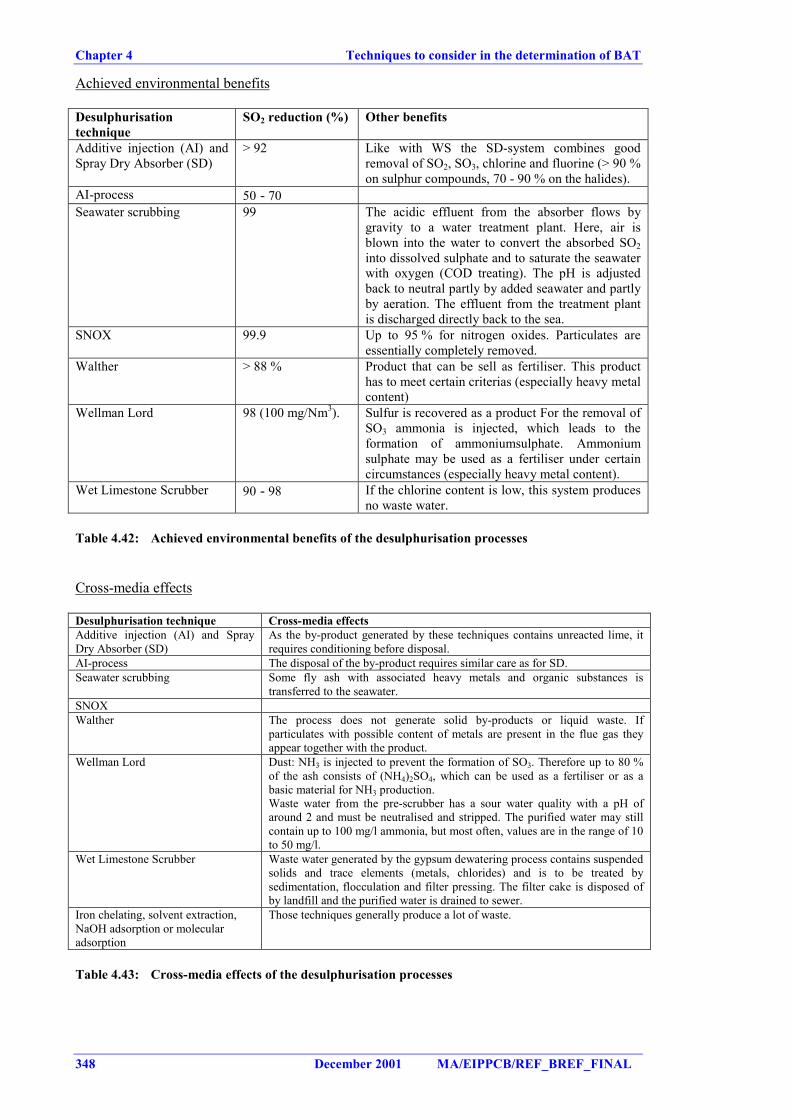
Chapter 4 Techniques to consider in the determination of BAT
348 December 2001 MA/EIPPCB/REF_BREF_FINAL
Achieved environmental benefits
Desulphurisationtechnique
SO2 reduction (%) Other benefits
Additive injection (AI) andSpray Dry Absorber (SD)
> 92 Like with WS the SD-system combines goodremoval of SO2, SO3, chlorine and fluorine (> 90 %on sulphur compounds, 70 - 90 % on the halides).
AI-process 50 - 70Seawater scrubbing 99 The acidic effluent from the absorber flows by
gravity to a water treatment plant. Here, air isblown into the water to convert the absorbed SO2into dissolved sulphate and to saturate the seawaterwith oxygen (COD treating). The pH is adjustedback to neutral partly by added seawater and partlyby aeration. The effluent from the treatment plantis discharged directly back to the sea.
SNOX 99.9 Up to 95 % for nitrogen oxides. Particulates areessentially completely removed.
Walther > 88 % Product that can be sell as fertiliser. This producthas to meet certain criterias (especially heavy metalcontent)
Wellman Lord 98 (100 mg/Nm3). Sulfur is recovered as a product For the removal ofSO3 ammonia is injected, which leads to theformation of ammoniumsulphate. Ammoniumsulphate may be used as a fertiliser under certaincircumstances (especially heavy metal content).
Wet Limestone Scrubber 90 - 98 If the chlorine content is low, this system producesno waste water.
Table 4.42: Achieved environmental benefits of the desulphurisation processes
Cross-media effects
Desulphurisation technique Cross-media effectsAdditive injection (AI) and SprayDry Absorber (SD)
As the by-product generated by these techniques contains unreacted lime, itrequires conditioning before disposal.
AI-process The disposal of the by-product requires similar care as for SD.Seawater scrubbing Some fly ash with associated heavy metals and organic substances is
transferred to the seawater.SNOXWalther The process does not generate solid by-products or liquid waste. If
particulates with possible content of metals are present in the flue gas theyappear together with the product.
Wellman Lord Dust: NH3 is injected to prevent the formation of SO3. Therefore up to 80 %of the ash consists of (NH4)2SO4, which can be used as a fertiliser or as abasic material for NH3 production.Waste water from the pre-scrubber has a sour water quality with a pH ofaround 2 and must be neutralised and stripped. The purified water may stillcontain up to 100 mg/l ammonia, but most often, values are in the range of 10to 50 mg/l.
Wet Limestone Scrubber Waste water generated by the gypsum dewatering process contains suspendedsolids and trace elements (metals, chlorides) and is to be treated bysedimentation, flocculation and filter pressing. The filter cake is disposed ofby landfill and the purified water is drained to sewer.
Iron chelating, solvent extraction,NaOH adsorption or molecularadsorption
Those techniques generally produce a lot of waste.
Table 4.43: Cross-media effects of the desulphurisation processes
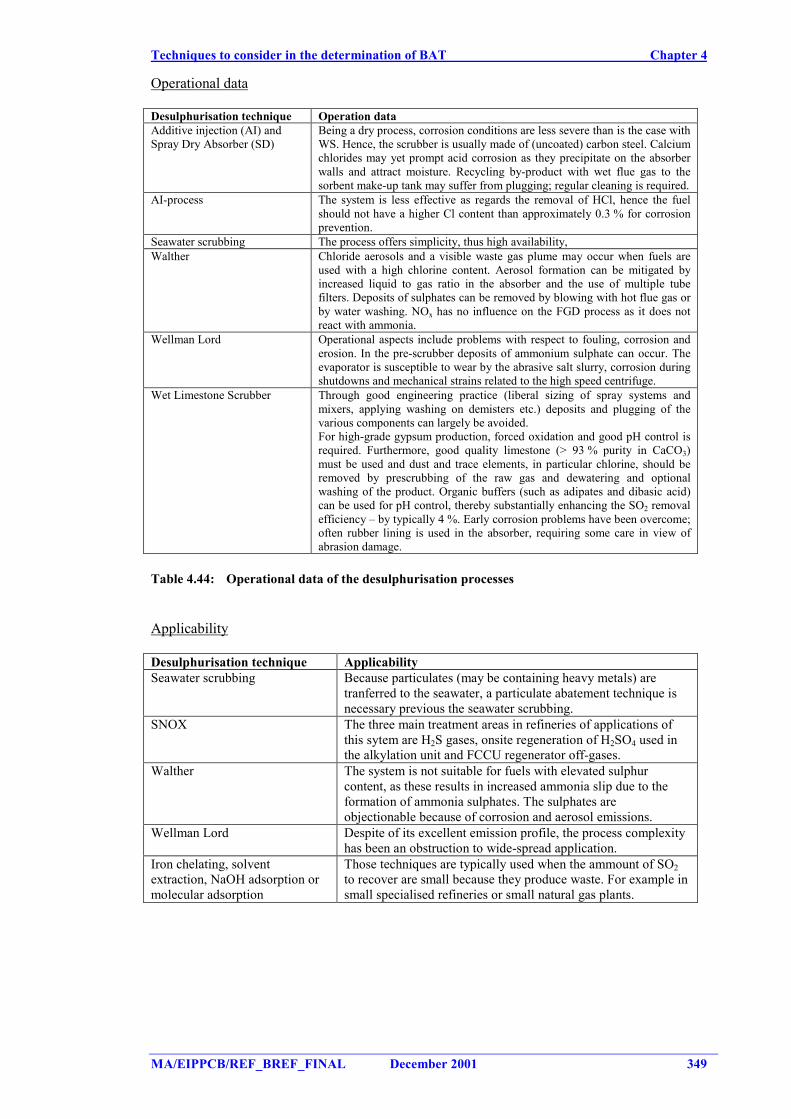
Techniques to consider in the determination of BAT Chapter 4
MA/EIPPCB/REF_BREF_FINAL December 2001 349
Operational data
Desulphurisation technique Operation dataAdditive injection (AI) andSpray Dry Absorber (SD)
Being a dry process, corrosion conditions are less severe than is the case withWS. Hence, the scrubber is usually made of (uncoated) carbon steel. Calciumchlorides may yet prompt acid corrosion as they precipitate on the absorberwalls and attract moisture. Recycling by-product with wet flue gas to thesorbent make-up tank may suffer from plugging; regular cleaning is required.
AI-process The system is less effective as regards the removal of HCl, hence the fuelshould not have a higher Cl content than approximately 0.3 % for corrosionprevention.
Seawater scrubbing The process offers simplicity, thus high availability,Walther Chloride aerosols and a visible waste gas plume may occur when fuels are
used with a high chlorine content. Aerosol formation can be mitigated byincreased liquid to gas ratio in the absorber and the use of multiple tubefilters. Deposits of sulphates can be removed by blowing with hot flue gas orby water washing. NOx has no influence on the FGD process as it does notreact with ammonia.
Wellman Lord Operational aspects include problems with respect to fouling, corrosion anderosion. In the pre-scrubber deposits of ammonium sulphate can occur. Theevaporator is susceptible to wear by the abrasive salt slurry, corrosion duringshutdowns and mechanical strains related to the high speed centrifuge.
Wet Limestone Scrubber Through good engineering practice (liberal sizing of spray systems andmixers, applying washing on demisters etc.) deposits and plugging of thevarious components can largely be avoided.For high-grade gypsum production, forced oxidation and good pH control isrequired. Furthermore, good quality limestone (> 93 % purity in CaCO3)must be used and dust and trace elements, in particular chlorine, should beremoved by prescrubbing of the raw gas and dewatering and optionalwashing of the product. Organic buffers (such as adipates and dibasic acid)can be used for pH control, thereby substantially enhancing the SO2 removalefficiency – by typically 4 %. Early corrosion problems have been overcome;often rubber lining is used in the absorber, requiring some care in view ofabrasion damage.
Table 4.44: Operational data of the desulphurisation processes
Applicability
Desulphurisation technique ApplicabilitySeawater scrubbing Because particulates (may be containing heavy metals) are
tranferred to the seawater, a particulate abatement technique isnecessary previous the seawater scrubbing.
SNOX The three main treatment areas in refineries of applications ofthis sytem are H2S gases, onsite regeneration of H2SO4 used inthe alkylation unit and FCCU regenerator off-gases.
Walther The system is not suitable for fuels with elevated sulphurcontent, as these results in increased ammonia slip due to theformation of ammonia sulphates. The sulphates areobjectionable because of corrosion and aerosol emissions.
Wellman Lord Despite of its excellent emission profile, the process complexityhas been an obstruction to wide-spread application.
Iron chelating, solventextraction, NaOH adsorption ormolecular adsorption
Those techniques are typically used when the ammount of SO2to recover are small because they produce waste. For example insmall specialised refineries or small natural gas plants.
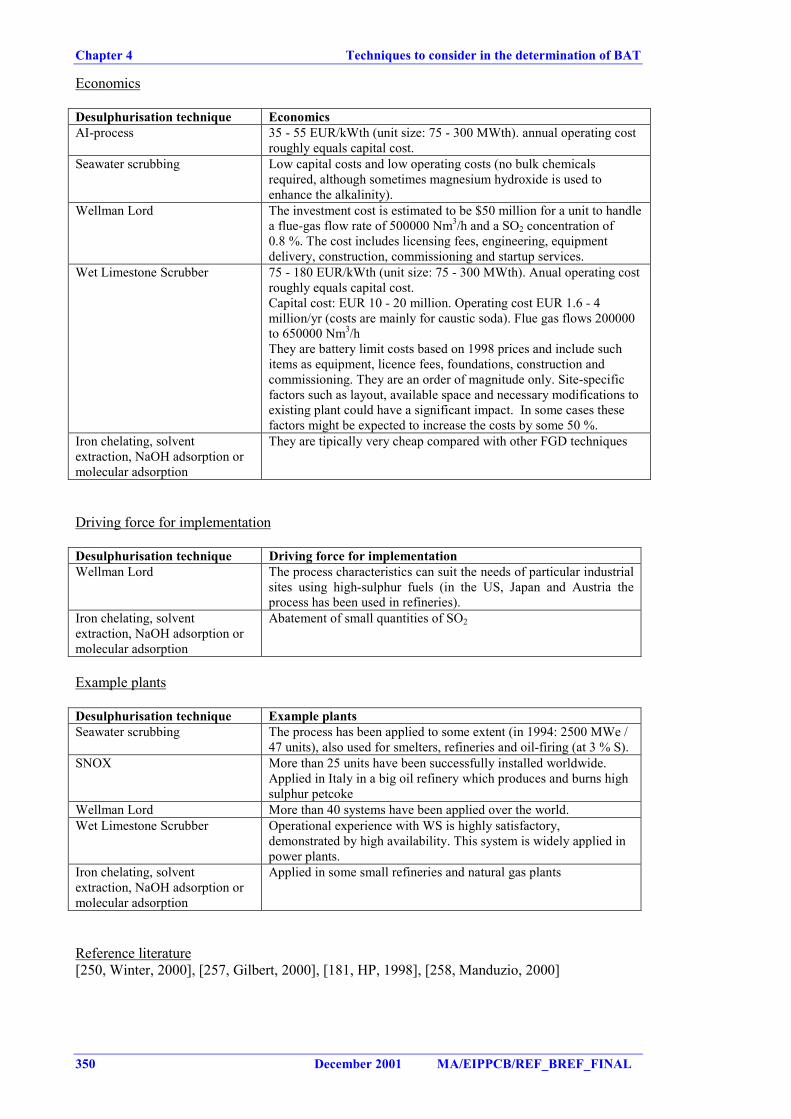
Chapter 4 Techniques to consider in the determination of BAT
350 December 2001 MA/EIPPCB/REF_BREF_FINAL
Economics
Desulphurisation technique EconomicsAI-process 35 - 55 EUR/kWth (unit size: 75 - 300 MWth). annual operating cost
roughly equals capital cost.Seawater scrubbing Low capital costs and low operating costs (no bulk chemicals
required, although sometimes magnesium hydroxide is used toenhance the alkalinity).
Wellman Lord The investment cost is estimated to be $50 million for a unit to handlea flue-gas flow rate of 500000 Nm3/h and a SO2 concentration of0.8 %. The cost includes licensing fees, engineering, equipmentdelivery, construction, commissioning and startup services.
Wet Limestone Scrubber 75 - 180 EUR/kWth (unit size: 75 - 300 MWth). Anual operating costroughly equals capital cost.Capital cost: EUR 10 - 20 million. Operating cost EUR 1.6 - 4million/yr (costs are mainly for caustic soda). Flue gas flows 200000to 650000 Nm3/hThey are battery limit costs based on 1998 prices and include suchitems as equipment, licence fees, foundations, construction andcommissioning. They are an order of magnitude only. Site-specificfactors such as layout, available space and necessary modifications toexisting plant could have a significant impact. In some cases thesefactors might be expected to increase the costs by some 50 %.
Iron chelating, solventextraction, NaOH adsorption ormolecular adsorption
They are tipically very cheap compared with other FGD techniques
Driving force for implementation
Desulphurisation technique Driving force for implementationWellman Lord The process characteristics can suit the needs of particular industrial
sites using high-sulphur fuels (in the US, Japan and Austria theprocess has been used in refineries).
Iron chelating, solventextraction, NaOH adsorption ormolecular adsorption
Abatement of small quantities of SO2
Example plants
Desulphurisation technique Example plantsSeawater scrubbing The process has been applied to some extent (in 1994: 2500 MWe /
47 units), also used for smelters, refineries and oil-firing (at 3 % S).SNOX More than 25 units have been successfully installed worldwide.
Applied in Italy in a big oil refinery which produces and burns highsulphur petcoke
Wellman Lord More than 40 systems have been applied over the world.Wet Limestone Scrubber Operational experience with WS is highly satisfactory,
demonstrated by high availability. This system is widely applied inpower plants.
Iron chelating, solventextraction, NaOH adsorption ormolecular adsorption
Applied in some small refineries and natural gas plants
Reference literature[250, Winter, 2000], [257, Gilbert, 2000], [181, HP, 1998], [258, Manduzio, 2000]
Techniques to consider in the determination of BAT Chapter 4
MA/EIPPCB/REF_BREF_FINAL December 2001 351
4.23.6 VOC abatement techniques
When transferring liquids to vessels at atmospheric pressure, the existing mixture of vapour andgas (often air, but also inerts) in the receiving vessel is often emitted to atmosphere. Suchloading operation is recognised as having an impact on the environment due to the presence ofVOC, a precursor of ozone. EU Stage 1 Directive 94/63/EC requires that Member Statesprescribe the specific emission reduction measures is laid down in the annexes of the Directive.Also the application of VRUs to prevent escape of these vapours to the atmosphere is specifiedin the directive. VRUs aim for recovery of hydrocarbons for re-use. In some cases recovery isnot economic, and preference will be given to vapour destruction units (VDU). A more generalterm covering both options is Vapour Handling Systems (VHS).
4.23.6.1 Establishment of a programme for prevention, detection and control offugitive emissions
DescriptionControl of fugitive emissions involves minimising leaks and spills through equipment changes,procedure changes, and improved monitoring, good housekeeping and maintenance practices.The aim in all refinery processes should be to prevent or minimise the release of VOCS.Because of the size, scope and nature of hydrocarbon processing on refineries, this presents amajor challenge, which requires an overall strategy that also devolves down into individualaction at a process unit and plant item level. Most VOCs are released through fugitive lossesfrom sources including valves, flanges, pump seals and equipment vents. Even a small simplerefinery may have over 10000 potential sources and the problem is magnified proportionally onthe complete complex refineries.
In the case of process component fugitive releases the only real option, is the implementation ofa permanent on-going Leak Detection and Repair (LDAR) programme. This should bedeveloped and tailored to suit the situation concerned, using appropriate techniques, frequenciesand priorities. It should provide estimates of fugitive VOC releases for monitoring returns andenable action to be taken to minimise releases. A LDAR contains the following elements:� type of measurement (e.g. detection limit of 500 ppm for valves and flanges, against the
interface of the flange)� frequency (e.g. twice a year)� type of components to be checked (e.g. pumps, control valves, heat exchangers, connectors,
flanges)� type of compound lines (e.g. exclude lines that contain liquids with a vapour pressure above
13 kPa)� what leaks should be repaired and how fast the action should be taken
The principal areas of fugitive loss are well known and their minimising has been the subject ofmuch investigation and action on refineries world-wide, mainly led by operators subject toextremely tight regulation. Some techniques to consider can be:• an essential first step of any programme is to establish a fugitive release inventory for the
refinery. This normally involves a combination of sampling, measurements, environmentalmonitoring, dispersion modeling and estimates based on emission factors
• identify all potential sources of VOC releases, by establishing population counts ofequipment components in line with up-to-date P & I drawings for processes. This surveyshould cover gas, vapour and light liquid duties
• quantifying of the VOC releases, initially as "baseline" estimates, and subsequently to morerefined levels. Suitable protocols for this include the “1995 Protocol for Equipment leakEmission Estimates” (USAEPA-453/R-95-017) for process component losses and APImethods(9) for tankage losses. Some major companies have developed their own techniquesand protocols. USAEPA method defines an emission estimate of 10000 ppm and is morecorrect for a plant that until today, has not implemented LDAR programme. A recent reportshown that from 1000 valves analysed by type found that the average leakage measured on
Chapter 4 Techniques to consider in the determination of BAT
352 December 2001 MA/EIPPCB/REF_BREF_FINAL
regulating control valves was over 70000 ppm. Some TWG members question that highemission leakage limit and propose to set the limit to 500 - 1000 ppm and specially withsmall chemicals are handled.
• using appropriate dispersion modeling techniques, predict atmospheric mass flux andconcentrations
• employing environmental monitoring techniques, compare the predicted situation with themeasured one
• identification of the processes that have higher fugitive releases• VOC releases need also to be minimised from refinery utility and ancillary systems and
during plant maintenance and cleaning operations. Hydrocarbons should be minimised incooling water and adequate separation facilities provided to deal with incidents ofcontamination. After depressurising off-line process vessels to RFG/flare, they neednormally to be steamed out to flare and residual liquids returned to oil slops plants, not runto drain before venting to air, when personnel entry is required
• vapour recovery/incineration/use• a strategy to reduce VOC emissions may include a complete inventory and quantification by
a DIAL LIDAR technique (differential absorption light detection and ranging) (seeSection 3.26 for more information).
• emissions that occur through relief valves are to be routed to flare or dedicated incinerationsystems, and in exceptional cases vented to a safe location
• fugitive VOC emissions (sometimes containing H2S) can be minimised through doublemechanical seals on pumps, compressors or agitators. For example dual pressurized sealingsystems on pumps virtually eliminate leakage of the process fluid into the environment andtypically have emissions approaching zero, usually described as ‘not measurable withexisting instrument technology’
• use of low emission valve stem packing (500 ppm) on critical valves, e.g. rising stem gatetype control valves in continuous operation, particularly on gas/light liquid highpressure/temperature duties. Valves is the type of equipment that causes most of the leaks(40 - 65 %) Valves with rising stems and in particular control valves are an importantsource of leaks and may account for as much as 64% of the leaking losses in a plant. It istherefore recommended that a high integrity low emission packing be installed on thesevalves that can provide emissions performance below 500 ppm and at the same time is firesafe. To ensure low term leakage performance valve live loading spring assemblies mountedon the gland bolts will ensure that the low emission packing is constantly loaded even as thematerial relaxes over time. Control Valve solutions with valve live loading exist asMaximum Achievable Control Technology (MACT) and emissions performance of 3-5years is achievable at below 500 ppm. Low emission packing should be specified, andshould be certified by an independent test by a reputable testing house. Packing also be firesafe. Rising Stem control valves even with low emission packings can leak excessively afterthe packing has relaxed in the stuffing box. Studies carried out by a French researchinstitute have shown average leakage concentrations on control valves to be as much as70000 ppm. (Power Point Slide Enclosed) In the chemical, petrochemical and refineryindustry the use of packed valves incorporating live loading spring assemblies mounted onthe gland bolts compensates for normal packing relaxation or the effects of thermal cyclingand vibration. Valve Live Loading systems offer considerable improvements in long-termsealability on rising stem gate valves, globe valves and regulating control valves. Onfrequently operated rising stem valves (most problematic) Live Loading offers aconsiderable improvement in long-term emissions performance (< 500 ppm for 3-5 years).Valves have been identified as the greatest source of fugitive emissions in refineries andrising stem valves particularly frequently operated valves represent the greatest sources offugitive emissions.
• use of alternative proven types of low-release valves where gate valves are not essential,e.g. quarter turn and sleeved plug valves, both of which have two independent seals
• use of balanced bellows type relief valves to minimise valve leakage outside the design liftrange and piping of reliefs to RFG or flare gas, normally via phase separation, withoutheader back pressure
Techniques to consider in the determination of BAT Chapter 4
MA/EIPPCB/REF_BREF_FINAL December 2001 353
• minimising the number of flanged connections on pipelines and the use of highspecification jointing materials. Flanges should be minimized and high integrity sealingmaterials should be used and should be fire safe materials. In some critical services,particularly where thermal cycling or possible vibration may exist, flange disc springs canbe mounted under the flange bolts to compensate for the effects of thermal cycling andgasket relaxation. Such solutions combined with high performance sealing materials canprovide emissions performance of <500 ppm for periods of 3-5 years. Often heatexchangers are not given a separate consideration in the discussion of fugitive emissions.On a typical refinery there can be several hundred heat exchangers. Due to the size of theseflanged connections, the large no. of bolts involved, the non uniform temperature on theflange and the thermal cycling conditions under which many operate, it is recommendedthat flange disc springs are fitted under the nuts of the bolts to maintain a constant glandload on the sealing material. Heat exchangers have a far greater tendency to leak thannormal pipe flanges due to their dimensions and particularly in thermal cycling conditions.High integrity sealing materials are recommended and not the standard typical metaljacketed gaskets as indicated in the design codes.
• use of canned pumps or double seals on conventional pumps. Study the use of non-leakingpumps as diaphragm pumps, bellow pumps, canned rotor pumps, or pumps with magneticclutches. Magnetic pumps cannot be used for clean liquids at low temperature. Emissionsfrom centrifugal pumps can be reduced to 33 % by replacing packed seals by mechanicalseals. Turbo-compressors can be sealed with labyrinth glands, with rotating rings or floatingrings in liquid seals. An escape of the transported medium through the seals should beprevented e.g. by inert gas or liquid sealing medium at elevated pressure. Furthermore,magnetic drive pumps and canned motor pumps have limited applicability and care must betaken when using such pumps in contaminated process streams, process streams containingparticulate and higher pressures. It should also be noted that magnetic pumps typically havelower efficiency compared to conventional pumps, drawing more power for the sameservice. In end effect this transfers emissions from the pump ( as VOC emissions) to thestack ( as CO2, SO2, NO2 emissions).
• piping of compressor seals, vent and purge lines to RFG or flare systems• use of end caps or plugs on open ended lines and closed loop flush on liquid sampling
points (no applicable with circulating fluid (pump discharge) or in tanks). Minimising thereleases to air from process hydrocarbon analysers, by optimising samplingvolume/frequency and venting to RFG or flare systems
• install a maintenance drain-out system to eliminate open discharges from drains• using totally closed-loop in all routine samplers. To follow product quality, inspection
requirements, environmental standards, etc. a sampling schedule is typically set up. Withroutine sampling is understood those that are frequently used or needed. For example, byroutine samplers is understood, the samplers of effluent water quality, daily samples ofprocessed crude fuel fired, fuel gas, certain feedstocks (i.e. FCCU), that are taken to analysethe sulphur concentration. and samplers from intermediates, final products, tanks, etc.
Achieved environmental benefitsFugitive emissions are one of the largest sources of refinery hydrocarbon emissions. A leakdetection and repair (LDAR) programme consists of using a portable VOC detecting instrumentto detect leaks during regularly scheduled inspections of valves, flanges, and pump seals. Leaksare then repaired immediately or are scheduled for repair as quickly as possible. A LDARprogramme could reduce fugitive emissions 40 to 64 percent, depending on the frequency ofinspections.
Techniques to reduce VOC emissions are: efficient seals and valves, good maintenanceprogrammes and monitoring of the emissions. Fugitive emissions can be reduced to 0.01 %weight when normal fugitive emissions has been calculated as 0.03 % weight on throughput.The investment cost for those techniques is negligeble and the operating cost is around EUR 0.1million per year (accounting for 190 EUR per tonne of VOC recovered).
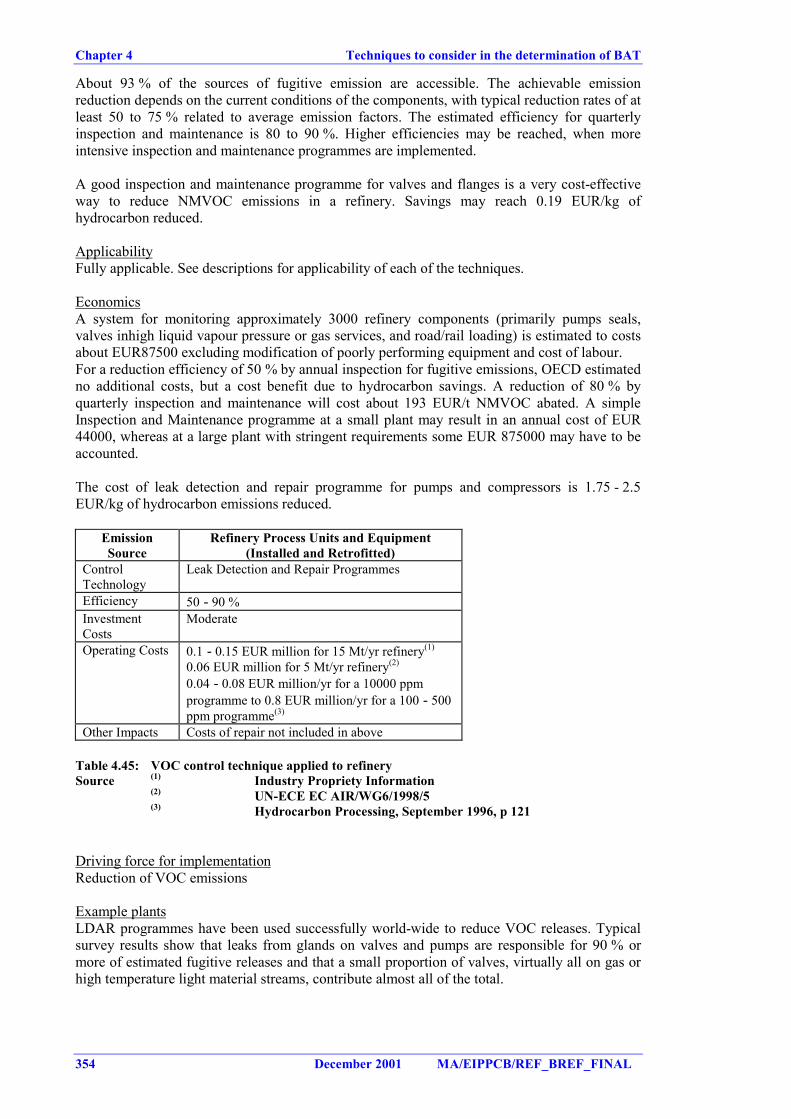
Chapter 4 Techniques to consider in the determination of BAT
354 December 2001 MA/EIPPCB/REF_BREF_FINAL
About 93 % of the sources of fugitive emission are accessible. The achievable emissionreduction depends on the current conditions of the components, with typical reduction rates of atleast 50 to 75 % related to average emission factors. The estimated efficiency for quarterlyinspection and maintenance is 80 to 90 %. Higher efficiencies may be reached, when moreintensive inspection and maintenance programmes are implemented.
A good inspection and maintenance programme for valves and flanges is a very cost-effectiveway to reduce NMVOC emissions in a refinery. Savings may reach 0.19 EUR/kg ofhydrocarbon reduced.
ApplicabilityFully applicable. See descriptions for applicability of each of the techniques.
EconomicsA system for monitoring approximately 3000 refinery components (primarily pumps seals,valves inhigh liquid vapour pressure or gas services, and road/rail loading) is estimated to costsabout EUR87500 excluding modification of poorly performing equipment and cost of labour.For a reduction efficiency of 50 % by annual inspection for fugitive emissions, OECD estimatedno additional costs, but a cost benefit due to hydrocarbon savings. A reduction of 80 % byquarterly inspection and maintenance will cost about 193 EUR/t NMVOC abated. A simpleInspection and Maintenance programme at a small plant may result in an annual cost of EUR44000, whereas at a large plant with stringent requirements some EUR 875000 may have to beaccounted.
The cost of leak detection and repair programme for pumps and compressors is 1.75 - 2.5EUR/kg of hydrocarbon emissions reduced.
EmissionSource
Refinery Process Units and Equipment(Installed and Retrofitted)
ControlTechnology
Leak Detection and Repair Programmes
Efficiency 50 - 90 %InvestmentCosts
Moderate
Operating Costs 0.1 - 0.15 EUR million for 15 Mt/yr refinery(1)
0.06 EUR million for 5 Mt/yr refinery(2)
0.04 - 0.08 EUR million/yr for a 10000 ppmprogramme to 0.8 EUR million/yr for a 100 - 500ppm programme(3)
Other Impacts Costs of repair not included in above
Table 4.45: VOC control technique applied to refinerySource (1) Industry Propriety Information
(2) UN-ECE EC AIR/WG6/1998/5(3) Hydrocarbon Processing, September 1996, p 121
Driving force for implementationReduction of VOC emissions
Example plantsLDAR programmes have been used successfully world-wide to reduce VOC releases. Typicalsurvey results show that leaks from glands on valves and pumps are responsible for 90 % ormore of estimated fugitive releases and that a small proportion of valves, virtually all on gas orhigh temperature light material streams, contribute almost all of the total.
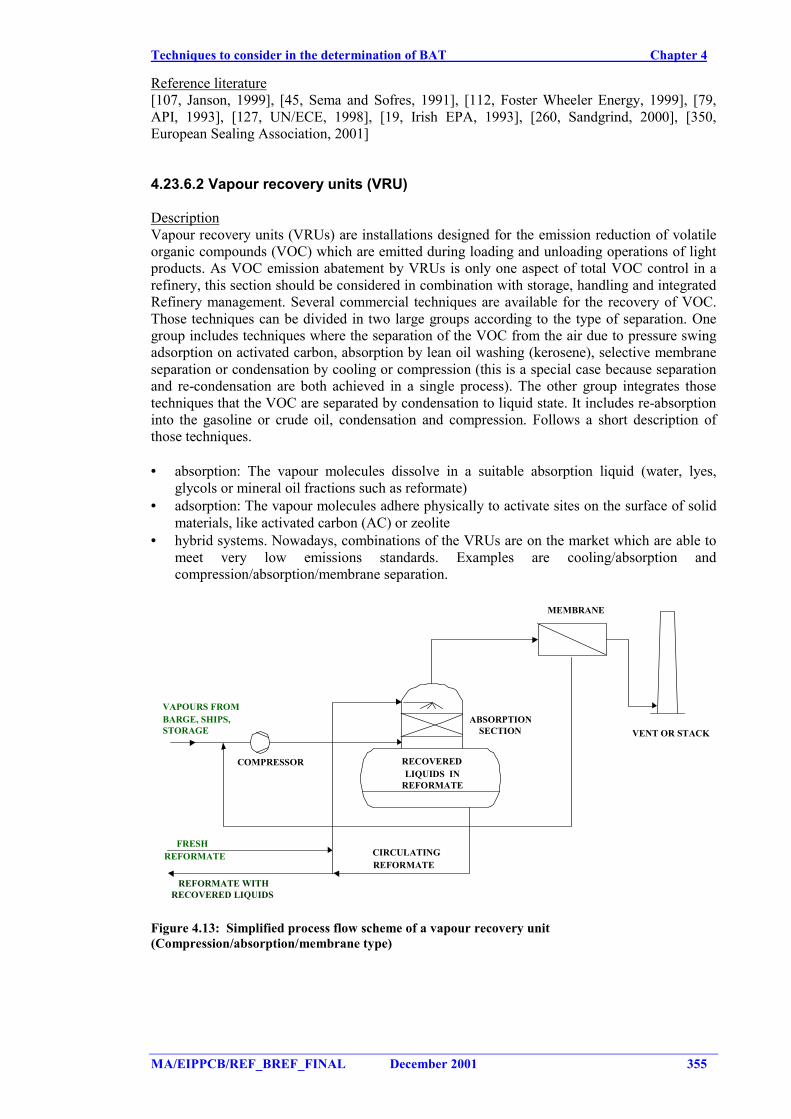
Techniques to consider in the determination of BAT Chapter 4
MA/EIPPCB/REF_BREF_FINAL December 2001 355
Reference literature[107, Janson, 1999], [45, Sema and Sofres, 1991], [112, Foster Wheeler Energy, 1999], [79,API, 1993], [127, UN/ECE, 1998], [19, Irish EPA, 1993], [260, Sandgrind, 2000], [350,European Sealing Association, 2001]
4.23.6.2 Vapour recovery units (VRU)
DescriptionVapour recovery units (VRUs) are installations designed for the emission reduction of volatileorganic compounds (VOC) which are emitted during loading and unloading operations of lightproducts. As VOC emission abatement by VRUs is only one aspect of total VOC control in arefinery, this section should be considered in combination with storage, handling and integratedRefinery management. Several commercial techniques are available for the recovery of VOC.Those techniques can be divided in two large groups according to the type of separation. Onegroup includes techniques where the separation of the VOC from the air due to pressure swingadsorption on activated carbon, absorption by lean oil washing (kerosene), selective membraneseparation or condensation by cooling or compression (this is a special case because separationand re-condensation are both achieved in a single process). The other group integrates thosetechniques that the VOC are separated by condensation to liquid state. It includes re-absorptioninto the gasoline or crude oil, condensation and compression. Follows a short description ofthose techniques.
• absorption: The vapour molecules dissolve in a suitable absorption liquid (water, lyes,glycols or mineral oil fractions such as reformate)
• adsorption: The vapour molecules adhere physically to activate sites on the surface of solidmaterials, like activated carbon (AC) or zeolite
• hybrid systems. Nowadays, combinations of the VRUs are on the market which are able tomeet very low emissions standards. Examples are cooling/absorption andcompression/absorption/membrane separation.
FRESHREFORMATE
REFORMATE WITHRECOVERED LIQUIDS
VENT OR STACK
VAPOURS FROMBARGE, SHIPS,STORAGE
MEMBRANE
RECOVEREDLIQUIDS IN
REFORMATE
ABSORPTIONSECTION
COMPRESSOR
CIRCULATINGREFORMATE
Figure 4.13: Simplified process flow scheme of a vapour recovery unit(Compression/absorption/membrane type)
Chapter 4 Techniques to consider in the determination of BAT
356 December 2001 MA/EIPPCB/REF_BREF_FINAL
• membrane gas separation: The vapour molecules dissolve into the membrane, move bydiffusion to the other side and desorb into the support material, driven by a pressuredifference. The concentration is higher at the desorption side of the membrane, as thevapour molecules are preferentially absorbed into the membrane compared to the gasmolecules.
• refrigeration/condensation: By cooling of the vapour/gas mixture the vapour moleculescondense and are separated as a liquid.
Achieved environmental benefits
VRU technique VOC removal efficiency (%)Absorption 99 - 99.95Adsorption 99.95 - 99.99Membrane gas separation 99 - 99.9Refrigeration/condensation 99.8 - 99.95
This method can achieve low exit concentrations if the appliedrefrigeration temperature is low enough. A great advantage ofcondensation is that the vapours are recovered as pure liquids (no waste),which can easily be returned directly to the storage tank.
Ranges are due to the use of 1 or 2 stages. Higher removal efficiencies are only reached with high inletloads.
Emissions of the various systems are directly related to the reduction efficiency as reportedabove and can be as low as 10 mg/Nm3 (without methane). An efficiency of 99.9 %concentrations of 150 mg/Nm3 (without methane) or 2500 mg/Nm3 (with methane) can beachieved.
Cross-media effectsEffluent is usually only condensate and is usually negligible.VRU techniqueAbsorption If water is used regeneration of the absorption liquid is not necessary, as
water can be treated in a waste water treatment plant. Regeneration morethan doubles the investment + energy costs. The only waste generated isthe exhausted liquid which need to be replaced once in many years.
Adsorption Waste is only relevant in case absorption bed.
Operational dataThe handling of VOC involves always safety measures in view of explosion risks (flamearresters) and the presence of toxic compounds such as benzene. VRUs are compact and requirevery little energy and process materials to operate. Usually operating times are longer than twoyears.
VRU techniqueAbsorption If reformate is used recycling to blending tanks is done.Hybrid systems Due to the complexity of operation it is difficult to maintain the high
performance
ApplicabilityVapour recovery units (VRUs) are installations designed for the emission reduction of volatileorganic compounds (VOC) which are emitted during loading and unloading operations of lightproducts. For a refinery this is particularly relevant to gasoline storage and loading as well as forproducts with equivalent volatility characteristics such as naphtha and BTEX.
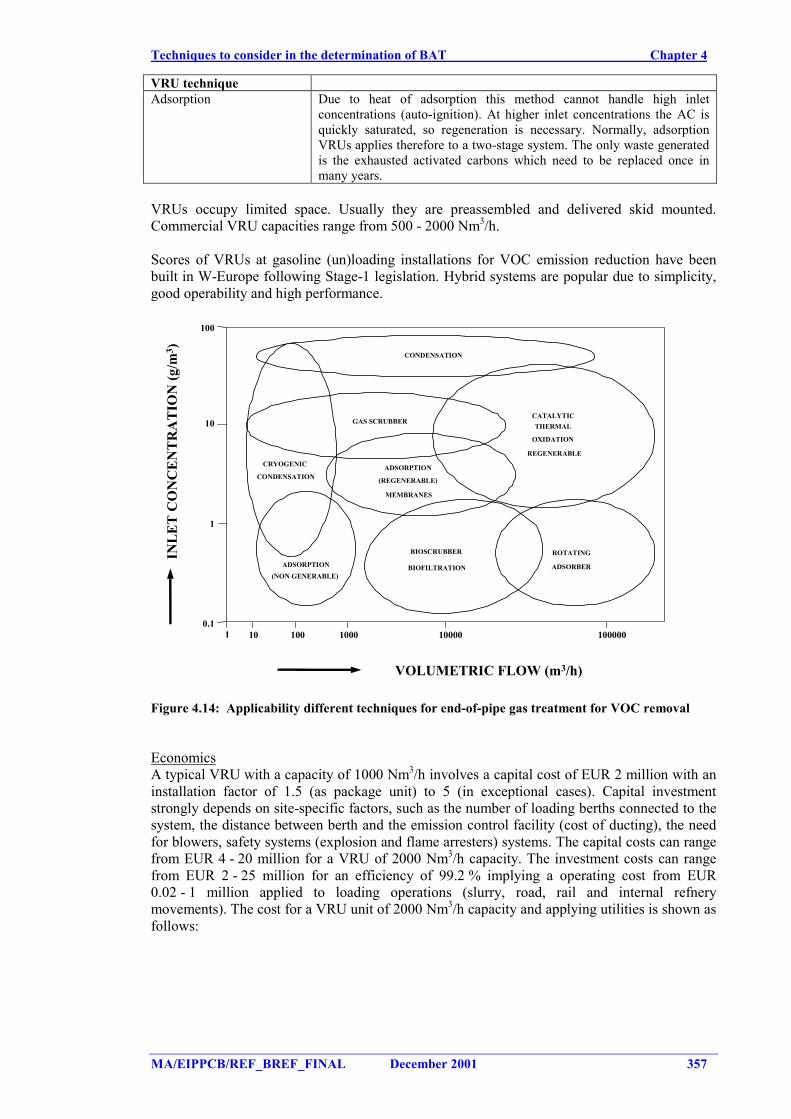
Techniques to consider in the determination of BAT Chapter 4
MA/EIPPCB/REF_BREF_FINAL December 2001 357
VRU techniqueAdsorption Due to heat of adsorption this method cannot handle high inlet
concentrations (auto-ignition). At higher inlet concentrations the AC isquickly saturated, so regeneration is necessary. Normally, adsorptionVRUs applies therefore to a two-stage system. The only waste generatedis the exhausted activated carbons which need to be replaced once inmany years.
VRUs occupy limited space. Usually they are preassembled and delivered skid mounted.Commercial VRU capacities range from 500 - 2000 Nm3/h.
Scores of VRUs at gasoline (un)loading installations for VOC emission reduction have beenbuilt in W-Europe following Stage-1 legislation. Hybrid systems are popular due to simplicity,good operability and high performance.
INLE
T C
ON
CEN
TRA
TIO
N (g
/m3 ) CONDENSATION
GAS SCRUBBER
ADSORPTION
(REGENERABLE)
MEMBRANES
CRYOGENIC
CONDENSATION
ADSORPTION(NON GENERABLE)
BIOSCRUBBER
BIOFILTRATION
ROTATING
ADSORBER
OXIDATION
THERMALCATALYTIC
REGENERABLE
0.110 100 1000 10000 100000
1
10
100
VOLUMETRIC FLOW (m3/h)
1
Figure 4.14: Applicability different techniques for end-of-pipe gas treatment for VOC removal
EconomicsA typical VRU with a capacity of 1000 Nm3/h involves a capital cost of EUR 2 million with aninstallation factor of 1.5 (as package unit) to 5 (in exceptional cases). Capital investmentstrongly depends on site-specific factors, such as the number of loading berths connected to thesystem, the distance between berth and the emission control facility (cost of ducting), the needfor blowers, safety systems (explosion and flame arresters) systems. The capital costs can rangefrom EUR 4 - 20 million for a VRU of 2000 Nm3/h capacity. The investment costs can rangefrom EUR 2 - 25 million for an efficiency of 99.2 % implying a operating cost from EUR0.02 - 1 million applied to loading operations (slurry, road, rail and internal refnerymovements). The cost for a VRU unit of 2000 Nm3/h capacity and applying utilities is shown asfollows:
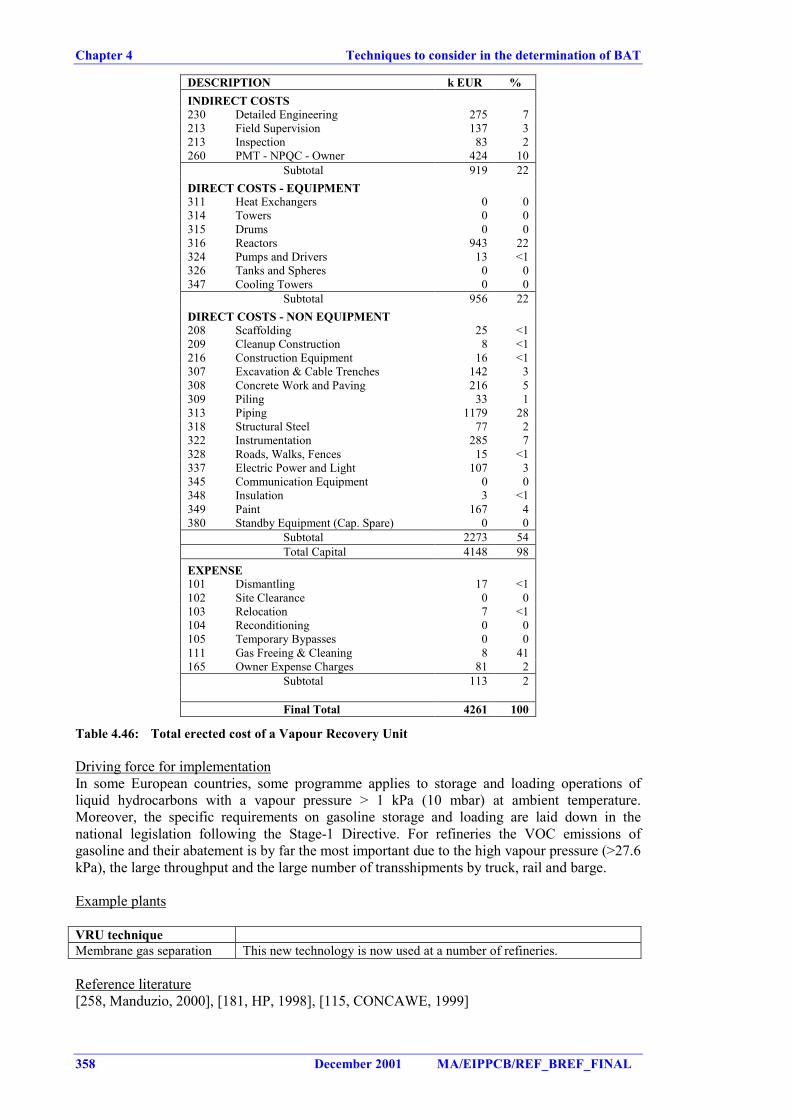
Chapter 4 Techniques to consider in the determination of BAT
358 December 2001 MA/EIPPCB/REF_BREF_FINAL
DESCRIPTION k EUR %INDIRECT COSTS230 Detailed Engineering 275 7213 Field Supervision 137 3213 Inspection 83 2260 PMT - NPQC - Owner 424 10
Subtotal 919 22DIRECT COSTS - EQUIPMENT311 Heat Exchangers 0 0314 Towers 0 0315 Drums 0 0316 Reactors 943 22324 Pumps and Drivers 13 <1326 Tanks and Spheres 0 0347 Cooling Towers 0 0
Subtotal 956 22DIRECT COSTS - NON EQUIPMENT208 Scaffolding 25 <1209 Cleanup Construction 8 <1216 Construction Equipment 16 <1307 Excavation & Cable Trenches 142 3308 Concrete Work and Paving 216 5309 Piling 33 1313 Piping 1179 28318 Structural Steel 77 2322 Instrumentation 285 7328 Roads, Walks, Fences 15 <1337 Electric Power and Light 107 3345 Communication Equipment 0 0348 Insulation 3 <1349 Paint 167 4380 Standby Equipment (Cap. Spare) 0 0
Subtotal 2273 54Total Capital 4148 98
EXPENSE101 Dismantling 17 <1102 Site Clearance 0 0103 Relocation 7 <1104 Reconditioning 0 0105 Temporary Bypasses 0 0111 Gas Freeing & Cleaning 8 41165 Owner Expense Charges 81 2
Subtotal 113 2
Final Total 4261 100
Table 4.46: Total erected cost of a Vapour Recovery Unit
Driving force for implementationIn some European countries, some programme applies to storage and loading operations ofliquid hydrocarbons with a vapour pressure > 1 kPa (10 mbar) at ambient temperature.Moreover, the specific requirements on gasoline storage and loading are laid down in thenational legislation following the Stage-1 Directive. For refineries the VOC emissions ofgasoline and their abatement is by far the most important due to the high vapour pressure (>27.6kPa), the large throughput and the large number of transshipments by truck, rail and barge.
Example plants
VRU techniqueMembrane gas separation This new technology is now used at a number of refineries.
Reference literature[258, Manduzio, 2000], [181, HP, 1998], [115, CONCAWE, 1999]
Techniques to consider in the determination of BAT Chapter 4
MA/EIPPCB/REF_BREF_FINAL December 2001 359
4.23.6.3 Vapour Destruction (VD)In addition to vapour recovery also vapour destruction can be applied.
DescriptionTwo systems are relevant in this respect:• oxidation: The vapour molecules are converted to CO2 and H2O either by thermal oxidation
at high temperatures or by catalytic oxidation at lower temperatures. The stage 1 directiveonly allows oxidation in special situations, e.g. when energy is recovered by a gas motor
• biofiltration: Decomposition to CO2 and H2O is achieved at temperatures slightly aboveambient by micro-organisms located in a solid humidified mass.
VOC collection and destructionAnother control technique is to collect VOCs from vents, pumps and compressors and to routethem to a flare system.
Achieved environmental benefitsThermal oxidation: 99 - 99.9 %, Catalytic oxidation 95 - 99 %, Biofilters 95 - 99 %. Theefficiency of the biofilters is normally a controversy. Since high removal efficiencies are onlyreaqched with high inlet loads, emission concentrations well below 50 mg/Nm3 NMVOC arerarely achieved.Biotreatment: The units are rugged, silent, need minimal maintenance and no inputs. No fuel orchemicals are required. Biofilters remove and destroy aliphatic and aromatic hydrocarbons,other VOC, H2S and odors in off-gases from process streams, tank vents, relief valves, soilvapour extracion, waste water treatments, etc.
Cross-media effectsThermal oxidation can give unwanted combustion products such as NOx, requiring extratreatment. Catalytic oxidation requires less energy to arrive at combustion temperatures, and canbe competitive with thermal oxidation at low inlet concentrations. Thermal oxidation requiresgood primary and/or secondary safety measures to prevent explosions, while the efficiency ofcatalytic oxidation may be reduced by catalyst poisoning and ageing. Incineration of VOC alsogenerates CO2. Combustion of streams with low concentrations and for preheating of catalystsadditional fuel is consumed.
Waste is only relevant in case biofilters are exhausted. No secondary pollutants or wastes arecreated.
Operational dataUsually operating times are longer than two years. Biofilters: Input air should be 5 - 55 ºC andmoist.
ApplicabilityBiofilters: Any gas that can burn in air will oxidise in biofilters. Installation for the treatment offlows of 17 m3/h up to 135000 m3/h are found in the literature.Bioxidation: The method is highly suited for treatment of continuous constant-composition airstreams with low concentrations of organic pollutants. The method is not suitable for the directtreatment of the vapour/air mixtures often encountered in transshipments, because suchmixtures have mostly higher vapour concentrations (>1 % v/v) and appear as sudden peak flowsduring the rather infrequent unloading operations. Biotreatment facilities are certainly sensitiveto poisoning by presence of unexpected compounds in the incoming vapour stream.Consequently most of those systems needs continuous monitoring to prevent the entrance ofundesired compounds.
EconomicsThermal oxidation of VOCs. The economics of a thermal oxidation system with heat recoverywill depend on many factors, including the calorific value of the waste stream. If a thermaloxidiser is furnished with a gas-to-gas heat exchanger that has an efficiency of 60 % and a gas
Chapter 4 Techniques to consider in the determination of BAT
360 December 2001 MA/EIPPCB/REF_BREF_FINAL
flow of 4720 l/s, the payback for heat recovery will be impressive. Assume natural gas, used assupplementary fuel, costs $20/ million of kcal and electric power cost $0.08/kWh. If a systemruns 24 h/day, 350 d/yr, the payback for the 200000$ additional capital investment for a plant-type heat exchanger would be less than five months.
Biofilters: Biofiltration costs significantly cost less than the other air pollution controltechniques. Capital costs vary with flowrate and the destruction/removal efficiency. Capitalcosts start at about $15/m3/h. Operation and maintenance costs are extremely low because nofuel or chemicals are required.
EmissionSource
Refinery Process Units and Equipment (Installed andRetrofitted)
ControlTechnology
Collection of atmospheric VOCs and relief valves toflare/incineration system
Efficiency up to 99.5 % destruction efficiency in incinerationInvestmentCosts
1.3 EUR million for5 Mt/yr refinery
Operating Costs 3.0 EUR millionOther Impacts Increase in CO2 emissions due to combustion
Table 4.47: VOC control technique applied to refinerySource: UN-ECE EC AIR/WG6/1998/5
Driving force for implementationReduction of VOCs
Example plantsThermal incineration: More than 107 units operaring in the world and over 76 portables.
Reference literature[118, VROM, 1999], [181, HP, 1998]
4.23.7 Flares
DescriptionFlares are used for safety and environmental control of discharges of undesired or excesscombustibles and for surges of gases in emergency situation or upsets. The flare is usuallyrequired to be smokeless for the gas flows that are expected to occur from normal day-to-dayoperation. This gas flow is usually designed at 15 to 20 percent of the maximum design flow.Flares may become an important SO2 emitter when clean fuels are used within the refinery.
Flare systems normally can be divided into two main sections, i.e. the flare collection systemwith a flare knock out drum and the flare stack itself. When dealing with large refinerycomplexes separate knock-out drums may be installed in different process areas with ‘blocking-in’ facilities to allow maintenance during shut downs of these areas.
In Figure 4.15 a simplified process flow diagram of a flare system is shown.
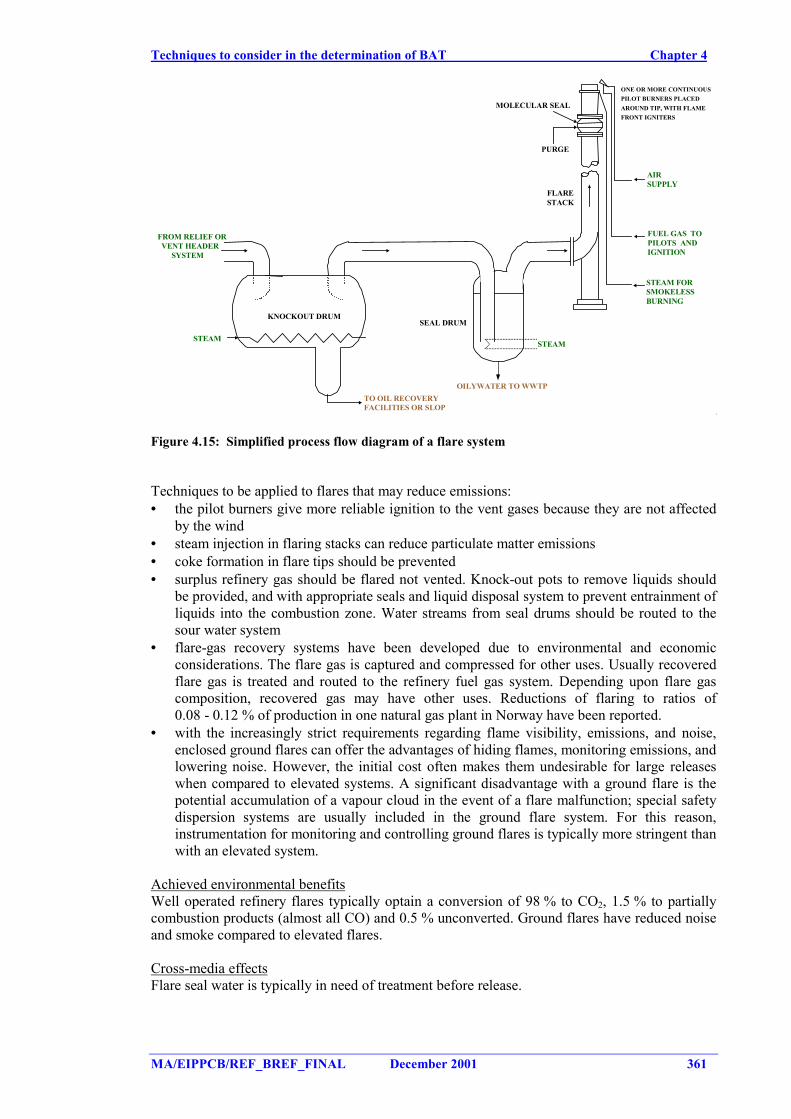
Techniques to consider in the determination of BAT Chapter 4
MA/EIPPCB/REF_BREF_FINAL December 2001 361
ONE OR MORE CONTINUOUSPILOT BURNERS PLACEDAROUND TIP, WITH FLAMEFRONT IGNITERS
AIRSUPPLY
FUEL GAS TOPILOTS ANDIGNITION
STEAM FORSMOKELESSBURNING
STEAMSTEAM
FROM RELIEF ORVENT HEADER
SYSTEM
PURGE
MOLECULAR SEAL
TO OIL RECOVERYFACILITIES OR SLOP
KNOCKOUT DRUM
OILYWATER TO WWTP
FLARESTACK
SEAL DRUM
Figure 4.15: Simplified process flow diagram of a flare system
Techniques to be applied to flares that may reduce emissions:• the pilot burners give more reliable ignition to the vent gases because they are not affected
by the wind• steam injection in flaring stacks can reduce particulate matter emissions• coke formation in flare tips should be prevented• surplus refinery gas should be flared not vented. Knock-out pots to remove liquids should
be provided, and with appropriate seals and liquid disposal system to prevent entrainment ofliquids into the combustion zone. Water streams from seal drums should be routed to thesour water system
• flare-gas recovery systems have been developed due to environmental and economicconsiderations. The flare gas is captured and compressed for other uses. Usually recoveredflare gas is treated and routed to the refinery fuel gas system. Depending upon flare gascomposition, recovered gas may have other uses. Reductions of flaring to ratios of0.08 - 0.12 % of production in one natural gas plant in Norway have been reported.
• with the increasingly strict requirements regarding flame visibility, emissions, and noise,enclosed ground flares can offer the advantages of hiding flames, monitoring emissions, andlowering noise. However, the initial cost often makes them undesirable for large releaseswhen compared to elevated systems. A significant disadvantage with a ground flare is thepotential accumulation of a vapour cloud in the event of a flare malfunction; special safetydispersion systems are usually included in the ground flare system. For this reason,instrumentation for monitoring and controlling ground flares is typically more stringent thanwith an elevated system.
Achieved environmental benefitsWell operated refinery flares typically optain a conversion of 98 % to CO2, 1.5 % to partiallycombustion products (almost all CO) and 0.5 % unconverted. Ground flares have reduced noiseand smoke compared to elevated flares.
Cross-media effectsFlare seal water is typically in need of treatment before release.
Chapter 4 Techniques to consider in the determination of BAT
362 December 2001 MA/EIPPCB/REF_BREF_FINAL
Operational dataSince air present in the stack can create a potentially explosive mixture with incoming flare gasduring low-flare gas loads, a continuous stream of purge gas is required. Also in a lot of cases amolecular water seal is employed which allows using a smaller purging rate.
ApplicabilityFlaring of toxic gases (never via a ground flare) requires special considerations. To ensure safeoperation during periods when the flare may not have a flame present, ground levelconcentration calculations for hazardous components should be performed assuming the flare asa vent only. Other safeguards may be necessary to mitigate groundlevel exposure hazards.Reliable continuous pilot monitoring is considered critical when flaring toxic gases.
There are basically two types of flares, an elevated flare and a ground flare. Ground flares areused when it is necessary to conceal the flare (for various reasons), otherwise the elevated flareis commonly chosen, because it can handle larger flow releases more economically. Sometimesa refinery has both a ground flare and an elevated flare. In that case the ground flare is used tocombust small amounts of continuous vents and small relief loads.
The elevated flare is always a vital part of the refinery complex, its primary purpose beingsafety. This flare system is designed to conduct easily ignitable and toxic vapours from theprocess area to a remote elevated location. The elevated flare system includes a seal drum toprevent the flame from flashing back into the process units, and an elevated stack with pilot-ignition and steam nozzles at the tip. Due to different burning characteristics of the gases, aseparate sour gas flare is usually provided; this flare could be equipped with different burnersthan the hydrocarbon flare to allow more efficient combustion of sour gases (H2S).
Driving force for implementationThe purpose of the flare system is to collect and process vent gases (e. g. pressure relief fromthe fractionator should pass to flare) and (large) quantities of fluids during emergency situationsor upsets: when safety relief valves are open, during depressurisation operations and purging ofprocess units in case of an emergency situation, during start-up of certain process units or priorto a scheduled shut down. Provisions are available to separate the liquids from the gases and toincinerate relieved vapours. The liquids are usually returned to the process units or tanks. Pilotburners are normally installed to take care of constant ignition of released vapours. Moreover,well controlled steam injection systems have been applied to achieve smokeless burning.
Flare-gas recovery systems often are installed to comply with local regulatory limits on flareoperation and, therefore must be sized to conform to any such limits.
Example plantsFlares are common in refineries
Reference literature[101, World Bank, 1998], [19, Irish EPA, 1993], [117, VDI, 2000], [118, VROM, 1999]
4.23.8 Combined techniques to abate air pollutants
DescriptionThe SNOX plant removes SO2, NOx and particulate from the flue gas produced by the coal-firedboilers at the Gela refinery power plant.
The SNOX plant is based on catalytic processes where the only additional material necessary isthe ammonia used for the NOx removal. Furthermore, natural gas and water are needed, besidessmall quantities of silicone oil for the acid mist control unit.
Techniques to consider in the determination of BAT Chapter 4
MA/EIPPCB/REF_BREF_FINAL December 2001 363
The process produces 94 - 95 % pure sulphuric acid (H2SO4) for sale. The system employs acatalytic converter to oxidise SO2 to SO3 at a temperature of 400 - 420 °C. This temperaturelevel allows a deNOx, operating at 380 °C, to be well fitted in the process. High NOx removal athigh NH3 slip is possible with no risk of precipitation of ammonium sulphates, as the reactortemperatures are above the decomposition temperature (350 °C) and any NH3 slip is destroyedin the SO2 / SO3 oxidiser. The process produces no waste water or waste products, nor does itconsume any chemical apart from ammonia for NOx control. The high removal of dust isdemanded by the H2SO4 production step. Dedusting with an efficiency consistently at 99.9 % isrequired as to avoid frequent clean-up of the SO2 / SO3 converter and to maintain good productquality. The flue gas train subsequently comprises an air preheater, a high-temperature ESP, thecold side of the regenerative heat exchanger, the deNOx reactor, a heat supply, the SO2/ SO3converter, hot-side regeneration heat-exchanger, the acid condenser (operating between240 - 100 °C, hydrating SO3 and condensing the resulting acid product) which heat is used asthe first step in preheating combustion air. The recovered heat, produced by the conversionprocess, is substantial and make up for the power demand when the sulphur content in the fuel(oil or coal) is 2 - 3 %. Areas relating to dust that require attention in operation are the HTEP,the SO2 / SO3 converter and the acid falling-film condenser (made of borosilicate glass tubes).
The SNOX process is divided into four main steps:• dust removal (ESP). More information in 4.23.4• selective Catalytic Reduction (SCR) of NOx. More information in 4.23.3.3• catalytic oxidation of SO2
• condensation of H2SO4
Dust removal (ESP)An extensive dust removal from the flue gas is necessary to obtain:• a long life of the deNOx catalyst• a long running time between screening of the SO2 oxidation catalyst• a high purity of the produced sulphuric acid.
Catalytic Oxidation of SO2From the SCR reactor the flue gas is distributed uniformly over the sulphuric acid catalyst in theSO2 converter. Here the SO2 initially present in the flue gas is oxidized into SO3 according tothe following reaction scheme:1) 2 SO2 + O2 2 SO3 + 23.6 kcal/gmol SO2
Condensation of H2SO4The SO3 rich flue gas from the SO2 converter is cooled from approximately 422°C down to260°C in the gas/gas exchanger, by heat exchange with the cold unconverted flue gas.Then the SO3 gas is condensed in the WSA heat exchanger.When the SO3 rich gas is cooled, the SO3 is hydrated to vapours sulphuric acid according to thefollowing reaction scheme:1) SO3 + H2O H2SO4 + 24.1 kcal/gmol SO3The cleaned gas is discharged into the atmosphere through the stack at 106°C.
Achieved environmental benefits• process qualified for treating high SO2 concentration flue gas (as in Gela refinery)• high removal of SO2, together with NOx and particulate removal• low environmental impacts: no raw material required (only ammonia consumption for NOx
control), no waste water or waste production• no cooling water consumption• production, as by-product of the process, of H2SO4 commercial grade for sale• high heat recovery.
Chapter 4 Techniques to consider in the determination of BAT
364 December 2001 MA/EIPPCB/REF_BREF_FINAL
Particulate removal rate less than 10 mg/Nm3 at ESP outletNOx removal rate 90 - 94.7 %SO2 removal rate 94 - >96 % with 5 % v/v O2 and a temperature of 410°C inlet
the SO2 converter.
Cross-media effectsH2SO4 production (95 % w/w H2SO4 concentration) 13 tonne/h with a 5.5 % w/w sulphurpet-coke
ApplicabilityThe Gela Refinery SNOX plant was designed for cleaning the flue gas produced in the boilers atpower plant burning a mixture of high sulphur Fuel Oil and high sulphur Petroleum Coke.
EconomicsA SNOX plant designed for a flue gas load of 1.0 million Nm3/h at the exit of the existinginduced draught fans had a cost of EUR 100 million.
Driving force for implementationEnvironmental Italian regulations (D.P.R. 203/88) imposed very severe limit on emissions(particulary on SO2), so AgipPetroli had to search a way to be able to continue to burn highsulphur pet-coke in its power plants in Gela refinery.
Example plantsGELA AgipPetroli Refinery Start up September 1999
Reference literature[297, Italy, 2000]
4.23.9 Odour preventing and control techniques
DescriptionScrubber with hypochlorite ion is used for odour/low-level VOC abatement.
4.23.10 Noise prevention and control techniques
DescriptionFlares, compressors, pumps, turbines and air coolers require particular attention as regardssources of noise. Abatement measures in refineries usually focus on these types of equipment.
Techniques to consider in the determination of BAT Chapter 4
MA/EIPPCB/REF_BREF_FINAL December 2001 365
4.24 Waste water treatments
This section together with the previous one and the next section are dealing with the end-of-pipeprocesses that appear in a refinery. Deeper information about the techniques included in thissection can be found in the Common waste water and wastegas treatments BREF. The reasonwhy those techniques are appearing here is to give an overall description of the techniques andto avoid repetition. Description of end-of-pipe techniques does not appear in the previoussections. In this Section, general information on environmental benefits, cross-media effects,operational data, applicability is described here. Prevention or minimisation techniques appliedto different process activities are found in each of the sections dealing with those productionprocesses. Complementing water management systems that may be found along the document,this section contains the waste water treatments. Those techniques are only discussed in thissection within this document.
Refinery waste water streams that require purification prior to discharge comprises mainly twostreams. The first effluent is process water generated in various refinery units as a consequenceof steam injection and/or washing hydrocarbon fractions with water. The direct contact withhydrocarbon fractions usually results in a high concentration of dissolved organics. Processwater is treated in a sour water stripper (SWS) when it contains hydrogen sulphide andammonia and is subsequently re-used as wash water for the desalter. The resulting effluent ishigh in oil and solids, has a high chemical oxygen demand (COD 300 - >600 mg/l) and mightcontain also specific contaminants for which legal limits apply. The second significant effluentstream that requires treatment is contaminated rainwater, referred to as surface water run-off,which usually requires only removal of free oil and solids as COD is usually below 100 mg/l.Prior to effluent treatment proper segregation and process water integration should beconsidered. Other waste water streams that appear in a refinery are the cooling water blowdown,tank water bottoms and ballast water. This section only includes the end-of-pipe processes thatappear in treatment of waste water in refinery. Deeper information about the techniquesincluded in chapter can be found in the Common waste water and wastegas treatments BREF.
Waste water treatment plants are advanced environmental protection systems for the control ofsurface water pollution. The purpose of waste water treatment is to remove floating anddispersed oil, suspended solids, dissolved oil, notably BTEX and phenol and other specificcompounds such as sulphides, cyanides, heavy metals, phosphate (when polymerisation ispresent) and nitrogen compounds and other COD. Additionally, the treated effluent can berendered suitable for re-use in the refinery process. The principle of waste water purification isbased on (1) dedicated separation techniques for the dispersed and floating oil and suspendedsolids from the waste water and (2) removal of dissolved compounds by biological treatment orfurther treatments.
4.24.1 Management of waste water within a refinery
This section try to give some indication on what can be done in a refinery with the managementof the waste water. In other words, it is better to combine waste waters from different processesor is better to process them independtly in some independent waste water plant. Topics relatedwith the storage of waste water is also included here. This section deals with process wastewater, cooling water and sanitary waste water, ballast water, cleaning water, accidentally oilcontaminated water, continuous oil contaminated water, etc.
Process water integration can be applied at any industrial site, be it a refinery or a combinedrefinery and petrochemical complex. In this document the concept and practical tools forpreparing a process water integration scheme for a refinery is presented in Section 4.15.7.1.Reference is made to a EU BREF document on waste water treatment.
DescriptionSome techniques to consider in that respect are:
Chapter 4 Techniques to consider in the determination of BAT
366 December 2001 MA/EIPPCB/REF_BREF_FINAL
1. use of sour water can be used to the maximum extend possible as desalter wash water or aswash water in overhead FCC main column
2. process water from the dimerisation process should be treated properly because the highcontent on phosphate that waste water from this process typically have
3. use of equalising tanks for the storage of waste water4. tanks for storage of ballast water may cause large VOC emissions. A way to prevent those
emissions is to cover the equalising tanks of the waste water treatment systems with floatingroofs. Technique to consider also included in the Section 4.21.13
5. the temperature of the waste water is controlled in order to reduce volatilisation and tosecure the performance of the biological treatment
6. rainwater from polluted plant areas (storm water) should be collected and routed to atreatment plant. For collection a “first flush” scheme may be used. Depending on the initialdegree of pollution (mainly oil), the contaminated water should be treated in oil/water/solidsseparation systems (API, flotation units, sandfilters) and/or biotreatment units. Non-contaminated water may be discharged directly or re-used in order to save costs. It isnecessary that the WWTP is able to handle high quantities of rainwater. For this purposesufficient buffer capacity need to be installed (storm water tank). In locations with lowrainfall segregation of streams is less relevant
7. control of surfactants in waste water - Surfactants entering the refinery waste water streamswill increase the amount of emulsions and sludges generated. Surfactants can enter thesystem from a number of sources including: washing unit pads with detergents; treatinggasolines with an end point over 400 degrees (F) thereby producing spent caustics; cleaningtank truck tank interiors; and using soaps and cleaners for miscellaneous tasks. In addition,the overuse and mixing of the organic polymers used to separate oil, water and solids in thewaste water treatment plant can actually stabilise emulsions. The use of surfactants need tobe minimised by educating operators, routing surfactant sources to a point downstream ofthe DAF unit and by using dry cleaning, high pressure water or steam to clean oil surfacesof oil and dirt
8. install high pressure power washer - Chlorinated solvent vapour degreasers can be replacedwith high pressure power washers which do not generate spent solvent hazardous wastes
9. use non-hazardous degreasers - Spent conventional degreaser solvents can be reduced oreliminated through substitution with less toxic and/or biodegradable products.
Achieved environmental benefits1. re-use of water within the refinery
Process effluent volume can be compared to the volumes of process effluent discharged(excluding once through cooling water). Although related, the values are not identical giventhat there are other sources of water to the effluent system including rainwater on plantsurfaces, water separaged from crude, ballast water, etc. On the other hand, some water willevaporate, be used in chemical reactions, etc. The correponding figures for effluents for 63European refineries are (all annual averages):
Annual average effluent volume 3.6 million m3/ yearRange 0.07 – 21 million m3/yearAverage effluent per tonne throughput 0.53 m3/ tonne throughputRange 0.09 to 1.6 m3/ tonne throughput
Other data from an EU+ country with many refineries gives the following ranges dependingon the type of refinery:
0.1 – 0.3 m3/ tonne throughput for pure refineries0.3 – 0.5 m3/ tonne throughput for lubricant refineries0.5 – 0.8 m3/ tonne throughput for bitumen refinery
Other data from another EU+ country gave a range from 0.18 – 0.21 m3/ tonne throughputfor three refineries in his country.
Techniques to consider in the determination of BAT Chapter 4
MA/EIPPCB/REF_BREF_FINAL December 2001 367
2. proper treatment of phosphates3. action has been taken in order to reduce the amount of oil to reach the API separators4. reduce the VOC emissions from waste waters5. reduce the VOC emissions and secure the performance of the biological treatment.
Driving force for implementationRe-use water, reduce the hydrocarbon charge to the waste water treatment and reduce VOCemissions.
Reference literature[118, VROM, 1999], [197, Hellenic Petroleum, 1999], [107, Janson, 1999], [262, Jansson,2000], [268, TWG, 2001]
4.24.2 Sour water stripping (SWS)
Sour water from the various refinery units is for the main part stripped in a SWS and cannormally be re-used together with crude distillation unit overhead wash water as desalter washwater. This is the main process water source in refineries.
DescriptionMost sour water strippers are single stage, requiring one stripping column. Figure 4.16 shows atypical single stage sour water stripper. The sour water streams from the process units arecollected in a sour water collection vessel. This provides both hold-up for feed and acts as asettler, where oil separation takes place. From this vessel sour water is pumped via afeed/effluent exchanger, to the top of the stripper column. The sour water is counter-currentlystripped in the column by steam, either injected live or generated in a reboiler. This column isusually refluxed to reduce the water content in the sour gas. Operating pressure in the columnvaries from 0.5 to 1.2 barg depending on the destination of the off-gas. Often pH control isapplied to maximise either H2S or NH3 removal.
Sour off-gases from a stripper unit can be routed either to a sulphur recovery unit (SRU), to anincinerator, or to the sour flare. Since off-gases routed to an incinerator or a flare contribute tothe release of SO2 and NOx, routing to a SRU unit is preferred and now commonly practised.Normally the off-gas from the sour water stripper, leaving the reflux drum containsapproximately 30 mol% water.
Two stage stripping:. The two-stage sour water stripper differs from the single stage stripper byoperating the first column at a lower pH (6), removing H2S over the top and NH3/water via thebottom, and the second stage at a higher pH (10), removing the NH3 over the top and a strippedwater stream over the bottom. These results in much lower H2S and NH3 concentration in thestripped water to be discharged to the effluent treatment plant.
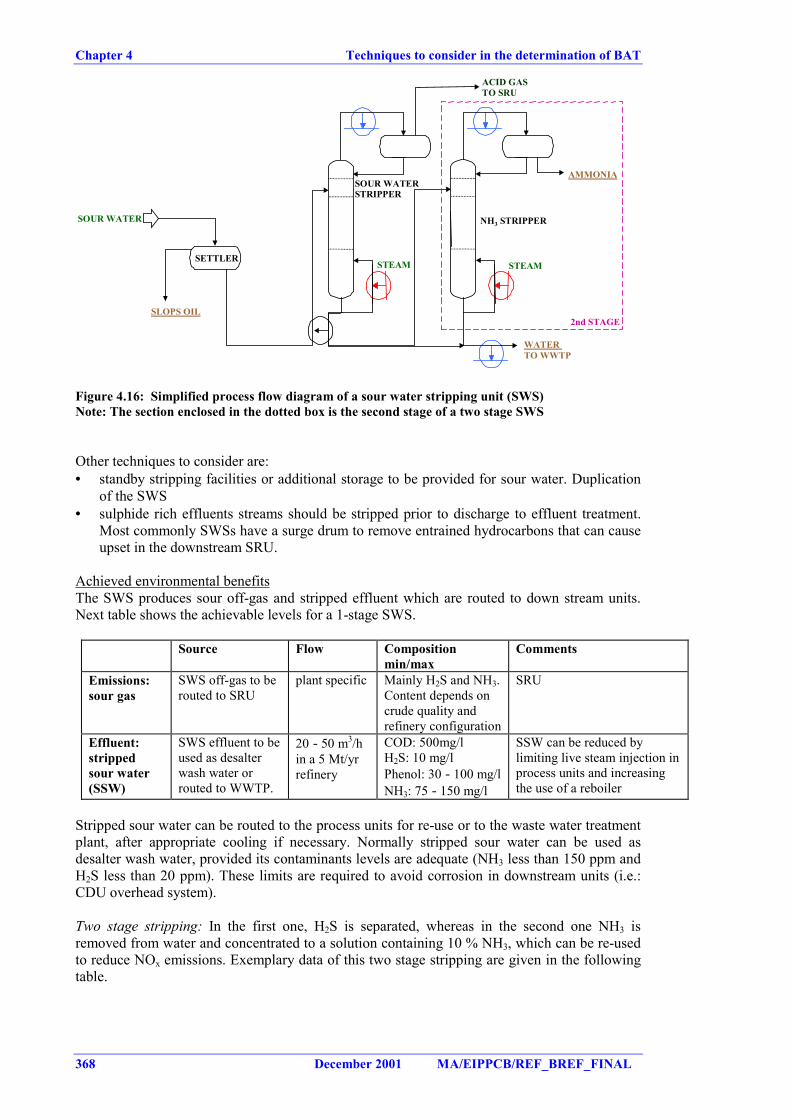
Chapter 4 Techniques to consider in the determination of BAT
368 December 2001 MA/EIPPCB/REF_BREF_FINAL
SLOPS OIL
SETTLER
SOUR WATER
WATER TO WWTP
ACID GASTO SRU
SOUR WATERSTRIPPER
STEAM
NH3 STRIPPER
STEAM
AMMONIA
2nd STAGE
Figure 4.16: Simplified process flow diagram of a sour water stripping unit (SWS)Note: The section enclosed in the dotted box is the second stage of a two stage SWS
Other techniques to consider are:• standby stripping facilities or additional storage to be provided for sour water. Duplication
of the SWS• sulphide rich effluents streams should be stripped prior to discharge to effluent treatment.
Most commonly SWSs have a surge drum to remove entrained hydrocarbons that can causeupset in the downstream SRU.
Achieved environmental benefitsThe SWS produces sour off-gas and stripped effluent which are routed to down stream units.Next table shows the achievable levels for a 1-stage SWS.
Source Flow Compositionmin/max
Comments
Emissions:sour gas
SWS off-gas to berouted to SRU
plant specific Mainly H2S and NH3.Content depends oncrude quality andrefinery configuration
SRU
Effluent:strippedsour water(SSW)
SWS effluent to beused as desalterwash water orrouted to WWTP.
20 - 50 m3/hin a 5 Mt/yrrefinery
COD: 500mg/lH2S: 10 mg/lPhenol: 30 - 100 mg/lNH3: 75 - 150 mg/l
SSW can be reduced bylimiting live steam injection inprocess units and increasingthe use of a reboiler
Stripped sour water can be routed to the process units for re-use or to the waste water treatmentplant, after appropriate cooling if necessary. Normally stripped sour water can be used asdesalter wash water, provided its contaminants levels are adequate (NH3 less than 150 ppm andH2S less than 20 ppm). These limits are required to avoid corrosion in downstream units (i.e.:CDU overhead system).
Two stage stripping: In the first one, H2S is separated, whereas in the second one NH3 isremoved from water and concentrated to a solution containing 10 % NH3, which can be re-usedto reduce NOx emissions. Exemplary data of this two stage stripping are given in the followingtable.
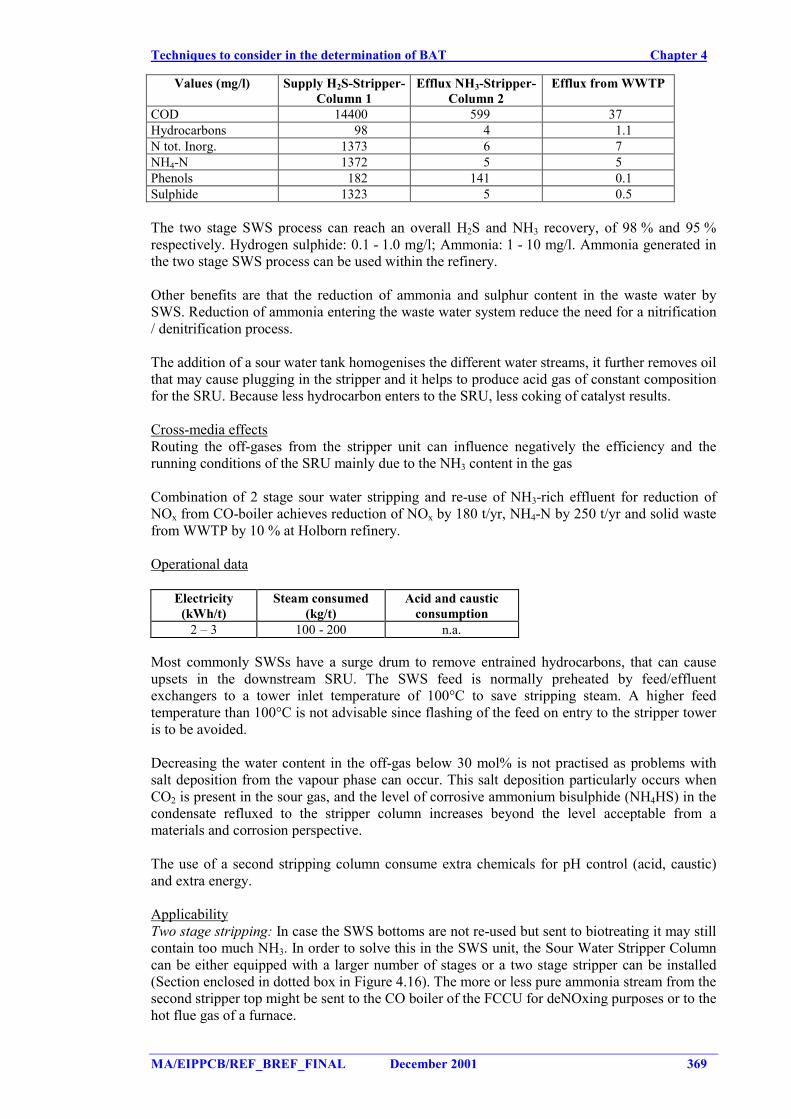
Techniques to consider in the determination of BAT Chapter 4
MA/EIPPCB/REF_BREF_FINAL December 2001 369
Values (mg/l) Supply H2S-Stripper-Column 1
Efflux NH3-Stripper-Column 2
Efflux from WWTP
COD 14400 599 37Hydrocarbons 98 4 1.1N tot. Inorg. 1373 6 7NH4-N 1372 5 5Phenols 182 141 0.1Sulphide 1323 5 0.5
The two stage SWS process can reach an overall H2S and NH3 recovery, of 98 % and 95 %respectively. Hydrogen sulphide: 0.1 - 1.0 mg/l; Ammonia: 1 - 10 mg/l. Ammonia generated inthe two stage SWS process can be used within the refinery.
Other benefits are that the reduction of ammonia and sulphur content in the waste water bySWS. Reduction of ammonia entering the waste water system reduce the need for a nitrification/ denitrification process.
The addition of a sour water tank homogenises the different water streams, it further removes oilthat may cause plugging in the stripper and it helps to produce acid gas of constant compositionfor the SRU. Because less hydrocarbon enters to the SRU, less coking of catalyst results.
Cross-media effectsRouting the off-gases from the stripper unit can influence negatively the efficiency and therunning conditions of the SRU mainly due to the NH3 content in the gas
Combination of 2 stage sour water stripping and re-use of NH3-rich effluent for reduction ofNOx from CO-boiler achieves reduction of NOx by 180 t/yr, NH4-N by 250 t/yr and solid wastefrom WWTP by 10 % at Holborn refinery.
Operational data
Electricity(kWh/t)
Steam consumed(kg/t)
Acid and causticconsumption
2 – 3 100 - 200 n.a.
Most commonly SWSs have a surge drum to remove entrained hydrocarbons, that can causeupsets in the downstream SRU. The SWS feed is normally preheated by feed/effluentexchangers to a tower inlet temperature of 100°C to save stripping steam. A higher feedtemperature than 100°C is not advisable since flashing of the feed on entry to the stripper toweris to be avoided.
Decreasing the water content in the off-gas below 30 mol% is not practised as problems withsalt deposition from the vapour phase can occur. This salt deposition particularly occurs whenCO2 is present in the sour gas, and the level of corrosive ammonium bisulphide (NH4HS) in thecondensate refluxed to the stripper column increases beyond the level acceptable from amaterials and corrosion perspective.
The use of a second stripping column consume extra chemicals for pH control (acid, caustic)and extra energy.
ApplicabilityTwo stage stripping: In case the SWS bottoms are not re-used but sent to biotreating it may stillcontain too much NH3. In order to solve this in the SWS unit, the Sour Water Stripper Columncan be either equipped with a larger number of stages or a two stage stripper can be installed(Section enclosed in dotted box in Figure 4.16). The more or less pure ammonia stream from thesecond stripper top might be sent to the CO boiler of the FCCU for deNOxing purposes or to thehot flue gas of a furnace.
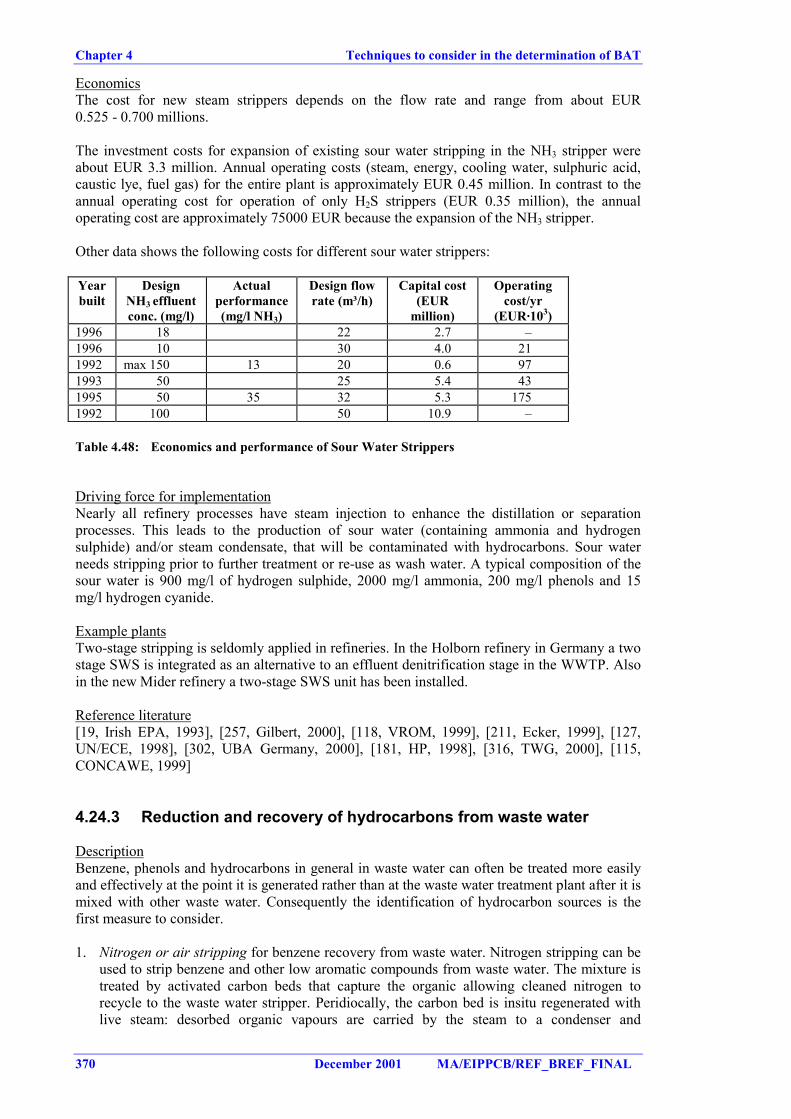
Chapter 4 Techniques to consider in the determination of BAT
370 December 2001 MA/EIPPCB/REF_BREF_FINAL
EconomicsThe cost for new steam strippers depends on the flow rate and range from about EUR0.525 - 0.700 millions.
The investment costs for expansion of existing sour water stripping in the NH3 stripper wereabout EUR 3.3 million. Annual operating costs (steam, energy, cooling water, sulphuric acid,caustic lye, fuel gas) for the entire plant is approximately EUR 0.45 million. In contrast to theannual operating cost for operation of only H2S strippers (EUR 0.35 million), the annualoperating cost are approximately 75000 EUR because the expansion of the NH3 stripper.
Other data shows the following costs for different sour water strippers:
Yearbuilt
DesignNH3 effluentconc. (mg/l)
Actualperformance(mg/l NH3)
Design flowrate (m³/h)
Capital cost(EUR
million)
Operatingcost/yr
(EUR·103)1996 18 22 2.7 –1996 10 30 4.0 211992 max 150 13 20 0.6 971993 50 25 5.4 431995 50 35 32 5.3 1751992 100 50 10.9 –
Table 4.48: Economics and performance of Sour Water Strippers
Driving force for implementationNearly all refinery processes have steam injection to enhance the distillation or separationprocesses. This leads to the production of sour water (containing ammonia and hydrogensulphide) and/or steam condensate, that will be contaminated with hydrocarbons. Sour waterneeds stripping prior to further treatment or re-use as wash water. A typical composition of thesour water is 900 mg/l of hydrogen sulphide, 2000 mg/l ammonia, 200 mg/l phenols and 15mg/l hydrogen cyanide.
Example plantsTwo-stage stripping is seldomly applied in refineries. In the Holborn refinery in Germany a twostage SWS is integrated as an alternative to an effluent denitrification stage in the WWTP. Alsoin the new Mider refinery a two-stage SWS unit has been installed.
Reference literature[19, Irish EPA, 1993], [257, Gilbert, 2000], [118, VROM, 1999], [211, Ecker, 1999], [127,UN/ECE, 1998], [302, UBA Germany, 2000], [181, HP, 1998], [316, TWG, 2000], [115,CONCAWE, 1999]
4.24.3 Reduction and recovery of hydrocarbons from waste water
DescriptionBenzene, phenols and hydrocarbons in general in waste water can often be treated more easilyand effectively at the point it is generated rather than at the waste water treatment plant after it ismixed with other waste water. Consequently the identification of hydrocarbon sources is thefirst measure to consider.
1. Nitrogen or air stripping for benzene recovery from waste water. Nitrogen stripping can beused to strip benzene and other low aromatic compounds from waste water. The mixture istreated by activated carbon beds that capture the organic allowing cleaned nitrogen torecycle to the waste water stripper. Peridiocally, the carbon bed is insitu regenerated withlive steam: desorbed organic vapours are carried by the steam to a condenser and
Techniques to consider in the determination of BAT Chapter 4
MA/EIPPCB/REF_BREF_FINAL December 2001 371
subsequently decanted into organic and water layers. Organics are returned to refinery asvaluable feed
2. Liquid-Liquid extraction from waste waters for phenol extraction from waste water3. Reduction of hydrocarbons and aromatic compounds4. High-pressure wet air oxidation. Water is intensively mixed with air and organic
compounds are oxidised in the presence of a catalyst at high temperature and high pressure(250 ºC, 7 MPa). Sulphur containing substances are oxidised to sulphates; amines andnitriles are converted to molecular nitrogen
5. Low pressure oxidation. Persistent organic compounds are treated with oxygen and aremineralised in a biological treatment plant. (BOC Gases)
6. Supercritical water oxidation process. Supercritical water (373 ºC, 221 bar) is used todissolve organic compounds, which are oxidised in a reactor by injection of oxygen
7. Energy absorption technology. Sources of contamination with hydrocarbons are desalters(40 %), storage tanks (20 %), slop-systems (15 %) and other processes (25 %). It is possibleto recognise type and extent of water contamination directly at the source by use ofelectromagnetically high frequencies (EA – Energy Absorption Technology).
Achieved environmental benefits1. A refinery has used that system to reduce 1895 l/d of waste water containing benzene 50
ppm, 100 ppm toluene/xylenes and 100 ppm of other hydrocarbons liquids. The recoveryunit consistently reduced benzene to below 500 ppb. About 35000 kg of hydrocarbon liquidare returned to the refinery feedstock annually. This technique can be also applied toremove MTBE
2. Recoveries greater than 99 % or raffinate concentrations well below 1ppm can be achieved.With this technique waste water containing > 1 % phenols was treated to get purified waterwith a phenol content lower than 1 ppm (Efficiencies: higher than 99 %; Koch ProcessTechnology, Inc.). Phenol containing waste water may also be treated microbiologically
3. The efficiency of this process is stated to be 99 % for a COD of 30000 mg/l. Sodiumsulphide of spent caustic can be reduced from 3 % to <1 mg/l (160°C; 0.9 MPa)
4. 5. Efficiency is higher than 99.9 %6. With this system emissions of hydrocarbons to water could be reduced (e.g. benzene
contamination: minus 80 %).
Operational data1. Nitrogen stripping has several advantages over air. No oxygen reduces biological fouling ofthe stripper and reduces the risk of refinery upsets creating explosive mixtures in the recoveryunit.2. Utilities: typical per m3 water feedElectricity 159 kWhSteam, 20.7 barg, 15.6 kgSteam, 2.07 barg, 103 kgWater tempered at 45 ºC, (∆T = 19 ºC) 5.6 m3
cooling at 29 ºC, (∆T = 11 ºC) 2.5 m3
Applicability1. This technology is used for the treatment of desalting water and waste water from BTEX-plants (Texaco Development Co; AMCEC, Inc.).2. They can be designed to handle waste water streams with phenol levels from several hundredppm to saturation (approx. 7 %) and above.3. This method is not applied for high flows.
Economics1. Economics: The design and equipment supply cost of about $1250000. Annual utility costsare around $85000.
Chapter 4 Techniques to consider in the determination of BAT
372 December 2001 MA/EIPPCB/REF_BREF_FINAL
2. Economics: Cost effective for levels of phenols higher than 1 %. A base case example for awaste water stream of 27.2 m3/h containing 6 % phenol was treated with 4.3 m3/h solvent in afour-column system. The overall phenol recovery was 99.3 %.Investment, extractor only, $1.32/m3
complete system, $3.43/m3
Recovered value $3.96/m3
3. Method very expensive
Driving force for implementationReduction and recovery of hydrocarbons
Example plants1. More than 15 systems ranging from 800 to 12000 l/min are now operating in various USA
refineries. Air stripping for the removal of MTBE has been used succesfully at least in oneEuropean refinery.
2. This system is typically applied when phenol concentrations are high.
Reference literature[181, HP, 1998], [211, Ecker, 1999], [316, TWG, 2000], [321, Helm, Spencer et al., 1998]
4.24.4 Primary treatments
Process water coming from the SWS is the main process water source in refineries. Moreover,some incompatible process effluents and drains from off-sites (flares and tanks) add to the totalflow of process water. This effluent has to pass first an oil/water separator (CPI, PPI or API) forfree oil and solids removal and an equalisation tank where sometimes further oil skimming canbe accomplished.
DescriptionEmissions to air of VOC (including benzene) and odorous components (hydrogen sulphides andmercaptans), however, are not uncommon and cannot always be controlled fully by up-streammeasures. Therefore APIs, CPIs can be provided with covers as an emission reduction measure,sometimes with off-gas treatment (biofilter or re-injected into the aeration basin). Safety aspects(explosiveness of VOC-air mixtures) are to be attended.
The next level of control is to install water seals (traps) on sewers and drains and gas tightcovers on junction boxes in the system. The use of covers on oil/water separators with good oilremoval facilities will prevent or reduce evaporation of liquid hydrocarbons from exposedsurfaces. Alternatively, incineration of the vapours coming from the API could be achievedfrom a covered API separator.
Achieved environmental benefitsPerformance of CPIs and APIs as regards oil removal suggests 50 - 100 ppm oil in the outlet.NMVOC emissions from oil separators can be reduced to 3 g/m3 by cover the CPI and API.
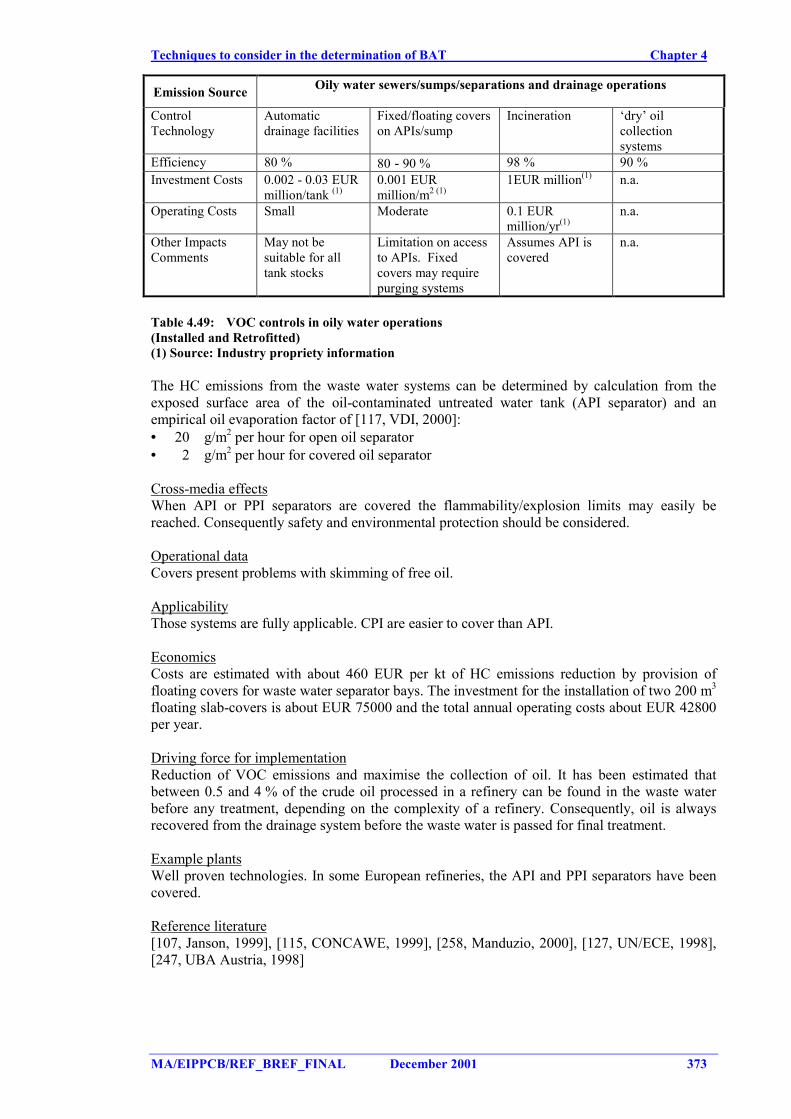
Techniques to consider in the determination of BAT Chapter 4
MA/EIPPCB/REF_BREF_FINAL December 2001 373
Emission Source Oily water sewers/sumps/separations and drainage operations
ControlTechnology
Automaticdrainage facilities
Fixed/floating coverson APIs/sump
Incineration ‘dry’ oilcollectionsystems
Efficiency 80 % 80 - 90 % 98 % 90 %Investment Costs 0.002 - 0.03 EUR
million/tank (1)0.001 EURmillion/m2 (1)
1EUR million(1) n.a.
Operating Costs Small Moderate 0.1 EURmillion/yr(1)
n.a.
Other ImpactsComments
May not besuitable for alltank stocks
Limitation on accessto APIs. Fixedcovers may requirepurging systems
Assumes API iscovered
n.a.
Table 4.49: VOC controls in oily water operations(Installed and Retrofitted)(1) Source: Industry propriety information
The HC emissions from the waste water systems can be determined by calculation from theexposed surface area of the oil-contaminated untreated water tank (API separator) and anempirical oil evaporation factor of [117, VDI, 2000]:• 20 g/m2 per hour for open oil separator• 2 g/m2 per hour for covered oil separator
Cross-media effectsWhen API or PPI separators are covered the flammability/explosion limits may easily bereached. Consequently safety and environmental protection should be considered.
Operational dataCovers present problems with skimming of free oil.
ApplicabilityThose systems are fully applicable. CPI are easier to cover than API.
EconomicsCosts are estimated with about 460 EUR per kt of HC emissions reduction by provision offloating covers for waste water separator bays. The investment for the installation of two 200 m3
floating slab-covers is about EUR 75000 and the total annual operating costs about EUR 42800per year.
Driving force for implementationReduction of VOC emissions and maximise the collection of oil. It has been estimated thatbetween 0.5 and 4 % of the crude oil processed in a refinery can be found in the waste waterbefore any treatment, depending on the complexity of a refinery. Consequently, oil is alwaysrecovered from the drainage system before the waste water is passed for final treatment.
Example plantsWell proven technologies. In some European refineries, the API and PPI separators have beencovered.
Reference literature[107, Janson, 1999], [115, CONCAWE, 1999], [258, Manduzio, 2000], [127, UN/ECE, 1998],[247, UBA Austria, 1998]
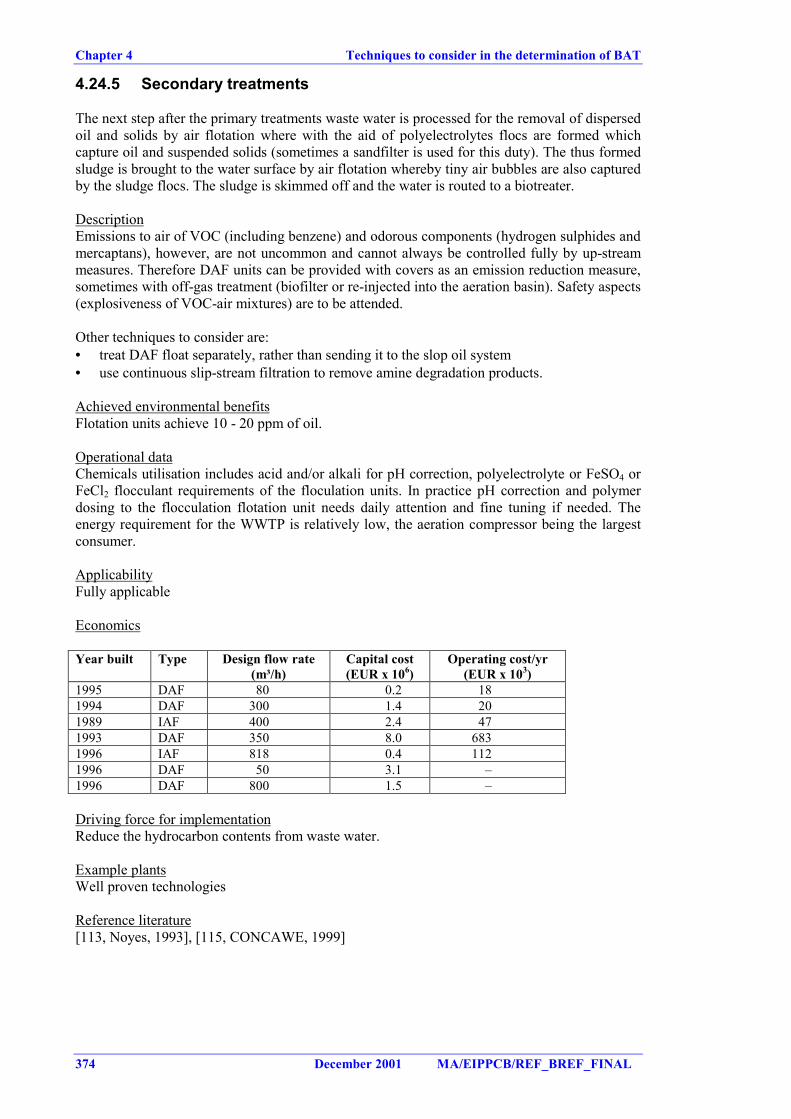
Chapter 4 Techniques to consider in the determination of BAT
374 December 2001 MA/EIPPCB/REF_BREF_FINAL
4.24.5 Secondary treatments
The next step after the primary treatments waste water is processed for the removal of dispersedoil and solids by air flotation where with the aid of polyelectrolytes flocs are formed whichcapture oil and suspended solids (sometimes a sandfilter is used for this duty). The thus formedsludge is brought to the water surface by air flotation whereby tiny air bubbles are also capturedby the sludge flocs. The sludge is skimmed off and the water is routed to a biotreater.
DescriptionEmissions to air of VOC (including benzene) and odorous components (hydrogen sulphides andmercaptans), however, are not uncommon and cannot always be controlled fully by up-streammeasures. Therefore DAF units can be provided with covers as an emission reduction measure,sometimes with off-gas treatment (biofilter or re-injected into the aeration basin). Safety aspects(explosiveness of VOC-air mixtures) are to be attended.
Other techniques to consider are:• treat DAF float separately, rather than sending it to the slop oil system• use continuous slip-stream filtration to remove amine degradation products.
Achieved environmental benefitsFlotation units achieve 10 - 20 ppm of oil.
Operational dataChemicals utilisation includes acid and/or alkali for pH correction, polyelectrolyte or FeSO4 orFeCl2 flocculant requirements of the floculation units. In practice pH correction and polymerdosing to the flocculation flotation unit needs daily attention and fine tuning if needed. Theenergy requirement for the WWTP is relatively low, the aeration compressor being the largestconsumer.
ApplicabilityFully applicable
Economics
Year built Type Design flow rate(m³/h)
Capital cost(EUR x 106)
Operating cost/yr(EUR x 103)
1995 DAF 80 0.2 181994 DAF 300 1.4 201989 IAF 400 2.4 471993 DAF 350 8.0 6831996 IAF 818 0.4 1121996 DAF 50 3.1 –1996 DAF 800 1.5 –
Driving force for implementationReduce the hydrocarbon contents from waste water.
Example plantsWell proven technologies
Reference literature[113, Noyes, 1993], [115, CONCAWE, 1999]
Techniques to consider in the determination of BAT Chapter 4
MA/EIPPCB/REF_BREF_FINAL December 2001 375
4.24.6 Tertiary treatments
DescriptionAfter the sludge is skimmed off in the flotation process, the water is routed to a biotreater,usually an activated sludge unit or to a trickling filter. By means of bacteria nearly all dissolvedhydrocarbons and other organics are removed. In case deep nitrogen removal is required,denitrification in a biotreater is an option. Oxygen using (aerobic) bacteria is able to convertammonia into nitrate and in a so-called anoxic stage (without aeration) in the biotreater otherbacteria are able to convert nitrate into atmospheric nitrogen, which escape as bubbles. Thegenerated biomass or biosludge is allowed to settle in a clarifier and for the main part recycledto the biotreater. Primary sludge from the flocculation-unit and excess biosludge are usuallysent to a thickener prior to dewatering and disposal (Figure 4.17). Air Flocculation Flotationprocesses can be operated with Dissolved or Induced Air (DAF or IAF resp.).
Other techniques to consider are:• heterotroph denitrification combined with autotrophic sulphide oxidation (the reductive
potential of sulphide is used to eliminate nitrogen via denitrifiction, simultaneously sulphideoxidised, so that sulphide precipitation in subsequent biological treatment unit isunnecesary)
• granular activated carbon (GAC). Pollutants are adsorbed and biologically treated in anoxygen rich atmosphere. (attainable COD: <100 mg/l)
• powdered activated carbon (PAC). Similar to GAC• cover of the waste water treatment plant. Fixed covers are to be avoided for loss prevention
purposes (building up of explosive vapours)• emissions to air of VOC (including benzene) and odorous components (hydrogen sulphides
and mercaptans), are not uncommon and cannot always be controlled fully by up-streammeasures. Therefore sometimes the aeration basins of biotreaters can be provided withcovers as an emission reduction measure, sometimes with off-gas treatment (biofilter or re-injected into the aeration basin). Safety aspects (explosiveness of VOC-air mixtures) are tobe attended, however they are less dangerous than in up-stream units.
Achieved environmental benefitsA biotreater can remove 80 - 90 % of dissolved oil and COD as well as 90 - 98 % BOD undernormal operating conditions. Natural nitrogen removal is normally about 10 % in an activatedsludge unit (ASU), 70 - 80 % in a nitrification/denitrification biotreater (DNB) and up to 90 %in a tertiary (add-on) denitrification unit. For MAH/phenol >95 % removal can be achievedbased on a well-adapted biological system. Oxygen aireation in activated sludge plants can beup to 50 % more efficient than air aeration techniques.
Cross-media effectsEnergy consumption, activated carbon wastes when GAC or PAC are appplied and methanolconsumption when denitrification is applied. Waste water treatment generate sludge. If wastewater treatment is not properly operated the amount of sludge can be increased.
Operational dataIf a denitrification biotreater is applied pumping energy is relatively high. If a tertiary treatmentunit is used for ammonia removal by biological nitrification, methanol can be used as in asubsequent denitrification stage as an oxygen receptor for denitrifiying bacteria. In somerefinery biotreaters powdered activated carbon is dosed for meeting discharge specs. Thesensitivity of a biotreater against shock loads (peak discharges) of toxic compounds (e.g.sulfolane, MTBE, phenol, cyanide, sulphide) is relatively large and should be avoided by spillprevention measures, good housekeeping and equalisation in a buffer tank.
ApplicabilityFully applicable. Toxic streams should not enter a biotreater.
Chapter 4 Techniques to consider in the determination of BAT
376 December 2001 MA/EIPPCB/REF_BREF_FINAL
EconomicsA complete API, equalisation tank, DAF, DNB biotreater, clarifier train for 125 m3/h requiresan investment cost of about EUR 15 million provided the up-stream drainage infrastructure isavailable. Operating costs are in the order of EUR 1.5/m3.
Floating cover: Capacity of the process 800 m3/h of oily water may emit up to 1000 t/yrEfficiency: 90 % of recovery of the VOCInvestment cost EUR 0.6 millionOperating cost: EUR 0.03 million per year
Driving force for implementationDenitrification biotreaters are usually applied in environments sensitive to nitrates.
Example plantsWell proven technologies. Nitrification/denitrification biotreater installations are operational atHarburg, Godorf and Gothenburg refineries.
Reference literature[181, HP, 1998], [45, Sema and Sofres, 1991]
4.24.7 Final treatments
In countries where water is a scarce resource it is sometimes economically attractive to furtherimprove the quality of the effluent in order to re-use the water as wash water or even as a sourcefor the preparation of boiler feed water (BFW). In that case sand filtration (SF), followed by acombination of ultrafiltration (UF) or activated carbon filtration (AC) and reverse osmosis (RO)for salt removal generates sufficiently pure water for entering the demineralisation unit of theBFW preparation unit. Other techniques are ozonation/oxidation, ion exchange and incineration.
DescriptionTechniques for the reduction of salt contents of the waste water: Ion exchange, Membraneprocesses or Osmosis.Metals may be separated by Precipitation, Flotation, Extraction, Ion exchange or Vacuumdistillation.
Achieved environmental benefitsSee Section 4.24.8
Cross-media effectsEnergy consumption, wastes from exhausted activated carbon, membranes and metal sludges.
Operational dataActivated carbon is needed if AC filtration appears in the system.
EconomicsWhen the WWTP is extended with SF and AC, the operating costs of the resulting WWTP isdoubled in reference with a WWTP without those systems (base case). With UF and RO boththe investment costs and the operating costs will approximately triple the base case.
Driving force for implementationThese systems have been installed at some locations only in BFW preparation. Applied inrefineries where shortages of water supply may occur.
Example plantsSandfilters, ultrafiltration, activated carbon and reverse osmosis are proven technologies.
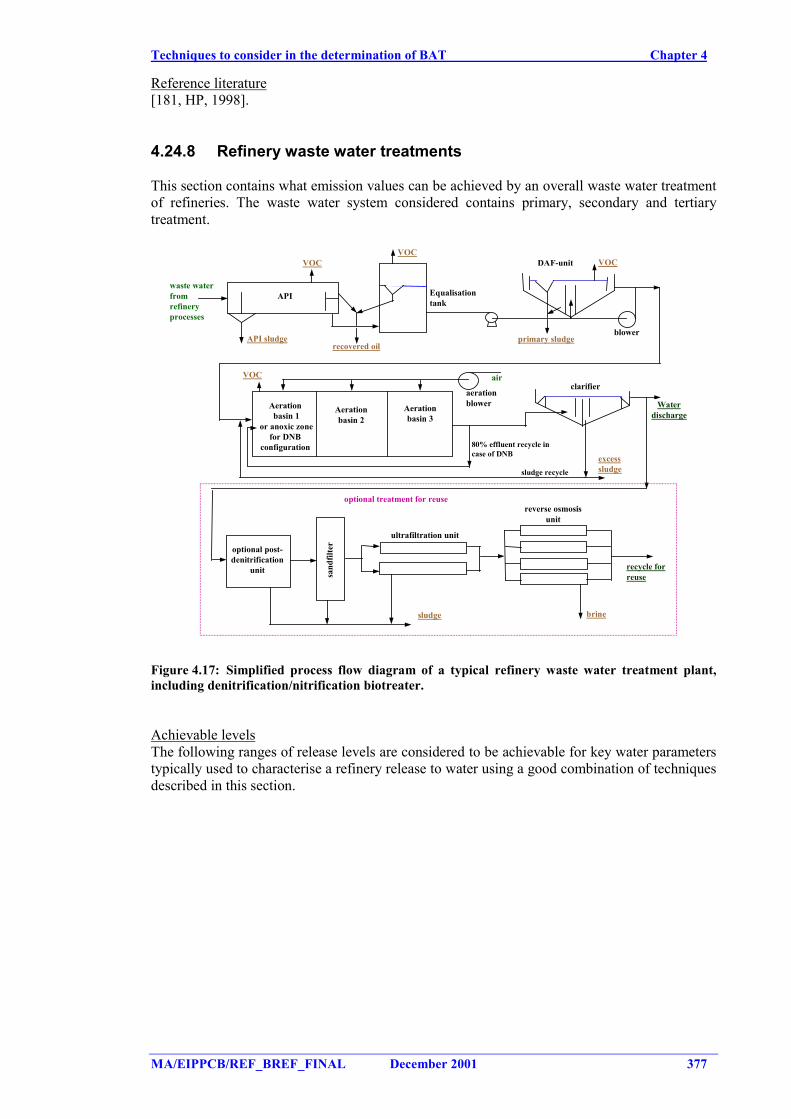
Techniques to consider in the determination of BAT Chapter 4
MA/EIPPCB/REF_BREF_FINAL December 2001 377
Reference literature[181, HP, 1998].
4.24.8 Refinery waste water treatments
This section contains what emission values can be achieved by an overall waste water treatmentof refineries. The waste water system considered contains primary, secondary and tertiarytreatment.
brinesludge
recycle forreuse
optional treatment for reuse
sludge recycle
optional post-denitrification
unit sand
filte
r
ultrafiltration unit
reverse osmosisunit
excesssludge
Aerationbasin 2
API Equalisationtank
DAF-unit
recovered oilprimary sludgeAPI sludge
Waterdischarge
clarifier
waste waterfromrefineryprocesses
Aeration basin 1
or anoxic zonefor DNB
configuration
Aerationbasin 3
blower
aerationblower
air
VOCVOC
VOC
VOC
80% effluent recycle incase of DNB
Figure 4.17: Simplified process flow diagram of a typical refinery waste water treatment plant,including denitrification/nitrification biotreater.
Achievable levelsThe following ranges of release levels are considered to be achievable for key water parameterstypically used to characterise a refinery release to water using a good combination of techniquesdescribed in this section.
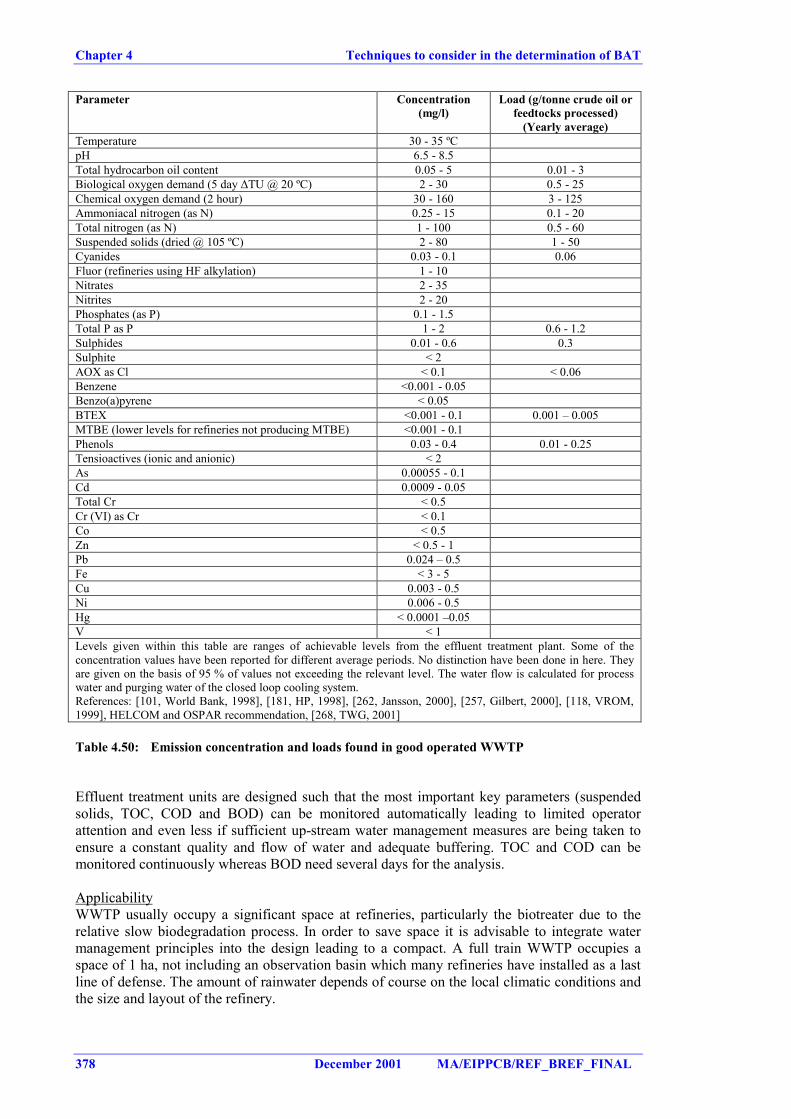
Chapter 4 Techniques to consider in the determination of BAT
378 December 2001 MA/EIPPCB/REF_BREF_FINAL
Parameter Concentration(mg/l)
Load (g/tonne crude oil orfeedtocks processed)
(Yearly average)Temperature 30 - 35 ºCpH 6.5 - 8.5Total hydrocarbon oil content 0.05 - 5 0.01 - 3Biological oxygen demand (5 day ∆TU @ 20 ºC) 2 - 30 0.5 - 25Chemical oxygen demand (2 hour) 30 - 160 3 - 125Ammoniacal nitrogen (as N) 0.25 - 15 0.1 - 20Total nitrogen (as N) 1 - 100 0.5 - 60Suspended solids (dried @ 105 ºC) 2 - 80 1 - 50Cyanides 0.03 - 0.1 0.06Fluor (refineries using HF alkylation) 1 - 10Nitrates 2 - 35Nitrites 2 - 20Phosphates (as P) 0.1 - 1.5Total P as P 1 - 2 0.6 - 1.2Sulphides 0.01 - 0.6 0.3Sulphite < 2AOX as Cl < 0.1 < 0.06Benzene <0.001 - 0.05Benzo(a)pyrene < 0.05BTEX <0.001 - 0.1 0.001 – 0.005MTBE (lower levels for refineries not producing MTBE) <0.001 - 0.1Phenols 0.03 - 0.4 0.01 - 0.25Tensioactives (ionic and anionic) < 2As 0.00055 - 0.1Cd 0.0009 - 0.05Total Cr < 0.5Cr (VI) as Cr < 0.1Co < 0.5Zn < 0.5 - 1Pb 0.024 – 0.5Fe < 3 - 5Cu 0.003 - 0.5Ni 0.006 - 0.5Hg < 0.0001 –0.05V < 1Levels given within this table are ranges of achievable levels from the effluent treatment plant. Some of theconcentration values have been reported for different average periods. No distinction have been done in here. Theyare given on the basis of 95 % of values not exceeding the relevant level. The water flow is calculated for processwater and purging water of the closed loop cooling system.References: [101, World Bank, 1998], [181, HP, 1998], [262, Jansson, 2000], [257, Gilbert, 2000], [118, VROM,1999], HELCOM and OSPAR recommendation, [268, TWG, 2001]
Table 4.50: Emission concentration and loads found in good operated WWTP
Effluent treatment units are designed such that the most important key parameters (suspendedsolids, TOC, COD and BOD) can be monitored automatically leading to limited operatorattention and even less if sufficient up-stream water management measures are being taken toensure a constant quality and flow of water and adequate buffering. TOC and COD can bemonitored continuously whereas BOD need several days for the analysis.
ApplicabilityWWTP usually occupy a significant space at refineries, particularly the biotreater due to therelative slow biodegradation process. In order to save space it is advisable to integrate watermanagement principles into the design leading to a compact. A full train WWTP occupies aspace of 1 ha, not including an observation basin which many refineries have installed as a lastline of defense. The amount of rainwater depends of course on the local climatic conditions andthe size and layout of the refinery.
Techniques to consider in the determination of BAT Chapter 4
MA/EIPPCB/REF_BREF_FINAL December 2001 379
4.25 Waste management
This section together with the two previous ones are dealing with the end-of-pipe processes thatappear in a refinery. The reason why those techniques are appearing here is to give an overalldescription of the techniques and to avoid repetition. Description of end-of-pipe techniques doesnot appear in the previous sections. In this Section, general information on environmentalbenefits, cross-media effects, operational data, applicability is described here. Prevention orminimisation techniques applied to different process activities are found in each of the sectionsdealing with those production processes. Complementing waste minimisation and prevention ofgeneration of waste that may be found along this chapter, this section contains the wastemanagement systems that may be found within refineries. Those techniques are only discussedin this section within this document.
Residual refinery wastes are typically in the form of sludges, spent process catalysts, filter clay,and incinerator ash. Other waste fractions are waste from flue gas desulphurisation, fly ash,bottom ash, spent activated carbon, filter dust, inorganic salts as ammonium sulphate and limefrom water pretreatment, oil-contaminated soil, bitumen, sweepings, spent acid and causticsolutions, chemicals, among others. Treatment of these wastes includes incineration, landtreating off-site, land filling onsite, land filling off-site, chemical fixation, neutralization, andother treatment methods.
4.25.1 Establishment of a waste management programme
DescriptionThe establishment of an Environmental Management System (Section 4.15.1) should containelements to prevent waste generation and some pollution prevention techniques that help toprevent pollution of soil and groundwater. Some techniques that may be included are:• implementation of a sludge master plan with the aim to reduce the sludge generated.• provide enclosed sampling loops• clean and assembly only in especially constructed and dedicated areas• provide dedicated drainage systems• physical barriers such as clay walls or plastic membranes can be installed around the site
boundary. To be effective at containing oil pollution, these have to extend below the watertable. Monitoring wells will also be required to ensure that if oil does build up behind thebarrier, it can be removed before it has a chance to escape under the barrier. A second formof barrier is a ditch also extending to below the groundwater table. Any oil leaving the sitecan be observed floating on the water in the ditch and recovered. The outer face of the ditchcan be sealed with an impervious layer such as concrete, plastic, clay, steel piling etc
• groundwater, like surface water basically flows downhill. Therefore, groundwater can beprevented from leaving a site by lowering the level inside the site by pumping so that it islower than the level outside. Water will then flow into the site rather than outwards. Thepumped water has obviously to be disposed of. It may be possible to use this water forsupply purposes on site. If it is to be discharged, then monitoring will be required to ensurethat it is not contaminated. If it is, then it will have to be treated in which case, this methodwill be limited by the capacity of the effluent treatment system
• minimisation of underground piping. Underground piping can be a source of undetectedreleases to the soil and groundwater. Inspecting, repairing or replacing underground pipingwith surface piping can reduce or eliminate these potential sources. Retrofitting can be veryexpensive
• perform a risk analysis to rank in order of significance cases where accidental leak mayoccur (elements to consider are the product in the tanks/pipes, the age of the equipment, thenature of the soil and groundwater that would be affected). Prioritise areas whereimpermeable floors are needed most. Produce a multiyear master plan to program necessarysteps
• periodically screening of leaks in sewers and pipes.• correct conditioning of a catalyst during a run extends catalytic life
Chapter 4 Techniques to consider in the determination of BAT
380 December 2001 MA/EIPPCB/REF_BREF_FINAL
• control of sodium content in visbreaker feedstock reduces coke formation• process optimisation leads to less off-specification product and hence less recycle• recycling caustic sufficiently can ensure it is completely spent• Sorting waste mixes e.g. concrete and scrap metal. could be cost-attractive (cheaper disposal
routes for some components) and eliminates risk of unwanted components• asbestos lagging: special equipment for compaction & packing• TEL/TML scale & sludge: permanganate treatment eliminates TEL/TML traces• oiled solids (soil): de-oiling in an oil extractor.• neutralisation: mixing polymerisation catalyst (H3PO4) with lime• Process treatment by steaming, flushing or regeneration prior to disposal: clay and sand
filters; catalysts• Solids released to the waste water sewer system can account for a large portion of a
refinery's oily sludges. Solids entering the sewer system (primarily soil particles) becomecoated with oil and are deposited as oily sludges in the API oil/water separator. Because atypical sludge has a solids content of 5 to 30 percent by weight, preventing one kg of solidsfrom entering the sewer system can eliminate 3 to 20 kg of oily sludge. TheAmoco/USAEPA study estimated that at the Yorktown facility 1000 tonnes of solids peryear enter the refinery sewer system. Methods used to control solids include: using a streetsweeper on paved areas, paving unpaved areas, planting ground cover on unpaved areas, re-lining sewers, cleaning solids from ditches and catch basins, and reducing heat exchangerbundle cleaning solids by using antifoulants in cooling water.
• A significant portion of refinery waste arises from oily sludges found in combinedprocess/storm sewers. Segregation of the relatively clean rainwater runoff from the processstreams can reduce the quantity of oily sludges generated. Furthermore, there is a muchhigher potential for recovery of oil from smaller, more concentrated process streams.
Achieved environmental benefitsThe aim of such a programme is to prevent contamination of the soil and the groundwater aswell as reduce the amount of waste generated.
Reference literature[195, The world refining association, 1999], [316, TWG, 2000], [115, CONCAWE, 1999]
4.25.2 Sludge management and treatment
DescriptionSludges are defined as emulsions of oil in water, stabilised by the presence of solids. Inrefineries a number of different types of sludges are generated at the following sources: crudeand product tanks (bottoms), API separation units, flocculation and flotation units, DAF,contaminated soil. Biological sludges represent an important different category of sludges interms of oil content and dewaterability. According to CONCAWE, in 1993, 44 % of theEuropean refinery sludges were incinerated, 9 % was land farmed and 30 % land filled. It isforeseen that land filling and land farming of sludges will be increasingly prohibited byforthcoming EU legislation, which means that the scope for sludge prevention reduction butalso for incineration at third parties will increase in the future.
The purpose of sludge treatment by dewatering, drying and/or incineration is to reduce thevolume and the residual hydrocarbon content in order to save costs in subsequent processing ordisposal. The principle of mechanical dewatering by decanters is based on centrifugal forces andon the density difference between water, oil and solids. The principle of the thermal treatmentsteps is based on a combination of evaporation by indirect heating and/or destruction of theorganic constituents by thermal oxidation (incineration).
Decanter centrifuges are the most widely used for dewatering both oily and for biosludges.Steam dryers are almost exclusively applied for biosludge and function often as a pretreatment
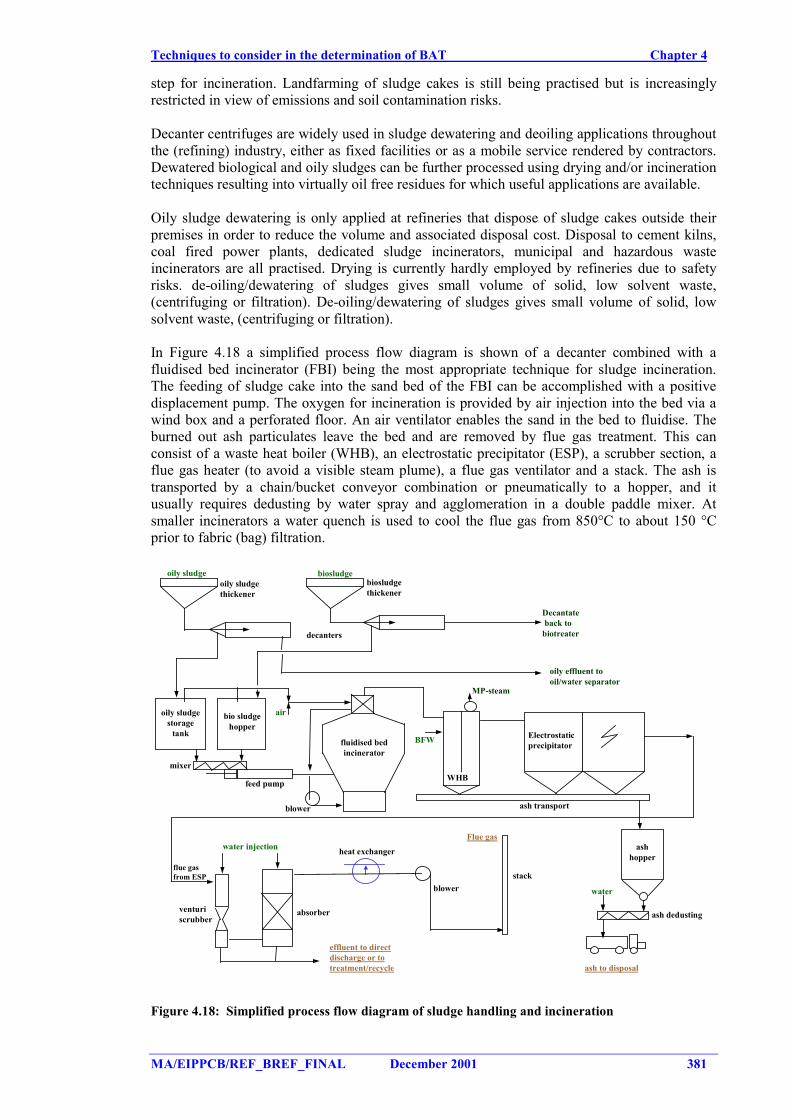
Techniques to consider in the determination of BAT Chapter 4
MA/EIPPCB/REF_BREF_FINAL December 2001 381
step for incineration. Landfarming of sludge cakes is still being practised but is increasinglyrestricted in view of emissions and soil contamination risks.
Decanter centrifuges are widely used in sludge dewatering and deoiling applications throughoutthe (refining) industry, either as fixed facilities or as a mobile service rendered by contractors.Dewatered biological and oily sludges can be further processed using drying and/or incinerationtechniques resulting into virtually oil free residues for which useful applications are available.
Oily sludge dewatering is only applied at refineries that dispose of sludge cakes outside theirpremises in order to reduce the volume and associated disposal cost. Disposal to cement kilns,coal fired power plants, dedicated sludge incinerators, municipal and hazardous wasteincinerators are all practised. Drying is currently hardly employed by refineries due to safetyrisks. de-oiling/dewatering of sludges gives small volume of solid, low solvent waste,(centrifuging or filtration). De-oiling/dewatering of sludges gives small volume of solid, lowsolvent waste, (centrifuging or filtration).
In Figure 4.18 a simplified process flow diagram is shown of a decanter combined with afluidised bed incinerator (FBI) being the most appropriate technique for sludge incineration.The feeding of sludge cake into the sand bed of the FBI can be accomplished with a positivedisplacement pump. The oxygen for incineration is provided by air injection into the bed via awind box and a perforated floor. An air ventilator enables the sand in the bed to fluidise. Theburned out ash particulates leave the bed and are removed by flue gas treatment. This canconsist of a waste heat boiler (WHB), an electrostatic precipitator (ESP), a scrubber section, aflue gas heater (to avoid a visible steam plume), a flue gas ventilator and a stack. The ash istransported by a chain/bucket conveyor combination or pneumatically to a hopper, and itusually requires dedusting by water spray and agglomeration in a double paddle mixer. Atsmaller incinerators a water quench is used to cool the flue gas from 850°C to about 150 °Cprior to fabric (bag) filtration.
bio sludgehopper
mixer
feed pump
fluidised bedincinerator
blower
BFW
air
MP-steam
Electrostaticprecipitator
ash transport
ashhopper
WHB
flue gasfrom ESP
blowerstack
heat exchanger
absorberventuriscrubber
water injection
effluent to directdischarge or totreatment/recycle
ash dedusting
ash to disposal
water
Flue gas
oily sludgestorage
tank
oily sludgethickener
biosludgethickener
decanters
oily effluent tooil/water separator
Decantate back tobiotreater
oily sludge biosludge
Figure 4.18: Simplified process flow diagram of sludge handling and incineration
Chapter 4 Techniques to consider in the determination of BAT
382 December 2001 MA/EIPPCB/REF_BREF_FINAL
Operating temperatures of the bed can be controlled at respectively 800 – 850 °C and 850 – 950 °C. The WHB operates between 250 and 450 °C, the ESP at 220 °C and the scrubberbetween 200 and 50 °C. In a FBI all ash is carried over the top with the flue gas, which providesa large dust loading (typically 50000 mg/Nm3) to the WHB and ESP. Some 50 % of the dust iscollected in the WHB, which can be regarded as a settling chamber. The catchment efficiency ofan ESP is typically 99 %, leaving the (venturi) scrubber system to eliminate ± 500 mg/Nm3 tothe stringent CEC limit of 5 mg/Nm3. The ash might find a useful outlet in concrete or asphaltdependent on the quality.
It should be mentioned that the emissions of SO2, NOx, CO, organic compound, PAH, heavymetals generated by those systems should be properly controlled by suitable abatementtechniques.
Achieved environmental benefitsGeneration of sludges can be minimised and can be maintained to values between 0.1 to 0.5 kgper tonne of feedstock processed within the refinery.
Cross-media effectsScrubbing might require caustic if acidic (SO2 and NOx) components are present in the flue gasin concentrations which need to be removed to legal limits. The FBI with flue gas treatment andash handling is a closed system, with fully automated control. The system is kept under slightnegative pressure. The described system is regarded state-of-the-art for sludge incineration andis able to fulfil all legal stack emission requirements. Dioxins (PCDD/F) could be an issue athigh chlorine loading combined with sub-optimum operation conditions. In flue gas treatmentsystems of domestic sludge incinerators impregnated activated carbon filters (ACF) or zeolitesare installed for mercury/dioxin control. Effluent from the scrubber system can be substantial.Recirculation of scrubber water is only a cost effective proposition if treatment is required priorto discharge.
Operational dataSafety issues are associated with start-up and (planned or emergency) shut-down, for which aflame control interlock and a nitrogen purging system is required. Anaerobic and pyrophoricsludges (tank bottoms) can cause safety problems during storage and drying. The energyrequirements of sludge drying and incineration depend strongly on the sludge cakecharacteristics (water and residual oil contents). Energy integration with FBI is two fold: airpreheating of the primary fluidisation air is standard, and steam generation can be economicallyaccomplished with systems able to generate >8 tonnes of MP steam/hour. An intrinsicdisadvantage of FBI is the relatively large excess of air utilised in order to keep the bedfluidised.
ApplicabilityBecause its high cost, options as reduction/recycling of waste are more typical wasteminimisation options to be applied before waste incineration. Fluidised bed incinerators may bean option for third-party waste industry receiving waste streams.
EconomicsFor a FBI with a capacity of 4 t/h sludge cake (20 % dry solids) a footprint of about 50x100 m isrequired including tankage and complete flue gas and ash handling. The installation is normally12 - 15 m high (tanks, incinerator, WHB, ESP, ash hopper) and the stack height is usually atleast 40 m, dependent on ancillary installations. The above-described system would be suitablefor a large 20 Mt/yr refinery and requires a capital investment of about EUR 37.5 million(including installation). The operational costs could amount to EUR 500 - 700/tonne dry solids.If large scale domestic sludge incinerators are available, which are entitled to take industrialsludges, the installation of a dedicated sludge incineration system is not economicallyjustifiable. This certainly would be the case for smaller refineries, indicating that contractdewatering, drying and incineration are competitive to own processing.
Techniques to consider in the determination of BAT Chapter 4
MA/EIPPCB/REF_BREF_FINAL December 2001 383
A combination of decanters with an advanced drying system for oily sludge occupies only10 - 15 % of the above indicated space, and would involve a capital investment of EUR 5million due to the fact that expensive flue gas treatment is avoided.
Driving force for implementationAt some locations it has become common in the last 5 - 10 years to minimise sludges, collectthem in tanks or basins and recover as much as possible the oil and water phases after gravitysettling.
Example plantsDecanter centrifuges are reliable, advanced and proven technology with minimum emissions. Atrefinery locations permanent decanter centrifuges have for example been installed at refineriesin Godorf, Gothenburg and Stanlow. A few times per year contractors are hired in either for on-site sludge processing or for collection and off-site processing (decanting, drying, incinerationin cement kilns, power plants or in industrial/domestic waste or dedicated sludge incinerators).
Sludge incineration plants using the fluidised bed system are state-of-the-art but requireadvanced design and process control. At several refineries Mobil, Wilhelmshafen, Shell Pernisand Godorf, Esso Botlek these systems were already built in the 1970s. Some of them have beendismantled due to the current availability of more economic options as compared with necessaryinvestment and operation in additional flue gas cleaning equipment. For oily sludges mixingwith other wastes and use as secondary fuel in cement kilns and/or power plants represents anattractive disposal route if those plants use appropriate abatement techniques. Internationalsludge contractors employ either mobile decanter and drying systems for oil recovery (Impex,EPMS, Soil Recovery A/S) or fixed oily sludge treatment systems (ATM).
4.25.3 Spent solid catalyst management
A BREF on Non-Ferrous metals has been already published. In that BREF the techniques usedfor the recovery of metals from secondary materials (e.g. refinery catalysts) is extensivellytreated.
The use of catalytic processes in refineries has increased significantly in the last 20 years. Thisincrease is mainly due to the introduction of catalytic residue conversion processes such asheavy oil residue cracking, hydrocracking and residue hydroconversion, hydrodemetallisationand hydrofinishing and also Hydrogen production. Since 1980 a significant expansion has takenplace of the hydrotreating and hydrodesulphurisation capacity as well as of sulphur recoveryunits and associated tail gas treatment, which processes also utilise catalysts. Traditionalcatalytic processes such as fluid catalytic cracking, catalytic reforming and isomerisation arealso generators of spent catalysts.
DescriptionThe purpose of spent catalyst management is to minimise environmental and health impacts. Toachieve this goal spent catalysts are carefully handled, safely removed, carefully packed andsent for reactivation or metal reclamation. Metal recovery aims at conversion of spent catalystsinto useful products, which can be recycled and re-used with minimum impact on theenvironment.
The principle of spent catalyst management is a scheduled, strictly regulated and safe handlingof the materials involved, usually executed by specialised contractors during plant turn-arounds.Arrangements with the supplier of fresh catalyst can sometimes be made for them to take backthe spent catalyst.
Regeneration of hydroprocessing catalysts is usually possible 3 or 4 times. The ultimate spentcatalysts are almost exclusively reworked by third parties into commercial metal oxides or metalsalt solutions. Although a regeneration process has been developed for spent FCC catalysts, this
Chapter 4 Techniques to consider in the determination of BAT
384 December 2001 MA/EIPPCB/REF_BREF_FINAL
process is hardly used due to the availability of cheaper alternatives. The catalyst carrier(alumina and/or silica) can sometimes be converted into products or is disposed of otherwise.Some refineries practise storage of spent catalysts at the refinery site with permission of theauthorities. Spent catalysts are distinguished by type, process, composition and recyclability. Asummary is given in Table 3.78.
Co/Mo catalysts from hydrodesulphurisation, hydrocracking, hydrotreating. Extensiveregeneration and reclamation options are available.
Ni/Mo catalysts are typically used in hydrotreaters and hydrocracking units. Regeneration andreclamation capacity is available.
Ni/W catalysts are used in lube oil hydrofinishing. This category experiences limitations todispose off in view of the high Tungsten content (24 % w/w).
FCC spent catalysts, also including heavy oil and residue cracking spent catalysts (RCC), arethe largest catalyst waste category in refineries. Outlets in road building are becoming available.
Reformer and Isomerisation catalysts are exclusively reprocessed by the suppliers of the freshcatalysts. Replacement contracts have been concluded since the introduction of these processesdue to the very expensive noble Pt metal involved.
Hydrodemetallisation catalysts typically have high vanadium contents (10 - 20 %) and arecurrently alumina based (used to be silica). Direct disposal to the steel industry is possibly themost cost-effective option.
Zn containing beds from H2 plants are typically recycled to the Zn-industry where ZnS ores areprocessed. Amounts are some 50 t/yr.
The applied regeneration processes are based on pyrometallurgical techniques (roasting-,calcination, smelting-, sintering- and reduction furnaces) for thermal destruction of theinorganic matrix and on hydrometallurgical methods (aqueous/acid extraction, crystallisation,precipitation, separation and drying) for recovery/purification of metal salts either in dry form oras liquid metal concentrates.
The reclamation plants (more information in Non-Ferrous BREF) are typically operated in batchmode and contain many different unit operations. From the total spent catalysts only some 5 %pure products are produced. The remainder is either ferro-alloy feed or ceramic raw material.The plant usually processes relatively small batches. Spent hydroprocessing catalysts can varyconsiderably in composition. Hence the plants have limited process automation.
Achieved environmental benefitsRecover of metals from catalyst
Cross-media effectsThe management of spent catalysts is an area of environmental concern because prolongeduncontrolled storage may lead to soil and groundwater contamination with heavy metals.
If the refinery has taken proper catalyst management measures the environmental concernsfocus usually on the spent catalyst regeneration facilities. Most of these plants currently operatewith proper flue gas and effluent treatment facilities and comply with present day emissionstandards. This is an important requirement for being acceptable for oil companies to make useof these spent catalyst reclamation contractors. Covering spent catalyst reception facilities isoperational or being considered.
Techniques to consider in the determination of BAT Chapter 4
MA/EIPPCB/REF_BREF_FINAL December 2001 385
Operational dataSafe handling of chemicals is an important issue for spent catalyst metal reclaimers as toxic andpyrophoric materials are being handled. For the refinery utilisation of energy and processmaterials during spent catalyst handling are not particularly relevant.
EconomicsCost for processing and metal recovery depend strongly on the composition of the spent catalystconcerned. For high metal waste even a recovery fee will be paid to the waste generator. Currentprocessing costs for an average HDS catalyst could be in the order of EUR 500/tonne. Recentstringent internationally accepted legal procedures, amongst which special packaging (for rent2 m3 containers at EUR 5/day), labelling and acceptance requirements as well as transportationcosts could add considerably to these costs. On-site processing of spent catalysts is noteconomic for a refinery.
Spent FCC catalysts with limited V/Ni concentrations are accepted with consent of authorities,by raw material suppliers to the road building industry. The material is sometimes used incement and as asphalt filler.
Example plantsThe regeneration of spent catalysts started in the early 1980s. All processors use pyro- andhydrometallurgical processes with varying degrees of sophistication, recovery capabilities andenvironmental performance. The pyro- and hydrometallurgical processes currently applied areconsidered acceptable and proven technology.
Reference literature[118, VROM, 1999; 122, REPSOL, 2001]
4.25.4 Recovery and recycling waste
Recycling and re-use of wastes minimises the quantity for disposal.
4.25.4.1 Treatment of heavy residues
Heavy residues generated by refineries are the heaviest fractions from the different units(distillation, conversion) and that have not application for products and are typically re-usedwithin the refinery. Those residues have a calorific value that can be exploited. Follow a list oftreatments that may be applied to reduce the amount of those residues. All these techniques arealready analysed in other sections but they are put together here to help the reader to understandwhat refineries may do with their heavy residues.
1. Methods to increase the hydrogen content (hydrogenation)
• Catalytic hydrogenation (included within Section 4.13) as Resid Fining, RCDUNIBON, Unicracking, HYVAHL-ASVAHL hydrotreatment, AUROBAN, H-Oil, LC-Fining, HYCON.
• Non catalytic hydrogenation (included within Section 4.22) as Hydrovisbreaking,Dynacracking, Donor Solvent Visbreaking.
2. Methods to increase the C-content
• Catalytic cracking (included within Section 4.5) as Reduced crude cracking (RCC),Heavy oil Cracking, VEBA combi cracking (VCC), Deep catalytic cracking (DCC).
Chapter 4 Techniques to consider in the determination of BAT
386 December 2001 MA/EIPPCB/REF_BREF_FINAL
• Non catalytic cracking (included within Section 4.7 and 4.22) as Delayed Coking,Fluid Coking, Flexicoking, LR-Coking, Deasphalting: DEMEX, Rose-Technology,Visbreaking, Thermal Cracking, Partial Oxidation.
4.25.4.2 Improve recovery of oils from oily sludges
Because oily sludges make up a large portion of refinery solid wastes, any improvement in therecovery of oil from the sludges can significantly reduce the volume of waste. There are anumber of technologies currently in use to mechanically separate oil, water and solids,including: belt filter presses, recessed chamber pressure filters, rotary vacuum filters, scrollcentrifuges, disc centrifuges, shakers, thermal dryers and centrifuge-dryer combinations.
4.25.4.3 Regenerate or eliminate filtration clay
Clay from refinery filters must periodically be replaced. Spent clay often contains significantamounts of entrained hydrocarbons and, therefore, must be designated as hazardous waste.Techniques that may be applied are:• Back washing spent clay with water or steam can reduce the hydrocarbon content to levels
so that it can be re-used or handled as a nonhazardous waste.• Another method used to regenerate clay is to wash the clay with naphtha, dry it by steam
heating and then feed it to a burning kiln for regeneration.• In some cases clay filtration can be replaced entirely with hydrotreating (See
Section 4.20.4).
4.25.4.4 Reprocessing off-specification productsIt is customary in refineries to have dedicated tankage (so-called “slops”) for the collection ofhydrocarbon streams/intermediate products that cannot be blended into final products for themarket. These slops are generally reprocessed, often by injection into the crude oil feedstock tothe crude distilling unit or to the coker. Often segregation is practised between wet and dryslops. The wet slops tank is equipped with facilities to separate (drain) water from oil. (toprevent slugs of water coming into the crude distiller). In some refineries separate slopsprocessing(distillation) facilities are installed [259, Dekkers, 2000].
Streams from water treatment units (e.g. oil/water mixtures from interceptors) can be routed tothe wet slops tank. Oil from sludge thickeners (centrifuges/decanters) can be routed to the slopstanks. In that way also the oil in sludges from DAF units can be recovered [259, Dekkers,2000].
4.25.4.5 Recycle / Re-use outside the installation
Some options to reduce the waste generation is the recycle or re-use of them. Follows someexamples that can be considered as good environmental practices:• some catalysts for metal recovery (reforming, desulphurisation) (See Section 4.25.3)• waste lubes: re-refining (See Section 4.25.4.6)• drums/containers: reconditioning• spent caustic can be used: (See Section 4.20.2)• alkylation process: CaF2
� for HF production� as a fluxing agent (steel industry)
• resale of polymerisation plant catalyst as a fertiliser (4.18.2)• sale of gypsum or sulphuric acid from flue gas desulphurisation units
Techniques to consider in the determination of BAT Chapter 4
MA/EIPPCB/REF_BREF_FINAL December 2001 387
• dust: In the regenerative flue gas desulphurisation process according to Welmann Lord NH3is injected to prevent the formation of SO3. Therefore up to 80 % of the ash consists of(NH4)2SO4, which can be used as a fertiliser or as a basic material for NH3 production [250,Winter, 2000].
• paper, wood, glass, scrap metal• construction/demolition debris:
� concrete to a crusher, for use in road building etc.� asphalt scrapings re-used, e.g. in road building
It has to be mentioned that re-use of waste fractions/residues outside the company is only anoption, if these waste fractions meet certain criteria (such as concentration of pollutants in afertiliser) and do not alter the original product characteristics (e.g. when using gypsum in thecement industry).
4.25.4.6 Re-use of waste lubes
DescriptionWaste lubes can be re-used within the refinery as fuel component or as feedstock for re-refining.Controlled incineration of waste lube oils is another alternative.
Achieved environmental benefitsReduce the amount of waste lubes produced within the refinery and act as a receiver of wastelubes.
Cross-media effectsWaste lubricating oils are generally undefined and may contain all kind of additives andcontaminants.(even PCB’s). Inclusion of contaminated waste lubes into commercial fuel oilwould expose the customer to high risks. Inclusion of this waste in refinery fuel poses a safetyrisk.
ApplicabilitySome applicability problems have been detected. For example, waste lubricating oil fromgarages may contain organic chlorides used as degreasers; in hydrotreaters they will beconverted into HCl and cause severe corrosion in this high pressure unit filled with hydrogen.Only by application of well-controlled pretreatment techniques, the treated waste oil can beupgraded to a fuel component. Such a pretreatment activity is normally not compatible withrefinery operations and is done outside the refinery by specialized companies, which also do thecollection of the waste oils. The only exception to the use of waste lubes as fuel component isfor waste lube oil that is generated in the refinery itself and of which its composition is beyondany doubt.
Driving force for implementationReduce the amount of waste lubes
Reference literature[259, Dekkers, 2000].
4.25.4.7 Recycle lab samples
Lab samples can be recycled to the oil recovery system.
4.25.5 Biodegradation of wastes
This section contains methods for the biodegradation of refinery wastes that may be usedspecifically within refineries on-site. This section does not contain methods for the remediation
Chapter 4 Techniques to consider in the determination of BAT
388 December 2001 MA/EIPPCB/REF_BREF_FINAL
of contaminated soils. As it was stated in the scope of this document, soil remediationtechniques are considered out of the scope of this document.
DescriptionMany hazardous chemicals present in refinery waste can be converted by microbiologicalmethods to harmless compounds such as water and carbon dioxide. In general, themicrobiological degradation of contaminants in soil is very slow in nature, because processconditions for such degradation are seldom favourable. To accelerate degradation a number ofconditions have to be fulfilled.
Current techniques for biological decontamination are based on optimisation of the processconditions for microbiological degradation. The appropriate micro-organisms formicrobiological degradation may already be present in the waste to be treated or may have to beadded. The latter is necessary if special micro-organisms are required. These special micro-organisms can be obtained by selection and adaptation.
Operational dataThe most important factors are the availability of temperature control, sufficient oxygen,nutrients, and the appropriate micro-organisms. Also important are the concentration level of thecontaminants and the variation in concentration. The presence of toxic compounds can disturbthe degradation process. Sometimes the presence of natural organic compounds has a positiveinfluence on the biodegradation process.
In summary the following conditions have to be met in order to optimise the degradation rate ofa waste generated by a refinery:
• sufficient number of micro-organisms of the right strains• non-toxic concentrations of contaminants or other compounds• adjustment of an accurate water content• presence of sufficient nutrients (mainly P and N in ratio 1:10)• presence of sufficient oxygen for aerobic processes and a full depletion of oxygen for
anaerobic processes• favourable temperature (20 - 30°C)• pH 6 - 8• temperature control• measures have to be applied to prevent emissions into air by volatile contaminants or
degradation products (by covering the area and by treating the exhaust air) and to preventemissions into water and soil (by sealing the floor and re-use of excess water).
• sufficient availability of contaminants (preferably without high peak concentrations) to themicro-organisms including good mixing of nutrients, waste, inert (e.g. soil) andcontaminants.
Reference literature[115, CONCAWE, 1999]
4.25.6 Stabilisation/solidification of waste
DescriptionThe following processes are commonly used:
Solidification – A process in which materials are added to the waste to produce a solid. It mayinvolve a solidifying agent that physically surrounds the contaminant (i.e. cement or lime), or itmay utilise a chemical fixation process (i.e. sorbents). The resulting waste is usually an easilyhandled solid with low leachability. Several processes exists:
Techniques to consider in the determination of BAT Chapter 4
MA/EIPPCB/REF_BREF_FINAL December 2001 389
• Cement-based processes. In this process the slurried waste is mixed with cement and duringthe hardening process is incorporated in the rigid concrete matrices. In the same line, spentcatalytic cracker unit (FCCU) catalyst may be used as an additive in cement manufacturing.When the cement is used, the catalyst component forms insoluble hydrates with the chalkpresent in the cement mixture, which also gives beneficial fixation of heavy metals.
• Thermoplastic techniques. In general the use of thermoplastic solidification techniques isrestricted to dry solid materials.
• Mixing with bitumen. The processing of waste with bitumen is applied in the oilmanufacturing industry as a disposal method. This process allows treatment of soils withhigh levels (up to 10 %) of high boiling range hydrocarbons.
Stabilisation – The conversion of a waste to a chemically stable form that resists leaching. Thismay be accomplished by a pH adjustment. Stabilisation also generally results in a solidificationof some sort (monolith or dry granular solid).
• Chemical Stabilisation. These processes are based on the reaction of lime with wastematerials and water to form a chemically stable product. When compacted, the porosity towater is very low. This reduces the risk of leaching.
Encapsulation – Complete coating or enclosure of a waste with a new, non-permeablesubstance. Two type of encapsulation techniques exists: Micro-encapsulation and macro-encapsulation.
The micro-encapsulation techniques are based on the reduction to surface-to-volume ratio of thewaste by formation of monolithic, hard mass with a very low permeability.Macro-encapsulation is the enclosing of a relatively large quantity of waste, such as an entirewaste container. Wastes are macro-encapsulated by surrounding them with a stiff, weight-supporting matrix, and a seam-free jacket.
Achieved environmental benefitsStabilisation and solidification are treatment processes designed to improve waste handling andphysical characteristics, decrease surface area across which pollutants can leach, or limit thesolubility of hazardous constituents.
ApplicabilityCement-based processes: The process is especially effective when the waste contains metalsbecause at the high pH of the cement mixture most metal compounds are converted intoinsoluble metal hydroxides. In the case of spent catalyst, most metal compounds are present ashydroxides which as such may also increase the strength and stability of the waste containingconcrete. On the other hand, the presence of organic impurities may act as interfering agents tothe curing of the concrete and this limits the application of this disposal route.
Thermoplastic techniques. In general the use of thermoplastic solidification techniques isrestricted to dry solid materials. This technique is not suitable to be used for wastes, containing:• organic chemicals (these may act as solvents)• oxidising salts (these can react with the organic material causing deterioration to the matrix
material; at elevated temperatures these mixtures are extremely flammable)• dehydrated salts (e.g. sodium sulphate easily dehydrates at temperatures required to
plasticise bitumen; when the bitumen matrix is soaked in water, rehydration of the sodiumsulphate can occur, and this can cause the bitumen to swell and split apart).
Mixing with bitumen. It is applied as a disposal method for spent FCCU catalyst and used forthe production of a filler component in road asphalt where the catalyst is present as a minorcomponent. The catalyst particles are completely encapsulated which makes aqueous extractionunlikely. This process allows treatment of soils with high levels (up to 10 %) of high boilingrange hydrocarbons. The soil is mixed with bitumen to produce a stable end-product suitable foruse in road construction.
Chapter 4 Techniques to consider in the determination of BAT
390 December 2001 MA/EIPPCB/REF_BREF_FINAL
Chemical Stabilisation. This technique is suitable to immobilise watery sludges to yield apowdery hydrophobic product which can be compacted. The immobilised product, is water-repellent and hardens with time and often has very good properties for civil engineeringapplications like foundations, tank bases, bundwall and road making.
Encapsulation is suitable for on-site treatment of disposal sites of accumulated spent acid tarsand oily sludges which are difficult to transport and to dispose of by other means. Adisadvantage is that the treated product occupies a larger volume than the original sludge.Because it can be applied on-site, the encapsulation process may be considered for singleapplications like rehabilitating refinery sites after decommissioning or cleaning up an oil-polluted site after a spill. The decision to apply the process depends on the future use of the siteand local legislation. The process is less attractive for the treatment of regularly producedsludges, because of the increased mass generated for disposal.
Reference literature[115, CONCAWE, 1999]
4.25.7 Waste storage
Wastes awaiting disposal should be stored in an environmentally acceptable manner, asapproved by the local control authority. Storage should not give rise to secondary environmentalproblems such as odour or pollution of groundwater due to rainwater percolation through orrun-off from the site. Storage should best be in closed vessels, containers or bags, on a sitesurrounded by a bund wall or toe wall, with drainage to a prepared system. Special precautionsare of course required for pyrophoric materials to eliminate the risk of fires; they must be keptwet, sealed or blanketed with inert gas.
Best available techniques Chapter 5
MA/EIPPCB/REF_BREF_FINAL December 2001 391
5 BEST AVAILABLE TECHNIQUES (BAT)
In understanding this chapter and its contents, the attention of the reader is drawn back to thepreface of this document and in particular the fifth section of the preface: “How to understandand use this document”. The techniques and associated emission and/or consumption levels, orranges of levels, presented in this chapter have been assessed through an iterative processinvolving the following steps:
• identification of the key environmental issues for the Mineral Oil refinery and NaturalGas Plant sectors
• examination of the techniques most relevant to address those key issues• identification of the best environmental performance levels, on the basis of the available
data in the European Union and world-wide• examination of the conditions under which these performance levels were achieved;
such as costs, cross-media effects, main driving forces involved in implementation ofthese techniques
• selection of the best available techniques (BAT) and the associated emission and/orconsumption levels for this sector in a general sense all according to Article 2(11) andAnnex IV of the Directive.
Expert judgement by the European IPPC Bureau and the relevant Technical Working Group(TWG) has played a key role in each of these steps and in the way in which the information ispresented here.
On the basis of this assessment, techniques, and as far as possible emission and consumptionlevels associated with the use of BAT, are presented in this chapter that are considered to beappropriate to the sector as a whole and in many cases reflect current performance of someinstallations within the sector. Where emission or consumption levels “associated with bestavailable techniques” are presented, this is to be understood as meaning that those levelsrepresent the environmental performance that could be anticipated as a result of the application,in this sector, of the techniques described, bearing in mind the balance of costs and advantagesinherent within the definition of BAT. However, they are neither emission nor consumptionlimit values and should not be understood as such. In some cases it may be technically possibleto achieve better emission or consumption levels but due to the costs involved or cross-mediaconsiderations, they are not considered to be appropriate as BAT for the sector as a whole.However, such levels may be considered to be justified in more specific cases where there arespecial driving forces.
The emission and consumption levels associated with the use of BAT have to be seen togetherwith any specified reference conditions (e.g. averaging periods).
The concept of “levels associated with BAT” described above is to be distinguished from theterm “achievable level” used elsewhere in this document. Where a level is described as“achievable” using a particular technique or combination of techniques, this should beunderstood to mean that the level may be expected to be achieved over a substantial period oftime in a well maintained and operated installation or process using those techniques.
Where available, data concerning costs have been given together with the description of thetechniques presented in the previous chapters. These give a rough indication about themagnitude of costs involved. However, the actual cost of applying a technique will dependstrongly on the specific situation regarding, for example, taxes, fees, and the technicalcharacteristics of the installation concerned. It is not possible to evaluate such site-specificfactors fully in this document. In the absence of data concerning costs, conclusions oneconomic viability of techniques are drawn from observations on existing installations.
It is intended that the general BAT in this chapter are a reference point against which to judgethe current performance of an existing installation or to judge a proposal for a new installation.
Chapter 5 Best available techniques
392 December 2001 MA/EIPPCB/REF_BREF_FINAL
In this way they will assist in the determination of appropriate "BAT-based" conditions for theinstallation or in the establishment of general binding rules under Article 9(8). It is foreseen thatnew installations can be designed to perform at or even better than the general BAT levelspresented here. It is also considered that existing installations could move towards the generalBAT levels or do better, subject to the technical and economic applicability of the techniques ineach case.
While the BREFs do not set legally binding standards, they are meant to give information forthe guidance of industry, Member States and the public on achievable emission andconsumption levels when using specified techniques. The appropriate limit values for anyspecific case will need to be determined taking into account the objectives of the IPPC Directiveand the local considerations.
In order to complement what has been said above, the approach followed in this document forthe BAT assessment can be summarised in the following steps:
1) Environmental performance - balanced with cross-media environmental effects - is themain criterion used to determine BAT. Moreover, a technique considered to be BATshould have a demonstrated applicability within the refinery sector or in anotherindustrial sector. In the latter case, the expert judgement of the TWG members shouldbe that there is no technical limitation on its implementation in the refinery sector.
2) A technique considered to be BAT needs to be economically viable within the sector.For this assessment, it is considered economically viable within the refinery sector if ithas already been applied on a certain number of occasions (the more complex and moreexpensive the technique, the higher the number of proven operating experiences needed)within the refinery sector or other similar industrial sectors.
3) Operational data and applicability are criteria considered as limitations for theimplementation of BAT in certain circumstances. Some of those limitations arementioned together with the BAT (e.g. new vs. existing). General applicability problemsin the implementation of techniques in existing installations (e.g. space, operationalproblems) are not mentioned in this chapter unless they are considered very specific (butare mentioned in Chapter 4).
As mentioned in the above paragraphs and in the Preface, Chapter 5 contains, where possible,the range of emission or performance levels associated with the use of a technique or group oftechniques considered to be BAT. All emission levels associated with BAT given in this chapterare daily averages unless stated otherwise. Gaseous concentrations are corrected to 3% O2 andin dry conditions unless stated otherwise. Where BAT is currently represented by only onetechnique, the emission or performance level cannot be defined as a single number because ofdifferences in practical situations of feedstock, degree of integration, process variations or othercircumstances. Where BAT is a group or combination of techniques, each single techniquewithin that group has its own range of associated levels. However, the ranges appropriate foreach technique are combined in a single range, typically wider than those related to a singletechnique. In some cases, some of the extreme values of the range have only been reported to bereached by a combination of at least two techniques.
The ranges given contain the lowest level of emissions found in Chapter 4, unless the lowestlevel has been achieved in special local circumstances. The upper end of the range does notgenerally correspond with the highest value found in Chapter 4. This upper value is determinedfrom the better environmental performance levels reported but also takes account of the cost ofreducing emissions and the process requirements constraints. In this respect, the proposed rangeis in accordance with the definition of BAT. For certain techniques, reduction percentages aregiven as well as associated emission levels. The reduction percentage (based on data in previouschapters) relates to the potential of the technique; it is acknowledged that, if a morecontaminated feed is processed, a higher reduction percentage needs to be applied to reach theBAT associated emission values. Each range has its own purpose and importance and can be ofhelp during the permit process.
Best available techniques Chapter 5
MA/EIPPCB/REF_BREF_FINAL December 2001 393
In the determination of the upper value of the associated emission range in this chapter, a splitview has been expressed by industry and two Member States. The split view is that theyconsider that the upper value in Chapter 5 should correspond with the upper value found inChapter 4. Their rationale is that if a technique considered BAT is already applied in aninstallation and achieves a certain value, that value should be considered in the range ofassociated emission values.
Some key findings to help users/readers of this documentDuring the preparation of this document, several important issues were raised and considered bythe TWG that may help future users/readers of this document.
• Due to the complex nature of refineries, the diversity in different refinery configurationsand the high degree of process integration, it is strongly advised to read Chapter 5 inconjunction with Chapter 4 when determining the most appropriate solution for anindividual refinery. To help the reader in this subject, references to Chapter 4 have beenincluded in Chapter 5.
• Since the likelihood of new facilities being built in Europe is low, environmentalimprovement in the sector is normally achieved by applying BAT to existing installations.This retrofitting is often referred to as “revamping”. This document takes account of thedifferences between new and existing installations, where relevant and quantifiable.
• For an integrated approach in refineries, it is important to note that integration includesboth the integration of environmental aspects of a single unit and the integration of theenvironmental aspects over the refinery as a whole. This can be illustrated by the fact thatif a refinery plans to build a new unit or replace an existing unit, the new unit is likely toinfluence operation of most (if not all) other units within the refinery and thus influencethe environmental performance of the refinery as a whole.
• Certain prevention techniques (e.g replacing an alkylation process by another) that appearin the following sections may be very difficult to implement in existing installations. Thereason is that the change from current practice to a more environmentally friendlytechnique has certain environmental and economic costs (e.g. decommissioning) whichmay outweigh the environmental and economic advantages of applying that technique.Thus, application is only justified in major rebuildings or changes and new installations.Existing installations may have factors such as space or height limitations that preventfull adoption of some of those techniques. A proper assessment can only be done atlocal/site level.
• Without prejudice to the preceding paragraph, the control and abatement techniques thatappear in this chapter are widely applicable to both new and existing plants in the refinerysector.
• Many factors influence decisions about whether or not a refinery should have a certainprocess technique or pollution abatement technique. Factors such as the refinery’sproducts, type of crude oil processed and type of refinery will need to be taken intoaccount when using this document at local level. Similarly, actual costs for a technique inone location/site may differ from those in another; even in the same location the cost foran identical technique may differ widely depending on specific situations. (e.g.differences in furnace layout, in space availability). Independent assessments, by e.g.engineering contractors, may resolve issues when they arise and can only be doneproperly at local level.
Chapter 5 Best available techniques
394 December 2001 MA/EIPPCB/REF_BREF_FINAL
• For an existing plant where the actual environmental performance is close to a BATperformance, it may be appropriate to consider the marginal cost-effectiveness ofimplementing a new measure in order to reach the BAT level. (See below for moreinformation on cost-effectiveness analysis.)
• In addition to the BAT referenced in this chapter, BAT for a refinery contains elementsfrom other IPPC documents and international regulations. In this context, specialattention is drawn to the Storage and Handling BREF, Industrial Cooling BREF,Monitoring BREF and BREF on Large Combustion Plants when commercial fuels (e.g.natural gas, commercial fuel oil, gasoil) are used in the refinery.
BAT related issuesThere were several key findings during the writing of this document, and they are relevant forthe overall understanding of this chapter.
Basis for comparing refineriesAll refineries are different in their configuration, process integration, feedstock, feedstockflexibility, products and product mix, unit size and design, control systems and environmentalfacilities. In addition, differences in owner’s strategy, market situation, location and age of therefinery, historical development, available infrastructure and environmental regulations areamongst other reasons for the wide variety in refinery concepts, designs and modes ofoperation. However, there are approaches that attempt to normalise refineries by assigning e.g.the so-called complexity indeces (See Section 1.3.1) to a refinery as an aid to comparing theperformance of refineries of different complexity (See application in Sections 3.1.2 and 3.10.1).
Cost- effectivenessIn judging whether a technique included in Chapter 4 and 5 is “available” in general, theconcept of cost-effectiveness - taking account of investment and operating costs - is a usefultool for the BAT assessment of the respective technique as compared to alternative techniquesthat can achieve comparable levels of pollution prevention or control. Levels of cost-effectiveness (e.g. the cost to reduce one tonne per year of SO2 emission) can be useful insetting so-called “reference values for cost-effectiveness”. Such indicators of cost-effectivenessare sometimes used in other industries. Some data provided by the TWG in this respect arefound in some techniques in Chapter 4 as well as in Annex IV.
BAT and environmental approachesA most important issue during the preparation of this document has been how to tackle theprocess integration issue within a refinery. This issue can be approached in two different ways:a) The so-called bottom-up approach, which matches the detail analytical approach followed
in this document. In this case, each process/activity found in the industrial sector is analysedfrom the environmental point of view. This approach already recognises that some issuesare common or integrated all over the installation (so called horizontal activities such asenergy system, storage, cooling and integrated refinery management) and they need to beanalysed across the whole installation.
b) The so-called top-down or bubble approach, where a certain environmental goal is given tothe whole installation. The bubble approach is currently applied in environmental regulationof refineries, in particular for air emissions. More information is provided in Section 4.15.2.
The discussion among the experts of the TWG reflected differences of opinion that go beyondpurely techno-economic considerations. Basically they may be considered to reflect differencesin legislative and administrative procedures in Member States, which in turn are basically theresult of differences in administrative and legislative cultures. The differences in approachshould therefore not be classified as right or wrong within the IPPC legal structure. Bothapproaches should be respected as having their own merits in the permitting procedure and canbe used in a complementary rather than contradictory manner. However, several importantconclusions were drawn from the discussion on both approaches:
Best available techniques Chapter 5
MA/EIPPCB/REF_BREF_FINAL December 2001 395
• The bottom-up approach has the advantage that the assessment of the emission valuesassociated with the application of individual techniques on a separate process unit is morestraightforward and more in line with the approach used in other BREFs. It provides thelicensing authority with a clear picture of what it is considered to be the bestenvironmental performance of a single refinery process/activity and how the goal can beachieved. This approach subsequently requires that the aspects of integration of therefinery as whole should be built from the individual processes/activities. If this is notperformed correctly, it may result in a sub-optimal solution. This approach recognisesthat this integration aspect and the calculation of the bubble level can only be assessedproperly at site level.
• The top-down approach can be used as an effective management tool to prioritise theapplication of environmental techniques in installations without becoming entangled inthe complex technical-economic interrelationships in the refinery. However, it does notprovide the licensing authority with guidance on what environmental goals may beachieved in certain processes/activies or on how a certain environmental goal can beachieved. The flexibility on how to achieve a goal is largely given to the operator withthis approach.
• Both approaches recognise that the overall reduction of emissions is typically achieved inpractice by a combined effort focused on the performance of the ‘processes/activities’(e.g. improved SRU efficiency, application of low NOx techniques) and on theperformance of the ‘integrated/whole’ installation (e.g. energy efficiency, fuelmanagement, sulphur balance). As a result of the high variability between refineries, theset of measures that leads to the lowest overall emissions at acceptable costs may alsovary significantly from one refinery to the other.
• A certain direct relationship has been recognised between the two approaches. The moreenvironmental measures that are applied, the lower the bubble level can be. Annex Vgives some examples of calculation of the bubble figure considering BAT associatedemission values for single processes/activities.
Some aids to understanding the remainder of this chapterIn subsequent sections of this chapter, the BAT conclusions for the Mineral Oil Refinery andNatural Gas Plant sector are set out on two levels. Section 5.1 deals with generic BATconclusions that are generally applicable to both sectors as a whole and Section 5.2 contains themore specific BAT conclusions for the various processes and activities under analysis. So, BATfor any specific refinery is the combination of the non-unit-specific elements applicable torefineries as a whole (generic BAT) and the unit-specific-BAT applicable to the particular case.Both these approaches are complementary rather than contradictory in practical situations.
5.1 Generic (whole refinery) BAT
A refinery consists of a number of single process units. The way these single units are built upinto an integrated refinery can have a considerable effect on the emissions. A well-integratedrefinery will be characterised by a comparatively low overall level of emissions of pollutants. Indetermining BAT, the environmental effects of the single units and of the whole refinery haveto be considered. This section provides the elements for BAT determined for refineries as awhole. It includes the determined BAT applicable to Mineral Oil Refineries and Natural GasPlants for environmental management and the reduction, in a general sense, of emissions to air,emissions to water and solid waste. This chapter reflects the fact that emissions to air are themost important environmental concern of refineries.
BAT for Good Housekeeping and Environmental Management:With reference to subsections of Section 4.15 a number of environmental managementtechniques are determined as BAT. They are techniques for continuous improvement of
Chapter 5 Best available techniques
396 December 2001 MA/EIPPCB/REF_BREF_FINAL
environmental performance. They provide the framework for ensuring the identification,adoption of and adherence to BAT options that, whilst often down-to-earth, are important.These good housekeeping/management techniques/tools often prevent emissions.
BAT is to:• implement and adhere to an Environmental Management System (EMS) (See
Section 4.15.1). A good EMS could include:� the preparation and publication of an annual environmental performance report. Such
a report will also enable the dissemination of performance improvements to others,and will be a vehicle for information exchange (Art. 16 of the Directive). Externalverifications may enhance the credibility of the report.
� the delivery to stakeholders on an annual basis of an environmental performanceimprovement plan. Continuous improvement is assured by such a plan.
� the practice of benchmarking on a continuous basis, including energy efficiency andenergy conservation activities, emissions to air (SO2, NOx, VOC, and particulates),discharges to water and generation of waste. Benchmarking for energy efficiencyshould involve an internal system of energy efficiency improvements, or intra- andinter-company energy efficiency benchmarking exercises, aiming for continuousimprovements and learning lessons.
� an annual report of the mass balance data on sulphur input and output via emissionsand products (including low-grade and off-spec products and further use and fate).(See Section 4.23.5)
• improve stability of unit operation by applying advanced process control and limitingplant upsets, thereby minimising times with elevated emissions (e.g. shutdowns and start-ups) (see Section 4.15.5)
• apply good practices for maintenance and cleaning (More information in 4.15.3).• implement environmental awareness and include it in training programmes (More
information in Section 4.15.4).• implement a monitoring system that allows adequate processing and emission control.
For more information on monitoring, refer to Section 3.26 and the Monitoring BREF.Some elements of a monitoring system could include:� continuous monitoring of pollutants for high volume flows with a high variability in
pollutant concentrations� periodic monitoring or the use of emission relevant parameters for flows with a low
variability� regular calibration of measurement equipment� periodic verification of measurement by simultaneous comparative measurements.
Reduction of Emissions to AirThe overall reduction of emissions to air is typically achieved in practice by a combined efforton the performance of the ‘processes/activities’ (e.g. improved SRU efficiency, application oflow NOx techniques) and on the performance of the ‘integrated/whole’ installation (e.g. energyefficiency, fuel management, sulphur balance). However, there is no consensus on a range ofemission values under the bubble concept which could be associated with BAT. The reasonsare: a) the different perceptions of emission ranges for individual processes, b) the differentperceptions of the bubble parameters (e.g. concentrations vs. loads, yearly vs. daily, include orexclude certain processes), c) the way the flexibility issue is resolved, d) the environmentalconcern (e.g. how the parameters of the bubble should be set), e) the variety of refineries inEurope (e.g. simple vs complex, oil refineries vs. specialised refineries, 100 % gas vs. highpercentage of liquid fuel, type of feedstock, etc). Annex V gives several examples of thosereasons. However, Chapter 5 contains the different proposals or benchmarks given by the TWG.Those benchmark ranges are given together with the time span qualification (very important, asdescribed in 4.15.2).
BAT is to:• improve the energy efficiency (reduction of all air pollutants generated by combustion)
by enhancing heat integration and recovery throughout the refinery, applying energy
Best available techniques Chapter 5
MA/EIPPCB/REF_BREF_FINAL December 2001 397
conservation techniques and optimising the energy production/consumption (morespecific information on how this can be achieved is found in Section 5.2.10). Threemethods have been identified for the quantification of energy efficiency (seeSection 3.10.1 and 4.10.1.1). Appropriate use of such data would be benchmarkingbetween facilities in order to determine possible areas for improvement taking intoaccount local differences in operations. The TWG provided data on EII for only ten EU+refineries (See Figure 3.7). Data about this index show that the index for the worldrefineries ranges between 55 and 165. Lower values correspond to more energy-efficientrefineries. Data reported by those ten EU+ refineries range from 58 to 94, all except onebelow the world average (92). Lower values are typically achievable under localcircumstances where low grade heat can be externally exchanged. The TWG recognisesthat a transparent and standarised method for the calculation of energy efficiency isrequired to compare energy performance within the sector (See Concluding Remarkschapter).
• use clean RFG and, if necessary to supply the rest of the refinery energy demand, liquidfuel combined with control and abatement techniques (see Section 5.2.10) or other fuelgases such as natural gas or LPG. Where gaseous fuels replace liquid fuels, the reductionof SO2 and NOx emissions as a result of the fuel switch is not complicated to calculate forsingle processing units and for the refinery as a whole (see Section 4.15.2). Informationon cross-media effects and applicability restrictions of a full gas switch is in Section4.10.2.1
• reduce sulphur dioxide emissions by:� quantifying the sulphur emissions from various refinery sources to identify the main
emitters in each specific case (See Section 3.26). This quantification is an element ofthe sulphur balance. More information about sulphur balance is in 4.23.5.
� using BAT applicable to SO2 emission reduction in the energy system, catcrackersand cokers (see Sections in 5.2)
� efficient operation of the sulphur recovery unit according to 5.2.23.� reducing SO2 emissions from typically small contributors when they become a
significant part of the total emission and if cost-effective (e.g. flaring, gases fromvacuum ejector gas burnt in furnaces) (See Section 4.23.5.7)
The TWG has not been able to identify a single range of emissions associated with theapplication of BAT under the bubble concept (see reasons within the introduction to BATfor Reduction of Emissions to Air). However, several benchmarks were identified (SeeSection 4.15.2):
For the concentration bubble approach (all in mg/Nm3 and @ 3% O2):� One Member State proposed that the full implementation of BAT results in a
bubble of 60 - 200 (daily average).� Two Member States proposed that the implementation of BAT results in a bubble
of 100 - 600 (monthly average) based on the calculations in Annex V.� One Member State proposed a bubble value of 850 (daily average)� Two Member States proposed a bubble range of 800 - 1200 (monthly average)
based on current practice.� Industry proposed a bubble range of 1000 – 1400 (yearly average) based on current
European refinery performance.For the load bubble approach (all in t SO2/Mt of throughput):� One Member State proposed that the full implementation of BAT result in a bubble
range of 50 – 230 (yearly average)� One Member State proposed a bubble range of 50 – 210 (yearly average) based on
the upper quartile of specific emissions from 40 existing EU refineries.
The above data demonstrates the wide variety of proposed ranges and the inconsistencywhen daily-monthly-yearly values are compared (yearly values should be the lowestvalues).
Chapter 5 Best available techniques
398 December 2001 MA/EIPPCB/REF_BREF_FINAL
One Member State does not agree with the above approach of dealing with the sulphurdioxide emissions in the refinery as a whole. Their proposal is to follow their nationalmethodology for BAT determination and implementation.
• reduce nitrogen oxides emissions by:� quantifying the NOx emission sources in order to identify the main emitters (e.g.
furnaces and boilers, the FCC regenerators and gas turbines) in each specific case(See Section 3.26)
� using BAT applicable to NOx reduction in the energy system and catcracker (seecorrespondent sections in 5.2)
The TWG has not been able to identify a single range of emissions associated with theapplication of BAT under the bubble concept (see reasons within the introduction to BATfor Reduction of Emissions to Air). However, several benchmarks were identified (SeeSection 4.15.2):
For the concentration bubble approach (all in mg/Nm3 and @ 3% O2):� One Member State proposed that the full implementation of BAT results in a
bubble of 70 - 150 (daily average).� One Member State proposed that the implementation of BAT results in a bubble of
100 - 200 (monthly average) based on calculation in Annex V.� One Member State proposed that the implementation of BAT results in a bubble of
150 (monthly average) and 200 daily.� Two Member States proposed a bubble range of 250 – 450 (monthly average)
based on current practice.� Industry proposed a bubble range of 200 – 500 (yearly average) based on current
European refinery performance.For the load bubble approach (all in t NOx/Mt of throughput):� One Member State proposed a bubble range of 20 – 150 (yearly average) based on
the upper quartile of specific emissions from 40 existing EU refineries.� One Member State proposed that the full implementation of BAT results in a
bubble range of 80 – 170 (daily average)
The above data demonstrate the wide variety of proposed ranges and the inconsistencywhen daily-monthly-yearly values are compared (yearly values should be the lowestvalues).
One Member State does not agree with the above approach of dealing with the nitrogenoxides emissions in the refinery as a whole. Their proposal is to follow their nationalmethodology for BAT determination and implementation.
• reduce particulate emission by:� quantifying the particulate emission sources (especially furnaces and boilers, the
FCC regenerators and cokers) in order to identify the main emitters in each specificcase (See Section 3.26)
� minimising the particulate emissions from solids handling situations (catalystloading/unloading, coke handling, sludge transport) by applying good housekeepingand control techniques (see Sections 4.5.9.4, 4.7.8, 4.7.11, 4.25.1&3)
� using BAT applicable to particulate reduction in the energy system, catcrackers andcokers (see Section 5.2)
The TWG has not shared so much information on values on particulate emission underthe bubble concept. The reason is because the bubble concept it is less applied forparticulates emissions than for the case of for SOx and NOx emissions. For this reason nofigures appear here. However, several benchmarks were included in Section 4.15.2.
Best available techniques Chapter 5
MA/EIPPCB/REF_BREF_FINAL December 2001 399
• reduce volatile organic carbons emissions by:� quantifying VOC emission sources (e.g. by DIAL) in order to identify the main
emitters in each specific case (more information in 3.26)� executing LDAR campaigns or equivalent. A good LDAR includes the
determination of the type of measurement, frequency, type of components to bechecked, type of compound lines, what leaks should be repaired and how fast theaction should be taken (more information in 4.23.6.1)
� using a maintenance drain-out system (See Section 4.23.6.1)� selecting and using low-leakage valves such as graphite-packed valves or equivalent
(especially important for control valves) for lines containing product with a highvapour pressure (See Section 4.23.6.1).
� using low leak pumps (e.g. seal-less designs, double seals, with gas seals or goodmechanical seals) on product lines carrying fluid with a high vapour pressure (SeeSection 4.23.6.1)
� minimising flanges (easier to apply in the design stage), installing sealing rings onleaking flanges and use of high integrity sealing materials (fire safe) in flanges (veryimportant for heat exchangers) (See Section 4.23.6.1)
� blinding, plugging or capping open-ended vent and drain valves (See Section4.23.6.1)
� routing relief valves with high potential VOC emissions to flare (See Section4.23.6.1)
� routing compressor vents with high potential for VOC emissions back to process andwhen not possible (e.g. vent compressor distance pieces) to refinery flare fordestruction (See Section 4.23.6.1)
� using totally closed loop in all routine samplers (see Section 4.23.6.1 for what isunderstood by routine sampler) that potentially may generate VOC emissions
� minimising flaring (see flaring in 5.2.23)� e.g. covering separators, basins and inlet bays and by routing off-gases in the
WWTP. Implementation of some of those techniques may compromise efficientoperation of WWTP or cause safety concerns if they are not properly designed andmanaged. For these reasons, this technique may have technical problems whenretrofitted. Consider as part of an odour abatement programme. (Section 4.24.4)
� using BAT applicable to VOC reduction in storage and handling (see 5.2.21)
BAT for Reduction of Discharges to Water is to:• apply a water management scheme (as part of the EMS) aimed at reducing
� the volume of water used in the refinery by:Type of water Benchmarks for water volume consumption
and emission (annual averages)(m3/t throughput)
Fresh water usage 1 0.01 – 0.622
Process effluent volume 1 0.09 – 0.532
Notes:1 Definition of what each type of water does and does not contains is found in
Section 3.15. As mentioned in 4.15.7.1 and 4.24.1, those values are very dependent onthe type of refinery and they cannot be related to the use of BAT. They should be seenas references.
2 Upper value of these ranges corresponds to the average of 63 European refineries. SeeSection 4.24.1.
♦ water stream integration options including water optimisation studies(seeSection 4.15.7.1).
♦ re-using as much as possible the cleaned waste water (see Section 4.15.8.1)♦ applying techniques to reduce waste water generated within each specific
process/activity (see Section 5.2)
Chapter 5 Best available techniques
400 December 2001 MA/EIPPCB/REF_BREF_FINAL
� the contamination of water by♦ segregation of contaminated, low-contaminated or non-contaminated water
streams and, where possible, drainage systems (Section 4.15.6, 4.24.1). Thisentails the complete system of fresh water supply, rainwater, ballast water,sanitary water, process water, boiler feed water, cooling water, groundwater aswell as effluent collection, storage and the various (primary, secondary andtertiary) waste water treatment systems. Many of those waters end up in a singlewaste water treatment where they may be mixed after they have beenappropriately (pre)treated. In existing installations, this segregation may be verycostly and may require space for implementation.
♦ segregation of “once-through” cooling water from process effluent until afterthis has been treated (Section 4.8.1)
♦ good housekeeping in operation and maintenance of existing facilities (as partof the EMS. Reference to Section 4.15.3)
♦ spill prevention and control (4.25.1, 4.15.3)♦ applying techniques to reduce contamination of waste water within each
specific process/activity (see Section 5.2).
• achieve the following water parameters in the WWTP effluent (see Table 4.50 inSection 4.24.8)
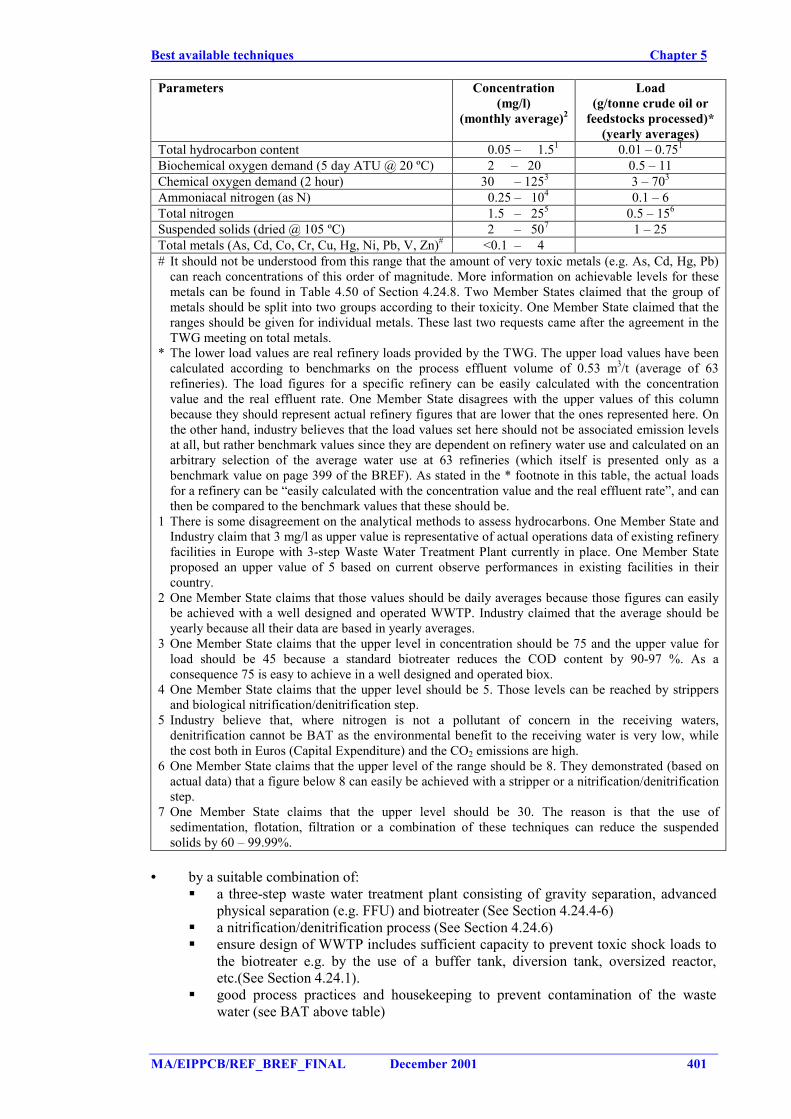
Best available techniques Chapter 5
MA/EIPPCB/REF_BREF_FINAL December 2001 401
Parameters Concentration(mg/l)
(monthly average)2
Load(g/tonne crude oil or
feedstocks processed)*(yearly averages)
Total hydrocarbon content 0.05 – 1.51 0.01 – 0.751
Biochemical oxygen demand (5 day ATU @ 20 ºC) 2 – 20 0.5 – 11Chemical oxygen demand (2 hour) 30 – 1253 3 – 703
Ammoniacal nitrogen (as N) 0.25 – 104 0.1 – 6Total nitrogen 1.5 – 255 0.5 – 156
Suspended solids (dried @ 105 ºC) 2 – 507 1 – 25Total metals (As, Cd, Co, Cr, Cu, Hg, Ni, Pb, V, Zn)# <0.1 – 4# It should not be understood from this range that the amount of very toxic metals (e.g. As, Cd, Hg, Pb)
can reach concentrations of this order of magnitude. More information on achievable levels for thesemetals can be found in Table 4.50 of Section 4.24.8. Two Member States claimed that the group ofmetals should be split into two groups according to their toxicity. One Member State claimed that theranges should be given for individual metals. These last two requests came after the agreement in theTWG meeting on total metals.
* The lower load values are real refinery loads provided by the TWG. The upper load values have beencalculated according to benchmarks on the process effluent volume of 0.53 m3/t (average of 63refineries). The load figures for a specific refinery can be easily calculated with the concentrationvalue and the real effluent rate. One Member State disagrees with the upper values of this columnbecause they should represent actual refinery figures that are lower that the ones represented here. Onthe other hand, industry believes that the load values set here should not be associated emission levelsat all, but rather benchmark values since they are dependent on refinery water use and calculated on anarbitrary selection of the average water use at 63 refineries (which itself is presented only as abenchmark value on page 399 of the BREF). As stated in the * footnote in this table, the actual loadsfor a refinery can be “easily calculated with the concentration value and the real effluent rate”, and canthen be compared to the benchmark values that these should be.
1 There is some disagreement on the analytical methods to assess hydrocarbons. One Member State andIndustry claim that 3 mg/l as upper value is representative of actual operations data of existing refineryfacilities in Europe with 3-step Waste Water Treatment Plant currently in place. One Member Stateproposed an upper value of 5 based on current observe performances in existing facilities in theircountry.
2 One Member State claims that those values should be daily averages because those figures can easilybe achieved with a well designed and operated WWTP. Industry claimed that the average should beyearly because all their data are based in yearly averages.
3 One Member State claims that the upper level in concentration should be 75 and the upper value forload should be 45 because a standard biotreater reduces the COD content by 90-97 %. As aconsequence 75 is easy to achieve in a well designed and operated biox.
4 One Member State claims that the upper level should be 5. Those levels can be reached by strippersand biological nitrification/denitrification step.
5 Industry believe that, where nitrogen is not a pollutant of concern in the receiving waters,denitrification cannot be BAT as the environmental benefit to the receiving water is very low, whilethe cost both in Euros (Capital Expenditure) and the CO2 emissions are high.
6 One Member State claims that the upper level of the range should be 8. They demonstrated (based onactual data) that a figure below 8 can easily be achieved with a stripper or a nitrification/denitrificationstep.
7 One Member State claims that the upper level should be 30. The reason is that the use ofsedimentation, flotation, filtration or a combination of these techniques can reduce the suspendedsolids by 60 – 99.99%.
• by a suitable combination of:� a three-step waste water treatment plant consisting of gravity separation, advanced
physical separation (e.g. FFU) and biotreater (See Section 4.24.4-6)� a nitrification/denitrification process (See Section 4.24.6)� ensure design of WWTP includes sufficient capacity to prevent toxic shock loads to
the biotreater e.g. by the use of a buffer tank, diversion tank, oversized reactor,etc.(See Section 4.24.1).
� good process practices and housekeeping to prevent contamination of the wastewater (see BAT above table)
Chapter 5 Best available techniques
402 December 2001 MA/EIPPCB/REF_BREF_FINAL
� combination of waste water from several processes with comparable qualities forpretreatment (e.g. treatment of sour water from primary distillation unit, catalyticcracker, coking and from other sour water sources by stripping; see Section 4.24.1).
BAT for Solid Waste Management is to• implement a solid waste management system (as part of the EMS) (See Sections 4.25.1-2
and 4.15.1,3). This includes:� annual reporting of waste quantities� implementing a plan with measures for waste reduction including recycling and/or
recovery� operating the WWTP so as to maximise performance, with the minimum of sludge
production (Section 4.24.6)� implementing good housekeeping activities� applying BAT determined on forthcoming waste BREF
• minimise oil spills and exclude oil spills that contaminate the soil (as part of the goodhousekeeping activities (see 4.25.1)). This includes, among other things:� implementing a plan to exclude leakage from pipework and tanks (part of the EMS).
This plan may include inspection, corrosion monitoring, leak detection instruments,double bottoms etc. (see Section 4.25.1)
� performing a risk analysis to rank in order of significance cases where an accidentalleak may occur (elements to consider are the product in the tanks/pipes, the age ofthe equipment, the nature of the soil and groundwater that would be affected).Prioritise areas where impermeable floors are needed most. Produce a multiyearmaster plan to programme necessary steps (Section 4.25.1 and 4.15.6)
� designing new installations with the minimum of underground piping. In existinginstallations, include underground pipes in risk assessment process referred to above(Section 4.25.1, 4.21.22)
• apply techniques to reduce solid waste generated within each specific process/activity(see Section 5.2).
5.2 BAT for process/activity
This section presents BAT elements for each process/activity covered in this document.Numbers in the headings of the following BAT sections correspond with the numbers used inprevious Chapters.
The analysis of production techniques from an environmental perspective is a task that isrequired for this BREF as well as comparisons between alternative production techniques,where they exist. The latter has only been possible to a limited extent because of a lack of theinformation.
2. BAT for Alkylation is to use either:• HF alkylation. Because of the use of HF, this technique may represent a high risk for the
operators and neighbourhood. Associated with BAT is the reduction of regular HFemissions to levels < 1 mg/Nm3 by scrubbing, to levels of 20 – 40 ppm F in thedischarges to water after AlF3 or CaF2 precipitation. It is not clear from the informationprovided by the TWG what fluoride levels may be reached in the waste generated by thistechnique. (Section 4.2.1)
• sulphuric acid alkylation. This technique includes as BAT the minimisation andregeneration of the spent sulphuric acid. Regeneration may imply transportation andstorage of spent sulphuric acid waste. Waste water generated by this process should beneutralised before routing to the WWTP. (Section 4.2.2)
3. BAT for Base Oil Production:Note: BAT for Vacuum Distillation Units and Hydroprocessing units are determined under theirrespective activities (Primary distillation and Hydrogen-consuming techniques).
Best available techniques Chapter 5
MA/EIPPCB/REF_BREF_FINAL December 2001 403
BAT is to:• use triple effect evaporation systems in the solvent recovery sections of deasphalting,
extraction and dewaxing process units. In some instances, for technical reasons (increasein temperature and pressure) it is not feasible to go from double to triple effect. Tripleeffect systems are typically used in non-fouling feedstocks (e.g. wax). (see 4.3.1)
• use N-methyl pyrrolidone (NMP) as solvent in the aromatic extraction. In some cases, theswitch from furfural to NMP may not be justified environmentally or technicallyespecially when producing lower boiling point base oils (e.g transformer oil distillates).Because a solvent switch typically requires different temperature, pressure and solventvolumes, they are typically very costly (See 4.3.2). Industry claims that considering theinformation within this document, both NMP and furfural are equally viable solventcandidates. In Industry’s opinion, no clear case has been made in the BREF to arrive atone preference.
• use hydrotreating for clean-up of the base oil streams and wax finishing if final clean-upis required. Clay treatment may be justified in some cases because product quality cannotbe achieved by hydrotreating, but it produces solid waste. (see 4.3.4,5)
• consider the application of a common hot oil system for these solvent recovery systems toreduce the number of furnaces (see 4.3.10) In stand-alone lube refineries, this willfacilitate application of flue gas treatment where liquid fuel is used (See 5.2.10)
• apply prevention techniques for VOC emissions from solvent-containing systems (e.g.storage). Practise benchmarking of solvent consumption (See 4.3.6-7)
• apply BAT on sulphur recovery units in stand-alone lube refineries (see 5.2.23)• review the possibility of waste water stripping from aromatic extraction before re-use (see
4.3.9)• consider the effect of solvents when designing and operating the WWTP. This BAT can
be seen as a part of a water management scheme (See Section on generic BAT and 4.3.2)• apply leakage prevention measures for solvent-containing systems, to prevent soil and
groundwater contamination with the water-soluble solvents employed. This can be seenas a part of the waste management system (See Section on generic BAT andSection 4.3.7)
4. BAT for Bitumen Production is to:• reduce aerosol and VOC emissions (considered as a part of the odour abatement
programme) by selecting between:� recovering the liquid element of the aerosol that is directed to vents from storage and
during the blending/filling operations of bitumen (e.g. wet electrostatic precipitator,oil scrubbing). This technique is easier to apply when the storage andblending/filling operations of bitumen are close enough. (More information inSection 4.4.2.3)
� incineration at a temperature over 800 ºC or in process heaters. (More information inSection 4.4.2.2-3). Fitting such a system into an existing incinerator package may bedifficult technically.
• apply leakage prevention measures (as part of the waste management) to prevent wastegeneration (see 4.4.4)
• apply BAT on sulphur recovery units in stand-alone bitumen refineries (see 5.2.23)• apply the following techniques if bitumen blowing is applied:
� treat the overheads from the oxidiser for removal of air contaminants (e.g. oil, solid,VOC) (as part of the odour abatement programme). If water scrubbing is used, waterused in the wet scrubber need to be cleaned before being re-used. If incineration isused, the blow gas can be used in process heaters (see 4.4.2.1).
� send the accumulated water condensate to a sour water stripper. In some cases,because of the quality and quantity of the water generated and a possible resizing ofthe SWS, this may not be justified economically (see 4.4.3).
� route the condensed hydrocarbons to the refinery slops oil system or alternativerecovery method (e.g. sludge recovery) (see 4.4.22).
Chapter 5 Best available techniques
404 December 2001 MA/EIPPCB/REF_BREF_FINAL
5. Catalytic CrackingA catalytic cracking unit is usually part of a processing complex that includes a gas plant, aminetreating of the light (incl.C3/C4) gases and treatment of various product streams. BATdeterminations for these associated activities are dealt with in the respective parts (gasseparation processes, hydrogen-consuming processes and waste gas treatments) of this section.For the catcracker itself (reactor, regenerator, fractionator, catalyst receipt, storage/loading, wetgas compressor, absorber and debutaniser) the main specific BAT determinations are givenabove. Solutions and measures should be considered in an integrated way with measures andsolutions in other units.
In this respect BAT is to:• include a CO-furnace/boiler for partial oxidation conditions. Under those conditions and
without abatement measures associated CO emission levels are 50 - 100 mg/Nm3 and forNOx emissions are 100 – 300 mg/Nm3 (see 4.5.3). Low figures for CO and NOx are nottypically achieved at the same time. One Member State claims that the associatedemission range should be 300 – 450 mg/Nm3 if those low levels of CO need to bereached. Industry remains of the view that the range should be 100 – 500 mg/Nm3 tocover the whole range reported in Section 4.5.3.
• monitor and control O2 (typically at 2%) for full combustion plants, resulting in a COemission level of 50 - 100 mg/Nm3 and 300 – 600 mg NOx/Nm3 in absence of adownstream CO boiler. Low figures for CO and NOx are not typically achieved at thesame time (see 4.5.1).
• increase energy conservation by:� applying power recovery (expander) to the regenerator gas. This technique may not
be economically or environmentally justified in small or low-pressure unit expanders(see 4.5.5)
� using waste heat boiler to recover part of the energy content of the flue gas from thecatcracker (see 4.5.5)
• reduce NOx emission to 40 – 150 mg/Nm3 (lower end is only applicable when SCR andlow sulphur feedstock are used) by a suitable combination of:� modification of the design and operation of regenerator, especially to avoid high
temperature spots. This technique may raise the CO emissions and cannot beenvironmentally justified if a major or complete revamp is necessary.
� hydrotreatment of the feedstock if it is economically and technically viable (see4.5.4). This technique is easier to implement when amine scrubbing and Clauscapacities and hydrogen are available (see 4.5.4)
� using SNCR on the regenerator flue gas, achieving a NOx reduction of 60 - 70 %(see 4.5.8.2)
� using SCR on the regenerator flue gas, achieving a NOx reduction of 85 - 90 %.Associated emissions of ammonia slip is 2 – 5 mg/Nm3. Ammonia slipconcentrations may increase at the end of the catalyst life (see 4.5.8.1).
Three split views from Member States appeared on the range of the NOx emissions. OneMember State claims that the application of an SCR is always possible and that the uppervalue should be therefore 100. One Member State claims that the range should be 300 – 450 mg/Nm3 because the FCC technology is chosen according to the crude oil processed,the refinery configuration and the product demand. So NOx emissions cannot drive theproduction operations. One Member State specifies that the range should be 10 – 450because SCR and SNCR are not applicable to all existing units.
• reduce particulates emissions to 10 – 40 mg/Nm3 (upper end of the range applicable tofeedstocks with very low sulphur/metal content. Because of poor reliability of theparticulates monitoring system and technical difficulties in upgrading the existing ESPs,the upper range can be difficult to reach. In those cases 50 is seen as a more achievablelevel) by a suitable combination of:
Best available techniques Chapter 5
MA/EIPPCB/REF_BREF_FINAL December 2001 405
� tertiary and multistage cyclones (4.5.9.1)� applying an ESP or scrubber to the FCC regenerator gas. Efficiencies associated with
BAT range are 95 – 99 %. Upper range has not been reported to be achieved withscrubbing (4.5.9.2, 4.5.10.2)
� containing catalyst losses to atmosphere during loading/unloading (4.5.9.4)� hydrotreatment of the feedstock if it is economically and technically viable (see
4.5.4). This technique is easier to implement when amine scrubbing and Clauscapacities and hydrogen are available (see 4.5.4). It has an impact on the metalcontent of particulates
� selecting attrition-resistant catalyst to decrease the frequency of replacement andreduce the particulate emissions (see 4.5.6). This may adversely affect theperformance of the FCCU (see waste paragraph)
• reduce SO2 emission to 10 - 350 mg/Nm3 (lower end of the range only achievable whenboth low sulphur feedstock and FGD are used) by a suitable combination of:� hydrotreatment of the feedstock if it is economically and technically viable (see
4.5.4). This technique is easier to implement when amine scrubbing and Clauscapacities and hydrogen are available (see 4.5.4).
� using DeSOx catalyst additive (see 4.5.10.1)� using FGD (techniques mentioned in Sections 4.5.10.2-6) of the regenerator gas with
95 – 99 % efficiency (emission target depends on uncontrolled level) especially ifhydrotreatment of feedstock is not applicable.
One Member State maintains that FGD is always applicable and that the range shouldtherefore be changed to 10 – 100.
• reduce discharges to water by:� hydrotreatment of the feedstock if it is economically and technically viable (see
4.5.4). This technique is easier to implement when amine scrubbing and Clauscapacities and hydrogen are available (see 4.5.4).
� minimising water use by recycling and the application of a cascading system,observing corrosion constraints (see 4.5.7)
� re-using waste water in desalters or ultimately routing it to the WWTP (see 4.5.7)
• reduce waste generation by� reducing uncontrolled catalyst losses (to air, from ESP, product and slurry tank
bottoms) by spent catalyst management. Applying benchmark performance (see4.5.12)
� selecting attrition-resistant catalyst to decrease the frequency of replacement andreduce the particulate emissions. This may adversely affect the performance of theFCCU (see 4.5.6)
One Member State does not agree with the approach followed in this section for the SOxand NOx emissions. Their proposal is to follow their national methodology for BATdetermination and implementation.
6. BAT for Catalytic Reforming is to:• route the regenerator gas generated during the catalyst regeneration to a scrubbing
system. Send the bleed stream from the scrubbing system to the WWTP. (Section 4.6.4)• optimise the amount of chlorinated promoters in the regeneration of the catalyst (See
4.6.3)• quantify the dioxin emissions from the catalyst regenerator. More information about
dioxin removal is given in Section 4.6.6. Since all techniques are quite new and notwidely used yet, futher data gathering on dioxin clean-up techniques are necessary (seeConcluding Remarks)
Chapter 5 Best available techniques
406 December 2001 MA/EIPPCB/REF_BREF_FINAL
7. BAT for Coking Processes is to:• use waste heat boilers to recuperate some of the heat produced during the
coking/calcining process (see 4.7.1, 4.7.3-4)• consider the use of flexicoking (fluid coking + gasification) to maximise the production
of fuel gas and increase the heat integration in the refinery. For applicability, this optionneeds to meet refinery product requirements (see 4.7.4)
• use cokers as an alternative (others are e.g. CDU in Section 5.2.19) to destroy oily slopsand sludge (see applicability restrictions in 4.7.5)
• convert COS from the coke gas of flexicokers to H2S (see 4.7.6)• route sour gas produced from cokers to sulphur treatment (see 4.7.6)• reduce particulate emissions (containing metals):
� by collecting and recycling, as much as possible within the refinery the coke finesgenerated in the coking processes (see 4.7.8 and 4.7.11.1)
� by proper handling and storing of coke including construction of wind breaks aroundthe green coke pit or storing it in completely enclosed facilities (see 4.7.8)
� by covering the conveyor belts and de-pressurising with filters (see 4.7.8)� by enclosing loading areas, keeping them under negative pressures and exhausting
the collected air through bag filters or by using dust extraction incorporated with theloading equipment (see 4.7.8).
� to 10 - 50 mg/Nm3 by applying ESP and/or cyclones and/or filters from the differentflue gases containing particulates (see Section 4.7.9.1). Industry claims that ESP isnot applicable because the conductivity of the coke particles is high andconsequently the higher value of the range should be 100.
• reduce SO2 emissions from the calcination flue gas to 25 to 300 mg/Nm3 by applyingFGD techniques (efficiency >90 %) (see 4.7.9.2). Industry claims that with theapplication of FGD and with 90 % removal is not possible to achieve the upper valuebecause the sulphur in the feed may be very high. Their proposal is to increase the valueto 500.
• reduce emissions to water by:� using treated water from the waste water treatment as cooling/cutting water in the
delayed coking/calcination processes (see 4.7.7)� stripping waste waster generated in coking processes before sending it to the WWTP
(see 4.7.10.1)• reduce waste generation by enhanced separation of oily coke fines (more information in
4.7.10.2).
8. BAT for Cooling Sytems is to:• apply BAT from the cooling BREF• reduce cooling demand in the refinery by applying an integrated approach and heat
optimisation analysis (related with BAT in Section 5.2.10, second bullet. See 4.10.1.3)• maximise the heat recovery by application of low-level heat utilisation schemes (e.g.
district heating, industrial heating) where local demand is identified and economic resultsfavourable (See 4.10.1.3)
• during design, consider the use of air cooling. Applicability limitations are noise, spaceand climatic conditions (see 4.8.2)
• eliminate as far as possible oil leakage into cooling water discharges (once-through orfrom circulating systems) (see 4.8.3)
• segregate once-through cooling water and process waters until after treatment of the latter(see 4.8.1)
9. BAT for Desalting is to:• use multistage desalters for new facilities. The switch from existing desalters to
multistage desalters may not be environmentally or economically justified (SeeSection 4.9.1)
Best available techniques Chapter 5
MA/EIPPCB/REF_BREF_FINAL December 2001 407
• apply good desalting practices (described in Section 4.9.1-3) that result in optimumdownstream processing (minimal corrosion, meeting product specifications and reducingcatalyst contamination) and waste water quality (oil and N content)
• maximise the use of already-used refinery water as desalting water (see 4.9.4).
10. BAT for the Energy System:As mentioned in the previous chapters, this section comprises all units where energy (eitherelectricity or heat) is produced. Consequently this section should be read together with anyprocess/activity section or even when energy issues are analysed within a refinery as a whole.
BAT is to:• adopt an Energy Management System as part of the Environmental Management System
(described in Generic BAT section) (see 4.10.1.2). The aim is to increase the refineryenergy efficiency (see below). As elements mentioned in the EMS section, a good EnergyManagement System could include:� reporting the energy efficiency of the refinery and the plan to increase it (as part of
environmental performance report described in EMS)� an energy consumption reduction plan (as part of environmental performance report
described in EMS)� participation in ranking/benchmarking activities in energy consumption (as part of
benchmarking described in EMS)• improve the refinery energy efficiency (see Generic BAT). Techniques that help to
improve the overall efficiency are:� application of efficient energy production techniques such as use of gas turbines,
combined cycle power generation/co-generation plants (CHP), IGCC, efficientlydesigned and operated furnaces and boilers and replacement of inefficient boilersand heaters. In the implementation phase of the replacement of inefficient boilersand heaters, consideration should be given tothe retrofitability, size, actual amount ofemissions, age and remaining life in order to evaluate the cost-effectiveness and thetiming for the action. (see 4.10.3)
� application of combustion improvement campaigns (see 4.10.1.2)� matching energy production and consumption with computerised control systems
(see 4.10.1.3)� optimised use of steam in the stripping processes and the use of steam traps (see
4.10.1.4)� enhancing the heat integration through processes/activities by energy optimisation
analysis (see 4.10.1.3)� enhancing the recovery of heat and power within the refinery (see 4.10.1.3)� using of waste heat boilers to reduce the use of fuel for the production of steam (see
4.10.1.3)� identifying and using, if possible, opportunities for synergy outside the refinery
fence (e.g. district/industrial heating, power generation) (See 4.10.1.3)• use clean RFG and, if necessary to supply the rest of the refinery energy demand, liquid
fuel combined with control and abatement techniques (see Section 5.2.10) or other fuelgases such as natural gas or LPG. Where gaseous fuels replace liquid fuels, the reductionof SO2 and NOx emissions as a result of the fuel switch is not complicated to calculate forsingle processing units and for the refinery as a whole (see Section 4.15.2). Informationon cross-media effects and applicability restrictions of a full gas switch is in Section4.10.2.1
• increase the proportion of clean fuels used. This can achieved by a suitable combinationof:� maximisation of the use of refinery fuel gas (RFG) with low H2S content (20 - 150
mg/Nm3 by amine treating) (see 4.10.2.1-2 and 4.23.5.1). One Member State claimthat for existing refineries the range should be <500 – 1000 ppm because the H2Scontent in RFG is negligible if the bubble limit is respected.
Chapter 5 Best available techniques
408 December 2001 MA/EIPPCB/REF_BREF_FINAL
� balance and control of the RFG system between suitable pressure limits to givesystem flexibility, with make-up available from sulphur-free sources such as LPG orimported gas (see 4.10.2.1)
� use state-of-the-art controls to optimise the performance of the RFG system (see4.10.11.3 and 4.10.12.1)
� use flaring of RFG only during start-up/shutdown/upset/emergency conditions.During normal operation give a constructive use to the RFG, including sale (relatedto flare section at the end of this chapter) (see 4.23.7)
� upgrading and cleaning heavy fuel oil used in the refinery to low-sulphur liquid fuel.As mentioned in the SO2 emission section below, the abatement of emissions afterfiring liquid fuels is also considered BAT (see 4.10.2.3).
• reduce CO2 emissions by:� increasing the refinery energy efficiency (see above and Generic BAT section)� increasing the use of gaseous fuels that have higher hydrogen-to-carbon ratios (see
4.10.2.1)• reduce CO emissions by application of efficient combustion techniques• reduce NOx emissions:
� by reducing fuel consumption (increase the energy efficiency, see above)� by replacing existing burners with low-NOx types during major outages. The lowest-
NOx burners suitable for individual applications should be used (see 4.10.4.1.2)� from boilers and heaters using gas fuel to 20 - 150 mg/Nm3 (lower levels for natural gas
and higher ones for small heaters with primary measures. Two Member States claimthat the upper value should be 100 because it can be reached with the implementation ofprimary measures and SCR) by applying a suitable combination of:
� high thermal efficiency heater/boiler designs with good control systems (e.g. oxygentrim) (see 4.10.3.1)
� low-NOx burner techniques (see 4.10.4.1-2)� flue gas circulation in boilers (see 4.10.4.3)� reburning technique (see 4.10.4.5)� SCR/SNCR. Ammonia slip considered associated with the use of SCR is
2 - 5 mg/Nm3. The lower value is achievable with new catalysts and ammonia sliptypically increases with catalyst life. (see 4.10.4.6-7)
� from boilers and heaters using liquid fuel to 55 - 300 mg/Nm3 (the lower levels relatesonly to boilers with SCR and the higher levels only to small heaters with primarymeasures. One Member State claims that small heaters (<50MW) can reach 200 andwith the big heaters and boilers (>50MW) the installation of SCR is justified andconsequenly values of less than 100 can be reached. One Member State claims a levelfrom 200 – 400 because of the nitrogen content in the fuel) by applying a suitablecombination of:� fuels with low nitrogen content (related with low sulphur content) (see 4.10.2.3)� low-NOx burner techniques (see 4.10.4.1-2)� flue gas circulation in boilers (see 4.10.4.3)� reburning technique (see 4.10.4.5)� SCR/SNCR to liquid fuels heavier than gasoil type. Ammonia slip considered
associated with BAT is 2 - 5 mg/Nm3. The lower value is achievable with newcatalysts and ammonia slip typically increases with catalyst life. (see 4.10.4.6-7)
� from gas turbines to 20 – 75 mg/Nm3@ 15 % O2 (lower levels for natural gas andhigher levels for small gas turbines and RFG. One Member State claims that the uppervalue should be 35 based on primary measures and SCR) by applying a suitablecombination of:
� diluent injection (see 4.10.4.4)� dry low-NOx combustors (see 4.10.4.2)� SCR. Ammonia slip considered associated to BAT is 2 – 5 mg/Nm3. The lower value
is achievable with new catalysts and ammonia slip typically increases with catalystlife. (see 4.10.4.6-7)
• reduce particulate emissions (particulates from liquid firing contain Ni,V) to 5 - 20mg/Nm3 by applying a suitable combination of:
Best available techniques Chapter 5
MA/EIPPCB/REF_BREF_FINAL December 2001 409
� reducing the fuel consumption (increasing the energy efficiency. See above)� maximising the use of gas and low ash content liquid fuels (see 4.10.5.1)� steam atomisation on the liquid fuels (see 4.10.5.2)� ESP or filters in the flue gas of furnaces and boilers when heavy liquid fuel is used
(see 4.10.5.3-4)One Member State claims that the range for particulates should be 30 – 50 because thosevalues are consistent with a 95% abatement. Industry rationale for the range 5 to 50mg/Nm3 is that this is consistent with the whole range reported in Chapter 4.
• reduce sulphur dioxide emissions:� by reducing the fuel consumption (increasing the energy efficiency)� from combustion processes (boilers, heaters and gas turbines):
� by increasing the proportion of clean fuels used (to low-sulphur residual fuel, togasoil, ultimately to gas) (See BAT on clean fuels at the beginning ofSection 5.2.10)
� to 5 – 20 mg SO2/Nm3 when using fuel gas by cleaning refinery fuel gas (20 to150 mg H2S /Nm3) including monitoring of the sulphur content of the refineryfuel gas. Refer to split views given on the H2S concentration in BAT forrefinery fuel gas.
� to achieve an average emission value of 50 – 850 mg SO2/Nm3 (lower end ofthe range is for the implementation of FGD and deep hydrodesulphurisation toall liquid fuels) for the total refinery liquid fuel pool by applying a suitablecombination of:� hydrodesulphurising the necessary amount of liquid fuel (See
section 4.10.2.3)� applying flue gas desulphurisation (See Section 4.5.10 and 4.23.5.4). This
technique is more cost-effective in large furnaces and boilers.One Member State claims that the use of FGD is always possible and that theupper value should therefore be 200. One Member State and Industry claim thatthe limit should be no lower than 1700 mg SO2/Nm3 which is equivalent to a1% sulphur level in fuel oil with no abatement.
• reduce water use by:� re-using condensate water as de-areator feed water. Where the condensate and the
de-areator are located far apart, their integration is not always cost effective. (see4.10.3.2)
� preheating the boiler feed water with waste heat. Where the BFW and the availablewaste heat are located far apart, their integration is sometimes too costly comparedwith the environmental benefit (see 4.10.3.2)
One Member State does not agree with the approach followed in this section for the SOxand NOx emissions. Their proposal is to follow their national methodology for BATdetermination and implementation. Another Member State does not agree with theapproach followed in this Section because they claim that the bubble approach shoulddrive the Energy BAT Section.
11. BAT for Etherification is to:• apply heat integration either in the unit itself or within the refinery (See 4.10.1.3)• use a storage tank or production planning to control waste water generated, to prevent any
upset of the biotreater (See 4.11.2)
12. BAT for the Gas Separation Processes is to:• enhance the heat integration with upstream plant streams using low-level heat streams
(see 4.12.1)• re-use the fuel gas used for the regeneration of molecular dryers (See 4.12.4)• preventing any release of odorant to any environmental medium during storage and
handling (e.g. blanket storage) (see 4.12.5, 4.21.21)• reduce VOC fugitive emissions (See 4.12.3 and Generic BAT)
Chapter 5 Best available techniques
410 December 2001 MA/EIPPCB/REF_BREF_FINAL
13. BAT for Hydrogen consuming Processes is to:• design and retrofit (where possible) hydrocracker units (reactor and fractionation section)
to highly heat-integrated equipment, applying energy optimisation analysis and four-stageseparator system (see 4.13.6)
• use heat recovery from high-temperature process streams in WHB and power recovery inthe high-pressure units (letting down liquid) (4.13.1-2,6-7)
• route off-gases containing H2S to amine systems and SRUs (see 4.23.5.1)• route waste waters containing H2S and N-compounds to the appropriate waste water
treatment (see 4.24.1 and 4.15.6)• use on-stream catalyst replacement for high-metal feedstocks (see 4.13.4)• promote catalyst regeneration options in co-operation with the catalyst
suppliers/manufacturers where possible (see 4.25.3).
14. BAT for Hydrogen Production is to:• consider the use of gas-heated steam reforming technology for new plants, including
recovery of heat from the steam reformer flue gas and heat integration around the solventabsorber and the methanator (see 4.14.1)
• recover hydrogen from the gasification processes of heavy fuel oil and coke if thetechnology is applied in the refinery (see 4.14.2)
• apply heat integration schemes in the hydrogen plant (see 4.14.1)• use PSA purge gas as fuel gas within the refinery (see 4.14.3)
15. BAT for Integrated Refinery Management• BAT determined from Section 4.15 appears in Section 5.1 (generic BAT).
16. BAT for Isomerisation is to:• use active chloride-promoted technology if sufficient guarantees can be given on
feedstock quality and contamination levels (see 4.16.1), or• use other catalytic systems (e.g. zeolite) (see 4.16.2)• optimise the use of chlorinated organic compounds used in maintaining the catalyst
activity (see 4.16.1)
17. BAT for Natural Gas Plants is to:• apply Generic BAT (Section 5.1) including good housekeeping and Environmental
Management and BAT related to reduction of air, water and solid emissions• apply BAT related to the Energy system (see Section 5.2.10)• apply BAT for Waste Gas Treatments (see Section 5.2.23)• use as fuel preferably gas that is of saleable quality (typically less than 5 mg of H2S/Nm3)
(see 4.17.1)• consider, particularly for large carbon dioxide flows, alternatives to direct releases of
CO2. (See Section 4.17.3)• dispose of mercury recovered from raw natural gas (if present) in an environmentally
acceptable way (Refer to Section 4.17.7)
18. BAT for Polymerisation is to:• optimise the catalyst consumption (Section 4.18.1)• re-use phosphoric acid (catalyst) within the refinery as much as possible e.g. biotreater
(see 4.18.2)• properly manage the unused on-site catalyst for disposal or re-use off site (see 4.18.2).
19. BAT for Primary Distillation UnitsThe main refinery process is the Atmospheric Crude Distiller. In fact, it is a complex process,normally including a desalter, a gas plant, hydrotreaters, amine treaters, a sour water stripperand sometimes also an integrated high-vacuum unit. So the respective BAT as determined forthe specific processing units (gas plants, hydrotreaters etc.) need to be observed.
Best available techniques Chapter 5
MA/EIPPCB/REF_BREF_FINAL December 2001 411
BAT is to:• maximise heat integration by selecting between:
� design highly integrated units (e.g. progressive distillation) (see 4.19.1)� increase heat integration between the atmospheric crude distiller with the vacuum
unit or with other refinery process units (4.19.2-3). Some techniques that could beused are:� application of energy optimisation analysis to the crude preheat train� increasing crude distillation column pumparounds. Reboiling sidestrippers with
a heat transfer oil rather than by steam stripping.
• maximise the use of liquid ring vacuum pump and surface condensers in place of somestage steam jet ejectors on the vacuum tower overhead. Especially applicable to the lastvacuum stage which gives the most environmental benefit avoiding contamination ofwater. Minimise waste water flow/transfer of hazardous substances from vacuum pumpsapplying water recycling/waste water-free technique. See applicability restriction andmore information in Section 4.19.4.
• apply advanced process control to optimise energy utilisation (see 4.19.2-3)• use crude distillation units as an alternative (other is in 5.2.7 third bullet) to reprocess
slop. This technique may generate problems in the desalter or may foul up the heatexchangers (see 4.19.8).
20. BAT for Product Treatments is to:• hydrotreat products where olefins and colour bodies need to be removed for new plants
(see 4.20.4)• consider the use catalytic dewaxing for new plants (see 4.20.6)• implement a good management system of the caustic solutions with the aim of
minimising the use of fresh caustic and maximising the use of spent caustic. (see 4.20.1-2). Techniques that could be used:� for recycling are cascading of caustic solution and the re-use of spent caustic
solutions by stripping.� for destruction are injection to desalters (this option may enhance the coke formation
e.g. in visbreakers as seen in Section 5.2.22 forth bullet) or incineration of remainingspent caustic solutions when COD is high (e.g > 100 g/l).
• incinerate the spent air from sweetening processes (as a part of an odour abatementprogramme) (see 4.20.3).
21. BAT for Storage and Handling of refinery materials:Note: In this section, refinery materials mainly relates to hydrocarbon compounds. Storage ofother materials in a refinery such as water, caustic, acids, etc is not covered here.
BAT is to:• apply the BAT determined in the BREF on Storage• ensure the liquids and gases stored are in appropriate tanks or vessels based upon the true
vapour pressure of the stored material (see Storage BREF).• implement containment BAT (see storage BREF)• use high-efficiency seals in floating roof tanks (see storage BREF)• bund all stored chemicals, with separate bunding for incompatibles (see storage BREF)• apply emission reduction measures during tank cleaning (See 4.21.10-11)• apply concepts of good housekeeping and environmental management (see Section 5.1
and 4.15.3)• minimise number of tanks and volume by a suitable combination of: application of in-line
blending, integration of processing units, co-operation with partners in industry. Thistechnique is much easier to apply on new facilities. (see 4.21.7, 4.21.14, 4.15.5)
• enhance vapour balancing and back venting during loading/unloading processes, e.g. byvapour balance lines that transfer the displaced vapour from the container being filled tothe one being emptied. Incompatibility of tank vapours and applicability to external
Chapter 5 Best available techniques
412 December 2001 MA/EIPPCB/REF_BREF_FINAL
floating roofs tank are some examples of restrictions of application. Applicability needsto reflect economics, the type and size of vessel to be used (e.g. tank, truck, railcar, ship),type of hydrocarbon fraction and frequency of use of the tank. Because this technique isrelated to the next one, both should be evaluated together when implementing on aspecific site. (see 4.21.18)
• apply vapour recovery (not applicable to non-volatile products) on tanks, vehicles, shipsetc. in stationary use and during loading/unloading. Achieved emission levels are verydependent on the application, but recoveries of 95 - >99 % are considered BAT. If VRUsare not considered appropriate for certain streams, vapour destruction units are consideredBAT. Properties of streams, such as type of substance, compatibility of substances orquantity need to be considered in the applicability of this BAT. Applicability needs toreflect economics, the type and size of vessel to be used (e.g. tank, truck, railcar, ship),type of hydrocarbon fraction and frequency of use of the tank. Because this technique isrelated to the above one, both should be evaluated together when implementing on aspecific site (see 4.21.16 and 4.23.6.2)
• reduce (risk of) soil contamination by the implementation of an inspection andmaintenance programme that could include implementing good housekeeping measures,double-bottom tanks, impervious liners, good housekeeping practices (draining,sampling, tank bottoms) (as part of the EMS) (see 4.21.8 and 4.21.13)
• install self-sealing hose connections or implement line draining procedures (see 4.21.13)• install barriers and/or interlock systems to prevent damage to equipment from the
accidental movement or driving away of vehicles (road or rail tank cars) during loadingoperations (see 4.21.13)
• implement procedures to ensure that arms are not operated until inserted fully into thecontainer to avoid splashing where top loading arms are used (see 4.21.13)
• apply instrumentation or procedures to prevent overfilling (see 4.21.13)• install level alarms independent of normal tank gauging system (see 4.21.13).
22. BAT for Visbreaking is to:• apply deep thermal conversion, hydrovisbreakers or soaker visbreakers (see 4.22.1-3)• sweeten the gas from visbreaking (See 4.22.4)• treat gas and effluent water because of the presence of sulphur compounds (see 4.22.4)• reduce the coke formation. It may be reduced by controlling the sodium content in the
visbreaker feedstock or by using additives that decelerate the coke-formation. (See4.22.5)
23. BAT for Waste Gas Treatments:Abatement techniques for air pollutants are not included in this section. They are included in theGeneric BAT section and in the BAT for each of the process/activities mentioned above. Thefollowing table gives a summary of where the main air pollutants can be found in this Chapter:
Air pollutant Section of this chapter where specific BAT-related air pollutants arementioned
CO Catcracker, energy systemCO2 Energy systemNOx Generic, catcracker, energy systemPM Generic, catcracker, reformer, coker, energy system,SOx Generic, catcracker, coker, energy system, product treatments,
visbreakerVOC Generic, bitumen, gas separation processes, NG plants, storage,
BAT for amine treating is to (see 4.23.5.1):• use regenerative amine process• re-use amine solutions wherever possible• reduce the concentration of H2S in the refinery gas to levels of 20 - 150 mg/Nm3 (See for
split views on the upper value within Section 5.2.10 third round bullet)
Best available techniques Chapter 5
MA/EIPPCB/REF_BREF_FINAL December 2001 413
• have sufficient capacity to allow maintenance activities and upsets (e.g. have redundancyequipment, apply load shedding, emergency amine scrubbers, multiple scrubber systems)(related with second BAT on SRU)
• use a storage tank or production planning to control waste water generated, to prevent anyupset of the biotreater. (See BAT on reduction of discharges to water).
BAT for sulphur recovery units (SRU in 4.23.5.2) is to:• apply a staged SRU, including tail gas treatment with a recovery efficiency of
99.5 % - 99.9 % (based on acid gas feed to the SRU). Range depends on costeffectiveness considerations. Those efficiencies ensure a SO2 concentration range in theflue gas after incineration of 2000 – 400 mg/Nm3. (See Section 4.23.5). One MS claimsthat FGD can be used when concentrations from SRU are over 2000 mg/Nm3 and theyrepresent a significant amount of SO2 emissions within the refinery. One Member Stateclaims that the recovery efficiencies mentioned as BAT are for new plants. They claimthat BAT for existing units is 98.5 – 99.5% recovery.
• have an SRU configuration with sufficient capacity for the H2S feed to the unit. This maybe achieved by having, for example, at least two parallel SRU’s of sufficient totalcapacity satisfactorily to cover all normal operating scenarios, including the sourest crudefeed slate expected to be processed on the site
• have enough SRU capacity to allow the scheduled maintenance activity to proceed everytwo years, without a significant increase of sulphur emissions
• have a utilisation factor of at least 96 %, including major planned turnaroundmaintenance
• use state-of-the-art control and monitoring systems. Use of a tail gas analyser linked tothe process control system (feedback control) will aid optimum conversion during allplant operating conditions, including changes to sulphur throughput
• use a good furnace burning-zone design and effective furnace temperature and oxygencontrol systems where sour water stripper off-gases are a feed stream, because the processmust also be designed and operated to complete the destruction of ammonia. Ammoniabreakthrough may lead to deposition and blockages of catalyst beds by ammonium salts(eg carbonate/sulphate) and these SRUs need to be monitored for evidence of this.
• apply alternative H2S/SO2 recovery/removal techniques (e.g. iron chelating, solventextraction, NaOH adsorption, molecular adsorption) in those installations where the H2Sproduction is small (< 2 t sulphur per day if incineration is acceptable). Those optionshave important cross-media effects such as waste generation and energy consumption.This BAT is especially relevant for stand-alone lubricant refineries, bitumen refineriesand some natural gas plants (see 4.3.5 and 4.3.8).
BAT for flaring is to (see 4.23.7):• use flaring as a safety system (start-up, shutdowns and emergencies).• ensure smokeless and reliable operation• minimise flaring by a suitable combination of:
� balancing the refinery fuel gas system� installing a gas recovery system� using high-integrity relief valves� applying advanced process control
• reducing relief gas to flare by management/good housekeeping practices
24. BAT for Waste Water Treatments is:• see Generic BAT Section
25. BAT for Solid Waste management is:• See Generic BAT Section

Emerging technologies Chapter 6
MA/EIPPCB/REF_BREF_FINAL December 2001 415
6 EMERGING TECHNIQUES
Emerging technique is understood in this document as a novel technique that has not yet beenapplied in any industrial sector on a commercial basis. This chapter contains those techniquesthat may appear in the near future and that may be applicable to the refinery sector.
Refinery activities overviewThroughout its history the refining industry has continuously developed new and improvedprocesses in response to changes in feed quality, product specifications, product slates, newproduct outlets and economic and environmental requirements. These developments haveslowed down in recent years for the following reasons:
1. Large oil companies are cutting down on their R&D budgets, and are more and morerelying on third parties for new developments in refinery technology and catalyticprocesses. These third parties develop techniques for licensing income or for income fromcatalyst sales. Developments are reported in the technical literature (HydrocarbonProcessing, Chemical Engineering Progress, Oil and Gas Journal, Erdöl, Gas und Kohle,Petroleum Technology Review) and during seminars and conferences (World PetroleumCongress, WEFA, Hart’s Fuel Conference, European Refining Technology Conference,NPRA and API specialist meetings) for the dissemination of those techniques.
2. Technological developments are concentrating on optimising current systems for higheryields (e.g. more selective catalysts and solvents), higher energy efficiency (e.g. improvedreactor design and better heat integration) and shorter downtimes (e.g. scavenging ofimpurities, automatic cleaning systems) rather than novel processes;
3. The current tool box of conversion, separation, treatment and environmental technologiesseems adequate and sufficient to meet any desired product slate and product specificationsfor the coming decade as well as meeting stringent regulatory requirements;
Meanwhile, the upgrading process of the refinery sector to implement existing techniques formeeting new product specifications will continue. The rationalisation process in the refiningindustry will also continue and low margins will force refineries to look for cost savings.
AlkylationMost of the safety and environmental concerns are related to the potential for a large release ofHF or H2SO4. A solid acid catalyst would potentially overcome most of the drawbacksassociated with liquid acid catalyst systems and open up a new area of marketing for alkylation.Numerous companies are putting a large R&D effort into the development of a new solidcatalyst for the alkylation process.
Catalyst TechnologyBF3/Al2O3 GrignardSbF5/SiO2 Circulating bed + washingZeolite H-b GrignardCF3SO3H fixed in a porous carrier (silica) Haldor Topsoe A/S[61, Decroocq, 1997], [330, Hommeltoft, 2000]
Technology providers claim that these techniques will be ready in the market in one to twoyears.
Base oil productionA recently published new technology is the application of membranes for solvent recovery inthe solvent extraction/dewaxing processes. Driving force is the reduction in energyconsumption. [259, Dekkers, 2000]
Catalytic crackingSome promising lines of investigation for the improvement of the environmental performanceof catcrackers are:
Chapter 6 Emerging technologies
416 December 2001 MA/EIPPCB/REF_BREF_FINAL
• the capability to process heavier feedstocks, containing more contaminants (catalystdeactivators) such as vanadium and nickel and having a higher Conradson Carbon Residue(CCR) content. Responses that are being developed are: continue the development of moreactive catalysts and more effective (e.g. two-stage) catalyst regeneration. Driving forces arethe reduction of residue (i.e. enhanced upgrading) and higher overall refinery efficiency(e.g. the elimination of high vacuum unit operation) [259, Dekkers, 2000].
• deNOx additives in catcracker regenerators. low-NOx additives. NOx removal additives arean emerging technology that may have future applicability for NOx control from FCCregenerators. The additives are added to the regenerator of the FCC to promote thedestruction of NOx by reaction of nitrogen oxides with carbon monoxide or coke. They areoften especially promoted SOx removal additives, providing the ability to simultaneouslyreduce the NOx and SOx emissions from the FCC regenerator. They have been investigatedunder laboratory conditions but have not been commercially demonstrated. These additivesare attractive since they need no capital investment, although the operating cost for additivereplacement is expected to be large. Some trials in USA have achieved NOx reductions of50 %.
• hot ceramic filters can be retrofitted to the underflow of third stage cyclones. Ceramic filtersare only applied in niche applications.
• improvement of the catalyst separation by use of a magnet (Kellogg Tech company) [247,UBA Austria, 1998]
• other flue gas desulphurisation includes CanSolv’s amine scrubbing system for SO2removal. It has not commercially proven application in FCC, but it’s process appears quitepromising and cost effective, especially at high sulphur.
Catalytic reformingThe current practice of application of continuously improved catalysts (supplied by catalystmanufacturers) is expected to continue. [259, Dekkers, 2000]
Energy systemSome promising lines of investigation for the improvement of the environmental performanceof the energy systems are CO2 abatement techniques (more information within the waste gastreatments). Others are the heat integration. The search for further energy improvements iscontinuing, with the current focus on attractive cogeneration opportunities and more complexheat integration.
Hydrogen productionSome promising lines of investigation in hydrogen production technologies are:• the hydrocarb process, in which the residual oil is essentially cracked to carbon and
hydrogen. This process can be seen as an internal source of natural gas for a refinery. Theprocess produces carbon, hydrogen and methanol. It has been calculated in a refinery of4.98 t/yr that this process can increase by 40 % the total gasoline production, 1150 m3/d ofmethanol and 795 m3/d of C/H2O slurry [12, Steinberg and Tung, 1992].
• methane pyrolysis, which takes advantage of the thermal decomposition of natural gas andthe direct production of hydrogen while sequestering the carbon or using the carbon forother commodity purposes. Consequently the CO2 generation is completely eliminated [12,Steinberg and Tung, 1992], [281, Steinberg, 2000].
Hydrogen-consuming processesSome promising lines of investigation for the improvement of the environmental performanceof energy systems are:• residue hydrotreating and hydroconversion processes (e.g. slurry bed technology). This
process has only been demonstrated at semi-commercial scale and no commercial plants arein operation yet.
• gasoline deep desulphurisation techniques with a lower hydrogen consumption are currentlyunder development. Parameters are not yet available.
Emerging technologies Chapter 6
MA/EIPPCB/REF_BREF_FINAL December 2001 417
Integrated refinery management
Leak detection technology.Smart LDAR. This device is able to detect (using laser technology) fugitive hydrocarbonemissions by real time video imaging of the equipment under surveillance. It allows the user toidentify at a refinery the zones in which the greatest emissions are located so that an LDARusing sniffing techniques can focus on the high emission items. An API study has shown that90% of fugitive emissions comes from 0.13% of the piping components (API analysis ofrefinery screening data. Publication 310, November 1997). This technology is underdevelopment and a number of technical issues need resolving before it is ready for use as aroutine tool. The approach would considerably reduce the cost / benefit of a LDAR program byidentifying swiftly the high leakers. Nevertheless these developments over conventional LDARprogrammes are likely to come to fruition in the future term and progress should be monitoredto see when they can be accepted as a good technique [115, CONCAWE, 1999].
Product treatmentsA development to be mentioned is the biodesulphurisation of gas oil and even crude oil [259,Dekkers, 2000]
Waste gas treatmentsSome developments to be mentioned are:� sulphur dioxide removal by SO2 capture from flue gas and conversion into liquid sulphur.� biological H2S removal [181, HP, 1998]� particulate abatement techniques by new developments including ceramic filters (e.g. NGK,
Japan) and a rotating particulate separator (Lebon & Gimbrair, the Netherlands)� CO2 abatement techniques.
Assuming refinery utilisation gradually increases and that product specification and abatementrequirements continue to be more stringent, then CO2 releases, if unabated, are likely tocontinue to rise, since measures to meet these requirements will require energy. In principle CO2emissions can be reduced by separation, collection and finding a useful application. Injection ofCO2 aiming at secondary and tertiary oil recovery is a potential possibility. Injection into sub-soil formations for storage or supply to greenhouses as a gaseous fertiliser product has also beensuggested. However, considering the large quantities of CO2 involved these projects will bevery costly indeed. Moreover, these types of solutions can only partly alleviate the CO2emission issue.
Removal of CO2 from Flue Gas StreamsWet scrubbing using caustic soda for the removal of SO2 / NOx will effectively remove CO2 as acarbonate. It should be noted, however, that to apply wet gas scrubbing for the sole purpose ofremoval of CO2 would be largely self-defeating as the scrubbing process itself and theproduction of the scrubbing agents both require energy. A number of other licensed processesare available which will remove CO2 from flue gases using a solvent that can be recycled,typically methylethylamine (MEA). After absorbing the CO2 in a scrubbing system, the solventis thermally regenerated, releasing the CO2. This could then be compressed, liquefied and sentto underground disposal. Present indications are that the high energy requirements of this typeof scheme will discourage its general use.
Disposal of CO2Unlike the abatement of other pollutants no feasible technology exists for the removal of carbondioxide from flue gases. A number of disposal options are, however. under scientificconsideration. For technical, ecological and economic reasons, a viable solution is not yetavailable, but this option is currently being investigated by certain major operators and theInternational Energy Agency (IEA).

Chapter 6 Emerging technologies
418 December 2001 MA/EIPPCB/REF_BREF_FINAL
Emerging technologies under consideration are:• disposal in the deep ocean• disposal in deep aquifers• disposal in exhausted oil and gas reservoirs• disposal as a solid in an insulated repository.
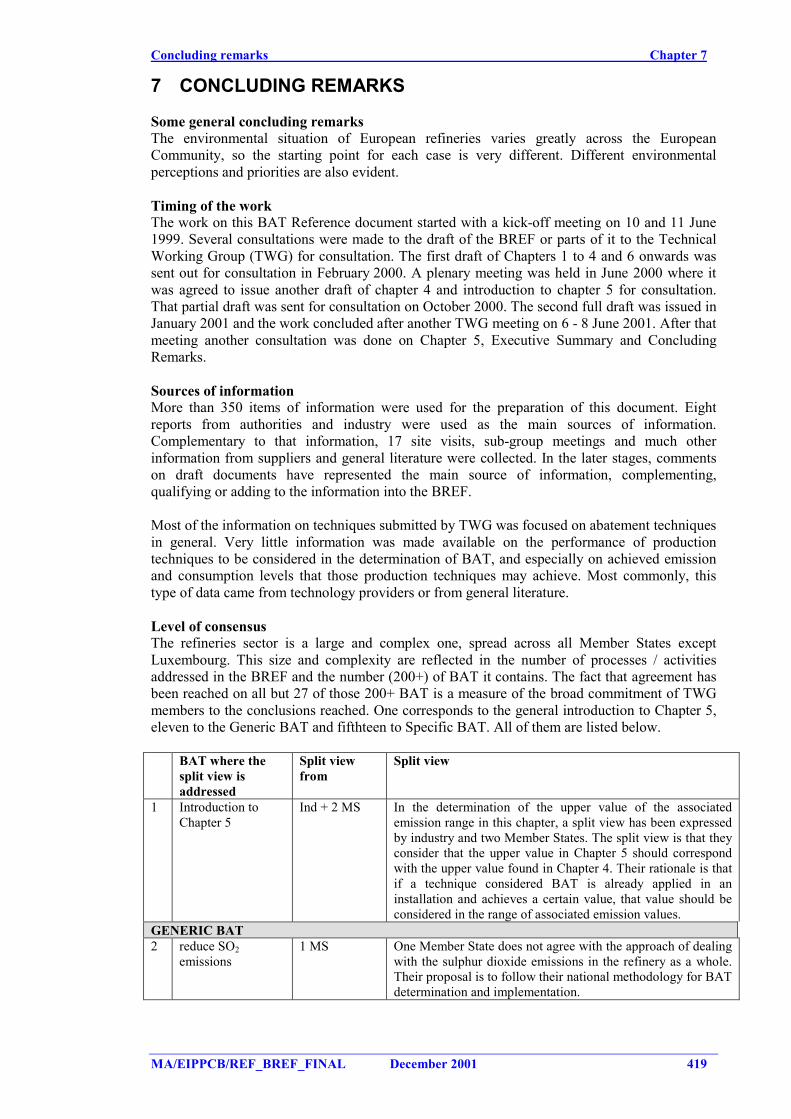
Concluding remarks Chapter 7
MA/EIPPCB/REF_BREF_FINAL December 2001 419
7 CONCLUDING REMARKS
Some general concluding remarksThe environmental situation of European refineries varies greatly across the EuropeanCommunity, so the starting point for each case is very different. Different environmentalperceptions and priorities are also evident.
Timing of the workThe work on this BAT Reference document started with a kick-off meeting on 10 and 11 June1999. Several consultations were made to the draft of the BREF or parts of it to the TechnicalWorking Group (TWG) for consultation. The first draft of Chapters 1 to 4 and 6 onwards wassent out for consultation in February 2000. A plenary meeting was held in June 2000 where itwas agreed to issue another draft of chapter 4 and introduction to chapter 5 for consultation.That partial draft was sent for consultation on October 2000. The second full draft was issued inJanuary 2001 and the work concluded after another TWG meeting on 6 - 8 June 2001. After thatmeeting another consultation was done on Chapter 5, Executive Summary and ConcludingRemarks.
Sources of informationMore than 350 items of information were used for the preparation of this document. Eightreports from authorities and industry were used as the main sources of information.Complementary to that information, 17 site visits, sub-group meetings and much otherinformation from suppliers and general literature were collected. In the later stages, commentson draft documents have represented the main source of information, complementing,qualifying or adding to the information into the BREF.
Most of the information on techniques submitted by TWG was focused on abatement techniquesin general. Very little information was made available on the performance of productiontechniques to be considered in the determination of BAT, and especially on achieved emissionand consumption levels that those production techniques may achieve. Most commonly, thistype of data came from technology providers or from general literature.
Level of consensusThe refineries sector is a large and complex one, spread across all Member States exceptLuxembourg. This size and complexity are reflected in the number of processes / activitiesaddressed in the BREF and the number (200+) of BAT it contains. The fact that agreement hasbeen reached on all but 27 of those 200+ BAT is a measure of the broad commitment of TWGmembers to the conclusions reached. One corresponds to the general introduction to Chapter 5,eleven to the Generic BAT and fifthteen to Specific BAT. All of them are listed below.
BAT where thesplit view isaddressed
Split viewfrom
Split view
1 Introduction toChapter 5
Ind + 2 MS In the determination of the upper value of the associatedemission range in this chapter, a split view has been expressedby industry and two Member States. The split view is that theyconsider that the upper value in Chapter 5 should correspondwith the upper value found in Chapter 4. Their rationale is thatif a technique considered BAT is already applied in aninstallation and achieves a certain value, that value should beconsidered in the range of associated emission values.
GENERIC BAT2 reduce SO2
emissions1 MS One Member State does not agree with the approach of dealing
with the sulphur dioxide emissions in the refinery as a whole.Their proposal is to follow their national methodology for BATdetermination and implementation.
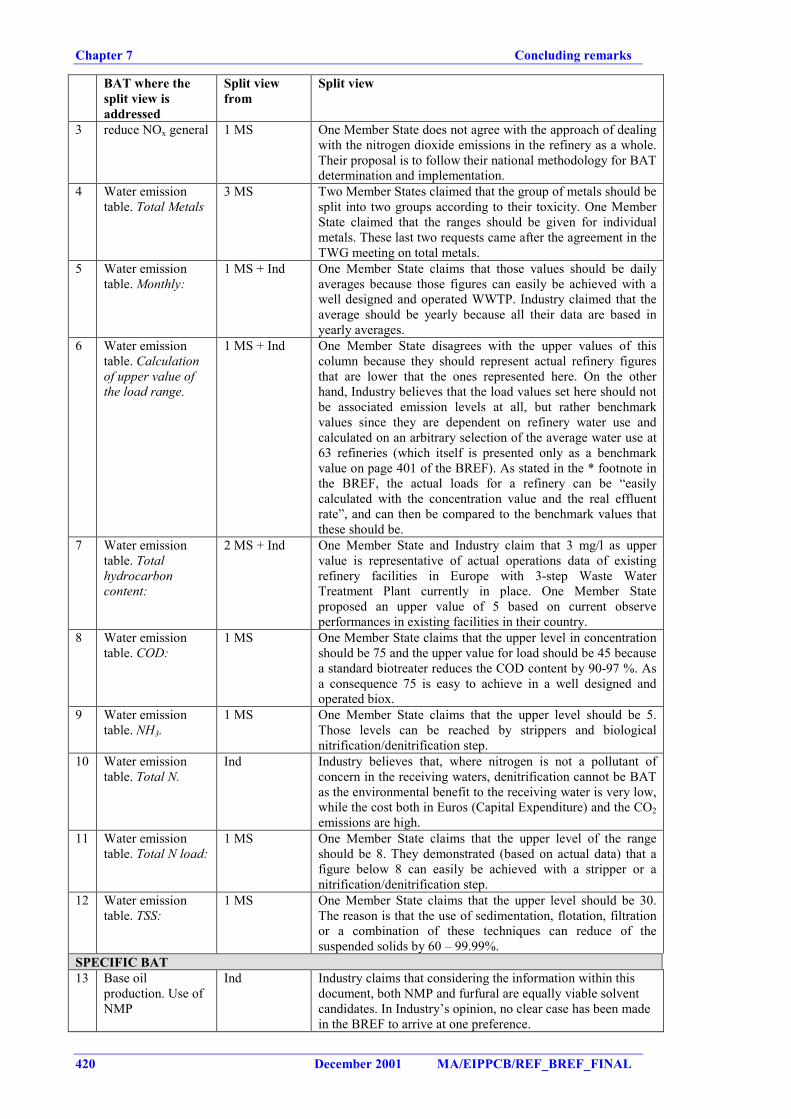
Chapter 7 Concluding remarks
420 December 2001 MA/EIPPCB/REF_BREF_FINAL
BAT where thesplit view isaddressed
Split viewfrom
Split view
3 reduce NOx general 1 MS One Member State does not agree with the approach of dealingwith the nitrogen dioxide emissions in the refinery as a whole.Their proposal is to follow their national methodology for BATdetermination and implementation.
4 Water emissiontable. Total Metals
3 MS Two Member States claimed that the group of metals should besplit into two groups according to their toxicity. One MemberState claimed that the ranges should be given for individualmetals. These last two requests came after the agreement in theTWG meeting on total metals.
5 Water emissiontable. Monthly:
1 MS + Ind One Member State claims that those values should be dailyaverages because those figures can easily be achieved with awell designed and operated WWTP. Industry claimed that theaverage should be yearly because all their data are based inyearly averages.
6 Water emissiontable. Calculationof upper value ofthe load range.
1 MS + Ind One Member State disagrees with the upper values of thiscolumn because they should represent actual refinery figuresthat are lower that the ones represented here. On the otherhand, Industry believes that the load values set here should notbe associated emission levels at all, but rather benchmarkvalues since they are dependent on refinery water use andcalculated on an arbitrary selection of the average water use at63 refineries (which itself is presented only as a benchmarkvalue on page 401 of the BREF). As stated in the * footnote inthe BREF, the actual loads for a refinery can be “easilycalculated with the concentration value and the real effluentrate”, and can then be compared to the benchmark values thatthese should be.
7 Water emissiontable. Totalhydrocarboncontent:
2 MS + Ind One Member State and Industry claim that 3 mg/l as uppervalue is representative of actual operations data of existingrefinery facilities in Europe with 3-step Waste WaterTreatment Plant currently in place. One Member Stateproposed an upper value of 5 based on current observeperformances in existing facilities in their country.
8 Water emissiontable. COD:
1 MS One Member State claims that the upper level in concentrationshould be 75 and the upper value for load should be 45 becausea standard biotreater reduces the COD content by 90-97 %. Asa consequence 75 is easy to achieve in a well designed andoperated biox.
9 Water emissiontable. NH3.
1 MS One Member State claims that the upper level should be 5.Those levels can be reached by strippers and biologicalnitrification/denitrification step.
10 Water emissiontable. Total N.
Ind Industry believes that, where nitrogen is not a pollutant ofconcern in the receiving waters, denitrification cannot be BATas the environmental benefit to the receiving water is very low,while the cost both in Euros (Capital Expenditure) and the CO2emissions are high.
11 Water emissiontable. Total N load:
1 MS One Member State claims that the upper level of the rangeshould be 8. They demonstrated (based on actual data) that afigure below 8 can easily be achieved with a stripper or anitrification/denitrification step.
12 Water emissiontable. TSS:
1 MS One Member State claims that the upper level should be 30.The reason is that the use of sedimentation, flotation, filtrationor a combination of these techniques can reduce of thesuspended solids by 60 – 99.99%.
SPECIFIC BAT13 Base oil
production. Use ofNMP
Ind Industry claims that considering the information within thisdocument, both NMP and furfural are equally viable solventcandidates. In Industry’s opinion, no clear case has been madein the BREF to arrive at one preference.
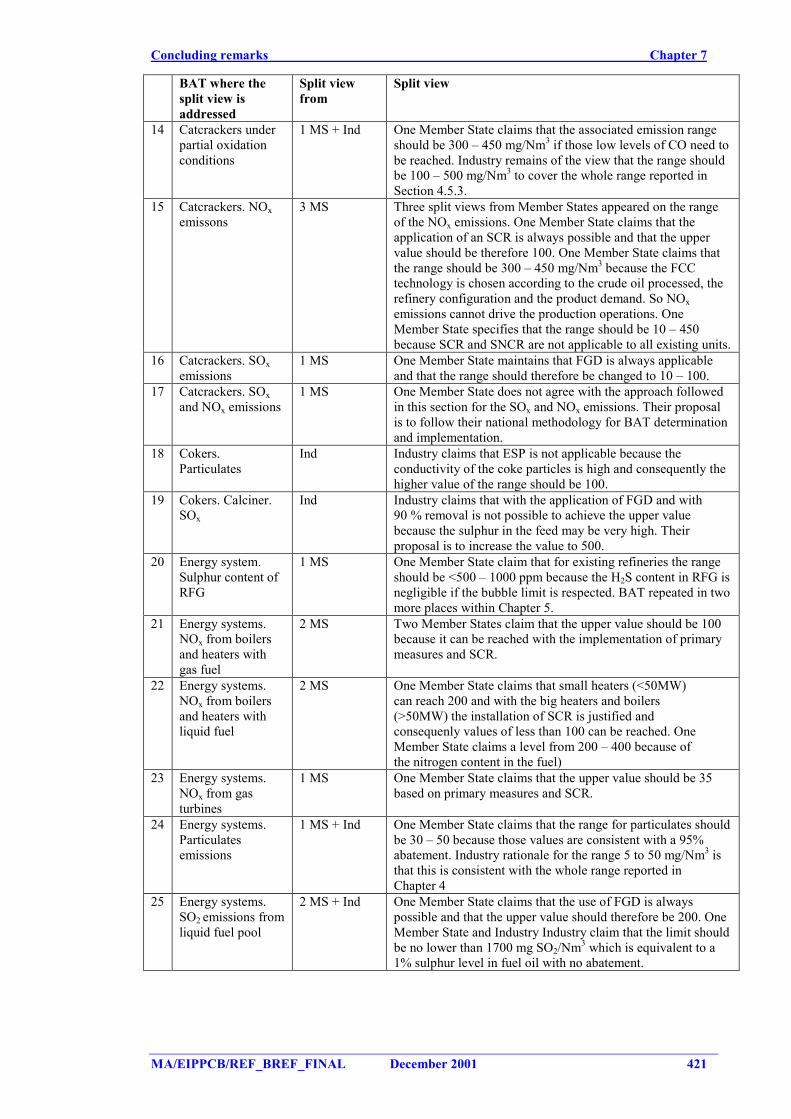
Concluding remarks Chapter 7
MA/EIPPCB/REF_BREF_FINAL December 2001 421
BAT where thesplit view isaddressed
Split viewfrom
Split view
14 Catcrackers underpartial oxidationconditions
1 MS + Ind One Member State claims that the associated emission rangeshould be 300 – 450 mg/Nm3 if those low levels of CO need tobe reached. Industry remains of the view that the range shouldbe 100 – 500 mg/Nm3 to cover the whole range reported inSection 4.5.3.
15 Catcrackers. NOxemissons
3 MS Three split views from Member States appeared on the rangeof the NOx emissions. One Member State claims that theapplication of an SCR is always possible and that the uppervalue should be therefore 100. One Member State claims thatthe range should be 300 – 450 mg/Nm3 because the FCCtechnology is chosen according to the crude oil processed, therefinery configuration and the product demand. So NOxemissions cannot drive the production operations. OneMember State specifies that the range should be 10 – 450because SCR and SNCR are not applicable to all existing units.
16 Catcrackers. SOxemissions
1 MS One Member State maintains that FGD is always applicableand that the range should therefore be changed to 10 – 100.
17 Catcrackers. SOxand NOx emissions
1 MS One Member State does not agree with the approach followedin this section for the SOx and NOx emissions. Their proposalis to follow their national methodology for BAT determinationand implementation.
18 Cokers.Particulates
Ind Industry claims that ESP is not applicable because theconductivity of the coke particles is high and consequently thehigher value of the range should be 100.
19 Cokers. Calciner.SOx
Ind Industry claims that with the application of FGD and with90 % removal is not possible to achieve the upper valuebecause the sulphur in the feed may be very high. Theirproposal is to increase the value to 500.
20 Energy system.Sulphur content ofRFG
1 MS One Member State claim that for existing refineries the rangeshould be <500 – 1000 ppm because the H2S content in RFG isnegligible if the bubble limit is respected. BAT repeated in twomore places within Chapter 5.
21 Energy systems.NOx from boilersand heaters withgas fuel
2 MS Two Member States claim that the upper value should be 100because it can be reached with the implementation of primarymeasures and SCR.
22 Energy systems.NOx from boilersand heaters withliquid fuel
2 MS One Member State claims that small heaters (<50MW)can reach 200 and with the big heaters and boilers(>50MW) the installation of SCR is justified andconsequenly values of less than 100 can be reached. OneMember State claims a level from 200 – 400 because ofthe nitrogen content in the fuel)
23 Energy systems.NOx from gasturbines
1 MS One Member State claims that the upper value should be 35based on primary measures and SCR.
24 Energy systems.Particulatesemissions
1 MS + Ind One Member State claims that the range for particulates shouldbe 30 – 50 because those values are consistent with a 95%abatement. Industry rationale for the range 5 to 50 mg/Nm3 isthat this is consistent with the whole range reported inChapter 4
25 Energy systems.SO2 emissions fromliquid fuel pool
2 MS + Ind One Member State claims that the use of FGD is alwayspossible and that the upper value should therefore be 200. OneMember State and Industry Industry claim that the limit shouldbe no lower than 1700 mg SO2/Nm3 which is equivalent to a1% sulphur level in fuel oil with no abatement.
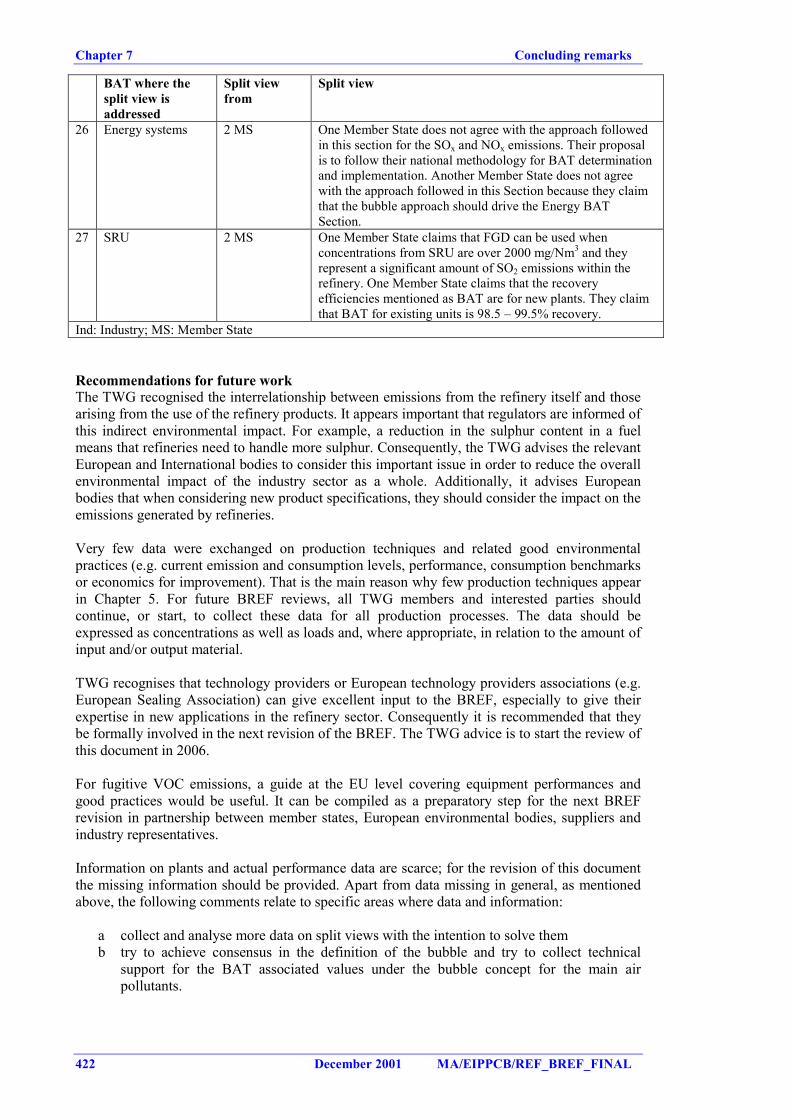
Chapter 7 Concluding remarks
422 December 2001 MA/EIPPCB/REF_BREF_FINAL
BAT where thesplit view isaddressed
Split viewfrom
Split view
26 Energy systems 2 MS One Member State does not agree with the approach followedin this section for the SOx and NOx emissions. Their proposalis to follow their national methodology for BAT determinationand implementation. Another Member State does not agreewith the approach followed in this Section because they claimthat the bubble approach should drive the Energy BATSection.
27 SRU 2 MS One Member State claims that FGD can be used whenconcentrations from SRU are over 2000 mg/Nm3 and theyrepresent a significant amount of SO2 emissions within therefinery. One Member State claims that the recoveryefficiencies mentioned as BAT are for new plants. They claimthat BAT for existing units is 98.5 – 99.5% recovery.
Ind: Industry; MS: Member State
Recommendations for future workThe TWG recognised the interrelationship between emissions from the refinery itself and thosearising from the use of the refinery products. It appears important that regulators are informed ofthis indirect environmental impact. For example, a reduction in the sulphur content in a fuelmeans that refineries need to handle more sulphur. Consequently, the TWG advises the relevantEuropean and International bodies to consider this important issue in order to reduce the overallenvironmental impact of the industry sector as a whole. Additionally, it advises Europeanbodies that when considering new product specifications, they should consider the impact on theemissions generated by refineries.
Very few data were exchanged on production techniques and related good environmentalpractices (e.g. current emission and consumption levels, performance, consumption benchmarksor economics for improvement). That is the main reason why few production techniques appearin Chapter 5. For future BREF reviews, all TWG members and interested parties shouldcontinue, or start, to collect these data for all production processes. The data should beexpressed as concentrations as well as loads and, where appropriate, in relation to the amount ofinput and/or output material.
TWG recognises that technology providers or European technology providers associations (e.g.European Sealing Association) can give excellent input to the BREF, especially to give theirexpertise in new applications in the refinery sector. Consequently it is recommended that theybe formally involved in the next revision of the BREF. The TWG advice is to start the review ofthis document in 2006.
For fugitive VOC emissions, a guide at the EU level covering equipment performances andgood practices would be useful. It can be compiled as a preparatory step for the next BREFrevision in partnership between member states, European environmental bodies, suppliers andindustry representatives.
Information on plants and actual performance data are scarce; for the revision of this documentthe missing information should be provided. Apart from data missing in general, as mentionedabove, the following comments relate to specific areas where data and information:
a collect and analyse more data on split views with the intention to solve themb try to achieve consensus in the definition of the bubble and try to collect technical
support for the BAT associated values under the bubble concept for the main airpollutants.
Concluding remarks Chapter 7
MA/EIPPCB/REF_BREF_FINAL December 2001 423
c energy efficiency has been recognised as one of the most important issues in the BREF.The reason is because refinery processes are very energy intensive. In the next revision,a further analysis of the methods and quantification of energy efficiency needs to bedone. The development and promotion of a transparent methodology for the calculationof energy efficiency should be promoted.
d provide data on decommissioning of processese provide data on mass balance of the metals contained within the crude oil. Mass balance
on sulphur is typically done in refineries, but no information on mass balance of metalshas been reported. Volatile metals such as mercury, contained within the crude oil are anissue that needs to be explored. Where do they go and how can they be abated?.
f data on characteristics of particulates such as unburnt hydrocarbons, metals (e.g. Ni, V)and PM10 need to be qualified
g very little information has been provided about noise levels or techniques to reducethem
h no information has been provided on odour abatement. It is recognised that odourabatement is linked to VOC abatement (typically sulphur compounds), but there is noidentification of compounds and where they may come from. In other words, analysis ofthe VOC needs to be done.
i collect data on dioxin emissions and on the effect of catalyst regeneration processes andsome clean-up facilities
j an important issue when considering refinery waste is that there are still many differingdefinitions between countries, which makes comparisons of waste difficult. Make acatalogue of types of wastes produced by refineries to make comparison easier and moreaccurate.
k collect information on NOx and SOx emissions from the flaring systeml collect information on NOx emissions from coking processesm very few information have been exchanged on natural gas plants. This can partially be
justified because the number of those plants are much smaller than Mineral OilRefineries. However, some concrete data on how those plants can be improvedenvironmentally need to be exchanged.
Suggested topics for future R&D projectsThe following topics might be considered for future Research and Development projects:
It has been recognised that the cross-media issues that may be generated by some processtechniques are very difficult to assess. For example, alkylation productions raises the difficultquestion of which is the better process: HF alkylation (more energy efficient but very toxiccatalyst) or sulphuric alkylation (less energy efficient and the waste generated needs to recycled,but less toxic). It may be worthwhile to develop some methodology to compare two or moretechnologies.
A study to compare energy efficiency in the refinery sector world wide. This needs to considerthe different types of refineries. During this study, a transparent methodology needs to bedefined. The study should also include an analysis of the techniques already used within therefinery sector to improve their energy efficiency and how they affect the efficiency, cost andenvironmental benefit.
No much information about the physical and chemical characteristics of dust (e.g. content ofunburnt hydrocarbons, content of metals and content of PM10) has been found during the work.Because those analyses are difficult to do, they can be supported by an R&D project tostandardise them.
A study of the fugitive emissions from refineries. This should include the collection of fugitiveVOC emission data from the refinery sector. This may be based on the information gathered bythe Commission under Article 15 (European Pollutant Emission Register, EPER). This shouldalso include an analysis of the monitoring methods and an analysis of techniques to reduce thoseVOC emissions in order to quantify emission reduction capabilities and cost. This programme
Chapter 7 Concluding remarks
424 December 2001 MA/EIPPCB/REF_BREF_FINAL
can also focus on the different types of equipments that could be used, their performances andtheir cost, or on the need to develop new equipment presenting a better trade-off betweenperformance and cost or allowing fugitive VOC emissions to be identified and characterised at alower cost than the actual LDAR programmes.
Refineries handle harmful products like aromatics (benzine, etc…). Some studies should bepromoted to better evaluate the emissions of these products, their impact on the environmentand the different ways to solve these problems. This is to some extent connected to fugitiveVOC emissions, except that here there is a need to characterise these emissions.
There is a need expressed by the permitters to get more precise technical information in thisarea. A lot of recommendations are made concerning the seals of different equipment. It couldbe particularly useful to study more precisely their efficiency and their implementationconditions and to set up good practices and methodologies concerning the type of seals torecommend, the way to check their efficiency, their utilisation conditions and the relevantreplacement interval.
The flameless oxidation mode has begun to be used more widely in sectors such as iron andsteel and ceramics. Studies and experiments should be promoted to encourage similar work inthe refinery sector. This technique seems to offer higher energy efficiency and low NOxemissions.
It has been very difficult to express environmental performances for this sector in mass flow orspecific mass flow that are highly representative of the environmental impact. This is becausethe energy consumption of a refinery increases with its complexity and the degree of conversionof the products. In parallel, the rate of sulphur recovered increases with the complexity and theenergy consumption. A methodology to facilitate a benchmarking in specific mass flow,considering for example several kinds of refineries, would be useful.
References Chapter 8
MA/EIPPCB/REF_BREF_FINAL December 2001 425
8 LIST OF REFERENCES
12. Steinberg, M. and Y. Tung, (1992). "Residual Oil refining by hydrocarb process"Brookhaven National Laboratory, Upton, NY 11973, USA (516)282-3036 (1 author);Hydrocarb Corporation, New York, NY, USA (2 author), 8 pgs.
18. Irish EPA, (1992). "BATNEEC Guidance Note. Class 9.2. Crude Petroleum Handlingand storage. Draft 3" Irish Environmental Protection Agency, 16 pgs.
19. Irish EPA, (1993). "BATNEEC Guidance Note. Class 9.3. Refining petroleum or gas.Draft 3" Irish Environmental Protection Agency, 29 pgs.
34. Italy, (1999). "The italian refining industry" Ministero dell'Ambiente, Servizioinquinamento atmosferico e acustico e le industrie a rischio., 38 pgs.
43. Dekkers, C. and R. Daane, (1999). “Metal contents in crudes much lower thanexpected" Oil & Gas Journal, (March 1, 1999) pp. 44-51.
45. Sema and Sofres, (1991). "Technical note on the best available technologies to reduceemissions of pollutants into the air from the refining industry. Application of articles 7& 13 of the Directive 84/360 EEC" Report made for European Commission, 135 pgs.
49. CONCAWE, (1998). "Sulphur dioxide emissions from oil refineries and combustion ofoil products in western Europe and Hungary (1995)" Concawe, 30 pgs.
60. Balik, J. A. and S. M. Koraido, (1991). “Identifying pollution prevention options for apetroleum refinery" Pollution prevention review, (summer 1991) pp. 273-293.
61. Decroocq, D., (1997). “Major scientific and technical challenges about development ofnew processes in refining and petrochemistry" Revue de l'institut francais du petrole, 52(5) pp. 469-489.
73. Radler, M., (1998). “1998 & 2000 worldwide refining survey" Oil & Gas Journal,Special (Dec. 21, 1998) pp. 49-92.
79. API, (1993). "Environmental design considerations for petroleum refining crudeprocessing units" American Petroleum Institute and Health and Environment AffairsDepartment, 133 pgs.
80. March Consulting Group, (1991). "Pollution Control for Petroleum Processes" MarchConsulting Group commissioned research for the Department of Environment (HMIP),93 pgs.
82. CONCAWE, (1995). "Oil refinery waste disposal methods, quantities and costs. 1993survey", 32 pgs.
83. CONCAWE, (1990). "A field guide on reduction and disposal of waste from oilrefineries and marketing installations" Concawe, 34 pgs.
101. World Bank, (1998). "Pollution prevention & abatement handbook. Petroleumrefining", 469-472 pgs.
107. Janson, B., (1999). "Swedish BAT notes on refineries" Swedish environmentalprotection agency, 18 pgs.
Chapter 8 References
426 December 2001 MA/EIPPCB/REF_BREF_FINAL
108. USAEPA, (1995). "Profile of the Petroleum Refining Industry (EPA Office ofcompliance Sector Notebook Project)" USA Environmental Protection Agency, 150pgs.
110. HMIP UK (1993). "Guidance on effective flaring in the gas, petroleum, petrochemicaland associated industries (Technical guidance note (abatement) A1)" HM Inspectorateof pollution in UK, London.
112. Foster Wheeler Energy, (1999). "A strategic review of the petroleum refinery industrysector" Foster Wheeler Energy Ltd. work for Environment Agency of UK, 141 pgs.
113. Noyes, R., (1993). "Petroleum refining" Pollution Prevention Technology Handbook,Mill Road, Park Ridge, New Jersey, Noyes Publications.
114. Ademe (1999). "Desulphurisation techniques of industrial processes (Les techniques dedésulfuration des procédés industriels)", Paris.
115. CONCAWE, (1999). "Best available techniques to reduce emissions from refineries"Concawe, 200 pgs.
117. VDI, (2000). "Emission control from mineral oil refineries" VDI / UBA, 80 pgs.
118. VROM, (1999). "Dutch notes on BAT for the mineral oil refineries" Ministry ofHousing, Spatial Planning and the Environment (VROM)- Directorate for Air andEnergy-Raytheon Engineers & Constructors, 50 pgs.
119. Bloemkolk, J. W. and R. J. van der Schaaf, (1996). “Design alternatives for the use ofcooling water in the process industry: minimization of the environmental impact fromcooling systems" Journal for Cleaner Production, 4 (1) pp. 21-27.
122. REPSOL (2001). "Technical information of several REPSOL refineries".
127. UN/ECE, (1998). "VOC task force on emission reduction for the oil and gas refiningindustry" DFIU-IFARE, 80 pgs.
136. MRI, (1997). "Emission factors" Midwest research institute, 130 pgs.
144. HMIP UK, (1997). "Natural Gas Processing" UK environmental protection agency, 17pgs.
147. HMIP UK, (1995). "Petroleum Processes: Oil Refining and Associated Processes"HMSO, 86 pgs.
166. Meyers, R. A. (1997). "Handbook of petroleum refining processes" McGraw-Hill, USA.
175. Constructors, R. E., (1998). "Validation of inventaries of NOx measures in the refinerysector (Validatie van de inventarisatie van NOx maatregelen in de raffinage sector)"Raytheon Engineers & Constructors for Ministry of VROM, Netherlands, 200 pgs.
181. HP, (1998). “Environmental processes '98" Hydrocarbon processing, (August 1998) pp.71-118.
195. The world refining association, (1999). "Efficient operations of refineries inwestern¢ral europe." Improving environmental procedures & energy production,Vienna, Austria, Honeywell.
References Chapter 8
MA/EIPPCB/REF_BREF_FINAL December 2001 427
197. Hellenic Petroleum, (1999). "Contribution of Hellenic Petroleum to the refinery BREF"Hellenic Petroleum, 25 pgs.
198. (Hellas), M. O., (1999). "Contribution of Motor Oil (Hellas) to the BREF" Motor Oil(Hellas), pgs.
199. Petrola Hellas, (1999). "Contribution of Petrola Hellas to the BREF" Petrola Hellas,pgs.
208. USAEPA, (1996). "Average Emission Factor Approach" Environmental ProtectionAgency of USA, 20 pgs.
211. Ecker, A., (1999). "State of the art of refineries focused on the IPPC directive"Umweltbundesamt, Austrian Environmental Agency, 160 pgs.
212. Hydrocarbon processing, (1998). “Refining Processes '98" Hydrocarbon processing,1998 (November) pp. 53-120.
215. Jansson, B., (1999). "Preem and Scanraff refineries in Sweden. Technical information"Swedish environmental protection agency, 200 pgs.
222. Shell Pernis, (1999). "Environmental report 1998, Technical Information of therefinery" Shell, 10 pgs.
229. Smithers, B., (1995). "VOC emissions from external floating roof tanks: Comparison ofremote measurements by laser with calculation methods" CONCAWE, 50 pgs.
242. CONCAWE, (1998). "European downstream Oil Industry Safety Performance 1997",30 pgs.
244. USAEPA, (1992). "Workbook for estimating fugitive emissions from petroleumproduction operations", 150 pgs.
245. API, (1983/1989/1990). "Evaporative loss from external and internal floating roof-tanks" American Petroleum Institute, 150 pgs.
246. BP-AMOCO (2001). "Energy review inhttp://www.bp.com/centres/energy/world_stat_rev/oil/reserves.asp".
247. UBA Austria, (1998). "State of the art in the refining industry with regard to the IPPC-directive (Jahrbuch der Europäischen Erdölindustrie)" Federal Environmental Agencyof Austria, 200 pgs.
248. Ademe, (2001). "International conference on Industrial Atmospheric pollution. NOxconference" International conference on Industrial Atmospheric pollution. NOx andN2O emission control: panel of available techniques, Paris.
249. BMUJF, (1999). "Emissionsbegrenzung und Anwendungsbereich von stat. Motoren",100 pgs.
250. Winter, B., (2000). "Comments from Austrian TWG member to the first draft".
251. Krause, B., (2000). "Comments from German TWG member to first draft".
252. CONCAWE, (2000). "Comments from Concawe to first draft".
253. MWV, (2000). "Comments from German refinery association to first draft".
Chapter 8 References
428 December 2001 MA/EIPPCB/REF_BREF_FINAL
254. UKPIA, (2000). "Comment from UK refinery association to first draft".
256. Lameranta, J., (2000). "Comments from Finish TWG member to first draft".
257. Gilbert, D., (2000). "Comments from French TWG member to first draft".
258. Manduzio, L., (2000). "Comments from Italian TWG member to first draft".
259. Dekkers, C., (2000). "Comments from Dutch TWG member to first draft".
260. Sandgrind, S., (2000). "Comments from Norwegian TWG member to first draft".
261. Canales, C., (2000). "Comments from Spain TWG member to the first draft".
262. Jansson, B., (2000). "Comments from Swedish TWG to first draft".
264. EIPPCB (2001). "BREF on Storage", Sevilla.
268. TWG, (2001). "Comments from TWG to second draft of Refineries BREF".
269. Confuorto, N., (2000). "Controlling FCCU flue gas emissions with scrubbers" Belco, 23pgs.
271. Martinez del Pozo, J. L., (2000). "Comments to delayed coking chapter of first draft".
272. Shawcross, P., (2000). "Information on coking, calcining and etherification processes"Conoco, 2 pgs.
276. Alstom Power, (2000). "SCONOx emissions control technology", 30 pgs.
278. Alstom Power, (2000). "Flakt-Hydro Process" ABB Alstom Power, 20 pgs.
281. Steinberg, M., (2000). “A new process for ammonia production with reduced CO2emission or coproduct carbon production" , Draft pp. 12.
282. Conoco, (2000). "Material from the Conoco Humber refinery in the UK" Conoco, 50pgs.
285. Demuynck, M., (1999). "ISO 14001 as instrument of deregulation, beginner ofsustainable development and base for EMAS" SECO, FEB, SSTC, 19 pgs.
287. Johnston, D., (1996). “Complexity index indicates refinery capability value" Oil & GasJournal, (March 18, 1996) pp. 74.
290. Statoil, (2000). "Information from Statoil Karsto natural gas plant" Statoil-Norway, 11pgs.
292. HMIP UK, (2000). “UK refineries "lag behind"on pollution abatement" ENDS Report,302 pp. 11-12.
293. France, (2000). "Material collected during the visit to France in April 2000", 500 pgs.
296. IFP, (2000). "Reports from the IFP" Institute Francais du Petrole, 150 pgs.
297. Italy, (2000). "Italian contribution to chapter 4", 62 pgs.
References Chapter 8
MA/EIPPCB/REF_BREF_FINAL December 2001 429
302. UBA Germany, (2000). "German Notes on BAT in the Refinery Industry. The GermanRefinery Industry" German Environmental Agency, 100 pgs.
308. Bakker, V. and J. W. Bloemkolk, (1994). "Parcom recommendations of 22 June 1989concerning refineries" PARCOM, 2 pgs.
309. Kerkhof, F. P., (2000). "Superclaus" Jacobs Engineering, 10 pgs.
310. Swain, E. J., (2000). “Processed-crude quality in US continues downward trend" Oil &Gas Journal, March 13, 2000 pp. 44-47.
312. EIPPCB (2001). "BREF on common waste water and waste gas treatment/managementsystems in the chemical sector", Sevilla.
315. USAEPA, (2000). "Exposure and human health reassesment of 2,3,7,8-TCDD andrelated compounds" USA Environmental Protection Agency, pgs.
316. TWG, (2000). "Comments from TWG members to the second draft of chapter 4 andchapter 5.1", pgs.
317. EIPPCB (2002). "BREF on large combustion plants", Sevilla.
318. Phylipsen, G. J. M., K. Blok, et al., (1998). "Handbook on international comparisons ofenergy efficiency in the manufacturing industry" Dept. of Science, Technology andSociety, Utrecht university, pgs.
319. Sequeira, A. (1998). "Lubricant base oil and wax processing" Marcel De KKer, NewYork.
320. Italy, (1996). “Italian IGCC project sets pace for new refining area" Oil & gas journal,Dec. 9 1996 .
321. Helm, L., C. Spencer, et al., (1998). Hydrocarbon Processing, 1998 pp. 91-100.
322. HMIP UK, (1995). "Chief Inspectors Guidance Note - Processes Subject to IntegratedPollution Control - Combustion Processes: Large Boilers and Furnaces 50 MWth andover" HM Inspectorate of pollution, 120 pgs.
323. API, (1997). "Manual of Petroleum Measurement Standards, Chapter 19 - EvaporativeLoss Measurement, Section 2 - Evaporative Loss from Floating-Roof Tanks," AmericanPetroleum Institute, 500 pgs.
324. Sicelub, (2001). "Lubrification systems for pumps, air coolers and compressors"Sicelub, 400 pgs.
325. Gary and Handwerk "Petroleum Refining - Technology & Economics", .
326. Nelson, W. L. "Petroleum Refinery Engineering", .
327. Broughson, J. "Process Utility Systems", .
330. Hommeltoft, S. I., (2000). "Information about solid catalyst alkylation" Haldor TopsoeA/S, 100 pgs.
337. Journal, O. G., (2000). “Special report on refining catalyst demand" Oil & Gas Journal,2000 .
Chapter 8 References
430 December 2001 MA/EIPPCB/REF_BREF_FINAL
344. Crowther, A., (2001). "Low temperature NOx oxidation" BOC gases, 7 pgs.
345. Molero de Blas, L. J. (2000). "Pollutant formation and interaction in the combustion ofheavy liquid fuels" Department of Chemical Engineering University Collage London,London.
346. France, (2001). "Information on sulphur balance in refineries, de-NOx costeffectiveness and TGTU processes" Ademe and Environmental Ministry of France, 25pgs.
347. Services, M. H. F. (2001). "Multiple Hearth Sludge Furnace Combustion".
348. Ashworth Leininger Group, (2001). "Petroleum Refining Sector. NOx controls report .Technical advice on emission control technology applie in the California" Ministry ofEnvironment. Air&Energy Directorate, 20 pgs.
349. Finnish Environmental Institute, (2001). "Risk Assessment of MTBE" FinnishEnvironmental Institute,, 200 pgs.
350. European Sealing Association, (2001). "Comments to the Second Draft" EuropeanSealing Association, 5 pgs.
Glossary Chapter 9
MA/EIPPCB/REF_BREF_FINAL December 2001 431
9 GLOSSARY
Symbols~ Around, more or less∆T Increase of temperature, temperature rise€ EUR (EU currency)
AAC Alternating CurrentAC Activated CarbonAmylenes PentenesAOC Accidentaly Oil ContaminatedºAPI Density unit (specific density = 141.5/(ºAPI+131.5))API American Petroleum InstituteAPI separator Oil/water/sludge separator (developed by American Petroleum Institute)ASU Activated Sludge Unitatm Atmosphere. Pressure unit that equals to 101.3 kPaAuto-Oil I,II Co-operative programmes between the EU and the oil and motor industries
to find the most cost-effective way to improve air quality in Europe. Thesehave led to Directives on fuel properties and vehicle emissions.
Bbbl US barrel (159 litres)bar Pressure unit that equals to 100 kPa (1 bar = 0.987 atmospheres)barg Bar gauge (relative pressure over the atmospheric pressure)BBU Bitumen Blowing UnitBFO Bunker Fuel OilBFW Boiler Feed Water to produce steamBOD Biological Oxygen Demandbpcd Barrels per calendar day (average flow rates based on operating 365 day per
year)bpsd Barrels per stream day (flow rates based on actual on-stream time of a unit)BREF Best Available Techniques reference document (Documents developed by
the EIPPCB on different IPPC sectors)BTEX Benzene, Toluene, Ethylbenzene, XyleneBTX Benzene, Toluene, Xylene
Ccat catalyticcatcracker catalytic cracker (typically refers to fluid catalytic cracker)CCGT Combined Cycle Gas TurbineCCR Conradson Carbon Residue (See under Concarbon more information)CDD/CDF Chlorodibenzoparadioxins/furansCDU Atmospheric Crude Distillation UnitCEC Comission of the European CommunityCHP Combined Heat and PowerCOC Continuously Oil ContaminatedCOD Chemical Oxygen DemandConcarbon Conradson carbon = measurement of carbon residue (expressed in % w/w).
Measurement of the tendency of a hydrocarbon to form coke.CONCAWE European Refinery Association for Environment, Health and SafetyCorinair European Air Emissions inventoryCPI Corrugated Plated InterceptorCx Hydrocarbons with x number of carbonsCW Cooling WaterCurrencies http://fxtop.com/en/adv.htm
Glossary Chapter 9
432 December 2001 MA/EIPPCB/REF_BREF_FINAL
Dd dayDAF Dissolved Air FlotationdB(A) Noise unitDC Direct CurrentDCU Delayed Coker UnitDEA Diethanol AmineDG Direction General from the European CommissionDGA DiglycolamineDIAL Differential absorption light detection and rangingDIPA Di-isopropanol amineDNB Nitrification/denitrification biotreaterDS Dissolved Solids
EEC European CommunityEFRT External Floating Roof TanksEIA Environmental Impact AssessmenteEII Energy intensity index (Solomon index. See Section 3.10.1)EIPPCB European IPPC BureauEMS Environmental Management System (see Section 4.15.1)EOP End-of-pipeEP European ParliamentETBE Ethyl tert-butyl etherEU+ EU countries plus Norway and SwitzerlandEUR Euro: EU currency
FFBI Fluidised Bed IncineratorFC Flue ControlFCC Fluidized-bed Catalytic CrackingFCCU Fluidised-bed Catalytic Cracking UnitFFU Flocculation/flotation unitFGD Flue Gas DesulphurisationFGR Flue Gas RecirculationFOE Fuel oil equivalent (1 tonne FOE = 4.25·1010 J)
GGAC Granular activated carbonGO Gasoil
Hh hourHC (1) HydrocarbonHC (2) Hydrocracker/ingHCU Hydrocracker UnitHDM HydrodemetallisationHDS HydrodesulphurisationHFO Heavy Fuel OilHGO Heavy GasoilHorizontal BREF BAT reference documents prepared to deal with topics common to more
than one IPPC industrial sector (namely storage, cooling, waste water andwaste gas and monitoring)
HORC Heavy Oil and Residue Catalytic crackingHP High PressureHSE Health, Safey and EnvironmentHT High Temperature
Glossary Chapter 9
MA/EIPPCB/REF_BREF_FINAL December 2001 433
HVU High Vacuum UnitHydrofiner Selective hydrocracking
II-TEQDF International toxic equivalent of dioxins/furansIAF Induced Air FlotationIFRT Internal Floating Roof TankIGCC Integrated Gasification Combined CycleIMO International Maritime Organisation
Kk-- kilokero keroseneKjN Kjendahl nitrogen (Measure of the total nitrogen content)kt kilotonne (106 kg)
LLCO Light Coking OilLCP Large Combustion Plant BREFLDAR Leakage Detection and Repair Programme (see Section 4.23.6.1)LGO Light GasoilLP Low PressureLPG Liquefied Petroleum GasLT Low TemperatureLVGO Light Vacuum GasoilLVOC Large Volume Organic Chemicals BREF
MM--- MillionMAH Mono Aromatic HydrocarbonMDEA Mono diethatnolamineMEA Mono ethanolamineMP Medium PressureMS EU Member StateMTBE Methyl Tert-buthyl EtherMt/yr Million of tonnes per yearMWe MegaWatts electric (energy)MWth MegaWatts thermal (energy)
Nn- normal, linear organic compoundN--- Normal (refers to volume of gases under normal conditions (temperature
0 ºC and pressure of 1 atmosphere (101.3 kPa))n/a not applicablen.a. not available (typically for data not available within the document).
Highlighted within the document to help next revisions.N-Kj Nitrogen analysed by Kjendal method.Naphthenic The naphthenes contain one or more saturated rings of 5 or 6 carbon atoms
in their molecules to which paraffinic-type branches are attached.NOC Non-oil contaminatedNOx Nitrogen Oxides (NO + NO2, normally expressed as NO2)
PPa Pascal (N/m2). SI unit for pressure: 1 atm=101.3 kPaPAC Powdered activated carbonPAH Polyaromatic HydrocarbonsPC Pressure Control
Glossary Chapter 9
434 December 2001 MA/EIPPCB/REF_BREF_FINAL
PCDD/F Polychlorodibenzoparadioxins/furansPlatformer Type of catalytic reformerPM Particulate Matter (any finely divided solid or liquid material emitted into
the air)PM10 Particulate matter of size less than 10 µmPoly-unit Polymerisation unitPPI Parallel Plate Interceptorppm parts per million (weight)ppm v/v parts per million in volumePPS Pressurised cross flow plate separation of the desalting unitPSA Pressure-swing adsorption used for purification of hydrogenpsi pounds per inche (British pressure unit 1 bar = 14.5 psi)psia pounds per inche (absolute pressure)
RRCC Residue Catalytic CrackerResidue This term is used in this document as the heaviest fractions of the distillation
and conversion units. Those fractions are used as feedstock in otherprocesses or as liquid refinery fuel.
RFG Refinery Fuel GasRO Reversed OsmosisRON Research Octane NumberRSH MercaptanRVP Reid Vapour Pressure
SS SulphurSF Sand FilterSOx Sulphur oxides (SO2 and SO3)SRU Sulphur Recovery UnitSS Suspended SolidsSW Sour WaterSWS Sour Water Stripper
Tt Tonne (1000 kg)t/yr Tonnes per annum (year)t/d Tonnes per dayTAME Tertiary Amyl Methyl EtherTCDD/F Tetrachlorodibenzoparadioxins/furans (toxicity reference for dioxins)TEL Tethra ethyl leadTGT Tail Gas Treatment of the sulphur recovery unitTML Tethra methyl leadTOC Total Organic CarbonTSS Total Suspended Solids (water)TWG European Technical Working Group on refineries
UU Unit (used together with names of process)UF UltrafiltrationUltraformer Type of reformerUSAEPA Environmental Protection Agency of the USA
Vv/v volume per volumeV.I. Viscosity Index (see Section 2.3)VBU Visbreaking Unit
Glossary Chapter 9
MA/EIPPCB/REF_BREF_FINAL December 2001 435
VOC Volatile Organic CompoundVR Vacuum ResidueVSBGO Visbreaking Gasoil
Ww/w weight per weight. Ratio expressed in weightWHB Waste Heat BoilerWWTP Waste Water Treatment Plant
Yyr year

Annexes Chapter 10
MA/EIPPCB/REF_BREF_FINAL December 2001 437
10 ANNEXES
Six annexes have been prepared to complement the information provided in the document. Theinformation provided is the following:Annex I Environmental legislation and emission limit values applied to refineries.Annex II Refinery configurations.Annex III Refinery feedstock, intermediates and products.Annex IV Submitted examples of cost-effectiveness and implementation of environmental
technologies.Annex V Background information from TWG members for the different proposals of SO2
and NOx emission under the bubble concept.Annex VI Proposals from some Member States on the implementation of BAT in the
refinery sector
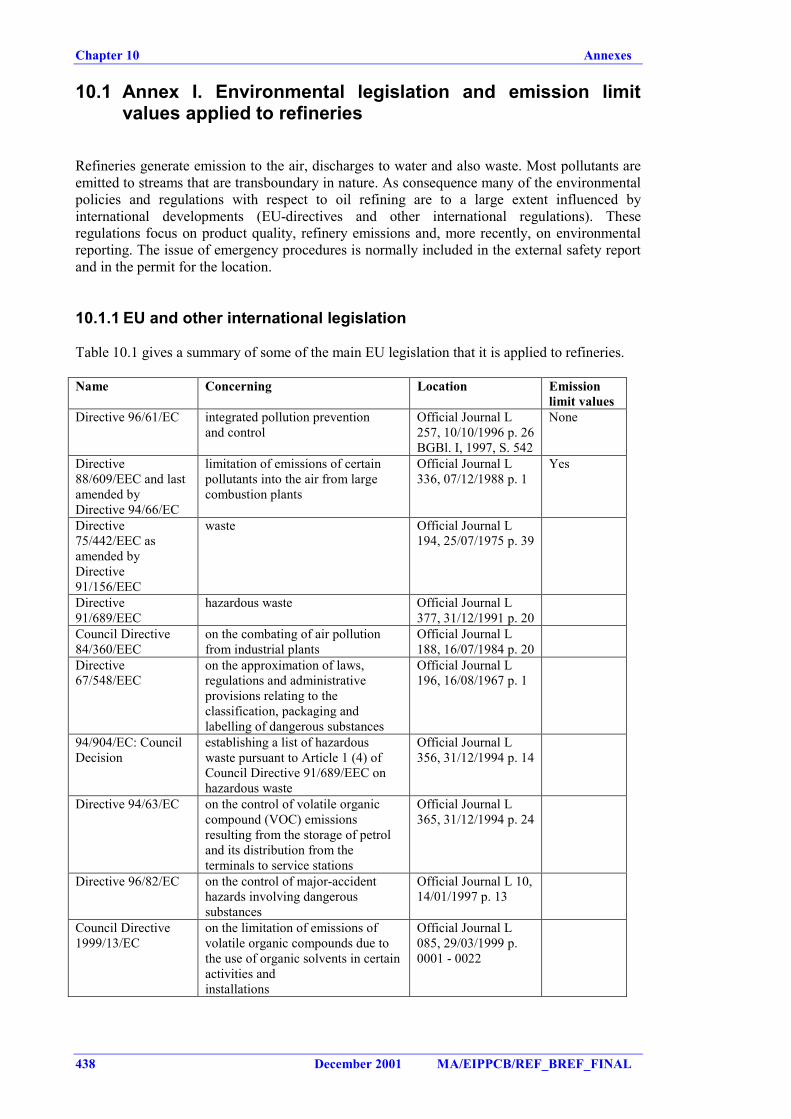
Chapter 10 Annexes
438 December 2001 MA/EIPPCB/REF_BREF_FINAL
10.1 Annex I. Environmental legislation and emission limitvalues applied to refineries
Refineries generate emission to the air, discharges to water and also waste. Most pollutants areemitted to streams that are transboundary in nature. As consequence many of the environmentalpolicies and regulations with respect to oil refining are to a large extent influenced byinternational developments (EU-directives and other international regulations). Theseregulations focus on product quality, refinery emissions and, more recently, on environmentalreporting. The issue of emergency procedures is normally included in the external safety reportand in the permit for the location.
10.1.1 EU and other international legislation
Table 10.1 gives a summary of some of the main EU legislation that it is applied to refineries.
Name Concerning Location Emissionlimit values
Directive 96/61/EC integrated pollution preventionand control
Official Journal L257, 10/10/1996 p. 26BGBl. I, 1997, S. 542
None
Directive88/609/EEC and lastamended byDirective 94/66/EC
limitation of emissions of certainpollutants into the air from largecombustion plants
Official Journal L336, 07/12/1988 p. 1
Yes
Directive75/442/EEC asamended byDirective91/156/EEC
waste Official Journal L194, 25/07/1975 p. 39
Directive91/689/EEC
hazardous waste Official Journal L377, 31/12/1991 p. 20
Council Directive84/360/EEC
on the combating of air pollutionfrom industrial plants
Official Journal L188, 16/07/1984 p. 20
Directive67/548/EEC
on the approximation of laws,regulations and administrativeprovisions relating to theclassification, packaging andlabelling of dangerous substances
Official Journal L196, 16/08/1967 p. 1
94/904/EC: CouncilDecision
establishing a list of hazardouswaste pursuant to Article 1 (4) ofCouncil Directive 91/689/EEC onhazardous waste
Official Journal L356, 31/12/1994 p. 14
Directive 94/63/EC on the control of volatile organiccompound (VOC) emissionsresulting from the storage of petroland its distribution from theterminals to service stations
Official Journal L365, 31/12/1994 p. 24
Directive 96/82/EC on the control of major-accidenthazards involving dangeroussubstances
Official Journal L 10,14/01/1997 p. 13
Council Directive1999/13/EC
on the limitation of emissions ofvolatile organic compounds due tothe use of organic solvents in certainactivities andinstallations
Official Journal L085, 29/03/1999 p.0001 - 0022
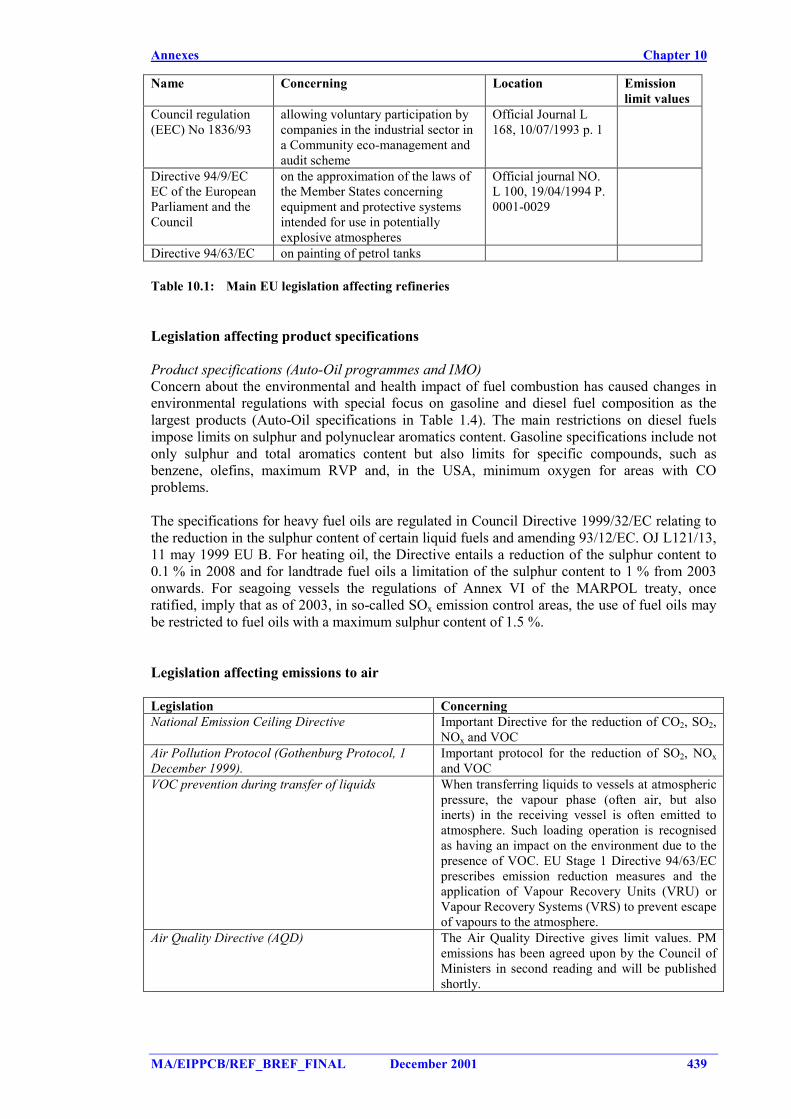
Annexes Chapter 10
MA/EIPPCB/REF_BREF_FINAL December 2001 439
Name Concerning Location Emissionlimit values
Council regulation(EEC) No 1836/93
allowing voluntary participation bycompanies in the industrial sector ina Community eco-management andaudit scheme
Official Journal L168, 10/07/1993 p. 1
Directive 94/9/ECEC of the EuropeanParliament and theCouncil
on the approximation of the laws ofthe Member States concerningequipment and protective systemsintended for use in potentiallyexplosive atmospheres
Official journal NO.L 100, 19/04/1994 P.0001-0029
Directive 94/63/EC on painting of petrol tanks
Table 10.1: Main EU legislation affecting refineries
Legislation affecting product specifications
Product specifications (Auto-Oil programmes and IMO)Concern about the environmental and health impact of fuel combustion has caused changes inenvironmental regulations with special focus on gasoline and diesel fuel composition as thelargest products (Auto-Oil specifications in Table 1.4). The main restrictions on diesel fuelsimpose limits on sulphur and polynuclear aromatics content. Gasoline specifications include notonly sulphur and total aromatics content but also limits for specific compounds, such asbenzene, olefins, maximum RVP and, in the USA, minimum oxygen for areas with COproblems.
The specifications for heavy fuel oils are regulated in Council Directive 1999/32/EC relating tothe reduction in the sulphur content of certain liquid fuels and amending 93/12/EC. OJ L121/13,11 may 1999 EU B. For heating oil, the Directive entails a reduction of the sulphur content to0.1 % in 2008 and for landtrade fuel oils a limitation of the sulphur content to 1 % from 2003onwards. For seagoing vessels the regulations of Annex VI of the MARPOL treaty, onceratified, imply that as of 2003, in so-called SOx emission control areas, the use of fuel oils maybe restricted to fuel oils with a maximum sulphur content of 1.5 %.
Legislation affecting emissions to air
Legislation ConcerningNational Emission Ceiling Directive Important Directive for the reduction of CO2, SO2,
NOx and VOCAir Pollution Protocol (Gothenburg Protocol, 1December 1999).
Important protocol for the reduction of SO2, NOxand VOC
VOC prevention during transfer of liquids When transferring liquids to vessels at atmosphericpressure, the vapour phase (often air, but alsoinerts) in the receiving vessel is often emitted toatmosphere. Such loading operation is recognisedas having an impact on the environment due to thepresence of VOC. EU Stage 1 Directive 94/63/ECprescribes emission reduction measures and theapplication of Vapour Recovery Units (VRU) orVapour Recovery Systems (VRS) to prevent escapeof vapours to the atmosphere.
Air Quality Directive (AQD) The Air Quality Directive gives limit values. PMemissions has been agreed upon by the Council ofMinisters in second reading and will be publishedshortly.
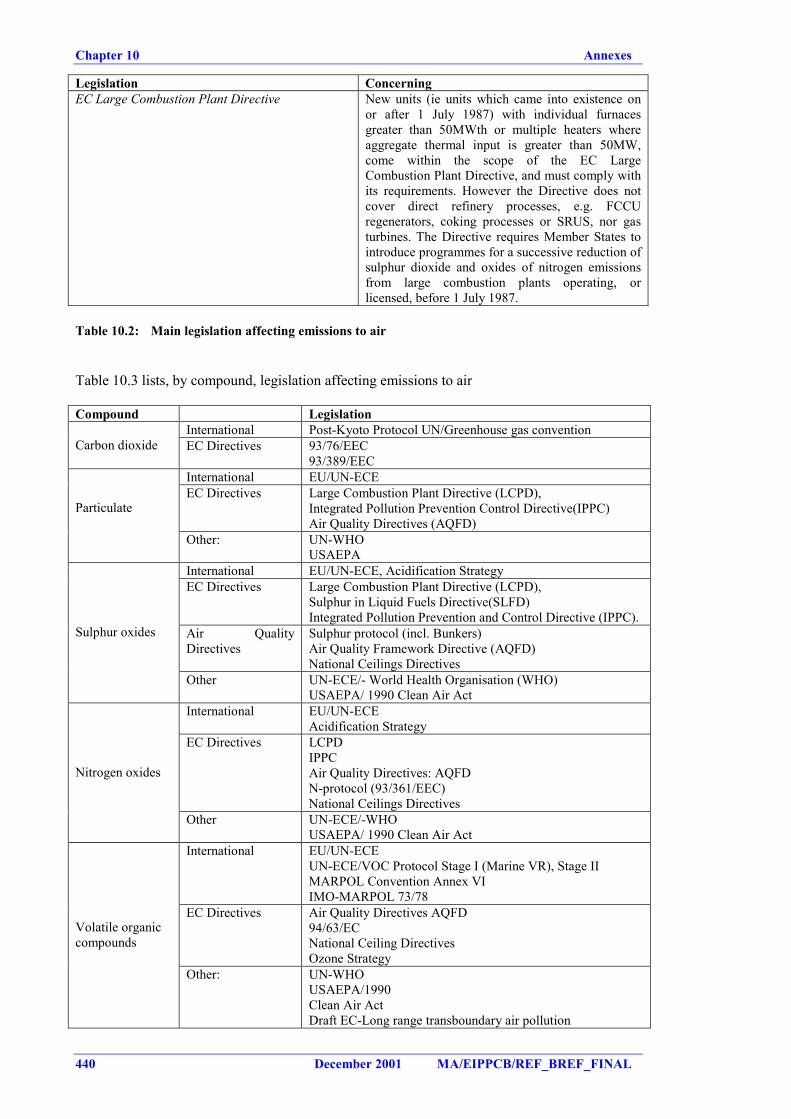
Chapter 10 Annexes
440 December 2001 MA/EIPPCB/REF_BREF_FINAL
Legislation ConcerningEC Large Combustion Plant Directive New units (ie units which came into existence on
or after 1 July 1987) with individual furnacesgreater than 50MWth or multiple heaters whereaggregate thermal input is greater than 50MW,come within the scope of the EC LargeCombustion Plant Directive, and must comply withits requirements. However the Directive does notcover direct refinery processes, e.g. FCCUregenerators, coking processes or SRUS, nor gasturbines. The Directive requires Member States tointroduce programmes for a successive reduction ofsulphur dioxide and oxides of nitrogen emissionsfrom large combustion plants operating, orlicensed, before 1 July 1987.
Table 10.2: Main legislation affecting emissions to air
Table 10.3 lists, by compound, legislation affecting emissions to air
Compound LegislationInternational Post-Kyoto Protocol UN/Greenhouse gas convention
Carbon dioxide EC Directives 93/76/EEC93/389/EEC
International EU/UN-ECEEC Directives Large Combustion Plant Directive (LCPD),
Integrated Pollution Prevention Control Directive(IPPC)Air Quality Directives (AQFD)
Particulate
Other: UN-WHOUSAEPA
International EU/UN-ECE, Acidification StrategyEC Directives Large Combustion Plant Directive (LCPD),
Sulphur in Liquid Fuels Directive(SLFD)Integrated Pollution Prevention and Control Directive (IPPC).
Air QualityDirectives
Sulphur protocol (incl. Bunkers)Air Quality Framework Directive (AQFD)National Ceilings Directives
Sulphur oxides
Other UN-ECE/- World Health Organisation (WHO)USAEPA/ 1990 Clean Air Act
International EU/UN-ECEAcidification Strategy
EC Directives LCPDIPPCAir Quality Directives: AQFDN-protocol (93/361/EEC)National Ceilings Directives
Nitrogen oxides
Other UN-ECE/-WHOUSAEPA/ 1990 Clean Air Act
International EU/UN-ECEUN-ECE/VOC Protocol Stage I (Marine VR), Stage IIMARPOL Convention Annex VIIMO-MARPOL 73/78
EC Directives Air Quality Directives AQFD94/63/ECNational Ceiling DirectivesOzone Strategy
Volatile organiccompounds
Other: UN-WHOUSAEPA/1990Clean Air ActDraft EC-Long range transboundary air pollution
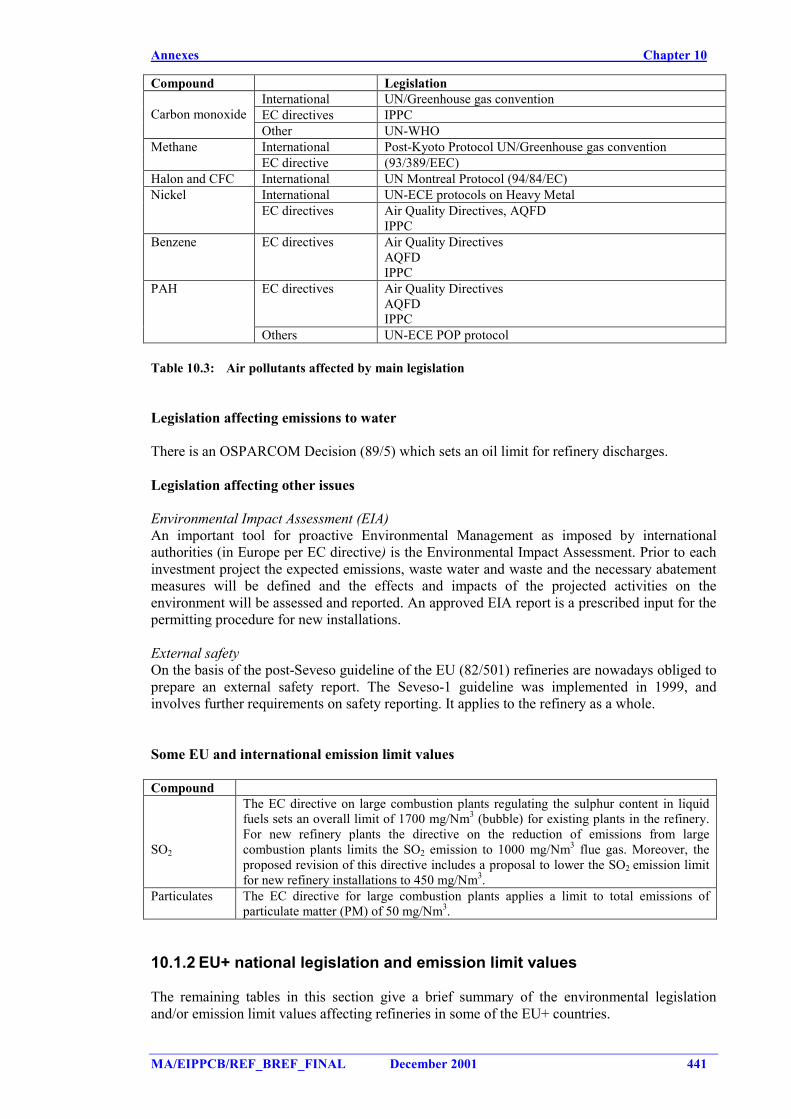
Annexes Chapter 10
MA/EIPPCB/REF_BREF_FINAL December 2001 441
Compound LegislationInternational UN/Greenhouse gas conventionEC directives IPPCCarbon monoxideOther UN-WHOInternational Post-Kyoto Protocol UN/Greenhouse gas conventionMethaneEC directive (93/389/EEC)
Halon and CFC International UN Montreal Protocol (94/84/EC)International UN-ECE protocols on Heavy MetalNickelEC directives Air Quality Directives, AQFD
IPPCBenzene EC directives Air Quality Directives
AQFDIPPC
EC directives Air Quality DirectivesAQFDIPPC
PAH
Others UN-ECE POP protocol
Table 10.3: Air pollutants affected by main legislation
Legislation affecting emissions to water
There is an OSPARCOM Decision (89/5) which sets an oil limit for refinery discharges.
Legislation affecting other issues
Environmental Impact Assessment (EIA)An important tool for proactive Environmental Management as imposed by internationalauthorities (in Europe per EC directive) is the Environmental Impact Assessment. Prior to eachinvestment project the expected emissions, waste water and waste and the necessary abatementmeasures will be defined and the effects and impacts of the projected activities on theenvironment will be assessed and reported. An approved EIA report is a prescribed input for thepermitting procedure for new installations.
External safetyOn the basis of the post-Seveso guideline of the EU (82/501) refineries are nowadays obliged toprepare an external safety report. The Seveso-1 guideline was implemented in 1999, andinvolves further requirements on safety reporting. It applies to the refinery as a whole.
Some EU and international emission limit values
Compound
SO2
The EC directive on large combustion plants regulating the sulphur content in liquidfuels sets an overall limit of 1700 mg/Nm3 (bubble) for existing plants in the refinery.For new refinery plants the directive on the reduction of emissions from largecombustion plants limits the SO2 emission to 1000 mg/Nm3 flue gas. Moreover, theproposed revision of this directive includes a proposal to lower the SO2 emission limitfor new refinery installations to 450 mg/Nm3.
Particulates The EC directive for large combustion plants applies a limit to total emissions ofparticulate matter (PM) of 50 mg/Nm3.
10.1.2 EU+ national legislation and emission limit values
The remaining tables in this section give a brief summary of the environmental legislationand/or emission limit values affecting refineries in some of the EU+ countries.
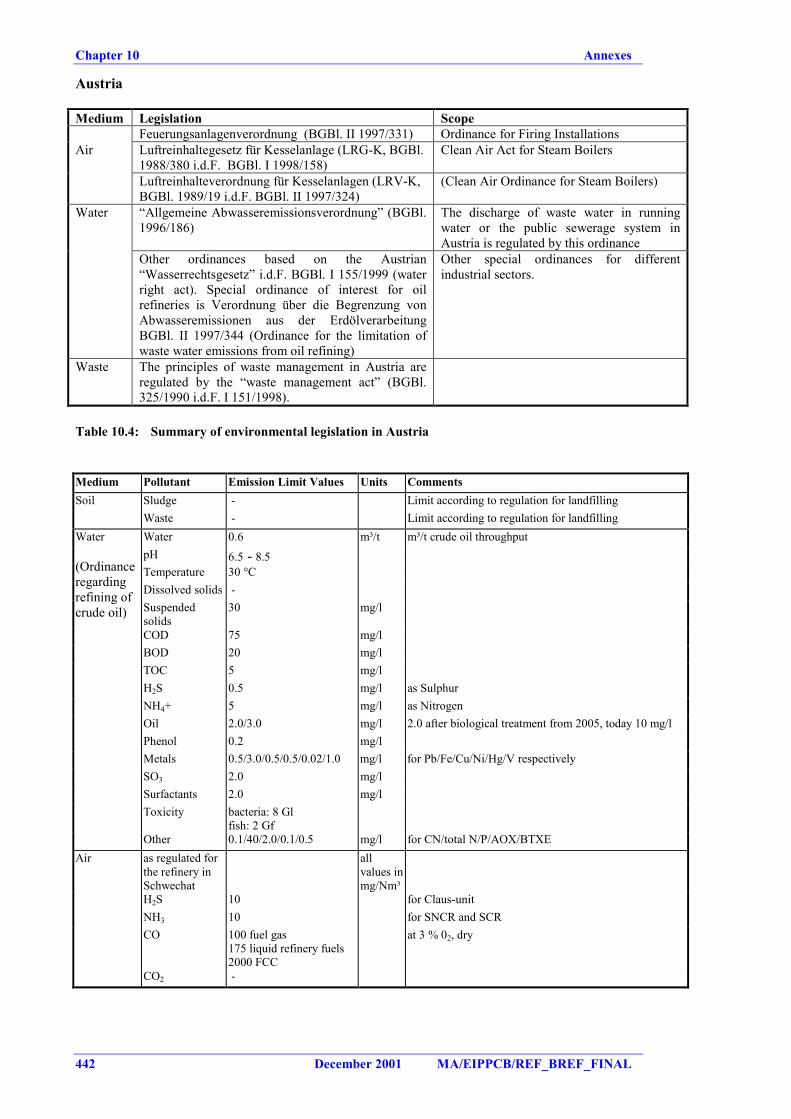
Chapter 10 Annexes
442 December 2001 MA/EIPPCB/REF_BREF_FINAL
Austria
Medium Legislation ScopeFeuerungsanlagenverordnung (BGBl. II 1997/331) Ordinance for Firing Installations
Air Luftreinhaltegesetz für Kesselanlage (LRG-K, BGBl.1988/380 i.d.F. BGBl. I 1998/158)
Clean Air Act for Steam Boilers
Luftreinhalteverordnung für Kesselanlagen (LRV-K,BGBl. 1989/19 i.d.F. BGBl. II 1997/324)
(Clean Air Ordinance for Steam Boilers)
Water “Allgemeine Abwasseremissionsverordnung” (BGBl.1996/186)
The discharge of waste water in runningwater or the public sewerage system inAustria is regulated by this ordinance
Other ordinances based on the Austrian“Wasserrechtsgesetz” i.d.F. BGBl. I 155/1999 (waterright act). Special ordinance of interest for oilrefineries is Verordnung über die Begrenzung vonAbwasseremissionen aus der ErdölverarbeitungBGBl. II 1997/344 (Ordinance for the limitation ofwaste water emissions from oil refining)
Other special ordinances for differentindustrial sectors.
Waste The principles of waste management in Austria areregulated by the “waste management act” (BGBl.325/1990 i.d.F. I 151/1998).
Table 10.4: Summary of environmental legislation in Austria
Medium Pollutant Emission Limit Values Units CommentsSoil Sludge - Limit according to regulation for landfilling
Waste - Limit according to regulation for landfillingWater 0.6 m³/t m³/t crude oil throughputpH 6.5 - 8.5Temperature 30 °CDissolved solids -Suspendedsolids
30 mg/l
COD 75 mg/lBOD 20 mg/lTOC 5 mg/lH2S 0.5 mg/l as SulphurNH4+ 5 mg/l as NitrogenOil 2.0/3.0 mg/l 2.0 after biological treatment from 2005, today 10 mg/lPhenol 0.2 mg/lMetals 0.5/3.0/0.5/0.5/0.02/1.0 mg/l for Pb/Fe/Cu/Ni/Hg/V respectivelySO3 2.0 mg/lSurfactants 2.0 mg/lToxicity bacteria: 8 Gl
fish: 2 Gf
Water
(Ordinanceregardingrefining ofcrude oil)
Other 0.1/40/2.0/0.1/0.5 mg/l for CN/total N/P/AOX/BTXEAir as regulated for
the refinery inSchwechat
allvalues inmg/Nm³
H2S 10 for Claus-unitNH3 10 for SNCR and SCRCO 100 fuel gas
175 liquid refinery fuels2000 FCC
at 3 % 02, dry
CO2 -
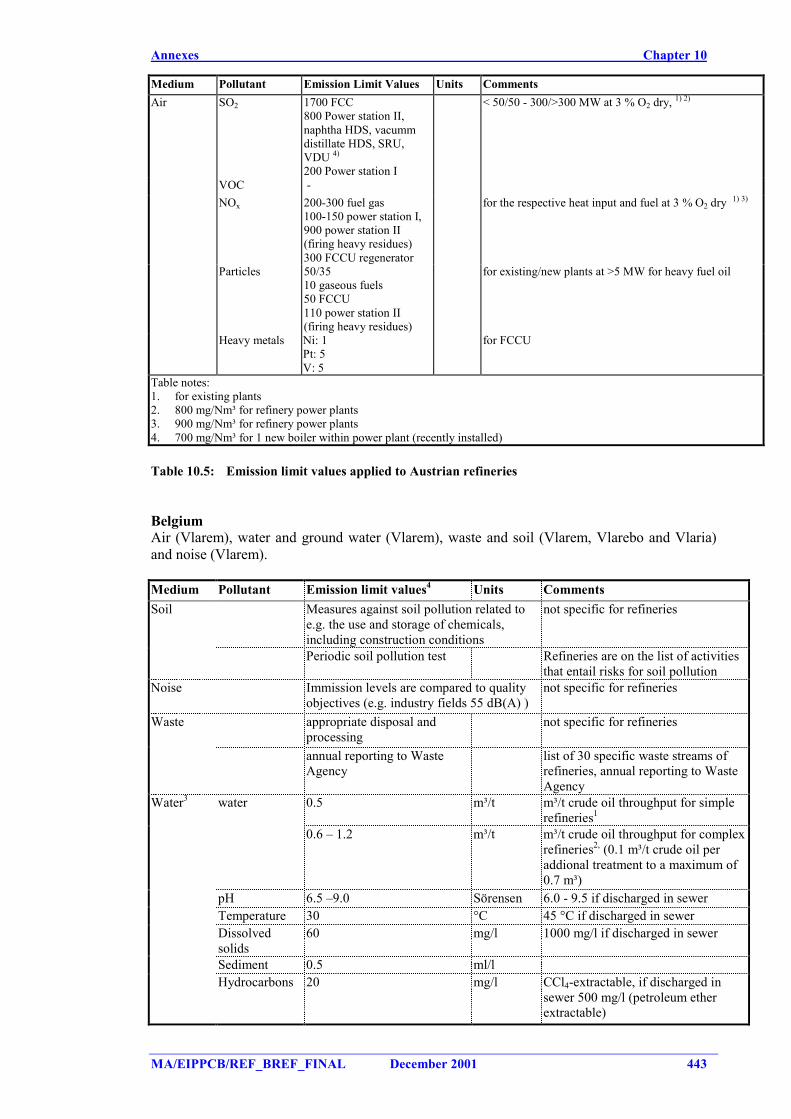
Annexes Chapter 10
MA/EIPPCB/REF_BREF_FINAL December 2001 443
Medium Pollutant Emission Limit Values Units CommentsAir SO2 1700 FCC
800 Power station II,naphtha HDS, vacummdistillate HDS, SRU,VDU 4)
200 Power station I
< 50/50 - 300/>300 MW at 3 % O2 dry, 1) 2)
VOC -NOx 200-300 fuel gas
100-150 power station I,900 power station II(firing heavy residues)300 FCCU regenerator
for the respective heat input and fuel at 3 % O2 dry 1) 3)
Particles 50/3510 gaseous fuels50 FCCU110 power station II(firing heavy residues)
for existing/new plants at >5 MW for heavy fuel oil
Heavy metals Ni: 1Pt: 5V: 5
for FCCU
Table notes:1. for existing plants2. 800 mg/Nm³ for refinery power plants3. 900 mg/Nm³ for refinery power plants4. 700 mg/Nm³ for 1 new boiler within power plant (recently installed)
Table 10.5: Emission limit values applied to Austrian refineries
BelgiumAir (Vlarem), water and ground water (Vlarem), waste and soil (Vlarem, Vlarebo and Vlaria)and noise (Vlarem).
Medium Pollutant Emission limit values4 Units CommentsSoil Measures against soil pollution related to
e.g. the use and storage of chemicals,including construction conditions
not specific for refineries
Periodic soil pollution test Refineries are on the list of activitiesthat entail risks for soil pollution
Noise Immission levels are compared to qualityobjectives (e.g. industry fields 55 dB(A) )
not specific for refineries
Waste appropriate disposal andprocessing
not specific for refineries
annual reporting to WasteAgency
list of 30 specific waste streams ofrefineries, annual reporting to WasteAgency
Water3 water 0.5 m³/t m³/t crude oil throughput for simplerefineries1
0.6 – 1.2 m³/t m³/t crude oil throughput for complexrefineries2, (0.1 m³/t crude oil peraddional treatment to a maximum of0.7 m³)
pH 6.5 –9.0 Sörensen 6.0 - 9.5 if discharged in sewerTemperature 30 °C 45 °C if discharged in sewerDissolvedsolids
60 mg/l 1000 mg/l if discharged in sewer
Sediment 0.5 ml/lHydrocarbons 20 mg/l CCl4-extractable, if discharged in
sewer 500 mg/l (petroleum etherextractable)
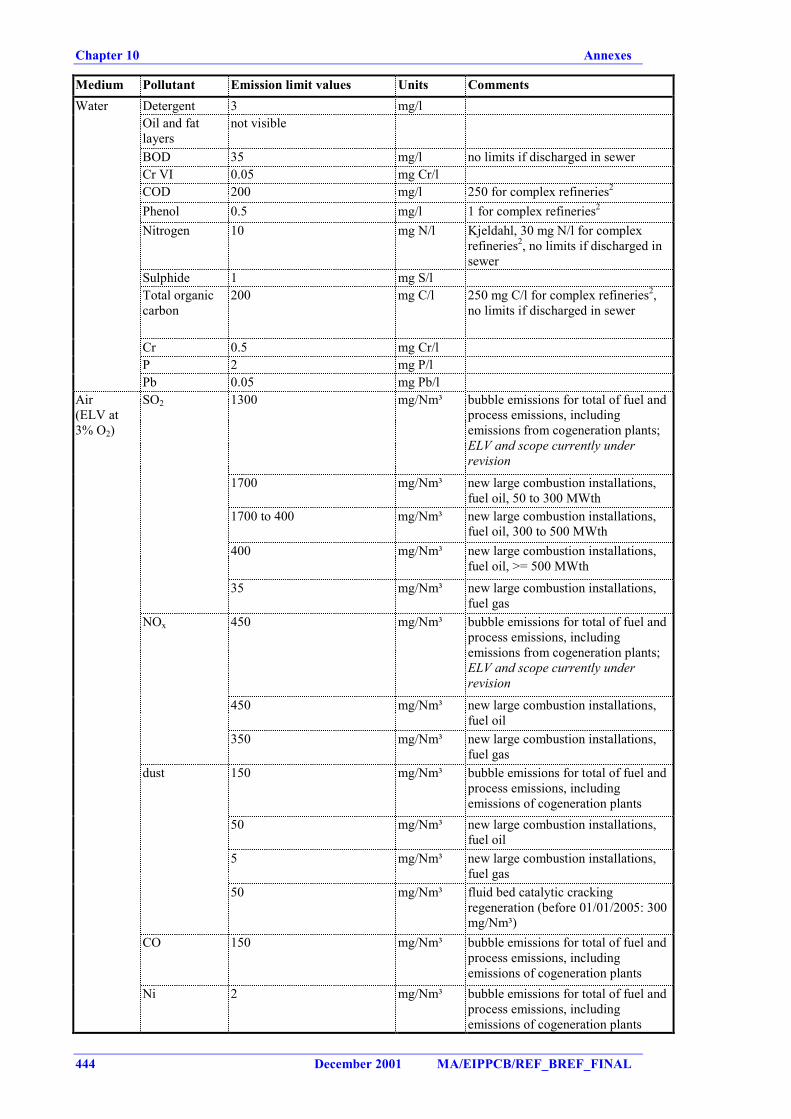
Chapter 10 Annexes
444 December 2001 MA/EIPPCB/REF_BREF_FINAL
Medium Pollutant Emission limit values Units CommentsWater Detergent 3 mg/l
Oil and fatlayers
not visible
BOD 35 mg/l no limits if discharged in sewerCr VI 0.05 mg Cr/lCOD 200 mg/l 250 for complex refineries2
Phenol 0.5 mg/l 1 for complex refineries2
Nitrogen 10 mg N/l Kjeldahl, 30 mg N/l for complexrefineries2, no limits if discharged insewer
Sulphide 1 mg S/lTotal organiccarbon
200 mg C/l 250 mg C/l for complex refineries2,no limits if discharged in sewer
Cr 0.5 mg Cr/lP 2 mg P/lPb 0.05 mg Pb/l
Air(ELV at3% O2)
SO2 1300 mg/Nm³ bubble emissions for total of fuel andprocess emissions, includingemissions from cogeneration plants;ELV and scope currently underrevision
1700 mg/Nm³ new large combustion installations,fuel oil, 50 to 300 MWth
1700 to 400 mg/Nm³ new large combustion installations,fuel oil, 300 to 500 MWth
400 mg/Nm³ new large combustion installations,fuel oil, >= 500 MWth
35 mg/Nm³ new large combustion installations,fuel gas
NOx 450 mg/Nm³ bubble emissions for total of fuel andprocess emissions, includingemissions from cogeneration plants;ELV and scope currently underrevision
450 mg/Nm³ new large combustion installations,fuel oil
350 mg/Nm³ new large combustion installations,fuel gas
dust 150 mg/Nm³ bubble emissions for total of fuel andprocess emissions, includingemissions of cogeneration plants
50 mg/Nm³ new large combustion installations,fuel oil
5 mg/Nm³ new large combustion installations,fuel gas
50 mg/Nm³ fluid bed catalytic crackingregeneration (before 01/01/2005: 300mg/Nm³)
CO 150 mg/Nm³ bubble emissions for total of fuel andprocess emissions, includingemissions of cogeneration plants
Ni 2 mg/Nm³ bubble emissions for total of fuel andprocess emissions, includingemissions of cogeneration plants
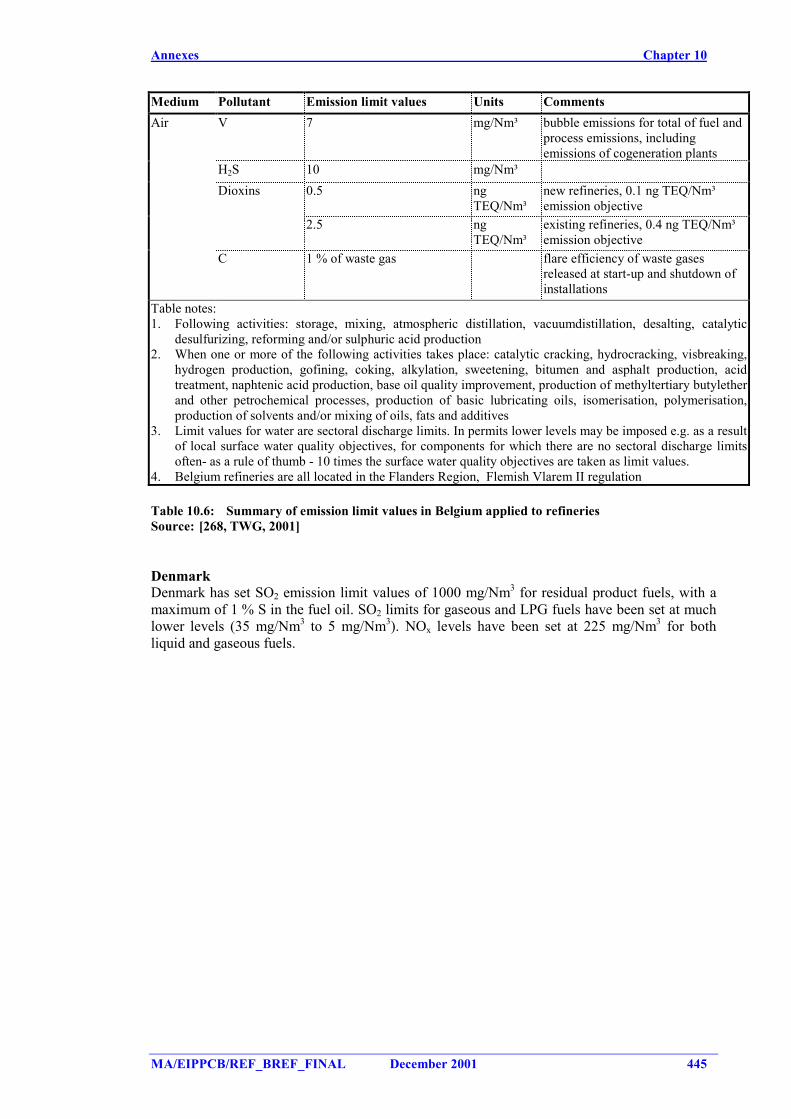
Annexes Chapter 10
MA/EIPPCB/REF_BREF_FINAL December 2001 445
Medium Pollutant Emission limit values Units CommentsAir V 7 mg/Nm³ bubble emissions for total of fuel and
process emissions, includingemissions of cogeneration plants
H2S 10 mg/Nm³Dioxins 0.5 ng
TEQ/Nm³new refineries, 0.1 ng TEQ/Nm³emission objective
2.5 ngTEQ/Nm³
existing refineries, 0.4 ng TEQ/Nm³emission objective
C 1 % of waste gas flare efficiency of waste gasesreleased at start-up and shutdown ofinstallations
Table notes:1. Following activities: storage, mixing, atmospheric distillation, vacuumdistillation, desalting, catalytic
desulfurizing, reforming and/or sulphuric acid production2. When one or more of the following activities takes place: catalytic cracking, hydrocracking, visbreaking,
hydrogen production, gofining, coking, alkylation, sweetening, bitumen and asphalt production, acidtreatment, naphtenic acid production, base oil quality improvement, production of methyltertiary butyletherand other petrochemical processes, production of basic lubricating oils, isomerisation, polymerisation,production of solvents and/or mixing of oils, fats and additives
3. Limit values for water are sectoral discharge limits. In permits lower levels may be imposed e.g. as a resultof local surface water quality objectives, for components for which there are no sectoral discharge limitsoften- as a rule of thumb - 10 times the surface water quality objectives are taken as limit values.
4. Belgium refineries are all located in the Flanders Region, Flemish Vlarem II regulation
Table 10.6: Summary of emission limit values in Belgium applied to refineriesSource: [268, TWG, 2001]
DenmarkDenmark has set SO2 emission limit values of 1000 mg/Nm3 for residual product fuels, with amaximum of 1 % S in the fuel oil. SO2 limits for gaseous and LPG fuels have been set at muchlower levels (35 mg/Nm3 to 5 mg/Nm3). NOx levels have been set at 225 mg/Nm3 for bothliquid and gaseous fuels.
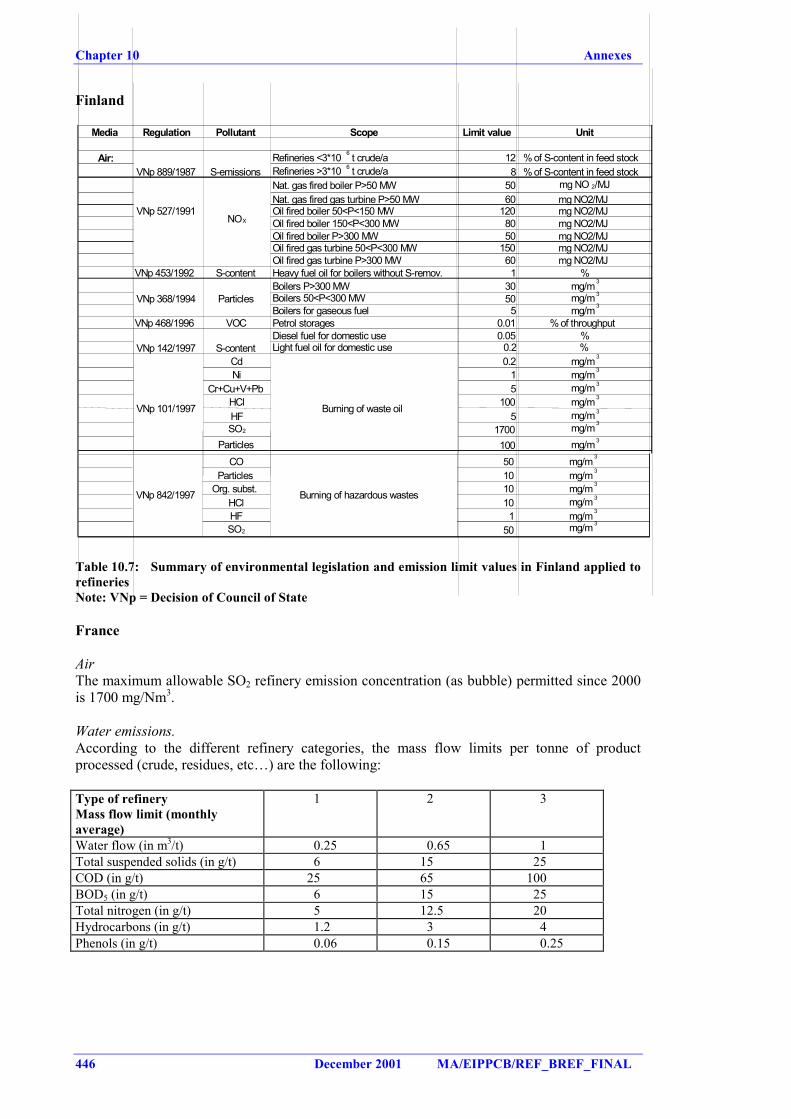
Chapter 10 Annexes
446 December 2001 MA/EIPPCB/REF_BREF_FINAL
Finland
Media Regulation Pollutant Scope Limit value Unit
Air: Refineries <3*10 6 t crude/a 12 % of S-content in feed stockRefineries >3*10 6 t crude/a 8 % of S-content in feed stockNat. gas fired boiler P>50 MW 50 mg NO 2/MJNat. gas fired gas turbine P>50 MW 60 mg NO2/MJOil fired boiler 50<P<150 MW 120 mg NO2/MJOil fired boiler 150<P<300 MW 80 mg NO2/MJOil fired boiler P>300 MW 50 mg NO2/MJOil fired gas turbine 50<P<300 MW 150 mg NO2/MJOil fired gas turbine P>300 MW 60 mg NO2/MJ
VNp 453/1992 S-content Heavy fuel oil for boilers without S-remov. 1 %Boilers P>300 MW 30 mg/m3
Boilers 50<P<300 MW 50 mg/m3
Boilers for gaseous fuel 5 mg/m3
VNp 468/1996 VOC Petrol storages 0.01 % of throughputDiesel fuel for domestic use 0.05 %Light fuel oil for domestic use 0.2 %
Cd 0.2 mg/m3
Ni 1 mg/m3
Cr+Cu+V+Pb 5 mg/m3
HCl 100 mg/m3
HF 5 mg/m3
SO2 1700 mg/m3
Particles 100 mg/m3
VNp 142/1997
Particles
S-content
NOX
S-emissions
VNp 101/1997 Burning of waste oil
VNp 889/1987
VNp 527/1991
VNp 368/1994
CO 50 mg/m3
Particles 10 mg/m3
Org. subst. 10 mg/m3
HCl 10 mg/m3
HF 1 mg/m3
SO2 50 mg/m3
VNp 842/1997 Burning of hazardous wastes
Table 10.7: Summary of environmental legislation and emission limit values in Finland applied torefineriesNote: VNp = Decision of Council of State
France
AirThe maximum allowable SO2 refinery emission concentration (as bubble) permitted since 2000is 1700 mg/Nm3.
Water emissions.According to the different refinery categories, the mass flow limits per tonne of productprocessed (crude, residues, etc…) are the following:
Type of refineryMass flow limit (monthlyaverage)
1 2 3
Water flow (in m3/t) 0.25 0.65 1Total suspended solids (in g/t) 6 15 25COD (in g/t) 25 65 100BOD5 (in g/t) 6 15 25Total nitrogen (in g/t) 5 12.5 20Hydrocarbons (in g/t) 1.2 3 4Phenols (in g/t) 0.06 0.15 0.25
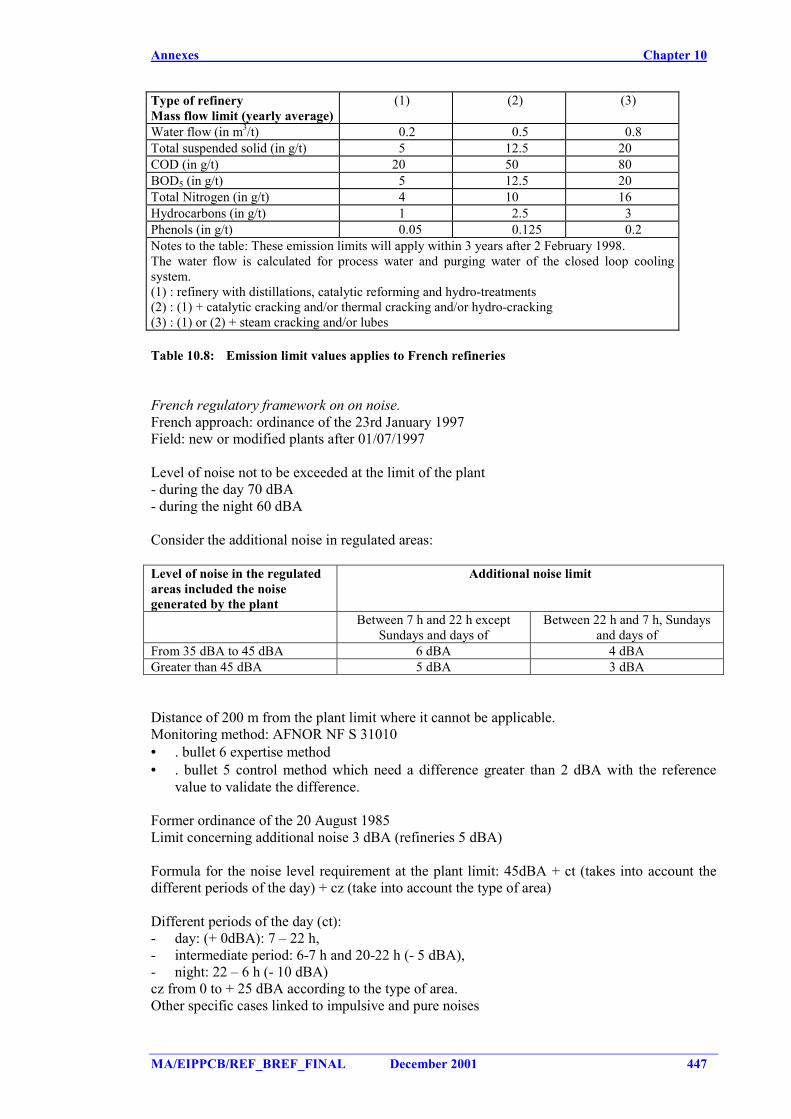
Annexes Chapter 10
MA/EIPPCB/REF_BREF_FINAL December 2001 447
Type of refineryMass flow limit (yearly average)
(1) (2) (3)
Water flow (in m3/t) 0.2 0.5 0.8Total suspended solid (in g/t) 5 12.5 20COD (in g/t) 20 50 80BOD5 (in g/t) 5 12.5 20Total Nitrogen (in g/t) 4 10 16Hydrocarbons (in g/t) 1 2.5 3Phenols (in g/t) 0.05 0.125 0.2Notes to the table: These emission limits will apply within 3 years after 2 February 1998.The water flow is calculated for process water and purging water of the closed loop coolingsystem.(1) : refinery with distillations, catalytic reforming and hydro-treatments(2) : (1) + catalytic cracking and/or thermal cracking and/or hydro-cracking(3) : (1) or (2) + steam cracking and/or lubes
Table 10.8: Emission limit values applies to French refineries
French regulatory framework on on noise.French approach: ordinance of the 23rd January 1997Field: new or modified plants after 01/07/1997
Level of noise not to be exceeded at the limit of the plant- during the day 70 dBA- during the night 60 dBA
Consider the additional noise in regulated areas:
Level of noise in the regulatedareas included the noisegenerated by the plant
Additional noise limit
Between 7 h and 22 h exceptSundays and days of
Between 22 h and 7 h, Sundaysand days of
From 35 dBA to 45 dBA 6 dBA 4 dBAGreater than 45 dBA 5 dBA 3 dBA
Distance of 200 m from the plant limit where it cannot be applicable.Monitoring method: AFNOR NF S 31010• . bullet 6 expertise method• . bullet 5 control method which need a difference greater than 2 dBA with the reference
value to validate the difference.
Former ordinance of the 20 August 1985Limit concerning additional noise 3 dBA (refineries 5 dBA)
Formula for the noise level requirement at the plant limit: 45dBA + ct (takes into account thedifferent periods of the day) + cz (take into account the type of area)
Different periods of the day (ct):- day: (+ 0dBA): 7 – 22 h,- intermediate period: 6-7 h and 20-22 h (- 5 dBA),- night: 22 – 6 h (- 10 dBA)cz from 0 to + 25 dBA according to the type of area.Other specific cases linked to impulsive and pure noises
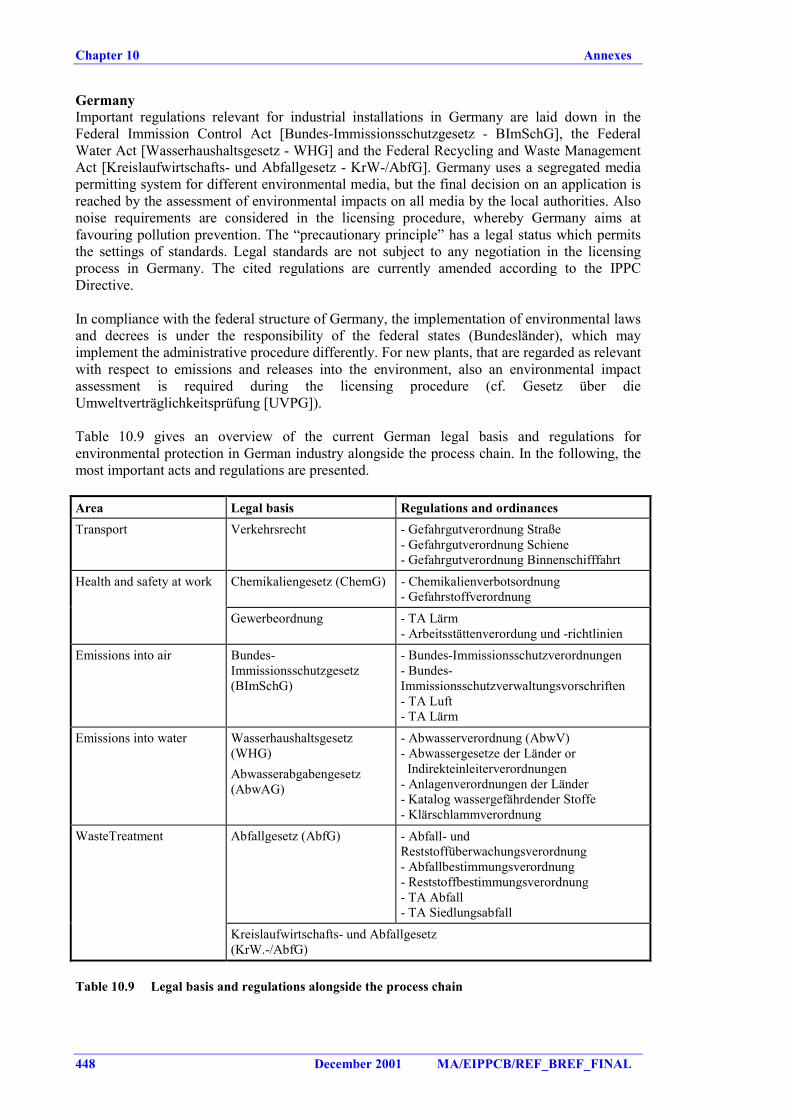
Chapter 10 Annexes
448 December 2001 MA/EIPPCB/REF_BREF_FINAL
GermanyImportant regulations relevant for industrial installations in Germany are laid down in theFederal Immission Control Act [Bundes-Immissionsschutzgesetz - BImSchG], the FederalWater Act [Wasserhaushaltsgesetz - WHG] and the Federal Recycling and Waste ManagementAct [Kreislaufwirtschafts- und Abfallgesetz - KrW-/AbfG]. Germany uses a segregated mediapermitting system for different environmental media, but the final decision on an application isreached by the assessment of environmental impacts on all media by the local authorities. Alsonoise requirements are considered in the licensing procedure, whereby Germany aims atfavouring pollution prevention. The “precautionary principle” has a legal status which permitsthe settings of standards. Legal standards are not subject to any negotiation in the licensingprocess in Germany. The cited regulations are currently amended according to the IPPCDirective.
In compliance with the federal structure of Germany, the implementation of environmental lawsand decrees is under the responsibility of the federal states (Bundesländer), which mayimplement the administrative procedure differently. For new plants, that are regarded as relevantwith respect to emissions and releases into the environment, also an environmental impactassessment is required during the licensing procedure (cf. Gesetz über dieUmweltverträglichkeitsprüfung [UVPG]).
Table 10.9 gives an overview of the current German legal basis and regulations forenvironmental protection in German industry alongside the process chain. In the following, themost important acts and regulations are presented.
Area Legal basis Regulations and ordinancesTransport Verkehrsrecht - Gefahrgutverordnung Straße
- Gefahrgutverordnung Schiene- Gefahrgutverordnung Binnenschifffahrt
Health and safety at work Chemikaliengesetz (ChemG) - Chemikalienverbotsordnung- Gefahrstoffverordnung
Gewerbeordnung - TA Lärm- Arbeitsstättenverordung und -richtlinien
Emissions into air Bundes-Immissionsschutzgesetz(BImSchG)
- Bundes-Immissionsschutzverordnungen- Bundes-Immissionsschutzverwaltungsvorschriften- TA Luft- TA Lärm
Emissions into water Wasserhaushaltsgesetz(WHG)Abwasserabgabengesetz(AbwAG)
- Abwasserverordnung (AbwV)- Abwassergesetze der Länder or Indirekteinleiterverordnungen- Anlagenverordnungen der Länder- Katalog wassergefährdender Stoffe- Klärschlammverordnung
WasteTreatment Abfallgesetz (AbfG) - Abfall- undReststoffüberwachungsverordnung- Abfallbestimmungsverordnung- Reststoffbestimmungsverordnung- TA Abfall- TA Siedlungsabfall
Kreislaufwirtschafts- und Abfallgesetz(KrW.-/AbfG)
Table 10.9 Legal basis and regulations alongside the process chain
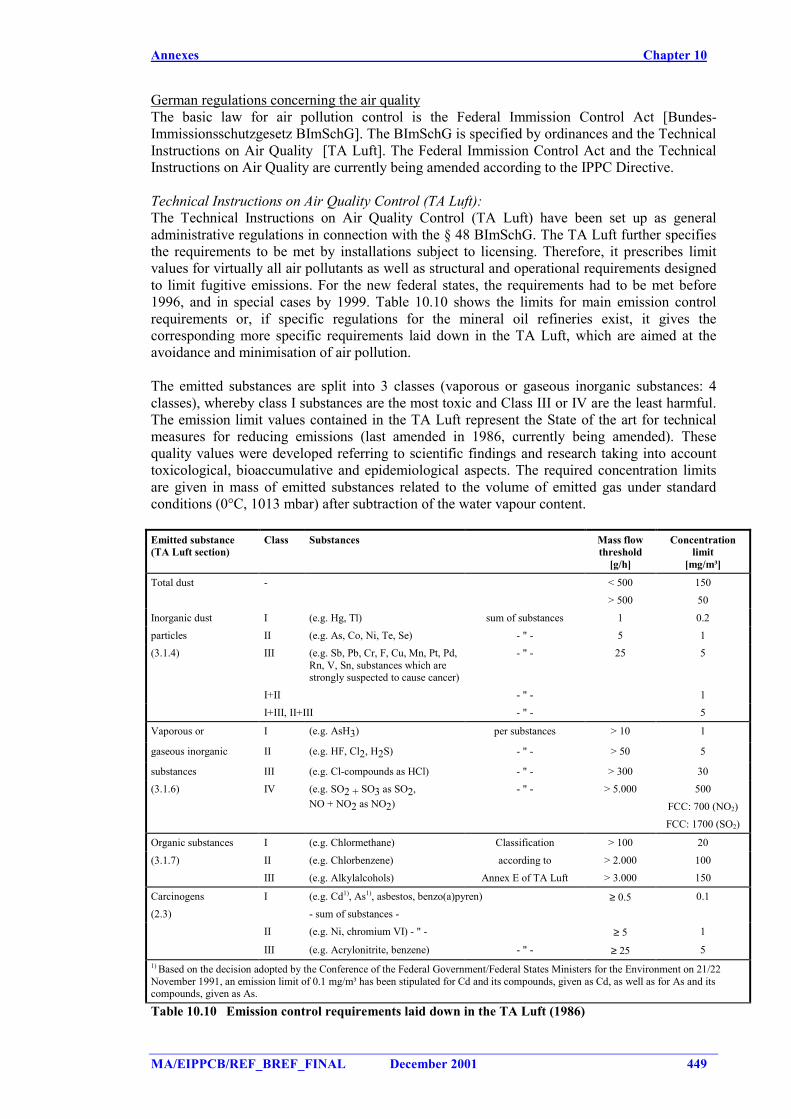
Annexes Chapter 10
MA/EIPPCB/REF_BREF_FINAL December 2001 449
German regulations concerning the air qualityThe basic law for air pollution control is the Federal Immission Control Act [Bundes-Immissionsschutzgesetz BImSchG]. The BImSchG is specified by ordinances and the TechnicalInstructions on Air Quality [TA Luft]. The Federal Immission Control Act and the TechnicalInstructions on Air Quality are currently being amended according to the IPPC Directive.
Technical Instructions on Air Quality Control (TA Luft):The Technical Instructions on Air Quality Control (TA Luft) have been set up as generaladministrative regulations in connection with the § 48 BImSchG. The TA Luft further specifiesthe requirements to be met by installations subject to licensing. Therefore, it prescribes limitvalues for virtually all air pollutants as well as structural and operational requirements designedto limit fugitive emissions. For the new federal states, the requirements had to be met before1996, and in special cases by 1999. Table 10.10 shows the limits for main emission controlrequirements or, if specific regulations for the mineral oil refineries exist, it gives thecorresponding more specific requirements laid down in the TA Luft, which are aimed at theavoidance and minimisation of air pollution.
The emitted substances are split into 3 classes (vaporous or gaseous inorganic substances: 4classes), whereby class I substances are the most toxic and Class III or IV are the least harmful.The emission limit values contained in the TA Luft represent the State of the art for technicalmeasures for reducing emissions (last amended in 1986, currently being amended). Thesequality values were developed referring to scientific findings and research taking into accounttoxicological, bioaccumulative and epidemiological aspects. The required concentration limitsare given in mass of emitted substances related to the volume of emitted gas under standardconditions (0°C, 1013 mbar) after subtraction of the water vapour content.
Emitted substance(TA Luft section)
Class Substances Mass flowthreshold
[g/h]
Concentrationlimit
[mg/m³]
Total dust - < 500> 500
15050
Inorganic dust I (e.g. Hg, Tl) sum of substances 1 0.2particles II (e.g. As, Co, Ni, Te, Se) - " - 5 1(3.1.4) III (e.g. Sb, Pb, Cr, F, Cu, Mn, Pt, Pd,
Rn, V, Sn, substances which arestrongly suspected to cause cancer)
- " - 25 5
I+II - " - 1I+III, II+III - " - 5
Vaporous or I (e.g. AsH3) per substances > 10 1
gaseous inorganic II (e.g. HF, Cl2, H2S) - " - > 50 5
substances III (e.g. Cl-compounds as HCl) - " - > 300 30(3.1.6) IV (e.g. SO2 + SO3 as SO2,
NO + NO2 as NO2)- " - > 5.000 500
FCC: 700 (NO2)FCC: 1700 (SO2)
Organic substances I (e.g. Chlormethane) Classification > 100 20
(3.1.7) II (e.g. Chlorbenzene) according to > 2.000 100III (e.g. Alkylalcohols) Annex E of TA Luft > 3.000 150
Carcinogens(2.3)
I (e.g. Cd1), As1), asbestos, benzo(a)pyren)- sum of substances -
≥ 0.5 0.1
II (e.g. Ni, chromium VI) - " - ≥ 5 1
III (e.g. Acrylonitrite, benzene) - " - ≥ 25 51) Based on the decision adopted by the Conference of the Federal Government/Federal States Ministers for the Environment on 21/22November 1991, an emission limit of 0.1 mg/m³ has been stipulated for Cd and its compounds, given as Cd, as well as for As and itscompounds, given as As.
Table 10.10 Emission control requirements laid down in the TA Luft (1986)
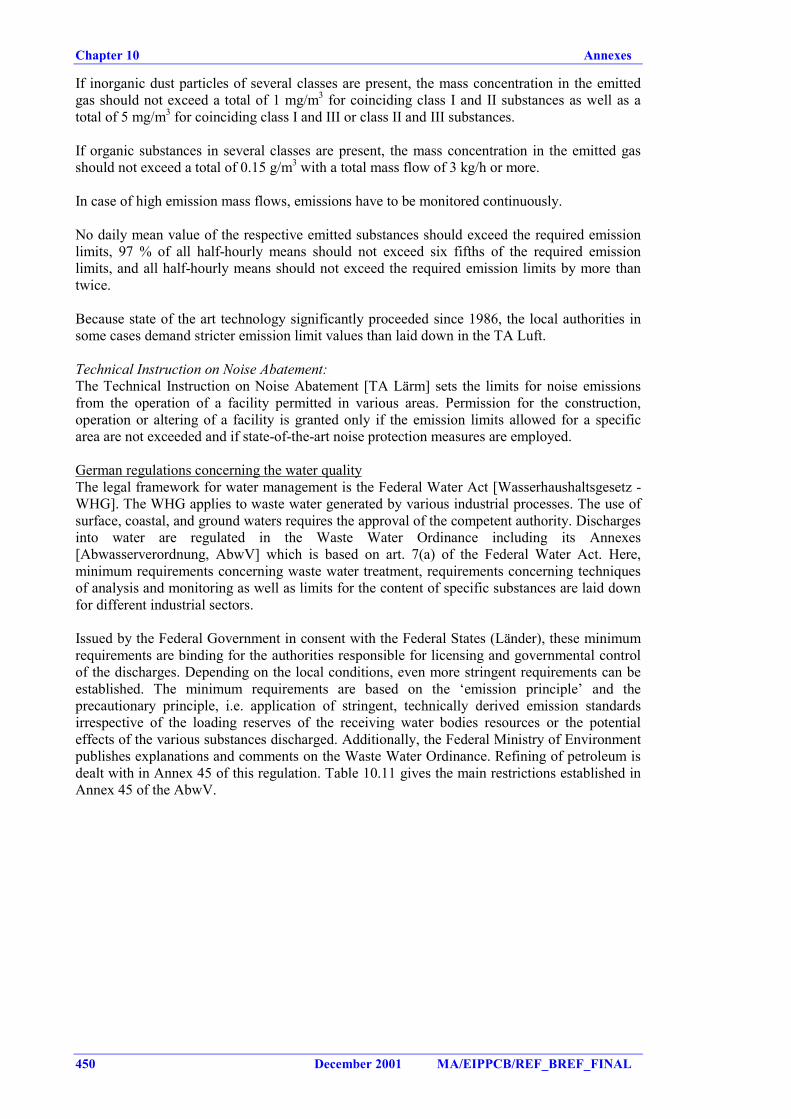
Chapter 10 Annexes
450 December 2001 MA/EIPPCB/REF_BREF_FINAL
If inorganic dust particles of several classes are present, the mass concentration in the emittedgas should not exceed a total of 1 mg/m3 for coinciding class I and II substances as well as atotal of 5 mg/m3 for coinciding class I and III or class II and III substances.
If organic substances in several classes are present, the mass concentration in the emitted gasshould not exceed a total of 0.15 g/m3 with a total mass flow of 3 kg/h or more.
In case of high emission mass flows, emissions have to be monitored continuously.
No daily mean value of the respective emitted substances should exceed the required emissionlimits, 97 % of all half-hourly means should not exceed six fifths of the required emissionlimits, and all half-hourly means should not exceed the required emission limits by more thantwice.
Because state of the art technology significantly proceeded since 1986, the local authorities insome cases demand stricter emission limit values than laid down in the TA Luft.
Technical Instruction on Noise Abatement:The Technical Instruction on Noise Abatement [TA Lärm] sets the limits for noise emissionsfrom the operation of a facility permitted in various areas. Permission for the construction,operation or altering of a facility is granted only if the emission limits allowed for a specificarea are not exceeded and if state-of-the-art noise protection measures are employed.
German regulations concerning the water qualityThe legal framework for water management is the Federal Water Act [Wasserhaushaltsgesetz -WHG]. The WHG applies to waste water generated by various industrial processes. The use ofsurface, coastal, and ground waters requires the approval of the competent authority. Dischargesinto water are regulated in the Waste Water Ordinance including its Annexes[Abwasserverordnung, AbwV] which is based on art. 7(a) of the Federal Water Act. Here,minimum requirements concerning waste water treatment, requirements concerning techniquesof analysis and monitoring as well as limits for the content of specific substances are laid downfor different industrial sectors.
Issued by the Federal Government in consent with the Federal States (Länder), these minimumrequirements are binding for the authorities responsible for licensing and governmental controlof the discharges. Depending on the local conditions, even more stringent requirements can beestablished. The minimum requirements are based on the ‘emission principle’ and theprecautionary principle, i.e. application of stringent, technically derived emission standardsirrespective of the loading reserves of the receiving water bodies resources or the potentialeffects of the various substances discharged. Additionally, the Federal Ministry of Environmentpublishes explanations and comments on the Waste Water Ordinance. Refining of petroleum isdealt with in Annex 45 of this regulation. Table 10.11 gives the main restrictions established inAnnex 45 of the AbwV.
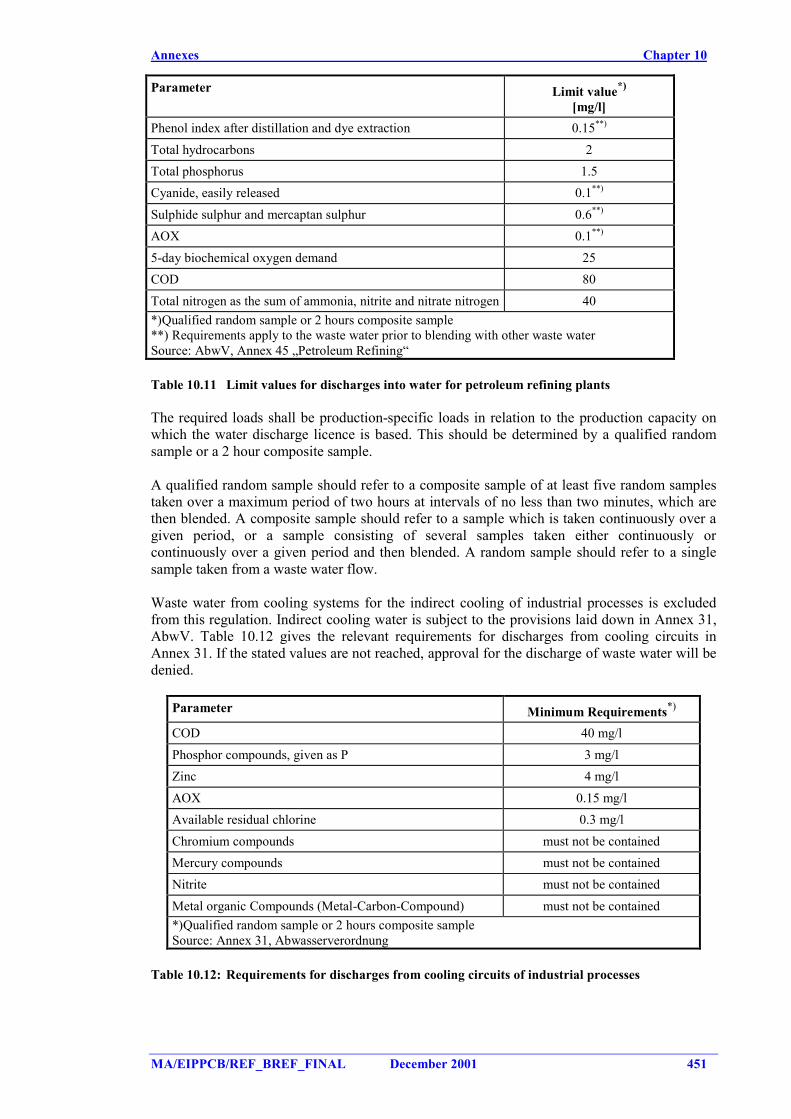
Annexes Chapter 10
MA/EIPPCB/REF_BREF_FINAL December 2001 451
Parameter Limit value*)
[mg/l]Phenol index after distillation and dye extraction 0.15**)
Total hydrocarbons 2Total phosphorus 1.5Cyanide, easily released 0.1**)
Sulphide sulphur and mercaptan sulphur 0.6**)
AOX 0.1**)
5-day biochemical oxygen demand 25COD 80Total nitrogen as the sum of ammonia, nitrite and nitrate nitrogen 40*)Qualified random sample or 2 hours composite sample**) Requirements apply to the waste water prior to blending with other waste waterSource: AbwV, Annex 45 „Petroleum Refining“
Table 10.11 Limit values for discharges into water for petroleum refining plants
The required loads shall be production-specific loads in relation to the production capacity onwhich the water discharge licence is based. This should be determined by a qualified randomsample or a 2 hour composite sample.
A qualified random sample should refer to a composite sample of at least five random samplestaken over a maximum period of two hours at intervals of no less than two minutes, which arethen blended. A composite sample should refer to a sample which is taken continuously over agiven period, or a sample consisting of several samples taken either continuously orcontinuously over a given period and then blended. A random sample should refer to a singlesample taken from a waste water flow.
Waste water from cooling systems for the indirect cooling of industrial processes is excludedfrom this regulation. Indirect cooling water is subject to the provisions laid down in Annex 31,AbwV. Table 10.12 gives the relevant requirements for discharges from cooling circuits inAnnex 31. If the stated values are not reached, approval for the discharge of waste water will bedenied.
Parameter Minimum Requirements*)
COD 40 mg/lPhosphor compounds, given as P 3 mg/lZinc 4 mg/lAOX 0.15 mg/lAvailable residual chlorine 0.3 mg/lChromium compounds must not be containedMercury compounds must not be containedNitrite must not be containedMetal organic Compounds (Metal-Carbon-Compound) must not be contained*)Qualified random sample or 2 hours composite sampleSource: Annex 31, Abwasserverordnung
Table 10.12: Requirements for discharges from cooling circuits of industrial processes
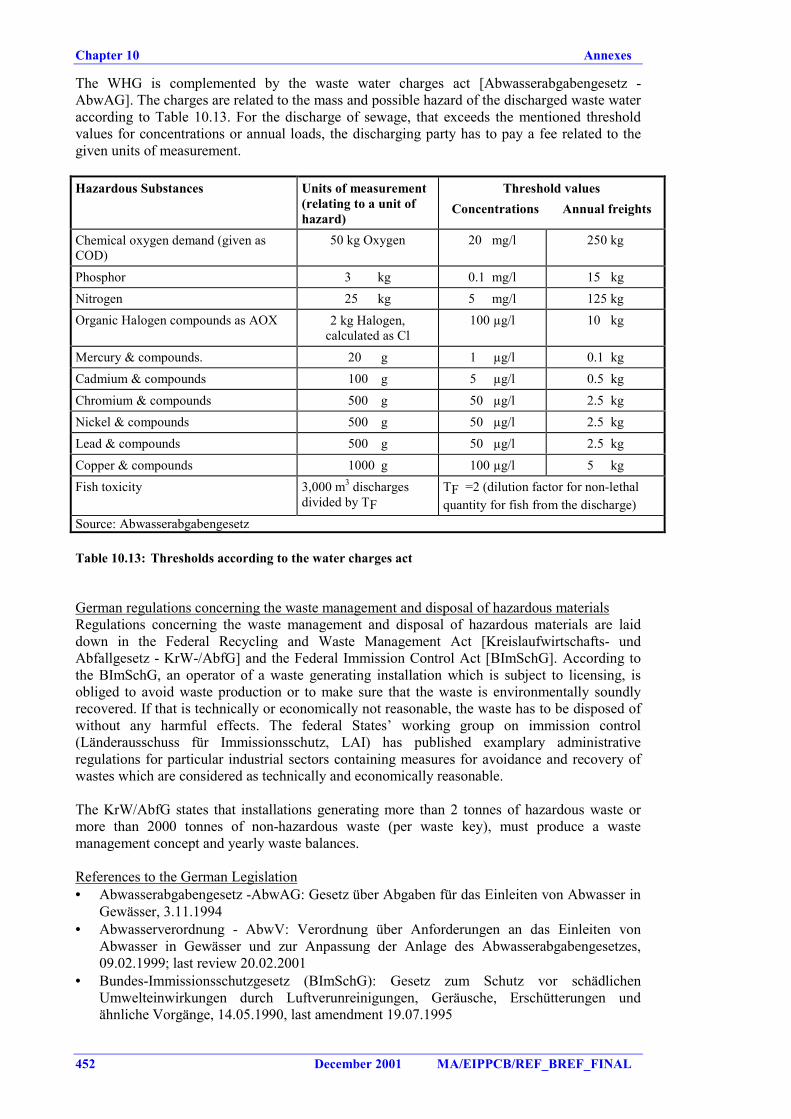
Chapter 10 Annexes
452 December 2001 MA/EIPPCB/REF_BREF_FINAL
The WHG is complemented by the waste water charges act [Abwasserabgabengesetz -AbwAG]. The charges are related to the mass and possible hazard of the discharged waste wateraccording to Table 10.13. For the discharge of sewage, that exceeds the mentioned thresholdvalues for concentrations or annual loads, the discharging party has to pay a fee related to thegiven units of measurement.
Hazardous Substances Units of measurement(relating to a unit ofhazard)
Threshold valuesConcentrations Annual freights
Chemical oxygen demand (given asCOD)
50 kg Oxygen 20 mg/l 250 kg
Phosphor 3 kg 0.1 mg/l 15 kgNitrogen 25 kg 5 mg/l 125 kgOrganic Halogen compounds as AOX 2 kg Halogen,
calculated as Cl100 µg/l 10 kg
Mercury & compounds. 20 g 1 µg/l 0.1 kgCadmium & compounds 100 g 5 µg/l 0.5 kgChromium & compounds 500 g 50 µg/l 2.5 kgNickel & compounds 500 g 50 µg/l 2.5 kgLead & compounds 500 g 50 µg/l 2.5 kgCopper & compounds 1000 g 100 µg/l 5 kgFish toxicity 3,000 m3 discharges
divided by TFTF =2 (dilution factor for non-lethalquantity for fish from the discharge)
Source: Abwasserabgabengesetz
Table 10.13: Thresholds according to the water charges act
German regulations concerning the waste management and disposal of hazardous materialsRegulations concerning the waste management and disposal of hazardous materials are laiddown in the Federal Recycling and Waste Management Act [Kreislaufwirtschafts- undAbfallgesetz - KrW-/AbfG] and the Federal Immission Control Act [BImSchG]. According tothe BImSchG, an operator of a waste generating installation which is subject to licensing, isobliged to avoid waste production or to make sure that the waste is environmentally soundlyrecovered. If that is technically or economically not reasonable, the waste has to be disposed ofwithout any harmful effects. The federal States’ working group on immission control(Länderausschuss für Immissionsschutz, LAI) has published examplary administrativeregulations for particular industrial sectors containing measures for avoidance and recovery ofwastes which are considered as technically and economically reasonable.
The KrW/AbfG states that installations generating more than 2 tonnes of hazardous waste ormore than 2000 tonnes of non-hazardous waste (per waste key), must produce a wastemanagement concept and yearly waste balances.
References to the German Legislation• Abwasserabgabengesetz -AbwAG: Gesetz über Abgaben für das Einleiten von Abwasser in
Gewässer, 3.11.1994• Abwasserverordnung - AbwV: Verordnung über Anforderungen an das Einleiten von
Abwasser in Gewässer und zur Anpassung der Anlage des Abwasserabgabengesetzes,09.02.1999; last review 20.02.2001
• Bundes-Immissionsschutzgesetz (BImSchG): Gesetz zum Schutz vor schädlichenUmwelteinwirkungen durch Luftverunreinigungen, Geräusche, Erschütterungen undähnliche Vorgänge, 14.05.1990, last amendment 19.07.1995
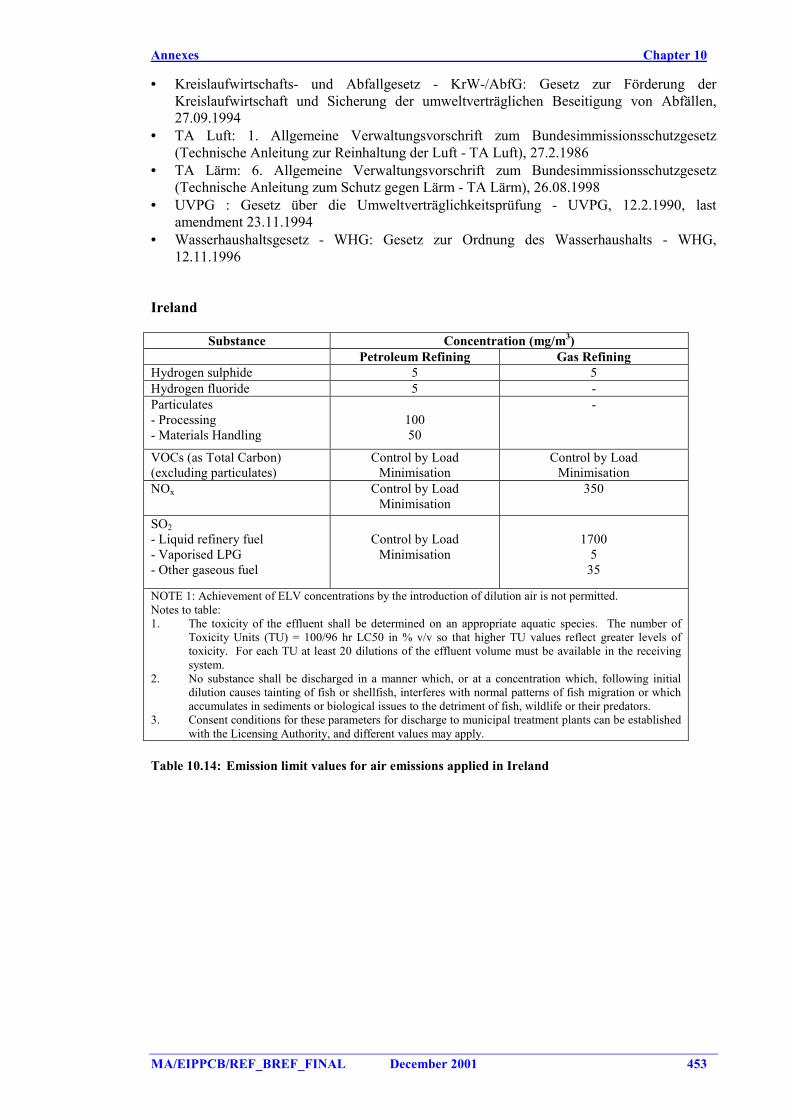
Annexes Chapter 10
MA/EIPPCB/REF_BREF_FINAL December 2001 453
• Kreislaufwirtschafts- und Abfallgesetz - KrW-/AbfG: Gesetz zur Förderung derKreislaufwirtschaft und Sicherung der umweltverträglichen Beseitigung von Abfällen,27.09.1994
• TA Luft: 1. Allgemeine Verwaltungsvorschrift zum Bundesimmissionsschutzgesetz(Technische Anleitung zur Reinhaltung der Luft - TA Luft), 27.2.1986
• TA Lärm: 6. Allgemeine Verwaltungsvorschrift zum Bundesimmissionsschutzgesetz(Technische Anleitung zum Schutz gegen Lärm - TA Lärm), 26.08.1998
• UVPG : Gesetz über die Umweltverträglichkeitsprüfung - UVPG, 12.2.1990, lastamendment 23.11.1994
• Wasserhaushaltsgesetz - WHG: Gesetz zur Ordnung des Wasserhaushalts - WHG,12.11.1996
Ireland
Substance Concentration (mg/m3)Petroleum Refining Gas Refining
Hydrogen sulphide 5 5Hydrogen fluoride 5 -Particulates- Processing- Materials Handling
10050
-
VOCs (as Total Carbon)(excluding particulates)
Control by LoadMinimisation
Control by LoadMinimisation
NOx Control by LoadMinimisation
350
SO2- Liquid refinery fuel- Vaporised LPG- Other gaseous fuel
Control by LoadMinimisation
17005
35
NOTE 1: Achievement of ELV concentrations by the introduction of dilution air is not permitted.Notes to table:1. The toxicity of the effluent shall be determined on an appropriate aquatic species. The number of
Toxicity Units (TU) = 100/96 hr LC50 in % v/v so that higher TU values reflect greater levels oftoxicity. For each TU at least 20 dilutions of the effluent volume must be available in the receivingsystem.
2. No substance shall be discharged in a manner which, or at a concentration which, following initialdilution causes tainting of fish or shellfish, interferes with normal patterns of fish migration or whichaccumulates in sediments or biological issues to the detriment of fish, wildlife or their predators.
3. Consent conditions for these parameters for discharge to municipal treatment plants can be establishedwith the Licensing Authority, and different values may apply.
Table 10.14: Emission limit values for air emissions applied in Ireland
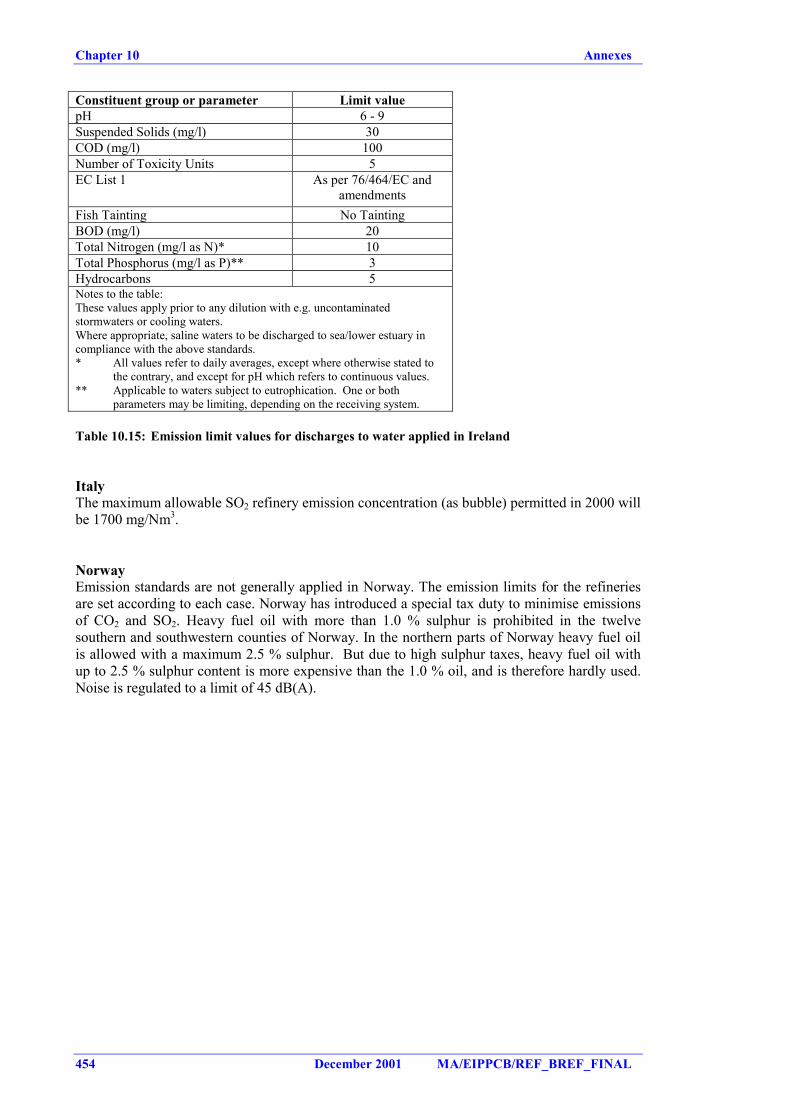
Chapter 10 Annexes
454 December 2001 MA/EIPPCB/REF_BREF_FINAL
Constituent group or parameter Limit valuepH 6 - 9Suspended Solids (mg/l) 30COD (mg/l) 100Number of Toxicity Units 5EC List 1 As per 76/464/EC and
amendmentsFish Tainting No TaintingBOD (mg/l) 20Total Nitrogen (mg/l as N)* 10Total Phosphorus (mg/l as P)** 3Hydrocarbons 5Notes to the table:These values apply prior to any dilution with e.g. uncontaminatedstormwaters or cooling waters.Where appropriate, saline waters to be discharged to sea/lower estuary incompliance with the above standards.* All values refer to daily averages, except where otherwise stated to
the contrary, and except for pH which refers to continuous values.** Applicable to waters subject to eutrophication. One or both
parameters may be limiting, depending on the receiving system.
Table 10.15: Emission limit values for discharges to water applied in Ireland
ItalyThe maximum allowable SO2 refinery emission concentration (as bubble) permitted in 2000 willbe 1700 mg/Nm3.
NorwayEmission standards are not generally applied in Norway. The emission limits for the refineriesare set according to each case. Norway has introduced a special tax duty to minimise emissionsof CO2 and SO2. Heavy fuel oil with more than 1.0 % sulphur is prohibited in the twelvesouthern and southwestern counties of Norway. In the northern parts of Norway heavy fuel oilis allowed with a maximum 2.5 % sulphur. But due to high sulphur taxes, heavy fuel oil withup to 2.5 % sulphur content is more expensive than the 1.0 % oil, and is therefore hardly used.Noise is regulated to a limit of 45 dB(A).
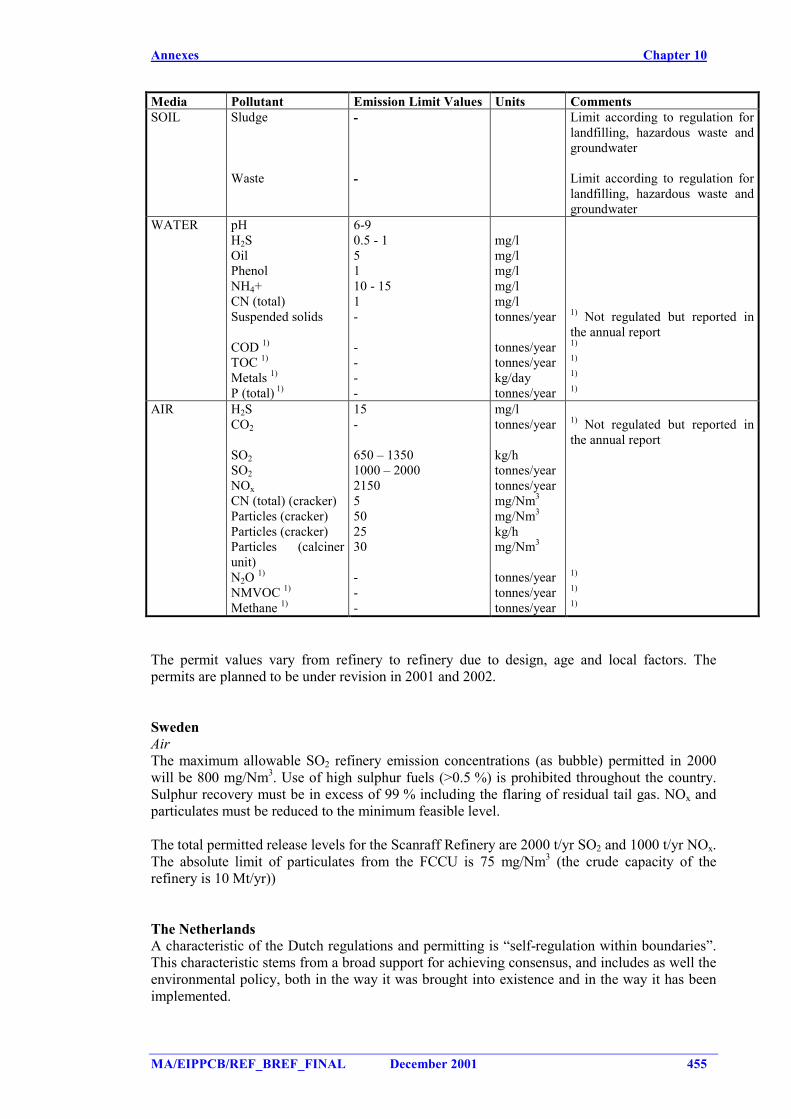
Annexes Chapter 10
MA/EIPPCB/REF_BREF_FINAL December 2001 455
Media Pollutant Emission Limit Values Units CommentsSOIL Sludge
Waste
-
-
Limit according to regulation forlandfilling, hazardous waste andgroundwater
Limit according to regulation forlandfilling, hazardous waste andgroundwater
WATER pHH2SOilPhenolNH4+CN (total)Suspended solids
COD 1)
TOC 1)
Metals 1)
P (total) 1)
6-90.5 - 15110 - 151-
----
mg/lmg/lmg/lmg/lmg/ltonnes/year
tonnes/yeartonnes/yearkg/daytonnes/year
1) Not regulated but reported inthe annual report1)
1)
1)
1)
AIR H2SCO2
SO2SO2NOxCN (total) (cracker)Particles (cracker)Particles (cracker)Particles (calcinerunit)N2O 1)
NMVOC 1)
Methane 1)
15-
650 – 13501000 – 200021505502530
---
mg/ltonnes/year
kg/htonnes/yeartonnes/yearmg/Nm3
mg/Nm3
kg/hmg/Nm3
tonnes/yeartonnes/yeartonnes/year
1) Not regulated but reported inthe annual report
1)
1)
1)
The permit values vary from refinery to refinery due to design, age and local factors. Thepermits are planned to be under revision in 2001 and 2002.
SwedenAirThe maximum allowable SO2 refinery emission concentrations (as bubble) permitted in 2000will be 800 mg/Nm3. Use of high sulphur fuels (>0.5 %) is prohibited throughout the country.Sulphur recovery must be in excess of 99 % including the flaring of residual tail gas. NOx andparticulates must be reduced to the minimum feasible level.
The total permitted release levels for the Scanraff Refinery are 2000 t/yr SO2 and 1000 t/yr NOx.The absolute limit of particulates from the FCCU is 75 mg/Nm3 (the crude capacity of therefinery is 10 Mt/yr))
The NetherlandsA characteristic of the Dutch regulations and permitting is “self-regulation within boundaries”.This characteristic stems from a broad support for achieving consensus, and includes as well theenvironmental policy, both in the way it was brought into existence and in the way it has beenimplemented.
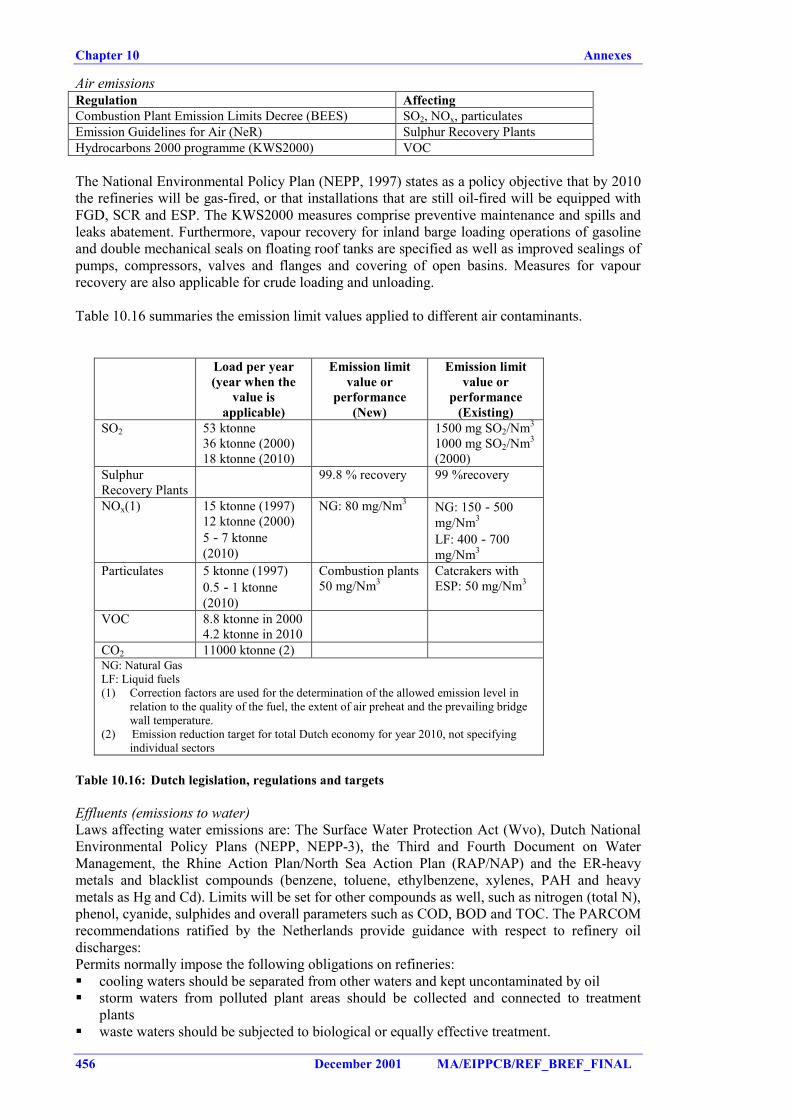
Chapter 10 Annexes
456 December 2001 MA/EIPPCB/REF_BREF_FINAL
Air emissionsRegulation AffectingCombustion Plant Emission Limits Decree (BEES) SO2, NOx, particulatesEmission Guidelines for Air (NeR) Sulphur Recovery PlantsHydrocarbons 2000 programme (KWS2000) VOC
The National Environmental Policy Plan (NEPP, 1997) states as a policy objective that by 2010the refineries will be gas-fired, or that installations that are still oil-fired will be equipped withFGD, SCR and ESP. The KWS2000 measures comprise preventive maintenance and spills andleaks abatement. Furthermore, vapour recovery for inland barge loading operations of gasolineand double mechanical seals on floating roof tanks are specified as well as improved sealings ofpumps, compressors, valves and flanges and covering of open basins. Measures for vapourrecovery are also applicable for crude loading and unloading.
Table 10.16 summaries the emission limit values applied to different air contaminants.
Load per year(year when the
value isapplicable)
Emission limitvalue or
performance(New)
Emission limitvalue or
performance(Existing)
SO2 53 ktonne36 ktonne (2000)18 ktonne (2010)
1500 mg SO2/Nm3
1000 mg SO2/Nm3
(2000)SulphurRecovery Plants
99.8 % recovery 99 %recovery
NOx(1) 15 ktonne (1997)12 ktonne (2000)5 - 7 ktonne(2010)
NG: 80 mg/Nm3 NG: 150 - 500mg/Nm3
LF: 400 - 700mg/Nm3
Particulates 5 ktonne (1997)0.5 - 1 ktonne(2010)
Combustion plants50 mg/Nm3
Catcrakers withESP: 50 mg/Nm3
VOC 8.8 ktonne in 20004.2 ktonne in 2010
CO2 11000 ktonne (2)NG: Natural GasLF: Liquid fuels(1) Correction factors are used for the determination of the allowed emission level in
relation to the quality of the fuel, the extent of air preheat and the prevailing bridgewall temperature.
(2) Emission reduction target for total Dutch economy for year 2010, not specifyingindividual sectors
Table 10.16: Dutch legislation, regulations and targets
Effluents (emissions to water)Laws affecting water emissions are: The Surface Water Protection Act (Wvo), Dutch NationalEnvironmental Policy Plans (NEPP, NEPP-3), the Third and Fourth Document on WaterManagement, the Rhine Action Plan/North Sea Action Plan (RAP/NAP) and the ER-heavymetals and blacklist compounds (benzene, toluene, ethylbenzene, xylenes, PAH and heavymetals as Hg and Cd). Limits will be set for other compounds as well, such as nitrogen (total N),phenol, cyanide, sulphides and overall parameters such as COD, BOD and TOC. The PARCOMrecommendations ratified by the Netherlands provide guidance with respect to refinery oildischarges:Permits normally impose the following obligations on refineries:� cooling waters should be separated from other waters and kept uncontaminated by oil� storm waters from polluted plant areas should be collected and connected to treatment
plants� waste waters should be subjected to biological or equally effective treatment.
Annexes Chapter 10
MA/EIPPCB/REF_BREF_FINAL December 2001 457
Permit values vary from location to location due to differences in design, age and other localfactors. The authority aims at uniformity for future permit revisions. A number of permitparameters and typical compliance values for Dutch refineries are (1997): Oil 140 t/yr, Benzene9 t/yr, Phenol 5 t/yr and N-total 540 t/yr. The parameters and compliance values refer to typicalrefinery effluent composition (ranges), having passed primary effluent treatment facilities butprior to secondary and/or tertiary treatments.
WasteHazardous waste in refineries mainly involves the management of oily sludges, spent catalystsand spent caustic. For these waste categories increased use is made of third-party wastecontractors for off-site recovery or disposal. The Environmental Management Act (Wm)governs legal disposal and two EU-Directives cover the classification, packing and labelling ofhazardous substances. As regards the export of hazardous waste a similar procedure exists aslaid down in the Basle Convention on the Control of Transboundary Movements of HazardousWaste and their Disposal.
Soil and groundwaterContaminated soil and polluted groundwater are relevant environmental issues for refineries.The Dutch Soil Protection Act (Wbb) stipulates no risk to people and the environment, multi-functionality of the soil, the duty of care, prevention of migration of pollutants beyond locationboundaries (isolate, manage and control) in case of historical soil pollution. Soil andgroundwater cleaning is obligatory if the so-called intervention values, as defined percomponent and for each soil type, are exceeded and if the extent of the pollution indicates theseriousness of the pollution. The urgency of the clean-up is determined by the migration rateand the risk to the threatened objects in the actual situation. Contaminated soil is an increasingproblem for refineries. In all refineries measures have been taken at least to make an inventoryof the soil and groundwater pollution and, where needed, measures are taken to preventmigration. In one refinery preventive measures for soil pollution had been included right fromthe design stage.
NoiseThe Netherlands has an integrated policy for noise, and aims for a proper inventory of noisesources and a planned abatement programme. Germany, Switzerland, Austria, France and theScandinavian countries are developing similar policies on noise.
Nowadays noise level contour values and monitoring obligations are included in permitrequirements of the refineries. Typical for industrial noise requirements in urban areas in mostcountries are maximum allowable limits between 55 and 73 dB(A) during daytime and 45-66dB(A) during the night.
United KingdomThe UK does not have standard emission limit values for refineries, but their guidance notesprovide expected BAT levels for new plant units. Existing unit operations should meetBATNEEC standarts (Best Available Techniques Not Entailing Excessive Cost).
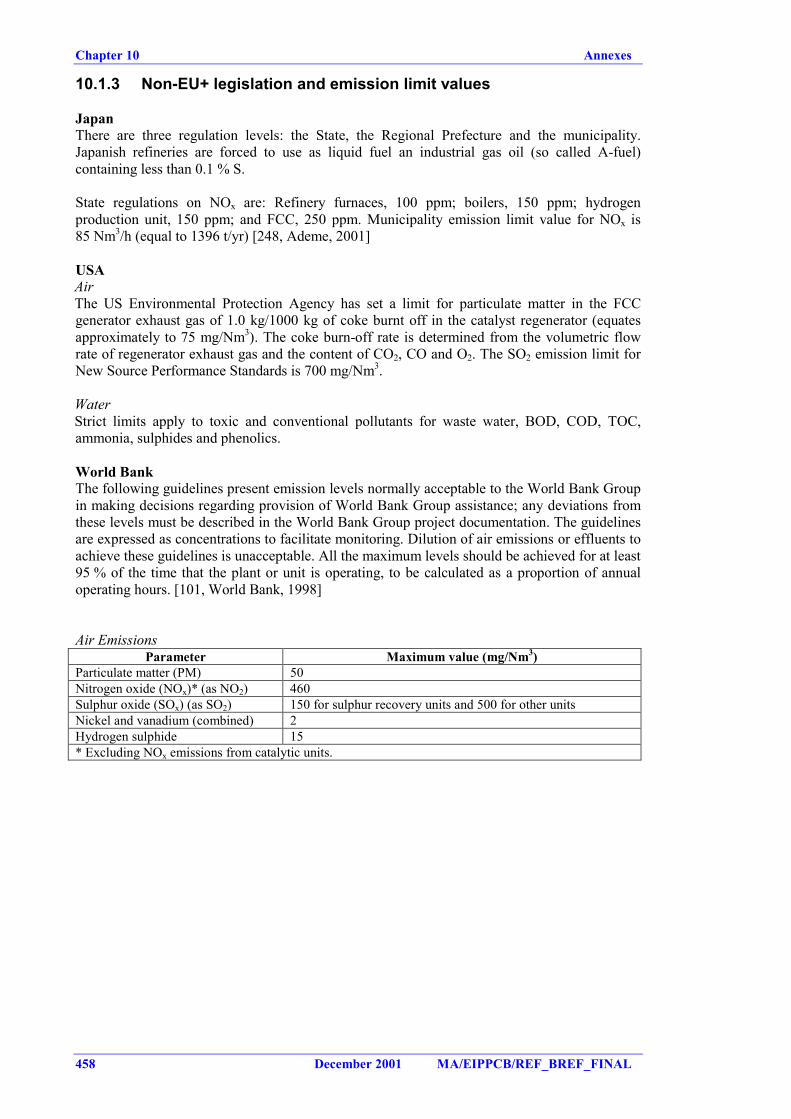
Chapter 10 Annexes
458 December 2001 MA/EIPPCB/REF_BREF_FINAL
10.1.3 Non-EU+ legislation and emission limit values
JapanThere are three regulation levels: the State, the Regional Prefecture and the municipality.Japanish refineries are forced to use as liquid fuel an industrial gas oil (so called A-fuel)containing less than 0.1 % S.
State regulations on NOx are: Refinery furnaces, 100 ppm; boilers, 150 ppm; hydrogenproduction unit, 150 ppm; and FCC, 250 ppm. Municipality emission limit value for NOx is85 Nm3/h (equal to 1396 t/yr) [248, Ademe, 2001]
USAAirThe US Environmental Protection Agency has set a limit for particulate matter in the FCCgenerator exhaust gas of 1.0 kg/1000 kg of coke burnt off in the catalyst regenerator (equatesapproximately to 75 mg/Nm3). The coke burn-off rate is determined from the volumetric flowrate of regenerator exhaust gas and the content of CO2, CO and O2. The SO2 emission limit forNew Source Performance Standards is 700 mg/Nm3.
WaterStrict limits apply to toxic and conventional pollutants for waste water, BOD, COD, TOC,ammonia, sulphides and phenolics.
World BankThe following guidelines present emission levels normally acceptable to the World Bank Groupin making decisions regarding provision of World Bank Group assistance; any deviations fromthese levels must be described in the World Bank Group project documentation. The guidelinesare expressed as concentrations to facilitate monitoring. Dilution of air emissions or effluents toachieve these guidelines is unacceptable. All the maximum levels should be achieved for at least95 % of the time that the plant or unit is operating, to be calculated as a proportion of annualoperating hours. [101, World Bank, 1998]
Air EmissionsParameter Maximum value (mg/Nm3)
Particulate matter (PM) 50Nitrogen oxide (NOx)* (as NO2) 460Sulphur oxide (SOx) (as SO2) 150 for sulphur recovery units and 500 for other unitsNickel and vanadium (combined) 2Hydrogen sulphide 15* Excluding NOx emissions from catalytic units.
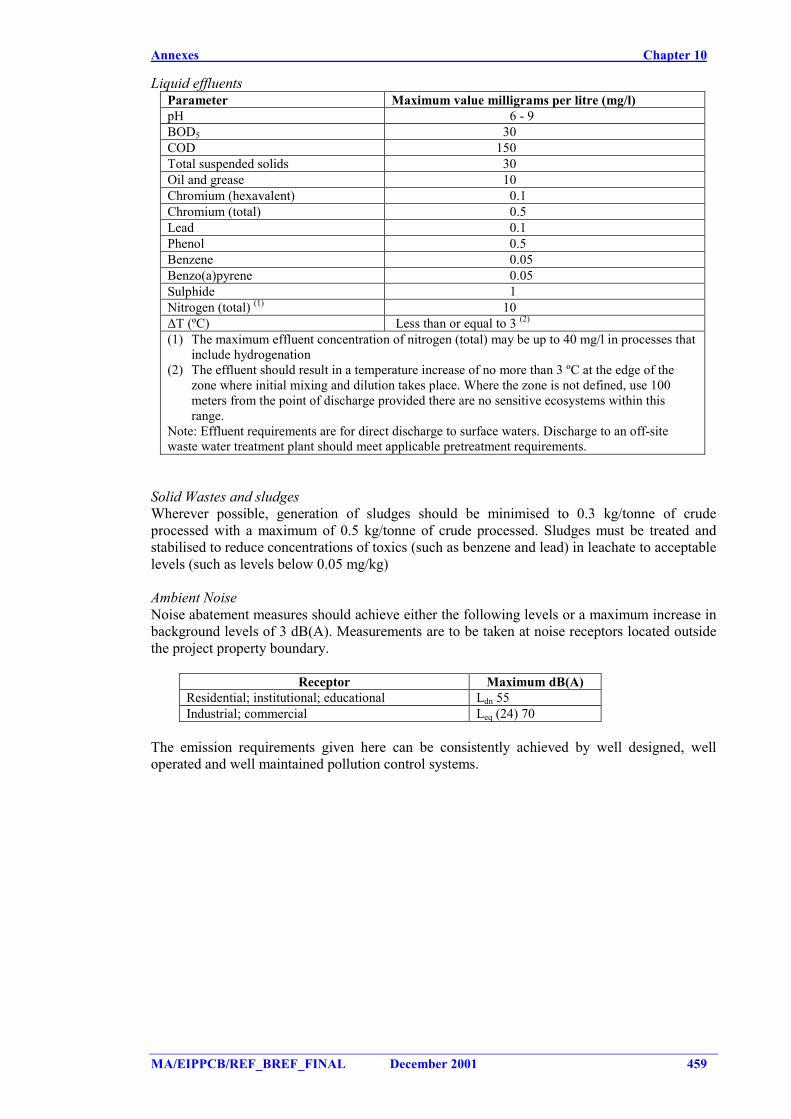
Annexes Chapter 10
MA/EIPPCB/REF_BREF_FINAL December 2001 459
Liquid effluentsParameter Maximum value milligrams per litre (mg/l)pH 6 - 9BOD5 30COD 150Total suspended solids 30Oil and grease 10Chromium (hexavalent) 0.1Chromium (total) 0.5Lead 0.1Phenol 0.5Benzene 0.05Benzo(a)pyrene 0.05Sulphide 1Nitrogen (total) (1) 10∆T (ºC) Less than or equal to 3 (2)
(1) The maximum effluent concentration of nitrogen (total) may be up to 40 mg/l in processes thatinclude hydrogenation
(2) The effluent should result in a temperature increase of no more than 3 ºC at the edge of thezone where initial mixing and dilution takes place. Where the zone is not defined, use 100meters from the point of discharge provided there are no sensitive ecosystems within thisrange.
Note: Effluent requirements are for direct discharge to surface waters. Discharge to an off-sitewaste water treatment plant should meet applicable pretreatment requirements.
Solid Wastes and sludgesWherever possible, generation of sludges should be minimised to 0.3 kg/tonne of crudeprocessed with a maximum of 0.5 kg/tonne of crude processed. Sludges must be treated andstabilised to reduce concentrations of toxics (such as benzene and lead) in leachate to acceptablelevels (such as levels below 0.05 mg/kg)
Ambient NoiseNoise abatement measures should achieve either the following levels or a maximum increase inbackground levels of 3 dB(A). Measurements are to be taken at noise receptors located outsidethe project property boundary.
Receptor Maximum dB(A)Residential; institutional; educational Ldn 55Industrial; commercial Leq (24) 70
The emission requirements given here can be consistently achieved by well designed, welloperated and well maintained pollution control systems.
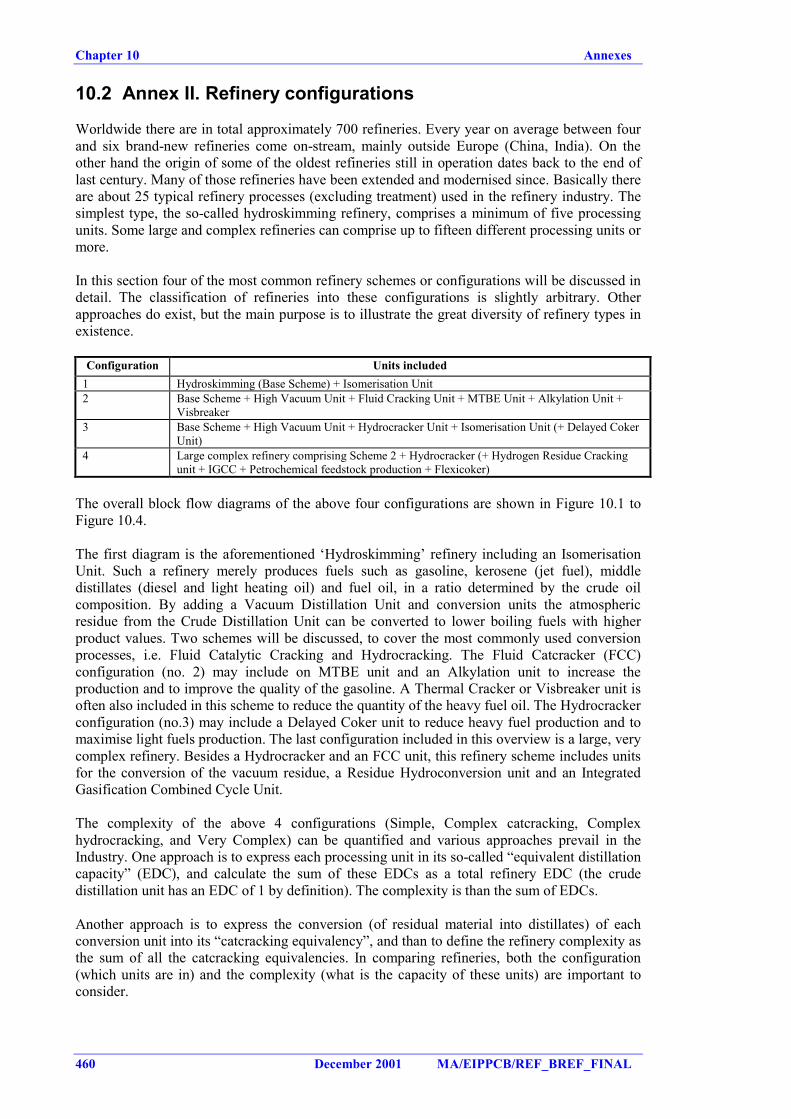
Chapter 10 Annexes
460 December 2001 MA/EIPPCB/REF_BREF_FINAL
10.2 Annex II. Refinery configurations
Worldwide there are in total approximately 700 refineries. Every year on average between fourand six brand-new refineries come on-stream, mainly outside Europe (China, India). On theother hand the origin of some of the oldest refineries still in operation dates back to the end oflast century. Many of those refineries have been extended and modernised since. Basically thereare about 25 typical refinery processes (excluding treatment) used in the refinery industry. Thesimplest type, the so-called hydroskimming refinery, comprises a minimum of five processingunits. Some large and complex refineries can comprise up to fifteen different processing units ormore.
In this section four of the most common refinery schemes or configurations will be discussed indetail. The classification of refineries into these configurations is slightly arbitrary. Otherapproaches do exist, but the main purpose is to illustrate the great diversity of refinery types inexistence.
Configuration Units included1 Hydroskimming (Base Scheme) + Isomerisation Unit2 Base Scheme + High Vacuum Unit + Fluid Cracking Unit + MTBE Unit + Alkylation Unit +
Visbreaker3 Base Scheme + High Vacuum Unit + Hydrocracker Unit + Isomerisation Unit (+ Delayed Coker
Unit)4 Large complex refinery comprising Scheme 2 + Hydrocracker (+ Hydrogen Residue Cracking
unit + IGCC + Petrochemical feedstock production + Flexicoker)
The overall block flow diagrams of the above four configurations are shown in Figure 10.1 toFigure 10.4.
The first diagram is the aforementioned ‘Hydroskimming’ refinery including an IsomerisationUnit. Such a refinery merely produces fuels such as gasoline, kerosene (jet fuel), middledistillates (diesel and light heating oil) and fuel oil, in a ratio determined by the crude oilcomposition. By adding a Vacuum Distillation Unit and conversion units the atmosphericresidue from the Crude Distillation Unit can be converted to lower boiling fuels with higherproduct values. Two schemes will be discussed, to cover the most commonly used conversionprocesses, i.e. Fluid Catalytic Cracking and Hydrocracking. The Fluid Catcracker (FCC)configuration (no. 2) may include on MTBE unit and an Alkylation unit to increase theproduction and to improve the quality of the gasoline. A Thermal Cracker or Visbreaker unit isoften also included in this scheme to reduce the quantity of the heavy fuel oil. The Hydrocrackerconfiguration (no.3) may include a Delayed Coker unit to reduce heavy fuel production and tomaximise light fuels production. The last configuration included in this overview is a large, verycomplex refinery. Besides a Hydrocracker and an FCC unit, this refinery scheme includes unitsfor the conversion of the vacuum residue, a Residue Hydroconversion unit and an IntegratedGasification Combined Cycle Unit.
The complexity of the above 4 configurations (Simple, Complex catcracking, Complexhydrocracking, and Very Complex) can be quantified and various approaches prevail in theIndustry. One approach is to express each processing unit in its so-called “equivalent distillationcapacity” (EDC), and calculate the sum of these EDCs as a total refinery EDC (the crudedistillation unit has an EDC of 1 by definition). The complexity is than the sum of EDCs.
Another approach is to express the conversion (of residual material into distillates) of eachconversion unit into its “catcracking equivalency”, and than to define the refinery complexity asthe sum of all the catcracking equivalencies. In comparing refineries, both the configuration(which units are in) and the complexity (what is the capacity of these units) are important toconsider.
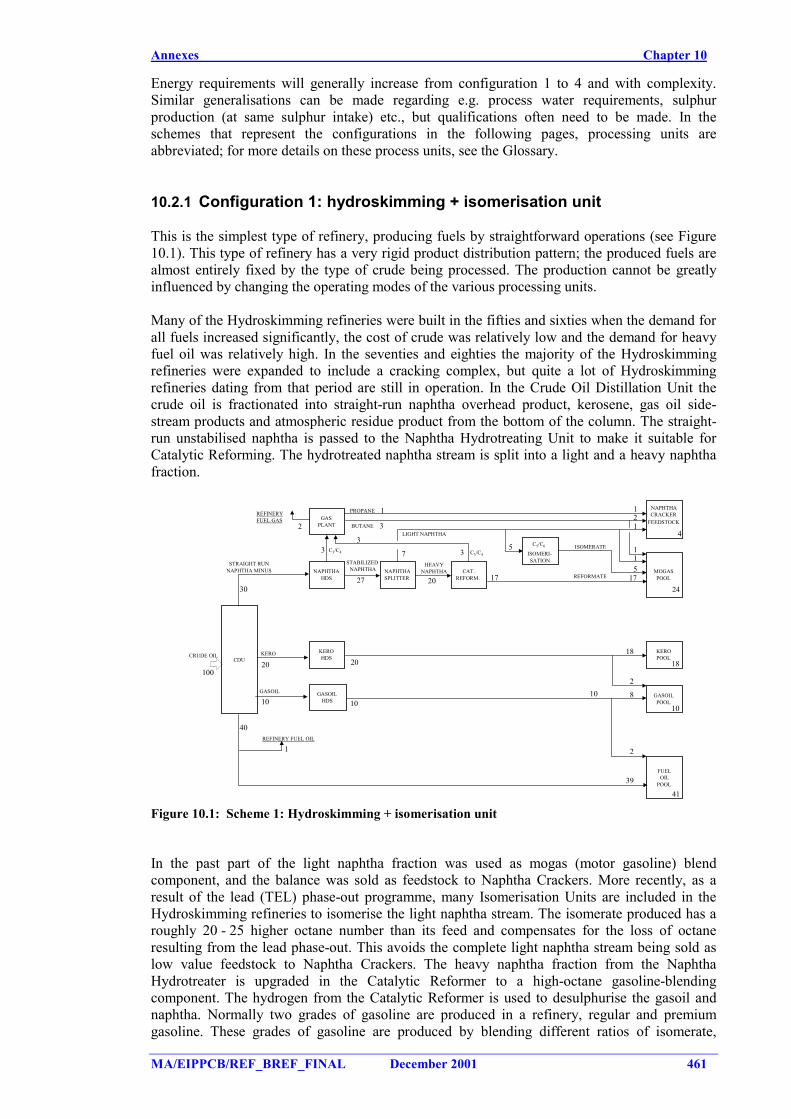
Annexes Chapter 10
MA/EIPPCB/REF_BREF_FINAL December 2001 461
Energy requirements will generally increase from configuration 1 to 4 and with complexity.Similar generalisations can be made regarding e.g. process water requirements, sulphurproduction (at same sulphur intake) etc., but qualifications often need to be made. In theschemes that represent the configurations in the following pages, processing units areabbreviated; for more details on these process units, see the Glossary.
10.2.1 Configuration 1: hydroskimming + isomerisation unit
This is the simplest type of refinery, producing fuels by straightforward operations (see Figure10.1). This type of refinery has a very rigid product distribution pattern; the produced fuels arealmost entirely fixed by the type of crude being processed. The production cannot be greatlyinfluenced by changing the operating modes of the various processing units.
Many of the Hydroskimming refineries were built in the fifties and sixties when the demand forall fuels increased significantly, the cost of crude was relatively low and the demand for heavyfuel oil was relatively high. In the seventies and eighties the majority of the Hydroskimmingrefineries were expanded to include a cracking complex, but quite a lot of Hydroskimmingrefineries dating from that period are still in operation. In the Crude Oil Distillation Unit thecrude oil is fractionated into straight-run naphtha overhead product, kerosene, gas oil side-stream products and atmospheric residue product from the bottom of the column. The straight-run unstabilised naphtha is passed to the Naphtha Hydrotreating Unit to make it suitable forCatalytic Reforming. The hydrotreated naphtha stream is split into a light and a heavy naphthafraction.
CDU
FUELOIL
POOL
KEROPOOL
GASOILPOOL
MOGASPOOL
GASPLANT
GASOILHDS
KEROHDS
CAT.REFORM.
NAPHTHASPLITTER
NAPHTHAHDS
NAPHTHACRACKER
FEEDSTOCK
4C5/C6
ISOMERI-SATIONSTABILIZED
NAPHTHA
PROPANE
BUTANE
C3/C4
REFORMATE
HEAVYNAPHTHA
STRAIGHT RUNNAPHTHA MINUS
KERO
GASOIL
CRUDE OIL
ISOMERATE
LIGHT NAPHTHA
10020
10
20
10
40
30
3
27 20
7
3
1 12
115
1717
5
1
24
18
2
8
2
18
10
39
41
10
33
REFINERY FUEL OIL
1
2
REFINERYFUEL GAS
C3/C4
Figure 10.1: Scheme 1: Hydroskimming + isomerisation unit
In the past part of the light naphtha fraction was used as mogas (motor gasoline) blendcomponent, and the balance was sold as feedstock to Naphtha Crackers. More recently, as aresult of the lead (TEL) phase-out programme, many Isomerisation Units are included in theHydroskimming refineries to isomerise the light naphtha stream. The isomerate produced has aroughly 20 - 25 higher octane number than its feed and compensates for the loss of octaneresulting from the lead phase-out. This avoids the complete light naphtha stream being sold aslow value feedstock to Naphtha Crackers. The heavy naphtha fraction from the NaphthaHydrotreater is upgraded in the Catalytic Reformer to a high-octane gasoline-blendingcomponent. The hydrogen from the Catalytic Reformer is used to desulphurise the gasoil andnaphtha. Normally two grades of gasoline are produced in a refinery, regular and premiumgasoline. These grades of gasoline are produced by blending different ratios of isomerate,
Chapter 10 Annexes
462 December 2001 MA/EIPPCB/REF_BREF_FINAL
reformate and butane. Saturated light hydrocarbons from the CDU Naphtha Hydrotreater,Isomerisation Unit and Catalytic Reformer Unit are sent to the Gas Plant. Propane from the GasPlant is either sold directly as propane product or blended with butane to be sold as LPG. Aproportion of the butanes produced in the Gas Plant is used as blend stock for the mogas pool,the remainder of the butanes are either blended with propane to be sold as LPG or directly soldas butane product. The components lighter than propane are sent to the refinery fuel gas system.Straight-run kerosene is often hydrotreated in the Kero Hydrotreating Unit (or kero HDS) andrun down as jet fuel. Normally a portion of the hydrotreated kerosene is used as blendingcomponent for the automotive diesel oil pool.
Straight-run gas oil is hydrotreated in the Gas Oil Hydrotreating Unit to reduce its sulphurcontent. Automotive diesel oil is produced by blending desulphurised kerosene withdesulphurised gas oil. Heating oil and marine diesel oil (MDO) are produced by blendingdesulphurised gasoil with straight-run gasoil. Both products have higher maximum allowablesulphur contents than diesel oil. Heavy fuel oil is produced from atmospheric residue withadjustment for viscosity and sulphur content by addition of desulphurised gas oil. In some casesthe atmospheric residue is thermally cracked. This is not indicated in the configuration scheme.The sour off-gases from the Naphtha Hydrotreater, the Kerosene and Gas Oil Hydrotreatingunits (or Gasoil HDS) are treated in the Amine Treating Unit to remove H2S and other sourcomponents present, prior to being sent to the refinery fuel gas system. The sour LPG streamfrom the Naphtha Hydrotreater is also treated in the Amine Unit to reduce its sulphur contentbefore combining with the sweet LPG stream from the Catalytic Reformers. Sour waste waterfrom all process units is stripped, prior to utilisation as wash water in the Desalter and finalpurification in Effluent Water Treating facilities. The sour off-gas from the Sour Water Stripperis combined with the H2S rich-off gas from the Amine Unit and sent to a Sulphur Recovery Unit(SRU), where the H2S is converted to elemental sulphur, and a nearly sulphur-free off-gas isvented to the atmosphere.
10.2.2 Configuration 2: catcracker configuration
Scheme 2 is a configuration whereby the Hydroskimming refinery is extended with a HighVacuum Unit (HVU), a Fluid Catalytic Cracking Unit (FCCU) and a Visbreaker Unit (VBU). Inthis refinery configuration a considerable part of the atmospheric residue is converted intolighter fuel components (see Figure 10.2.). As a result the production of residual fuel oil and/orthe export of atmospheric residue is considerably reduced. FCC units are specifically designedto increase the production of gasoline. Depending on the refinery market and strategy, asignificant quantity of kerosene can also be produced, when the heavier fraction of thecatcracked naphtha is separated and hydrotreated along with the straight-run kerosene product.The overall yield of middle distillates is also increased due to the production of ‘light cycle oil’.
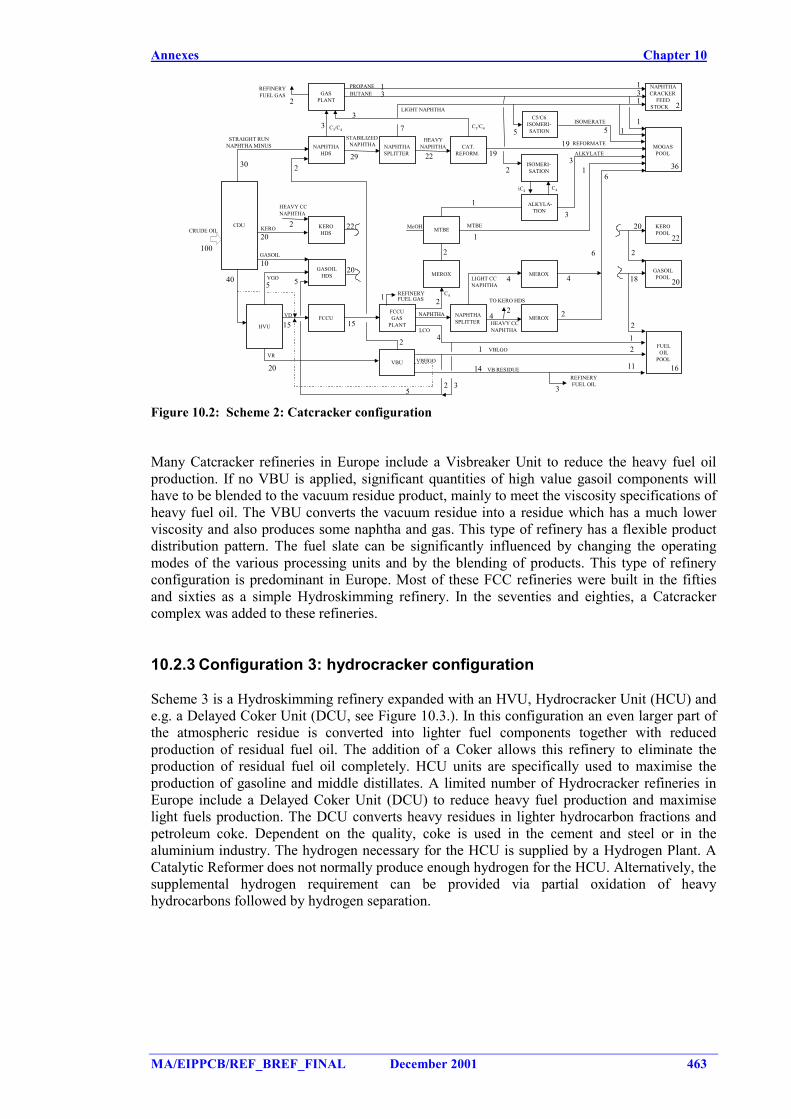
Annexes Chapter 10
MA/EIPPCB/REF_BREF_FINAL December 2001 463
CDU
FUELOIL
POOL
KEROPOOL
GASOILPOOL
FCCUGAS
PLANTFCCU
VBU
HVU
MOGASPOOL
GASPLANT
GASOILHDS
KEROHDS
CAT.REFORM.
NAPHTHASPLITTER
NAPHTHAHDS
MEROX
NAPHTHACRACKER
FEEDSTOCK
ISOMERI-SATION
ALKYLA-TION
STABILIZED NAPHTHA
PROPANEBUTANE
ALKYLATE
REFORMATEHEAVYNAPHTHA
STRAIGHT RUNNAPHTHA MINUS
MTBE
MEROX
NAPHTHASPLITTER
MEROX
MTBE
C4
MeOHKERO
GASOIL
HEAVY CCNAPHTHA
TO KERO HDS
VBLGO
VB RESIDUEVBHGO
HEAVY CCNAPHTHA
VGO
VR
VD
LCO
NAPHTHA
LIGHT CCNAPHTHA
CRUDE OIL
iC4 C4
REFINERYFUEL GAS
LIGHT NAPHTHAC5/C6
ISOMERI-SATION
ISOMERATE
100
40
10
20
5
15
20
15
2
1 2
4
2
325
1
14
4 2
4 4
11
212
16
18
2
20
2022
2
1
13
6
30 229
33
13
7
22 19
2
5
1
1
1
3
5 1
3
19
16
36
2
REFINERYFUEL GAS
REFINERYFUEL OIL
3
520
22
2
C3/C4C3/C4
2
Figure 10.2: Scheme 2: Catcracker configuration
Many Catcracker refineries in Europe include a Visbreaker Unit to reduce the heavy fuel oilproduction. If no VBU is applied, significant quantities of high value gasoil components willhave to be blended to the vacuum residue product, mainly to meet the viscosity specifications ofheavy fuel oil. The VBU converts the vacuum residue into a residue which has a much lowerviscosity and also produces some naphtha and gas. This type of refinery has a flexible productdistribution pattern. The fuel slate can be significantly influenced by changing the operatingmodes of the various processing units and by the blending of products. This type of refineryconfiguration is predominant in Europe. Most of these FCC refineries were built in the fiftiesand sixties as a simple Hydroskimming refinery. In the seventies and eighties, a Catcrackercomplex was added to these refineries.
10.2.3 Configuration 3: hydrocracker configuration
Scheme 3 is a Hydroskimming refinery expanded with an HVU, Hydrocracker Unit (HCU) ande.g. a Delayed Coker Unit (DCU, see Figure 10.3.). In this configuration an even larger part ofthe atmospheric residue is converted into lighter fuel components together with reducedproduction of residual fuel oil. The addition of a Coker allows this refinery to eliminate theproduction of residual fuel oil completely. HCU units are specifically used to maximise theproduction of gasoline and middle distillates. A limited number of Hydrocracker refineries inEurope include a Delayed Coker Unit (DCU) to reduce heavy fuel production and maximiselight fuels production. The DCU converts heavy residues in lighter hydrocarbon fractions andpetroleum coke. Dependent on the quality, coke is used in the cement and steel or in thealuminium industry. The hydrogen necessary for the HCU is supplied by a Hydrogen Plant. ACatalytic Reformer does not normally produce enough hydrogen for the HCU. Alternatively, thesupplemental hydrogen requirement can be provided via partial oxidation of heavyhydrocarbons followed by hydrogen separation.
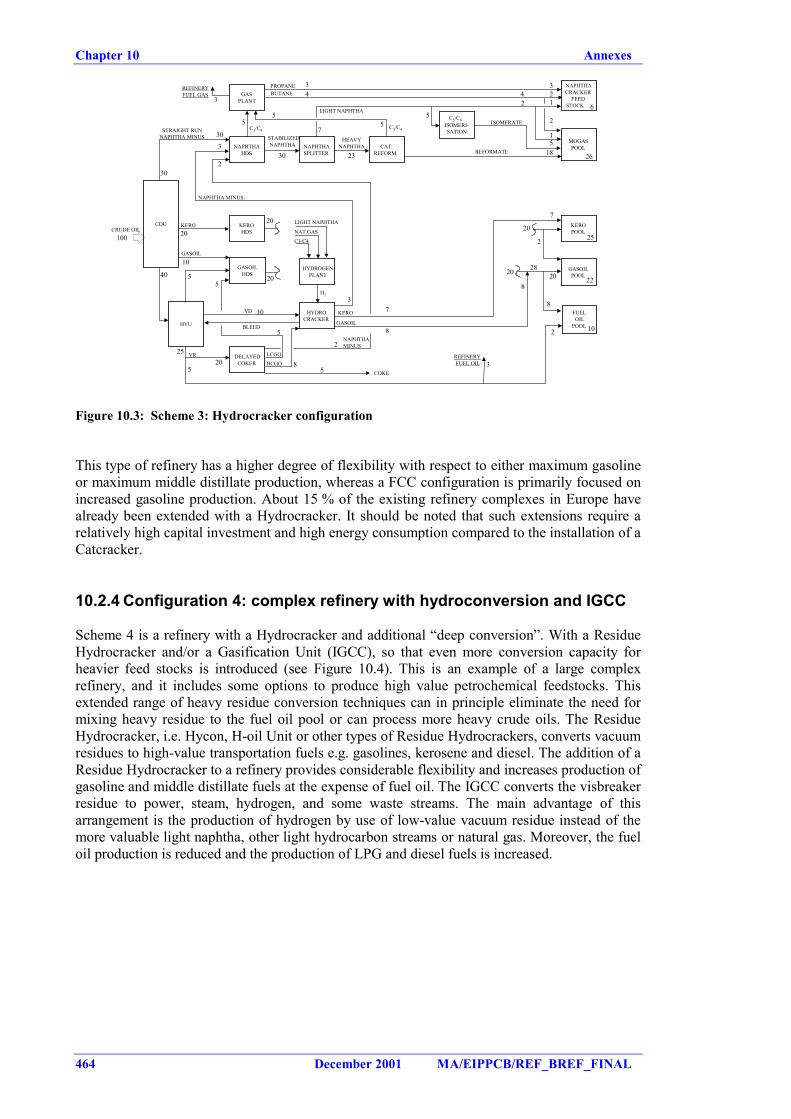
Chapter 10 Annexes
464 December 2001 MA/EIPPCB/REF_BREF_FINAL
CDU
FUELOIL
POOL
KEROPOOL
GASOILPOOL
HYDROCRACKER
DELAYEDCOKER
HVU
MOGASPOOL
GASPLANT
GASOILHDS
KEROHDS
CAT.REFORM.
NAPHTHASPLITTER
NAPHTHAHDS
NAPHTHACRACKER
FEEDSTOCK
C3/C4
STABILIZED NAPHTHA
PROPANEBUTANE
C3/C4
REFORMATE
STRAIGHT RUNNAPHTHA MINUS
KERO
GASOIL
VR
VD
GASOIL
NAPHTHA MINUS
CRUDE OIL
H2
BLEED
KERO
HYDROGENPLANT
C3/C4
NAT.GAS
LIGHT NAPHTHA
HCGO
COKE
NAPHTHAMINUS
LCGO
HEAVYNAPHTHA
LIGHT NAPHTHAC5/C6
ISOMERI-SATION
ISOMERATE
100
40
10
20
30
20
2055
10
2520
5 58
2
5
7
8
20
8
2820
2
8
REFINERYFUEL OIL
20
2
10
22
25
7
30
3
2
5
30 23
75
5 5
5
321
2
18
1
24
26
3
3
REFINERYFUEL GAS
3
34
6
Figure 10.3: Scheme 3: Hydrocracker configuration
This type of refinery has a higher degree of flexibility with respect to either maximum gasolineor maximum middle distillate production, whereas a FCC configuration is primarily focused onincreased gasoline production. About 15 % of the existing refinery complexes in Europe havealready been extended with a Hydrocracker. It should be noted that such extensions require arelatively high capital investment and high energy consumption compared to the installation of aCatcracker.
10.2.4 Configuration 4: complex refinery with hydroconversion and IGCC
Scheme 4 is a refinery with a Hydrocracker and additional “deep conversion”. With a ResidueHydrocracker and/or a Gasification Unit (IGCC), so that even more conversion capacity forheavier feed stocks is introduced (see Figure 10.4). This is an example of a large complexrefinery, and it includes some options to produce high value petrochemical feedstocks. Thisextended range of heavy residue conversion techniques can in principle eliminate the need formixing heavy residue to the fuel oil pool or can process more heavy crude oils. The ResidueHydrocracker, i.e. Hycon, H-oil Unit or other types of Residue Hydrocrackers, converts vacuumresidues to high-value transportation fuels e.g. gasolines, kerosene and diesel. The addition of aResidue Hydrocracker to a refinery provides considerable flexibility and increases production ofgasoline and middle distillate fuels at the expense of fuel oil. The IGCC converts the visbreakerresidue to power, steam, hydrogen, and some waste streams. The main advantage of thisarrangement is the production of hydrogen by use of low-value vacuum residue instead of themore valuable light naphtha, other light hydrocarbon streams or natural gas. Moreover, the fueloil production is reduced and the production of LPG and diesel fuels is increased.
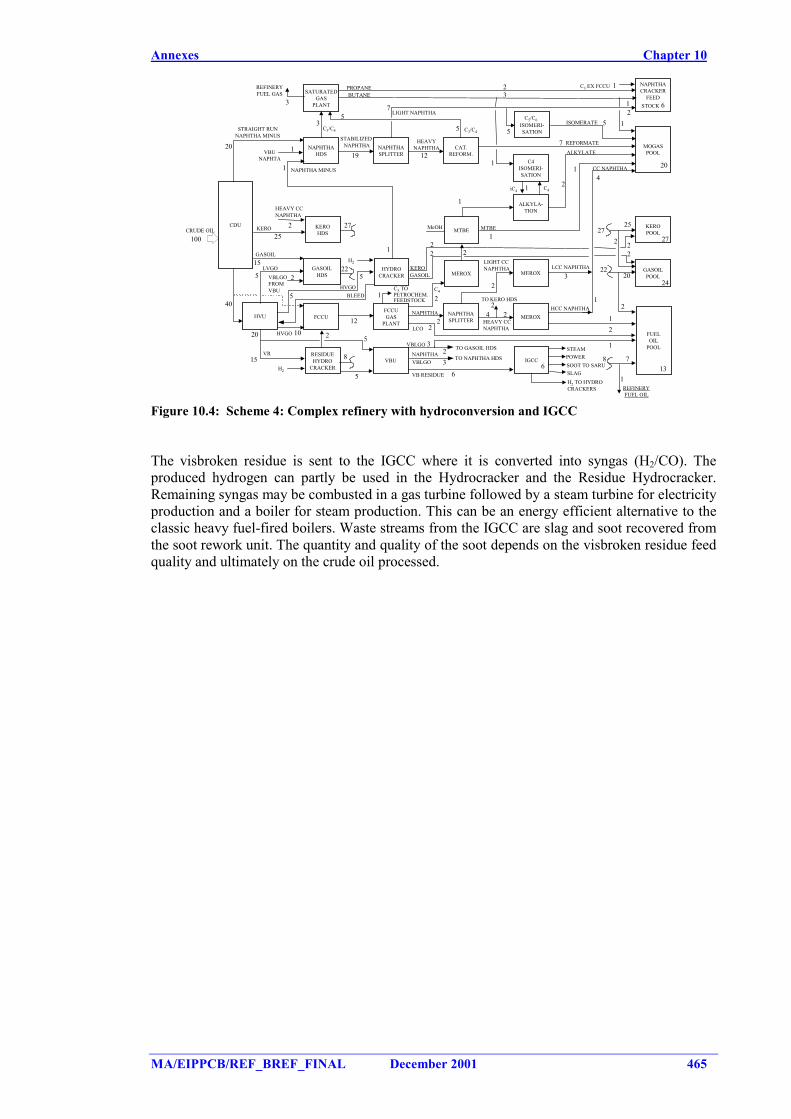
Annexes Chapter 10
MA/EIPPCB/REF_BREF_FINAL December 2001 465
CDU
FUELOIL
POOL
KEROPOOL
GASOILPOOL
FCCUGAS
PLANTFCCU
VBU
HVU
MOGASPOOL
SATURATEDGAS
PLANT
GASOILHDS
KEROHDS
CAT.REFORM.
NAPHTHASPLITTER
NAPHTHAHDS
MEROX
NAPHTHACRACKER
FEEDSTOCK 6
C4ISOMERI-SATION
ALKYLA-TION
STABILIZED NAPHTHA
LIGHT NAPHTHA
PROPANEBUTANE
ALKYLATE
REFORMATEHEAVYNAPHTHA
STRAIGHT RUNNAPHTHA MINUS
MTBE
MEROX
NAPHTHASPLITTER
MEROX
MTBE
C4
MeOHKERO
GASOIL
HEAVY CCNAPHTHA
TO KERO HDS
VBLGO 3
VB RESIDUE
HEAVY CCNAPHTHA
LVGO
VR
LCO
NAPHTHA
LIGHT CCNAPHTHA
CRUDE OIL
HYDROCRACKER
TO NAPHTHA HDSRESIDUEHYDRO
CRACKER
C3 TOPETROCHEM.FEEDSTOCK
IGCC
H2
TO GASOIL HDS
VBLGOFROMVBU
ISOMERI-SATION
ISOMERATE
KEROGASOIL
HVGOBLEED
NAPHTHA MINUS
HVGO 10
H2
STEAMPOWER
SLAGSOOT TO SARU
NAPHTHA
H2 TO HYDROCRACKERS
CC NAPHTHA
LCC NAPHTHA
HCC NAPHTHA
100
40
25
15
5
20VBU
NAPHTA
1
1
3
19 12
7
5
5
2 27
23
21
1
55
7
1
1
2
1
2725
227
20
C3 EX FCCU 1
14
REFINERYFUEL GAS
3
20 5
15
2
5
5
12
5
222
1
82
2
6
2
VBLGO 3
21
22
2
2
224
1
2
22
2
20
2
3
1
24
12
1
76 13
REFINERYFUEL OIL
1
8
C3/C4C3/C4
C5/C6
iC4 C4
Figure 10.4: Scheme 4: Complex refinery with hydroconversion and IGCC
The visbroken residue is sent to the IGCC where it is converted into syngas (H2/CO). Theproduced hydrogen can partly be used in the Hydrocracker and the Residue Hydrocracker.Remaining syngas may be combusted in a gas turbine followed by a steam turbine for electricityproduction and a boiler for steam production. This can be an energy efficient alternative to theclassic heavy fuel-fired boilers. Waste streams from the IGCC are slag and soot recovered fromthe soot rework unit. The quantity and quality of the soot depends on the visbroken residue feedquality and ultimately on the crude oil processed.
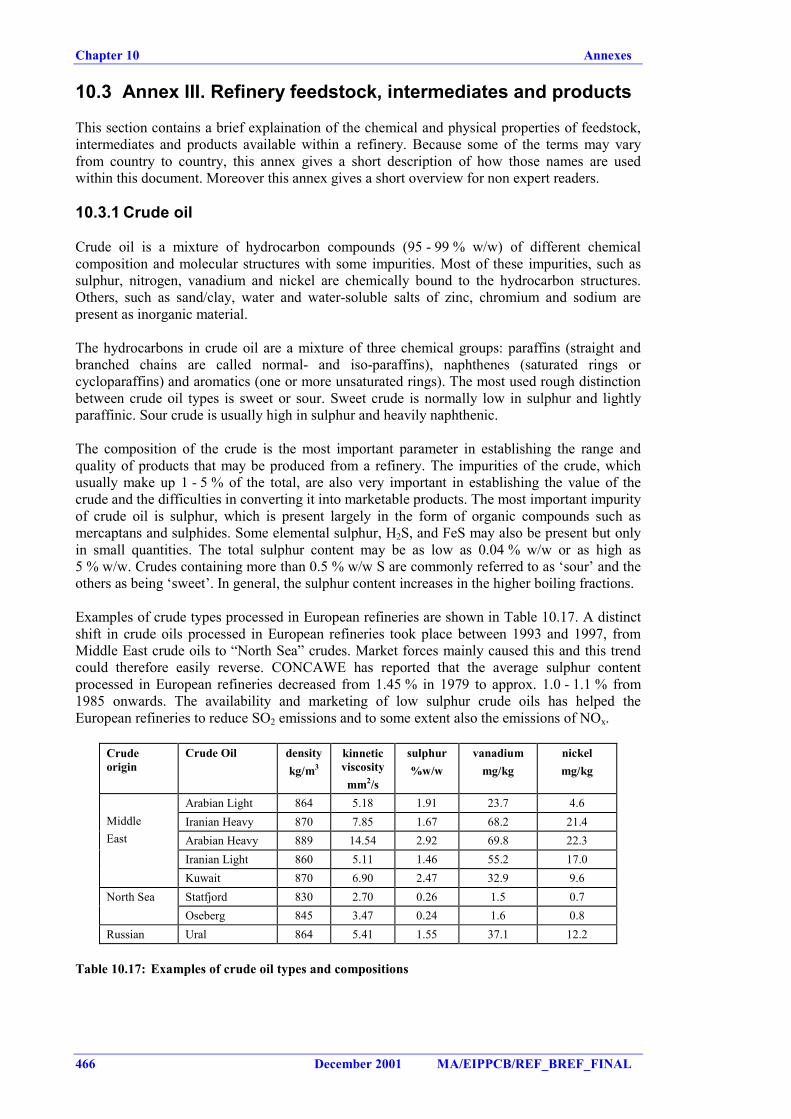
Chapter 10 Annexes
466 December 2001 MA/EIPPCB/REF_BREF_FINAL
10.3 Annex III. Refinery feedstock, intermediates and products
This section contains a brief explaination of the chemical and physical properties of feedstock,intermediates and products available within a refinery. Because some of the terms may varyfrom country to country, this annex gives a short description of how those names are usedwithin this document. Moreover this annex gives a short overview for non expert readers.
10.3.1 Crude oil
Crude oil is a mixture of hydrocarbon compounds (95 - 99 % w/w) of different chemicalcomposition and molecular structures with some impurities. Most of these impurities, such assulphur, nitrogen, vanadium and nickel are chemically bound to the hydrocarbon structures.Others, such as sand/clay, water and water-soluble salts of zinc, chromium and sodium arepresent as inorganic material.
The hydrocarbons in crude oil are a mixture of three chemical groups: paraffins (straight andbranched chains are called normal- and iso-paraffins), naphthenes (saturated rings orcycloparaffins) and aromatics (one or more unsaturated rings). The most used rough distinctionbetween crude oil types is sweet or sour. Sweet crude is normally low in sulphur and lightlyparaffinic. Sour crude is usually high in sulphur and heavily naphthenic.
The composition of the crude is the most important parameter in establishing the range andquality of products that may be produced from a refinery. The impurities of the crude, whichusually make up 1 - 5 % of the total, are also very important in establishing the value of thecrude and the difficulties in converting it into marketable products. The most important impurityof crude oil is sulphur, which is present largely in the form of organic compounds such asmercaptans and sulphides. Some elemental sulphur, H2S, and FeS may also be present but onlyin small quantities. The total sulphur content may be as low as 0.04 % w/w or as high as5 % w/w. Crudes containing more than 0.5 % w/w S are commonly referred to as ‘sour’ and theothers as being ‘sweet’. In general, the sulphur content increases in the higher boiling fractions.
Examples of crude types processed in European refineries are shown in Table 10.17. A distinctshift in crude oils processed in European refineries took place between 1993 and 1997, fromMiddle East crude oils to “North Sea” crudes. Market forces mainly caused this and this trendcould therefore easily reverse. CONCAWE has reported that the average sulphur contentprocessed in European refineries decreased from 1.45 % in 1979 to approx. 1.0 - 1.1 % from1985 onwards. The availability and marketing of low sulphur crude oils has helped theEuropean refineries to reduce SO2 emissions and to some extent also the emissions of NOx.
Crudeorigin
Crude Oil densitykg/m3
kinneticviscositymm2/s
sulphur%w/w
vanadiummg/kg
nickelmg/kg
Arabian Light 864 5.18 1.91 23.7 4.6Iranian Heavy 870 7.85 1.67 68.2 21.4Arabian Heavy 889 14.54 2.92 69.8 22.3Iranian Light 860 5.11 1.46 55.2 17.0
MiddleEast
Kuwait 870 6.90 2.47 32.9 9.6Statfjord 830 2.70 0.26 1.5 0.7North SeaOseberg 845 3.47 0.24 1.6 0.8
Russian Ural 864 5.41 1.55 37.1 12.2
Table 10.17: Examples of crude oil types and compositions
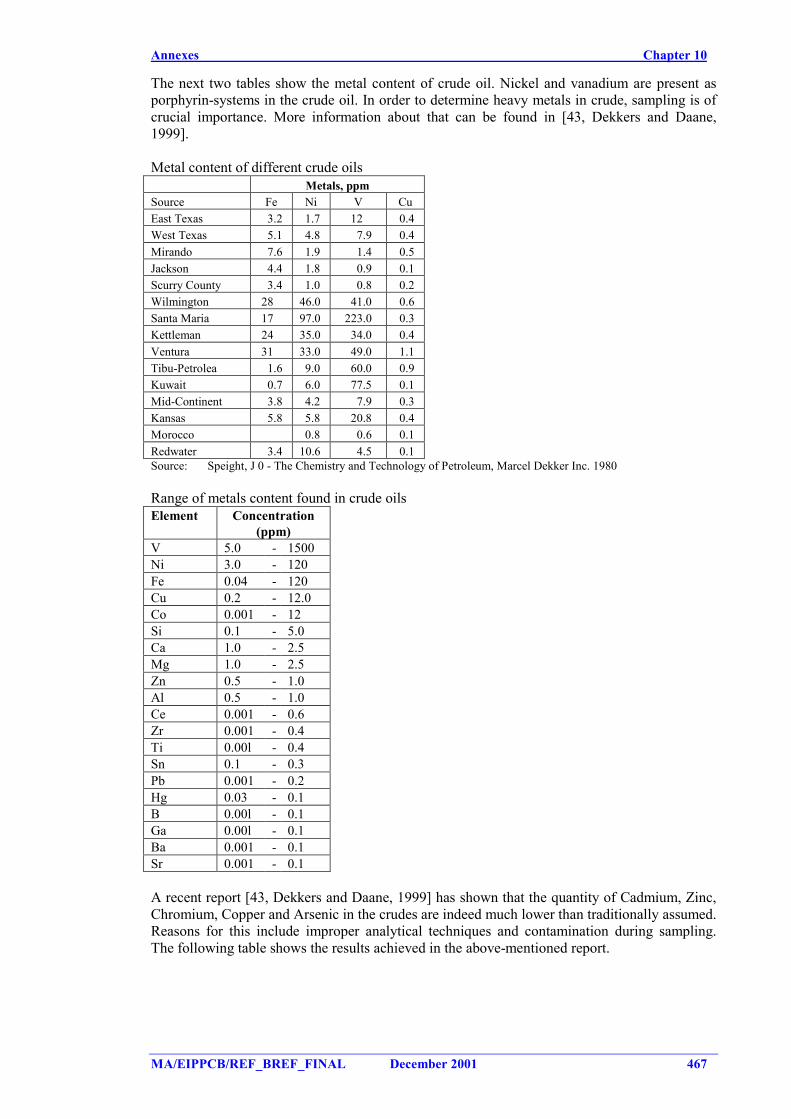
Annexes Chapter 10
MA/EIPPCB/REF_BREF_FINAL December 2001 467
The next two tables show the metal content of crude oil. Nickel and vanadium are present asporphyrin-systems in the crude oil. In order to determine heavy metals in crude, sampling is ofcrucial importance. More information about that can be found in [43, Dekkers and Daane,1999].
Metal content of different crude oilsMetals, ppm
Source Fe Ni V CuEast Texas 3.2 1.7 12 0.4West Texas 5.1 4.8 7.9 0.4Mirando 7.6 1.9 1.4 0.5Jackson 4.4 1.8 0.9 0.1Scurry County 3.4 1.0 0.8 0.2Wilmington 28 46.0 41.0 0.6Santa Maria 17 97.0 223.0 0.3Kettleman 24 35.0 34.0 0.4Ventura 31 33.0 49.0 1.1Tibu-Petrolea 1.6 9.0 60.0 0.9Kuwait 0.7 6.0 77.5 0.1Mid-Continent 3.8 4.2 7.9 0.3Kansas 5.8 5.8 20.8 0.4Morocco 0.8 0.6 0.1Redwater 3.4 10.6 4.5 0.1Source: Speight, J 0 - The Chemistry and Technology of Petroleum, Marcel Dekker Inc. 1980
Range of metals content found in crude oilsElement Concentration
(ppm)V 5.0 - 1500Ni 3.0 - 120Fe 0.04 - 120Cu 0.2 - 12.0Co 0.001 - 12Si 0.1 - 5.0Ca 1.0 - 2.5Mg 1.0 - 2.5Zn 0.5 - 1.0Al 0.5 - 1.0Ce 0.001 - 0.6Zr 0.001 - 0.4Ti 0.00l - 0.4Sn 0.1 - 0.3Pb 0.001 - 0.2Hg 0.03 - 0.1B 0.00l - 0.1Ga 0.00l - 0.1Ba 0.001 - 0.1Sr 0.001 - 0.1
A recent report [43, Dekkers and Daane, 1999] has shown that the quantity of Cadmium, Zinc,Chromium, Copper and Arsenic in the crudes are indeed much lower than traditionally assumed.Reasons for this include improper analytical techniques and contamination during sampling.The following table shows the results achieved in the above-mentioned report.
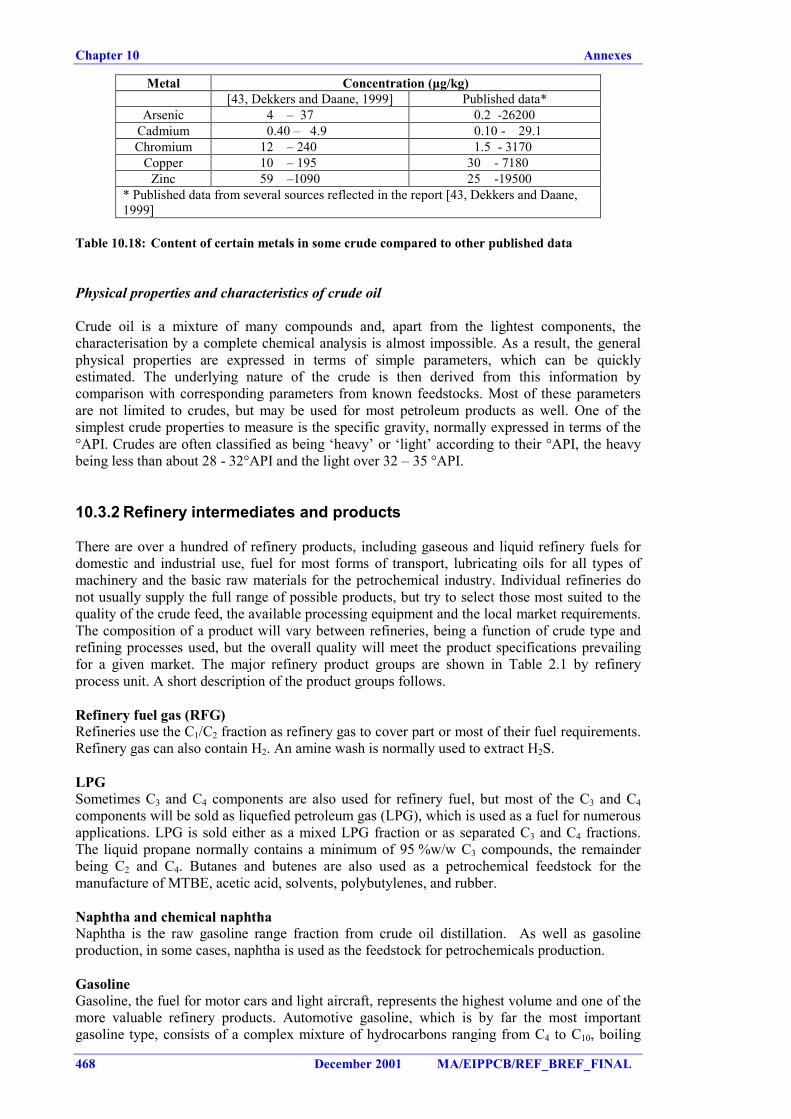
Chapter 10 Annexes
468 December 2001 MA/EIPPCB/REF_BREF_FINAL
Metal Concentration (µg/kg)[43, Dekkers and Daane, 1999] Published data*
Arsenic 4 – 37 0.2 -26200Cadmium 0.40 – 4.9 0.10 - 29.1Chromium 12 – 240 1.5 - 3170
Copper 10 – 195 30 - 7180Zinc 59 –1090 25 -19500
* Published data from several sources reflected in the report [43, Dekkers and Daane,1999]
Table 10.18: Content of certain metals in some crude compared to other published data
Physical properties and characteristics of crude oil
Crude oil is a mixture of many compounds and, apart from the lightest components, thecharacterisation by a complete chemical analysis is almost impossible. As a result, the generalphysical properties are expressed in terms of simple parameters, which can be quicklyestimated. The underlying nature of the crude is then derived from this information bycomparison with corresponding parameters from known feedstocks. Most of these parametersare not limited to crudes, but may be used for most petroleum products as well. One of thesimplest crude properties to measure is the specific gravity, normally expressed in terms of the°API. Crudes are often classified as being ‘heavy’ or ‘light’ according to their °API, the heavybeing less than about 28 - 32°API and the light over 32 – 35 °API.
10.3.2 Refinery intermediates and products
There are over a hundred of refinery products, including gaseous and liquid refinery fuels fordomestic and industrial use, fuel for most forms of transport, lubricating oils for all types ofmachinery and the basic raw materials for the petrochemical industry. Individual refineries donot usually supply the full range of possible products, but try to select those most suited to thequality of the crude feed, the available processing equipment and the local market requirements.The composition of a product will vary between refineries, being a function of crude type andrefining processes used, but the overall quality will meet the product specifications prevailingfor a given market. The major refinery product groups are shown in Table 2.1 by refineryprocess unit. A short description of the product groups follows.
Refinery fuel gas (RFG)Refineries use the C1/C2 fraction as refinery gas to cover part or most of their fuel requirements.Refinery gas can also contain H2. An amine wash is normally used to extract H2S.
LPGSometimes C3 and C4 components are also used for refinery fuel, but most of the C3 and C4components will be sold as liquefied petroleum gas (LPG), which is used as a fuel for numerousapplications. LPG is sold either as a mixed LPG fraction or as separated C3 and C4 fractions.The liquid propane normally contains a minimum of 95 %w/w C3 compounds, the remainderbeing C2 and C4. Butanes and butenes are also used as a petrochemical feedstock for themanufacture of MTBE, acetic acid, solvents, polybutylenes, and rubber.
Naphtha and chemical naphthaNaphtha is the raw gasoline range fraction from crude oil distillation. As well as gasolineproduction, in some cases, naphtha is used as the feedstock for petrochemicals production.
GasolineGasoline, the fuel for motor cars and light aircraft, represents the highest volume and one of themore valuable refinery products. Automotive gasoline, which is by far the most importantgasoline type, consists of a complex mixture of hydrocarbons ranging from C4 to C10, boiling
Annexes Chapter 10
MA/EIPPCB/REF_BREF_FINAL December 2001 469
between 38°C and 205°C. Most refiners produce gasoline in three or four octane grades, theprincipal difference being the anti-knock performance. Mogas is a term normally used for motorgasoline.
Jet fuel (kerosene, avtur)Jet fuel is the name given to kerosene or kerosene blends used as fuel in aviation turbines (hencealso called Avtur) by both commercial aviation and military aircraft. For most refineries theprimary source of jet fuel blending stocks is the straight-run kerosene fraction (C8 - C12) fromthe atmospheric crude unit. For a refinery with a Hydrocracker, kerosene boiling rangehydrocarbons from this unit can also meet jet fuel specifications, and is a major contributor tojet fuel production. Hydrotreated light Coker gas oil and thermally cracked gasoil can also beused as blending stock. In some developing countries kerosene is still the primary fuel forcooking and domestic heating.
Diesel oil / heating oil / gasoilDiesel fuels are produced by blending of kero and gas oil fractions from the crude distillationunit and gas oil fractions of the high vacuum unit and from conversion units. An upgraded andflexible processing scheme for desulphurisation of blending components is necessary in mostrefineries in order to arrive at the currently required and future sulphur specifications (500 ppmcurrently, 350 ppm from 2000 and 50 ppm from 2005 onwards). Light heating oils (kero/dieselfraction) are typically used for small domestic applications.
Middle distillates / distillate fuelsAlternative names for the fuels in the kerosene and gasoil boiling ranges.
Fuel oilsFuel oils cover a very wide range of applications and are produced in a variety of grades.Gasoils are sometimes referred to as fuel oils, but in Europe the term is usually used to describeheavy fuel oils (atmospheric residue) which are used for electricity etc. Heavy fuel oil are usedfor electricity or power generation by utility companies, or sold as bunker fuel oil for seagoingvessels. Refineries use heavier fractions from crude oil distillation, from vacuum distillation orfrom visbreaking for generation of heat, electricity and steam in their furnaces and boilers.
Heavy fuel oils consist largely of the residue remaining from the distillation of crudes. Theseresidues consist of large hydrocarbon structures containing components that require additionalprocessing to convert them into more valuable, lighter products for use in gasoline and dieselengines. These residues generally have a high sulphur and ash content, are mostly very viscousand will therefore be blended with lighter gasoils in order to sell them as a commercial fuel forships and utilities.
Lubricating oils, wax and greasesLubricating oil feedstocks are produced from the atmospheric residue by fractionation undervacuum. The oil cuts produced from the vacuum distillation column are further processed toremove unwanted impurities (solvent extraction and dewaxing) and blended with miscellaneousadditives (both organic and inorganic in nature) to give lubricating oils of various grades.Lubricating oils can be modified by mixing with thickening agents such as soap, clay or silicagel to produce lubricating greases. Dewaxing yields paraffinic or microcrystalline wax that isusually subjected to hydrofinishing to remove colours, odours and potentially carcinogenichydrocarbons for domestic applications.
BitumenBitumen (referred to as asphalt in the USA) is used mainly for paving roads but also for anumber of other applications, such as materials for roofing. The basic source of bitumen is theresidue remaining after vacuum distillation of crude. The residue can also be treated by blowingwith air at high temperature (bitumen blowing process) to increase the asphaltene content.
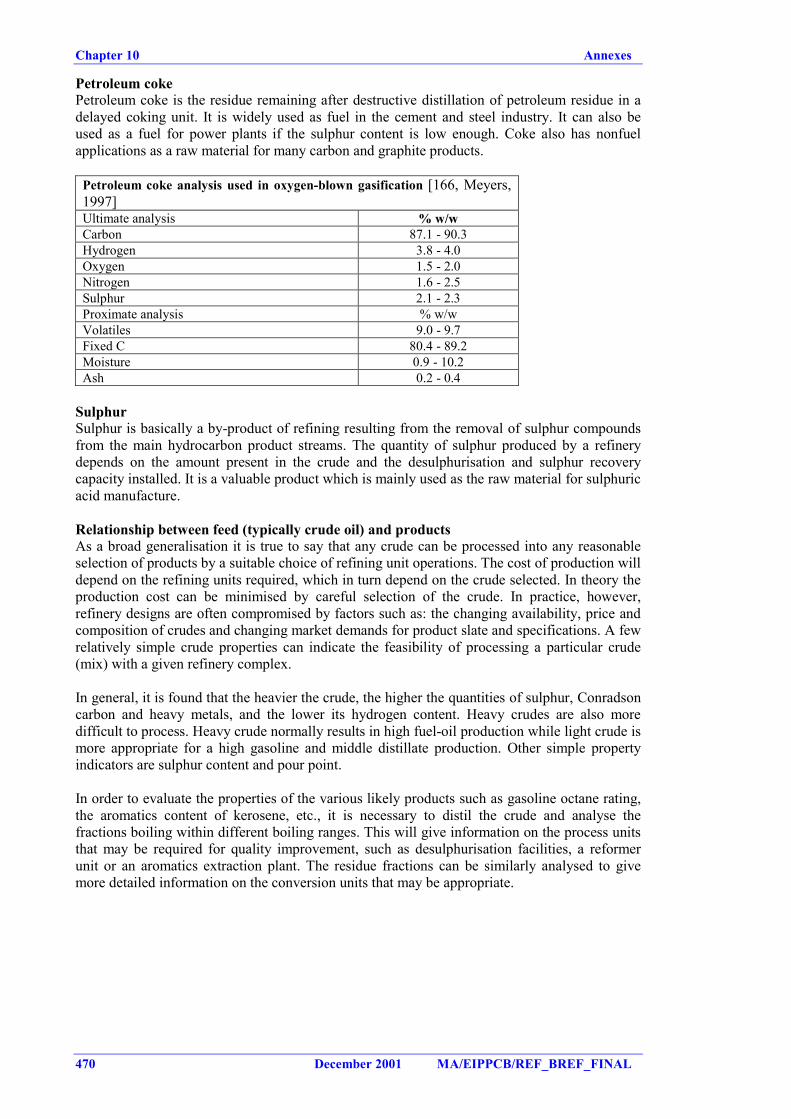
Chapter 10 Annexes
470 December 2001 MA/EIPPCB/REF_BREF_FINAL
Petroleum cokePetroleum coke is the residue remaining after destructive distillation of petroleum residue in adelayed coking unit. It is widely used as fuel in the cement and steel industry. It can also beused as a fuel for power plants if the sulphur content is low enough. Coke also has nonfuelapplications as a raw material for many carbon and graphite products.
Petroleum coke analysis used in oxygen-blown gasification [166, Meyers,1997]Ultimate analysis % w/wCarbon 87.1 - 90.3Hydrogen 3.8 - 4.0Oxygen 1.5 - 2.0Nitrogen 1.6 - 2.5Sulphur 2.1 - 2.3Proximate analysis % w/wVolatiles 9.0 - 9.7Fixed C 80.4 - 89.2Moisture 0.9 - 10.2Ash 0.2 - 0.4
SulphurSulphur is basically a by-product of refining resulting from the removal of sulphur compoundsfrom the main hydrocarbon product streams. The quantity of sulphur produced by a refinerydepends on the amount present in the crude and the desulphurisation and sulphur recoverycapacity installed. It is a valuable product which is mainly used as the raw material for sulphuricacid manufacture.
Relationship between feed (typically crude oil) and productsAs a broad generalisation it is true to say that any crude can be processed into any reasonableselection of products by a suitable choice of refining unit operations. The cost of production willdepend on the refining units required, which in turn depend on the crude selected. In theory theproduction cost can be minimised by careful selection of the crude. In practice, however,refinery designs are often compromised by factors such as: the changing availability, price andcomposition of crudes and changing market demands for product slate and specifications. A fewrelatively simple crude properties can indicate the feasibility of processing a particular crude(mix) with a given refinery complex.
In general, it is found that the heavier the crude, the higher the quantities of sulphur, Conradsoncarbon and heavy metals, and the lower its hydrogen content. Heavy crudes are also moredifficult to process. Heavy crude normally results in high fuel-oil production while light crude ismore appropriate for a high gasoline and middle distillate production. Other simple propertyindicators are sulphur content and pour point.
In order to evaluate the properties of the various likely products such as gasoline octane rating,the aromatics content of kerosene, etc., it is necessary to distil the crude and analyse thefractions boiling within different boiling ranges. This will give information on the process unitsthat may be required for quality improvement, such as desulphurisation facilities, a reformerunit or an aromatics extraction plant. The residue fractions can be similarly analysed to givemore detailed information on the conversion units that may be appropriate.
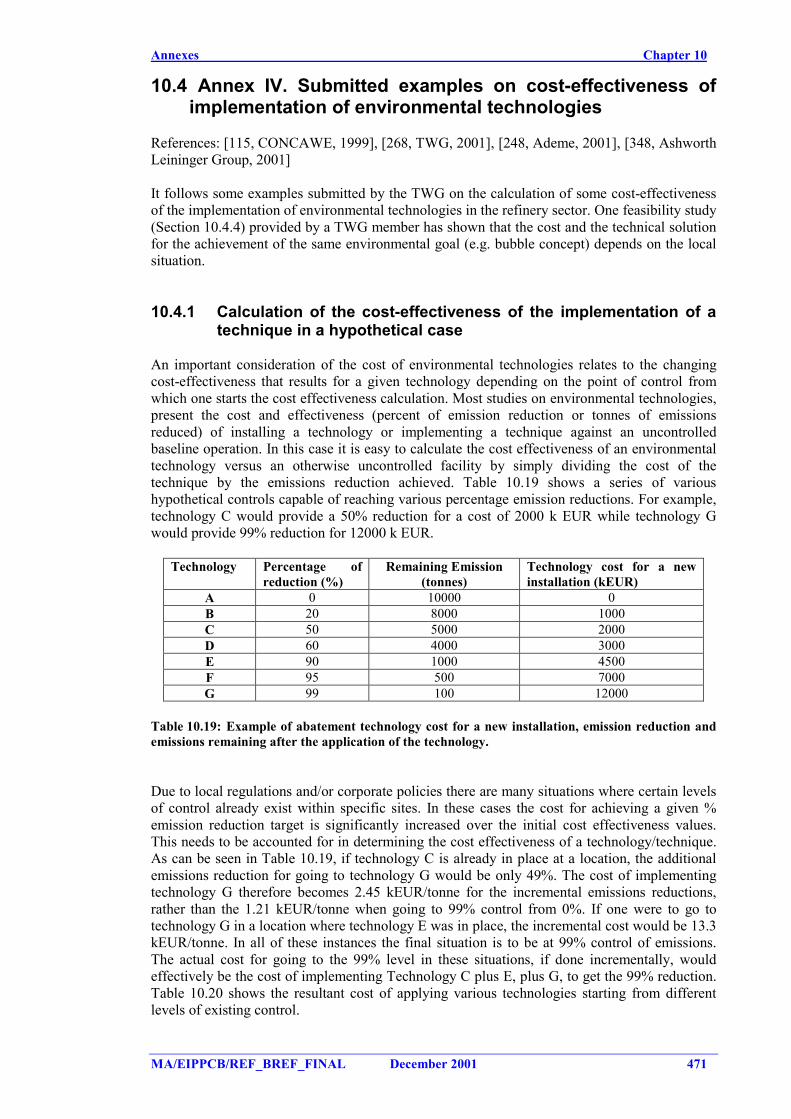
Annexes Chapter 10
MA/EIPPCB/REF_BREF_FINAL December 2001 471
10.4 Annex IV. Submitted examples on cost-effectiveness ofimplementation of environmental technologies
References: [115, CONCAWE, 1999], [268, TWG, 2001], [248, Ademe, 2001], [348, AshworthLeininger Group, 2001]
It follows some examples submitted by the TWG on the calculation of some cost-effectivenessof the implementation of environmental technologies in the refinery sector. One feasibility study(Section 10.4.4) provided by a TWG member has shown that the cost and the technical solutionfor the achievement of the same environmental goal (e.g. bubble concept) depends on the localsituation.
10.4.1 Calculation of the cost-effectiveness of the implementation of atechnique in a hypothetical case
An important consideration of the cost of environmental technologies relates to the changingcost-effectiveness that results for a given technology depending on the point of control fromwhich one starts the cost effectiveness calculation. Most studies on environmental technologies,present the cost and effectiveness (percent of emission reduction or tonnes of emissionsreduced) of installing a technology or implementing a technique against an uncontrolledbaseline operation. In this case it is easy to calculate the cost effectiveness of an environmentaltechnology versus an otherwise uncontrolled facility by simply dividing the cost of thetechnique by the emissions reduction achieved. Table 10.19 shows a series of varioushypothetical controls capable of reaching various percentage emission reductions. For example,technology C would provide a 50% reduction for a cost of 2000 k EUR while technology Gwould provide 99% reduction for 12000 k EUR.
Technology Percentage ofreduction (%)
Remaining Emission(tonnes)
Technology cost for a newinstallation (kEUR)
A 0 10000 0B 20 8000 1000C 50 5000 2000D 60 4000 3000E 90 1000 4500F 95 500 7000G 99 100 12000
Table 10.19: Example of abatement technology cost for a new installation, emission reduction andemissions remaining after the application of the technology.
Due to local regulations and/or corporate policies there are many situations where certain levelsof control already exist within specific sites. In these cases the cost for achieving a given %emission reduction target is significantly increased over the initial cost effectiveness values.This needs to be accounted for in determining the cost effectiveness of a technology/technique.As can be seen in Table 10.19, if technology C is already in place at a location, the additionalemissions reduction for going to technology G would be only 49%. The cost of implementingtechnology G therefore becomes 2.45 kEUR/tonne for the incremental emissions reductions,rather than the 1.21 kEUR/tonne when going to 99% control from 0%. If one were to go totechnology G in a location where technology E was in place, the incremental cost would be 13.3kEUR/tonne. In all of these instances the final situation is to be at 99% control of emissions.The actual cost for going to the 99% level in these situations, if done incrementally, wouldeffectively be the cost of implementing Technology C plus E, plus G, to get the 99% reduction.Table 10.20 shows the resultant cost of applying various technologies starting from differentlevels of existing control.
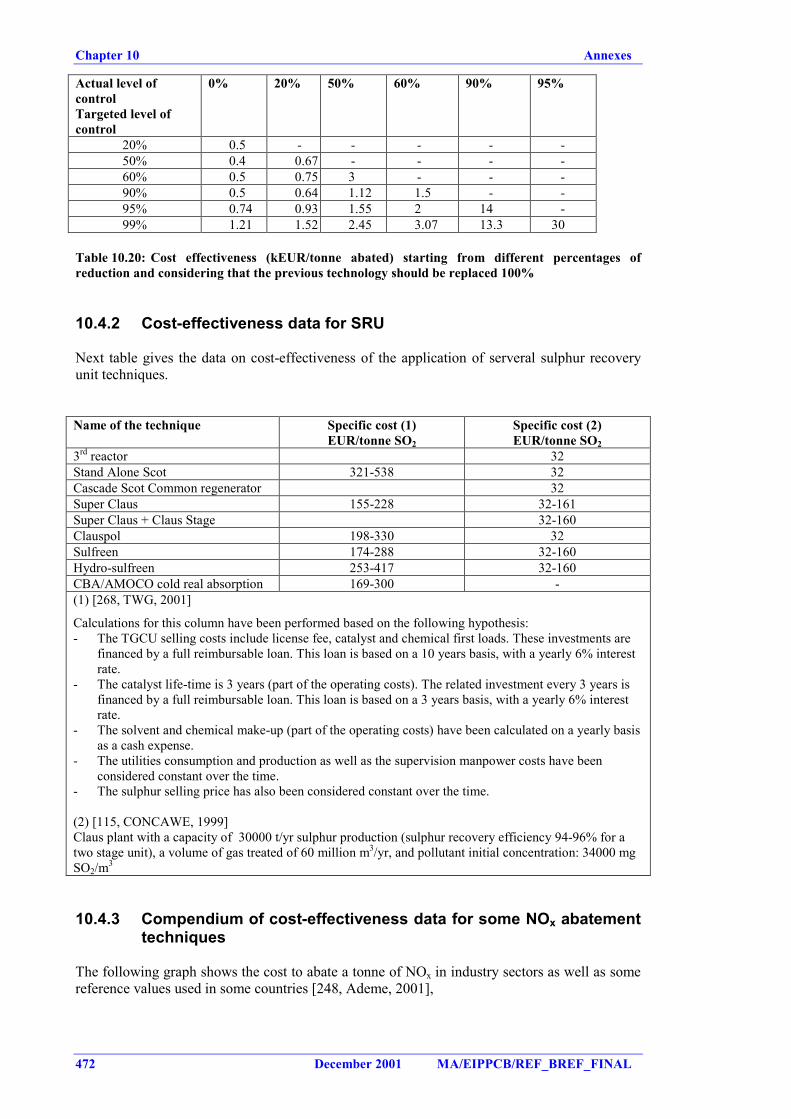
Chapter 10 Annexes
472 December 2001 MA/EIPPCB/REF_BREF_FINAL
Actual level ofcontrolTargeted level ofcontrol
0% 20% 50% 60% 90% 95%
20% 0.5 - - - - -50% 0.4 0.67 - - - -60% 0.5 0.75 3 - - -90% 0.5 0.64 1.12 1.5 - -95% 0.74 0.93 1.55 2 14 -99% 1.21 1.52 2.45 3.07 13.3 30
Table 10.20: Cost effectiveness (kEUR/tonne abated) starting from different percentages ofreduction and considering that the previous technology should be replaced 100%
10.4.2 Cost-effectiveness data for SRU
Next table gives the data on cost-effectiveness of the application of serveral sulphur recoveryunit techniques.
Name of the technique Specific cost (1)EUR/tonne SO2
Specific cost (2)EUR/tonne SO2
3rd reactor 32Stand Alone Scot 321-538 32Cascade Scot Common regenerator 32Super Claus 155-228 32-161Super Claus + Claus Stage 32-160Clauspol 198-330 32Sulfreen 174-288 32-160Hydro-sulfreen 253-417 32-160CBA/AMOCO cold real absorption 169-300 -(1) [268, TWG, 2001]
Calculations for this column have been performed based on the following hypothesis:- The TGCU selling costs include license fee, catalyst and chemical first loads. These investments are
financed by a full reimbursable loan. This loan is based on a 10 years basis, with a yearly 6% interestrate.
- The catalyst life-time is 3 years (part of the operating costs). The related investment every 3 years isfinanced by a full reimbursable loan. This loan is based on a 3 years basis, with a yearly 6% interestrate.
- The solvent and chemical make-up (part of the operating costs) have been calculated on a yearly basisas a cash expense.
- The utilities consumption and production as well as the supervision manpower costs have beenconsidered constant over the time.
- The sulphur selling price has also been considered constant over the time.
(2) [115, CONCAWE, 1999]Claus plant with a capacity of 30000 t/yr sulphur production (sulphur recovery efficiency 94-96% for atwo stage unit), a volume of gas treated of 60 million m3/yr, and pollutant initial concentration: 34000 mgSO2/m3
10.4.3 Compendium of cost-effectiveness data for some NOx abatementtechniques
The following graph shows the cost to abate a tonne of NOx in industry sectors as well as somereference values used in some countries [248, Ademe, 2001],
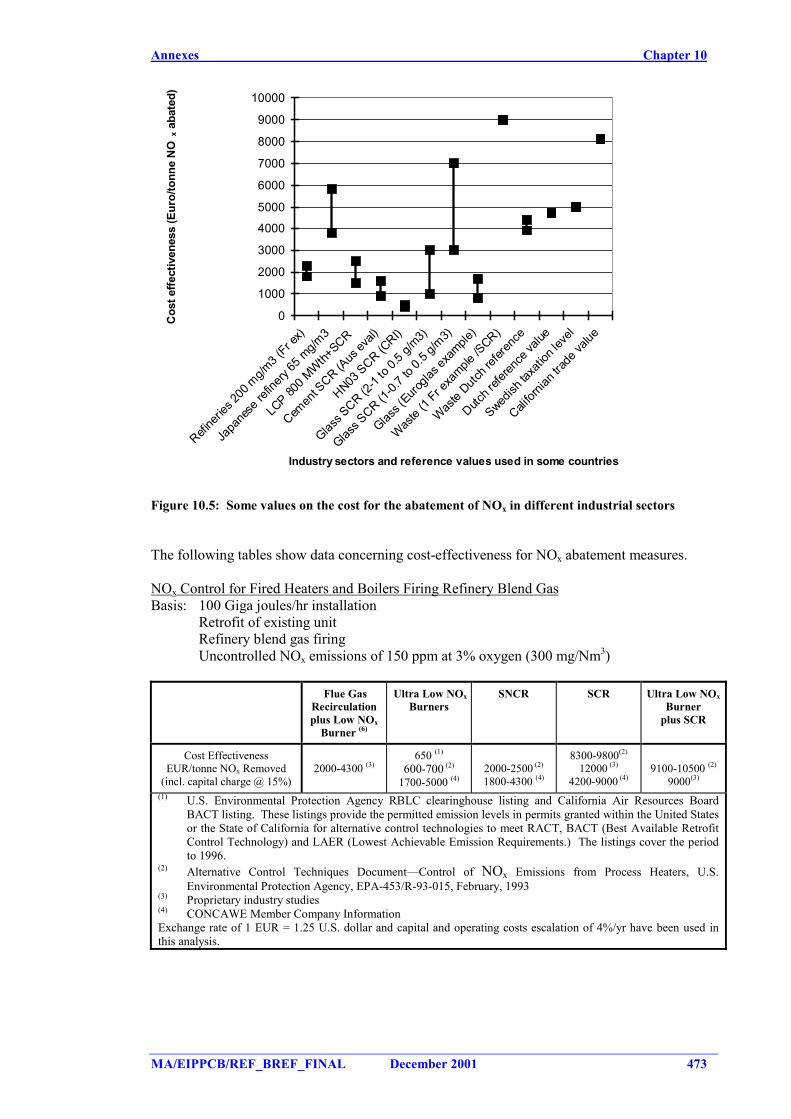
Annexes Chapter 10
MA/EIPPCB/REF_BREF_FINAL December 2001 473
0
1000
2000
3000
4000
5000
6000
7000
8000
9000
10000
Refine
ries 2
00 m
g/m3 (
Fr ex)
Japa
nese
refin
ery 65
mg/m
3
LCP 80
0 MWth+
SCR
Cemen
t SCR (A
us ev
al)
HN03 SCR (C
RI)
Glass S
CR (2-1
to 0.5
g/m3)
Glass S
CR (1-0.
7 to 0
.5 g/m
3)
Glass (
Eurogla
s exa
mple)
Waste
(1 Fr e
xample
/SCR)
Waste
Dutch r
eferen
ce
Dutch r
eferen
ce va
lue
Swedish
taxa
tion l
evel
Califor
nian t
rade v
alue
Industry sectors and reference values used in some countries
Cos
t effe
ctiv
enes
s (E
uro/
tonn
e N
Ox a
bate
d)
Figure 10.5: Some values on the cost for the abatement of NOx in different industrial sectors
The following tables show data concerning cost-effectiveness for NOx abatement measures.
NOx Control for Fired Heaters and Boilers Firing Refinery Blend GasBasis: 100 Giga joules/hr installation
Retrofit of existing unitRefinery blend gas firingUncontrolled NOx emissions of 150 ppm at 3% oxygen (300 mg/Nm3)
Flue GasRecirculationplus Low NOx
Burner (6)
Ultra Low NOxBurners
SNCR SCR Ultra Low NOxBurner
plus SCR
Cost EffectivenessEUR/tonne NOx Removed
(incl. capital charge @ 15%)2000-4300 (3)
650 (1)
600-700 (2)
1700-5000 (4)2000-2500 (2)
1800-4300 (4)
8300-9800(2)
12000 (3)
4200-9000 (4)9100-10500 (2)
9000(3)
(1) U.S. Environmental Protection Agency RBLC clearinghouse listing and California Air Resources BoardBACT listing. These listings provide the permitted emission levels in permits granted within the United Statesor the State of California for alternative control technologies to meet RACT, BACT (Best Available RetrofitControl Technology) and LAER (Lowest Achievable Emission Requirements.) The listings cover the periodto 1996.
(2) Alternative Control Techniques Document—Control of NOx Emissions from Process Heaters, U.S.Environmental Protection Agency, EPA-453/R-93-015, February, 1993
(3) Proprietary industry studies(4) CONCAWE Member Company InformationExchange rate of 1 EUR = 1.25 U.S. dollar and capital and operating costs escalation of 4%/yr have been used inthis analysis.
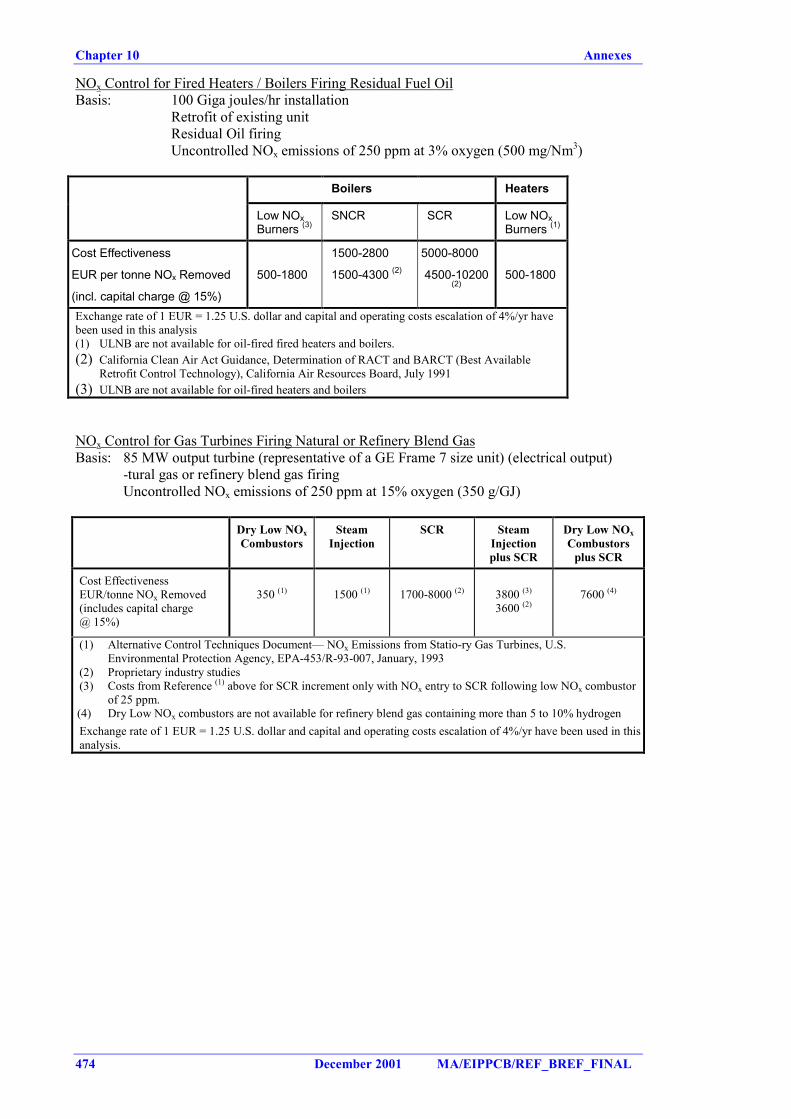
Chapter 10 Annexes
474 December 2001 MA/EIPPCB/REF_BREF_FINAL
NOx Control for Fired Heaters / Boilers Firing Residual Fuel OilBasis: 100 Giga joules/hr installation
Retrofit of existing unitResidual Oil firingUncontrolled NOx emissions of 250 ppm at 3% oxygen (500 mg/Nm3)
Boilers Heaters
Low NOxBurners (3)
SNCR SCR Low NOxBurners (1)
Cost Effectiveness
EUR per tonne NOx Removed
(incl. capital charge @ 15%)
500-1800
1500-2800
1500-4300 (2)
5000-8000
4500-10200(2)
500-1800
Exchange rate of 1 EUR = 1.25 U.S. dollar and capital and operating costs escalation of 4%/yr havebeen used in this analysis(1) ULNB are not available for oil-fired fired heaters and boilers.(2) California Clean Air Act Guidance, Determination of RACT and BARCT (Best Available
Retrofit Control Technology), California Air Resources Board, July 1991(3) ULNB are not available for oil-fired heaters and boilers
NOx Control for Gas Turbines Firing Natural or Refinery Blend GasBasis: 85 MW output turbine (representative of a GE Frame 7 size unit) (electrical output)
-tural gas or refinery blend gas firingUncontrolled NOx emissions of 250 ppm at 15% oxygen (350 g/GJ)
Dry Low NOxCombustors
SteamInjection
SCR SteamInjectionplus SCR
Dry Low NOxCombustors
plus SCR
Cost EffectivenessEUR/tonne NOx Removed(includes capital charge@ 15%)
350 (1) 1500 (1) 1700-8000 (2) 3800 (3)
3600 (2)7600 (4)
(1) Alternative Control Techniques Document— NOx Emissions from Statio-ry Gas Turbines, U.S.Environmental Protection Agency, EPA-453/R-93-007, January, 1993
(2) Proprietary industry studies(3) Costs from Reference (1) above for SCR increment only with NOx entry to SCR following low NOx combustor
of 25 ppm.(4) Dry Low NOx combustors are not available for refinery blend gas containing more than 5 to 10% hydrogenExchange rate of 1 EUR = 1.25 U.S. dollar and capital and operating costs escalation of 4%/yr have been used in thisanalysis.
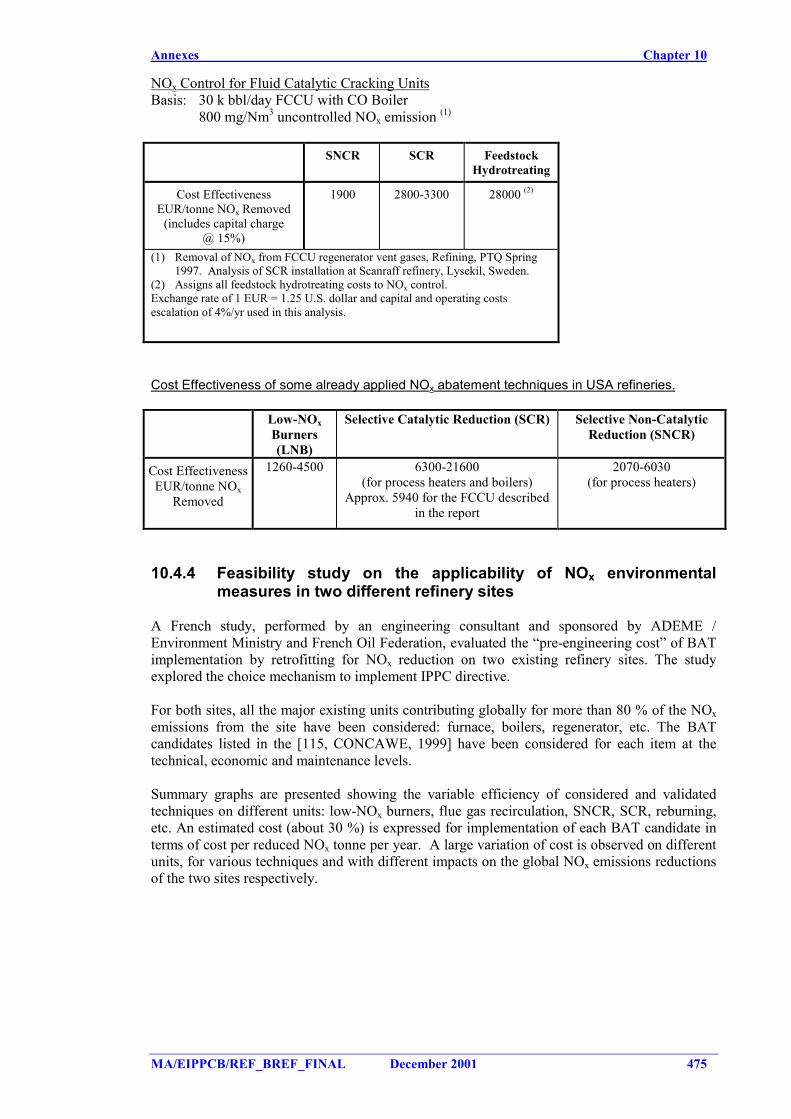
Annexes Chapter 10
MA/EIPPCB/REF_BREF_FINAL December 2001 475
NOx Control for Fluid Catalytic Cracking UnitsBasis: 30 k bbl/day FCCU with CO Boiler
800 mg/Nm3 uncontrolled NOx emission (1)
SNCR SCR FeedstockHydrotreating
Cost EffectivenessEUR/tonne NOx Removed
(includes capital charge@ 15%)
1900 2800-3300 28000 (2)
(1) Removal of NOx from FCCU regenerator vent gases, Refining, PTQ Spring1997. Analysis of SCR installation at Scanraff refinery, Lysekil, Sweden.
(2) Assigns all feedstock hydrotreating costs to NOx control.Exchange rate of 1 EUR = 1.25 U.S. dollar and capital and operating costsescalation of 4%/yr used in this analysis.
Cost Effectiveness of some already applied NOx abatement techniques in USA refineries.
Low-NOxBurners(LNB)
Selective Catalytic Reduction (SCR) Selective Non-CatalyticReduction (SNCR)
Cost EffectivenessEUR/tonne NOx
Removed
1260-4500 6300-21600(for process heaters and boilers)
Approx. 5940 for the FCCU describedin the report
2070-6030(for process heaters)
10.4.4 Feasibility study on the applicability of NOx environmentalmeasures in two different refinery sites
A French study, performed by an engineering consultant and sponsored by ADEME /Environment Ministry and French Oil Federation, evaluated the “pre-engineering cost” of BATimplementation by retrofitting for NOx reduction on two existing refinery sites. The studyexplored the choice mechanism to implement IPPC directive.
For both sites, all the major existing units contributing globally for more than 80 % of the NOxemissions from the site have been considered: furnace, boilers, regenerator, etc. The BATcandidates listed in the [115, CONCAWE, 1999] have been considered for each item at thetechnical, economic and maintenance levels.
Summary graphs are presented showing the variable efficiency of considered and validatedtechniques on different units: low-NOx burners, flue gas recirculation, SNCR, SCR, reburning,etc. An estimated cost (about 30 %) is expressed for implementation of each BAT candidate interms of cost per reduced NOx tonne per year. A large variation of cost is observed on differentunits, for various techniques and with different impacts on the global NOx emissions reductionsof the two sites respectively.
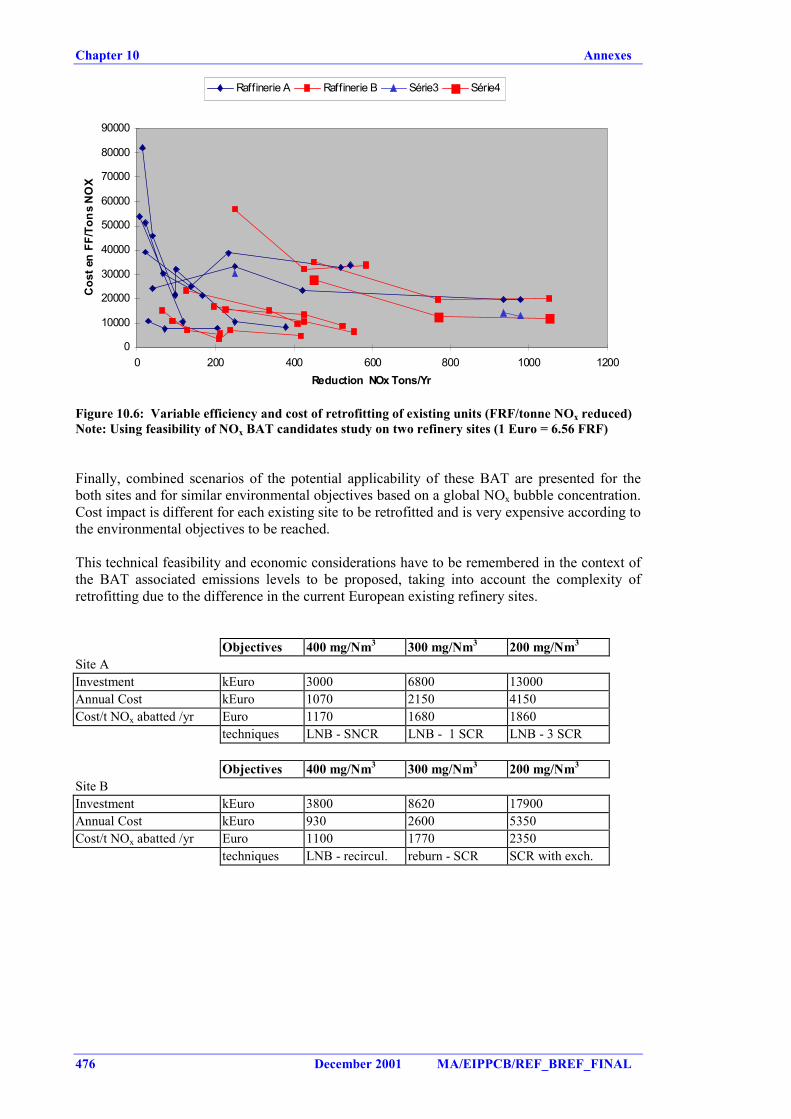
Chapter 10 Annexes
476 December 2001 MA/EIPPCB/REF_BREF_FINAL
0
10000
20000
30000
40000
50000
60000
70000
80000
90000
0 200 400 600 800 1000 1200Reduction NOx Tons/Yr
Cos
t en
FF/T
ons
NO
XRaffinerie A Raffinerie B Série3 Série4
Figure 10.6: Variable efficiency and cost of retrofitting of existing units (FRF/tonne NOx reduced)Note: Using feasibility of NOx BAT candidates study on two refinery sites (1 Euro = 6.56 FRF)
Finally, combined scenarios of the potential applicability of these BAT are presented for theboth sites and for similar environmental objectives based on a global NOx bubble concentration.Cost impact is different for each existing site to be retrofitted and is very expensive according tothe environmental objectives to be reached.
This technical feasibility and economic considerations have to be remembered in the context ofthe BAT associated emissions levels to be proposed, taking into account the complexity ofretrofitting due to the difference in the current European existing refinery sites.
Objectives 400 mg/Nm3 300 mg/Nm3 200 mg/Nm3
Site AInvestment kEuro 3000 6800 13000Annual Cost kEuro 1070 2150 4150Cost/t NOx abatted /yr Euro 1170 1680 1860
techniques LNB - SNCR LNB - 1 SCR LNB - 3 SCR
Objectives 400 mg/Nm3 300 mg/Nm3 200 mg/Nm3
Site BInvestment kEuro 3800 8620 17900Annual Cost kEuro 930 2600 5350Cost/t NOx abatted /yr Euro 1100 1770 2350
techniques LNB - recircul. reburn - SCR SCR with exch.
Annexes Chapter 10
MA/EIPPCB/REF_BREF_FINAL December 2001 477
10.5 Annex V: Background information from TWG members forthe different proposals of SO2 and NOx emission under thebubble concept
The calculation of the emission levels for the bubble concept that can be associated withapplying BAT incorporates the various aspects presented in Section 4.15.2 (description of thebubble concept) and the elements described in Chapter 5. The following elements have to betaken into consideration, with due regard to the applicability of each of the elements or optionsin a particular situation:
� Increased energy efficiency of the various processes integrated with the refinery fuelmanagement system;
� Decrease use of liquid fuels by increased use of gaseous fuels from within the refinery or,where applicable, from additional processing and conversion in the refinery, FCC, IGCC,coker, etc.;
� Lower the S-content of liquid fuels (e.g. hydrotreatment) used in the refinery;� Use of clean gaseous fuels (-tural gas or cleaned refinery gas);� Use of liquid fuels combined with control techniques to clean the flue gases, thereby
reducing the emissions of SO2 and NOx;� Apply BAT to single installations, especially to the sulphur recovery unit (SRU).
It follows some calculations, justifications for the proposals given by some TWG members.
10.5.1 Calculations based on BAT assumptions provided by theNetherlands
In order to illustrate the use of the bubble concept in a refinery, a number of cases and theirrelevant emissions are calculated along the lines outlined below. The following assumptions areused.
Gas-fired refinery:There are a few full conversion refineries in Europe that are fully gas-fired. The main source ofenergy in these cases is cleaned refinery gas. In some cases also natural gas is used assupplementary fuel.
Assumptions for bubble calculation: Full conversion, fully gas fired refinery, processing 10million tonne of crude oil with an annual fuel use of 700000 tonnes (7% on intake). SRUapplies BAT with 99.8% efficiency and has an annual production of 100000 tonnes ofelementary sulphur. The FCC has an annual throughput of 1.5 million tonne (consuming some12% of the total refinery fuel consumption). The 100% gas case is presented in Tables 10.21-24.
Gas and Liquid Fired Refinery using low sulphur oil (0.5% S)Most European refineries use a combination of gaseous and liquid fuels from within therefinery. The calculation of the technical achievable emission values in such a refinery is basedon a) existence of a combined fuel management system in the refinery, and b) emission valuesof the combined fuel system with fuels that are either inherently clean (certain refinery gases ornatural gas) or refinery gaseous or liquid fuels that can be cleaned relatively easy. It may alsocover the situation of the cleaning of the flue gases from fuels that “untreated” will causepollution to air.
Assumptions for the calculation: Medium conversion, partially gas fired refinery, processing 10million tonne of crude oil with an annual fuel use of 400000 tonne (4% on intake). SRU appliesBAT with 99.8% efficiency and has an annual production of 50000 tonnes of elementarysulphur. The FCC has an annual throughput of 1.5 million tonne (consuming some 20% of thetotal refinery fuel consumption). Several cases are shown (70% gas, 50%gas and 30% gas).
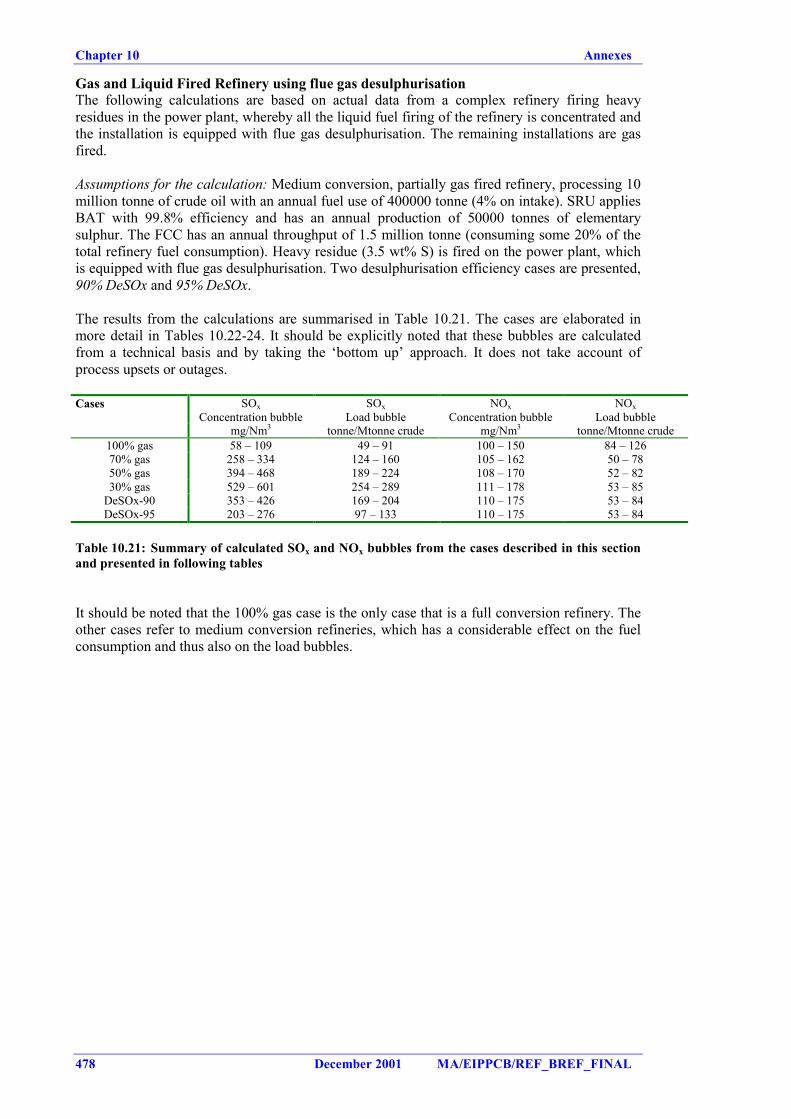
Chapter 10 Annexes
478 December 2001 MA/EIPPCB/REF_BREF_FINAL
Gas and Liquid Fired Refinery using flue gas desulphurisationThe following calculations are based on actual data from a complex refinery firing heavyresidues in the power plant, whereby all the liquid fuel firing of the refinery is concentrated andthe installation is equipped with flue gas desulphurisation. The remaining installations are gasfired.
Assumptions for the calculation: Medium conversion, partially gas fired refinery, processing 10million tonne of crude oil with an annual fuel use of 400000 tonne (4% on intake). SRU appliesBAT with 99.8% efficiency and has an annual production of 50000 tonnes of elementarysulphur. The FCC has an annual throughput of 1.5 million tonne (consuming some 20% of thetotal refinery fuel consumption). Heavy residue (3.5 wt% S) is fired on the power plant, whichis equipped with flue gas desulphurisation. Two desulphurisation efficiency cases are presented,90% DeSOx and 95% DeSOx.
The results from the calculations are summarised in Table 10.21. The cases are elaborated inmore detail in Tables 10.22-24. It should be explicitly noted that these bubbles are calculatedfrom a technical basis and by taking the ‘bottom up’ approach. It does not take account ofprocess upsets or outages.
Cases SOxConcentration bubble
SOxLoad bubble
NOxConcentration bubble
NOxLoad bubble
mg/Nm3 tonne/Mtonne crude mg/Nm3 tonne/Mtonne crude100% gas 58 – 109 49 – 91 100 – 150 84 – 12670% gas 258 – 334 124 – 160 105 – 162 50 – 7850% gas 394 – 468 189 – 224 108 – 170 52 – 8230% gas 529 – 601 254 – 289 111 – 178 53 – 85
DeSOx-90 353 – 426 169 – 204 110 – 175 53 – 84DeSOx-95 203 – 276 97 – 133 110 – 175 53 – 84
Table 10.21: Summary of calculated SOx and NOx bubbles from the cases described in this sectionand presented in following tables
It should be noted that the 100% gas case is the only case that is a full conversion refinery. Theother cases refer to medium conversion refineries, which has a considerable effect on the fuelconsumption and thus also on the load bubbles.
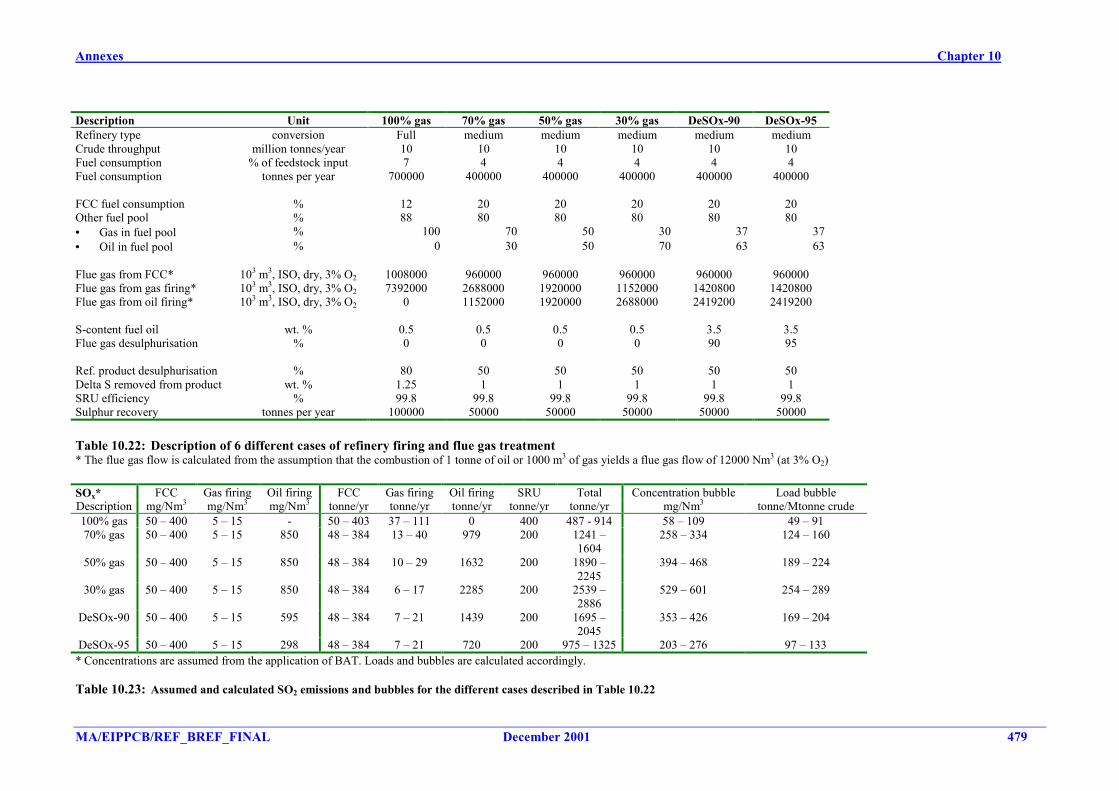
Annexes Chapter 10
MA/EIPPCB/REF_BREF_FINAL December 2001 479
Description Unit 100% gas 70% gas 50% gas 30% gas DeSOx-90 DeSOx-95Refinery type conversion Full medium medium medium medium mediumCrude throughput million tonnes/year 10 10 10 10 10 10Fuel consumption % of feedstock input 7 4 4 4 4 4Fuel consumption tonnes per year 700000 400000 400000 400000 400000 400000
FCC fuel consumption % 12 20 20 20 20 20Other fuel pool % 88 80 80 80 80 80• Gas in fuel pool % 100 70 50 30 37 37• Oil in fuel pool % 0 30 50 70 63 63
Flue gas from FCC* 103 m3, ISO, dry, 3% O2 1008000 960000 960000 960000 960000 960000Flue gas from gas firing* 103 m3, ISO, dry, 3% O2 7392000 2688000 1920000 1152000 1420800 1420800Flue gas from oil firing* 103 m3, ISO, dry, 3% O2 0 1152000 1920000 2688000 2419200 2419200
S-content fuel oil wt. % 0.5 0.5 0.5 0.5 3.5 3.5Flue gas desulphurisation % 0 0 0 0 90 95
Ref. product desulphurisation % 80 50 50 50 50 50Delta S removed from product wt. % 1.25 1 1 1 1 1SRU efficiency % 99.8 99.8 99.8 99.8 99.8 99.8Sulphur recovery tonnes per year 100000 50000 50000 50000 50000 50000
Table 10.22: Description of 6 different cases of refinery firing and flue gas treatment* The flue gas flow is calculated from the assumption that the combustion of 1 tonne of oil or 1000 m3 of gas yields a flue gas flow of 12000 Nm3 (at 3% O2)
SOx* FCC Gas firing Oil firing FCC Gas firing Oil firing SRU Total Concentration bubble Load bubbleDescription mg/Nm3 mg/Nm3 mg/Nm3 tonne/yr tonne/yr tonne/yr tonne/yr tonne/yr mg/Nm3 tonne/Mtonne crude100% gas 50 – 400 5 – 15 - 50 – 403 37 – 111 0 400 487 - 914 58 – 109 49 – 9170% gas 50 – 400 5 – 15 850 48 – 384 13 – 40 979 200 1241 –
1604258 – 334 124 – 160
50% gas 50 – 400 5 – 15 850 48 – 384 10 – 29 1632 200 1890 –2245
394 – 468 189 – 224
30% gas 50 – 400 5 – 15 850 48 – 384 6 – 17 2285 200 2539 –2886
529 – 601 254 – 289
DeSOx-90 50 – 400 5 – 15 595 48 – 384 7 – 21 1439 200 1695 –2045
353 – 426 169 – 204
DeSOx-95 50 – 400 5 – 15 298 48 – 384 7 – 21 720 200 975 – 1325 203 – 276 97 – 133* Concentrations are assumed from the application of BAT. Loads and bubbles are calculated accordingly.
Table 10.23: Assumed and calculated SO2 emissions and bubbles for the different cases described in Table 10.22
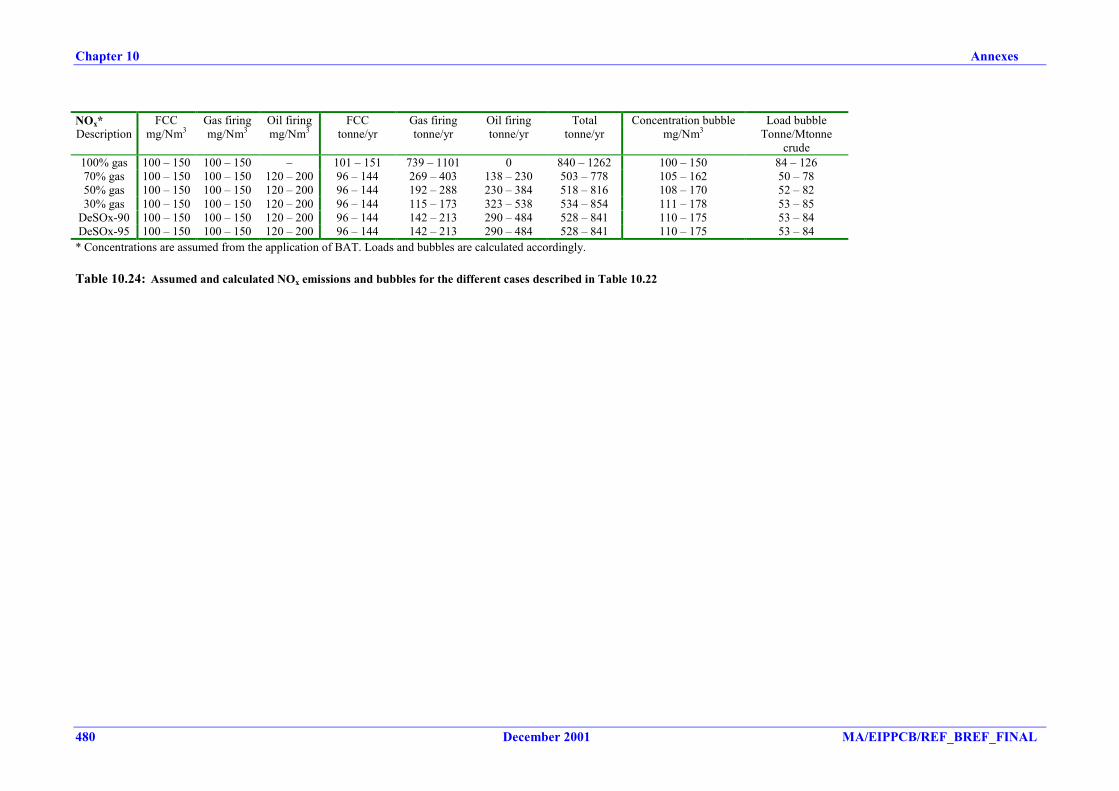
Chapter 10 Annexes
480 December 2001 MA/EIPPCB/REF_BREF_FINAL
NOx* FCC Gas firing Oil firing FCC Gas firing Oil firing Total Concentration bubble Load bubbleDescription mg/Nm3 mg/Nm3 mg/Nm3 tonne/yr tonne/yr tonne/yr tonne/yr mg/Nm3 Tonne/Mtonne
crude100% gas 100 – 150 100 – 150 – 101 – 151 739 – 1101 0 840 – 1262 100 – 150 84 – 12670% gas 100 – 150 100 – 150 120 – 200 96 – 144 269 – 403 138 – 230 503 – 778 105 – 162 50 – 7850% gas 100 – 150 100 – 150 120 – 200 96 – 144 192 – 288 230 – 384 518 – 816 108 – 170 52 – 8230% gas 100 – 150 100 – 150 120 – 200 96 – 144 115 – 173 323 – 538 534 – 854 111 – 178 53 – 85
DeSOx-90 100 – 150 100 – 150 120 – 200 96 – 144 142 – 213 290 – 484 528 – 841 110 – 175 53 – 84DeSOx-95 100 – 150 100 – 150 120 – 200 96 – 144 142 – 213 290 – 484 528 – 841 110 – 175 53 – 84
* Concentrations are assumed from the application of BAT. Loads and bubbles are calculated accordingly.
Table 10.24: Assumed and calculated NOx emissions and bubbles for the different cases described in Table 10.22
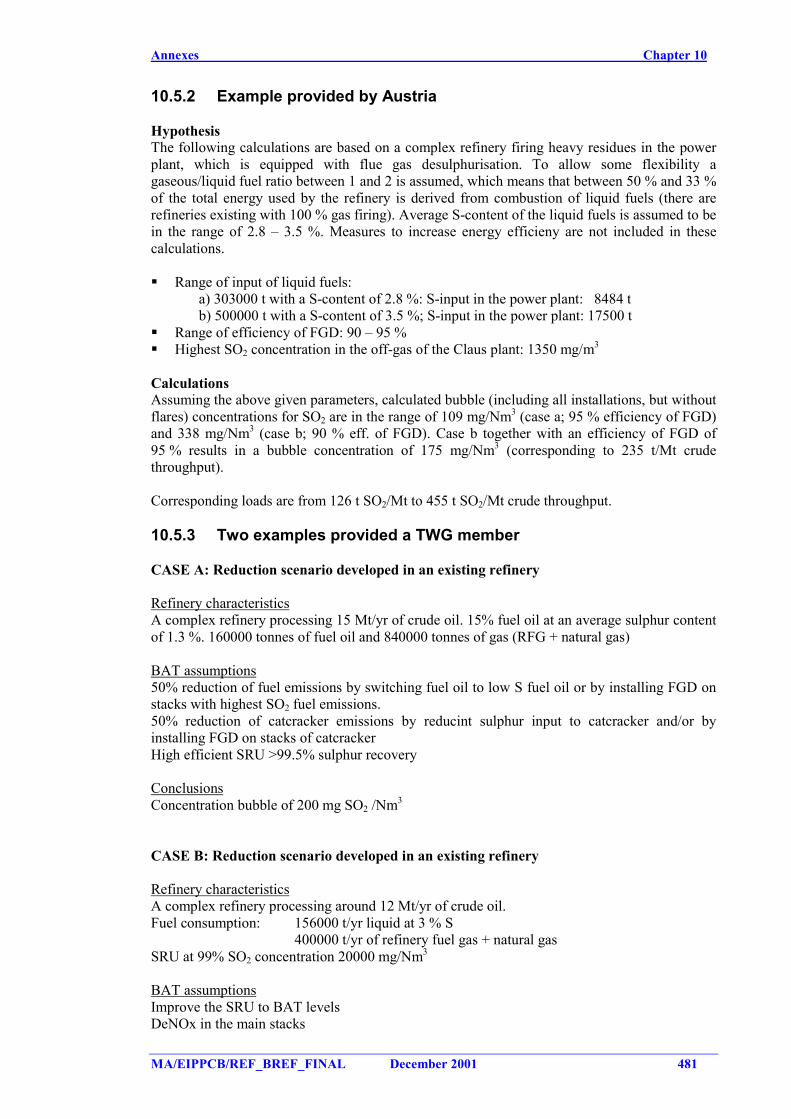
Annexes Chapter 10
MA/EIPPCB/REF_BREF_FINAL December 2001 481
10.5.2 Example provided by Austria
HypothesisThe following calculations are based on a complex refinery firing heavy residues in the powerplant, which is equipped with flue gas desulphurisation. To allow some flexibility agaseous/liquid fuel ratio between 1 and 2 is assumed, which means that between 50 % and 33 %of the total energy used by the refinery is derived from combustion of liquid fuels (there arerefineries existing with 100 % gas firing). Average S-content of the liquid fuels is assumed to bein the range of 2.8 – 3.5 %. Measures to increase energy efficieny are not included in thesecalculations.
� Range of input of liquid fuels:a) 303000 t with a S-content of 2.8 %: S-input in the power plant: 8484 tb) 500000 t with a S-content of 3.5 %; S-input in the power plant: 17500 t
� Range of efficiency of FGD: 90 – 95 %� Highest SO2 concentration in the off-gas of the Claus plant: 1350 mg/m3
CalculationsAssuming the above given parameters, calculated bubble (including all installations, but withoutflares) concentrations for SO2 are in the range of 109 mg/Nm3 (case a; 95 % efficiency of FGD)and 338 mg/Nm3 (case b; 90 % eff. of FGD). Case b together with an efficiency of FGD of95 % results in a bubble concentration of 175 mg/Nm3 (corresponding to 235 t/Mt crudethroughput).
Corresponding loads are from 126 t SO2/Mt to 455 t SO2/Mt crude throughput.
10.5.3 Two examples provided a TWG member
CASE A: Reduction scenario developed in an existing refinery
Refinery characteristicsA complex refinery processing 15 Mt/yr of crude oil. 15% fuel oil at an average sulphur contentof 1.3 %. 160000 tonnes of fuel oil and 840000 tonnes of gas (RFG + natural gas)
BAT assumptions50% reduction of fuel emissions by switching fuel oil to low S fuel oil or by installing FGD onstacks with highest SO2 fuel emissions.50% reduction of catcracker emissions by reducint sulphur input to catcracker and/or byinstalling FGD on stacks of catcrackerHigh efficient SRU >99.5% sulphur recovery
ConclusionsConcentration bubble of 200 mg SO2 /Nm3
CASE B: Reduction scenario developed in an existing refinery
Refinery characteristicsA complex refinery processing around 12 Mt/yr of crude oil.Fuel consumption: 156000 t/yr liquid at 3 % S
400000 t/yr of refinery fuel gas + natural gasSRU at 99% SO2 concentration 20000 mg/Nm3
BAT assumptionsImprove the SRU to BAT levelsDeNOx in the main stacks
Chapter 10 Annexes
482 December 2001 MA/EIPPCB/REF_BREF_FINAL
ConclusionsSOx bubble concentration of 50 mg/Nm3
NOx bubble concentration of <100 mg/Nm3.
10.5.4 Italian proposals and justification for the given bubble figures
With respect to environmental benefits, Italy and other mediterranean countries arecharacterised by a nearly full compliance with objectives for acidification and very marginaltransboundary pollution. In other words we don’t need very stringent emission ranges for SO2and NOx.
From the technical and economic point of view, we should consider that the refining sector inthe Mediterranean area is characterised as follows:
• 70 % of the European fuel oil market demand is located in the Mediterranean area;• the current configuration of the existing refineries in this area derives from the actual
petroleum products demand that is very different from the North Europe demand;• the crude oil slate processed is mainly derived from Middle East crude oils that represent
the best choice to fit both the market demand and the refinery configuration. The heavy fueloil produced under these conditions needs to be used internally because any other options(deep conversion, desulphurisation, gasification, etc) are not economic sustainable
In conclusion we believe that the level associated with BAT should take into account the costand the advantages associated to different emission ranges and, moreover, BAT must betechniques generally applicable otherwise the competitiveness inside the refining sector inEurope will be distorted.
On the basis of these considerations we propose the following bubble emission ranges:
• SO2: 800-1200 mg/Nm3 (monthly average all plants included)• NOx: 250-450 mg/Nm3 (monthly average all plants included)• Dust: 30-50 mg/Nm3 (monthly average all plants included)
The ranges here proposed for SO2 and NOx are derived from the emission values associated tothe BAT considered for the revision of the Large Combustion Plants Directive, recentlyapproved at European level. The BATs adopted for this revision are the most stringenttechniques applicable to the new and existing large combustion plants.
In the revision of the Large Combustion Plants Directive the SO2 emission limit values for newand existing refineries are respectively 600 and 1000 mg/Nm3. Having considered that thebubble emission levels in the BREF are referred to all plants, these emission limit values areslightly increased to include the SO2 emission also from Claus and Catalytic Cracking plants.
The emission limit values for NOx, in the revision of the Large Combustion Plants Directive aredefined in the same range we proposed for refinery bubble and this seems enough to justify ourproposal.
The above emission values ranges are coherent with the definition of general BAT and so therequirement of more stringent ranges do not have justification.
By the way the techniques that need to be adopted to meet the more stringent ranges willincrease the refinery energy consumption and the associated CO2 emissions.
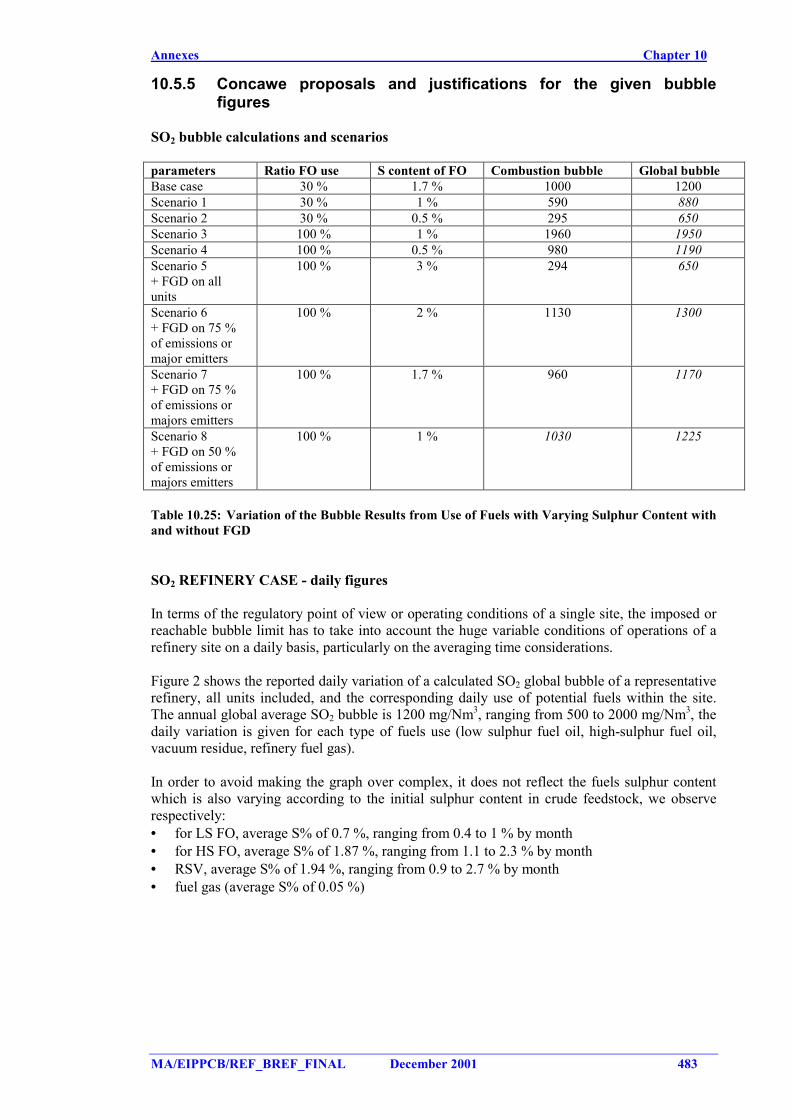
Annexes Chapter 10
MA/EIPPCB/REF_BREF_FINAL December 2001 483
10.5.5 Concawe proposals and justifications for the given bubblefigures
SO2 bubble calculations and scenarios
parameters Ratio FO use S content of FO Combustion bubble Global bubbleBase case 30 % 1.7 % 1000 1200Scenario 1 30 % 1 % 590 880Scenario 2 30 % 0.5 % 295 650Scenario 3 100 % 1 % 1960 1950Scenario 4 100 % 0.5 % 980 1190Scenario 5+ FGD on allunits
100 % 3 % 294 650
Scenario 6+ FGD on 75 %of emissions ormajor emitters
100 % 2 % 1130 1300
Scenario 7+ FGD on 75 %of emissions ormajors emitters
100 % 1.7 % 960 1170
Scenario 8+ FGD on 50 %of emissions ormajors emitters
100 % 1 % 1030 1225
Table 10.25: Variation of the Bubble Results from Use of Fuels with Varying Sulphur Content withand without FGD
SO2 REFINERY CASE - daily figures
In terms of the regulatory point of view or operating conditions of a single site, the imposed orreachable bubble limit has to take into account the huge variable conditions of operations of arefinery site on a daily basis, particularly on the averaging time considerations.
Figure 2 shows the reported daily variation of a calculated SO2 global bubble of a representativerefinery, all units included, and the corresponding daily use of potential fuels within the site.The annual global average SO2 bubble is 1200 mg/Nm3, ranging from 500 to 2000 mg/Nm3, thedaily variation is given for each type of fuels use (low sulphur fuel oil, high-sulphur fuel oil,vacuum residue, refinery fuel gas).
In order to avoid making the graph over complex, it does not reflect the fuels sulphur contentwhich is also varying according to the initial sulphur content in crude feedstock, we observerespectively:• for LS FO, average S% of 0.7 %, ranging from 0.4 to 1 % by month• for HS FO, average S% of 1.87 %, ranging from 1.1 to 2.3 % by month• RSV, average S% of 1.94 %, ranging from 0.9 to 2.7 % by month• fuel gas (average S% of 0.05 %)
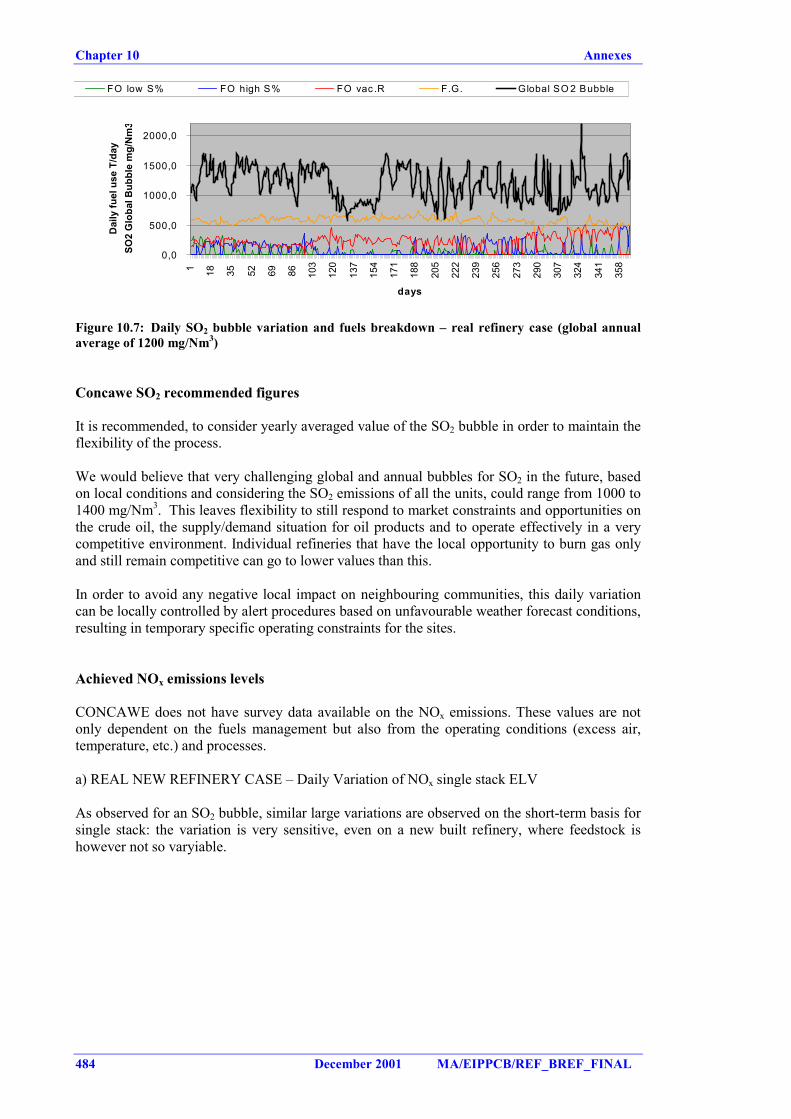
Chapter 10 Annexes
484 December 2001 MA/EIPPCB/REF_BREF_FINAL
0,0
500,0
1000,0
1500,0
2000,0
1 18 35 52 69 86 103
120
137
154
171
188
205
222
239
256
273
290
307
324
341
358
days
Dai
ly fu
el u
se T
/day
SO
2 G
loba
l Bub
ble
mg/
Nm
3
FO low S% FO high S% FO vac .R F.G. Global SO 2 Bubble
Figure 10.7: Daily SO2 bubble variation and fuels breakdown – real refinery case (global annualaverage of 1200 mg/Nm3)
Concawe SO2 recommended figures
It is recommended, to consider yearly averaged value of the SO2 bubble in order to maintain theflexibility of the process.
We would believe that very challenging global and annual bubbles for SO2 in the future, basedon local conditions and considering the SO2 emissions of all the units, could range from 1000 to1400 mg/Nm3. This leaves flexibility to still respond to market constraints and opportunities onthe crude oil, the supply/demand situation for oil products and to operate effectively in a verycompetitive environment. Individual refineries that have the local opportunity to burn gas onlyand still remain competitive can go to lower values than this.
In order to avoid any negative local impact on neighbouring communities, this daily variationcan be locally controlled by alert procedures based on unfavourable weather forecast conditions,resulting in temporary specific operating constraints for the sites.
Achieved NOx emissions levels
CONCAWE does not have survey data available on the NOx emissions. These values are notonly dependent on the fuels management but also from the operating conditions (excess air,temperature, etc.) and processes.
a) REAL NEW REFINERY CASE – Daily Variation of NOx single stack ELV
As observed for an SO2 bubble, similar large variations are observed on the short-term basis forsingle stack: the variation is very sensitive, even on a new built refinery, where feedstock ishowever not so varyiable.
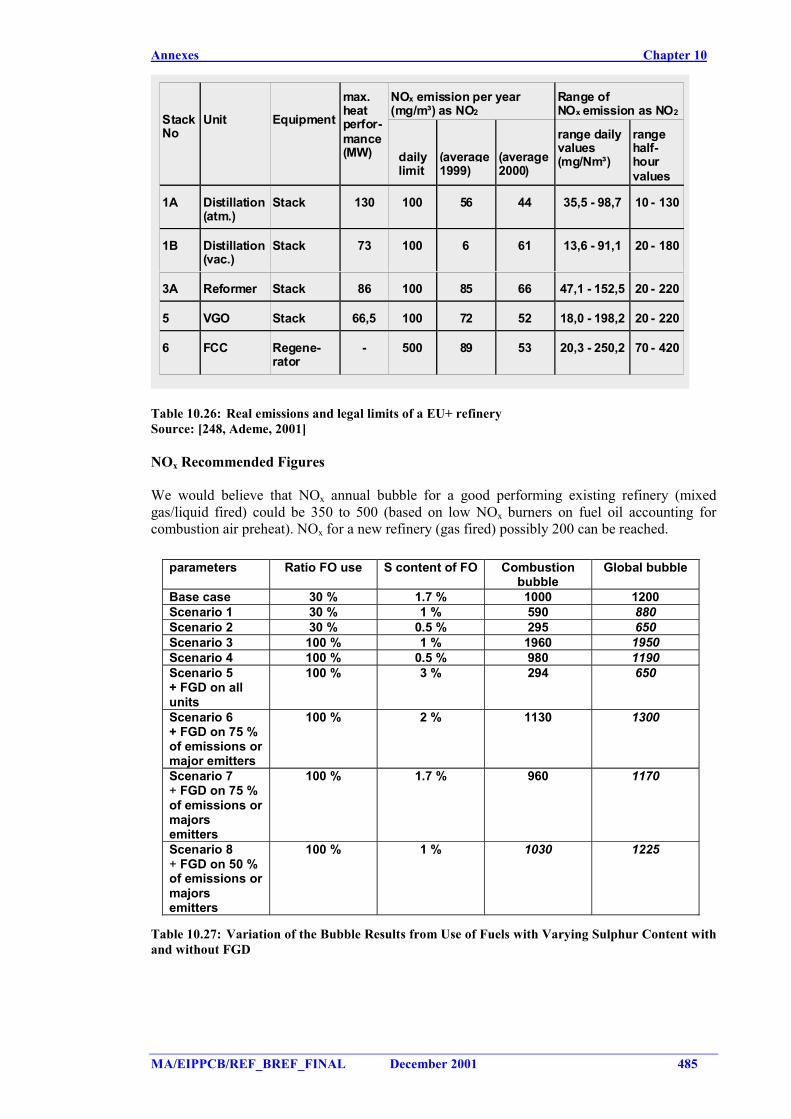
Annexes Chapter 10
MA/EIPPCB/REF_BREF_FINAL December 2001 485
NOx emission per year(mg/m³) as NO2
Range ofNOx emission as NO2Stack
NoUnit Equipment
max.heatperfor-mance(MW) daily
limit(average1999)
(average2000)
range dailyvalues(mg/Nm³)
rangehalf-hourvalues
1A Distillation(atm.)
Stack 130 100 56 44 35,5 - 98,7 10 - 130
1B Distillation(vac.)
Stack 73 100 6 61 13,6 - 91,1 20 - 180
3A Reformer Stack 86 100 85 66 47,1 - 152,5 20 - 220
5 VGO Stack 66,5 100 72 52 18,0 - 198,2 20 - 220
6 FCC Regene-rator
- 500 89 53 20,3 - 250,2 70 - 420
Table 10.26: Real emissions and legal limits of a EU+ refinerySource: [248, Ademe, 2001]
NOx Recommended Figures
We would believe that NOx annual bubble for a good performing existing refinery (mixedgas/liquid fired) could be 350 to 500 (based on low NOx burners on fuel oil accounting forcombustion air preheat). NOx for a new refinery (gas fired) possibly 200 can be reached.
parameters Ratio FO use S content of FO Combustionbubble
Global bubble
Base case 30 % 1.7 % 1000 1200Scenario 1 30 % 1 % 590 880Scenario 2 30 % 0.5 % 295 650Scenario 3 100 % 1 % 1960 1950Scenario 4 100 % 0.5 % 980 1190Scenario 5+ FGD on allunits
100 % 3 % 294 650
Scenario 6+ FGD on 75 %of emissions ormajor emitters
100 % 2 % 1130 1300
Scenario 7+ FGD on 75 %of emissions ormajorsemitters
100 % 1.7 % 960 1170
Scenario 8+ FGD on 50 %of emissions ormajorsemitters
100 % 1 % 1030 1225
Table 10.27: Variation of the Bubble Results from Use of Fuels with Varying Sulphur Content withand without FGD
Chapter 10 Annexes
486 December 2001 MA/EIPPCB/REF_BREF_FINAL
10.6 Annex VI. Proposals from two Member States on theimplementation of BAT in the refinery sector
Those are alternative text proposals given by the French delegation and the Italian delegation forsome parts of chapter 5 related with the emissions of SO2 and NOx. The main conclusion, as itcan be seen, is that the BAT sections on those two pollutants should be driven by the bubbleconcept. And consequently the BAT related with those pollutants should only be proposals forthe achievement of those environmental goals.
10.6.1 French proposals for the structure of some parts of Chapter 5
GENERAL BAT. REDUCTION OF SO2 EMISSIONSThe French delegation proposes reducing sulphur oxide emissions by the following steps:1. Mass balance of sulphur, through the whole refinery, to identify the main sulphur streams
(indicated in the graph in Figure 10.9 (see at the end of this Section)) and the overallpercentage of sulphur recovered (OPSR) in an inert form or trapped in products in an inertform (OPSR: methodology tool used to appreciate the influence of a technical measure onthe sulphur balance)
2. Quantification of the sulphur emissions of the different refinery sources being part of S2and S4 in order to clarify the bubble concept and to identify the main emitters in eachspecific case,
3. Selection, among the different technical options indicated below (described more preciselyin the specific BAT), the technical measures allowing to achieve the following globalindicative reference values (bubble benchmark)
600 mg/Nm3 (Monthly average),850 mg/Nm3 (Daily average),considering the possible cross-media (extra energy consumption, production of wasteand water effluents, atmospheric emissions outside the refinery, increase of residueproduction, etc...) and the cost effectiveness.Possible technical measures which could be implemented to fulfill the globalenvironmental goal include the following:
• switch to gaseous fuels if no other reasonable option can guarantee a betterevolution of the OPSR,
• improvement of gaseous and liquid fuels and feeds characteristics,• use of flue gas desulphurisation promoting regenerative techniques or techniques
leading to products which can be valorised and trapping sulphur in an inert form(This amount of sulphur has to be taken into account in the OPSR evaluation),
• DeSOx catalyst for the FCC,• maximisation of the sulphur stream S6,• flaring optimisation,• treatment of non condensable gases from the vacuum ejectors
Due to the specific characteristics of the sulphur recovery units for flue gases, it is additionalyconsidered that BAT is also to apply the specific BAT defined for this type of unit (seeSection 5.2.23).
The overall sulphur strategy should also lead to minimise S7 by increasing the conversion ofproducts without specifications with processes like cokers, hydrocracking, gasification, etc…,by improving the characteristics of these products or by having an external use ensuring that theenvironmental impact is minimised (cement plants, conversion in another refinery for example).This kind of external use has also to be taken into account in the OPSR calculation.
Annexes Chapter 10
MA/EIPPCB/REF_BREF_FINAL December 2001 487
GENERAL BAT. REDUCTION OF NOX EMISSIONSThe NOX BAT implementation process needs a prior quantification and characterisation of theemission sources. It follows, having in mind an environmental goal for the whole refinery (150mg/Nm3 (Monthly average), 200 mg/Nm3 (Daily Average)), definition of the priorities to reducethe global emission level taking into account environmental benefits, cost effectiveness andcross-media effects.
Primary measures have generally the highest cost effectiveness but also limited performancesespecially for liquid fuels. These measures can easily be implemented for new units but mayraise important integration problems with existing units. Given the limited cost of this type ofmeasure its promotion may be encouraged where possible.
The limited performance of the primary measures makes necessary to consider secondarymeasures, whose cost effectiveness considerations are of great importance. Its implementationshould be restricted to the main sources, e.g. those representing about 80% of the emissions ofthe whole refinery. Secondary measures includes three main abatement techniques: Reburning,SNCR (Selective non catalytic reduction) and SCR (Selective catalytic reduction) with a rangeof efficiencies (50 to 60%, 50 to 70 % and 80 to 90 %) and costs per tone of pollutant abated.
BAT can be considered an average abatement rate of 70 % for the sources representing 80% ofthe whole emission of a refinery. According to the principles described above, the combinationof primary and secondary measures allows to reduce the global rough emission level of arefinery by 60-80 % and to achieve average emission levels in the range of 100-150 mg/Nm3 ona long-term period.
Other techniques, such as catalytic combustion, or oxyfiring, may need also consideration andcould represent relevant technical measures to achieve the global BAT emission level above-mentioned.
Other technical options have been implemented in some world areas to achieve lower emissionlevels. In a refinery in California there was a switch from liquid to gaseous fuels andimplementation of secondary measures on gas fired units, achieving 20-30 mg/Nm3. In Japan ithas been applied hydrotreatment of liquid fuels and feeds combined with the implementation onan important number of SCR units, achieving 60-65 mg/Nm3.
However, although this type of environmental goal may be locally justified, it is not consideredthat these experiences represent at the time of writing a general level of BAT in the EUframework because of the direct cost of these measures and the other investments required tomanage the great amount of residues produced or to improve their characteristics.
CATALYTIC CRACKING NEW STRUCTUREIn most cases, the catalytic cracking is a source contributing to a large extend to the emission ofSOx, NOx, dust, metals, CO and SO2 of a refinery. Some measures on this specific unit may beconsidered fully justified from an environmental point of view in all cases but others have toevaluated in the global framework of the refinery. For this reason, this section has been splittedin specific BATs and technical options to consider in the global framework of the refinery.
The specific BATs include:
1. a CO-furnace boiler for partial oxidation conditions. The associated emission levels are lessthan 50 mg/Nm3 for CO and between 100-300 mg/Nm3 for NOx (see Section 4.5.3),
2. a monitoring and control of the oxygen excess (around 2%) for the full combustion mode.The associated emission levels are between 50-100 mg/Nm3 for CO and between 300 - 600mg/Nm3 for NOx (see Section 4.5.1),
Chapter 10 Annexes
488 December 2001 MA/EIPPCB/REF_BREF_FINAL
3. a reduction of particulates emission in the range 10 - 30 mg/Nm3 (metals (Ni, V, etc...) lessthan 5 mg/Nm3) by a suitable combination of the following techniques:
• then BAT on particulate emissions• text BAT on energy conservation,• text BAT on reduce discharges to water,• text BAT on reduce waste generation,• a yearly monitoring of the N2O emissions of the regenerator.
In addition, the FCC unit may be a major source of NOx and SOx. In this case, several technicaloptions described below have to be considered and evaluated alone or in combination:
• the hydro-treatment of the feedstock (economical and technical viability are described in theSection 4.5.4). The main purpose of this technique is to reduce the sulphur content of thefeed but this option has also a positive influence on NOx, metals and on the product quality.Most units around the world (California for example) are designed to achieve 300 to 500ppm in the feedstock,
• flue gas desulphurisation; depending on the process considered and the running conditions,the abatement rate may vary between 50 and 90 %. These techniques may produce largeamounts of residues and water effluents,
• DeSOx catalyst. This technique may have a limited efficiency and involves an importantconsumption of catalyst. This option is probably more suitable to solve peak pollutionproblems,
• DeNOx measures such as SCR (abatement rate between 80-90%) and SNCR (abatementrate between 50 and 70 %) (these techniques have an associated emission of ammoniawhich can be limited to 10 mg/Nm3 and it has to be pointed out that SCR is much morecommon for FCC units than SNCR) or modifications concerning the design of the unitwhich can induce a trade-off between NOx and CO emissions.
These technical options allow thus to achieve ranges as low as 50 - 200 mg/Nm3 for SOx as SO2and 50 - 100 mg/Nm3 for NOx as NO2. Their combination has to be optimised concerningperformances in regard of the different parameters, energy consumption, waste and watereffluents and cost effectiveness. They may not be justified in all refinery frameworks but haveto be considered to fulfil the whole environmental goal of a refinery.
BAT PROCESS PER PROCESS ENERGY SYSTEM
The energy system is the main source of air pollution of a refinery, however, due to the diversityof the units used (boilers, furnaces, turbines), their characteristics (size, age, type of burners,purpose) and their running conditions (air preheat, fuels used, temperature requirements, oxygenexcess and type of control), the strategy to reduce the environmental impact of these units canonly be given by the general guidelines described below.
Firstly, it is necessary to have an overview of the fuels used by the refinery, types of combustionunits, and characteristics of the air emissions (concentration and mass flow) for the mainpollutants (SOx, NOx, dust, metals, carbone oxides).
On these bases, the first step is to consider technical options which seems totally justified froman economical point of view. This category includes specific BATs such as:
• the use of clean refinery gaseous fuels (H2S content between 20 and 100 mg/Nm3),• the reduction of CO emissions below 50 mg/Nm3 with efficient combustion techniques, the
reduction of dust emissions in the range 10 - 20 mg/Nm3 (metal content (Ni, V, etc...below5 mg/Nm3) applying the suitable following combination of techniques (improvement of fuelcharacteristics, steam atomisation for liquid fuels, ESP or bag filter),
Annexes Chapter 10
MA/EIPPCB/REF_BREF_FINAL December 2001 489
• the use of primary DeNOx measures for new units, existing ones when these measures canbe implemented quite easily and in the other cases during the major rebuilding of theseunits. The achievable emission levels with primary DeNOx techniques are the following:Gaseous fuels (30 to 100 mg/Nm3 for boilers and heaters, 50 to 100 mg/Nm3 at 15% O2 forgas turbines - the lowest values are more likely achieved with natural gas and the highestwith refinery fuel gas but a lot of other parameters may influence the performance level),liquid fuels (200 to 400 mg/Nm3 for boilers and furnaces -the performance level is mainlyinfluenced by the nitrogen content of the fuel even if other parameters need also to beconsidered).
• It is also considered in this category to (add Section 101).
The second step consists of analysing the relevancy of the following basket of techniques in theglobal framework of a refinery concerning NOx and SOx for the main sources (see SOx and NOxsections of the general BAT):
• improvement of liquid fuels and feeds characteristics,• use of flue gas desulphurisation promoting regenerative techniques or techniques
leading to products which can be valorised and trapping sulphur in an inert form,• switch to gaseous fuels if no other reasonable option can guarantee a better evolution of the
overall percentage of sulphur recovery (OPSR), of the amount of residue produced and ofthe SOx, NOx and dust abatement rates. It has to be reminded that gaseous fuels having ahigher ratio H/C contribute to lower the SO2 emissions,
• reburning (for boilers and furnaces), SNCR (Selective non catalytic reduction) and SCR(Selective catalytic reduction) with various efficiencies (50 to 60%, 50 to 70 % and 80 to 90%) and costs per tone of pollutant avoided.
These last two techniques induce NH3 emissions which can be kept below 10 mg/Nm3.The application of these techniques or of a combination of these techniques may allow toachieve emission levels lower than 50 mg/Nm3 for NOx (as NO2) and 100 mg/Nm3 for SOx (asSO2) on any kind of the energy system sources, but the partial or complete implementation ofthese options on a specific unit has to be examined in the global framework of the refinery.
The technico-economical analysis may lead to select a less ambitious option concerningperformances allowing nevertheless to achieve the global environmental target at the refinerylevel. On the contrary, better performances may be proposed through technical options likecatalytic combustion for turbines (NOx level lower than 2.5 ppm)
BAT FOR STORAGE
First proposal is to define an upper limit (volume and pressure) to store a liquid in another waythan a pressurised tank designed to prevent any direct organic vapour loss to the atmosphere(connection to a vapour recovery unit with an efficiency of more than 95%). This limit could be70 kPa concerning the pressure under storage conditions and 150 m3 for the volume.
Then, a second limit (volume: 150 m3 and pressure under storage conditions: 3.5 kPa) could beindicated concerning the following technical choices: pressurised tank designed to prevent anydirect organic vapour loss to the atmosphere (connection to a vapour recovery unit with anefficiency of more than 95%) or external floating roof with two seals (one above the other) orfor new fixed roof storages connection to a vapour recovery unit with an efficiency of more than95% and for existing fixed roof storages installation of an internal floating- type cover with twoseals or connection to a vapour recovery unit with an efficiency of more than 95%.
For storages non connected to a vapour recovery unit, BAT is also to paint the external wallsand the roof with a material having a radiant heat reflection index of at least 70%. This BATcould apply to facilities that load organic liquids with a vapour pressure higher than 10500 Pa
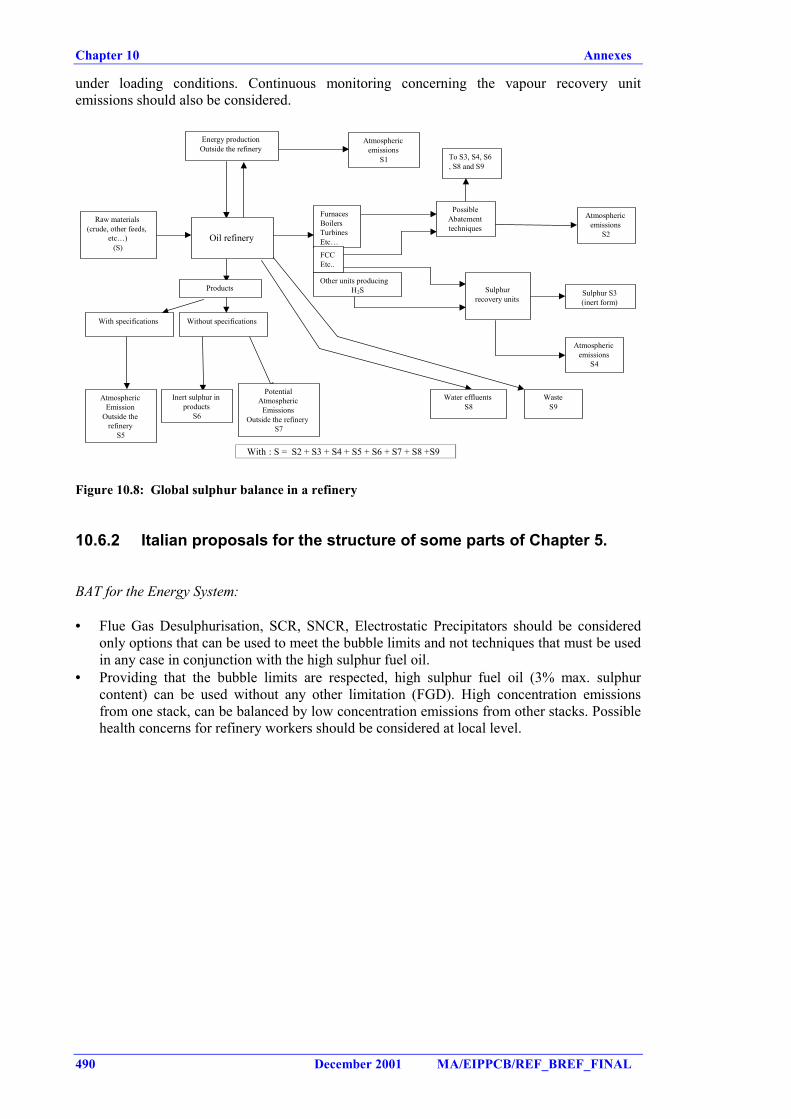
Chapter 10 Annexes
490 December 2001 MA/EIPPCB/REF_BREF_FINAL
under loading conditions. Continuous monitoring concerning the vapour recovery unitemissions should also be considered.
With : S = S2 + S3 + S4 + S5 + S6 + S7 + S8 +S9
Atmosphericemissions
S1
Oil refinery
Products
Raw materials(crude, other feeds,
etc…)(S)
FurnacesBoilersTurbinesEtc…
Sulphurrecovery units
With specifications Without specifications
Energy productionOutside the refinery
Inert sulphur inproducts
S6
AtmosphericEmission
Outside therefinery
S5
PotentialAtmospheric
EmissionsOutside the refinery
S7
Sulphur S3(inert form)
PossibleAbatementtechniques
FCCEtc...Other units producing
H2S
Atmosphericemissions
S4
Water effluentsS8
WasteS9
Atmosphericemissions
S2
To S3, S4, S6, S8 and S9
Figure 10.8: Global sulphur balance in a refinery
10.6.2 Italian proposals for the structure of some parts of Chapter 5.
BAT for the Energy System:
• Flue Gas Desulphurisation, SCR, SNCR, Electrostatic Precipitators should be consideredonly options that can be used to meet the bubble limits and not techniques that must be usedin any case in conjunction with the high sulphur fuel oil.
• Providing that the bubble limits are respected, high sulphur fuel oil (3% max. sulphurcontent) can be used without any other limitation (FGD). High concentration emissionsfrom one stack, can be balanced by low concentration emissions from other stacks. Possiblehealth concerns for refinery workers should be considered at local level.