bc1 front cover rev2 - international plant...
TRANSCRIPT
BETTER CROPSWITH PLANT FOODA Publication of the International Plant Nutrition Institute (IPNI) 2016 Number 1
www.ipni.net
In This Issue...
...and much more
Purple: Its Link to Phosphorus Defi ciency
Interview with IPNI Science Award Winner Our Photo Contest Winners
Nutrient Considerations for Low Corn Prices
Cropping System’s Impact of Soil K Status in China
Also:
VOLUME
Vol. C (100) 2016, No. 1Our cover: Our 100th volume milestone with selected issue covers from 1923 to 2015.Photo by: © istockphoto/art_vorEditor: Gavin D. SulewskiAssistant Editor: Sharon Jollay Circulation Manager: Wendy Hollifi eldDesign: Rob LeMasterBack page illustration: Greg Cravens
INTERNATIONAL PLANT NUTRITION INSTITUTE (IPNI) Mostafa Terrab, Chairman (OCP Group) Oleg Petrov, Vice Chairman (Uralkali) Tony Will, Finance Committee Chair (CF Industries)HEADQUARTERS—Peachtree Corners, Georgia, U.S. T.L. Roberts, President S.J. Couch, Vice President, Administration R.L. Mikkelsen, Vice President, Communications B. Green, IT Manager B. Rose, Statistics/Accounting C. Smith, Administrative Assistant A. Williams, Communications Specialist Nitrogen Program C.S. Snyder, Conway, Arkansas, U.S. Phosphorus Program T.W. Bruulsema, Guelph, Ontario, CanadaASIA /AFRICA AND MID. EAST GROUP—Saskatoon, Saskatchewan, Canada A.M. Johnston, Vice President L.M. Doell, Corporate Secretary and Administrative Assistant China Program P. He, Beijing S. Li, Beijing F. Chen, Wuhan, Hubei S. Tu, Chengdu, Sichuan South Asia Program K. Majumdar, Gurgaon, Haryana, India T. Satyanarayana, Hyderabad, Telangana, India S. Dutta, Kolkata, West Bengal, India Southeast Asia Program T. Oberthür, Penang, Malaysia M. Pampolino, Manila, Philippines North Africa Program M. El Gharous, Settat, Morocco H. Boulal, Settat, Morocco Sub-Saharan Africa Program S. Zingore, Nairobi, Kenya Middle East Program M. Rusan, Irbid, JordanAMERICAS AND OCEANIA GROUP—Brookings, South Dakota, U.S. P.E. Fixen, Senior Vice President, and Director of Research P. Pates, Administrative Assistant North American Program T.L. Jensen, Saskatoon, Saskatchewan, Canada R.L. Mikkelsen, Merced, California, U.S. T.S. Murrell, West Lafayette, Indiana, U.S. S.B. Phillips, Owens Cross Roads, Alabama, U.S. W.M. Stewart, San Antonio, Texas, U.S. Brazil Program L.I. Prochnow, Piracicaba, São Paulo V. Casarin, Piracicaba, São Paulo E. Francisco, Rondonópolis, Mato Grosso Northern Latin America Program R. Jaramillo, Quito, Ecuador Mexico and Central America Program A.S. Tasistro, Peachtree Corners, Georgia, U.S. Latin America-Southern Cone Program F.O. Garcia, Buenos Aires, Argentina Australia and New Zealand Program R. Norton, Horsham, Victoria, AustraliaE. EUROPE AND C. ASIA GROUP—Moscow, Russia S. Ivanova, Vice President V. Nosov, Krasnodar, RussiaBETTER CROPS WITH PLANT FOOD (ISSN:0006-0089) is published quarterly by the International Plant Nutrition Institute (IPNI). Periodicals postage paid at Peachtree Corners, GA, and at ad-ditional mailing offi ces (USPS 012-713). Subscriptions free on request to qualifi ed individuals; others $8.00 per year or $2.00 per issue.Address changes may be e-mailed to: whollifi [email protected]: Send address changes to Better Crops with Plant Food, 3500 Parkway Lane, Suite 550, Peachtree Corners, GA 30092-2844. Phone (770) 447-0335; fax (770) 448-0439. Website: www.ipni.net. Copyright 2015 by International Plant Nutrition Institute.
Better Crops with Plant Food is registered in Canada Post.Publications mail agreement No. 40035026Return undeliverable Canadian addresses to: PO Box 2600 Mississauga ON L4T 0A9 Canada
C O N T E N T SBETTER CROPS WITH PLANT FOOD
IPNI thanks the Government of Saskatchewan for their support of this publication through its resource tax funding.
IPNI Members:• Agrium Inc. • Arab Potash Company • BHP Billiton • CF Industries Holdings, Inc. • Compass Minerals Plant Nutrition • International Raw Materials LTD • K+S KALI GmbH • LUXI Fertilizer Industry Group • OCP S.A. • PhosAgro • PotashCorp • QAFCO • Shell Sulphur Solutions • Simplot • Sinofert Holdings Limited • SQM • The Mosaic Company • Toros Tarim • Uralchem, JSC • UralkaliAffi liate Members:• Arab Fertilizer Association (AFA) • Associação Nacional para Difusão de Adubos (ANDA) • Fertiliser Association of India (FAI) • Fertilizer Canada• International Fertilizer Industry Association (IFA) • International Potash Institute (IPI) • The Fertilizer Institute (TFI) • The Sulphur Institute (TSI)
Note to Readers: Articles which appear in this issue of Better Crops with Plant Food can be found at: >www.ipni.net/bettercrops<
Drought and Soil Salinity Infl uence Response of Cereals 20to Potassium and Sulfur Fertilization Qifu Ma, Richard Bell, Craig Scanlan, Gavin Sarre, and Ross Brennan
Importance of Phosphorus Management in 17Maize-Wheat Cropping Systems Rakesh Kumar, S. Karmakar, A.K. Sarkar, Sudarshan Dutta, Kaushik Majumdar, T. Satyanarayana, and Adrian M. Johnston
Fertilization Practices in Tunisian 9High-Density Olive Planting Systems Ajmi Larbi, Monji Msallem, Sofi ene Mestaoui, Mohamed Bechir Sai, Mohamed El Gharous, and Hakim Boulal
Double Standards 24 Eros Francisco
An Interview with 2015 IPNI Science 3Award Winner - Dr. Cynthia Grant
Potassium Changes in Soils Managed for Cash or Grain Crops 6 Ping He, Fang Chen, Shutian Li, Shihua Tu, and Adrian M. Johnston
The Colors in Phosphorus Defi cient Plants 14 Tom Bruulsema
2015 Crop Nutrient Defi ciency Photo Contest Winners 12
Nutrient Considerations for Low Corn Prices 4 T. Scott Murrell
Dr. Mirasol Pampolino Named Deputy Director 23For IPNI Southeast Asia Program
Information About the 2016 InfoAg Conference 23
Better C
rops/Vol. 100 (2016, No. 1)
3
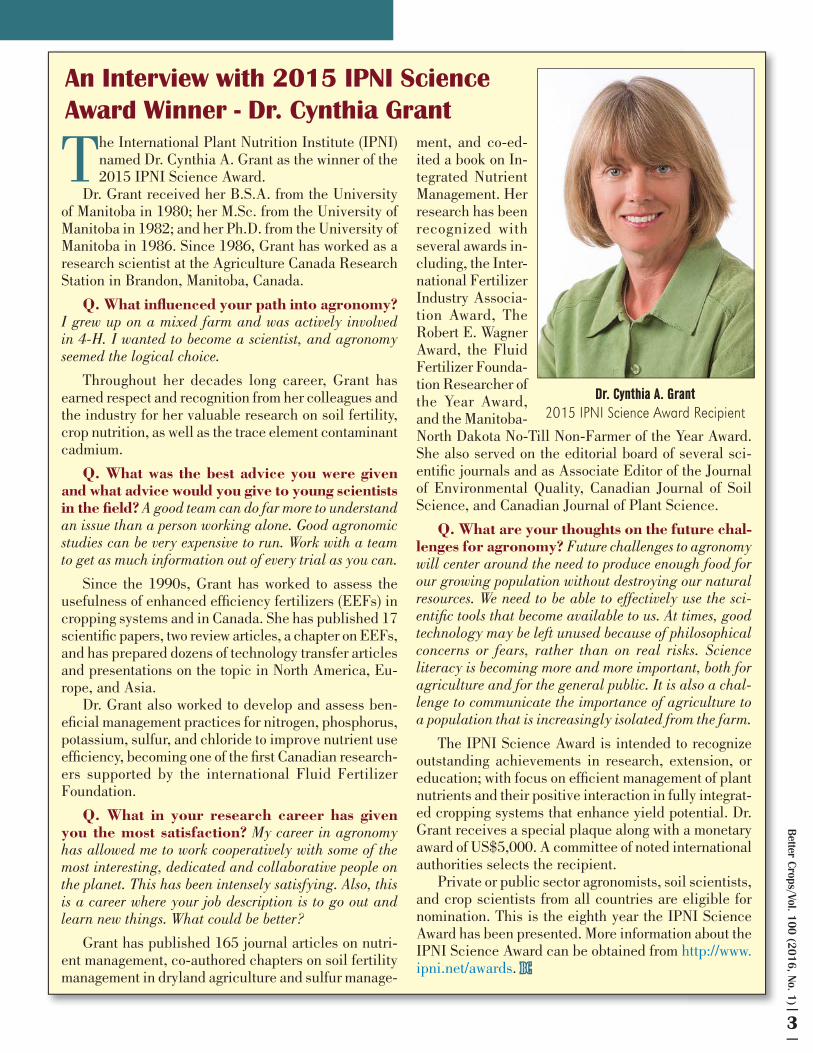
The International Plant Nutrition Institute (IPNI) named Dr. Cynthia A. Grant as the winner of the 2015 IPNI Science Award.
Dr. Grant received her B.S.A. from the University of Manitoba in 1980; her M.Sc. from the University of Manitoba in 1982; and her Ph.D. from the University of Manitoba in 1986. Since 1986, Grant has worked as a research scientist at the Agriculture Canada Research Station in Brandon, Manitoba, Canada.
Q. What infl uenced your path into agronomy? I grew up on a mixed farm and was actively involved in 4-H. I wanted to become a scientist, and agronomy seemed the logical choice.
Throughout her decades long career, Grant has earned respect and recognition from her colleagues and the industry for her valuable research on soil fertility, crop nutrition, as well as the trace element contaminant cadmium.
Q. What was the best advice you were given and what advice would you give to young scientists in the fi eld? A good team can do far more to understand an issue than a person working alone. Good agronomic studies can be very expensive to run. Work with a team to get as much information out of every trial as you can.
Since the 1990s, Grant has worked to assess the usefulness of enhanced effi ciency fertilizers (EEFs) in cropping systems and in Canada. She has published 17 scientifi c papers, two review articles, a chapter on EEFs, and has prepared dozens of technology transfer articles and presentations on the topic in North America, Eu-rope, and Asia.
Dr. Grant also worked to develop and assess ben-efi cial management practices for nitrogen, phosphorus, potassium, sulfur, and chloride to improve nutrient use effi ciency, becoming one of the fi rst Canadian research-ers supported by the international Fluid Fertilizer Foundation.
Q. What in your research career has given you the most satisfaction? My career in agronomy has allowed me to work cooperatively with some of the most interesting, dedicated and collaborative people on the planet. This has been intensely satisfying. Also, this is a career where your job description is to go out and learn new things. What could be better?
Grant has published 165 journal articles on nutri-ent management, co-authored chapters on soil fertility management in dryland agriculture and sulfur manage-
ment, and co-ed-ited a book on In-tegrated Nutrient Management. Her research has been recognized with several awards in-cluding, the Inter-national Fertilizer Industry Associa-tion Award, The Robert E. Wagner Award, the Fluid Fertilizer Founda-tion Researcher of the Year Award, and the Manitoba-North Dakota No-Till Non-Farmer of the Year Award. She also served on the editorial board of several sci-entifi c journals and as Associate Editor of the Journal of Environmental Quality, Canadian Journal of Soil Science, and Canadian Journal of Plant Science.
Q. What are your thoughts on the future chal-lenges for agronomy? Future challenges to agronomy will center around the need to produce enough food for our growing population without destroying our natural resources. We need to be able to effectively use the sci-entifi c tools that become available to us. At times, good technology may be left unused because of philosophical concerns or fears, rather than on real risks. Science literacy is becoming more and more important, both for agriculture and for the general public. It is also a chal-lenge to communicate the importance of agriculture to a population that is increasingly isolated from the farm.
The IPNI Science Award is intended to recognize outstanding achievements in research, extension, or education; with focus on effi cient management of plant nutrients and their positive interaction in fully integrat-ed cropping systems that enhance yield potential. Dr. Grant receives a special plaque along with a monetary award of US$5,000. A committee of noted international authorities selects the recipient.
Private or public sector agronomists, soil scientists, and crop scientists from all countries are eligible for nomination. This is the eighth year the IPNI Science Award has been presented. More information about the IPNI Science Award can be obtained from http://www.ipni.net/awards. BCBC
An Interview with 2015 IPNI Science Award Winner - Dr. Cynthia Grant
Dr. Cynthia A. Grant2015 IPNI Science Award Recipient
4
Bet
ter
Cro
ps/V
ol. 1
00 (
2016
, No.
1)
Abbreviations and notes: N = nitrogen; P = phosphorus; K = potassium.
It is important to take advantage of the nutrient-supplying power that exists within individual fi elds. Soil test results provide the best guidance for deciding which nutrients
should be applied and how much of them to use. If soil test levels of P and K are high, there is little chance that an eco-nomic response to these nutrients will occur in the year of application. In such cases, producers can take advantage of existing soil nutrient supplies. However, this approach must be done with the understanding that supplies will need to be replenished later to avoid future nutrient defi ciencies and as-sociated revenue losses.
Taking N credits for previous crops is an important part of buying only what is needed. Many people also forget that with some crops, such as alfalfa, lower N application rates may be justifi ed for crops planted up to 2 years after termination of the stand (Yost et al., 2014a, b).
An often overlooked, but effective tool is the soil nitrate test. This test helps producers account for the nitrate already present in their soils. If levels are high enough, freshly applied N rates can be reduced, or in some cases, omitted. This test is particularly useful where manure applications have been made, previous crop yields were poor, or climatic conditions are dry.
Account for Nutrient Supplies on the Farm or NearbyIf there is access to manure, use it as effectively as possible.
Also, be sure that you know the nutrient content of the manure and the rate at which manure is applied, so you can calculate how much of each nutrient is being put on. If you have previ-ously felt that spreader calibration and manure testing were too time consuming or too expensive to deal with, this may be the year to reconsider. If manure application equipment is dated, it may be time to run the numbers and see if updated equipment capable of applying lower, agronomic rates can be justifi ed. In some cases, manure application rates can be cut in half and still meet crop needs, allowing manure to be a nutrient source on more acres.
Time Nutrient Applications for Highest Effi ciencySpring fertilizer applications provide N at a time closer
to crop need, reducing the chances for loss. However, spring applications can also carry higher logistical risks, since con-ditions are typically wetter than in the fall and time is more limited. In some areas, fall N applications can be effective if they are made when soil temperatures drop below 50°F (10°C) and remain there. Nitrifi cation inhibitors can also reduce or eliminate N losses from fall to spring.
Splitting the total N application across various times in the
season can sometimes increase N recovery by the crop. Several options exist. For example, a pre-plant application combined with a second application during early vegetative growth stages is an often-used split.
Whenever possible, manure applications should be made close to the time of crop need, such as the spring.
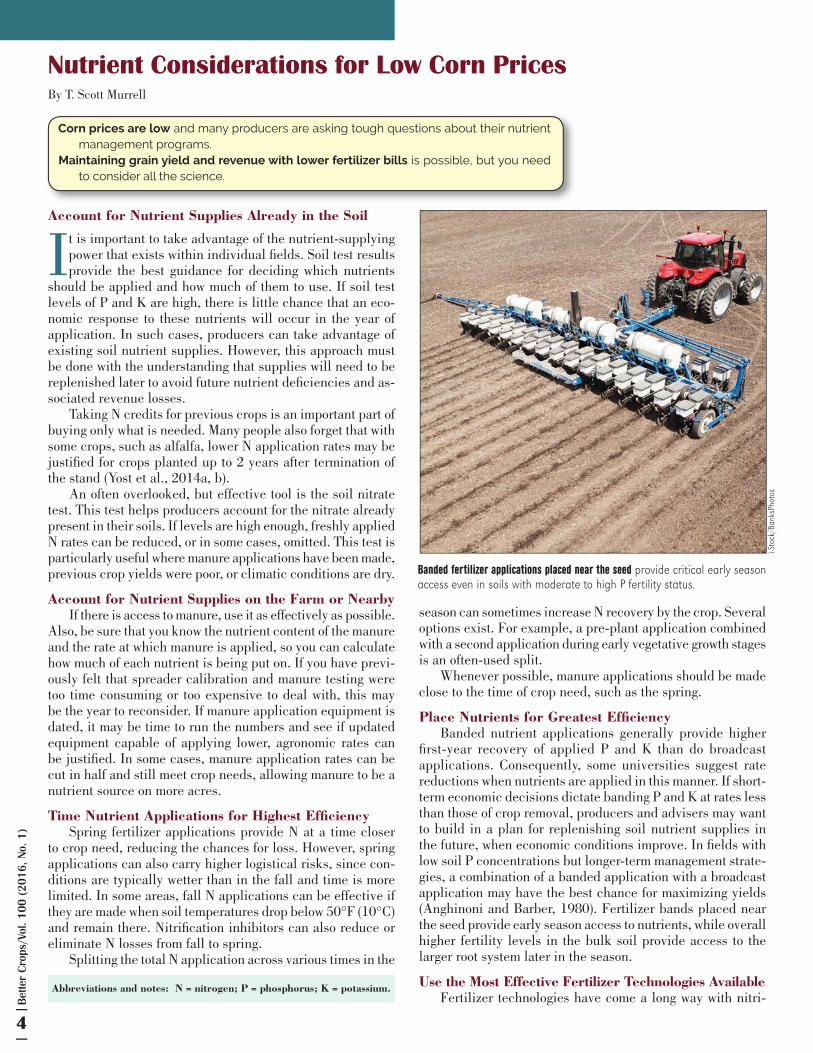
Place Nutrients for Greatest Effi ciencyBanded nutrient applications generally provide higher
fi rst-year recovery of applied P and K than do broadcast applications. Consequently, some universities suggest rate reductions when nutrients are applied in this manner. If short-term economic decisions dictate banding P and K at rates less than those of crop removal, producers and advisers may want to build in a plan for replenishing soil nutrient supplies in the future, when economic conditions improve. In fi elds with low soil P concentrations but longer-term management strate-gies, a combination of a banded application with a broadcast application may have the best chance for maximizing yields (Anghinoni and Barber, 1980). Fertilizer bands placed near the seed provide early season access to nutrients, while overall higher fertility levels in the bulk soil provide access to the larger root system later in the season.
Use the Most Effective Fertilizer Technologies AvailableFertilizer technologies have come a long way with nitri-
By T. Scott Murrell
Nutrient Considerations for Low Corn Prices
i-Sto
ck/B
anks
Phot
os
Corn prices are low and many producers are asking tough questions about their nutrient management programs.
Maintaining grain yield and revenue with lower fertilizer bills is possible, but you need to consider all the science.
Account for Nutrient Supplies Already in the Soil
Banded fertilizer applications placed near the seed provide critical early season access even in soils with moderate to high P fertility status.
Better C
rops/Vol. 100 (2016, No. 1)
5
fi cation inhibitors, urease inhibitors, and controlled-release fertilizers being just some of the options available. Be sure to understand these products thoroughly and examine university research that tests their effi cacy. There are situations where these products provide an advantage. Know the conditions under which they have the best chances of making a difference.
Allocate Money to the Right NutrientsIn times like these, many emphasize that N needs must
come fi rst. Before jumping to this conclusion, soil test levels of a fi eld or fi eld area must be examined. In the worst case, it may be found that N, P and K are all in short supply. When this happens, crop response to any single nutrient will be limited if only that nutrient is applied. When P levels are low, the plant has a reduced supply of stored energy. Without enough energy, the plant is not effective in absorbing limited soil N, P or K supplies. In these cases, if recommended rates of each nutrient cannot be afforded, it is best to band at least low rates of P and K near the seed as part of the N fertilization program. This balanced approach will maximize the effectiveness of all applied nutrients.
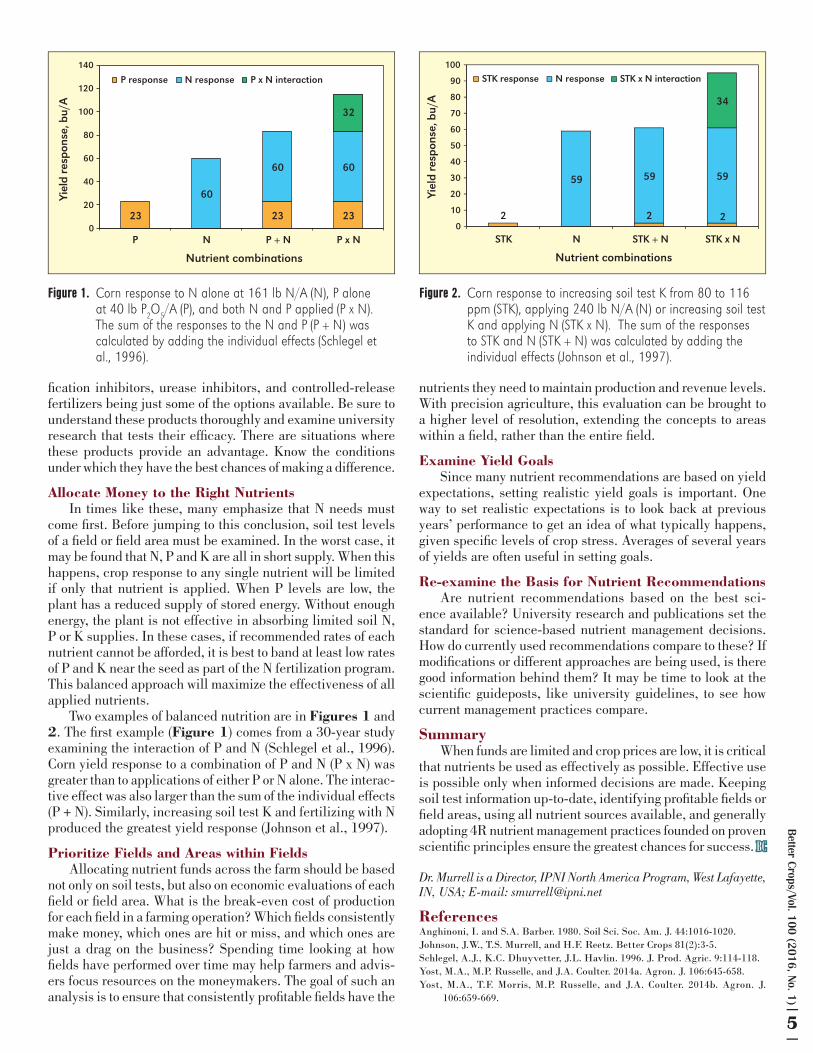
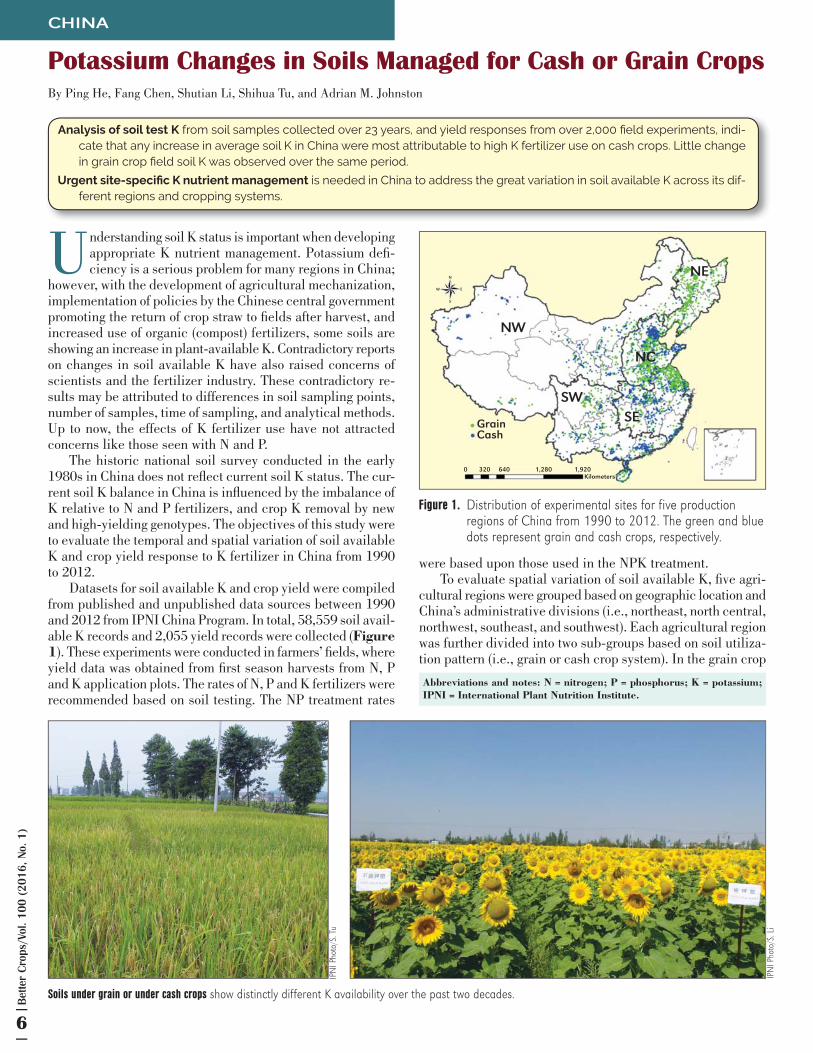
Two examples of balanced nutrition are in Figures 1 and 2. The fi rst example (Figure 1) comes from a 30-year study examining the interaction of P and N (Schlegel et al., 1996). Corn yield response to a combination of P and N (P x N) was greater than to applications of either P or N alone. The interac-tive effect was also larger than the sum of the individual effects (P + N). Similarly, increasing soil test K and fertilizing with N produced the greatest yield response (Johnson et al., 1997).
Prioritize Fields and Areas within FieldsAllocating nutrient funds across the farm should be based
not only on soil tests, but also on economic evaluations of each fi eld or fi eld area. What is the break-even cost of production for each fi eld in a farming operation? Which fi elds consistently make money, which ones are hit or miss, and which ones are just a drag on the business? Spending time looking at how fi elds have performed over time may help farmers and advis-ers focus resources on the moneymakers. The goal of such an analysis is to ensure that consistently profi table fi elds have the
nutrients they need to maintain production and revenue levels. With precision agriculture, this evaluation can be brought to a higher level of resolution, extending the concepts to areas within a fi eld, rather than the entire fi eld.
Examine Yield GoalsSince many nutrient recommendations are based on yield
expectations, setting realistic yield goals is important. One way to set realistic expectations is to look back at previous years’ performance to get an idea of what typically happens, given specifi c levels of crop stress. Averages of several years of yields are often useful in setting goals.
Re-examine the Basis for Nutrient RecommendationsAre nutrient recommendations based on the best sci-
ence available? University research and publications set the standard for science-based nutrient management decisions. How do currently used recommendations compare to these? If modifi cations or different approaches are being used, is there good information behind them? It may be time to look at the scientifi c guideposts, like university guidelines, to see how current management practices compare.
SummaryWhen funds are limited and crop prices are low, it is critical
that nutrients be used as effectively as possible. Effective use is possible only when informed decisions are made. Keeping soil test information up-to-date, identifying profi table fi elds or fi eld areas, using all nutrient sources available, and generally adopting 4R nutrient management practices founded on proven scientifi c principles ensure the greatest chances for success. BCBC
Dr. Murrell is a Director, IPNI North America Program, West Lafayette, IN, USA; E-mail: [email protected]
ReferencesAnghinoni, I. and S.A. Barber. 1980. Soil Sci. Soc. Am. J. 44:1016-1020.Johnson, J.W., T.S. Murrell, and H.F. Reetz. Better Crops 81(2):3-5.Schlegel, A.J., K.C. Dhuyvetter, J.L. Havlin. 1996. J. Prod. Agric. 9:114-118.Yost, M.A., M.P. Russelle, and J.A. Coulter. 2014a. Agron. J. 106:645-658.Yost, M.A., T.F. Morris, M.P. Russelle, and J.A. Coulter. 2014b. Agron. J.
106:659-669.
Figure 1. Corn response to N alone at 161 lb N/A (N), P alone at 40 lb P2O5/A (P), and both N and P applied (P x N). The sum of the responses to the N and P (P + N) was calculated by adding the individual effects (Schlegel et al., 1996).
Figure 2. Corn response to increasing soil test K from 80 to 116 ppm (STK), applying 240 lb N/A (N) or increasing soil test K and applying N (STK x N). The sum of the responses to STK and N (STK + N) was calculated by adding the individual effects (Johnson et al., 1997).
23 23 23
60
60 60
0
20
40
60
80
100
120
140
P N P + N P x N
Yiel
d re
spon
se, b
u/A
Nutrient combinations
P response N response P x N interaction
32
2 2 2
59 59 59
34
0
10
20
30
40
50
60
70
80
90
100
STK N STK + N STK x N
Yiel
d re
spon
se, b
u/A
Nutrient combinations
STK response N response STK x N interaction
6
Bet
ter
Cro
ps/V
ol. 1
00 (
2016
, No.
1)
Abbreviations and notes: N = nitrogen; P = phosphorus; K = potassium; IPNI = International Plant Nutrition Institute.
CHINA
Understanding soil K status is important when developing appropriate K nutrient management. Potassium defi -ciency is a serious problem for many regions in China;
however, with the development of agricultural mechanization, implementation of policies by the Chinese central government promoting the return of crop straw to fi elds after harvest, and increased use of organic (compost) fertilizers, some soils are showing an increase in plant-available K. Contradictory reports on changes in soil available K have also raised concerns of scientists and the fertilizer industry. These contradictory re-sults may be attributed to differences in soil sampling points, number of samples, time of sampling, and analytical methods. Up to now, the effects of K fertilizer use have not attracted concerns like those seen with N and P.
The historic national soil survey conducted in the early 1980s in China does not refl ect current soil K status. The cur-rent soil K balance in China is infl uenced by the imbalance of K relative to N and P fertilizers, and crop K removal by new and high-yielding genotypes. The objectives of this study were to evaluate the temporal and spatial variation of soil available K and crop yield response to K fertilizer in China from 1990 to 2012.
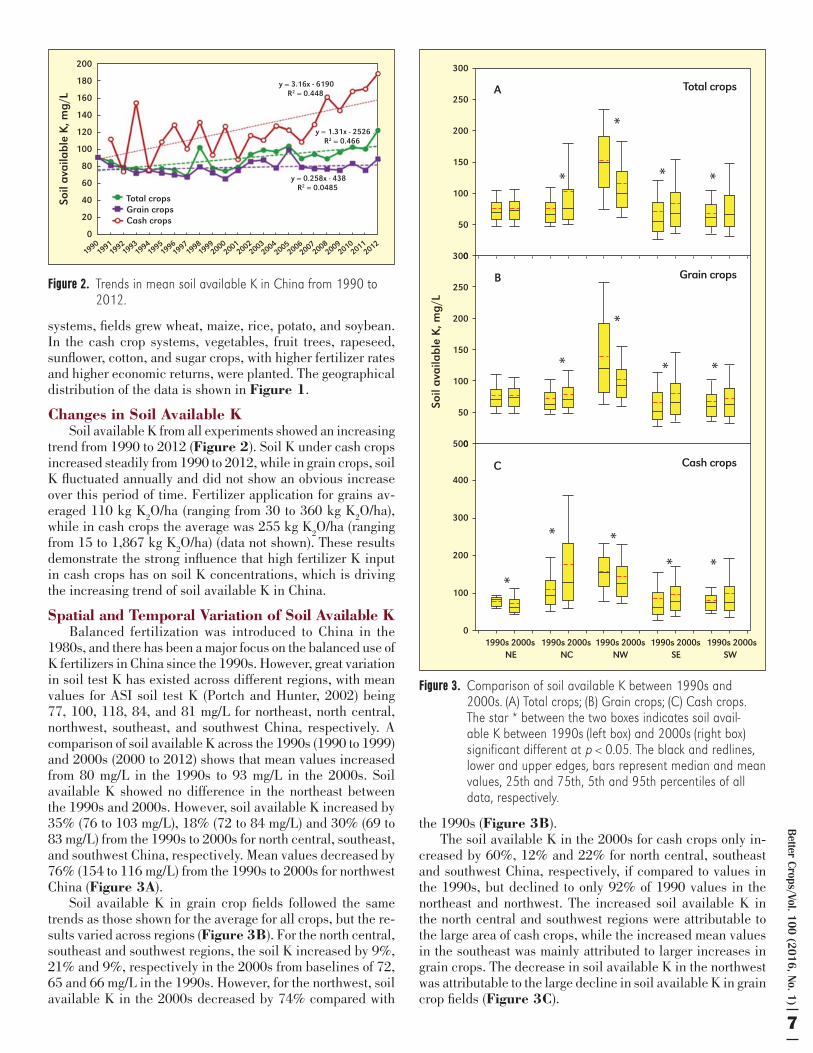
Datasets for soil available K and crop yield were compiled from published and unpublished data sources between 1990 and 2012 from IPNI China Program. In total, 58,559 soil avail-able K records and 2,055 yield records were collected (Figure 1). These experiments were conducted in farmers’ fi elds, where yield data was obtained from fi rst season harvests from N, P and K application plots. The rates of N, P and K fertilizers were recommended based on soil testing. The NP treatment rates
were based upon those used in the NPK treatment.To evaluate spatial variation of soil available K, fi ve agri-
cultural regions were grouped based on geographic location and China’s administrative divisions (i.e., northeast, north central, northwest, southeast, and southwest). Each agricultural region was further divided into two sub-groups based on soil utiliza-tion pattern (i.e., grain or cash crop system). In the grain crop
By Ping He, Fang Chen, Shutian Li, Shihua Tu, and Adrian M. Johnston
Potassium Changes in Soils Managed for Cash or Grain Crops
Figure 1. Distribution of experimental sites for five production regions of China from 1990 to 2012. The green and blue dots represent grain and cash crops, respectively.
IPN
I Pho
to/S
. Tu
Analysis of soil test K from soil samples collected over 23 years, and yield responses from over 2,000 fi eld experiments, indi-cate that any increase in average soil K in China were most attributable to high K fertilizer use on cash crops. Little change in grain crop fi eld soil K was observed over the same period.
Urgent site-specifi c K nutrient management is needed in China to address the great variation in soil available K across its dif-ferent regions and cropping systems.
N
S
W E
GrainCash
Kilometers0 320 640 1,280 1,920
NC
NE
SWSE
NW
IPN
I Pho
to/S
. Li
Soils under grain or under cash crops show distinctly different K availability over the past two decades.
Better C
rops/Vol. 100 (2016, No. 1)
7
systems, fi elds grew wheat, maize, rice, potato, and soybean. In the cash crop systems, vegetables, fruit trees, rapeseed, sunfl ower, cotton, and sugar crops, with higher fertilizer rates and higher economic returns, were planted. The geographical distribution of the data is shown in Figure 1.
Changes in Soil Available KSoil available K from all experiments showed an increasing
trend from 1990 to 2012 (Figure 2). Soil K under cash crops increased steadily from 1990 to 2012, while in grain crops, soil K fl uctuated annually and did not show an obvious increase over this period of time. Fertilizer application for grains av-eraged 110 kg K
2O/ha (ranging from 30 to 360 kg K
2O/ha),
while in cash crops the average was 255 kg K2O/ha (ranging
from 15 to 1,867 kg K2O/ha) (data not shown). These results
demonstrate the strong infl uence that high fertilizer K input in cash crops has on soil K concentrations, which is driving the increasing trend of soil available K in China.
Spatial and Temporal Variation of Soil Available KBalanced fertilization was introduced to China in the
1980s, and there has been a major focus on the balanced use of K fertilizers in China since the 1990s. However, great variation in soil test K has existed across different regions, with mean values for ASI soil test K (Portch and Hunter, 2002) being 77, 100, 118, 84, and 81 mg/L for northeast, north central, northwest, southeast, and southwest China, respectively. A comparison of soil available K across the 1990s (1990 to 1999) and 2000s (2000 to 2012) shows that mean values increased from 80 mg/L in the 1990s to 93 mg/L in the 2000s. Soil available K showed no difference in the northeast between the 1990s and 2000s. However, soil available K increased by 35% (76 to 103 mg/L), 18% (72 to 84 mg/L) and 30% (69 to 83 mg/L) from the 1990s to 2000s for north central, southeast, and southwest China, respectively. Mean values decreased by 76% (154 to 116 mg/L) from the 1990s to 2000s for northwest China (Figure 3A).
Soil available K in grain crop fi elds followed the same trends as those shown for the average for all crops, but the re-sults varied across regions (Figure 3B). For the north central, southeast and southwest regions, the soil K increased by 9%, 21% and 9%, respectively in the 2000s from baselines of 72, 65 and 66 mg/L in the 1990s. However, for the northwest, soil available K in the 2000s decreased by 74% compared with
the 1990s (Figure 3B).The soil available K in the 2000s for cash crops only in-
creased by 60%, 12% and 22% for north central, southeast and southwest China, respectively, if compared to values in the 1990s, but declined to only 92% of 1990 values in the northeast and northwest. The increased soil available K in the north central and southwest regions were attributable to the large area of cash crops, while the increased mean values in the southeast was mainly attributed to larger increases in grain crops. The decrease in soil available K in the northwest was attributable to the large decline in soil available K in grain crop fi elds (Figure 3C).
Figure 2. Trends in mean soil available K in China from 1990 to 2012.
Figure 3. Comparison of soil available K between 1990s and 2000s. (A) Total crops; (B) Grain crops; (C) Cash crops. The star * between the two boxes indicates soil avail-able K between 1990s (left box) and 2000s (right box) significant different at p < 0.05. The black and redlines, lower and upper edges, bars represent median and mean values, 25th and 75th, 5th and 95th percentiles of all data, respectively.
200
180
160
140
120
100
80
60
40
20
0
Soil
avai
labl
e K
, mg/
L
Total cropsGrain cropsCash crops
19901991
19921993
19941995
19961997
19981999
20002001
20022003
20042005
20062007
20082009
20102011
2012
y = 3.16x - 6190R2 = 0.448
y = 1.31x - 2526R2 = 0.466
y = 0.258x - 438R2 = 0.0485
300
250
200
150
100
50
0300
250
200
150
100
50
0500
400
300
200
100
0
Soil
ava
ilab
le K
, mg
/L
1990s 2000s 1990s 2000s 1990s 2000s 1990s 2000s 1990s 2000sNE NC NW SE SW
Total crops
Grain crops
Cash crops
A
B
C
*
*
* *
*
*
* *
*
* *
* *
8
Bet
ter
Cro
ps/V
ol. 1
00 (
2016
, No.
1)
Results from this study indicate that soil available K showed a minor increase in soils planted to grain crops, but increased signifi cantly in those soils planted to cash crops. The trends of increased soil K for cash crops is in accordance with the high fertilizer K application rates used by farmers. The K fertilizer application rates for cash crops averaged 164, 231, 205, 240, and 391 kg K
2O/ha, which were 1.7, 2.1, 1.7, 2.1,
and 2.8 times those for grain crops for northeast, north central, northwest, southeast, and southwest China, respectively (data not shown). However, the soil available K for grain crops in 2000s were lower than 80 mg/L (the critical value for K defi -ciency) in all regions except the northwest. Therefore, more K fertilizer was needed for soils planted with grain crops and no increase in soil indigenous K supply has been measured. The results can be supported by relative yield and a great number of site-to-site reports as well. Although with the development of agricultural mechanization and more crop residues being returned back to soils, reports from grain crop fi elds indicated that the return of straw alone is not suffi cient to maintain the soil K balance. Fertilizer K application is essential to maintain both high yield and soil K balance.
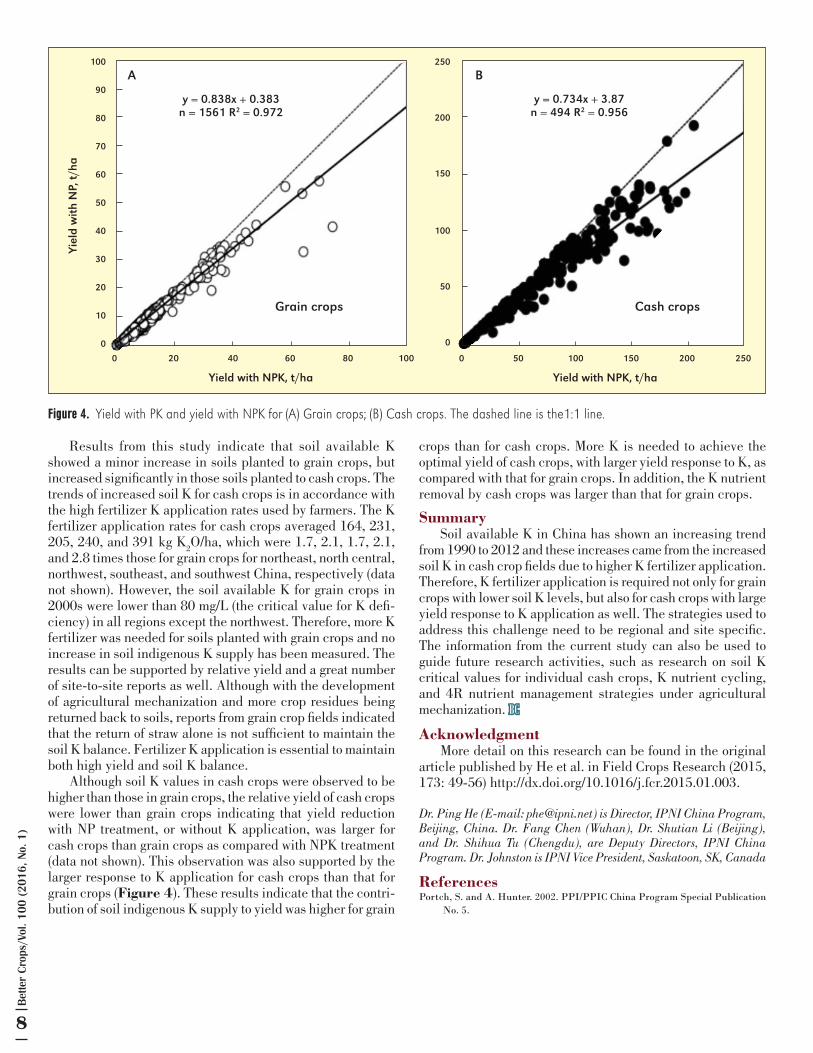
Although soil K values in cash crops were observed to be higher than those in grain crops, the relative yield of cash crops were lower than grain crops indicating that yield reduction with NP treatment, or without K application, was larger for cash crops than grain crops as compared with NPK treatment (data not shown). This observation was also supported by the larger response to K application for cash crops than that for grain crops (Figure 4). These results indicate that the contri-bution of soil indigenous K supply to yield was higher for grain
crops than for cash crops. More K is needed to achieve the optimal yield of cash crops, with larger yield response to K, as compared with that for grain crops. In addition, the K nutrient removal by cash crops was larger than that for grain crops.
SummarySoil available K in China has shown an increasing trend
from 1990 to 2012 and these increases came from the increased soil K in cash crop fi elds due to higher K fertilizer application. Therefore, K fertilizer application is required not only for grain crops with lower soil K levels, but also for cash crops with large yield response to K application as well. The strategies used to address this challenge need to be regional and site specifi c. The information from the current study can also be used to guide future research activities, such as research on soil K critical values for individual cash crops, K nutrient cycling, and 4R nutrient management strategies under agricultural mechanization. BCBC
AcknowledgmentMore detail on this research can be found in the original
article published by He et al. in Field Crops Research (2015, 173: 49-56) http://dx.doi.org/10.1016/j.fcr.2015.01.003.
Dr. Ping He (E-mail: [email protected]) is Director, IPNI China Program, Beijing, China. Dr. Fang Chen (Wuhan), Dr. Shutian Li (Beijing), and Dr. Shihua Tu (Chengdu), are Deputy Directors, IPNI China Program. Dr. Johnston is IPNI Vice President, Saskatoon, SK, Canada
ReferencesPortch, S. and A. Hunter. 2002. PPI/PPIC China Program Special Publication
No. 5.
Figure 4. Yield with PK and yield with NPK for (A) Grain crops; (B) Cash crops. The dashed line is the1:1 line.
100
90
80
70
60
50
40
30
20
10
0
250
200
150
100
50
0
Yield with NPK, t/ha Yield with NPK, t/ha
Yiel
d w
ith
NP,
t/h
a
0 20 40 60 80 100 0 50 100 150 200 250
y = 0.838x + 0.383n = 1561 R2 = 0.972
y = 0.734x + 3.87n = 494 R2 = 0.956
A B
Grain crops Cash crops
Better C
rops/Vol. 100 (2016, No. 1)
9
Abbreviations and notes: N = nitrogen; P = phosphorus; K = potassium; B = boron.
TUNISIA
Tunisia is one of the largest olive producers in the world. Its olive production sector plays a strategic role in the national economy with its 1.8 million ha under olive
representing 34% of the countries agricultural land. How-ever, large portions of these olive orchards are old and poorly maintained. The government of Tunisia initiated in early 2000 a large program for the introduction and expansion of the hyper-intensive olive system in the irrigated area. In 2011, the intensive olive grove areas in Tunisia reached 50,000 ha, with 4,500 ha managed using a super high-density planting (SHD) system (Larbi et al., 2014). However, little information has been provided with regards to an improved technical production package for those wanting to transition to SHD plantations. Among the constraints that farmers are facing during this switch are the nutrient management practices required for SHD plantations. Little research has been conducted on fertilization management in high-density plantation systems and farmers are still using traditional fertilization practices based on the application of the same amount every year without taking into account the nutritional status of the trees. The development of a 4R Nutrient Stewardship strategy on right source, rate, time, and placement of fertilizer application in SHD olive production systems is key for improving both olive and oil production, as well as nutrient use effi ciency.
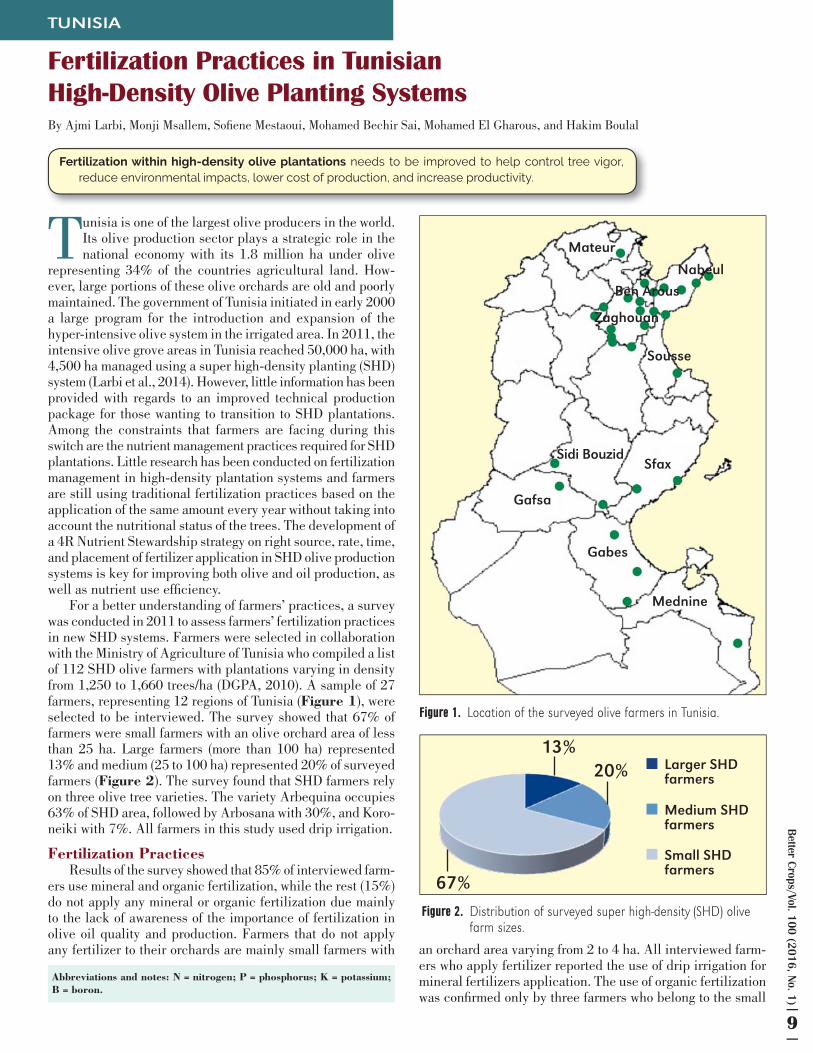
For a better understanding of farmers’ practices, a survey was conducted in 2011 to assess farmers’ fertilization practices in new SHD systems. Farmers were selected in collaboration with the Ministry of Agriculture of Tunisia who compiled a list of 112 SHD olive farmers with plantations varying in density from 1,250 to 1,660 trees/ha (DGPA, 2010). A sample of 27 farmers, representing 12 regions of Tunisia (Figure 1), were selected to be interviewed. The survey showed that 67% of farmers were small farmers with an olive orchard area of less than 25 ha. Large farmers (more than 100 ha) represented 13% and medium (25 to 100 ha) represented 20% of surveyed farmers (Figure 2). The survey found that SHD farmers rely on three olive tree varieties. The variety Arbequina occupies 63% of SHD area, followed by Arbosana with 30%, and Koro-neiki with 7%. All farmers in this study used drip irrigation.
Fertilization PracticesResults of the survey showed that 85% of interviewed farm-
ers use mineral and organic fertilization, while the rest (15%) do not apply any mineral or organic fertilization due mainly to the lack of awareness of the importance of fertilization in olive oil quality and production. Farmers that do not apply any fertilizer to their orchards are mainly small farmers with an orchard area varying from 2 to 4 ha. All interviewed farm-
ers who apply fertilizer reported the use of drip irrigation for mineral fertilizers application. The use of organic fertilization was confi rmed only by three farmers who belong to the small
By Ajmi Larbi, Monji Msallem, Sofi ene Mestaoui, Mohamed Bechir Sai, Mohamed El Gharous, and Hakim Boulal
Fertilization Practices in TunisianHigh-Density Olive Planting Systems
Fertilization within high-density olive plantations needs to be improved to help control tree vigor, reduce environmental impacts, lower cost of production, and increase productivity.
Figure 2. Distribution of surveyed super high-density (SHD) olive farm sizes.
Figure 1. Location of the surveyed olive farmers in Tunisia.
Mateur
Nabeul
Ben Arous
Zaghouan
Sousse
Sidi BouzidSfax
Gafsa
Gabes
Mednine
67%
13%20% Larger SHD
farmers
Medium SHDfarmers
Small SHDfarmers
10
Bet
ter
Cro
ps/V
ol. 1
00 (
2016
, No.
1)
SHD group. The survey found that 56% of respondents have contact with regional agricultural extension centers. However this group of farmers indicated that technical staff of these centers did not provide any advice related to fertilization management.
Fertilizer Sources Of the farmers who use nutrients, 100% of them use N and
P, while 82% apply N, P and K. The main source of N and P are ammonium nitrate (91%) and urea (9%) for N and phosphoric acid (100%) for P. Farmers reported that the limited use of urea was a refl ection on the high salt content of the irrigation water source. For K, the main sources are potassium sulfate (75%) and potassium nitrate combined with potassium sulfate (25%). It has also been reported that 30% of farmers who ap-ply fertilizers use foliar application of B (mineral boron) and K (potassium sulfate and NPK products with high K content).
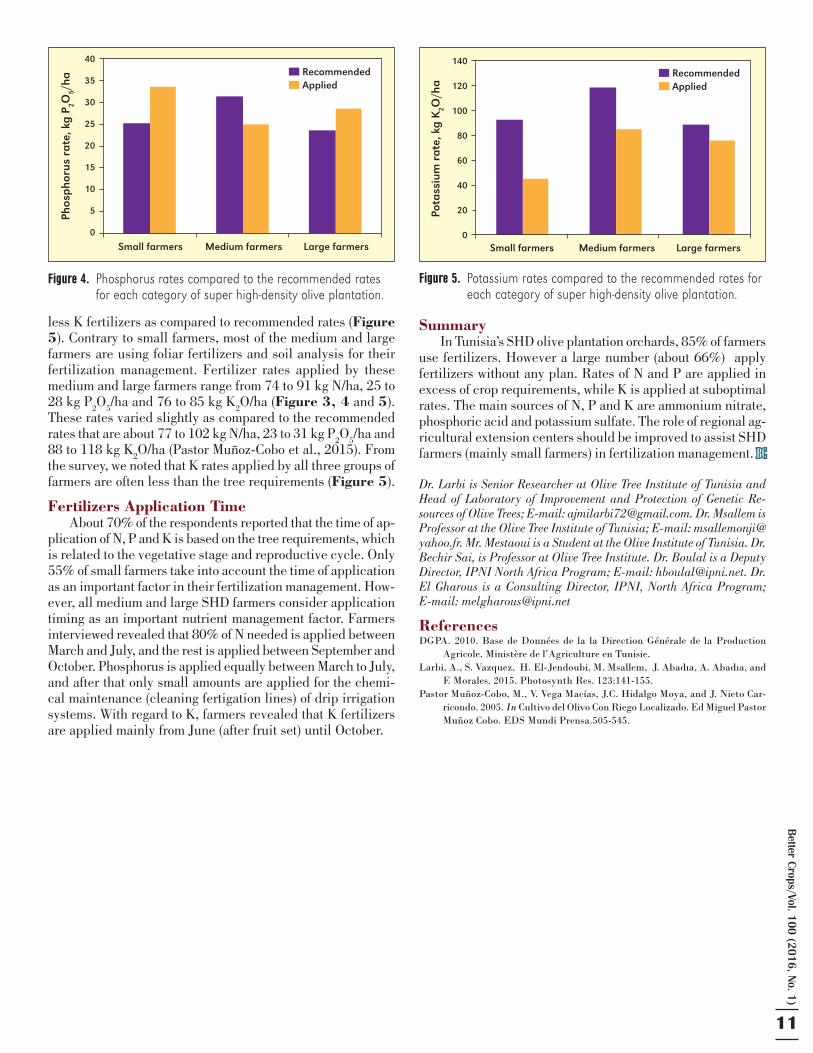
Fertilizer Rates The survey showed that the amount of fertilizers applied
varied signifi cantly according to the olive orchard’s age and yield. A high percentage of small farmers (95%) applied fertil-izers without any structured plan. Indeed, N and P fertilizers are applied excessively as compared to recommended rates (Figure 3 and 4). Average N and P
2O
5 rates were about 109
and 33 kg/ha, respectively, while the recommended amounts based on fruits uptake are about 82 and 25 kg, for N and P
2O
5,
respectively. However, for K, small farmers often applied
Figure 3. Nitrogen rates compared to the recommended rates for each category of super high-density olive plantation.
120
100
80
60
40
20
0
Nit
roge
n ra
te, k
g N
/ha
RecommendedApplied
Small farmers Medium farmers Large farmers
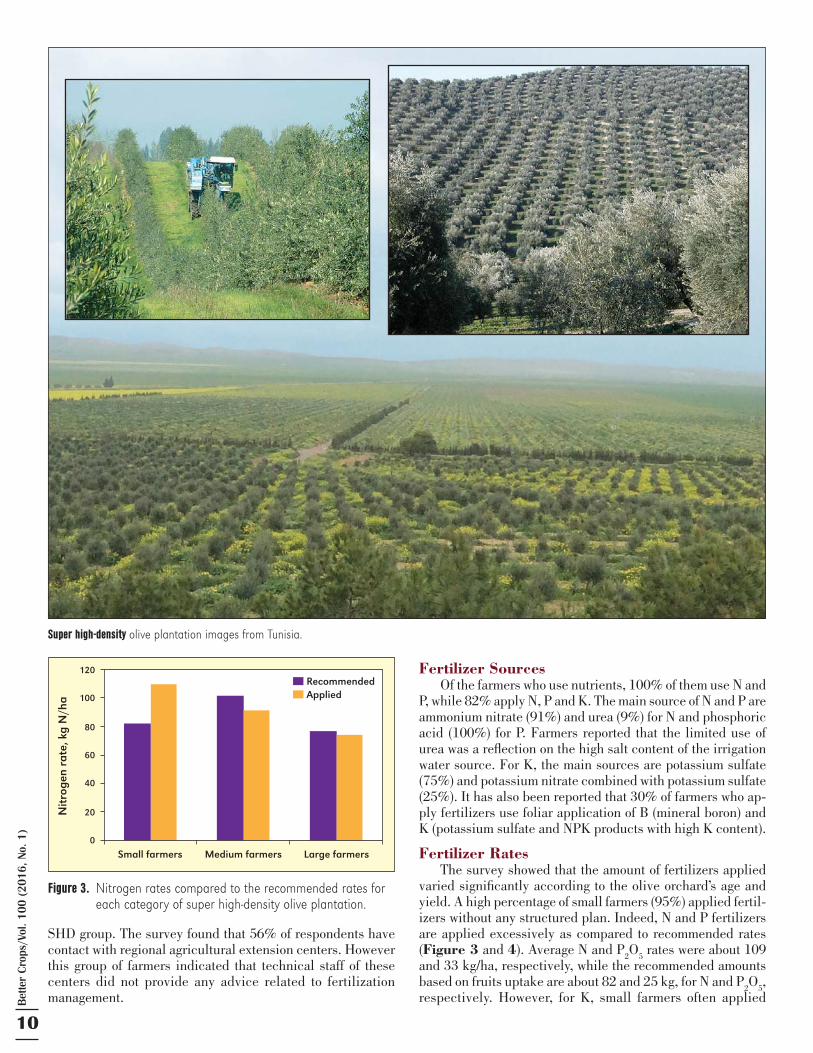
Super high-density olive plantation images from Tunisia.
Better C
rops/Vol. 100 (2016, No. 1)
11
less K fertilizers as compared to recommended rates (Figure 5). Contrary to small farmers, most of the medium and large farmers are using foliar fertilizers and soil analysis for their fertilization management. Fertilizer rates applied by these medium and large farmers range from 74 to 91 kg N/ha, 25 to 28 kg P
2O
5/ha and 76 to 85 kg K
2O/ha (Figure 3, 4 and 5).
These rates varied slightly as compared to the recommended rates that are about 77 to 102 kg N/ha, 23 to 31 kg P
2O
5/ha and
88 to 118 kg K2O/ha (Pastor Muñoz-Cobo et al., 2015). From
the survey, we noted that K rates applied by all three groups of farmers are often less than the tree requirements (Figure 5).
Fertilizers Application Time About 70% of the respondents reported that the time of ap-
plication of N, P and K is based on the tree requirements, which is related to the vegetative stage and reproductive cycle. Only 55% of small farmers take into account the time of application as an important factor in their fertilization management. How-ever, all medium and large SHD farmers consider application timing as an important nutrient management factor. Farmers interviewed revealed that 80% of N needed is applied between March and July, and the rest is applied between September and October. Phosphorus is applied equally between March to July, and after that only small amounts are applied for the chemi-cal maintenance (cleaning fertigation lines) of drip irrigation systems. With regard to K, farmers revealed that K fertilizers are applied mainly from June (after fruit set) until October.
SummaryIn Tunisia’s SHD olive plantation orchards, 85% of farmers
use fertilizers. However a large number (about 66%) apply fertilizers without any plan. Rates of N and P are applied in excess of crop requirements, while K is applied at suboptimal rates. The main sources of N, P and K are ammonium nitrate, phosphoric acid and potassium sulfate. The role of regional ag-ricultural extension centers should be improved to assist SHD farmers (mainly small farmers) in fertilization management. BCBC
Dr. Larbi is Senior Researcher at Olive Tree Institute of Tunisia and Head of Laboratory of Improvement and Protection of Genetic Re-sources of Olive Trees; E-mail: [email protected]. Dr. Msallem is Professor at the Olive Tree Institute of Tunisia; E-mail: [email protected]. Mr. Mestaoui is a Student at the Olive Institute of Tunisia. Dr. Bechir Sai, is Professor at Olive Tree Institute. Dr. Boulal is a Deputy Director, IPNI North Africa Program; E-mail: [email protected]. Dr. El Gharous is a Consulting Director, IPNI, North Africa Program; E-mail: [email protected]
ReferencesDGPA. 2010. Base de Données de la la Direction Générale de la Production
Agricole. Ministère de l’Agriculture en Tunisie.Larbi, A., S. Vazquez, H. El-Jendoubi, M. Msallem, J. Abadıa, A. Abadıa, and
F. Morales. 2015. Photosynth Res. 123:141-155.Pastor Muñoz-Cobo, M., V. Vega Macías, J.C. Hidalgo Moya, and J. Nieto Car-
ricondo. 2005. In Cultivo del Olivo Con Riego Localizado. Ed Miguel Pastor Muñoz Cobo. EDS Mundi Prensa.505-545.
Figure 5. Potassium rates compared to the recommended rates for each category of super high-density olive plantation.
Figure 4. Phosphorus rates compared to the recommended rates for each category of super high-density olive plantation.
40
35
30
25
20
15
10
5
0
Phos
phor
us r
ate,
kg
P 2O5/
haRecommendedApplied
Small farmers Medium farmers Large farmers
140
120
100
80
60
40
20
0
Pota
ssiu
m r
ate
, kg
K2O
/ha
RecommendedApplied
Small farmers Medium farmers Large farmers
12
Bet
ter
Cro
ps/V
ol. 1
00 (
2016
, No.
1)
2015 Crop Nutrient Deficiency Photo Contest Winners
IPNI is once again pleased to announce the winners of the 2015 Crop Nutrient Defi ciency Photo Contest.
Many excellent examples of crop nutrient defi ciency were received across all four of our contest’s categories. Pref-erence was given to well-photographed entries that provided a good representation of the impact of the defi ciency to the whole plant, adequate nutrient analyses information, and details con-cerning current or historical fertilization at the site.
IPNI thanks all participants for their submissions to this annual contest. By providing these excellent examples of docu-
Featured Category (Root and Tuber Crops)
Nitrogen Category
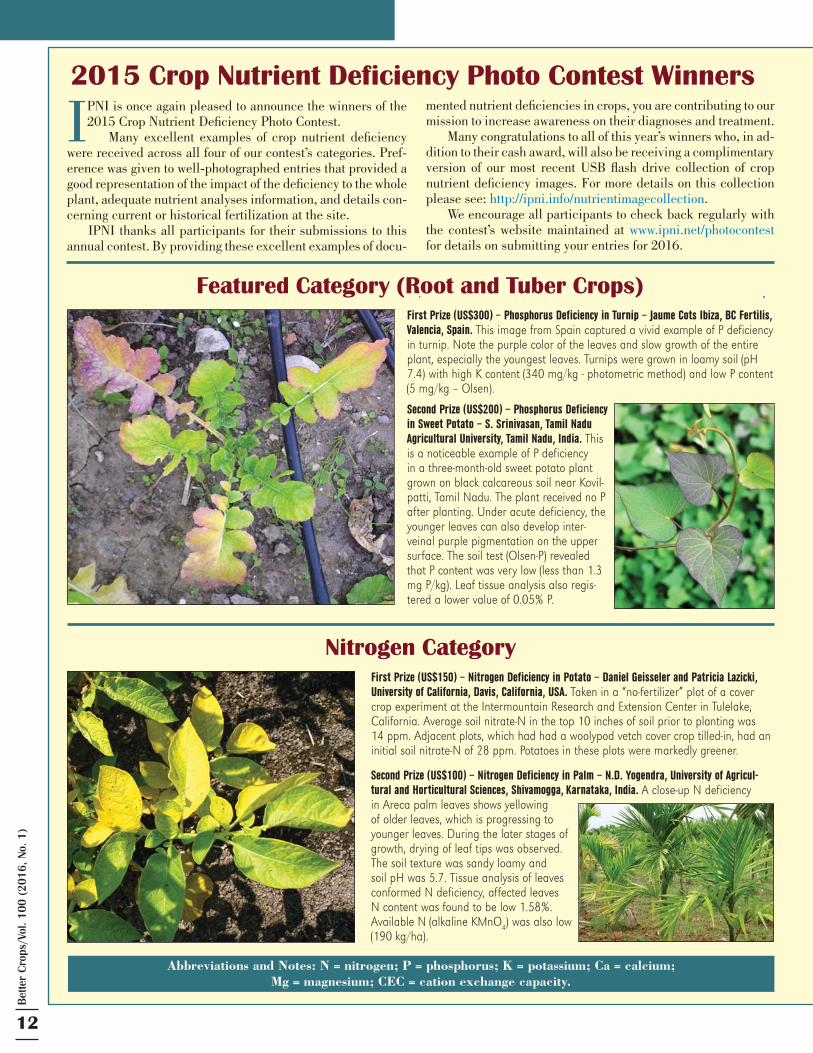
First Prize (US$300) – Phosphorus Deficiency in Turnip – Jaume Cots Ibiza, BC Fertilis, Valencia, Spain. This image from Spain captured a vivid example of P deficiency in turnip. Note the purple color of the leaves and slow growth of the entire plant, especially the youngest leaves. Turnips were grown in loamy soil (pH 7.4) with high K content (340 mg/kg - photometric method) and low P content (5 mg/kg – Olsen).
First Prize (US$150) – Nitrogen Deficiency in Potato – Daniel Geisseler and Patricia Lazicki, University of California, Davis, California, USA. Taken in a “no-fertilizer” plot of a cover crop experiment at the Intermountain Research and Extension Center in Tulelake, California. Average soil nitrate-N in the top 10 inches of soil prior to planting was 14 ppm. Adjacent plots, which had had a woolypod vetch cover crop tilled-in, had an initial soil nitrate-N of 28 ppm. Potatoes in these plots were markedly greener.
Second Prize (US$100) – Nitrogen Deficiency in Palm – N.D. Yogendra, University of Agricul-tural and Horticultural Sciences, Shivamogga, Karnataka, India. A close-up N deficiency in Areca palm leaves shows yellowing of older leaves, which is progressing to younger leaves. During the later stages of growth, drying of leaf tips was observed. The soil texture was sandy loamy and soil pH was 5.7. Tissue analysis of leaves conformed N deficiency, affected leaves N content was found to be low 1.58%. Available N (alkaline KMnO4) was also low (190 kg/ha).
Abbreviations and Notes: N = nitrogen; P = phosphorus; K = potassium; Ca = calcium; Mg = magnesium; CEC = cation exchange capacity.
mented nutrient defi ciencies in crops, you are contributing to our mission to increase awareness on their diagnoses and treatment.
Many congratulations to all of this year’s winners who, in ad-dition to their cash award, will also be receiving a complimentary version of our most recent USB fl ash drive collection of crop nutrient defi ciency images. For more details on this collection please see: http://ipni.info/nutrientimagecollection.
We encourage all participants to check back regularly with the contest’s website maintained at www.ipni.net/photocontest for details on submitting your entries for 2016.
Second Prize (US$200) – Phosphorus Deficiency in Sweet Potato – S. Srinivasan, Tamil Nadu Agricultural University, Tamil Nadu, India. This is a noticeable example of P deficiency in a three-month-old sweet potato plant grown on black calcareous soil near Kovil-patti, Tamil Nadu. The plant received no P after planting. Under acute deficiency, the younger leaves can also develop inter-veinal purple pigmentation on the upper surface. The soil test (Olsen-P) revealed that P content was very low (less than 1.3 mg P/kg). Leaf tissue analysis also regis-tered a lower value of 0.05% P.
Better C
rops/Vol. 100 (2016, No. 1)
13
Phosphorus Category
Potassium Category
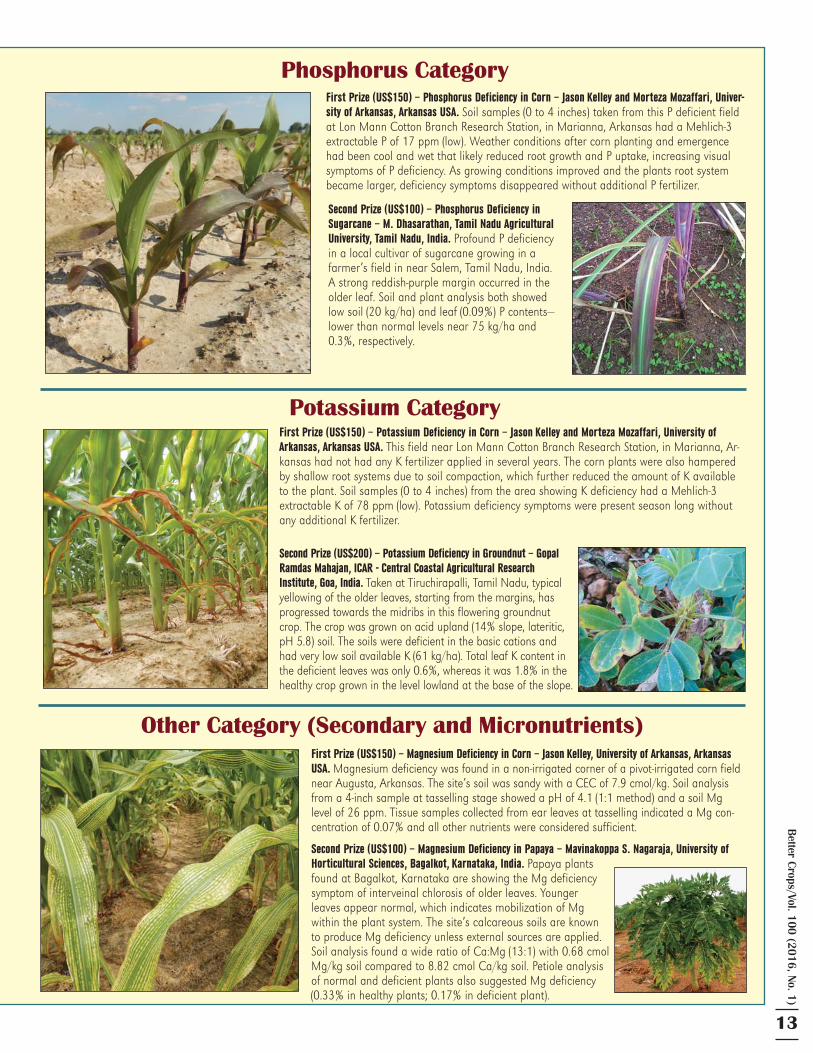
First Prize (US$150) – Phosphorus Deficiency in Corn – Jason Kelley and Morteza Mozaffari, Univer-sity of Arkansas, Arkansas USA. Soil samples (0 to 4 inches) taken from this P deficient field at Lon Mann Cotton Branch Research Station, in Marianna, Arkansas had a Mehlich-3 extractable P of 17 ppm (low). Weather conditions after corn planting and emergence had been cool and wet that likely reduced root growth and P uptake, increasing visual symptoms of P deficiency. As growing conditions improved and the plants root system became larger, deficiency symptoms disappeared without additional P fertilizer.
Second Prize (US$100) – Phosphorus Deficiency in Sugarcane – M. Dhasarathan, Tamil Nadu Agricultural University, Tamil Nadu, India. Profound P deficiency in a local cultivar of sugarcane growing in a farmer’s field in near Salem, Tamil Nadu, India. A strong reddish-purple margin occurred in the older leaf. Soil and plant analysis both showed low soil (20 kg/ha) and leaf (0.09%) P contents—lower than normal levels near 75 kg/ha and 0.3%, respectively.
First Prize (US$150) – Potassium Deficiency in Corn – Jason Kelley and Morteza Mozaffari, University of Arkansas, Arkansas USA. This field near Lon Mann Cotton Branch Research Station, in Marianna, Ar-kansas had not had any K fertilizer applied in several years. The corn plants were also hampered by shallow root systems due to soil compaction, which further reduced the amount of K available to the plant. Soil samples (0 to 4 inches) from the area showing K deficiency had a Mehlich-3 extractable K of 78 ppm (low). Potassium deficiency symptoms were present season long without any additional K fertilizer.
Second Prize (US$200) – Potassium Deficiency in Groundnut – Gopal Ramdas Mahajan, ICAR - Central Coastal Agricultural Research Institute, Goa, India. Taken at Tiruchirapalli, Tamil Nadu, typical yellowing of the older leaves, starting from the margins, has progressed towards the midribs in this flowering groundnut crop. The crop was grown on acid upland (14% slope, lateritic, pH 5.8) soil. The soils were deficient in the basic cations and had very low soil available K (61 kg/ha). Total leaf K content in the deficient leaves was only 0.6%, whereas it was 1.8% in the healthy crop grown in the level lowland at the base of the slope.
First Prize (US$150) – Magnesium Deficiency in Corn – Jason Kelley, University of Arkansas, Arkansas USA. Magnesium deficiency was found in a non-irrigated corner of a pivot-irrigated corn field near Augusta, Arkansas. The site’s soil was sandy with a CEC of 7.9 cmol/kg. Soil analysis from a 4-inch sample at tasselling stage showed a pH of 4.1 (1:1 method) and a soil Mg level of 26 ppm. Tissue samples collected from ear leaves at tasselling indicated a Mg con-centration of 0.07% and all other nutrients were considered sufficient.
Second Prize (US$100) – Magnesium Deficiency in Papaya – Mavinakoppa S. Nagaraja, University of Horticultural Sciences, Bagalkot, Karnataka, India. Papaya plants found at Bagalkot, Karnataka are showing the Mg deficiency symptom of interveinal chlorosis of older leaves. Younger leaves appear normal, which indicates mobilization of Mg within the plant system. The site’s calcareous soils are known to produce Mg deficiency unless external sources are applied. Soil analysis found a wide ratio of Ca:Mg (13:1) with 0.68 cmol Mg/kg soil compared to 8.82 cmol Ca/kg soil. Petiole analysis of normal and deficient plants also suggested Mg deficiency (0.33% in healthy plants; 0.17% in deficient plant).
Other Category (Secondary and Micronutrients)
14
Bet
ter
Cro
ps/V
ol. 1
00 (
2016
, No.
1)
Abbreviations and notes: N = nitrogen; P = phosphorus.
In some species, reddening or purpling of the leaf margin indicates that the plant is under some kind of stress, for example, P defi ciency or freezing stress. But other species
display these colors all the time, while some not at all. In most cases the pigment causing these colors is—or is presumed to be—anthocyanin. A recent review of potential ecological and physiological functions (Hughes and Lev-Yadun, 2015) brings out a lot of interesting points about these pigments and their relation to P defi ciency.
Anthocyanins come in a wide range of colors. They are the same compounds that color fl owers. The anthocyanins associ-ated with P defi ciency are usually red to purple. In some spe-cies, including corn, apples, pears, and strawberries, symptoms are most prominent on leaf margins (Table 1). Experiments
with apples have shown that when a P defi ciency is relieved, the red/purple color of the leaf margins subsides. In other species, for example tomatoes, the undersides between the veins turn purple. Other species—like sugar beet, rice, potato, and onions—don’t change color at all, other than perhaps a deepening of greenness as the plant’s growth is stunted. Chlo-rophyll contains no P, so in a defi cient plant, chlorophyll may have higher abundance relative to P-containing compounds (Marschner, 1995).
A question that intrigues plant scientists is why plants pro-duce purple and red colors. Possibilities include undermining the camoufl age of insect pests to make them more visible to their predators. Or “aposematism”—a warning signal to make the plant part look inedible or dangerous to pests that might be tempted to feed on the leaf. Insects see color, and red or
purple could look to them as if the leaf is either well-defended or not very nutritious to eat. Red leaves are generally lower in N and P—and thus less nutritious. They are also higher in phenolics, and anthocyanins themselves may be antinutritional for insects and other herbivores. In one New Zealand shrub spe-cies, the width of the red portion of the leaf margin correlated to higher levels of the plant defense compound polygodial and was associated with less damage from herbivory.
Birds are the most common predators of plant-eating in-sects, and they too see color. Thus a non-green color on the leaf margin can help them fi nd and consume the herbivore insects that have green camoufl age. Birds are also smart enough to learn that a leaf margin with breaks from insect feeding is a sign of greater likelihood of fi nd-ing a caterpillar. A plant that colors its margins will show these breaks more conspicuously.
Pigments can play a role in helping plants deal with excess uptake of certain trace elements. The trace elements can include excess amounts of nutrients like boron (B), cobalt (Co), iron (Fe), man-ganese (Mn), molybdenum (Mo), nickel (Ni) and zinc (Zn), and other metals like aluminum (Al), cadmium
By Tom Bruulsema
The Colors in Phosphorus Deficient Plants
IPN
I201
0EPA
11-1
394
Purple or red coloring sometimes indicates P defi ciency for some plant species; however, colored leaf margins seem to serve a wide variety of functions in plant acclimation to environmental stress.
Examining the physiology and biochemistry of pigment production explains some of the variable color responses. It also highlights the role of P in photosynthetic energy transfer, a role crucial to high-yield crop production systems.
Table 1. Crop species classed by P deficiency symptoms.
Red/purple onleaf margins
Red/purple inother places
None, or darkblue-green leaf
Apple Cabbage OnionCanola Eucalyptus PotatoCorn Sugar maple SoybeanLentil Tomato Sugar beetGrape RiceGuavaPear
StrawberrySweet potato
IPN
I201
0RM
I10-
1116
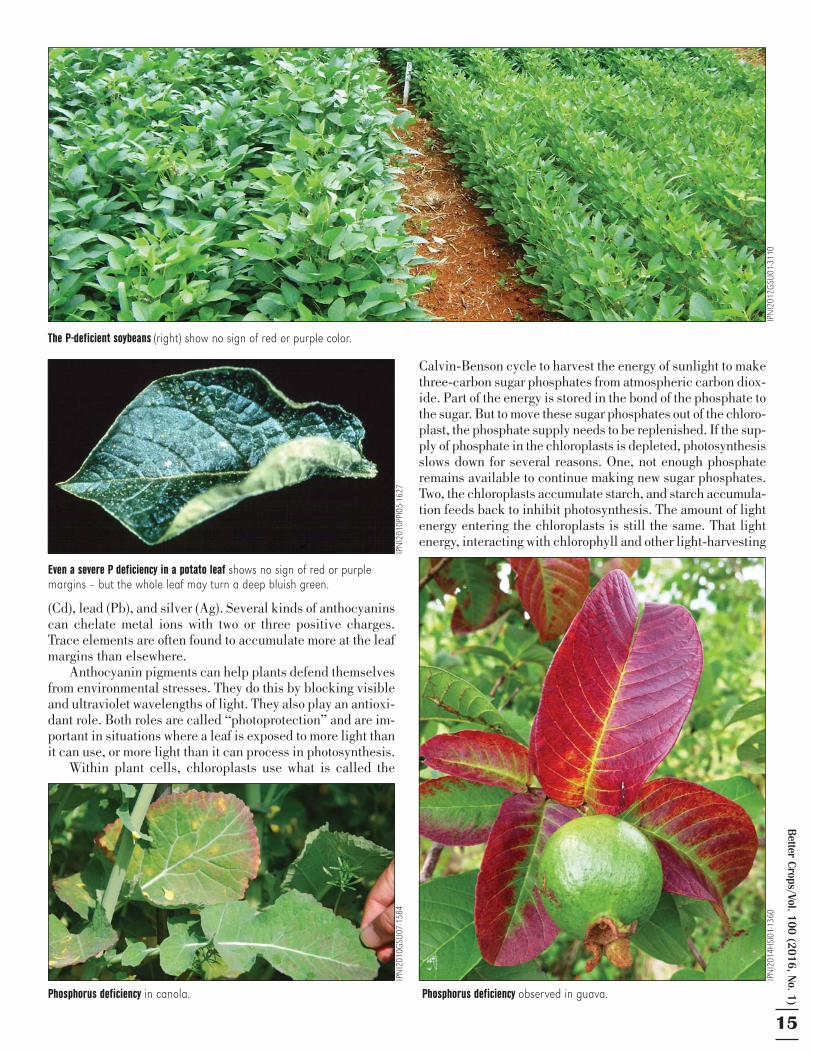
An extreme example of purpling on the underside of a tomato leaf.
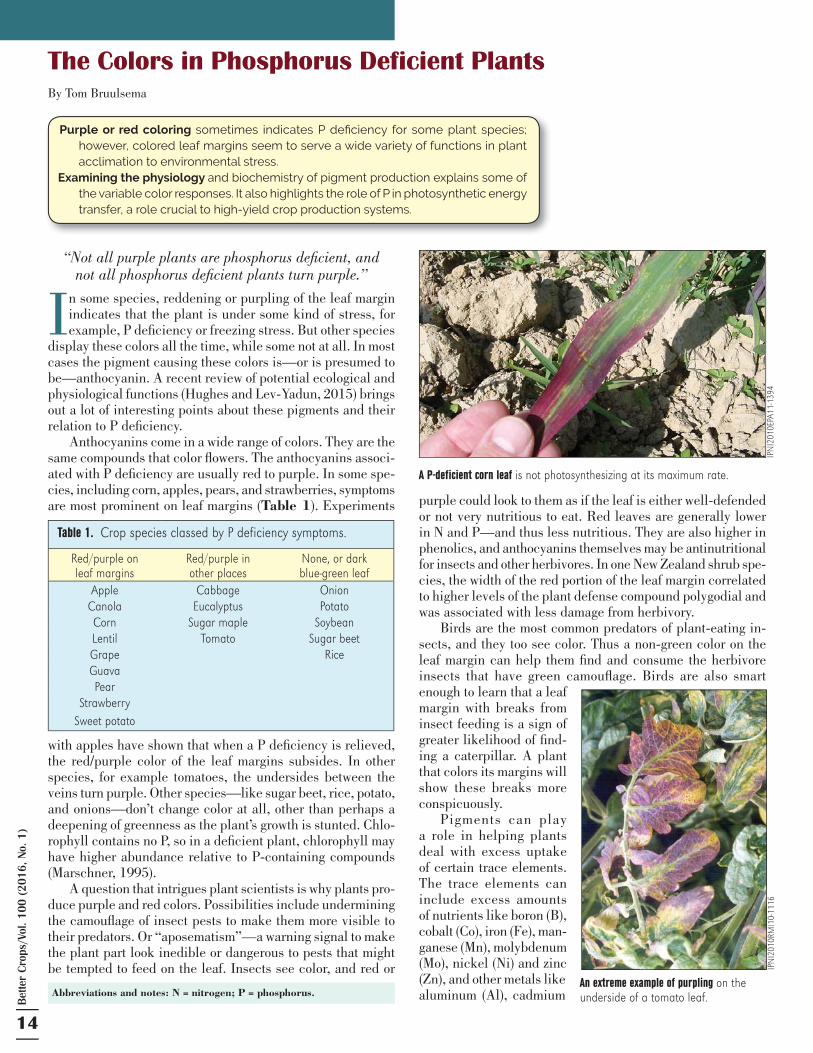
“Not all purple plants are phosphorus defi cient, and not all phosphorus defi cient plants turn purple.”
A P-deficient corn leaf is not photosynthesizing at its maximum rate.
Better C
rops/Vol. 100 (2016, No. 1)
15
(Cd), lead (Pb), and silver (Ag). Several kinds of anthocyanins can chelate metal ions with two or three positive charges. Trace elements are often found to accumulate more at the leaf margins than elsewhere.
Anthocyanin pigments can help plants defend themselves from environmental stresses. They do this by blocking visible and ultraviolet wavelengths of light. They also play an antioxi-dant role. Both roles are called “photoprotection” and are im-portant in situations where a leaf is exposed to more light than it can use, or more light than it can process in photosynthesis.
Within plant cells, chloroplasts use what is called the
Calvin-Benson cycle to harvest the energy of sunlight to make three-carbon sugar phosphates from atmospheric carbon diox-ide. Part of the energy is stored in the bond of the phosphate to the sugar. But to move these sugar phosphates out of the chloro-plast, the phosphate supply needs to be replenished. If the sup-ply of phosphate in the chloroplasts is depleted, photosynthesis slows down for several reasons. One, not enough phosphate remains available to continue making new sugar phosphates. Two, the chloroplasts accumulate starch, and starch accumula-tion feeds back to inhibit photosynthesis. The amount of light energy entering the chloroplasts is still the same. That light energy, interacting with chlorophyll and other light-harvesting
IPN
I201
2GSU
01-3
110
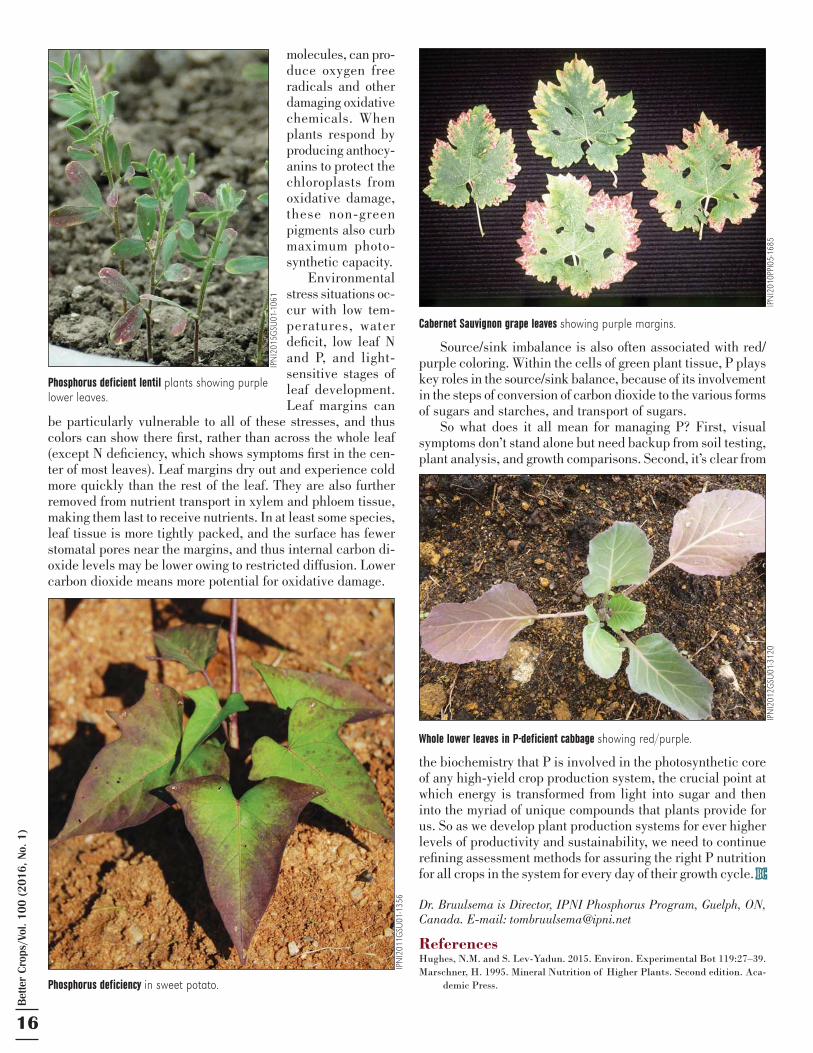
The P-deficient soybeans (right) show no sign of red or purple color.
IPN
I201
0PPI
05-1
627
Even a severe P deficiency in a potato leaf shows no sign of red or purple margins – but the whole leaf may turn a deep bluish green.
IPN
I201
0GSU
07-1
584
Phosphorus deficiency in canola.
IPN
I201
4HSI
01-1
360
Phosphorus deficiency observed in guava.
16
Bet
ter
Cro
ps/V
ol. 1
00 (
2016
, No.
1)
molecules, can pro-duce oxygen free radicals and other damaging oxidative chemicals. When plants respond by producing anthocy-anins to protect the chloroplasts from oxidative damage, these non-green pigments also curb maximum photo-synthetic capacity.
Environmental stress situations oc-cur with low tem-peratures, water defi cit, low leaf N and P, and light-sensitive stages of leaf development. Leaf margins can
be particularly vulnerable to all of these stresses, and thus colors can show there fi rst, rather than across the whole leaf (except N defi ciency, which shows symptoms fi rst in the cen-ter of most leaves). Leaf margins dry out and experience cold more quickly than the rest of the leaf. They are also further removed from nutrient transport in xylem and phloem tissue, making them last to receive nutrients. In at least some species, leaf tissue is more tightly packed, and the surface has fewer stomatal pores near the margins, and thus internal carbon di-oxide levels may be lower owing to restricted diffusion. Lower carbon dioxide means more potential for oxidative damage.
Source/sink imbalance is also often associated with red/purple coloring. Within the cells of green plant tissue, P plays key roles in the source/sink balance, because of its involvement in the steps of conversion of carbon dioxide to the various forms of sugars and starches, and transport of sugars.
So what does it all mean for managing P? First, visual symptoms don’t stand alone but need backup from soil testing, plant analysis, and growth comparisons. Second, it’s clear from
the biochemistry that P is involved in the photosynthetic core of any high-yield crop production system, the crucial point at which energy is transformed from light into sugar and then into the myriad of unique compounds that plants provide for us. So as we develop plant production systems for ever higher levels of productivity and sustainability, we need to continue refi ning assessment methods for assuring the right P nutrition for all crops in the system for every day of their growth cycle. BCBC
Dr. Bruulsema is Director, IPNI Phosphorus Program, Guelph, ON, Canada. E-mail: [email protected]
ReferencesHughes, N.M. and S. Lev-Yadun. 2015. Environ. Experimental Bot 119:27–39.Marschner, H. 1995. Mineral Nutrition of Higher Plants. Second edition. Aca-
demic Press.
Phosphorus deficient lentil plants showing purple lower leaves.
Phosphorus deficiency in sweet potato.
Cabernet Sauvignon grape leaves showing purple margins.
Whole lower leaves in P-deficient cabbage showing red/purple.
IPN
I201
5GSU
01-1
061
IPN
I201
1GSU
01-1
356
IPN
I201
0PPI
05-1
685
IPN
I201
2GSU
01-3
120
Better C
rops/Vol. 100 (2016, No. 1)
17
Abbreviations and notes: N = nitrogen, P = phosphorus; K = potassium; O.C. = organic carbon; SSNM = site-specifi c nutrient management. 1 US$ = 67 Indian Rupees (Rs.). IPNI Project IND-GM22.
NORTH EASTERN INDIA
Yields within the state of Jharkhand’s maize-wheat cropping system are under performing at 1.8 and 1.9 t/ha, respectively. These yields are much lower than
the national averages of 2.6 t/ha (maize) and 3.1 t/ha (wheat) (FAI, 2014). This region of eastern India has large tracts of red and lateritic soils that have coarse texture, low organic matter content, low pH, and generally low availability of N, P, K, secondary, and micronutrients.
Increased cereal crop production can be addressed in these soils through the use of high-yielding varieties and improved nutrient management. It is realistic to expect two to three-fold increases in crop yields with the adoption of these practices. The approach of this research was to estimate inherent soil nutrient supply through the nutrient omission plot technique, which was followed by adequate and balanced application of all yield-limiting nutrients, based on attainable yield targets.
As part of the IPNI Global Maize Initiative >http://research.ipni.net/article/EXP-3006<, fi eld experiments were conducted for three consecutive years (2010-11 to 2012-13) at the Birsa Agricultural University Farm in Ranchi, Jharkhand to assess the effect of nutrient use and phosphate omission on crop yields, nutrient uptake, soil health, and the economics of the maize-wheat cropping system. The experiments used hybrid maize (var. Pioneer 30V 92 planted within a 70 x 18 cm geometry), which was grown during the rainy season as a rain-fed crop (June to October). The following wheat crop (var. DBW 17, 25 cm row-to-row spacing) was grown in winter as an irrigated crop.
The experimental area falls within the sub-tropical Eastern Plateau and Hill region. The soil was sandy loam in texture with pH 5.2, 4.9 g O.C./kg, low available N, P and K (272 kg N/ha, 32 kg P
2O
5/ha, 139 kg K
2O/ha) determined by Subbiah
and Asija (1956), Bray and Kurtz No. 1 (1956), and Jackson (1967) methods, respectively. The study’s four treatments included: 1) ample NPK (250-120-110 kg N-P
2O
5-K
2O/ha for
maize and 150-110-100 kg N-P2O
5-K
2O/ha for wheat), 2) P
omission from ample NPK, 3) SSNM (200-90-100 kg N-P2O
5-
K2O/ha for maize and 120-70-60 kg N-P
2O
5-K
2O/ha for wheat),
and 4) Farmers’ Fertilization Practice (FFP – 2.5 t FYM/ha + 20 kg N/ha). All treatments were laid out in a randomized block design with four replications. Rates within the ample NPK treatment were chosen to avoid any nutrient limitation, while SSNM rates were based on published nutrient uptake values for maize, and nutrient use effi ciencies for this soil type (Setiyono et al., 2010; IPNI personal communication). Nutrient application under FFP for maize and wheat were based on a
By Rakesh Kumar, S. Karmakar, A.K. Sarkar, Sudarshan Dutta, Kaushik Majumdar, T. Satyanarayana, and Adrian M. Johnston
Importance of Phosphorus Management inMaize-Wheat Cropping Systems
IPN
I Im
age/
S. D
utta
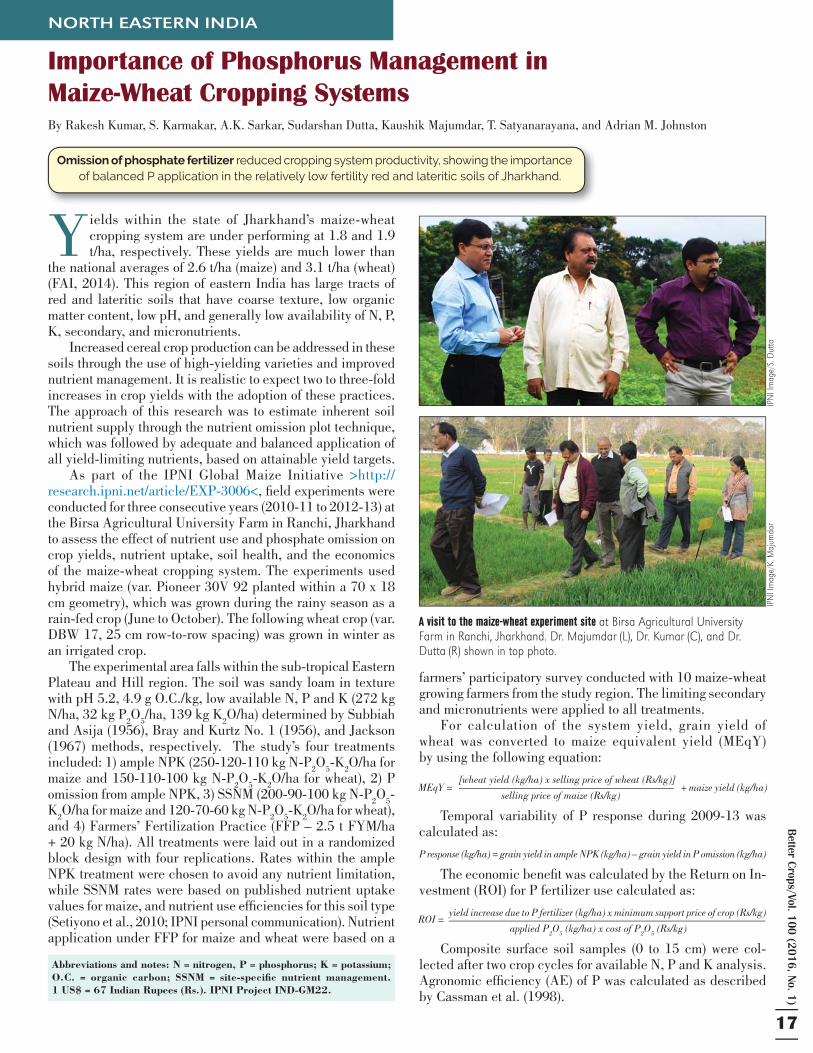
Omission of phosphate fertilizer reduced cropping system productivity, showing the importance of balanced P application in the relatively low fertility red and lateritic soils of Jharkhand.
IPN
I Im
age/
K. M
ajum
dar
A visit to the maize-wheat experiment site at Birsa Agricultural University Farm in Ranchi, Jharkhand. Dr. Majumdar (L), Dr. Kumar (C), and Dr. Dutta (R) shown in top photo.
farmers’ participatory survey conducted with 10 maize-wheat growing farmers from the study region. The limiting secondary and micronutrients were applied to all treatments.
For calculation of the system yield, grain yield of wheat was converted to maize equivalent yield (MEqY) by using the following equation:
[wheat yield (kg/ha) x selling price of wheat (Rs/kg)]
selling price of maize (Rs/kg)
Temporal variability of P response during 2009-13 was calculated as:
P response (kg/ha) = grain yield in ample NPK (kg/ha) – grain yield in P omission (kg/ha)
The economic benefi t was calculated by the Return on In-vestment (ROI) for P fertilizer use calculated as:
yield increase due to P fertilizer (kg/ha) x minimum support price of crop (Rs/kg)
applied P2O
5 (kg/ha) x cost of P
2O
5 (Rs/kg)
Composite surface soil samples (0 to 15 cm) were col-lected after two crop cycles for available N, P and K analysis. Agronomic effi ciency (AE) of P was calculated as described by Cassman et al. (1998).
MEqY = + maize yield (kg/ha)
ROI =
18
Bet
ter
Cro
ps/V
ol. 1
00 (
2016
, No.
1) Crop Yield and Nutrient Uptake
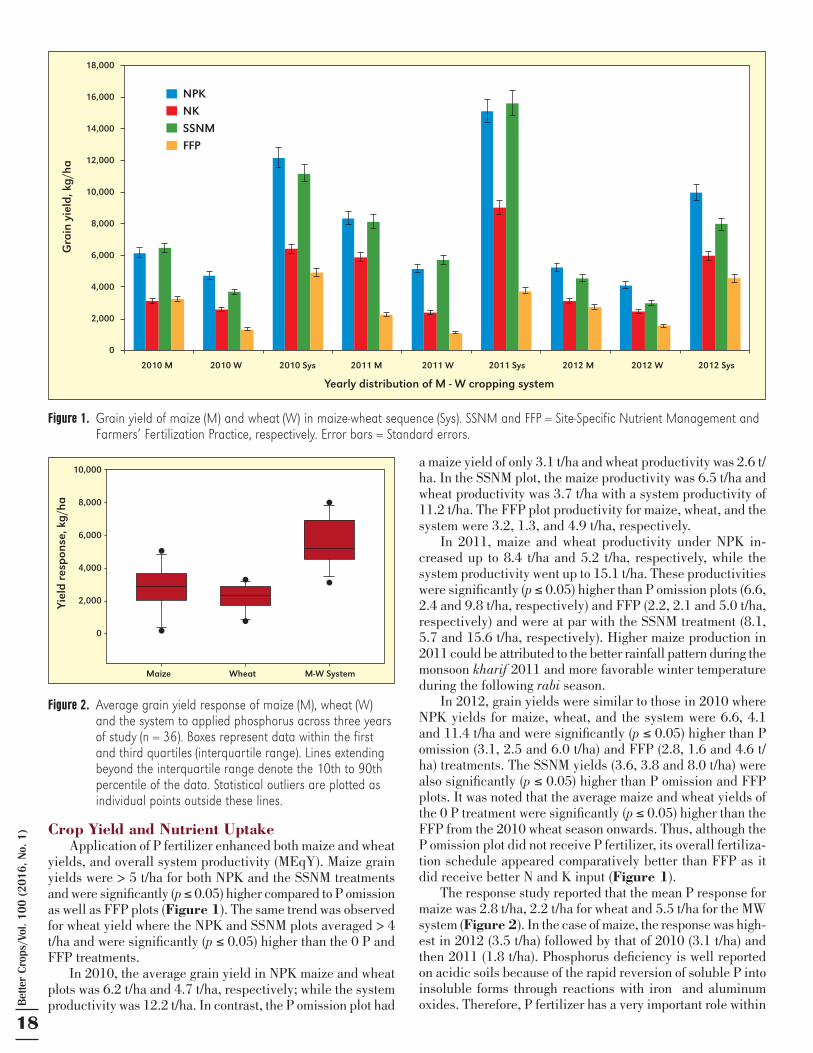
Application of P fertilizer enhanced both maize and wheat yields, and overall system productivity (MEqY). Maize grain yields were > 5 t/ha for both NPK and the SSNM treatments and were signifi cantly (p ≤ 0.05) higher compared to P omission as well as FFP plots (Figure 1). The same trend was observed for wheat yield where the NPK and SSNM plots averaged > 4 t/ha and were signifi cantly (p ≤ 0.05) higher than the 0 P and FFP treatments.
In 2010, the average grain yield in NPK maize and wheat plots was 6.2 t/ha and 4.7 t/ha, respectively; while the system productivity was 12.2 t/ha. In contrast, the P omission plot had
a maize yield of only 3.1 t/ha and wheat productivity was 2.6 t/ha. In the SSNM plot, the maize productivity was 6.5 t/ha and wheat productivity was 3.7 t/ha with a system productivity of 11.2 t/ha. The FFP plot productivity for maize, wheat, and the system were 3.2, 1.3, and 4.9 t/ha, respectively.
In 2011, maize and wheat productivity under NPK in-creased up to 8.4 t/ha and 5.2 t/ha, respectively, while the system productivity went up to 15.1 t/ha. These productivities were signifi cantly (p ≤ 0.05) higher than P omission plots (6.6, 2.4 and 9.8 t/ha, respectively) and FFP (2.2, 2.1 and 5.0 t/ha, respectively) and were at par with the SSNM treatment (8.1, 5.7 and 15.6 t/ha, respectively). Higher maize production in 2011 could be attributed to the better rainfall pattern during the monsoon kharif 2011 and more favorable winter temperature during the following rabi season.
In 2012, grain yields were similar to those in 2010 where NPK yields for maize, wheat, and the system were 6.6, 4.1 and 11.4 t/ha and were signifi cantly (p ≤ 0.05) higher than P omission (3.1, 2.5 and 6.0 t/ha) and FFP (2.8, 1.6 and 4.6 t/ha) treatments. The SSNM yields (3.6, 3.8 and 8.0 t/ha) were also signifi cantly (p ≤ 0.05) higher than P omission and FFP plots. It was noted that the average maize and wheat yields of the 0 P treatment were signifi cantly (p ≤ 0.05) higher than the FFP from the 2010 wheat season onwards. Thus, although the P omission plot did not receive P fertilizer, its overall fertiliza-tion schedule appeared comparatively better than FFP as it did receive better N and K input (Figure 1).
The response study reported that the mean P response for maize was 2.8 t/ha, 2.2 t/ha for wheat and 5.5 t/ha for the MW system (Figure 2). In the case of maize, the response was high-est in 2012 (3.5 t/ha) followed by that of 2010 (3.1 t/ha) and then 2011 (1.8 t/ha). Phosphorus defi ciency is well reported on acidic soils because of the rapid reversion of soluble P into insoluble forms through reactions with iron and aluminum oxides. Therefore, P fertilizer has a very important role within
Figure 1. Grain yield of maize (M) and wheat (W) in maize-wheat sequence (Sys). SSNM and FFP = Site-Specific Nutrient Management and Farmers’ Fertilization Practice, respectively. Error bars = Standard errors.
Figure 2. Average grain yield response of maize (M), wheat (W) and the system to applied phosphorus across three years of study (n = 36). Boxes represent data within the first and third quartiles (interquartile range). Lines extending beyond the interquartile range denote the 10th to 90th percentile of the data. Statistical outliers are plotted as individual points outside these lines.
18,000
16,000
14,000
12,000
10,000
8,000
6,000
4,000
2,000
0
2010 M 2010 W 2010 Sys 2011 M 2011 W 2011 Sys 2012 M 2012 W 2012 Sys
Gra
in y
ield
, kg/
ha
Yearly distribution of M - W cropping system
NPK
NK
SSNM
FFP
10,000
8,000
6,000
4,000
2,000
0
Yiel
d re
spon
se, k
g/ha
Maize Wheat M-W System
Better C
rops/Vol. 100 (2016, No. 1)
19
the maize-wheat system, especially when compared with FFP.
Nutrient Use Effi ciencyNutrient use effi ciency (NUE)
provides an integrative index that quantifi es total economic output relative to the utilization of all nutrient resources in the system. Agronomic Efficiency (AE) and Partial Factor productivity (PFP) are useful measures of NUE (Cassman et al., 1998). The AE values for maize and wheat varied (example equation for AE (P
2O
5) = (Yield in NPK plot – Yield in P omission plot) / P
2O
5
applied x 100) although there was no crop-wise pattern. Tem-poral variation also was observed in AE values in the present study; there was a decreasing trend in the AE value for maize from 2010 to 2012. On the other hand, AE of wheat increased in 2011 from 2010, but again decreased in 2012. Similarly the AE of the maize-wheat system increased in 2011 from 2010, but decreased in 2012 (Table 1). This could be attributed to the higher yield of both maize and wheat in the year of 2011. The PFP is being calculated by dividing the grain yield with the amount of nutrient applied; therefore, it is an indication of production per unit of nutrient applied. PFP can be increased with the increase in the amount, uptake and utilization of indigenous nutrients. PFP can also improve by increasing the effi ciency with which applied nutrients are taken up by the crop and utilized to produce grain. The PFP value for P
2O
5
was signifi cantly higher in the SSNM treatments compared to NPK (Table 1), and it is expected as SSNM yield was at par with NPK with lower rates of P
2O
5.
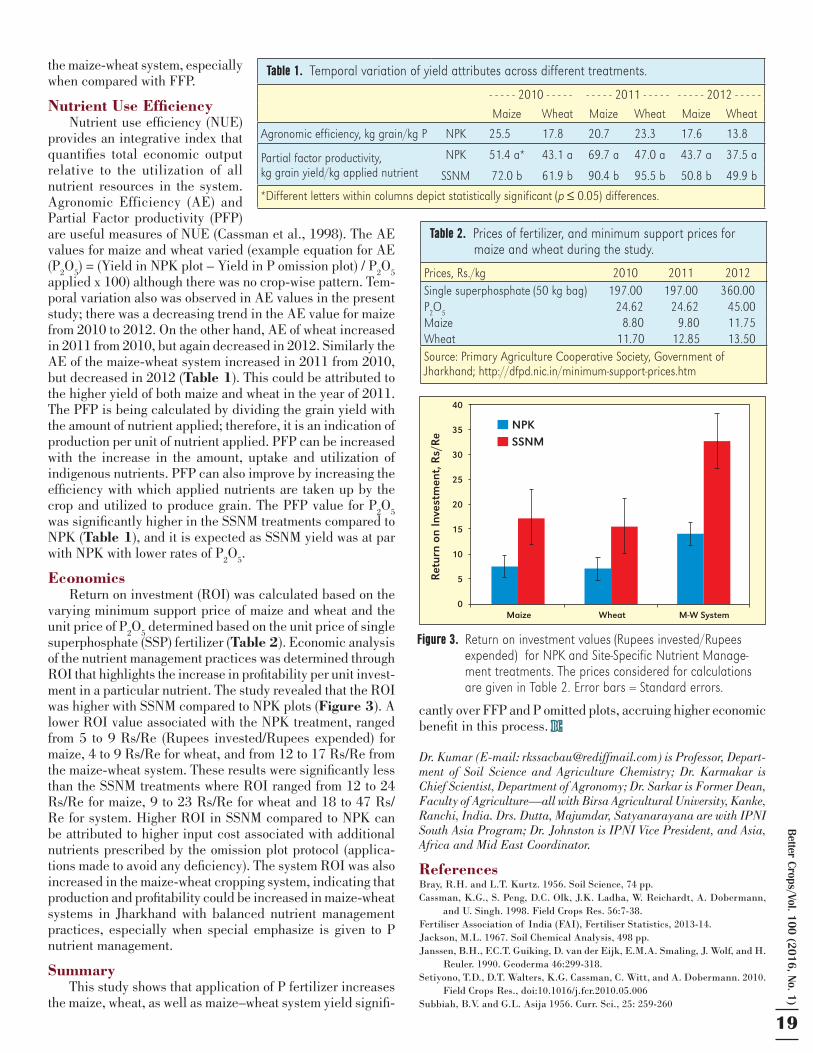
EconomicsReturn on investment (ROI) was calculated based on the
varying minimum support price of maize and wheat and the unit price of P
2O
5 determined based on the unit price of single
superphosphate (SSP) fertilizer (Table 2). Economic analysis of the nutrient management practices was determined through ROI that highlights the increase in profi tability per unit invest-ment in a particular nutrient. The study revealed that the ROI was higher with SSNM compared to NPK plots (Figure 3). A lower ROI value associated with the NPK treatment, ranged from 5 to 9 Rs/Re (Rupees invested/Rupees expended) for maize, 4 to 9 Rs/Re for wheat, and from 12 to 17 Rs/Re from the maize-wheat system. These results were signifi cantly less than the SSNM treatments where ROI ranged from 12 to 24 Rs/Re for maize, 9 to 23 Rs/Re for wheat and 18 to 47 Rs/Re for system. Higher ROI in SSNM compared to NPK can be attributed to higher input cost associated with additional nutrients prescribed by the omission plot protocol (applica-tions made to avoid any defi ciency). The system ROI was also increased in the maize-wheat cropping system, indicating that production and profi tability could be increased in maize-wheat systems in Jharkhand with balanced nutrient management practices, especially when special emphasize is given to P nutrient management.
Summary This study shows that application of P fertilizer increases
the maize, wheat, as well as maize–wheat system yield signifi -
cantly over FFP and P omitted plots, accruing higher economic benefi t in this process. BCBC
Dr. Kumar (E-mail: [email protected]) is Professor, Depart-ment of Soil Science and Agriculture Chemistry; Dr. Karmakar is Chief Scientist, Department of Agronomy; Dr. Sarkar is Former Dean, Faculty of Agriculture—all with Birsa Agricultural University, Kanke, Ranchi, India. Drs. Dutta, Majumdar, Satyanarayana are with IPNI South Asia Program; Dr. Johnston is IPNI Vice President, and Asia, Africa and Mid East Coordinator.
ReferencesBray, R.H. and L.T. Kurtz. 1956. Soil Science, 74 pp.Cassman, K.G., S. Peng, D.C. Olk, J.K. Ladha, W. Reichardt, A. Dobermann,
and U. Singh. 1998. Field Crops Res. 56:7-38.Fertiliser Association of India (FAI), Fertiliser Statistics, 2013-14. Jackson, M.L. 1967. Soil Chemical Analysis, 498 pp.Janssen, B.H., F.C.T. Guiking, D. van der Eijk, E.M.A. Smaling, J. Wolf, and H.
Reuler. 1990. Geoderma 46:299-318.Setiyono, T.D., D.T. Walters, K.G. Cassman, C. Witt, and A. Dobermann. 2010.
Field Crops Res., doi:10.1016/j.fcr.2010.05.006Subbiah, B.V. and G.L. Asija 1956. Curr. Sci., 25: 259-260
Figure 3. Return on investment values (Rupees invested/Rupees expended) for NPK and Site-Specific Nutrient Manage-ment treatments. The prices considered for calculations are given in Table 2. Error bars = Standard errors.
Table 1. Temporal variation of yield attributes across different treatments.
- - - - - 2010 - - - - - - - - - - 2011 - - - - - - - - - - 2012 - - - - -Maize Wheat Maize Wheat Maize Wheat
Agronomic efficiency, kg grain/kg P NPK 25.5 a* 17.8 a 20.7 a 23.3 a 17.6 b 13.8 a
Partial factor productivity, kg grain yield/kg applied nutrient
NPK 51.4 a* 43.1 a 69.7 a 47.0 a 43.7 a 37.5 a
SSNM 72.0 b 61.9 b 90.4 b 95.5 b 50.8 b 49.9 b
*Different letters within columns depict statistically significant (p ≤ 0.05) differences.
Table 2. Prices of fertilizer, and minimum support prices for maize and wheat during the study.
Prices, Rs./kg 2010 2011 2012Single superphosphate (50 kg bag) 197.00 197.00 360.00P2O5 çlll24.62 lll24.62 lll45.00Maize llllll8.80 llllll9.80 lll11.75Wheat llll11.70 llll12.85 lll13.50Source: Primary Agriculture Cooperative Society, Government of Jharkhand; http://dfpd.nic.in/minimum-support-prices.htm
40
35
30
25
20
15
10
5
0
Ret
urn
on In
vest
men
t, R
s/R
e
Maize Wheat M-W System
NPKSSNM
20
Bet
ter
Cro
ps/V
ol. 1
00 (
2016
, No.
1)
Abbreviations and notes: K = potassium; S = sulfur; Cu = copper; Mo = molybdenum; Na = sodium; Zn = zinc; KCl = potassium chloride; K2SO4= potassium sulfate; CEC = cation exchange capacity. P and K are ex-pressed as elemental forms. 1 mg of Colwell K/kg is equivalent to 0.1 cmol exchangeable K/kg
WESTERN AUSTRALIA
In sandy soils or acid lateritic soils containing kaolinitic clay with low CEC, considerable amounts of K can be lost by leaching (Sittiphanit et al., 2009). In Western Australia
(WA), greater removal of K in hay, grain and straw than fertilizer K input has steadily increased the incidence of K defi ciency on uniform deep sands and sandy duplex soils (sand over loam, clay or lateritic ironstone gravel) (Wong et al., 2000). In low K soils (less than 40 mg Colwell-K/kg), the reduction of wheat and barley growth is relatively greater in roots than shoots (Ma et al., 2011, 2013). The favoring of shoot growth at the expense of roots under K defi ciency may, in turn, have a negative feedback on plant uptake of soil water and nutrients and thus make low K plants more vulnerable to drought and/or salinity.
The climate in the south-west WA is a Mediterranean type with short, mild, wet winters and long, hot, dry summers. In this environment, crops often experience intermittent drought during early growth and terminal drought after anthesis. Plant nutrients in the drying topsoil become less available at the root surface, particularly when stratifi ed in the topsoil under no-till farming. In south-west WA, soil salinity and/or sodicity severely affects about 1 million ha of agricultural lands and is expected to expand because of rising saline groundwater due to the landscape water imbalance under annual pastures or crops (Clarke et al., 2002). In this study, we conducted fi eld experiments to investigate the role of K nutrition in alleviating drought and salinity stresses in wheat and barley and compare K-use effi ciency between KCl and K
2SO
4 sources. The effect
of time of K application was also examined.
2011 Experiment - WheatWheat was grown near Bolgart, Dowerin and Borden, in
WA. A pre-sowing soil analysis showed that soil K at 0 to 30 cm depth was low and potentially defi cient at all sites (Table 1). The experiments were sown in mid June, and each plot had an area of 2 m by 22 m and seven rows at 0.25-m row spacing. At sowing, 100 kg/ha of NPS fertilizer enriched with Cu-Zn-Mo was banded 5 cm below the seed. The fertilizer had 12.6 N, 17.7 P, 5.5 S, 0.25 Cu, 0.35 Zn, and 0.025 Mo (w/w%). At fi ve weeks after sowing (WAS), 200 kg/ha of urea (46% N) was broadcast.
All experiments included two K sources (KCl, K2SO
4), four
K rates (0, 20, 40, and 80 kg K/ha), and four application times
(0, 5, 10, or 15 WAS) by broadcast method. In addition, 80 kg K/ha using KCl without gypsum was also applied at 5 WAS to compare with the response of plants treated at the same rate of KCl plus gypsum. At anthesis, shoot dry weight was obtained by quadrat cuts and shoot K concentrations were determined by inductively coupled plasma atomic emission spectroscopy. At maturity, individual plots were machine harvested for grain yield.
2012 Experiment - BarleyBarley was grown at Beverley, WA. A pre-sowing soil
analysis showed 20 mg Colwell-K/kg in the 0 to 40 cm profi le, 10 mg S/kg in the top 10 cm soil and 6 mg S/kg at the lower depths. The soil was marginally saline. The experiment was sown in early June with similar rate of basal fertilizers to the 2011 experiments. At 2 WAS, KCl and K
2SO
4 were broadcast
at 0, 20, 40, and 120 kg K/ha. At anthesis, photosynthetic gas exchange of the fl ag leaves was measured and concentrations of K and Na of the uppermost three leaves were determined. At maturity, grain yields were measured from quadrat cuts.
ResultsIn the 2011 season, there was a dry spell of <30 mm total
rainfall from stem elongation to grain development at Dow-erin, compared to regular rainfall at Bolgart and Borden with monthly averages of 54 and 41 mm over the growing period, respectively. The difference in rainfall among the sites affected crop response to soil K treatments. While little K response was observed at Bolgart and Borden, applying 20, 40 and 80 kg K/ha as either K
2SO
4 or KCl with gypsum at 0 or 5 WAS
at Dowerin increased grain yield (Figure 1). Later broadcast application reduced the K effectiveness. The supply of 80 kg K/ha as KCl without gypsum at 5 WAS had lower shoot K and S contents, and decreased dry weight and grain yield than the same K rate using K
2SO
4 (Table 2).
By Qifu Ma, Richard Bell, Craig Scanlan, Gavin Sarre, and Ross Brennan
Drought and Soil Salinity Influence Response of Cerealsto Potassium and Sulfur Fertilization
Wheat required more K under drought than non-drought conditions, and the eff ectiveness of K fertilization was improved by early application.
In moderately saline, low K soil, K input improved growth and yield of barley—a response partially attributed to the plant’s ability to tolerate the substitution of Na for K.
Table 1. Pre-sowing soil potassium (Colwell-K) and sulfur (KCl-40 S) at three sites in the central and southern regions of the grain belt in Western Australia.
Soil depth Dowerin (central) Bolgart (central) Borden (southern)K S K S K S
- - - - - - - - - - - - - - - - - - - - mg/kg - - - - - - - - - - - - - - - - - - - -0 – 10 cm 31 14.6 40 6.7 23 6.110 – 20 cm 29 11.8 30 4.6 23 3.520 – 30 cm 28 12.2 37 3.0 30 4.430 – 40 cm 37 13.0 45 4.0 – – 40 – 60 cm 34 14.1 59 4.3 – – 60 – 80 cm 33 17.2 59 3.3 – –
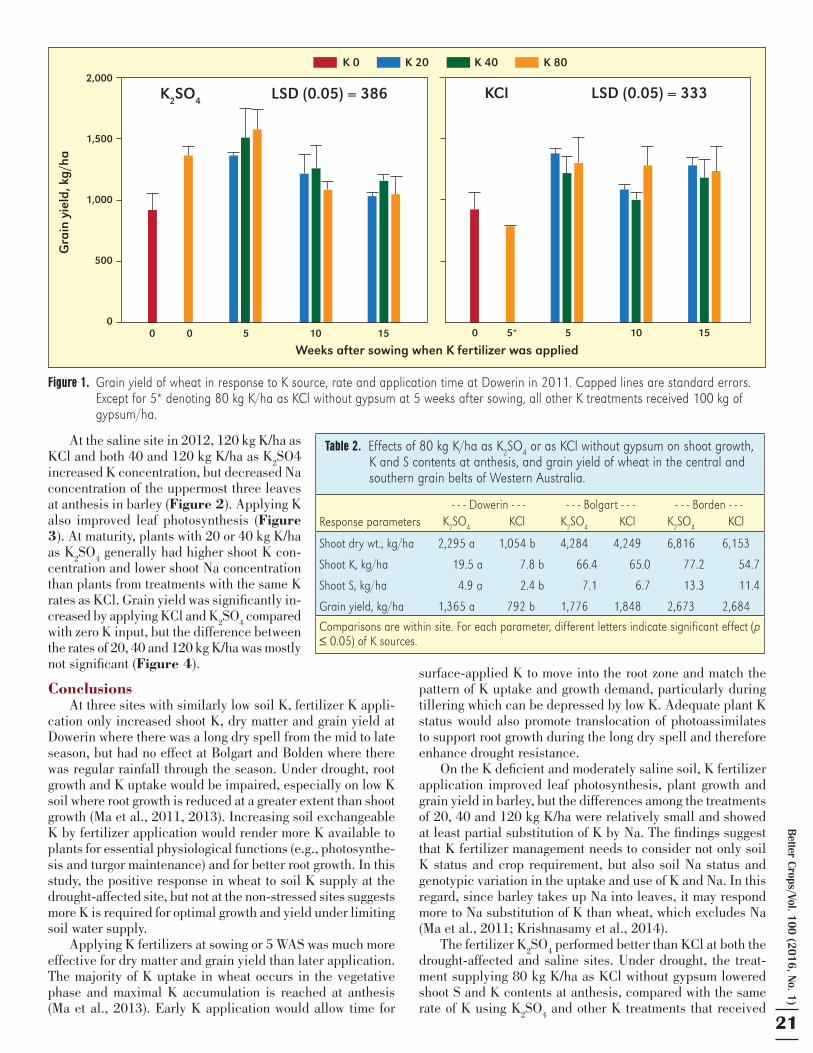
Better C
rops/Vol. 100 (2016, No. 1)
21
At the saline site in 2012, 120 kg K/ha as KCl and both 40 and 120 kg K/ha as K
2SO4
increased K concentration, but decreased Na concentration of the uppermost three leaves at anthesis in barley (Figure 2). Applying K also improved leaf photosynthesis (Figure 3). At maturity, plants with 20 or 40 kg K/ha as K
2SO
4 generally had higher shoot K con-
centration and lower shoot Na concentration than plants from treatments with the same K rates as KCl. Grain yield was signifi cantly in-creased by applying KCl and K
2SO
4 compared
with zero K input, but the difference between the rates of 20, 40 and 120 kg K/ha was mostly not signifi cant (Figure 4).
ConclusionsAt three sites with similarly low soil K, fertilizer K appli-
cation only increased shoot K, dry matter and grain yield at Dowerin where there was a long dry spell from the mid to late season, but had no effect at Bolgart and Bolden where there was regular rainfall through the season. Under drought, root growth and K uptake would be impaired, especially on low K soil where root growth is reduced at a greater extent than shoot growth (Ma et al., 2011, 2013). Increasing soil exchangeable K by fertilizer application would render more K available to plants for essential physiological functions (e.g., photosynthe-sis and turgor maintenance) and for better root growth. In this study, the positive response in wheat to soil K supply at the drought-affected site, but not at the non-stressed sites suggests more K is required for optimal growth and yield under limiting soil water supply.
Applying K fertilizers at sowing or 5 WAS was much more effective for dry matter and grain yield than later application. The majority of K uptake in wheat occurs in the vegetative phase and maximal K accumulation is reached at anthesis (Ma et al., 2013). Early K application would allow time for
surface-applied K to move into the root zone and match the pattern of K uptake and growth demand, particularly during tillering which can be depressed by low K. Adequate plant K status would also promote translocation of photoassimilates to support root growth during the long dry spell and therefore enhance drought resistance.
On the K defi cient and moderately saline soil, K fertilizer application improved leaf photosynthesis, plant growth and grain yield in barley, but the differences among the treatments of 20, 40 and 120 kg K/ha were relatively small and showed at least partial substitution of K by Na. The fi ndings suggest that K fertilizer management needs to consider not only soil K status and crop requirement, but also soil Na status and genotypic variation in the uptake and use of K and Na. In this regard, since barley takes up Na into leaves, it may respond more to Na substitution of K than wheat, which excludes Na (Ma et al., 2011; Krishnasamy et al., 2014).
The fertilizer K2SO
4 performed better than KCl at both the
drought-affected and saline sites. Under drought, the treat-ment supplying 80 kg K/ha as KCl without gypsum lowered shoot S and K contents at anthesis, compared with the same rate of K using K
2SO
4 and other K treatments that received
2,000
1,500
1,000
500
0
Gra
in y
ield
, kg/
ha
Weeks after sowing when K fertilizer was applied0 0 5 10 15 0 5* 5 10 15
K2SO
4 LSD (0.05) = 386 KCI
LSD (0.05) = 333
K 0 K 20 K 40 K 80
Figure 1. Grain yield of wheat in response to K source, rate and application time at Dowerin in 2011. Capped lines are standard errors. Except for 5* denoting 80 kg K/ha as KCl without gypsum at 5 weeks after sowing, all other K treatments received 100 kg of gypsum/ha.
Table 2. Effects of 80 kg K/ha as K2SO4 or as KCl without gypsum on shoot growth, K and S contents at anthesis, and grain yield of wheat in the central and southern grain belts of Western Australia.
Response parameters - - - Dowerin - - - - - - Bolgart - - - - - - Borden - - -
K2SO4 KCl K2SO4 KCl K2SO4 KCl
Shoot dry wt., kg/ha 2,295 a 1,054 b 4,284 4,249 6,816 6,153
Shoot K, kg/ha llllllll19.5 a lllllllllll7.8 b llllllllll66.4 llllllllll65.0 llllllllll77.2 llllllllll54.7
Shoot S, kg/ha llllllllll4.9 a lllllllllll2.4 b llllllllllll7.1 llllllllllll6.7 llllllllll13.3 llllllllll11.4
Grain yield, kg/ha 1,365 a lll792 b 1,776 1,848 2,673 2,684
Comparisons are within site. For each parameter, different letters indicate significant effect (p ≤ 0.05) of K sources.
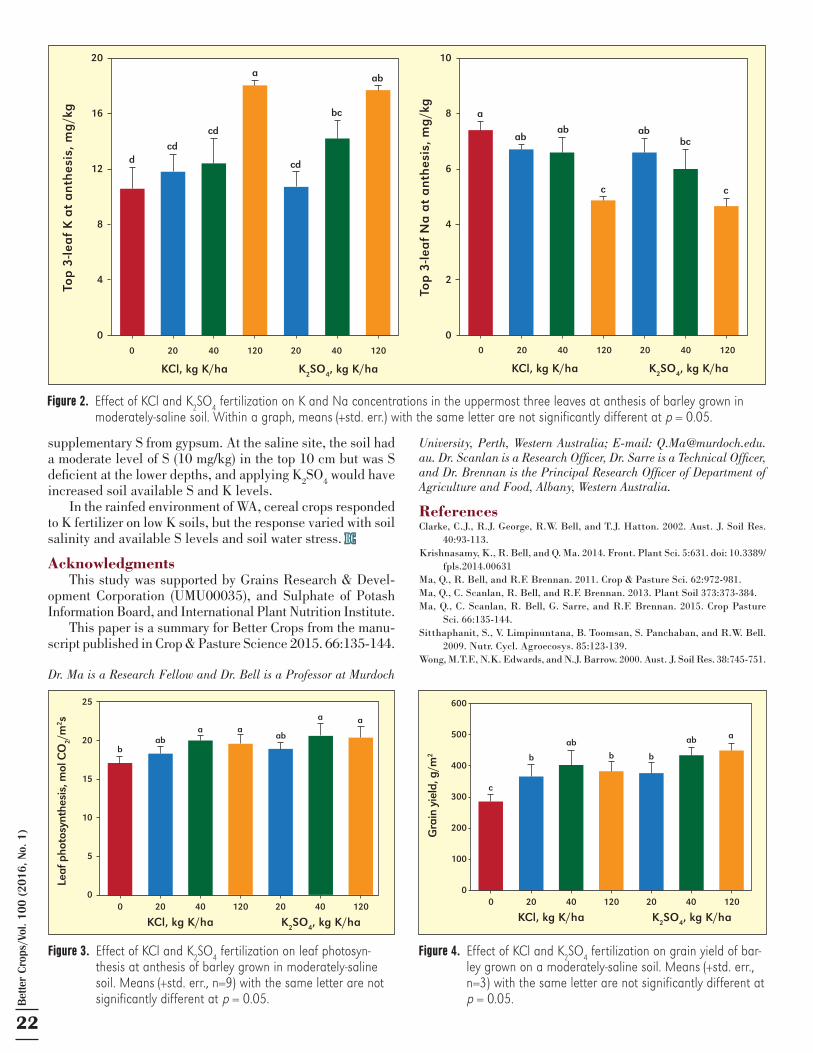
22
Bet
ter
Cro
ps/V
ol. 1
00 (
2016
, No.
1)
supplementary S from gypsum. At the saline site, the soil had a moderate level of S (10 mg/kg) in the top 10 cm but was S defi cient at the lower depths, and applying K
2SO
4 would have
increased soil available S and K levels.In the rainfed environment of WA, cereal crops responded
to K fertilizer on low K soils, but the response varied with soil salinity and available S levels and soil water stress. BCBC
AcknowledgmentsThis study was supported by Grains Research & Devel-
opment Corporation (UMU00035), and Sulphate of Potash Information Board, and International Plant Nutrition Institute.
This paper is a summary for Better Crops from the manu-script published in Crop & Pasture Science 2015. 66:135-144.
Dr. Ma is a Research Fellow and Dr. Bell is a Professor at Murdoch
University, Perth, Western Australia; E-mail: [email protected]. Dr. Scanlan is a Research Offi cer, Dr. Sarre is a Technical Offi cer, and Dr. Brennan is the Principal Research Offi cer of Department of Agriculture and Food, Albany, Western Australia.
ReferencesClarke, C.J., R.J. George, R.W. Bell, and T.J. Hatton. 2002. Aust. J. Soil Res.
40:93-113.Krishnasamy, K., R. Bell, and Q. Ma. 2014. Front. Plant Sci. 5:631. doi: 10.3389/
fpls.2014.00631Ma, Q., R. Bell, and R.F. Brennan. 2011. Crop & Pasture Sci. 62:972-981.Ma, Q., C. Scanlan, R. Bell, and R.F. Brennan. 2013. Plant Soil 373:373-384.Ma, Q., C. Scanlan, R. Bell, G. Sarre, and R.F. Brennan. 2015. Crop Pasture
Sci. 66:135-144.Sitthaphanit, S., V. Limpinuntana, B. Toomsan, S. Panchaban, and R.W. Bell.
2009. Nutr. Cycl. Agroecosys. 85:123-139.Wong, M.T.F., N.K. Edwards, and N.J. Barrow. 2000. Aust. J. Soil Res. 38:745-751.
Figure 2. Effect of KCl and K2SO4 fertilization on K and Na concentrations in the uppermost three leaves at anthesis of barley grown in moderately-saline soil. Within a graph, means (+std. err.) with the same letter are not significantly different at p = 0.05.
Figure 3. Effect of KCl and K2SO4 fertilization on leaf photosyn-thesis at anthesis of barley grown in moderately-saline soil. Means (+std. err., n=9) with the same letter are not significantly different at p = 0.05.
Figure 4. Effect of KCl and K2SO4 fertilization on grain yield of bar-ley grown on a moderately-saline soil. Means (+std. err., n=3) with the same letter are not significantly different at p = 0.05.
20
16
12
8
4
0
10
8
6
4
2
0
0 20 40 120 20 40 120
KCl, kg K/ha K2SO
4, kg K/ha
d
0 20 40 120 20 40 120
KCl, kg K/ha K2SO
4, kg K/ha
Top
3-le
af
K a
t a
nth
esis
, mg
/kg
Top
3-le
af
Na
at
an
thes
is, m
g/k
g
cd
cd
a
cd
bc
ab
a
abab ab
bc
c c
25
20
15
10
5
00 20 40 120 20 40 120
KCl, kg K/ha K2SO
4, kg K/ha
ab ab
b
a
Leaf
pho
tosy
nthe
sis,
mol
CO
2/m
2 s
aa a
600
500
400
300
200
100
00 20 40 120 20 40 120
KCl, kg K/ha K2SO
4, kg K/ha
ab ab
c
b b b
a
Gra
in y
ield
, g/m
2

Better C
rops/Vol. 100 (2016, No. 1)
23
For more than 20 years, InfoAg has been the leading event in precision agriculture. In 2016, InfoAg and ICPA will be colocated, providing additional educational and networking opportunities for everyone
interested in the pursuit of precision agriculture.
www.infoag.org • (217) 762-7955Producers • Input Suppliers • Crop Consultants/Scouts • Farm Managers • Academics and Extension • State and Federal Agents InfoAg is for:
August 2-4, 2016 • Union Station • St. Louis, MissouriIn conjunction with the 13th International Conference on Precision Agriculture, July 31-August 3, 2016.
THE PREMIER EVENT IN PRECISION AGRICULTURE!
Dr. Mirasol Pampolino Named Deputy DirectorFor IPNI Southeast Asia Program
The International Plant Nutrition Institute (IPNI) an-nounced the appointment of Dr. Mirasol Pampolino as deputy director of the Southeast Asia Program
(SEAP). Ms. Pampolino joined IPNI as an agronomist in 2008.
She has been instrumental in the development of Nutrient Expert®, a decision support tool that helps crop advisers to rapidly develop fertilizer recommendations for specifi c fi elds or growing environments. She will continue to man-age global Nutrient Expert activities through 2017, before assuming full-time duties in the SE Asia region.
“Pampolino has very strong expertise in cereal crop production and management in tropical and sub-tropical regions,” said Asia and Africa Group Vice President Dr. Adrian Johnston. “Her leadership will expand the level of engagement in SE Asia to cover a broader range of crops important to the region,” Johnston said.
Prior to joining IPNI, Pampolino worked at the In-ternational Rice Research Institute for 15 years, where
she served in different capaci-ties conducting research studies related to soil science and plant nutrition. She obtained her B.Sc. in Agriculture and M.Sc. in Soil Science from the University of the Philippines Los Baños (UPLB) and her Ph.D. in Agricultural Chemis-try (Soil Science) from Hokkaido University, Japan.
In her role as deputy director, Pampolino will lead fi eld crop projects in SE Asia, including rice, maize, and cassava. Dr. Thomas Oberthur, SEAP regional director, will continue to lead tree crop projects, mainly oil palm and cocoa.
“The SE Asia region represents a great opportunity for IPNI to implement new programs while helping grow-ers improve nutrient management of various crops,” said IPNI President, Dr. Terry Roberts. “Mira’s skills will help diversify and expand our reach,” said Roberts. BCBC
Dr. Mirasol Pampolino
DOUBLE STANDARDS
International Plant Nutrition Institute3500 Parkway Lane, Suite 550
Peachtree Corners, Georgia 30092-2844www.ipni.net
Our modern society, born out of the Industrial Revo-lution of the 19th century,
enjoys the benefi t of several tech-nologies that can be used to save lives. Most think of airplanes, computers, automobiles, lab devices, among other crucial in-ventions. I’ve wondered why we do not add tractors, combines, precision ag. devices, and fertil-izers to the list as well?
Without a doubt, the Green Revolution of the 20th century has allowed developed countries to modernize their cropping sys-tems with new fi eld techniques, which have made possible record achievements in crop yields, food supply, and hunger alleviation worldwide. Nevertheless, accord-ing to statistics from the United Nations World Food Programme (WFP), 795 million people in the world do not have enough food to lead a healthy active life. Furthermore, the number of people suffering from hunger is higher than the number of deaths caused by AIDS, malaria, and tuberculosis combined. Therefore, common sense tells us that fi ghting hunger through effi cient production of accessible foods can save a huge number of lives.
On the other hand, the Cultural Revolution of the 20th century seems to have affected our ability to weigh the facts. The world’s many, who are at risk of hunger-related disease and death, are relying on us to keep the focus on a healthy and affordable global food production system. Much like society’s self-imposed need for the latest smart phone or high performance sneaker, by focusing only on premium health- or so-called “environmentally-friendly foods”, agriculture risks creating a food system afforded only by the fi nancially elite. Our conventional food production systems are not trendy, but are essential for food security, considering the present need to feed millions suffering of malnutrition.
To help us weigh the facts on the food quality debate, I suggest a scientifi c review published by the American Journal of Clinical Nutrition entitled Nutritional Quality of Organic Foods: a systematic review. You can access the article via this link >http://ajcn.nutrition.org/content/early/2009/07/29/ajcn.2009.28041.full.pdf+html<.
Enjoy the read!
Eros FranciscoDeputy Director, IPNI Brazil Program