bc4 front cover rev1
TRANSCRIPT

BETTER CROPSWITH PLANT FOODA Publication of the International Plant Nutrition Institute (IPNI) 2016 Number 4
www.ipni.net
In This Issue...
...and much more
Controlled-Release Ureaand Banana
Our IPNI Scholarsfor 2016!
Adapting Oil Palm BMPsin Ghana
Plant Nutrition andDisease Resistance
Also:
Taking a Long Look at Crop RotationsTaking a Long Look at Crop Rotationsin the Northern Great Plainsin the Northern Great Plains
VOLUMEVOLUME

Vol. C (100) 2016, No. 4Our cover: Autumn fi eld scene in central Alberta, Canada. Photo by: ImagineGolf (iStock Image)Editor: Gavin D. SulewskiAssistant Editor: Sharon Jollay Design: Rob LeMasterBack page illustration: Greg Cravens
INTERNATIONAL PLANT NUTRITION INSTITUTE (IPNI) Executive Board of Directors Norbert Steiner, Chairman (K+S Aktiengesellschaft) Tony Will, Vice Chair (CF Industries) Dmitry Osipov, Finance Committee Chair, (Uralkali) Peachtree Corners, Georgia, U.S. (HQ) T.L. Roberts, President S.J. Couch, Vice President, Administration R.L. Mikkelsen, Vice President, Communications B. Green, IT Manager B. Rose, Statistics/Accounting C. Smith, Administrative Assistant A. Williams, Communications Specialist Saskatoon, Saskatchewan, Canada L.M. Doell, Director, Administrative Services S. Shirley, Communications Agronomist Nitrogen Program C.S. Snyder, Conway, Arkansas, U.S. Phosphorus Program T.W. Bruulsema, Guelph, Ontario, Canada Potassium Program T.S. Murrell, West Lafayette, Indiana, U.S. ASIA/AFRICA/MID. EAST GROUP—Gurgaon, Haryana, India K. Majumdar, Vice President China Program P. He, Beijing S. Li, Beijing F. Chen, Wuhan, Hubei S. Tu, Chengdu, Sichuan South Asia Program T. Satyanarayana, Gurgaon, Haryana, India S. Dutta, Kolkata, West Bengal, India Southeast Asia Program T. Oberthür, Penang, Malaysia M. Pampolino, Manila, Philippines North Africa Program M. El Gharous, Settat, Morocco H. Boulal, Settat, Morocco Sub-Saharan Africa Program S. Zingore, Nairobi, Kenya Middle East Program M. Rusan, Irbid, JordanAMERICAS/OCEANIA GROUP—Brookings, South Dakota, U.S. P.E. Fixen, Senior Vice President, and Director of Research P. Pates, Administrative Assistant North American Program T.L. Jensen, Saskatoon, Saskatchewan, Canada R.L. Mikkelsen, Merced, California, U.S. S.B. Phillips, Owens Cross Roads, Alabama, U.S. W.M. Stewart, San Antonio, Texas, U.S. Brazil Program L.I. Prochnow, Piracicaba, São Paulo V. Casarin, Piracicaba, São Paulo E. Francisco, Rondonópolis, Mato Grosso Northern Latin America Program R. Jaramillo, Quito, Ecuador Mexico and Central America Program A.S. Tasistro, Peachtree Corners, Georgia, U.S. Latin America-Southern Cone Program F.O. Garcia, Buenos Aires, Argentina Australia and New Zealand Program R. Norton, Horsham, Victoria, AustraliaE. EUROPE/C. ASIA GROUP—Moscow, Russia S. Ivanova, Vice President V. Nosov, Krasnodar, Russia
BETTER CROPS WITH PLANT FOOD (ISSN:0006-0089) is published quarterly by IPNI. Periodicals postage paid at Peachtree Corners, GA, and at additional mailing offi ces (USPS 012-713). Subscriptions free on request to qualifi ed individuals.Address changes may be e-mailed to: [email protected]
POSTMASTER: Send address changes to Better Crops with Plant Food, 3500 Parkway Lane, Suite 550, Peachtree Corners, GA 30092-2844. Phone (770) 447-0335; Fax (770) 448-0439. Website: www.ipni.net. Copyright 2015 by IPNI.
Better Crops with Plant Food is registered in Canada Post.Publications mail agreement No. 40035026Return undeliverable Canadian addresses to: PO Box 2600 Mississauga ON L4T 0A9 Canada
C O N T E N T SBETTER CROPS WITH PLANT FOOD
IPNI thanks the Government of Saskatchewan for their support of this publication through its resource tax funding.
IPNI Members:• Agrium Inc. • Arab Potash Company • BHP Billiton • CF Industries Holdings, Inc. • Compass Minerals Plant Nutrition • International Raw Materials LTD • K+S KALI GmbH • Kingenta Ecological Engineering Group Co. • LUXI Fertilizer Industry Group • OCP S.A. • • PhosAgro • PotashCorp • Shell Sulphur Solutions • Simplot • Sinofert Holdings Limited • SQM • The Mosaic Company • Uralchem, JSC • Uralkali • Yara International ASA
Affi liate Members:• Arab Fertilizer Association (AFA) • Associação Nacional para Difusão de Adubos (ANDA) • Fertiliser Association of India (FAI) • Fertilizer Canada • Fertilizers Europe• International Fertilizer Association (IFA) • International Potash Institute (IPI) • The Fertilizer Institute (TFI) • The Sulphur Institute (TSI)
Note to Readers: Articles which appear in this issue of Better Crops with Plant Food can be found at: >www.ipni.net/bettercrops<
Controlled-Release Urea in 19Banana Production in Southern China Hongwei Tan, Liuqiang Zhou, Yan Zeng, Huiping Ou, Jinsheng Huang, Xiaojun Zhu, and Shihua Tu
Adapting Oil Palm Best Management Practices to Ghana: 12Opportunities for Production Intensifi cation T. Rhebergen, T. Fairhurst, S. Zingore, M. Fisher, T. Oberthür, and A. Whitbread
Using Plant Physiology to Diagnose Nitrogen Defi ciency in Wheat 10 Andreas Neuhaus, Marianne Hoogmoed, and Victor Sadras
IPNI Scholar Award Recipients - 2016 3
Nutrient Use Effi ciency in Oil Palm Nurseries 16 Hendra Sugianto, Christopher Donough, Rahmadsyah, Chin-Huat Lim, and Thomas Oberthür
Testing the Benefi ts of Balanced Nutrient Use and 7Crop Diversifi cation on Soil Productivity and Health Miles Dyck, Dick Puurveen, and Tom Jensen
Diagnosis of the Nutritional Status of Rainfed Olive Orchards 22 Ajmi Larbi, Mahdi Fendri, Hakim Boulal, Mohamed El Gharous, and Monji Msallem
The Interaction Between Plant Nutrition and Disease: 25Focus on Verticillium Brad Geary and Doug Jacobson
IPNI Appoints Potassium Program Director 27
Increasing Beef Production with 28Improved Soil Nutrient Use: Brazil's Challenge Eros Francisco
The Overlooked Plant Nutrient? 32 Robert L. Mikkelsen

Better C
rops/Vol. 100 (2016, No. 4)
3
The International Plant Nutrition Institute (IPNI) has selected the winners of the annual Scholar Award Program. A total of 36 graduate students, representing 14 countries, were chosen in 2016. Each winner receives the equivalent of US$2,000.
IPNI Scholar Award Recipients - 2016
AFRICA
Amira Hachana
Bayou Bunkura Allito
Muneta Grace Manzeke
Ms. Amira Hachana, National Institute of Agronomy, Tunis, Tunisia. Ph.D. Program: Diagnostic of the Biodiversity of Rhi-zosphere Microfl ora and its Interaction with Rhizobium Legumino-sarum Nodulating Pea in Different Bioclimatic Areas of Tunisia.
Mr. Bayou Bunkura Allito, Kwame Nkrumah University of Science and Technology, Kumasi, Ashanti, Ghana, Africa. Ph.D. Program: Rhizobium Strain and Host-variety Interaction Effect on N
2 Fixation and Yield of Faba Bean in Southern Ethiopia.
Ms. Muneta Grace Manzeke, University of Zimbabwe, Harare, Zimbabwe. Ph.D. Program: Geospatial Variation of Bio-available Micronutrients in Tropical Soils and its Effects on Crop Productivity and Human Nutrition.
Dr. Gu Chiming, Wuhan Botanical Garden of Chinese Academy of Science, Moshan, Wuchang, Wuhan, China. Ph.D. Pro-gram: Study on Non-Point Pollution Condition and Control Measures in Danjiangkou Reservoir, Hubei, China.
Ms. Li Ting, Institute of Soil Science, Chinese Academic of Sciences, Nanjing, China. Ph.D. Program: Composition and Bioavailability of Soil Available Potassium of Typical Farmland in China.
Mr. Liang Guopeng, Chinese Academy of Agricultural Sciences, Beijing, China. M.Sc. Program: Seasonal Patterns of Soil Respiration and Soil Biochemical Properties under Nitrogen Addition.
Mr. Khalid Mehmood, University of Chinese Academy of Sciences, Beijing, China. Ph.D. Program: Amelioration of Acid Soils Using Low Energy Consuming Biochars Combined with Inorganic Fertilizers for Improved Crop Growth.
Ms. Zhang Qian, Chinese Academy of Agricultural Sciences, Beijing, China. Ph.D. Program: Effect of Organic Amend-ments and its Microbiological Mechanism under Rice-Wheat Rotation.
CHINA
Gu Chiming Li Ting Liang Guopeng Khalid Mehmood Zhang Qian
Graduate students attending a degree-granting institution located in any country within an IPNI regional program are eligible. The award is available to graduate students in science programs relevant to plant nutri-tion science and the management of crop nutrients including: agronomy, horticulture, ecology, soil fertility, soil chemistry, crop physiology, environmental science, and others.
Regional committees of IPNI scientifi c staff select the recipients of the IPNI Scholar Award. The awards are presented directly to the students at a preferred location and no specifi c duties are required of them.
Funding for the scholar award program is provided through support of IPNI member companies, primary producers of nitrogen, phosphate, potash, and other fertilizers.
More information is available from IPNI staff, individual universities, or from the IPNI website: www.ipni.net/awards. BCBC

4
Bet
ter
Cro
ps/V
ol. 1
00 (
2016
, No.
4)
NORTH AMERICAMs. Carolyn Wilson, Dalhousie University, Halifax, Nova Scotia, Canada. M.Sc. Pro-gram: Effect of Diverse Compost Products on Soil Quality and Potato Productivity.
Ms. Sara Berg, South Dakota State Univer-sity, Brookings, South Dakota, USA. M.Sc. Program: Evaluation of Tillage and Cover Crop Impacts on Corn Nitrogen Requirements in Southeastern South Dakota.
Mr. John Breker, North Dakota State Uni-versity, Fargo, North Dakota, USA. M.Sc. Program: Recalibration of Potassium Soil Test for Corn in North Dakota.
Mr. Jarom Davidson, University of Arkan-sas, Fayetteville, Arkansas, USA. M.Sc. Program: Validation of N-STaR Nitrogen Rate Recommendations and Evaluation of N-STaR Soil Sampling Procedures for Clay Soils in Arkansas.
Ms. Kelsey Hoegenauer, University of Arkansas, Fayetteville, Arkansas, USA. Ph.D. Program: Using Cover Crops to Recycle Nutrients in an Arkansas No-Till System.
Ms. Sarah Mueller, Purdue University, West Lafayette, Indiana, USA. Ph.D. Program: Supplemental Late-vegetative Nitrogen Application for High-yield Corn: Agronomic, Economic and Environmental Implications with Modern versus Older Hybrids.
Mr. Jared Spackman, University of Minnesota, Minneapolis, Minnesota, USA. M.Sc. Program: Nitrogen Fertilizer Source, Timing and Rate Impacts on Maize Nitrogen Use Effi ciency and Mineralization Potential of Minnesota Soils.
Ms. Elizabeth Trybula, Purdue University, West Lafayette, Indiana, USA. Ph.D. Program: Crop Water Productivity Re-sponse to Potassium Rate Application in Humid and Semi-Arid Conditions.
Carolyn Wilson Sara Berg John Breker Jarom Davidson
Kelsey Hoegenauer Sarah Mueller Jared Spackman Elizabeth Trybula
EASTERN EUROPE/MIDDLE EASTMr. Andrey Paratunov, Volgograd State Agrarian University, Volgograd, Russia. M.Sc. Program: Tomato Fertigation in a Dry Steppe Zone of Volga-Don Interfl uve.
Ms. Alena Ozheredova, Stavropol State Agrarian University, Stavropol, Russia. Ph.D. Program: The Effect of Fertilizers and Technologies on Winter Wheat Production in Central Ciscaucasia.
Ms. Anastasia Chobanu, Belgorod Agrarian University, Belgorod, Russia. M.Sc. Program: The Effect of Fertilizers on Biological Indicators of Soil Fertility.
Mr. Muhammad Asif, Sabanci University, Tuzla/Istanbul, Turkey. Ph.D. Program: Impact of Climate Change on Wheat Nutrition and Physiology.
Andrey Paratunov Alena Ozheredova Anastasia Chobanu Muhammad Asif
Getachew Agegnehu Jenberu
OCEANIA
Mr. Getachew Agegnehu Jenberu, James Cook University, Cairns, Queensland, Australia. Ph.D. Program: Biochar, Compost and Biochar-compost: Crop Performance, Soil Quality and Greenhouse Gas Emissions in Tropical Agricultural Soils.

Better C
rops/Vol. 100 (2016, No. 4)
5
SOUTH AMERICA
Mr. Walter Carciochi, University of Mar del Plata, Balcarce, Buenos Aires, Argentina. Ph.D. Program: Evaluation of Diagnosis Methods of Sulfur Availability in Maize.
Ms. Clara Milano, National Southern University, Bahia Blanca, Buenos Aires, Argentina. M.Sc. Program: Biological Nitrogen Fixation of Native Legume Grasses Introduced to the Degraded Grasslands of Southwestern Buenos Aires Province, Argentina.
Mr. Martín Torres Duggan, University of Buenos Aires, Buenos Aires, Argentina. Ph.D. Program: Forage Productivity Improvement under Manure, Rock Phosphate, and Zeolites Applications.
Mr. Eduardo Cancellier, Federal University of Lavras, Lavras, Minas Gerais, Brazil. Ph.D. Program: Development of Bio-based Coatings for Production of Controlled-Release Fertilizers and Availability of Controlled-Release Phosphorus.
Ms. Shivelly Los Galettos, State University of Ponta Grossa, Ponta Grossa, Parana, Brazil. Ph.D. Program: Effi ciency of Phosphate Fertilization as Infl uenced by the Application of Phosphogypsum in No-till System.
Ms. Lauren Menandro, Agronomic Institute of Campinas, Campinas, São Paulo, Brazil. M.Sc. Program: Characterization, Agronomic and Industrial Recovery of Sugarcane Shoots and Old Leaves.
Mr. Saulo Augusto Quassi de Castro, University of São Paulo, Piracicaba, São Paulo, Brazil. M.Sc. Program: Contribu-tion of Nitrogen Fertilizer in Sugarcane Due to Crop Rotation, Straw Removal and Nitrogen Rates.
Walter Carciochi Clara Milano Martín Torres Duggan Eduardo Cancellier Shivelly Los Galettos Lauren Menandro Saulo Augusto Quassi de Castro
SOUTH ASIA
Ms. Ridham Kakar, Dr. Y.S. Parmar University of Horticulture and Forestry, Nauni, Solan, Himachal Pradesh, India. Ph.D. Program: Integrated Nutrient Management under Ginger-caulifl ower Cropping Sequence in North-West Himalayas.
Mr. Kiran K.R., Indian Agricultural Research Institute, New Delhi, India. Ph.D. Program: Mobilization of Soil Iron to Minimize Iron Defi ciency Chlorosis of Soybean under Ambient and Elevated CO
2 and Temperature Conditions.
Mr. Rumesh Ranjan, Indian Agricultural Research Institute, New Delhi, India. Ph.D. Program: Genetic Analysis and Identifi cation of QTL’s Infl uencing Nitrogen Use Effi ciency in Wheat.
Ms. Pragyan Paramita Rout, Tamil Nadu Agricultural University, Coimbatore, Tamil Nadu, India. Ph.D. Program: De-velopment and Standardization of Sensors for Soil Moisture Monitoring and Precision Nutrient Management for Growing Flower Crops under Fertigation and Matric Suction Irrigation.
Mr. Vijayakumar Shanmugam, Indian Agricultural Research Institute, New Delhi, India. Ph.D. Program: Potassium Management in Aerobic Rice–Wheat Cropping System.
Ridham Kakar Kiran K.R Rumesh Ranjan Pragyan Paramita Rout
Vijayakumar Shanmugam
Arunbabu Talla Abdul Rehman
Continued on next page

6
Bet
ter
Cro
ps/V
ol. 1
00 (
2016
, No.
4)
Chuck Chuan Ng
SOUTHEAST ASIAMr. Chuck Chuan Ng, University of Malaya, Kuala Lumpur, Malaysia. Ph.D. Program: Soil-plant In-teraction of Trace Elemental Metals in Vetiver Grass.
SOUTH ASIA continued
Mr. Arunbabu Talla, Indian Institute of Technology, Kharagpur, West Bengal, India. Ph.D. Program: Planting Time and Nitrogen Management for Improving Hybrid Rice Production under Changing Climate of Subtropical India.
Mr. Abdul Rehman, University of Agriculture, Faisalabad, Pakistan. Ph.D. Program: Exploring the Role of Zinc Nutrition in Yield Improvement, Grain Biofortifi cation and Resistance against Abiotic Stresses in Wheat.
Frontiers of Potassium Science Conference | kfrontiers.orgOrganizers have designed this unique international con-
ference being held in Rome, Italy on January 25-27, 2017, as a forum to exchange information on how to improve potassium plant nutrition and soil management to better the health of soils, plants, animals, and humans. The 4R Nutrient Steward-ship framework is integrated into the conference structure to keep the discussions anchored to the information needs of farmers and those who provide nutrient management guidance.
Speakers (Selected list)Marta Alfaro, Instituto de Investigaciones Agropecuárias (INIA), Chile.Michael Bell, University of Queensland, Australia.Sylvie Brouder, Purdue University, USA.Ismail Cakmak, Sabanci University, Turkey.Heitor Cantarella, Agronomic Institute of Campinas, Brazil. Paul Fixen, International Plant Nutrition Institute, USA.David Franzen, North Dakota State University, USA.Keith Goulding, Rothamsted Research, UK.Philippe Hinsinger, UMR Eco&Soils, INRA-Montpellier SupAgro, France.John Kovar, USDA ARS, USA.Kaushik Majumdar, International Plant Nutrition Institute, India.
Robert Mikkelsen, International Plant Nutrition Institute, USA.Scott Murrell, International Plant Nutrition Institute, USA. Steven Oosthuyse, HortResearch SA, SQM, South Africa.Mike Rahm, The Mosaic Company, USA.Michel Ransom, Kansas State University, USA.Zed Rengel, The University of Western Australia, Australia.Vinod Kumar Singh, Indian Agricultural Research Institute, India.Michael Stone, Purdue University, USA.Jeff Volenec, Purdue University, USA.Connie Weaver, Purdue University, USA.Philip White, James Hutton Institute, Scotland.
Example Discussion Topics
Potassium in Sustainable Intensification of Cropping SystemsHow do potassium inputs and outputs compare for different cropping systems and geopolitical boundaries?
4R Source: Improving Decisions About the Source of Potassium to ApplyHow does the source of potassium fertilizer affect its proper placement in the soil?
4R Rate: Improving the Accuracy of Potassium Rate RecommendationsWhy and to what extent do various crops differ in their recovery efficiency of potassium?
4R Time: Improving Decisions About When to Apply PotassiumWhat are the genetic effects on potassium accumulation rates, partitioning, and plant metabolism?
4R Place: Improving Potassium Placement DecisionsWhat plant characteristics (rhizosphere biology and chemistry, root architecture, etc.) most influence potassium placement decisions?
Connecting Frontier Science to Frontier PracticeHow do we increase the impact of scientific findings on soil and crop management of potassium in the field?
Please visit http://KFrontiers.org to obtain all program and registration details, and to sign up for all pre- and post-conference updates.
Better C
rops/Vol. 100 (2016, No. 4)
7
Abbreviations and notes: N = nitrogen; P = phosphorus; K = potassium; S = sulfur; Ca = calcium; Mg = magnesium.
WESTERN CANADA
The majority of nutrient management fi eld research is conducted over a short time frame of up to a few years at most. However, when it is possible to continue a set
of experimental treatments for many decades, this so called “long-term research” can be very helpful in providing observ-able results that short-term research cannot offer.
One such long-term research site is 60 miles (100 km) southwest of Edmonton, Alberta, near the Village of Breton located in the Boreal Forest region. These “Breton Classical Plots” were established in 1930 by Dr. Frank Wyatt and Dr. John Newton of the Department of Soils, University of Alberta. Soil in this region is commonly referred to as “Gray Wooded”, but soil classifi cation systems refer to the soil as Gray Luvisolic (Canada), Boralf (U.S. Soil Taxonomy), and Albic Luvisol (FAO Soil Classifi cation).
This soil type formed under mixed wood forest and its associated understory vegetation, and is much different than adjacent grassland soils of the Northern Great Plains. As early farm settlers converted the prime, naturally fertile grassland soils to cropped agriculture in the early 1900s, the later ar-riving settlers began clearing and farming these Gray soils.
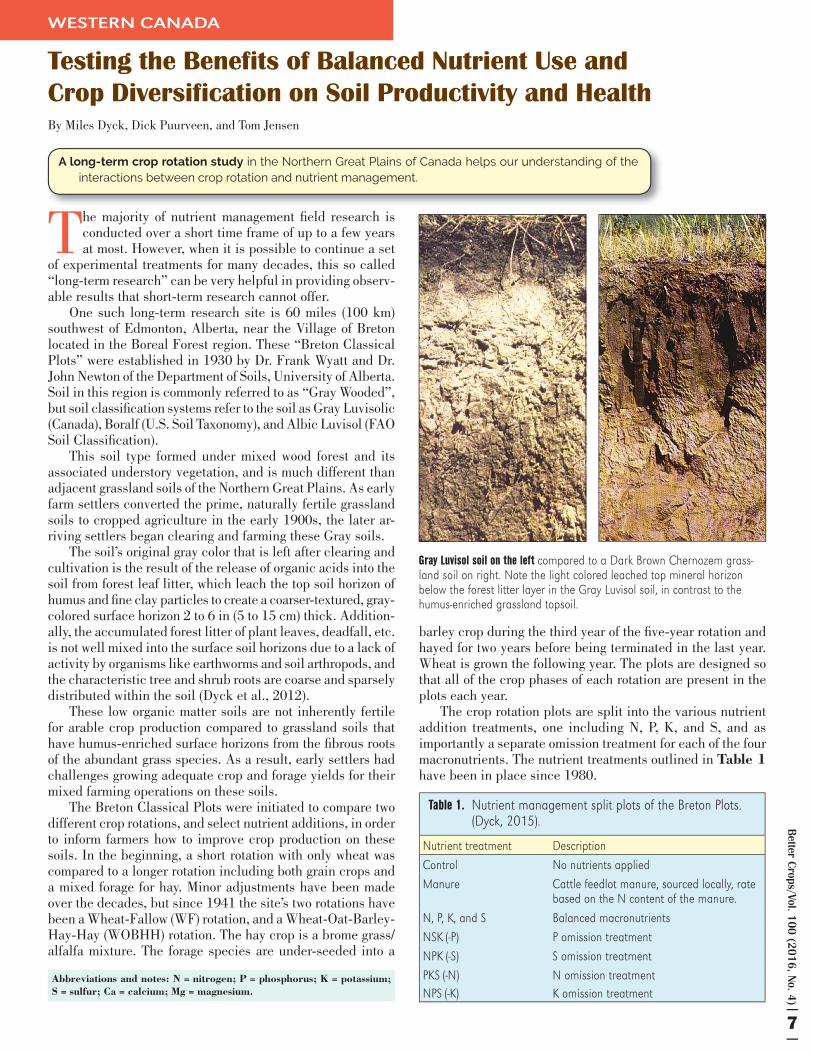
The soil’s original gray color that is left after clearing and cultivation is the result of the release of organic acids into the soil from forest leaf litter, which leach the top soil horizon of humus and fi ne clay particles to create a coarser-textured, gray-colored surface horizon 2 to 6 in (5 to 15 cm) thick. Addition-ally, the accumulated forest litter of plant leaves, deadfall, etc. is not well mixed into the surface soil horizons due to a lack of activity by organisms like earthworms and soil arthropods, and the characteristic tree and shrub roots are coarse and sparsely distributed within the soil (Dyck et al., 2012).
These low organic matter soils are not inherently fertile for arable crop production compared to grassland soils that have humus-enriched surface horizons from the fi brous roots of the abundant grass species. As a result, early settlers had challenges growing adequate crop and forage yields for their mixed farming operations on these soils.
The Breton Classical Plots were initiated to compare two different crop rotations, and select nutrient additions, in order to inform farmers how to improve crop production on these soils. In the beginning, a short rotation with only wheat was compared to a longer rotation including both grain crops and a mixed forage for hay. Minor adjustments have been made over the decades, but since 1941 the site’s two rotations have been a Wheat-Fallow (WF) rotation, and a Wheat-Oat-Barley-Hay-Hay (WOBHH) rotation. The hay crop is a brome grass/alfalfa mixture. The forage species are under-seeded into a
barley crop during the third year of the fi ve-year rotation and hayed for two years before being terminated in the last year. Wheat is grown the following year. The plots are designed so that all of the crop phases of each rotation are present in the plots each year.
The crop rotation plots are split into the various nutrient addition treatments, one including N, P, K, and S, and as importantly a separate omission treatment for each of the four macronutrients. The nutrient treatments outlined in Table 1have been in place since 1980.
By Miles Dyck, Dick Puurveen, and Tom Jensen
Testing the Benefits of Balanced Nutrient Use and Crop Diversification on Soil Productivity and Health
A long-term crop rotation study in the Northern Great Plains of Canada helps our understanding of the interactions between crop rotation and nutrient management.
Table 1. Nutrient management split plots of the Breton Plots. (Dyck, 2015).
Nutrient treatment DescriptionControl No nutrients appliedManure Cattle feedlot manure, sourced locally, rate
based on the N content of the manure.
N, P, K, and S Balanced macronutrientsNSK (-P) P omission treatmentNPK (-S) S omission treatmentPKS (-N) N omission treatmentNPS (-K) K omission treatment
Gray Luvisol soil on the left compared to a Dark Brown Chernozem grass-land soil on right. Note the light colored leached top mineral horizon below the forest litter layer in the Gray Luvisol soil, in contrast to the humus-enriched grassland topsoil.

8
Bet
ter
Cro
ps/V
ol. 1
00 (
2016
, No.
4)
Soil Organic Matter TrendsThe ability to observe long-term changes in soil proper-
ties within the Breton plots, as affected by crop rotation and nutrient management, is most useful to nutrient management decision making. Back in 1930, these Gray soils had a soil organic matter (SOM) content of 2.4% after the leaf litter layer was mixed with the leached mineral surface soil layer and underlying B horizon (Figure 1). Today, check plots receiving no fertilizer or manure under the WF rotation have seen a 24% loss in SOM down to 1.8%. Long term fertilization with NPKS has lessened this loss to a current 2.2% SOM. Application of manure has increased SOM content up to 3.6%.
In contrast to the WF rotation, the continuously cropped WOBHH rotation has shown improved SOM status under all treatments. Even the check (without nutrient input) has 3.2% SOM, and the NPKS fertilizer treatment up to 3.8%. The manure treatment has greatly increased its SOM content to 4.7%. The positive performance of the manure treatment is based upon the large addition of organic material providing much more than just the N, P, K, and S. However, the gains found in check, with two out of fi ve years in forage production, associated fi brous grass root growth, and symbiotic N fi xation inputs from alfalfa, are perhaps more surprising. Another pos-sible benefi t from deep-rooted perennial grasses and alfalfa comes from their ability to transport other nutrients (i.e., S, Ca, Mg) to soil surface zones, placing them nearer to growing cereal crop roots.
Wheat Yield TrendsAnalysis of wheat yield trends over the last nine years
(2007 to 2015) makes clear the current implications of adopt-ing practices over the long-term. Both the WF and WOBHH rotations are yielding lowest in the check treatments where zero nutrient addition is combined with continual removal of nutrients through crop harvest (Figure 2).
The highest yielding treatment, also common to both rotations, was the NPKS treatment. However, a divergence is observed between the two rotations, which is related to the impact of omitting K. Wheat yield in the NPS plots has fell
relative to the NPKS plots in the WOBHH rotation, but this gap is not seen in the WF rotation. This difference is linked to the greater removal of K under the WOBHH rotation due to the har-vest of hay. Over the long-term, this has lowered K availability to a larger degree compared to the WF rotation where only grain is removed from the plots.
The omission of N from the WF rotation results in very low yields that are similar to those obtained in the check. Thus, the addition of N is critical to the productivity of these Gray soils farmed under a WF system. In contrast, the WOBHH benefi ts from inclusion of an alfalfa for-age legume crop within the two-
year hay phase. As a result, wheat yields under N omission are far greater than those obtained in check plots.
Given adequate K input, the brome grass/alfalfa mixture in this fi ve-year rotation improves Gray soil productivity and soil health. The inclusion of mixed forages in a crop rotation also lends itself to the mixed farming operations commonly
Figure 1. Soil organic matter percentage as affected by crop rota-tion and nutrient treatment, 2013 soil sample analysis results. Error bars represent the standard error.
Figure 2. The effect of crop rotation and nutrient treatment on average wheat crop yields in each rotation, over a nine-year period (2007 through 2015). Error bars represent the standard error.
Table 2. Nutrient source and application rates (lb/A) according to rotation, phase, and fertility treatment.
Nutrient Source
- - - - - - - - - - - - - - - - - - - - - - Rotation-Phase - - - - - - - - - - - - - - - - - - - - - -WF-
WheatWF-
FallowWOBHH-Wheat
WOBHH-Oats
WOBHH-Barley silage1
WOBHH-Forage hay
N Manure2 803 0 784 783 0 0
N Urea 80 0 45 67 45 0
P2O5 Triple super phosphate 46 0 46 46 46 46
K2O Potassium chloride 53 0 53 53 53 53
S Elemental S 18 0 18 18 18 181Barley silage is under seeded to forage.2 Actual application rate of manure is determined by laboratory analysis and based on total N content. Rates of P, K, and S applied with the manure vary slightly due to annual differences in feedlot manure as affected by local availability of grain and hay sources, feed rations and bedding material.3 Manure for Wheat-Oats-Barley-Hay-Hay-Oats (WOBHH-Oats) and Wheat Fallow-Wheat (WF-Wheat) is applied in the spring prior to planting.4 Manure for the WOBHH-Wheat is applied in the previous fall prior to the plough down of second growth hay of that year.
0
10
20
30
40
50
60
Whe
at y
ield
, bu/
A
Crop rotation/nutrient treatment
WF C
heck
WF M
anure
WF N
PKS
WF -
NW
F -P
WF -
KW
F - S
5 yr C
heck
5 yr M
anure
5 yr N
PKS
5 yr -N
5 yr -P
5 yr -K
5 yr -S
0.00
1.00
2.00
3.00
4.00
5.00
6.00
WF C
heck
WF M
anure
WF N
PKS
WF -
NW
F -P
WF -
KW
F - S
5 yr C
heck
5 yr M
anure
5 yr N
PKS
5 yr -N
5 yr -P
5 yr -K
5 yr -S
Original S
oil
Soil
orga
nic
mat
ter,
%
Crop rotation/nutrient treatment

Better C
rops/Vol. 100 (2016, No. 4)
9
practiced in the area. Integrating crop and livestock, growing mixed forage crops, and returning livestock manure to fi elds on a regular basis will increase soil productivity compared to only growing small grains or oil seed crops.
The Breton Classical Plots are an extremely valuable legacy of crop rotation and nutrient treatment research, allowing observation of the long-term effects that cannot be measured in the short term. The research results emphasize the positive infl uence a balanced application of N, P, K, and S can have on a soil, whether applied as fertilizers or livestock manure. There is much discussion presently about what constitutes soil productivity and soil health, and what should be measured to assess the quality of a soil. The SOM and yield potential differ-ences between the combinations of crop rotation and nutrient
application are clearly observed at the Breton Plots, and help answer what practices maintain or improve soil capability for agricultural production. BCBC
Dr. Dyck (E-mail: [email protected]) and Mr. Puurveen (E-mail: [email protected]), Renewable Resources Department, University of Alberta, Edmonton, Alberta, Canada. Dr. Jensen is a Director of the IPNI North America Program (E-mail: [email protected]).
ReferencesDyck, M.F., J.A. Robertson, and D. Puurveen. 2012. The University of Alberta
Breton plots. www.prairiesoilsandcrops 5:96-104.Dyck, M.F. 2015. 2015FO21R - Coordinated N and S fertilizer management
to increase crop N uptake and reduce environmental N losses. Research Report ACIDF.
E
Dick
Puu
rvee
nBreton Plots, University of Alberta.

10
Bet
ter
Cro
ps/V
ol. 1
00 (
2016
, No.
4)
Abbreviations and notes: N = nitrogen.
AUSTRALIA
Nitrogen is a major yield and profi t driver for cereal production in the Mediterranean climates of Western Australia (WA) and South Australia (SA). The yield
components of plants/m2, spikelets/plant, grain number/spike-let, and grain weight in relation to N are fairly well understood. However, N fertilizer inputs can be diffi cult to match to the seasonal conditions, especially when only based on pre-season soil tests. Using a plant-tissue test that is more directly related to yield components such as biomass and achievable yield
(and maybe protein) responses, rather than just adequate nutrient tissue concentrations at different growth stages, may overcome some of the limitations associated with a pre-season soil test and predicted mineralized N. Such a plant test may help to guide N fertilizer applications to improve crop yields and profi tability with more certainty.
Nitrogen supply from mineralization of organic matter is often irregular in WA and SA because of fl uctuations in soil moisture and temperature. Low and unreliable rainfall in these climates restrict N supply and target yields. It makes sense to adopt a fl exible and robust strategy that can account for chang-
By Andreas Neuhaus, Marianne Hoogmoed, and Victor Sadras
Using Plant Physiology to Diagnose Nitrogen Deficiency in Wheat
A nitrogen nutrition index (NNI) is presented as a robust interpretation method to guide profi table and sustainable in-season N applications in dry climates with unfertile soils.
Risk management and improved confi dence in diagnosing early N defi ciency is the focus of this research.
Trial site in South Australia with different wheat varieties growing under a range of N treatments. Part of the trial is irrigated, while the other is rainfed to determine the effects of water deficit on the N dilution curve.

Better C
rops/Vol. 100 (2016, No. 4)
11
es in soil and seasonal conditions and thereby reduces the risk of mis-match-ing N supply and demand with fertilizer N applications rates and timings. Past research has worked towards a N nutri-tion index (NNI) obtained from whole shoots in well-watered, high-yielding conditions. Can the same concept be transferred to water-limited and lower-yielding growing areas in WA and SA? This question is being investigated in a project led by Dr. Sadras. He recently reviewed the NNI and linked the con-cept to plant water relations (Sadras and Lemaire, 2014). This NNI concept, if adjusted to water-limited climates, may have the potential to provide a useful tool for growers/advisers to guide in-season N recommendations in order to close the yield gap between actual and target yields, similar to the interpreta-tion model developed by the fertilizer company CSBP Ltd. (Southern, 1985) for macro- and micronutrients in WA.
Determination of NNIA critical N concentration represents the minimum N
concentration that is required to achieve maximum biomass. Crop growth is a sensitive indicator that integrates all major constraints, including water and N supply. Crop growth is also directly related to N uptake and slows down under N defi ciency. Maximum growth would lead to maximum yield in well-watered conditions, but doubts can be raised for cropping areas with a hot, dry fi nish that reduces harvest index (Heerwaarden et al., 1998). Canopy management in these water-limited climates may favor below maximum growth, which can be controlled with N defi cit. Thus this benchmark of maximum growth needs to be tested and validated before developed further for WA and SA conditions.
Over the course of a season the critical N concentration naturally decreases as the crop grows and the leaf to stem ratio declines. This is because stem or structural tissue has a lower N concentration than the photosynthetic leaf tissue. Furthermore, competition for light increases and more N is translocated within the plant from older, shaded leaves to younger, more photosynthetically active leaves. The end result of these processes over the course of the growing season is a critical “N dilution curve” that can be obtained from trial data by drawing a line through all critical N concentrations plotted against crop biomass (Figure 1). NNI is a calculated ratio using the measured N concentration in relation to the established N dilution curve.
The NNI is a robust concept in that plant sampling can occur throughout the vegetative period when fertilizer deci-sions are made. Whole shoot sampling is relatively easy and quick and is ideal for interpreting mobile nutrients that get remobilized within the plant, such as N.
This plant physiological concept needs to be calibrated using local trial data, thereby integrating variety and climate
specifi c conditions that are refl ected in the whole shoot N analysis at the time of sampling. The expectation is that dilution curves will “shift” downwards under water defi cit, and with varieties storing high concentration of water soluble carbohydrates (Hoogmoed and Sadras, 2016).
More importantly, NNI can be used as an intermediate variable to correlate to yield and protein. More relevant infor-mation can be made available for N decision making on farms, assuming the N uptake would not be limited by other nutrient defi ciencies, or the growth stage, and that weather conditions are favorable. The NNI to yield correlation will also show if crop yield peaks at NNI < 1, which would indicate the benefi ts of some degree of N defi cit in WA and SA.
This NNI will be explored in greater detail in fi eld trials conducted currently in SA and WA. The aim of these trials is to validate the plant physiological framework and to investi-gate the interaction of N nutrition and water defi cit in rainfed broad-acre agriculture. BCBC
AcknowledgementThe Grain Research and Development Corporation (GRDC)
is thanked for the fi nancial support of this project.
Dr. Hoogmoed (E-mail: [email protected]) and Dr. Sadras (E-mail: [email protected]) are with the South Aus-tralian Research and Development Institute. Dr. Neuhaus (E-mail: [email protected]) is with CSBP Ltd., Kwinana, Western Australia, Australia
ReferencesHeerwaarden, van A.F., R.A. Richards, G.D. Farquhar, and J.F. Angus. 1998.
Aust. J. Agric. Res. 49:1095-1110.Hoogmoed, M. and V.O. Sadras, 2016. Field Crops Res. 193:196-200.Sadras, V.O. and G. Lemaire. 2014. Field Crops Res. 164: 54-64.Southern, P. 1985. CSBP Productivity Focus 3:1-6.
Figure 1. Example of a critical N dilution curve for the crop vegetative period in well-watered conditions. Red points represent three plant tissue tests for shoot N concentra-tion and the corresponding biomass to illustrate when N would be deficient in the plant (NNI < 1, N concentration is below the minimum N concentration that is required for maximum growth), sufficient (NNI = 1, N concentration is matching the minimum N concentration for maximum growth) or in high, luxurious supply (NNI > 1, N concentration is above the minimum N concentration that is required for maximum growth).
6
5
4
3
2
1
0
0 2 4 6 8 10 12
Biomass, t/haSh
oot
N, %
NNI = 1.3
NNI = 1
NNI = 0.7
Nitrogen Nutrition = N actual/ N critical Index (NNI)

12
Bet
ter
Cro
ps/V
ol. 1
00 (
2016
, No.
4)
GHANA
The large demand for palm oil has resulted in a rapid expansion of global oil palm cultivation. Most of the current expan-
sion is taking place in Sub-Saharan Africa and Latin America as land available for new oil palm planting is limited in Southeast Asia. As a result, oil palm production in many West African (WA) countries has increased in the past decade. However, compared with the major producing countries in Southeast Asia and Latin America, average bunch yields in WA are very low (Table 1).
Smaller yields in WA are partly the result of sub-optimal climate conditions and poor management practices. Water stress is the main yield-determining factor outside management control in WA. In order to guide government policy makers and investors, it is essential to know where the most suitable conditions for the expansion of oil palm production in WA exists. Using Ghana as a case study, we describe a framework for evaluating areas that are both suitable and available for oil palm production based upon land suitability evaluation (LSE) methods and GIS techniques. We conclude by providing recommendations for the sustainable development of the oil palm sector in Ghana.
Land Suitability Evaluation (LSE) and Data AnalysisWe conducted the LSE in three-steps. First, we defi ned cli-
matically suitable areas for oil palm based upon climate and soil data obtained from WorldClim (www.worldclim.org), the ISRIC/WDC (https://soilgrids.org), and the FAO (http://www.fao.org/soils-portal/soil-survey/soil-maps-and-databases/harmonized-world-soil-database-v12/en/) soil databases, respectively. Four climatic zones (CZs) with varying suitability for oil palm were delineated in Ghana, based upon water defi cits calculated using the method of Surre (1968). These CZs were grouped accord-ing to mean annual water defi cit (mm/year), which integrates relevant climate (i.e., rainfall amount and distribution) and soil properties (i.e., water holding capacity) in a single parameter that delineates areas similar in terms of oil palm productivity (Olivin, 1968; van der Vossen, 1969). We defi ned four CZs:
1. Optimal: areas with a mean annual water defi cit <150 mm;2. Favorable: areas with a mean annual water defi cit <250 mm;
3. Suitable: areas with a mean annual water defi cit <400 mm; and4. Unsuitable: areas with a mean annual water defi cit >400 mm.
Areas that were climatically suitable were overlaid with biophysical and topographic constraints categorized as either ‘suitable’ or ‘not suitable’ (Table 2). Solar radiation, temper-ature, and slope were included be-cause, after water defi cit (WD), they are the most i m p o r t a n t factors that a f f ec t the growth and performance of oil palm (Paramananthan, 2003).
In the fi nal step, we excluded the most current land-use information, including protected areas defi ned by IUCN (Dud-
By T. Rhebergen, T. Fairhurst, S. Zingore, M. Fisher, T. Oberthür, and A. Whitbread
Adapting Oil Palm Best Management Practices to Ghana: Opportunities for Production Intensification
An increasing global demand for palm oil, and limited availability of agricultural land in Southeast Asia, has driven a rapid expansion of new oil palm plantings in West Africa.
Sub-optimal climate conditions and generally low yields in West Africa, combined with highly fragmented land holdings limit the potential for expansion of large-scale plantings.
Research conducted in Ghana indicates that production increases can alternatively be sought by applying best management practices to land already planted with oil palm.
Table 1. Area planted, fruit bunch production and yields in the main producer countries in oil palm production regions worldwide in 2013 (FAO, 2015).
Region CountryProduction, ‘000t fruit bunches
Mature area,‘000 ha
Bunch yield,t/ha
S.E. Asia
Indonesia 120,000 ll7,080 16.9
Malaysia 100,000 ll4,550 22.0
Papua New Guinea 102,100 4,ll150 14.0
Thailand 112,812 4, l626 20.5
Total 234,912 12,406 18.9
Lat. America
Colombia 234,991 12,250 20.0
Ecuador 232,317 12, 219 10.6
Guatemala 231,480 12, 265 22.8
Total 238,788 23ll534 16.5
W. Africa
Cameroon 232,450 12, 135 18.1
Ghana 232,100 12, 360 15.8
Liberia 2,lllll176 12, 217 10.4
Nigeria 235,000 1l2,000 12.5
Sierra Leone llllllll210 12, 228 17.5
Total 239,936 2l2,540 13.9
Table 2. Suitability for oil palm production based on climate and topography parameters (Paramananthan, 2003).
Limitation Units Suitable Unsuitable
ClimateSolar radiation MJ/m2 7 to 21 <7 or >21Temperature °C 18 to 37 <18 or >37TopographySlope ° <20 >20

Better C
rops/Vol. 100 (2016, No. 4)
13
ley, 2008), and urban settlements (Balk et al., 2006; CIESIN et al., 2011). Data on protected areas and urban settlements were obtained from the World Database on Protected Areas (http://protected-planet.net) (IUCN and UNEP-WCMC, 2014) and the Socioeconomic Data and Applications Center (SEDAC) (http://sedac.ciesin.columbia.edu/data/set/grump-v1-urban-extents/data-download) (CIESIN et al., 2011).
Areas Suitable and Available forOil Palm Production in Ghana
Suitable areas for oil palm production (WD <400 mm/year) are found in the wetter southern parts of Ghana, and are estimated at 73,500 km2 or 31% of the total land area. Unsuitable areas for oil palm production (WD >400 mm/year) are 165,000 km2 and occur in the northern regions characterized by a hot and dry climate. Optimal areas for oil palm (WD <150 mm/year) are estimated at 5,800 km2 and occur in the south of the West-ern Region and a smaller area west of Koforidua in the Eastern Region (Figure 1). Suitable areas for oil palm produc-tion were reduced by 9% to 67,200 km2 after excluding biophysical/topographi-cal constraints, and urban settlements and protected areas. The reduction was greatest in the optimal production zone (-30%), where large areas of forest re-serve and urban settlements occur. Few large, contiguous tracts of land remain available for oil palm within this zone (Figure 1).
The Effect of Climate Change onOil Palm Production in Ghana
Compared to a previous suitability assessment (van der Vossen, 1969), our methodology shows a larger suitable area (+20%) for oil palm production in Ghana. The difference is likely the result of different methods used to determine suitability, but also because of a chang-ing climate. Meteorological observations show that the climate in the oil palm belt has changed between 1960 and 2000. In particular, temperatures increased and there was less, but more variable rainfall. These climate trends are projected to continue to 2050 (EPA and Ministry of Environment, 2011), suggesting a more favorable water balance and growing Figure 1. Map of southern Ghana showing suitable and available areas with potential for
expansion in oil palm production, after excluding biophysical and topographical constraints and urban settlements and protected areas.
�������������������������������������������������������������������������������������������������������������������������������������������������������������������������
������
������
������
������
������
������
������
������
������
������
������������������������������������������������������������������������������������������������������������������������������������������������������������������������
0 60 120 240 Kilometers
���� ���������������������
��!"#��$
%�&'(��������!"�&'&)*�'(����&!��*��!��
+'������,-������/��$*�"$0����23�4&*���$�,-������/��$*�"$0����25������$�,-6������/��$*�"$0����27!�������$�,86������/��$*�"$0����2
5�&'$��8�95�&'$����#��9:$�'$*���*$��-�9�
;*&�$��$"��*$��7*��!��$���$�$!��
Volta
&*�($*!
%*&!)�<(�0&
<�(�!��
�$��$*!
�$!�*��
����$*!
�*$��$*�<��*�
S
� �
Abbreviations and notes: IPNI Project GBL-53
Field evaluations are carried out to pinpoint deficiencies in management practices that contribute to yield gaps. Site-specific best management practices are then developed and proposed as remedial action.
14
Bet
ter
Cro
ps/V
ol. 1
00 (
2016
, No.
4)
conditions for oil palm in Ghana in the future. Alternatively, temperature increases will most likely increase evapotranspira-tion and aggravate soil-moisture conditions during periods of drought. This could lead to higher water defi cits, and adversely affect oil palm production.
Key Constraints to the Production ofOil Palm in Ghana
The suboptimal amount and distribution of rainfall (water defi cit) is the main constraint limiting oil palm production in WA. An almost linear inverse relationship between bunch yield and water defi cit has been found in several studies in WA and Ghana (Danso et al., 2008; Olivin, 1968). Each 100 mm increase in water defi cit reduces bunch yields by 10 to 15% (Corley and Tinker, 2003; Olivin, 1968), and 40 to 50% if the palms were subjected to severe water stress in the preceding year as well (Caliman et al., 1998). Soils with a high water storage capacity are desirable to cope with WA’s climate, and represent a signifi cant resource for oil palm development in Ghana. These results emphasize the need to explore the fre-quency and intensity of water defi cits, and the occurrence of
drought as prerequisites to planning future expansion of the area of oil palm (Caliman, 1992).
Restrictions to Area Expansion in GhanaThe annual shortage in crude palm oil (CPO) will increase
from 35,000 t to 127,000 t by 2024 (MASDAR, 2011) if current production levels are maintained. To meet the projected oil demand in Ghana, suitability mapping identifi es opportuni-ties for area expansion into the most suitable lands for higher yields. Whilst area expansion is possible, fragmentation of suitable and available land largely hinders the establishment of large-scale plantations. This is exacerbated by other land-use types that were not part of the assessment, such as land under cocoa and rubber production, annual cropping, mining, high conservation value (HCV) areas, and fallow land that is part of slash and burn agriculture. Moreover, land acquisition is further complicated by complex land tenure arrangements that prevail in southern Ghana that make it diffi cult for investors to acquire land for the development of large-scale plantations (Ahiable, personal communication).
Opportunities to Increase Oil Palm Production in Ghana with Best Management Practices
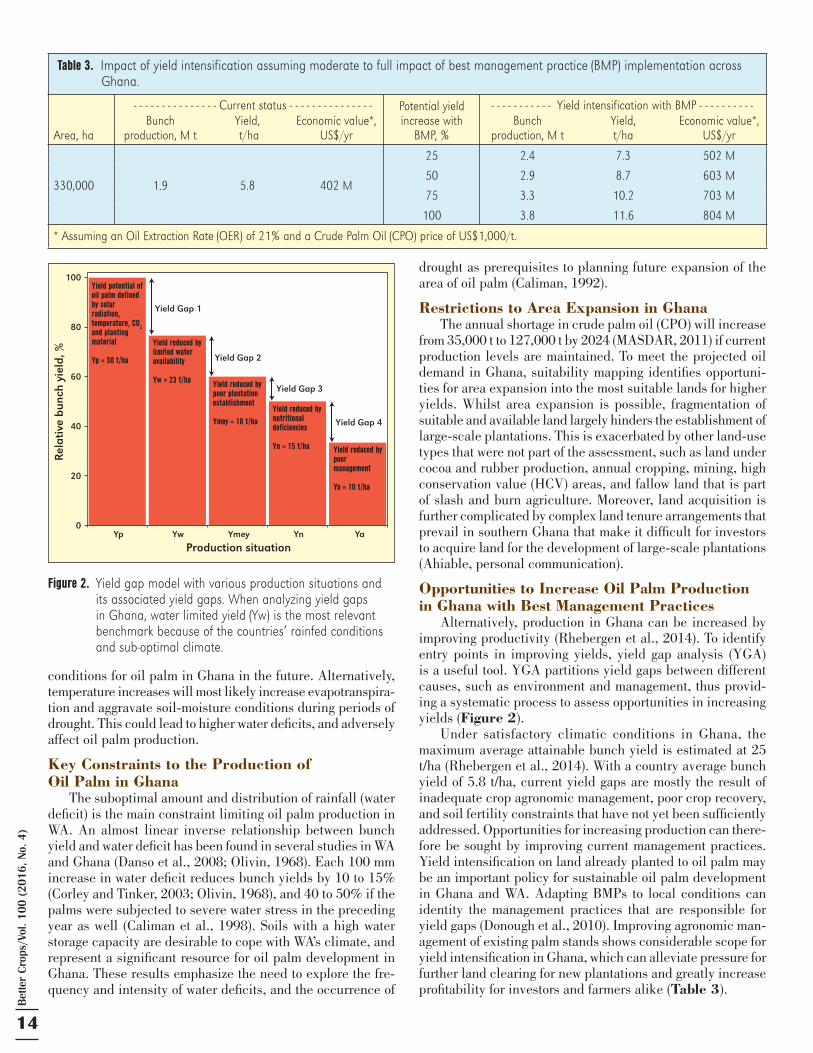
Alternatively, production in Ghana can be increased by improving productivity (Rhebergen et al., 2014). To identify entry points in improving yields, yield gap analysis (YGA) is a useful tool. YGA partitions yield gaps between different causes, such as environment and management, thus provid-ing a systematic process to assess opportunities in increasing yields (Figure 2).
Under satisfactory climatic conditions in Ghana, the maximum average attainable bunch yield is estimated at 25 t/ha (Rhebergen et al., 2014). With a country average bunch yield of 5.8 t/ha, current yield gaps are mostly the result of inadequate crop agronomic management, poor crop recovery, and soil fertility constraints that have not yet been suffi ciently addressed. Opportunities for increasing production can there-fore be sought by improving current management practices. Yield intensifi cation on land already planted to oil palm may be an important policy for sustainable oil palm development in Ghana and WA. Adapting BMPs to local conditions can identity the management practices that are responsible for yield gaps (Donough et al., 2010). Improving agronomic man-agement of existing palm stands shows considerable scope for yield intensifi cation in Ghana, which can alleviate pressure for further land clearing for new plantations and greatly increase profi tability for investors and farmers alike (Table 3).
Table 3. Impact of yield intensification assuming moderate to full impact of best management practice (BMP) implementation across Ghana.
Area, haBunch
production, M tYield, t/ha
Economic value*, US$/yr
Potential yield increase with
BMP, %Bunch
production, M tYield, t/ha
Economic value*, US$/yr
330,000 1.9 5.8 402 M
25 2.4 7.3 502 M
50 2.9 8.7 603 M
75 3.3 10.2 703 M
100 3.8 11.6 804 M
* Assuming an Oil Extraction Rate (OER) of 21% and a Crude Palm Oil (CPO) price of US$1,000/t.
- - - - - - - - - - - - - - - Current status - - - - - - - - - - - - - - - - - - - - - - - - - - Yield intensification with BMP - - - - - - - - - -
Figure 2. Yield gap model with various production situations and its associated yield gaps. When analyzing yield gaps in Ghana, water limited yield (Yw) is the most relevant benchmark because of the countries’ rainfed conditions and sub-optimal climate.
100
80
60
40
20
0
Production situation
Rel
ativ
e bu
nch
yiel
d, %
Yp Yw Ymey Yn Ya
Yield Gap 1
Yield Gap 2
Yield Gap 3
Yield Gap 4
Yield potential ofoil palm definedby solarradiation,temperature, CO
2and plantingmaterial
Yp = 30 t/ha
Yield reduced bylimited wateravailability
Yw = 23 t/ha Yield reduced bypoor plantationestablishment
Ymey = 18 t/haYield reduced bynutritionaldeficiencies
Yn = 15 t/ha Yield reduced bypoormanagement
Ya = 10 t/ha

Better C
rops/Vol. 100 (2016, No. 4)
15
ConclusionsThe suitability assessment shows that highly fragmented
suitable areas for oil palm production in Ghana are limiting the expansion of large-scale plantings. Therefore, a feasible strategy for expansion of smallholder production is needed, provided there are enough and effi cient milling facilities to process the fruit. Alternatively, research conducted in South-east Asia and Ghana indicate that production increases can be sought by applying BMPs to land already planted with oil palm. Closing yield gaps in Ghana could make a signifi cant contribution to the national CPO supply and could lead to an increased profi tability for investors and farmers alike. More-over, increasing productivity in already existing palm stands reduces the need to clear land for new plantations. BCBC
Mr. Rhebergen is Project Manager, Oil Palm Yield Intensifi cation, IPNI Sub Saharan Africa Program (E-mail: [email protected]). Dr. Fairhurst is with Tropical Crop Consultants Ltd., Wye, England. Dr. Zingore is Director, IPNI Sub Saharan Africa Program. Dr. Fisher is with the International Center for Tropical Agriculture (CIAT), Cali, Colombia. Dr. Oberthür is Director, IPNI Southeast Asia Program. Dr. Whitbread is with the International Crops Research Institute for the Semi-Arid Tropics (ICRISAT), Patancheru, India and Crop Pro-duction Systems in the Tropics George-August-Universität, Göttingen, Göttingen, Germany.
ReferencesBalk, D.L. and U. Deichmann, G. Yetman, F. Pozzi, S.I. Hay, and A. Nelson.
2006. Adv. Parasitol 62:119-156.Caliman, J.P. 1992. Oléagineux 47:205-216.Caliman, J.P. and A. Southworth. 1998. IOPRI/GAPKI, Bali, Indonesia, pp. 250-274.CIESIN, IFPRI, World Bank, and CIAT. 2011. NASA Socioeconomic Data and
Applications Center (SEDAC), Palisades, NY, USA.Corley, R.H.V. and P.B. Tinker. 2003. World Agriculture Series. Blackwell Science
Ltd, Oxford, UK, 562 pp.Danso, I. B.N. Nuertey, E. Andoh-Mensah, A. Osei-Bonsu, T.E.O. Asamoah.
2008. J. Ghana Sci. Assoc. 10:93-102.Donough, C., C. Witt, and T.H. Fairhurst. 2010. Indonesian Oil Palm Research
Institute (IOPRI), Jogyakarta, Indonesia, pp.1-8.Dudley, N. 2008. IUCN, Gland, Switzerland, 86 pp.EPA and Ministry of Environment, S.A.T. 2011. Ministry of Environment,
Science and Technology, Accra, Ghana.FAO, 2015. FAOSTAT Database.IUCN and UNEP-WCMC. 2014. Cambridge, UK: UNEP-WCMC.MASDAR, 2011. Ministry of Food and Agriculture (MOFA).Olivin, J. 1968. Oléagineux, 23:499-504.Paramananthan, S. 2003. Potash & Phosphate Institute/Potash & Phosphate
Institute of Canada (PPI/PPIC) and International Potash Institute (IPI), Singapore, pp.27-58.
Rhebergen, T., M.P. Hoffmann, S. Zingore, T. Oberthür, K. Acheampong, G. Dwumfour, V. Zutah, C. Adu-Frimpong, F. Ohipeni, and T. Fairhurst. 2014. International Oil Palm Conference (IOPC), Bali, Indonesia.
Surre, C., 1968. Calcul du bilan de l’eau et ses applications pratiques. Oléag-ineux, 23:165-167.
van der Vossen, H.A.M. 1969. Ghana J. Agric. Sci., 2:113-118.
Extent and Nature of Circulation Average No. Copies Each Issue During Preceding 12 Months
No. Copies of Single Issue Published Nearest to Filing Date
15.
14. Issue Date for Circulation Data Below13. Publication Title
a. Total Number of Copies (Net press run)
In-County Paid/Requested Mail Subscriptions stated on PS Form 3541. (Include direct written request from recipient, telemarketing, and Internet requests from recipient, paid subscriptions including nominal rate subscriptions, employer requests, advertiser’s proof copies, and exchange copies.)
d. Non- requested
Distribution (By mail and outside the mail)
b. Legitimate Paid and/orRequestedDistribution(By mailandoutsidethe mail)
c. Total Paid and/or Requested Circulation (Sum of 15b (1), (2), (3), and (4))
Outside County Paid/Requested Mail Subscriptions stated on PS Form 3541. (Include direct written request from recipient, telemarketing, and Internet requests from recipient, paid subscriptions including nominal rate subscriptions, employer requests, advertiser’s proof copies, and exchange copies.)
(1)
(2)
(4) Requested Copies Distributed by Other Mail Classes Through the USPS (e.g., First-Class Mail®)
Sales Through Dealers and Carriers, Street Vendors, Counter Sales, and Other Paid or Requested Distribution Outside USPS® (3)
Nonrequested Copies Distributed Outside the Mail (Include pickup stands, trade shows, showrooms, and other sources) (4)
(1)Outside County Nonrequested Copies Stated on PS Form 3541 (include sample copies, requests over 3 years old, requests induced by a premium, bulk sales and requests including association requests, names obtained from business directories, lists, and other sources)
(2)In-County Nonrequested Copies Stated on PS Form 3541 (include sample copies, requests over 3 years old, requests induced by a premium, bulk sales and requests including association requests, names obtained from business directories, lists, and other sources)
(3)Nonrequested Copies Distributed Through the USPS by Other Classes of Mail (e.g., First-Class Mail, nonrequestor copies mailed in excess of 10% limit mailed at Standard Mail® or Package Services rates)
Total Distribution (Sum of 15c and e)f.
Total Nonrequested Distribution [Sum of 15d (1), (2), (3) and (4)]e.
Copies not Distributed (See Instructions to Publishers #4, (page #3))g.
Total (Sum of 15f and g)h.
Percent Paid and/or Requested Circulation (15c divided by 15f times 100)
i.
Better Crops with Plant Food August, 2015
12,880 12,430
748 1,460
0 0
4,690 4,609
300 300
5,738 6,369
5,625
0
0
0
4,980
0
0
0
5,625 4,980
11,363 11,349
1,517 1,081
12,880 12,430
51% 56%
I certify that 50% of all my distributed copies (electronic and print) are legitimate requests or paid copies.
18. Signature and Title of Editor, Publisher, Business Manager, or Owner Date
I certify that all information furnished on this form is true and complete. I understand that anyone who furnishes false or misleading information on this form or who omits material or information requested on the form may be subject to criminal sanctions (including fines and imprisonment) and/or civil sanctions (including civil penalties).
17. Publication of Statement of Ownership for a Requester Publication is required and will be printed in theissue of this publication.
November, 2016
09-26-2106
Statement of Ownership, Management, and Circulation (Requester Publications Only)
1. Publication Title 2. Publication Number 3. Filing Date
4. Issue Frequency 5. Number of Issues Published Annually 6. Annual Subscription Price (if any)
8. Complete Mailing Address of Headquarters or General Business Office of Publisher (Not printer)
9. Full Names and Complete Mailing Addresses of Publisher, Editor, and Managing Editor (Do not leave blank) Publisher (Name and complete mailing address)
Editor (Name and complete mailing address)
Managing Editor (Name and complete mailing address)
10. Owner (Do not leave blank. If the publication is owned by a corporation, give the name and address of the corporation immediately followed by the names and addresses of all stockholders owning or holding 1 percent or more of the total amount of stock. If not owned by a corporation, give the names and addresses of the individual owners. If owned by a partnership or other unincorporated firm, give its name and address as well as those of each individual owner. If the publication is published by a nonprofit organization, give its name and address.)
11. Known Bondholders, Mortgagees, and Other Security Holders Owning or Holding 1 Percent or More of Total Amount of Bonds, Mortgages, or Other Securities. If none, check box.
PS Form 3526-R, July 2014 [Page 1 of 4 (See instructions page 4)] PSN: 7530-09-000-8855
None
7. Complete Mailing Address of Known Office of Publication (Not printer) (Street, city, county, state, and ZIP+4®)
_
Contact Person
Telephone (Include area code)
Full Name Complete Mailing Address
Complete Mailing AddressFull Name
12. Tax Status (For completion by nonprofit organizations authorized to mail at nonprofit rates) (Check one)
Has Not Changed During Preceding 12 MonthsHas Changed During Preceding 12 Months (Publisher must submit explanation of change with this statement.)
The purpose, function, and nonprofit status of this organization and the exempt status for federal income tax purposes:
PRIVACY NOTICE: See our privacy policy on www.usps.com.
Better Crops with Plant Food 0 0 0 6 0 0 8 9 09-26-2016
Quarterly Four Free to subscribers
International Plant Nutrition Institute3500 Parkway Ln, Suite 550, Peachtree Corners, GA 30092-2844
Gavin Sulewski
770-825-8080
International Plant Nutrition Institute 3500 Parkway Ln, Suite 550, Peachtree Corners, GA 30092-2844
International Plant Nutrition Institute 3500 Parkway Ln, Suite 550, Peachtree Corners, GA 30092-2844
Gavin Sulewski, International Plant Nutrition Institute 3500 Parkway Ln, Suite 550, Peachtree Corners, GA 30092-2844
Gavin Sulewski, International Plant Nutrition Institute 3500 Parkway Ln, Suite 550, Peachtree Corners, GA 30092-2844
International Plant Nutrition Institute 3500 Parkway Ln, Suite 550, Peachtree Corners, GA 30092-2844

16
Bet
ter
Cro
ps/V
ol. 1
00 (
2016
, No.
4)
Abbreviations and notes: N = nitrogen; P = phosphorus; K = potassium; Mg = magnesium. IPNI Project SEAP-04
INDONESIA
High quality seedlings are an important prerequisite for high yielding, mature oil palms. Oil palm seedlings are typically groomed for one year in the nursery before
being planted into the fi eld. Nurseries usually practice a two-stage system, in which a pre-nursery stage of 12 to 14 weeks is followed by the main nursery stage that lasts between 38 to 40 weeks.
Standardized fertilizer programs are used in both nursery stages. However, the nutrient supply capacity of the topsoil growth medium is not routinely determined, potentially caus-ing suboptimal and ineffi cient application of nutrients. The International Plant Nutrition Institute (IPNI) analyzed samples of plants and topsoil growth medium, in a collaborative project with Wilmar Group in South Sumatra, Indonesia, to understand nutrient use effi ciency (NUE) in two-stage oil palm nurseries.
The South Sumatra ProjectThe South Sumatra project was implemented at three
separate sites. Pre-germinated hybrid oil palm seeds were sown in weekly batches at the pre-nursery. Ten batches of each were assessed in 2012 and 2013 at sites 1 and 2, involving a total of 63,500 plants. In 2014 at site 3, four batches were assessed totaling 9,200 plants. In each batch, one part was subjected to Best Management Practices (BMP) following the methods of Rankine and Fairhurst (1999), while the rest were managed using the Standard Estate Practices (SEP) of the partner plantation. BMP and SEP treatments continued in the main nursery, involving 26,108 plants at sites 1 and 2 and 4,750 plants at site 3. The main difference between BMP and SEP in the two nursery stages was the fertilizer program
summarized in Table 1.Nutrient losses in each nursery system were estimated by
comparing the total amount of nutrients retained in the growth medium and plants at the end of each nursery stage, with the total amount of nutrients in the growth medium at the start of each nursery stage and nutrients supplied by fertilizers during each stage. Initial values were determined for the growth me-dium by sampling the topsoil-fi lled, unplanted and unfertilized bags. Bags were sampled again at the end of pre- and main nurseries stages to obtain the fi nal nutrient content.
Each sampled plant was measured (as described by Donough et al. 2014), then carefully removed from its bag and separated from the growth medium. All samples of air-dried soil and oven-dried plant portions were combined according
By Hendra Sugianto, Christopher Donough, Rahmadsyah, Chin-Huat Lim, and Thomas Oberthür
Nutrient Use Efficiency in Oil Palm Nurseries
Soil tests are useful in selecting suitable topsoil for use as growth medium in oil palm nurs-eries to avoid diff erences in plant growth between sites.
Nutrient use effi ciency (NUE) in oil palm nurseries can be improved with appropriate ap-plication rates and timing.
Further improvements in NUE in oil palm nurseries could come with more effi cient irrigation and use of slow-release nutrient sources.
Table 1. Nutrients supplied in the oil palm nursery of the South Sumatra project.
Nutrient
Pre-nursery application, g/plant
Main nursery application, g/plant
BMP1 SEP2 BMP SEPN 0.9 2.2 24.4 30.1P 0.6 1.2 24.7 26.2K 0.3 0.8 31.5 35.4Mg 0.1 0.4 34.5 33.01Best Management Practice; 2Standard Estate Practice
Seedlings are planted in polythene bags (polybags) filled with a suitable medium, usually topsoil. On the left, the pre-nursery bags (15 cm x 23 cm) are ar-ranged in beds (10 bags wide and 100 bags long) and the main nursery (right) uses larger bags (38 cm x 45 cm) arranged in an equilateral triangular pattern (90 cm spacing). Seedlings are irrigated in the nursery, using a fine spray provided by perforated polythene tubes.

Better C
rops/Vol. 100 (2016, No. 4)
17
to site, giving a total of 24 samples for each nursery. This was comprised of six samples of dried plant tops (two treatments BMP and SEP, three sites per treatment), six samples of dried plant roots, and six samples each of initial and ending growth media.
Nutrient LossesThe nutrient balance was much better under BMP in the
pre-nursery stage (Table 2). In the main nursery, the BMP
nutrient balance was still superior but the absolute difference smaller. The Mg balance in the main nursery was better with SEP. The values for P appear low as only plant-available P, but not total soil P, was determined.
There were signifi cant differences in the nutrient balances between sites. Table 3 illustrates these differences for the
K balances, which are attributable to site differences in the properties of the topsoil growth medium, including the clay, organic C, and soil N content, and the cation exchange capac-ity (data not shown). This clearly indicates the usefulness of soil tests in the selection of suitable topsoil growth medium.
Plant Growth and Nutrient Use Effi ciencyPlant growth under BMP and SEP was not signifi cantly
different (Table 4). This indicates suffi cient nutrients were supplied by either treatment. In the pre-nursery, BMP plants were very similar in size to SEP plants despite receiving far less nutrients (Table 1). This indicates that nutrient supply was excessive with SEP, with the lower nutrient balance in the SEP pre-nursery (Table 2) suggesting that much of this
oversupply is lost. Early applications in the SEP pre-nursery fertilizer program could be eliminated without any adverse effect on pre-nursery plant growth. This is shown by similar plant growth achieved with late applications in the BMP pre-nursery fertilizer program.
In the main nursery, BMP plants were marginally larger (Table 4) even though they received slightly less nutrients except for Mg. Donough et al. (2014), reporting early results from Sites 1 and 2 only, attributed this to the higher propor-tion of readily available P supplied in the BMP main nursery fertilizer program.
In the pre-nursery stage, partial factor productivity [PFP = plant dry weight (g) per g nutrient applied] was better with BMP, especially for K (Figure 1a). Internal effi ciency [IE = plant dry weight (g) per g nutrient uptake] was only marginally different between the two treatments (Figure 1b). Again, this is an indication of excessive and untimely supply of nutrients through SEP. BMP nutrients were applied near the end of the pre-nursery period. SEP nutrients, on the other hand, were ap-plied regularly after sowing. This suggests losses of nutrients that were applied during the early stage of the pre-nursery. In the main nursery, differences between treatments were small for both PFP and IE (Figure 2a and 2b), indicating similar nutrient use effi ciency in BMP and SEP fertilizer programs.
ConclusionsThe loss of nutrients from the oil palm nursery system,
especially in the pre-nursery stage, can be high if generous fertilizer rates are applied and not appropriately timed. Further improvement in nutrient retention in the pre-nursery stage should be possible with the adoption of irrigation methods that supply water more effi ciently and are possibly grouped with slow-release nutrient sources.
The difference between current practices and BMP are smaller in the main nursery stage. Yet, as in the pre-nursery, improvements in irrigation and use of slow-release nutrient sources will further help reducing nutrient loss and improve nutrient use effi ciency in the main nursery.
Use of standardized fertilizer programs at various locations may lead to differences in plant growth between locations. Soil tests should be used to guide selection of suitable topsoil growth medium for planting in oil palm nurseries. BCBC
Table 2. Nutrient balance in the oil palm nursery of the South Sumatra project.
Nutrients
Pre-nursery nutrients retained1, %
Main nursery nutrients retained2,%
BMP3 SEP4 BMP SEPN 76 52 70 65P 79 57 12 10K 76 18 47 43Mg 39 24 70 911Nutrients in soil plus plant tissue at end of the pre-nursery period as a % of nutrients added in fertilizers plus initial soil contents; 2Nutrients in soil plus plant tissue at end of the main nursery period as a % of nutrients added in fertilizers plus initial soil and plant tissue contents; 3Best Management Practice; 4Standard Estate Practice.
Table 3. Potassium balance in oil palm nurseries at three sites of the South Sumatra project.
Site1
Retained K (%) in pre-nurseries2
Retained K (%) in main nurseries3
BMP4 SEP5 BMP SEP1 94 39 37 202 71 34 62 483 66 12 86 77 1Three different oil palm nurseries involved in the project; 2K in soil plus plant tissue at end of the pre-nursery period as a % of K added in fertilizer plus initial soil content; 3K in soil plus plant tissue at end of the main nursery period as a % of K added in fertilizer plus initial soil and plant tissue contents; 4Best Management Practice; 5Standard Estate Practice.
Table 4. Plant growth measures in the oil palm nursery stage of the South Sumatra project.
Growth IndicatorsPre-nursery stage1 Main nursery stage2
BMP3 SEP4 BMP SEPStem diameter5 (cm) 221.0 22l0.9 22lll6.2 534l5.9Plant height6 (cm) 24 25 690 585Fronds per plant7 224.7 22l4.7 614 514Petiole cross-section8 (cm2) - - 22lll1.2 534l1.1Plant dry weight9 (g) 222.5 22l2.9 636 5341Growth measured once at end of PN period; 2Data shown for measure-ments after 28 weeks in MN; 3Best Management Practice; 4Standard Estate Practice; 5Stem diameter at soil level; 6Height from soil surface to tip of longest frond; 7Fully expanded green fronds only; 8Product of width and depth of petiole at proximal end of frond, measured on the 3rd fully expanded frond, measured only in MN; 9PN sampled at end of PN period, MN sampled at 36 weeks at 2 sites and 28 weeks at 1 site.

18
Bet
ter
Cro
ps/V
ol. 1
00 (
2016
, No.
4)
AcknowledgementsData used were generated from a collaborative project
between IPNI Southeast Asia Program (SEAP) and Wilmar International Limited (WIL). All fi eldwork and data collection were carried out by staff of WIL in three oil palm nurseries located within South Sumatra, Indonesia. IPNI staff and con-sultants helped design and analyze results. All direct costs of fi eldwork and implementation were borne by WIL. Canpotex provided funds to cover the cost of IPNI consultants and labo-ratory analyses. All laboratory analyses were done by Asian Agri Laboratory in North Sumatra, Indonesia.
Mr. Sugianto (E-mail: [email protected]) is Oil Palm Advisor for Indonesia, IPNI Southeast Asia Program (SEAP). Mr. Donough is Senior Oil Palm Advisor, IPNI SEAP, Mr. Rahmadsyah is Senior Research Manager, Sumatra, Wilmar Plantations Indonesia. Dr. Lim is Research Head, Wilmar International Ltd. Dr. Oberthür is Director, IPNI SEAP
ReferencesDonough, C.R., S. Mohanaraj, Rahmadsyah, T. Oberthür. 2014. Poster presented
at International Oil Palm Conference, June 2014, Bali, Indonesia. Rankine, I. R. and T.H. Fairhurst. 1999. Potash & Phosphate Institute (PPI),
Potash & Phosphate Institute of Canada (PPIC) and 4T Consultants. 109 pp.
Figure 1. Partial factor productivity and internal efficiency for nutrients applied under best management (BMP) and standard estate (SEP) practices in the pre-nursery of the South Sumatra project.
Figure 2. Partial factor productivity and internal efficiency for nutrients applied under best management (BMP) and standard estate (SEP) practices in the main nursery of the South Sumatra project.
0
2
4
6
8
10
12
14
16
18
20
N P K Mg
g pl
ant
dry
wei
ght/
g nu
trie
nt a
pplie
d(a) Partial Factor Productivity
BMP
SEP
0
50
100
150
200
250
300
350
400
450
500
550
N P K Mg
g pl
ant
dry
wei
ght/
g nu
trit
ent
upta
ke
(b) Internal Efficiency
BMP
SEP
0
20
40
60
80
100
120
140
160
180
200
N P K Mg
g pl
ant
dry
wei
ght/
g nu
trie
nt a
pplie
d
(a) Partial Factor Productivity
BMP
SEP
0
50
100
150
200
250
300
350
400
450
500
550
600
650
700
750
N P K Mg
g pl
ant
dry
wei
ght/
g nu
trie
nt u
ptak
e
(b) Internal Efficiency
BMP
SEP

Better C
rops/Vol. 100 (2016, No. 4)
19
Abbreviations and notes: N = nitrogen; P = phosphorus; K = potassium. IPNI Project CHN-GX15
SOUTHWEST CHINA
Banana requires much larger quantities of nutrients (es-pecially N and K) than other common fi eld crops due to the crop’s obviously large biomass. In order to improve N
use effi ciency during the rainy, summer season, growers often have to divide their N fertilizer into six to eight applications to minimize ammonium volatilization, nitrate leaching, and denitrifi cation. Since manual fertilizer application are still common in China’s plantations, these split applications have created diffi cult, time consuming, and costly work in the hot, humid, and sometimes wet fi elds.
Controlled-release urea (CRU) is considered to be an N source capable of delivering enhanced effi ciency in crop production. Use of CRU has reduced the number of split ap-plications of N fertilizer while still improving crop yield and crop N uptake (Haderlein et al., 2001; Geng et al., 2015). These characteristics make CRU an ideal N source for banana.
The objectives of this study were to examine the optimal rates and timing of CRU manufactured by Agrium Inc. (Cal-gary, Alberta, Canada) and to evaluate its infl uence on banana yield and quality. Researchers wanted to offer science-based information for proper CRU use. This three-year (2013 to 2015) fi eld experiment compared different rates, timings, and blends of CRU and regular urea (RU) (Table 1). The full rate of N
By Hongwei Tan, Liuqiang Zhou, Yan Zeng, Huiping Ou, Jinsheng Huang, Xiaojun Zhu, and Shihua Tu
Controlled-Release Urea in Banana Production in Southern China
Researchers tested complete or partial substitution of controlled-release urea for regular urea in order to identify new options capable of off ering high fruit yield along with improved effi ciencies in crop management and N use.
Banana is widely grown in southern China where the crop covers 400,000 ha and annual fruit production has reached 12 million t (MOA, 2013).

20
Bet
ter
Cro
ps/V
ol. 1
00 (
2016
, No.
4)
applied as RU was split six times between a basal application, three seedling side-dressings, fl ower bud differentiation, and fruit swelling. The CRU was applied basally and the remainder was either side-dressed solely at the seedling stage, or was split between the seedling and fruit swelling stages. Prior to the fl ower bud shooting stage, all fertilizers were broadcast and incorporated into the soil around the drip line of the banana canopy. The banana seedlings were transplanted in the fi rst year and the suckers (daughter plants) sprouted from the previ-ous plant corms that were used as the second and third crops.
Yield ResponsesBanana yields varied considerably from year to year,
but trends showed an increase with time. Importantly, CRU increased banana yield while reducing the number of split applications of N (Table 2). The two full rate CRU treatments consistently produced the highest yields. Dividing CRU into two side-dressings improved yield marginally compared to the single side-dressing, but with no economic advantage (Table 3). In the fi rst two years, CRU applied at 80% of the full N rate produced higher yields than the full rate of RU, but this
trend ended during year 3. CRU applied at 70% of the full N rate consistently produced lower yields and this yield gap increased with time. Blended CRU+RU (80:20) produced slightly lower yields than RU in year 1, but this reversed in the last two years, especially for the treatment with two side-dressings. Similar results were observed for the reduced rate (80%) CRU+RU blend, which also implies a feasible practice at this location.
Banana yields were not signifi cantly related to agronomic traits such as plant height, stem girth, or fl ower bud shooting date, but they were related to fi nger number per plant and fi nger weight (data not shown). The study found that adequate fi nger number per plant, and bigger fi ngers, were key to obtaining high yields. This observation agrees with other research that reports on CRU’s benefi ts on yield components such as increased kernel/ear and 100-kernel weight for maize (Wang et al. 2011), increased boll number per plant and boll
weight for cotton (Hu et al., 2011), and increased effective tillers, fi lled grain per panicle, and 1000-grain weight in rice (Yang et al., 2013).
Economic Returns and Agronomic Effi ciency
For net returns, all CRU options generated more income than the RU treatment (Table 3). Among the CRU options, the two full N rate treatments proved most profi table.
Besides the potential for CRU to improve yield and profi ts with reduced labor, based on the large N input that is associated with banana crop produc-tion, the anticipated environmental gains related to CRU are large. Re-searchers report that CRU can reduce
Table 3. Economic returns as affected by combinations of controlled-release urea (CRU) and regular urea (RU), Guangxi, China.
Treatment2013 2014 2015
- - - - Net income2, US$/ha - - - -No N (CK) 15,690 10,020 15,520RU (5)1 11,400 15,240 15,600CRU (1) 13,100 17,120 17,200CRU (2) 13,300 16,940 17,590CRU+RU (80:20) (1) 11,880 16,290 16,530CRU+RU (80:20) (2) 11,760 16,060 17,050CRU @ 80% N rate (1) 12,320 16,210 16,220CRU @ 70% N rate (1) 12,120 16,000 15,410CRU+RU (60:40) @ 80% N rate (1) 11,920 16,570 16,6301Figures in the brackets refer to the number of side-dressings.2Net income refers to the values after deducting the total cost includ-ing fertilizers (CRU prices have exceeded regular urea by US$154 to US$200/t), pesticides, labor, irrigation, and harvest.
Table 1. Controlled-release urea (CRU) and regular urea (RU) rates and ap-plication timings tested with banana, Guangxi, China.
TreatmentN rate, kg/ha Timing of application
Total CRU RU Basal Side-dressingsNo N (CK) 670 670 670 0 0RU (5)1 673 670 673 1 5CRU (1) 673 673 670 1 1CRU (2) 673 673 670 1 2CRU+RU (80:20) (1) 673 538 135 1 1CRU+RU (80:20) (2) 673 538 135 1 2CRU @ 80% N rate (1) 538 538 670 1 1CRU @ 70% N rate (1) 471 471 670 1 1CRU+RU (60:40) @ 80% N rate (1) 538 323 215 1 11Figures in the brackets refer to the number of side-dressings.Rates for P and K were 176 kg P2O5/ha (as fused Ca-Mg phosphate) and 878 kg K2O/ha (as potassium chloride), which were split three times between basal, flower bud initiation, and the fruit swelling stages.
Table 2. Effects of different controlled-release urea (CRU) and regular urea (RU) combina-tions on banana yields in 2013 to 2015, Guangxi, China.
Treatment
- - - - 2013 - - - - - - - - 2014 - - - - - - - - 2015 - - - -Yield, t/ha
±% vs. RU
Yield, t/ha
±% vs. RU
Yield, t/ha
±% vs. RU
No N (CK) 16.2 c2ll -48 24.5 cl l -36 18.9 dl l -61RU (5)1 31.0 ab - 38.4 bl l - 48.1 bl l -CRU (1) 33.2 all -4ll7.0 40.9 al l -3lll6.6 50.5 ab -l65.0CRU (2) 34.0 all -4ll9.8 41.0 al l -3lll6.8 52.1 al l -l68.2CRU+RU (80:20) (1) 30.6 bll ll4-1.4 39.1 ab -3lll1.9 48.7 bl l -l61.2CRU+RU (80:20) (2) 30.8 bll 4ll-0.7 39.4 ab -3lll2.8 50.6 ab -l65.1CRU @ 80% N rate (1) 31.3 ab -4ll0.9 38.7 bl l -3lll1.0 47.7 bl l -ll-0.8CRU @ 70% N rate (1) 30.8 bll 4ll-0.9 38.2 bl l -llll-0.5 45.5 clll -ll-5.4
CRU+RU (60:40) @ 80% N rate (1) 30.3 bll 4ll-2.3 39.3 ab -3lll2.4 48.5 bl l -l60.81Figures in the brackets refer to the number of side-dressings.2Values in each column followed by different letters are statistically different at p=0.05.

Better C
rops/Vol. 100 (2016, No. 4)
21
N losses via ammonium volatilization by 51 to 71% in winter wheat (Lu and Song, 2011) and by 51 to 91% in summer maize (Zhao et al., 2009). In rice, N loss reductions of 24 to 27% through runoff were measured in paddy fi elds by Ji et al. (2007), and Xie et al. (2016) found 28 to 55% less N
2O
emissions in maize. In this study, agronomic effi ciency (AE)
from CRU, used alone, at a reduced rate, or in combination with RU, was higher than with RU alone (Table 4). The CRU options providing reduced N rates had the highest AE values for three consecutive years, which were followed by the two CRU treatments providing the full N rate.
SummaryControlled-release urea signifi cantly
reduced the number of fertilizer N applications from a 6-split strategy with regular urea to a less demanding and less costly 2 to 3 splits with CRU. Banana yields with CRU were gener-ally 5 to 10% higher compared to RU. The higher yields were attributed to improved fi nger number per plant and fi nger weight. The full CRU-N rates proved best, followed by CRU applied at a reduced (80%) N rate. However, reduced N rate options could only maintain two to three years of high yield production given the site’s soil fertility status. Agronomic ef-fi ciency of N was the highest for both reduced rate (70% and 80%) CRU options, followed by either CRU treatment applied at the full N rate. CRU alone achieved the best returns, but CRU applied in blends with urea, or in reduced rates, were all feasible practices. BCBC
Acknowledgement The authors would like to acknowledge the support from
Agrium Inc. Mention of trade names or commercial products in this article is solely for the purpose of providing specifi c information and does not imply recommendation or endorse-ment by the International Plant Nutrition Institute (IPNI).
Prof. Tan (E-mail: [email protected]) is with the Sugarcane Institute, Guangxi Academy of Agricultural Sciences, Prof. Zhou, Ms. Zeng, Ms. Ou, Mr. Huang, and Ms. Zhu work in the Institute of Agricultural Resources and Environment, Guangxi Academy of Agricultural Sciences, Nanning, Guangxi, China. Dr. Shihua Tu is Deputy Director, IPNI Southwest Program, Chengdu, Sichuan, China.
ReferencesGeng, J.B., Y.B. Sun, M. Zhang, C.L. Li, Y.C. Yang, Z.G. Liu, and S.L. Li. 2015.
Field Crops Res. 184:65-73.Haderlein, L., T.L. Jensen, R.E. Dowbenko, and A.D. Blaylock. 2001. The Sci.
World 1(S2):114-121.Hu, W., Y. Zhang, G.Z. Hu, Q.J. Li, and M.Y. Tang. 2011. Cotton Sci. 23:253-258.Ji, H.H., S.X. Zheng, Y.H. Lu, and Y.L. Liao. 2007. Chinese J. Applied Ecol.
18:1432-1440.Lu, Y.Y. and F.P. Song. 2011. Acta Ecol. 31:7133-7140.MOA. 2013. China Ag. pp. 225-227.Wang, Y.J., Q.Z. Sun, J.S. Yang, K.J. Wang, S.T. Dong, C.P. Yuan, and L.C.
Wang. 2011. Acta Agron. 37:2233-2240.Xie, Y., X.M. Rong, Y.P. Zhang, X. He, D.J. Shi, and Q. Liu. 2016. J. Agro-Envir.
Sci. 35:596-603. Yang, C.L., L. Yuan, Y.C. Li, X.Q. Liang, L.H. Wu, and H.K. Chen. 2013. Chinese
J. Soil Sci.44:184-190.Zhao, B., S.T. Dong, K.J. Wang, J.W. Zhang, and P. Liu. 2009. Chinese J. Applied
Ecol. 20:2678-2684.
Table 4. Agronomic efficiency (AE) of nitrogen as affected by combinations of controlled-release urea (CRU) and regular urea (RU), Guangxi, China.
Treatment
AE2 in 2013 AE in 2014 AE in 2015kg/kg ±% vs RU kg/kg ±% vs RU kg/kg ±% vs RU
RU (5)1 22.0 - 21.1 - 43.4 -CRU (1) 25.3 15 24.9 18 47.0 llllll8.2CRU (2) 26.5 20 25.0 18 49.3 14CRU+RU (80:20) (1) 21.4 lllll-3.6 22.2 lllll 5.1 44.2 lllll 2.0CRU+RU (80:20) (2) 21.7 lllll-1.3 22.7 lllll 8.5 47.0 lllll 8.4CRU @ 80% N rate (2) 28.1 28 27.1 28 53.5 23CRU @ 70% N rate (1) 30.9 40 29.7 41 56.5 30CRU+RU (60:40) @ 80% N rate (1) 26.2 19 28.1 33 55.0 271Figures in the brackets refer to the number of side-dressings.2Agronomic efficiency = kg grain yield increase/kg applied N.
New Rapid e-Renewal Systemfor Subscribers of Better Crops
Good news! It now only takes two minutes to reconnect with us and renew your subscription to Better Crops.
If you haven’t renewed your subscription for a while, we invite you to take a moment to visit http://www.ipni.net/subscribe. Here you can up-date all your information and make the selection to continue to receive Better Crops. Your subscription is highly valued and as always, its free!
Thank you for your continued interest in Bet-ter Crops.

22
Bet
ter
Cro
ps/V
ol. 1
00 (
2016
, No.
4)
Abbreviations and notes: N = nitrogen; P = phosphorus; K = potassium; Ca = calcium; AN = ammonium nitrate; CaCO3 = calcium carbonate. IPNI Project TUN-1
TUNISIA
Tunisia is one of the most important olive-growing countries of the southern Mediterranean region. Despite the crop’s
importance, the main constraints facing Tunisian olive production are low productivity, aging trees, and inadequate nutrient management. The nutritional defi cit in these orchards has resulted in crop losses, low fruit quality, and in severe cases, the death of trees. Generally, fertilization is done without any previous knowledge of the nutritional status of the trees or the soil nutrient balance. Excessively negative, or positive, nutri-ent balances are hampering the sustainability of olive crop productivity and orchard soil fertility in Tunisia.
Nutrient application should meet, and not exceed, the seasonal demands of the orchard. It is important to understand the nutritional status of olive trees and their real nutrient demand to get fertilizer application right. In rainfed orchards, farmers often limit their application of fertilizers because of the risks of low rainfall, the high cost of fertilizers, and a general lack of knowledge concerning the importance of adequate fertil-ization.
On-farm experiments were conducted during 2014 and 2015 in three rainfed orchards located in the north-western province of Teboursouk. The olive orchards were 40 to 60 years old, which represents the average for the region. The average fruit yield was low (1,000 kg/ha) in 2014 and was considered an “off” year. In 2015, an “on” year, yield exceeded 2,800 kg/ha. Besides wanting to highlight the NPK balance and the role that best nutrient management practices can play, researchers also wanted to determine if nutrient management can help to reduce the yield swings that result from olive’s typical alternating (on/off) fruit-bearing years.
For foliar diagnosis, leaf samples were collected from each experimental site in July for both years. In each farm, two bulk leaf samples were collected, each leaf sample comprised of 150 healthy, fully expanded mature leaves collected from the middle portion of non-bearing current season shoots. Leaves were analyzed for N, P, and K. The olive orchards were fertilized by one broadcast application of 3 to 4 kg AN/tree in Febru-ary (common farm practice) in both years of experimentation, except for farm 3 where 30 kg cattle manure/tree was applied (Table 1).
The soil was clay loam texture, characterized by 46 to 57% total CaCO
3, 0.9 to 1.7% organic matter, and pH (water) of 8.1
to 8.7. Soil available K (ammonium acetate extractable) varied between 230 and 294 ppm, available Ca between 8,650 and 9,670 ppm, and available P (Olsen) varied between 46 and 85 ppm (Table 2). There was no signifi cant difference between surface (0 to 30 cm) and sub-surface (30 to 60 cm) sampling for all the analyzed parameters.
The olive tree tolerates a wide range of soil pH, but a neu-tral to slightly alkaline (7 to 8.5) pH is most suitable. Organic matter and CaCO
3 content of the soils were adequate for proper
growth of trees. Olive trees need at least 1% soil organic matter (Soyergin et al., 2002) and can tolerate a wide range of lime content in the soil up to very high values of 76% (FAO, 2006).
The available P contents in the soil of the three farms showed moderate variation. The minimum value was 38 ppm, above the critical level of 8 ppm proposed by Gargouri and Mhiri (2002). The soil available K was moderate considering the soil texture (clay loam soil). Based on the soil analysis, soils of the on-farm experimental sites were suited for olive tree cultivation.
Foliar AnalysisFoliar analysis showed that 50% and 67% of olive orchards
were defi cient in N in the 2014 “off” year and 2015 “on” year, respectively. A generally inadequate approach to N fertiliza-tion was considered the root cause of this N defi ciency. The common practice of using a single application of ammonium
By Ajmi Larbi, Mahdi Fendri, Hakim Boulal, Mohamed El Gharous, and Monji Msallem
Diagnosis of the Nutritional Status of Rainfed Olive Orchards
Foliar analysis is used to confi rm the nutritional constraints in rainfed olive yields in Tunisia that are caused by inadequate and improper nutrient management.
Table 1. Description of on-farm experimental olive sites in northern Tunisia.
FarmArea, ha
Tree age, yr.
Planting density, tree/ha 2014 2015
Nutrient input1, kg/tree
1 20 62 100 17.0 35 32 24 40 100 16.0 28 3-43 200.5 55 100 10.5 39 301 Common farm practice of applying 3 to 4 kg ammonium nitrate/tree in February. Farm 3 received 30 kg cattle manure/tree.Cumulative rainfalls were 545 mm in 2014 and 533 mm in 2015. Olive tree density was 100 trees/ha (10 x 10 m spacing) planted with Chétoui and Jarboui varieties.
Yield, kg/tree
Table 2. Soil analysis of the three on-farm olive orchards sites in Teboursouk, Tunisia.
FarmDepth,
cmOrganic
matter, %Total
CaCO3, % pHAvailable K, ppm
Available Ca, ppm
Available P, ppm
10-30 1.7 48 8.5 231 9,670 4630-60 1.7 46 8.5 208 9,250 38
20-30 1.0 56 8.7 295 8,970 8730-60 0.9 53 8.5 262 8,130 75
30-30 0.9 47 8.1 290 8,650 8530-60 0.9 47 8.3 271 9,340 87

Better C
rops/Vol. 100 (2016, No. 4)
23
nitrate each year leaves the fertilizer highly susceptible to loss, largely through leaching away from the root zone. The higher yield (over 30 kg/tree) observed in 2015 increased the extent of N defi ciency, due to higher N uptake by the trees and the absence of any split application of N (Table 3).
For P, no defi ciency was observed in 2014. However, leaf P concentra-tions decreased during 2015 below the published critical value of 0.1%. The low P concentration in 2015 can be attributed to high yielding trees, a corresponding high extraction of P by fruits, and also to the calcareous nature of these orchard soils that regularly precipitate P (Hidalgo et al., 2011). The conventional soil application of P is usually not very effi cient (Ferreira et al., 1986) and foliar application remains the best alternative to correct P defi ciency.
Similar to P, leaf K concentration also decreased in 2015. Although this is mainly due to the high fruit yield in 2015, the fall in leaf K concentration can be explained by redistribution of K from the leaves to the fruit during the period be-tween July until December/January (harvest period). Furthermore, the high content of CaCO
3 and the soil
texture (22 to 30% of clay) with high adsorptive power can affect soil K availability for olive trees (Hidalgo et al., 2011).
According to the threshold val-ues in Table 3, three cases of N de-fi ciency, zero cases of P defi ciency, and two cases of K defi ciency were found from the six samples taken during 2014. However, 2015 found
Table 3. Foliar N, P, and K analysis of olive tree varieties growing at three olive farms in Teboursouk, Tunisia.
- - - - Farm 1 - - - - - - - - Farm 2 - - - - - - - - Farm 3 - - - - - - - - Average - - - -
Nutrient YearThreshold values2, % Chétoui Jerboui Chétoui Jerboui Chétoui Jerboui Chétoui Jerboui
- - - - - - - - - - - - - - - - - - - - - - - - - - - - - - - - - - - - - - - - - % - - - - - - - - - - - - - - - - - - - - - - - - - - - - - - - - - - - - - - - -
N20141
1.5 to 21.67 a3 1.41 a 1.45 b 1.59 a 1.70 a 1.37 a 1.61 a 1.46 a
2015 1.37 b 1.40 a 1.77 a 1.37 b 1.59 b 1.42 a 1.58 b 1.40 b
P2014
0.1 to 0.30.10 a 0.13 a 0.11 a 0.13 a 0.11 a 0.13 a 0.11 a 0.13 a
2015 0.11 a 0.09 b 0.08 b 0.09 b 0.08 b 0.09 b 0.09 b 0.09 b
K2014
0.8 to 10.91 a 0.76 a 0.92 a 0.99 a 1.04 a 0.77 a 0.96 a 0.84 a
2015 0.66 b 0.58 b 0.49 b 0.61 b 0.38 b 0.54 b 0.51 b 0.58 b12014 = “off” fruit-bearing year while 2015 = “on” fruit-bearing year.2Pastor et al. (2005)3For each nutrient, values followed by different letters in the same column differ significantly at p < 0.05.
On-farm experimental sites (denoted by red points) within the province of Teboursouk in northwest Tunisia.

24
Bet
ter
Cro
ps/V
ol. 1
00 (
2016
, No.
4)
four cases of N defi ciency, fi ve cases of P de-fi ciency, and six cases of K defi ciency.
In January 2016, a foliar diagnosis was done for subplots planted to the Chétoui variety (Table 4). Results showed moderate N defi ciency and severe P and K defi ciency as the range of leaf nutrient concentrations decreased from the July 2015 values. These foliar analyses confi rmed the nutrient defi cien-cies observed.
SummaryIn rainfed areas of Tunisia, low fertilizer
use by olive farmers, mainly during the high fruit-bearing year, contributes to severe N, P, and K defi ciency. The use of foliar P and K fertilization remains essential to overcome constraints related to P precipitation in highly calcareous soil or poor fertilizer solubilization under rain water scarcity. BCBC
AcknowledgmentsThis study was supported by International
Plant Nutrition Institute.
Dr. Larbi is a Senior Researcher at Olive Tree Insti-tute of Tunisia and Head of Laboratory of Improve-ment and Protection of Genetic Resources of Olive Trees; E-mail: [email protected]. Dr. Fendri is a Researcher at Olive Tree Institute of Tunisia. Dr. Boulal is a Deputy Director, IPNI North Africa Program; E-mail: [email protected]. Dr. El Gharous is a Consulting Director, IPNI, North Africa Pro-gram: E-mail: [email protected]. Dr. Msallem is Professor at the Olive Tree Institute of Tunisia; E-mail: [email protected].
ReferencesFAO, 2006. Guidelines for soil description. 4th Ed. FAO,
Rome. Italy.Ferreira, J., A. Gracia-Ortiz, L. Frias, and A. Fernandez.
1986. Olea. 17:141-152. Gargouri, K. and A. Mhiri. 2002. Options méditerranéennes.
Series A50:199-204.Hidalgo, J., J.C. Hidalgo, and M. Pastor. 2011. In, Ad Oleum
Habendum. Ed: GEA Westfalia Seprator SA, Spain. Spanish. pp. 35-45.
Pastor, M., V. Vega, J.C. Hidalgo, and J.N. Carricondo. 2005. In, Cultivo del Olivo con riego localizado. Eds: Junta de Anadlucia and Ediciones Mundi Prensa. Spain. Spanish. pp. 515-545.
Soyergin, S., I. Moltay, C. Genc, A.E. Fidan, and A.R. Sutcu. 2002. Acta Hortic. 586:375-379.
Table 4. Nitrogen, P, and K leaf concentration range (% dry matter, var. Chétoui) in three olive farms, January 2016, Teboursouk, Tunisia.
Nutrient, % July 2015 Jan 2016
N 1.37 to 1.77 1.26 to 1.31P 0.08 to 0.11 0.04 to 0.06K 0.38 to 0.66 0.34 to 0.38
Symptoms of N (top), P (middle) and K (bottom) deficiency in rainfed olive orchards, Teboursouk, Tunisia.

Better C
rops/Vol. 100 (2016, No. 4)
25
Abbreviations and notes: N = nitrogen; P = phosphorus; K = potassium; Ca = calcium; Mg = magnesium; B = boron; Fe = iron; Mn = manganese. IPNI Project USA-UT8
Most of us know that human health and disease preven-tion is directly tied to nutrition. Scurvy, for example, is a disease resulting from a lack of vitamin C that
causes gum disease and other ailments. Humans can elimi-nate scurvy by consuming vitamin C in their diets. Plants are also dependent on nutrition for growth and disease reduction. Unlike humans, plants primarily obtain their nutrients from a small area of soil surrounding their roots. Proper nutrition clearly improves plant health, but not all plant diseases are cured by nutrition. However optimal plant nutrition can help reduce the US$5 billion lost annually to crop diseases in the world. Balanced plant nutrition is an effective and affordable way to minimize or prevent plant disease.
All plants are dependent on mineral nutrients for their growth and overall health and quality. Fourteen mineral nutrients are considered essential, with N, P, and K being considered primary, due to the quantity found within the plant and the large amount needed for proper plant growth. A number of other nutrients (e.g., Ca, Mg, Mn, Fe, B, etc.) also infl uence plant growth and disease interactions. The relationships and mechanisms by which plant nutrients and diseases interact are varied and complex. A particular disease might inhibit the plant’s ability to absorb an essential nutrient, while the absorption of a particular nutrient might allow the plant to escape the effects of a particular disease.
Proper plant nutrition is essential to resisting disease. If an otherwise healthy plant is defi cient in any of the nutri-ents required for proper growth, its susceptibility to disease increases. Proper plant nutrition can inhibit the pathogen’s ability to infect the plant. One of the advantages to reducing disease with nutrients is that—to a certain degree—growers can control the supply of nutrients available and their timing to the plant. This topic is complex and readers are urged to consult the references at the end of this article for more infor-mation on specifi c crops and nutrients.
Due to their importance and quantity needed, N, P, and K are often the fi rst nutrients to be depleted in the soil and are regularly supplemented through fertilizer applications. These three nutrients play a key role in plant development and health. Nutrient-defi cient plants are less likely to tolerate stress and are more susceptible to disease; likewise, plants grown with an excessive supply of these elements may be subject to in-creased disease and to lower plant quality and development (Univ. California, 1992).
Nitrogen is essential for the production of amino acids, proteins, enzymes, hormones, phytoalexins (antibiotics), and
other cellular components, as well serving an essential role in photosynthesis and growth. Phosphorus within a plant is primarily used for energy transfer and protein metabolism. Potassium, unlike N and P, does not become part of any plant material, but remains unattached as a regulator of plant growth through activation of at least 60 different enzymes in meriste-matic tissues, among other essential roles.
Plant Nutrition and VerticilliumVerticillium is a destructive soil-borne fungal disease
infl uenced by mineral nutrition. The fungus enters plant roots and begins to clog the vascular system, resulting in the characteristic wilt associated with the disease. There are very few chemical treatments available to eliminate Verticillium, so agronomic and fi eld cultural practices are very important. Soil fertility and mineral nutrition affect Verticillium virulence by reducing the inoculum density of spores in the soil and by infl uencing the host plant’s resistance to the pathogen.
By Brad Geary and Doug Jacobson
The Interaction Between Plant Nutrition and Disease: Focus on Verticillium
Jack
Kel
ly Cl
ark
Uni
v. of
Cal
iforn
ia
A review of the infl uence plant nutrition can have on plant disease susceptibility using the soil-borne fungal disease Verticillium as a case study example.
Vascular discoloration in cotton stem resulting from Verticillium infection.

26
Bet
ter
Cro
ps/V
ol. 1
00 (
2016
, No.
4)
Verticillium wilt affects over 300 host plants in many plant families. Verticillium wilt on lettuce is a serious problem that has resulted in complete crop failure in some areas. Peppers, tomatoes, and potatoes are well known examples of vegetables that can be severely damaged by Verticillium. Unfortunately, populations of Verticillium remain in the soil for several years, limiting when lettuce, or other crops, can be planted again. Control options are limited to fumigation or switching to crops that are not Verticillium hosts. Recent research has shown that Verticillium damage can be greatly reduced with the proper balance of mineral nutrients within the susceptible plants.
A number of studies have found that N management can decrease Verticillium wilt severity in many crops, including lettuce, cotton, eggplant, olive, and potato. Plants primarily take up N as ammonium (NH
4+) and nitrate (NO
3-). Verticil-
lium wilt generally decreases when N is supplied as NH4
+, rather than in the NO
3- form, which has shown an increase in
disease severity of Verticillium wilt in eggplants (Elmer, 2000). Although the exact mechanisms by which NH
4+ decreases Ver-
ticillium wilt is unknown, it is postulated that the acidifi cation of the rhizosphere due to the extrusion of H+ ions to balance the charge created by NH
4+ uptake has a detrimental effect
on the pathogen. Evidence supporting H+ ions infl uence on Verticillium comes from a study where lettuce was grown under low pH conditions, high H+ ions, and Verticillium wilt was not as severe (Subbarao, 2012).
An adequate Mn supply has been shown to decrease the severity of Verticillium wilt and other plant diseases. Plant tissues low in Mn are more susceptible to fungal diseases such as Verticillium, while tissues with adequate Mn concentrations successfully resist many fungal infections. Manganese avail-ability works in tandem with the form of N present and soil acidity to decrease Verticillium severity. Higher Mn uptake is generally found in low pH soils, where more of the N may also be N present in the NH
4+ form due to slower nitrifi cation.
Phosphorus defi ciency in soils severely limits plant yield, but research on P and Verticillium indicates that it does not have as great an infl uence as other nutrients. In preliminary studies, an increase in P fertilization of cotton, independent of other nutrients, resulted in an increase in Verticillium se-verity. Clearly, reducing P inputs may a cause P defi ciency in plants, limit plant growth, and allow disease to take advantage of a weakened plant, but excessive soil P concentrations may encourage diseases like Verticillium. It is important to analyze soil and plant tissues to maintain optimal P concentrations and maintain good plant health.
Potassium uptake is typically greater than for any other nutrient. It is now commonly accepted that ensuring an ad-equate K supply generally decreases many plant diseases. This is true for Verticillium, where increased K fertilization corresponds to a decrease in wilt severity. For example, when cotton is heavily infested with Verticillium, an associated defi ciency of K is commonly found. Pistachio and potato also show decreases in Verticillium severity with increased rates of K fertilization. This relationship between K and plant disease should be used to encourage proper plant nutrition and not excessive K fertilization rates.
Despite the complex relationships between plant nutrition and plant disease, proper nutrition is an essential component to disease resistance. Clearly there are no guaranteed solutions
Cliff
Sny
der/
IPN
I Pho
to
Symptoms of Verticillium wilt infection in sunflower (top), potato (middle) and cotton (bottom) plants.
Brad
Gea
ry, B
righa
m Y
oung
Uni
v.H
owar
d F.
Schw
artz
, Col
orad
o St
ate
Uni
v.,

Better C
rops/Vol. 100 (2016, No. 4)
27
concerning disease mitigation through plant nutrition, but proper nutrition is one certain way that growers can combat plant disease. Keep in mind that too much of any nutrient can be detrimental to plant growth and that balanced nutrition is essential for optimal crop growth and development. BCBC
Dr. Geary is a Professor in the Plant and Wildlife Sciences Dept., Brigham Young University, Provo, Utah; E-mail: [email protected]. Mr. Jacobson is a Graduate Student at the Plant and Wildlife Sciences Dept., Brigham Young University.
ReferencesUniv. California. 1992. Integrated Pest Management for Cole Crops and Lettuce.
Statewide Integrated Pest Mangagement Project. Publication 3307, 112 pp.Elmer, W.H. 2000. Plant Disease. 84:1231-1234.Subbarao K.V. 2012. Biology and Epidemiology of Verticillium Wilt of Lettuce.
Salinas:, California Leafy Greens Research Program. Calgreen.org
Further Reading Datnoff, L.E., W.H. Elmer, and D.M. Huber (eds.). 2007. Mineral Nutrition and
Plant Disease. Amer. Phytopath Soc., St. Paul, Minnesota, USA. Dordas, C. 2008. Agron. Sust. Develop. 28:33-46.
IPNI Appoints Potassium Program DirectorThe International Plant Nutrition Institute (IPNI) has ap-
pointed Dr. T. Scott Murrell as Director of its new Potassium Program.
For the past 20 years, Dr. Murrell has worked for IPNI (2007 to present) and its predecessor the Potash & Phosphate Institute (PPI; 1996 to 2007) as IPNI Director of the North America Program and PPI Regional Director of the Northcen-tral U.S. Program, respectively. Most recently, Dr. Murrell’s focus within the IPNI North American Program has been on the improvement of nutrient management within corn-soybean cropping systems, data management for soil testing and crop nutrient uptake, and soil potassium assessment. Dr. Murrell will continue his work with data management as that is an inte-gral component of potassium plant nutrition and management.
“All IPNI scientists’ activities include agronomic programs that address potassium, nitrogen, phosphorus, and other plant nutrients as part of the Institute’s regional and global tactical plans,” explained IPNI President Dr. Terry L. Roberts. “Our addition of a Potassium Program Director completes our team of Directors that will have primary and global focus on each of the major nutrients.” BCBC
Crop Nutrient Deficiency Photo Contest Entries Due December 6, 2016 There is still time to beat the deadline for submitting entries to the annual IPNI
photo contest for plant nutrient defi ciencies. Our list of prizes is as follows:• US$250 First Prize for best overall photo• US$150 First Prize Awards and US$100 Second Prize Awards within each of
the four plant nutrient categories (Nitrogen, Phosphorus, Potassium, and Other Nutrients).
• In addition, the grand prize winners and fi rst place winners will receive the most recent copy of our USB image collection. For details on the collection, please see http://ipni.info/NUTRIENTIMAGECOLLECTION
Entries can only be submitted electronically to the contest website: www.ipni.net/photocontest.
Winners will be notifi ed and announced in early 2017. Look for results posted on ipni.net. BCBC
Dr. T. Scott Murrell, Director of the IPNI Potassium Program.
Phot
o by
Har
i Gow
them
G.
Calcium deficiency in wheat.

28
Bet
ter
Cro
ps/V
ol. 1
00 (
2016
, No.
4)
Abbreviations and notes: N = nitrogen; P = phosphorus; K = potassium; S = sulfur; Ca = calcium; Mg = magnesium; Al = aluminum; H+ = hydrogen ion; BMP = best management practice; US$1 = R$3.2 (Brazilian Real).
BRAZIL
Brazil’s livestock-related agriculture currently occupies 25% of the country’s total area of 851 million (M) ha. Agriculture for livestock is the largest land use type
compared to other uses including: federal lands (18%), con-servation units (15%), forests and natural vegetation (13%), Indian reservations (13%), other purposes (15%), and cities and infrastructure (0.2%). About one quarter of the area oc-cupied by livestock agriculture is used to grow crops; however, the remaining land (about 180 M ha) grows forage grasses mainly for grazing (IBGE, 2015).
Forage production systems in Brazil are very diverse with 45% growing native vegetation and 55% cultivated forages. Half of Brazil’s pastures are considered to be degraded to some degree. The main causes of pasture degradation are related to adverse soil conditions (low fertility, acidity, and compaction), selecting the wrong plant species (variety adaptation or low tolerance to soil/climate conditions), and inadequate pasture management (weed competition, low seed germination, wrong seeding rate, etc.). Despite this, these pastures support the world’s largest (212 M head) commercial cattle herd (IBGE, 2015), which makes Brazil the second largest beef producer and exporter in the world.
Most of Brazil’s tropical soils are weathered with low nutri-ent availability (especially P), medium to high acidity (H+ and
Al3+), and low organic matter content. Therefore, and because of the amount of land devoted to grain production, the country is the world’s fourth largest fertilizer consumer with about 32 M t of fertilizer products used in 2015. But according to the National Fertilizer Association (ANDA, 2015), only 1.5% of that amount is designated to pasture land, while soybeans, maize, sugarcane, coffee, and cotton consume 91% of the total.
Brazil’s average stocking rate is about 1 head per ha. In terms of actual land use, this is a very ineffi cient livestock system that can be improved by BMPs including soil amelio-ration (correcting acidity and increasing nutrient availability) and better grazing methods.
Why don’t livestock farmers apply fertilizer to their fi elds? Cunha (2013) lists the following four reasons: 1) tropical grass-es have a low nutrient requirement, 2) famers rarely associate low biomass production with low soil fertility and don’t usually perceive a return from fertilizer, 3) livestock systems have poor grazing effi ciency, and 4) technical assistance is scarce.
RecommendationsMultiple species of Brachiaria grass dominate the great
majority of forages used in Brazilian pastures. Some of these grasses are commonly known to be tolerant to soil acidity and to have a relatively low nutrient requirement. Despite such characteristics, Brachiaria grasses do respond positively to liming and fertilizer application, as demonstrated by several studies.
Figure 1 shows dry matter yield of Brachiaria decumbens
By Eros Francisco
Increasing Beef Production with Improved Soil Nutrient Use: Brazil’s Challenge
E. F
ranc
isco/
IPN
I Pho
tos
Pasture for grazing is the major land use in Brazil, but the country’s livestock systems are generally very ineffi cient.
Brazil has great potential to increase its beef production, but farmers will need to follow results from agronomic research and adopt recommended technologies.
Liming, fertilizer use, and other techniques are useful best management practices to change this current reality.
Livestock farming systems examples in Brazil with low (left) and high (right) technology adoption.

Better C
rops/Vol. 100 (2016, No. 4)
29
in response to liming and levels of nutrient application. Liming reduces Al3+ toxicity, provides Ca2+ and Mg2+, and increases nutrient use effi ciency for subsequent fertilizer applications. According to Vilela et al. (2004), liming recommendations for pastures in the Cerrado region, based on soil base saturation (BS), vary according to species tolerance to soil acidity or low soil fertility: 35% BS for highly tolerant grasses (i.e., Brachiaria decumbens, Brachiaria humidicola, and Andropogon gayanus), 45% BS for moderately tolerant grasses (i.e., Brachiaria bri-zantha cv. Marandu, Panicum maximum cv. Vencedor, and Setaria anceps), and 55% BS for less tolerant grasses (i.e., Panicum maximum cv. Tanzânia, Panicum maximum cv. Mombaça, Pennisetum purpureum, Cynodon spp). The authors also recommend that when the level of Mg is below 0.5 cmol
c/
kg, a dolomitic type of lime should be used.Another practice that may be adopted to mitigate subsoil
acidity is phosphogypsum application. Phosphogypsum is com-monly recommended at 50 kg/ha for each percent clay in the soil. Phosphogypsum will reduce the level of Al3+ saturation in the subsoil and provide plant with S in the form of sulfate (SO
42-). Table 1 presents two years of results with Brachiaria
brizantha cv. Marandu in response to phosphogypsum ap-plication.
Recommendations for P and K fertilizer rates in Brazil’s pastures are based on the nutrient requirement of the grass plus a soil analysis (Table 2). In soils low in P, the response to P applica-tion may exceed the effect of other nutrients. In some Cerrado soils, P fi xation is extreme and creates strong competition between the soil and plant. As a result, liming is a BMP to increase soil P availability and promote its efficient use by plants. As pastures are perennial crops, P application and incorpora-tion is recommended prior to seeding. Phosphorus applica-tion is necessary to achieve high dry matter yields in intensifi ed livestock systems (Table 3).
Tropical grasses take up high amounts of K, which is
Figure 1. Dry matter yield of Brachiaria decumbens in response to liming and nutrient application. Adapted by Barcelos et al. (2011).
0
1
2
3
4
5
6
7
0 0.15 0.5 1 2
Dry
mat
ter
yiel
d, t
/ha
Liming equivalent (times)
High nutrient input
Low nutrient input
No nutrient input
Table 3. Dry matter yield of Brachiaria decumbens in response to N and P rates.
P2O5 rate, kg/ha - - - - - - - - - - - - - N rate, kg/ha - - - - - - - - - - - - -
0 75 150 300
0 3.4 - - -
60 3.4 8.1 10 12
120 3.6 8.3 12 15
Source: Lupatini et al. (2010).
Table 1. Dry matter yield of Brachiaria brizantha cv. Marandu in response to phosphogypsum application.
Phosphogypsum rate, kg/haDry matter yield, t/ha
Year 1 Year 2
1,200 3.4 5.8
1,200 4.2 8.7
1,500 4.5 9.7
Source: Souza et al. (2011).
Table 2. Phosphorus and potassium recommendations for the establishment and maintenance of pastures in the Cerrado, based on soil analysis and nutrient demand of plants or level of technology adoption.
Level of nutrient demand or technology adoption
- - - - - - - - - - - - - - - - Soil P1 - - - - - - - - - - - - - - - - - - - - - - - - - - Soil K - - - - - - - - - -Very low Low Medium Optimum Low Medium Optimum- - - - - - - - - - - - - - P2O5, kg/ha2 - - - - - - - - - - - - - - - - - - - - - - K2O, kg/ha - - - - - - - -
Establishment3
Low (<1 AU5/ha) 40-120 30-90 20-60 0 20 0 0Medium (1-3 AU/ha) 70-180 55-135 35-90 0 40 20 0
High (3-7 AU/ha) 80-240 50-150 40-120 0 60 30 0
Maintenance4
Low (<1 AU/ha) - 15-40 0 0 140 100 0
Medium (1-3 AU/ha) - 20-50 15-30 0 100 140 0
High (3-7 AU/ha) - 30-60 15-40 0 200 100 01Interpretation of P-Mehlich availability depends on soil clay content.2Rates of P2O5 varies according to soil clay content in direct relation.3Soluble sources of P are recommended in furrow or broadcast plus incorporation. Potassium application can be broadcasted.4Single broadcast application in the beginning of rainy season for P and K (<40 kg K2O/ha). Split broadcast ap-plications with 30 day intervals for K2O rates >40 kg K2O/ha.5Animal unit: 454 kg cow.Source: Vilela et al. (2004) and Cantarutti et al. (1999).

30
Bet
ter
Cro
ps/V
ol. 1
00 (
2016
, No.
4)
an important nutrient to control evapotranspiration and sus-tain the high photosynthetic performance of C4 plant types. In soils low in K, plants struggle to accumulate biomass and the response to any N application is compromised (Figure 2).
Nitrogen is a key nutrient to promote biomass production and C4 plants grown in tropical environments are very respon-sive to N (Figure 3).
Rates recommended for N fertilizer will vary widely de-pending on soil conditions, plant demand, technology adoption by the farm, and irrigation. Vilela et al. (2004) recommended 50 kg N/ha, along with 30 kg S/ha for the establishment of pastures in the Cerrado. Cantarutti et al. (1999) recom-mended the same amount of N and S for livestock systems using moderate technology, but 100 to 150 kg N/ha in farms using higher technology. For the maintenance of pastures in the Cerrado, Vilela et al. (2004) recommended 100 to 150 kg N/ha for medium-tech farms and 200 kg N/ha in higher-tech farms. These higher N rates are recommended to be split into three applications of at least 50 kg N/ha during the beginning, middle, and end of the rainy season. The authors encourage the use of ammonium nitrate or ammonium sulfate to avoid
Examples of integration of livestock, cropping, and forestry to achieve better use of pasture lands. (Top to Bottom: Brachiaria grass planted with maize, forage grass planted after soybean, forage grass planted with trees).
Figure 2. Cumulative dry matter yield of Brachiaria decumbes in response to N and K rates. Source: Carvalho et al. (1991).
Figure 3. Dry matter yield of Panicum maximum in response to N rates. Source: Sarmento (2005).
0
2
4
6
8
10
12
14
16
18
20
0 100 200 300 400
Dry
mat
ter
yiel
d, t
/ha
Nitrogen rate, kg/ha
150 kg K2O/ha
75 kg K2O/ha
0 kg K2O/ha
0
1
2
3
4
5
6
7
8
0 50 100 150 200 250 300 350 400 450 500
Dry
mat
ter
yiel
d, t
/ha
Nitrogen rate, kg/ha
E. F
ranc
isco/
IPN
I Pho
tos

Better C
rops/Vol. 100 (2016, No. 4)
31
potential N losses due to volatilization. Urea may be used if soil and weather conditions are monitored to ensure adequate soil moisture, mild temperatures, and an application just prior to a rain when possible. For highly intensive livestock systems, N rates may also be adjusted according to other parameters (i.e., grazing effi ciency, level of farm management) as is sug-gested in Table 4.
Benefi tsDespite the low effi ciency of most of the livestock farming
systems in Brazil due to very low stocking rates, some farmers are showing impressive beef yields with the adoption of new techniques and technology (e.g., correctly managing grazing harvest, investing in improved animal genetics, and applying fertilizers to increase soil fertility to sustain high biomass production). Table 5 shows a successful farm in the state of Mato Grosso do Sul that achieved high beef productivity by signifi cantly increasing stocking rates compared to the state’s average, and other low-tech farms.
Regions of Brazil are also successfully integrating their livestock production with annual crop or tree production sys-tems. For example, Brachiaria can be established along with maize (second crop) in the Cerrado. The strategy results in a well-established forage grass soon after maize harvest. Similarly, grasses are grown as a second crop after soybean and are grazed for fi ve months before the next cropping season; or are grown along with tree species where annual crops are no longer in the system.
SummaryThere are many ways to im-
prove the effi ciency of livestock farming systems, including the use of fertilizers to correct soil nutrient defi ciencies. Brazil’s beef productivity will have to increase with time, which means pasture lands must be managed better. Livestock producers face the economic choice to either decide to stay in business, or concede to the increasing pressure to convert more land into grain production. Certainly, the use of nutrients associ-ated with best management practices is a profi table path for livestock producers. BCBC
Dr. Francisco is a Deputy Director of the IPNI Brazil Program based in Rondonópolis, Mato Grosso. E-mail: [email protected].
ReferencesAguiar, A.P.A. 2015. In: A.M. Torres Junior, F.P.W. Oliveria Filho, and M.Z.
Marzocchi (Eds.), Encontro dos Encontros da Scot Consultoria, 3. Ri-beirão Preto.
Associação Nacional para Difusão de Adubos (ANDA). 2015. Anuário estatístico do setor de fertilizantes. São Paulo.
Barcelos, A.F., J.A. Lima, J.P. Pereira, P.T.G. Guimarães, A.R. Evangelhista, and C.C.M. Gonçalves. 2011. Adubação de capins do gênero Brachiaria. Belo Horizonte: EPAMIG. 84p.
Cantarutti, R.B., C.E. Martins, M.M. Carvalho, D.M. Fonseca, M.L. Arruda, H. Vilela, and F.T.T. Oliveira. 1999. In: A.C. Ribeiro, P.T.G. Guimarães, and V. Alvarez. (Eds.). Recomendações para o uso de corretivos e fertilizantes em Minas Gerais. Viçosa. 359p.
Carvalho, M.M., C.E. Martins, R.S. Verneque, and C. Siqueira. 1991. Revista Brasileira de Ciência do Solo, v.15, n.2, p.195-200.
Cunha, J.F. 2013. In: A.M. Torres Junior, F.P.W. Oliveria Filho, and M.Z. Mar-zocchi. Encontro dos Encontros da Scot Consultoria, 1. Ribeirão Preto.
Instituto Brasileiro de Geografia e Estatística (IBGE). 2015. Levantamento Sistemático da Produção Agrícola. Rio de Janeiro. http://www.ibge.gov.br/home/estatistica/indicadores/agropecuaria/lspa/default.shtm
Lupatini, G.C., S.F. Medeiros, W.K. Yamamoto, and J.R. Ronchesel. 2010. In: Simpósio de Ciências da UNESP, 6. Dracena.
Martha Junior, G.B., L. Vilela, L.G. Barioni, D.M.G. Sousa, and A.O. Barcellos. 2004. In: Simpósio sobre manejo da pastagem, 21. Piraciacaba.
Sarmento, P. 2005. Respostas agronômicas e morfológicas de Panicum maximum, sob pastejo, à adubação nitrogenada. (Tese de Doutorado). Faculdade de Ciências Agrárias e Veterinárias, Universidade Estadual Paulista. Jabo-tibal. 92p.
Vilela, L., W.V. Soares, D.M.G. Sousa, and M.C.M. Macedo. 2004. In: D.M.G. Sousa and E. Lobato. (Eds.). Cerrado: correção do solo e adubação. Bra-sília. 416p.
Table 5. Comparison of livestock farming systems in the state of Mato Grosso do Sul, Brazil.
System1
DM yield, Stocking rate, ADG2, Beef yield, Total cost, Operating profit,t/ha/yr kg/ha heads/ha kg/day kg/ha/year R$/kg R$/ha/year
State unknown 3, 400 lllll1.30 0.35 lllllllll82.9 3.38 3, 216
Low-tech 34.3 3,380 0ll1.24 0.46 1,lll118.0 3.50 3,295
High-tech 38.1 3,720 10.7 0.62 1,287 3.22 3,5591Systems: State average, low input of technology, high input of technology (liming, fertilizer application, and irrigation).2Average daily gain of weight.Source: Adapted from Aguiar (2015).
Table 4. Nitrogen requirement considering the impact of faming management on N use efficiency (NUE) and grazing efficiency (GE).
Farming management
NUE, kg DM1/kg N
GE, %
N requirement, kg N/AU2
Very bad <30 <40 170Bad 30-35 40-45 130Medium 35-40 45-50 100Good 40-45 50-55 185Very good 45-50 55-60 170Excellent >50 >60 1601Dry matter yield.2Animal unit: 454 kg cow.Source: Martha Junior et al. (2004).

THE OVERLOOKED PLANT NUTRIENT?
International Plant Nutrition Institute3500 Parkway Lane, Suite 550
Peachtree Corners, Georgia 30092-2844www.ipni.net
It’s well understood that plants require the right combination of the 14 es-
sential mineral nutrients to sustain their growth. However, it frequently seems like just a few of the nutrients get most of the attention due to their cost or their environmental impacts. Potassium is too often overlooked as a key component in every successful farming operation.
The upcoming Frontiers of Potassium Science conference will take a close look at all aspects of potassium behavior in soils and plants, and how to improve potash fertilizer management.
Potassium is an essential mineral that is defi cient in most human diets. Since potassium is not stored in the body, it must be regularly replaced by eating potassium-rich foods. Farmers often fail to account for the nutritional value of the food they produce.
Potassium is also essential for plant health and there must be a continual supply in the soil to obtain desired yields. The emphasis on agricultural intensifi cation requires answers on how potassium management differs in diverse cropping systems and growing conditions.
When the potassium supply is limited, plants have reduced yields, poor quality, utilize water less effi ciently, and are more susceptible to pest and disease damage. However, accurately predicting which soils require ad-ditional potassium and how crops will respond to added fertilizer is not simple. The selection of a particular fertilizer and where to put it for maximum effi ciency is not always easy to determine. The extent of global potash resources needs to be regularly surveyed to ensure an uninterrupted supply.
Ultimately, the purpose of gathering the world-leading potassium scientists is not complete until theory gets transferred to the farmer. This conference serves as the kick-off for a comprehensive book, video presentations, regional agronomy meetings, and practical educational material that includes fi eld-ready advice.
A closer look at potassium in agriculture is certainly overdue. I hope you will join IPNI in taking a closer look at this neglected nutrient in the years to come.
Robert L. MikkelsenIPNI Vice President of Communications
& North American Program Director