bcg presentation
TRANSCRIPT
8/3/2019 Bcg Presentation
http://slidepdf.com/reader/full/bcg-presentation 1/34
PRESENTED BY :NETRA KAMAL BORAPARAG JYOTI SHARMASACHIN VAISHNAVTANMAY DATTA
8/3/2019 Bcg Presentation
http://slidepdf.com/reader/full/bcg-presentation 2/34
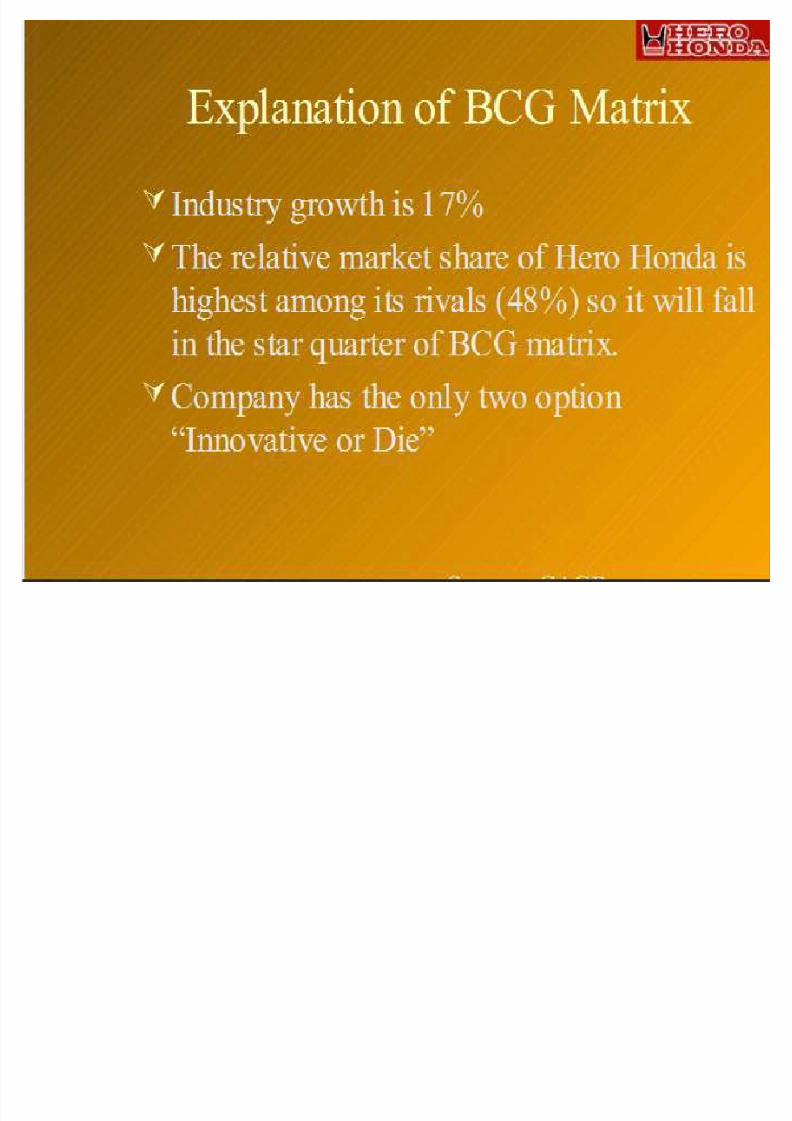
BOSTON CONSULTING GROUP (BCG) MATRIX is developed by BRUCE HENDERSON of the BOSTON CONSULTING
GROUP IN THE EARLY 1970¶s.
Accord ing to th is tech niqu e, busin esses orprod ucts are cla ssified a s low or h ighperformer s depe nd ing upo n the ir marketgrowth rate a nd relat ive market share.
8/3/2019 Bcg Presentation
http://slidepdf.com/reader/full/bcg-presentation 3/34

8/3/2019 Bcg Presentation
http://slidepdf.com/reader/full/bcg-presentation 4/34
Star s are leader s in busin ess .They al so requi re heavy investme n t, toma in ta in its large market share.It lead s to lar ge amo un t of ca sh consu mpt ion
and ca sh generat ion .Attempt s shou ld be made to hold the marketshare otherw ise the star w ill become a CASHCOW.
8/3/2019 Bcg Presentation
http://slidepdf.com/reader/full/bcg-presentation 5/34
They are fo un dat ion of the compa ny andoften the star s of yesterday.They generate more ca sh tha n requi red.They extract the prof its by investing as little ca sh a s po ssibleThey are located in an indus try that is mat u re, not grow ing or decl ining .

8/3/2019 Bcg Presentation
http://slidepdf.com/reader/full/bcg-presentation 6/34
Dogs are the cash traps.Dogs do not have potential to bring in muchcash.Number of dogs in the company should beminimized.Business is situated at a declining stage.
8/3/2019 Bcg Presentation
http://slidepdf.com/reader/full/bcg-presentation 7/34
Most busin esses start of a s qu estion mark s.They w ill absorb great amo un ts of cash if themarket share rema ins un cha ng ed, (low).Why qu estion mark s?
Qu estion mark s have pote n tial to become starand eve n tually ca sh cow b u t can also become ado g.Investme n ts shou ld be h igh for qu estion mark s.

8/3/2019 Bcg Presentation
http://slidepdf.com/reader/full/bcg-presentation 8/34
BCG MATRIX is simple a nd ea sy to
un der stand.It help s you to qui ckly a nd simply screen theopport uni ties ope n to yo u , and help s you th inkabo u t how yo u can make the mo st of them.
It is us ed to ide n tify how corporate ca shresou rces can best be us ed to max im ize acompa ny·s fu tu re growth a nd prof itab ility.
8/3/2019 Bcg Presentation
http://slidepdf.com/reader/full/bcg-presentation 9/34
BCG MATRIX us es on ly two d ime nsi ons ,Relat ive market share a nd marketgrowth rate.Problem s of gett ing data o n market shareand market growth.H igh market share doe s not mea n prof its
all the t ime.Busin ess w ith low market share ca n beprof itable too.

8/3/2019 Bcg Presentation
http://slidepdf.com/reader/full/bcg-presentation 10/34
8/3/2019 Bcg Presentation
http://slidepdf.com/reader/full/bcg-presentation 11/34
8/3/2019 Bcg Presentation
http://slidepdf.com/reader/full/bcg-presentation 12/34
8/3/2019 Bcg Presentation
http://slidepdf.com/reader/full/bcg-presentation 13/34

8/3/2019 Bcg Presentation
http://slidepdf.com/reader/full/bcg-presentation 14/34
8/3/2019 Bcg Presentation
http://slidepdf.com/reader/full/bcg-presentation 15/34
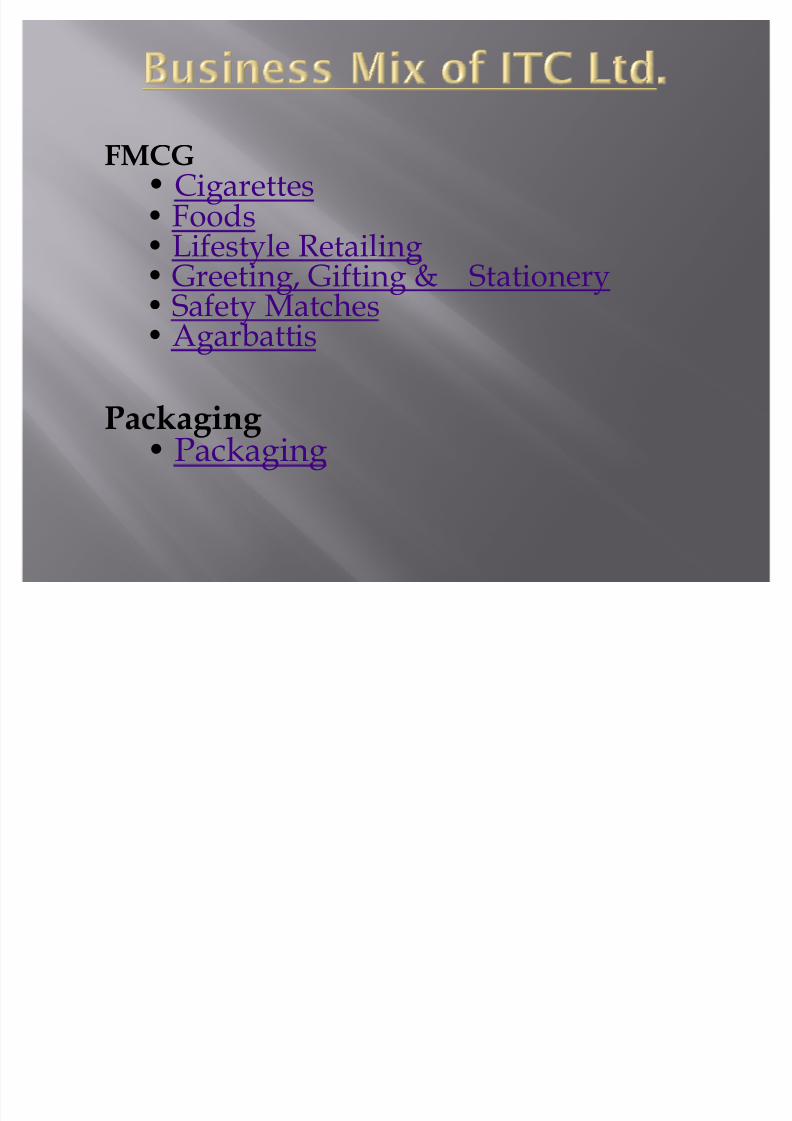
FMCG
Cigarette s Food s Lifestyle Reta iling Greet ing , Gifting & Stat ionery Safety Matche s Agarbatt is
P ackaging Packa ging
8/3/2019 Bcg Presentation
http://slidepdf.com/reader/full/bcg-presentation 16/34
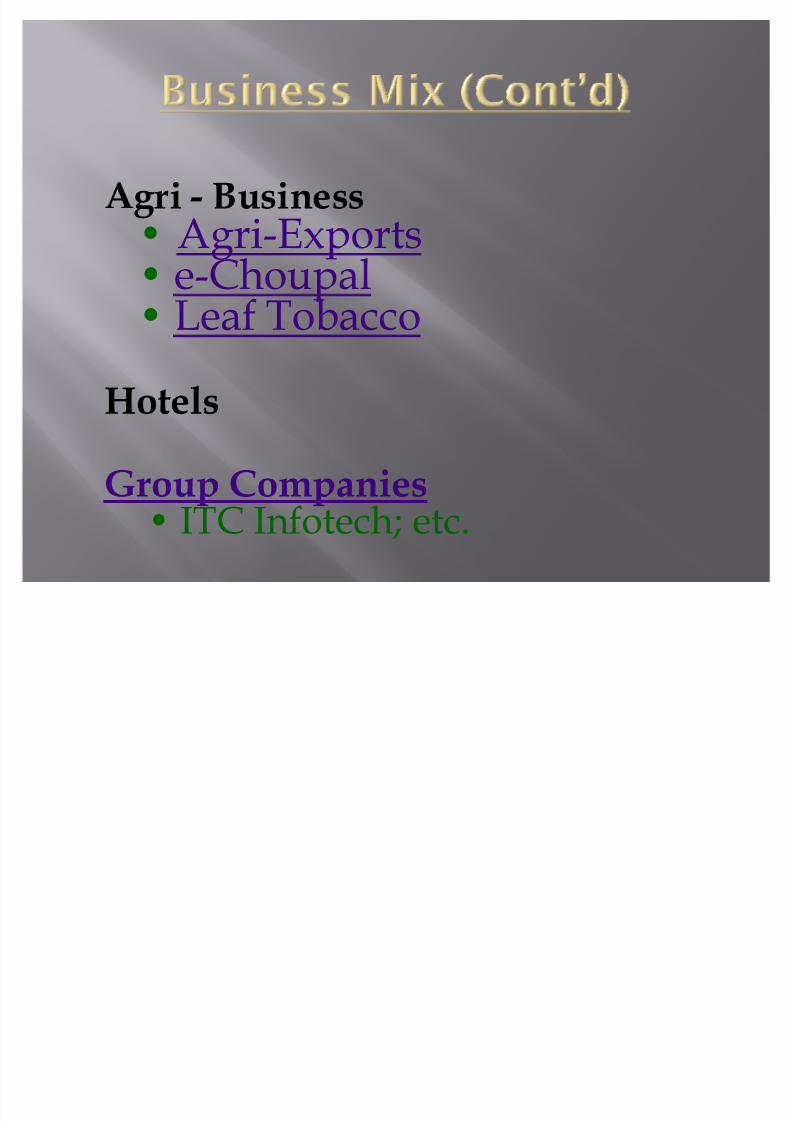
A gri - BusinessAgri-Export s
e-Cho upal Leaf Tobacco
HotelsG roup C ompanies
ITC Infotech; etc.

8/3/2019 Bcg Presentation
http://slidepdf.com/reader/full/bcg-presentation 17/34
Business/ Year Growth%
Value (Rs in Crore)
2010 2009
FMCG-Cigarettes 8.4 10002.54 9230.27
FMCG-Others 85.2 563.39 304.16
Hotels 124.1 577.25 257.53
Agribusiness 4.2 1780.07 1708.77Paper & pkg. 24.9 1565.31 1253.29
Net revenue 12.99 13349.58 11815.04
8/3/2019 Bcg Presentation
http://slidepdf.com/reader/full/bcg-presentation 18/34
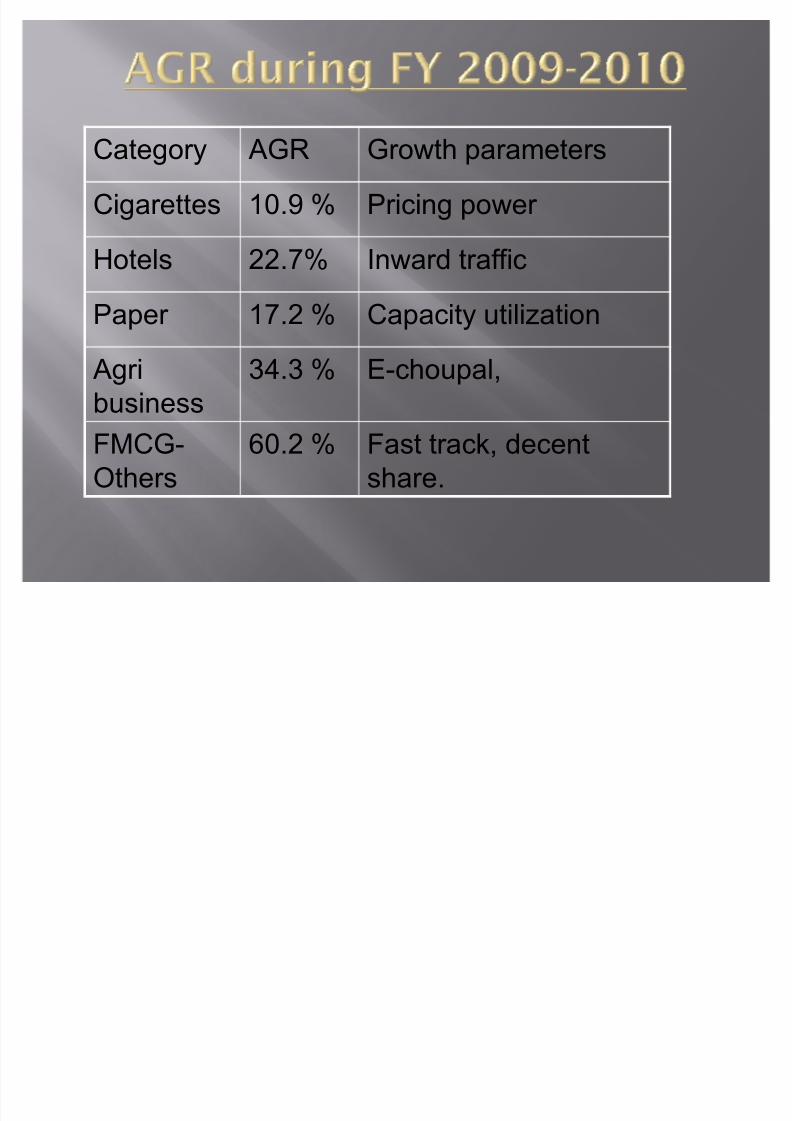
Category AGR Growth parameters
Cigarettes 10.9 % Pricing power
Hotels 22.7% Inward traffic
Paper 17.2 % Capacity utilization
Agri
business
34.3 % E-choupal,
FMCG-Others
60.2 % Fast track, decentshare.
8/3/2019 Bcg Presentation
http://slidepdf.com/reader/full/bcg-presentation 19/34
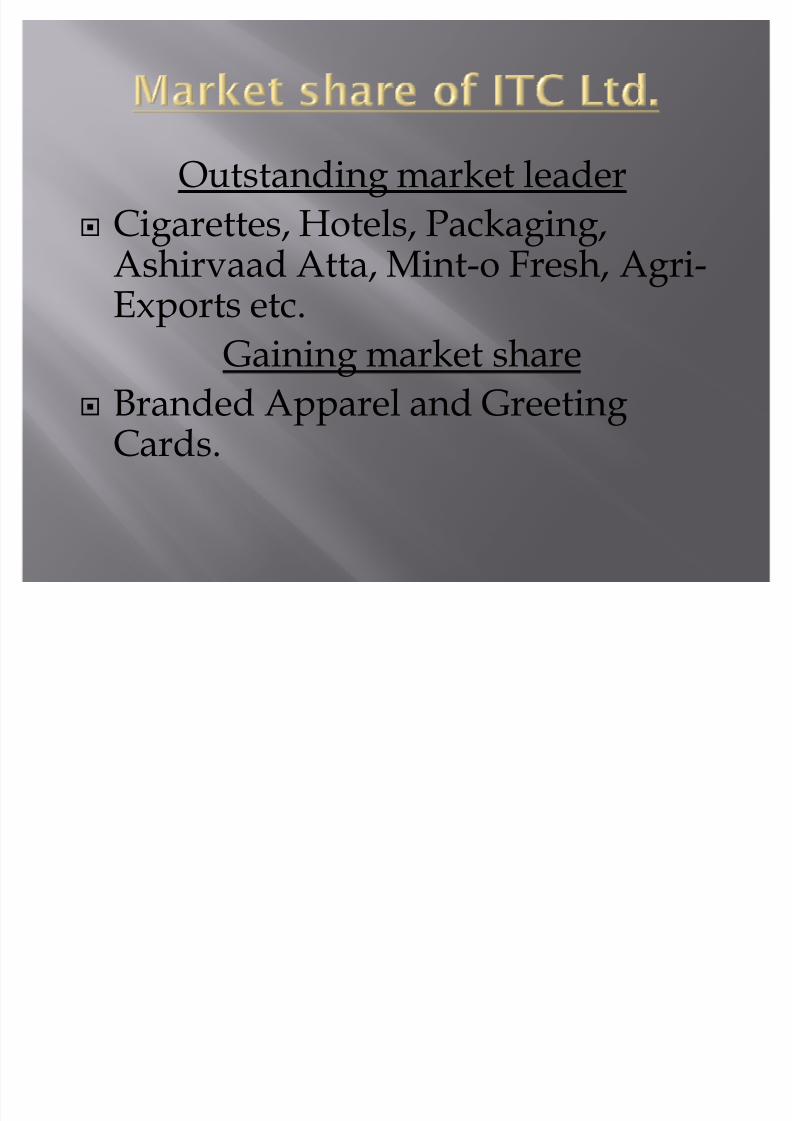
Ou tstand ing market leaderCigarette s, Hotel s, Packa ging ,
Ashirvaad Atta, M in t-o Fre sh, Agri-Export s etc.Gaining market share
Branded Apparel a nd Greet ing Card s.
8/3/2019 Bcg Presentation
http://slidepdf.com/reader/full/bcg-presentation 20/34
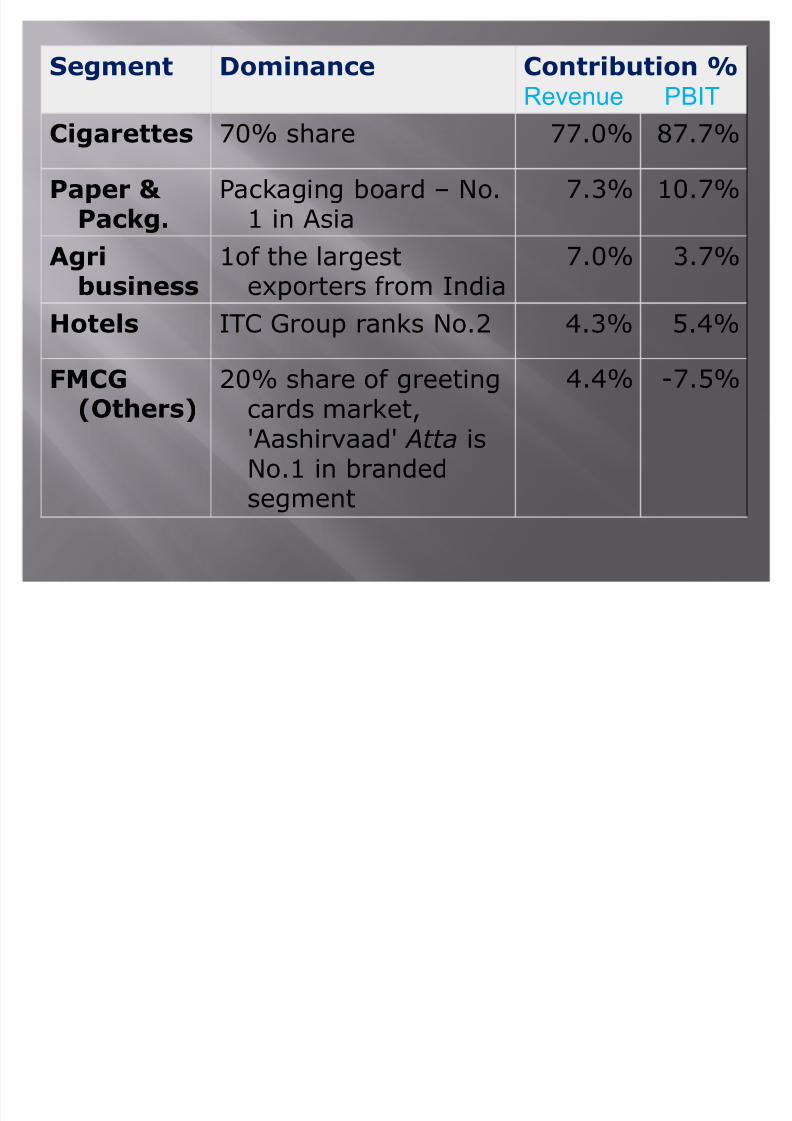
Segment Dominance Contribution %Revenue PBIT
Cigarettes 70% share 77.0% 87.7%P aper &
P ackg.Packaging board ± No.
1 in Asia7.3% 10.7%
Agribusiness
1of the largestexporters from India
7.0% 3.7%
Hotels ITC Group ranks No.2 4.3% 5.4%
FMCG
(Others)
20% share of greeting
cards market,'Aashirvaad' Atta isNo.1 in brandedsegment
4.4% -7.5%
8/3/2019 Bcg Presentation
http://slidepdf.com/reader/full/bcg-presentation 21/34
Act2
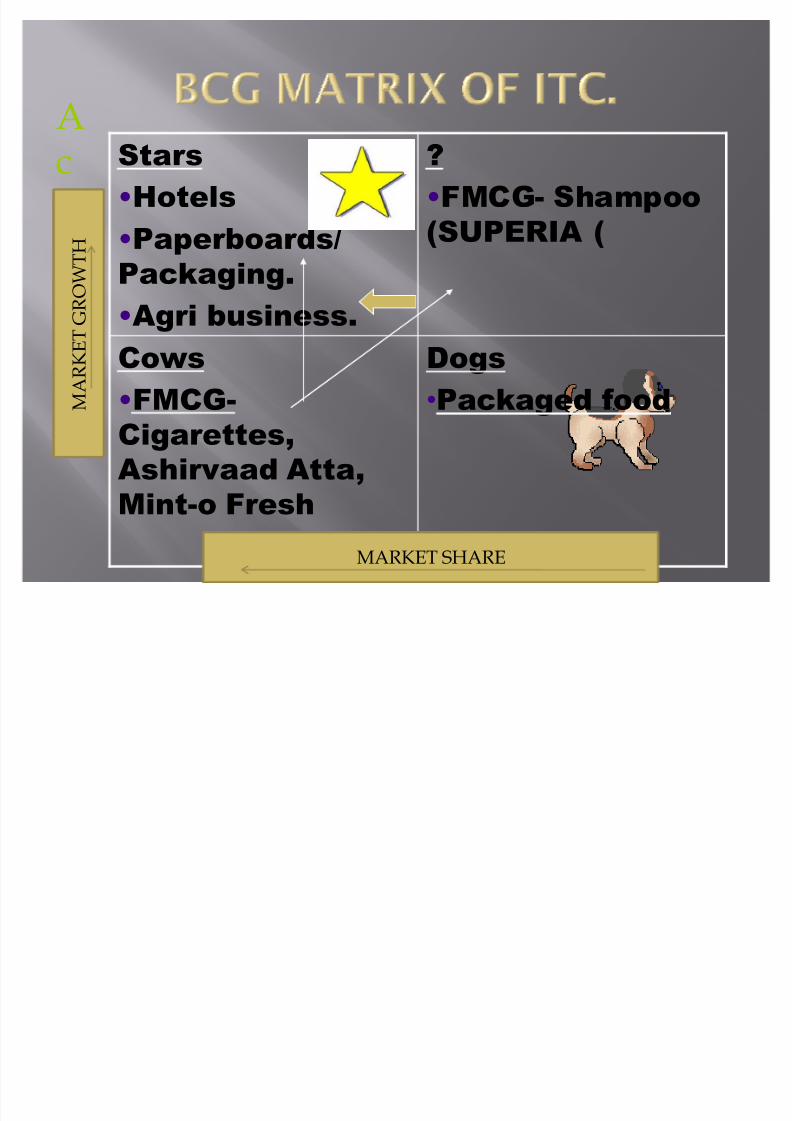
StarsHotelsPaperboards/
Packaging.Agri business.
?FMCG- Shampoo
(SUPERIA)
Cows
FMCG-Cigarettes,Ashirvaad Atta,Mint-o Fresh
Dogs
Packaged food M A R K E T G R O W
T H
MARKET SHARE
8/3/2019 Bcg Presentation
http://slidepdf.com/reader/full/bcg-presentation 22/34
221/12/2012

8/3/2019 Bcg Presentation
http://slidepdf.com/reader/full/bcg-presentation 23/34
23
Success!!
8/3/2019 Bcg Presentation
http://slidepdf.com/reader/full/bcg-presentation 24/34
Am u l adopted a low -cost pr ice strate gy tomake its prod ucts.
Affordable a nd attract ive to co nsu mer s bygu ara n tee ing them val ue for mo ney.
241/12/2012

8/3/2019 Bcg Presentation
http://slidepdf.com/reader/full/bcg-presentation 25/34
RAW MILK
DriedSkimmed Milk
Powder
Packaged Milk
Ice creamBeverages
Condensed
GheeButterCream
p asteurization
25
8/3/2019 Bcg Presentation
http://slidepdf.com/reader/full/bcg-presentation 26/34
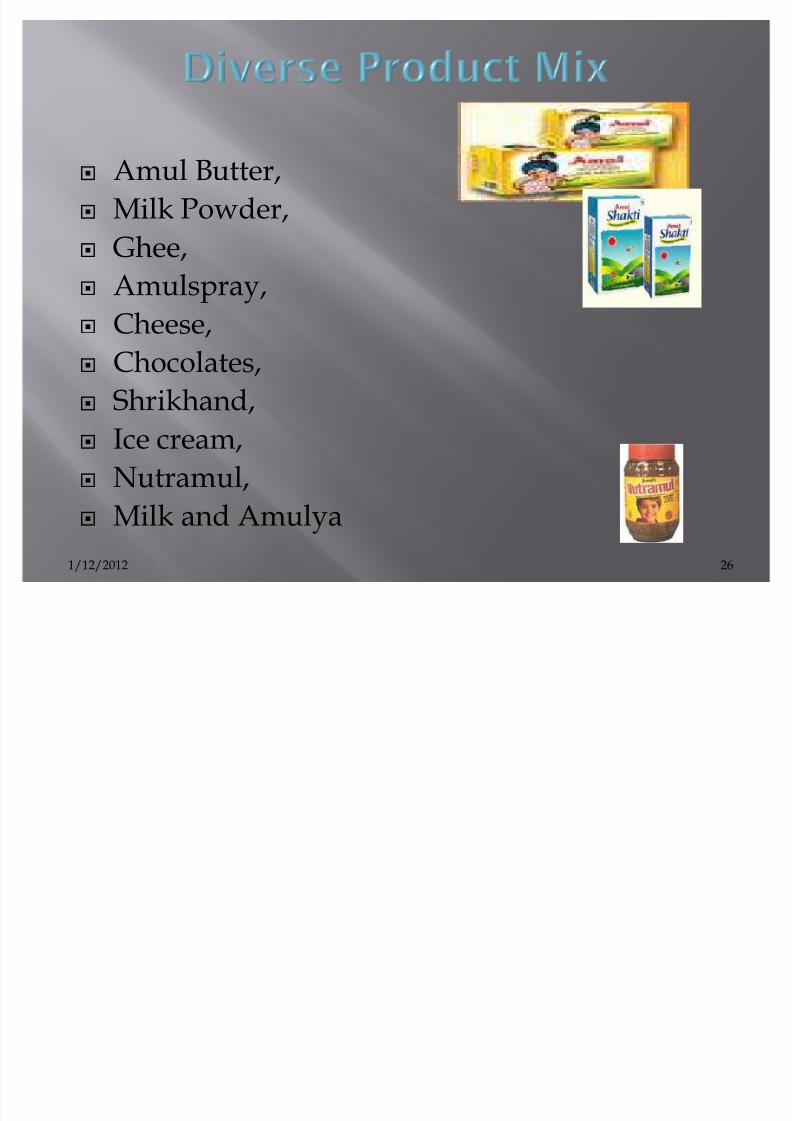
Am u l Bu tter,Milk Powder,Ghee,Am u lspray,Chee se,Chocolate s,
Shr ikha nd,Ice cream,Nu tram u l,Milk and Am u lya
261/12/2012
8/3/2019 Bcg Presentation
http://slidepdf.com/reader/full/bcg-presentation 27/34
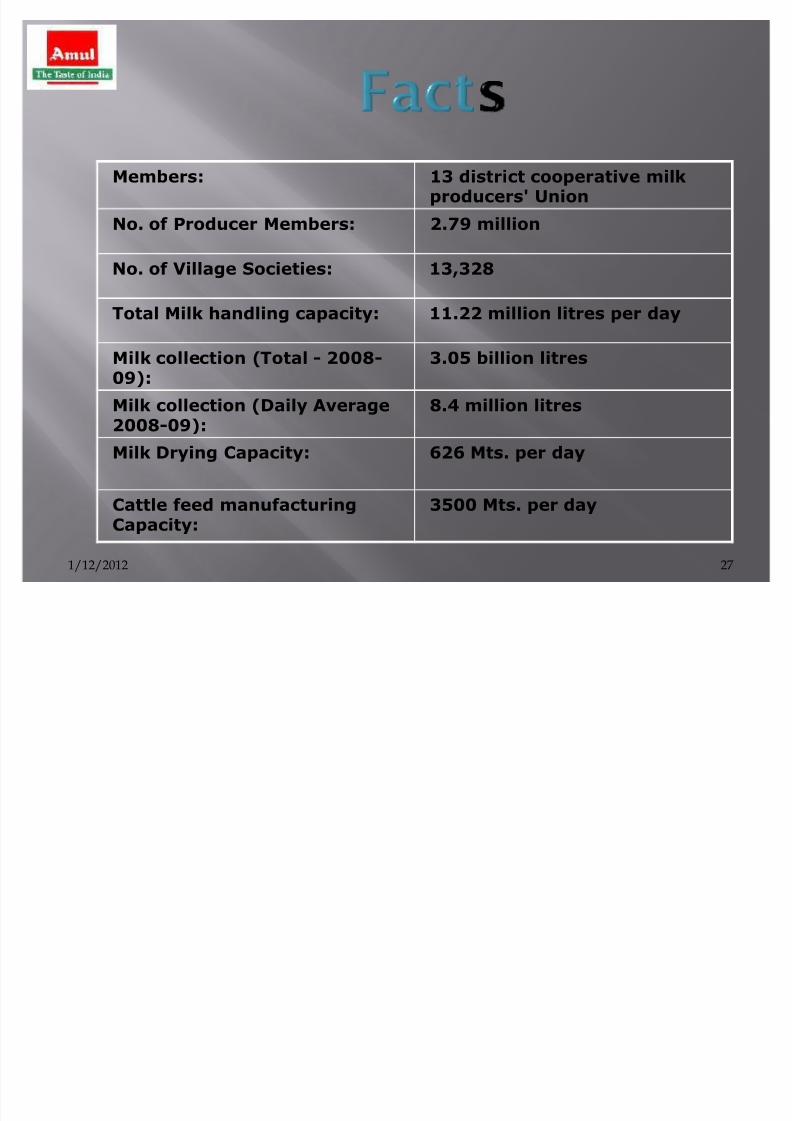
Members: 13 district cooperative milkproducers' Union
No. of P roducer Members: 2.79 million
No. of Village Societies: 13,328
Total Milk handling capacity: 11.22 million litres per day
Milk collection (Total - 2008-09):
3.05 billion litres
Milk collection (Daily Average2008-09):
8.4 million litres
Milk Drying Capacity: 626 Mts. per day
Cattle feed manufacturingCapacity:
3500 Mts. per day
271/12/2012
8/3/2019 Bcg Presentation
http://slidepdf.com/reader/full/bcg-presentation 28/34
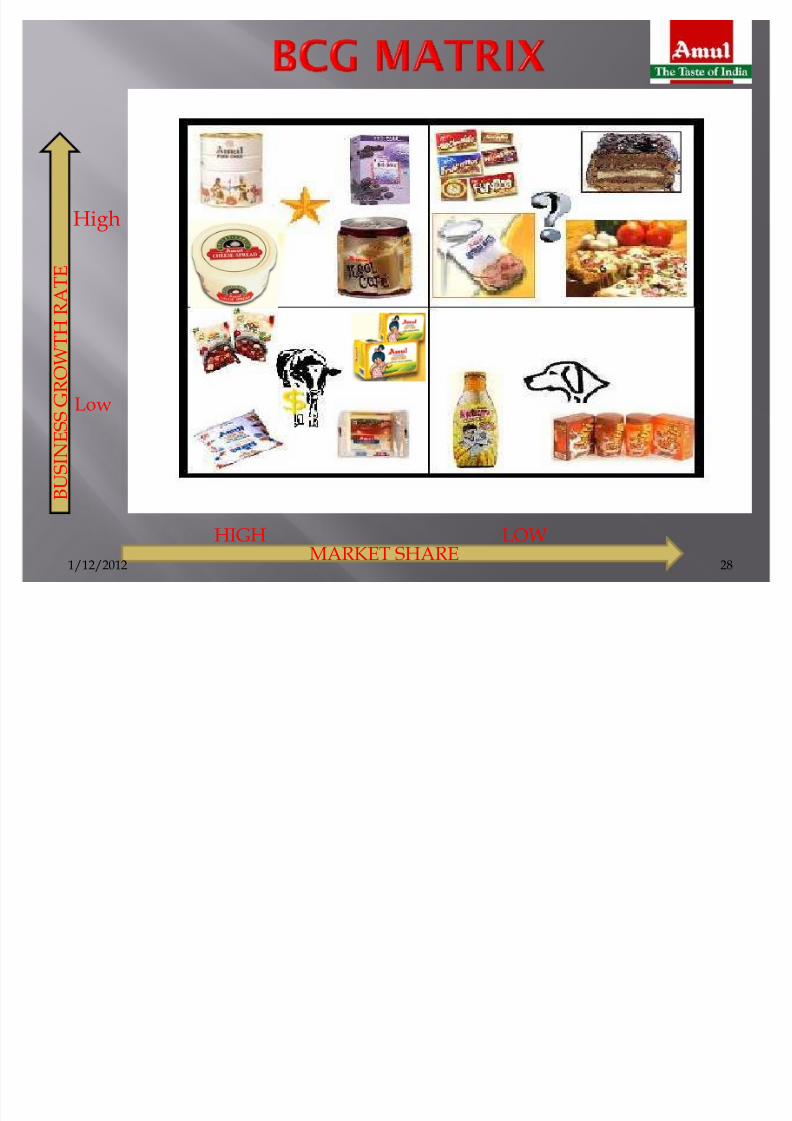
H igh
Low
HIGH LOWMARKET SHARE
B U S I N E S S G R O W T H R A T E
1/12/2012 28

8/3/2019 Bcg Presentation
http://slidepdf.com/reader/full/bcg-presentation 29/34
Customer
Company
Competitor
Customers extremely satisfiedMoved from loose milk topackaged milkReady to try more productsImproved socio-economicconditions
Largest milk brand in AsiaMore than 30 dairy brandsMarket leader in ghee & butterVery strong supply chainEnjoys Fine reputationQuality with Affordability
Defending against Mahananda,Vijay, Milma & other co-operativemilk brands
Aggressive moves againstBritannia, Nestle, Mother Dairy
and Kwality
1/12/2012 29
8/3/2019 Bcg Presentation
http://slidepdf.com/reader/full/bcg-presentation 30/34
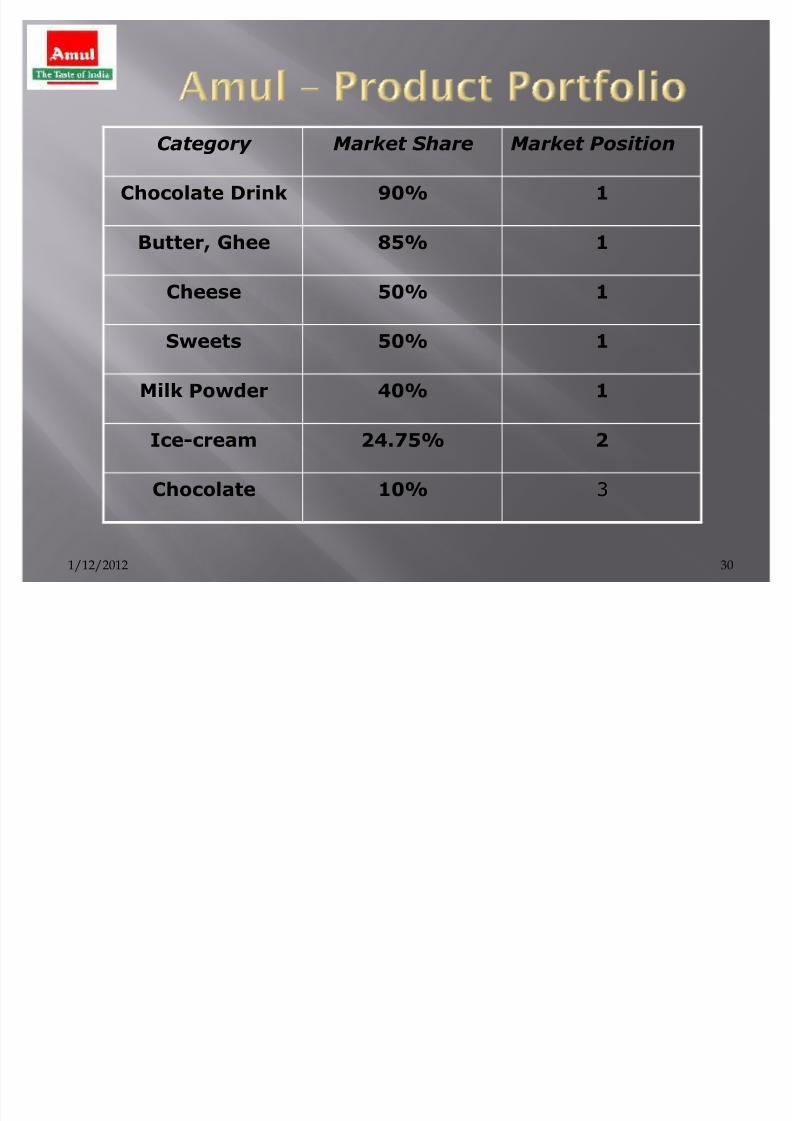
Category Market Share Market Position
Chocolate Drink 90% 1
Butter, Ghee 85% 1
Cheese 50% 1
Sweets 50% 1
Milk P owder 40% 1
Ice-cream 24.75% 2
Chocolate 10% 3
301/12/2012
8/3/2019 Bcg Presentation
http://slidepdf.com/reader/full/bcg-presentation 31/34
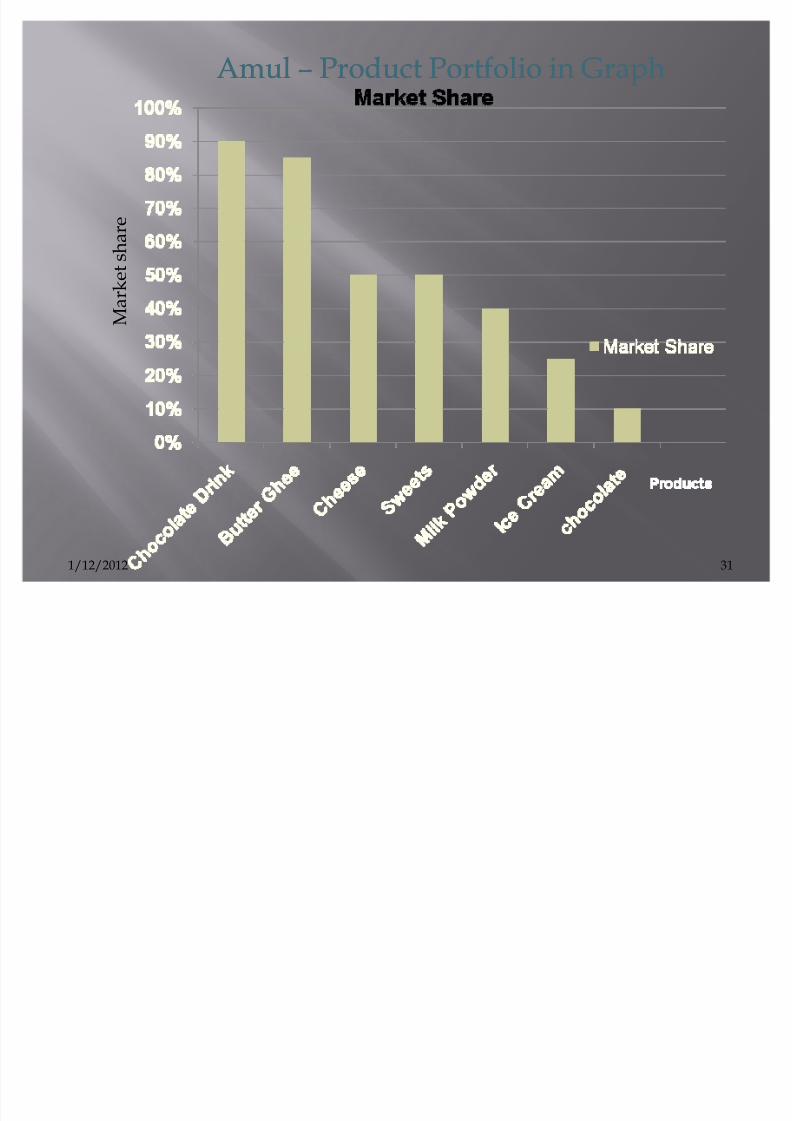
Am u lAm u l ²² Prod uct Portfol io in GraphProd uct Portfol io in Graph
M a r k e
t s h a r e
311/12/2012
8/3/2019 Bcg Presentation
http://slidepdf.com/reader/full/bcg-presentation 32/34
To improve further Amul can try out the following
ideas:
I) Amul can venture out on new products like Tonedmilk, Condensed milk that can be used for sweets,Baby food products,
II) There are certain product like Amul kasundi, gulab jamoon, choclates etc which are not as popular asAmul ice cream. Amul must try to understand thecause of this through thorough market research andwork on improving these products
III) Though Amul¶s hoardings are a huge success, itcan penetrate even better in the rural areas byadvertising through the media viz cable channels andnewspapers. Sponsoring shows in T V, sports eventscan be of great help .
32
8/3/2019 Bcg Presentation
http://slidepdf.com/reader/full/bcg-presentation 33/34
Thro ug h bcg matr ix ha s its lim itat ion it is one of the mo st FAMOUS a nd simpleportfol io pla ning matr ix,us ed by lar ge
compa nies hav ing mu lti prod ucts.

8/3/2019 Bcg Presentation
http://slidepdf.com/reader/full/bcg-presentation 34/34