bearing capacity of i-joists - diva portal424305/fulltext02.pdf · analyserades med hjälp av...
TRANSCRIPT

Bearing Capacity of I-Joists
Växjö June 2011 Amjad Islam, Stephen U. Nwokoli, Tatek Debebe
Department of Civil Engineering

1
Organisation/ Organization Författare/Author(s) Linnéuniversitetet Amjad Islam, Tatek Debebe, Stephen U. Nwokoli Institutionen för teknik Linnaeus University School of Engineering Dokumenttyp/Type of document Handledare/tutor Examinator/examiner Examensarbete/Degree project Erik Serrano Erik Serrano Titel och undertitel/Title and subtitle Bearing Capacity of I-joist Sammanfattning (på svenska) Detta arbete handlar om bärförmåga hos träbaserade I-balkar vid upplagstryck. Fininta elementmodeller analyserades med hjälp av datorprogrammet Abaqus CAE för att bestämma balkars bärförmåga. Syftet med undersökningen var att jämföra beräkningsresultaten med ett nyligen föreslaget dimensioneringsuttryck som baseras på kurvpassning av provningsresultat. Finita elementmodellerna bestod av tre olika delar, balkarnas liv, vilka modellerades med skalelement, samt balkarnas flänsar och de stålplattor som användes vid upplag och belastningspunkter vid provningarna, och som modellerades med solidelement. Två sorters analys genomfördes, dels linjär bucklingsanalys för att beräkna risken för lokal buckling av livet, och dels statisk spänningsanalys för att beräkna risken för klyvning av flänsen. Resultaten visar bland annat att stålplattornas längd vid upplagen i vissa fall inte påverkar bärförmågan i någon nämnvärd omfattning, i första hand vad gäller klyvning av flänsen. Vidare visas att bärförmåga på grund av lokal livbuckling är omvänt proportionell mot balkhöjden i kvadrat, medan balkhöjden inte alls påverkar risken för klyvning av flänsen. Nyckelord: I-balkar, upplagstryck, buckling, klyvning av fläns, finita elementmetoden Abstract (in English) This work deals with the bearing capacity of wood based I-joists Finite element models were analyzed to determine the bearing capacity of I-joists, using the finite element software Abaqus CAE. The purpose of this study is to compare the results from the developed FE-models with experimental results, and with a previously proposed design formula. To perform the analyses finite element models were created. The model consists of three parts:, the web (made of shell element), the flanges and steel plates used at the supports and loading points (made of solid elements) To determine the bearing capacity of the I-joist two types of analyses were performed, a linear buckling analysis to check the risk of web buckling and a static (stress) analysis to check the risk of splitting of the flanges. This study shows that the steel plate length, in some cases, has little or no impact on primarily the splitting load. Furthermore, the buckling load decreases as the depth of the beam increases, the influence of the depth being proportional to 1/h2. The depth of the beam has no impact on the risk of splitting of the flange. Key Words I-joist, Bearing capacity, Buckling, Splitting, Abaqus CAE, Finite Element Method Utgivningsår/Year of issue Språk/Language Antal sidor/Number of pages 2011 English 44 Internet/WWW

2
Abstract
This work deals with the bearing capacity of wood based I-joists Finite element models were analyzed to determine the bearing capacity of I-joists, using the finite element software Abaqus CAE. The purpose of this study is to compare the results from the developed FE-models with experimental results, and with a previously proposed design formula. To perform the analyses finite element models were created. The model consists of three parts:,the web (made of shell element), the flanges and steel plates used at the supports and loading points (made of solid elements) To determine the bearing capacity of the I-joist two types of analyses were performed, a linear buckling analysis to check the risk of web buckling and a static (stress) analysis to check the risk of splitting of the flanges. This study shows that the steel plate length and the length of the beam have little or no impact on the splitting and buckling load. Furthermore, the buckling load decreases as the depth of the beam increases, the influence of the depth being proportional to 1/h2. The depth of the beam has no impact on the risk of splitting of the flange.

3
Acknowledgements
We would like to express our gratitude for the support and inputs provided by our supervisor, Professor Erik Serrano, in this study. His insight and comprehensive knowledge of the subject and software have proved extremely helpful in creating this work. In addition to our supervisor we would like to thank every one who helped us build on that foundation. Those individuals include our teachers, colleagues and friends at Linnaeus University Växjö. We would also like to thank the Swedish manufacturer company for providing a comprehensive report of their experiment, which became the basis of this study. Finally, we would like to appreciate our families for their support and encouragement during this study. Thank You.

4
Table of Contents
Abstract................................................................................................................................ 2
Acknowledgements.............................................................................................................. 3
1. Introduction..................................................................................................................... 5 1.1 Background........................................................................................................................... 5
1.1.1. I-Joists ......................................................................................................................................... 5 1.1.2. Structural design of I-joists ......................................................................................................... 6 1.1.3 Failure modes in bearing capacity tests ....................................................................................... 8
1.2 Purpose.................................................................................................................................. 8 1.3 Hypothesis and limitations .................................................................................................. 8 1.4 Literature review.................................................................................................................. 9
3. Experiments and proposed design formula ................................................................. 10 3.1 Experiments........................................................................................................................ 10
3.1.1 Material ...................................................................................................................................... 10 3.1.2 Test procedure ............................................................................................................................ 10
3.2 Proposed design formula ................................................................................................... 10 4. Theory............................................................................................................................ 12
5. Method........................................................................................................................... 16
6. Analysis of Results ........................................................................................................ 21 6.1. Experimental results ......................................................................................................... 21 6.2 Finite Element Method Results......................................................................................... 22 6.3 Graphical presentation of finite element analysis results............................................... 23
6.3.1 End Support ................................................................................................................................ 23 6.3.2 Inner Support .............................................................................................................................. 25 6.3.3 Mid Span .................................................................................................................................... 27
7. Discussion...................................................................................................................... 29 7.1. Experimental results ......................................................................................................... 29 7.2 Finite Element Method Results......................................................................................... 29 7.3 Comparison of experimental and numerical results ....................................................... 30
8. Conclusions ................................................................................................................... 34
9. Literature References.................................................................................................... 35
Appendix – Deformed model plots (selection) ................................................................. 36

5
1. Introduction The master thesis project described here relates to theoretical studies of the bearing capacity of wood based I-joists, by using the finite element method. A number of different loading conditions and beam geometries are investigated. In addition, a proposed analytical expression for determining the bearing capacity will be discussed in relation to the results obtained using the finite element (FE) analyses. The results obtained in the FE-analyses are compared also with available experimental results. The aim is to understand the mode of failure of the I-joists for different loading and support conditions and for different beam geometries.
1.1 Background
1.1.1. I-Joists Timber has been used as construction material for thousands of years, as early as 700 BC as claimed in (Dinwoodie, 2000). The early use of timber includes the production of furniture, coffins, wooden couches, beds, housing, boats, etc. The use of timber as a construction material increased widely in the nineteenth century not only for roofs but also for waterwheels, signal poles, gearwheels and rails of early pit railways. In UK about 50% of total consumption of timber was consumed by construction industry either as structural and non–structural members. (Dinwoodie, 2000). There are a number of inherent characteristics that makes timber an ideal construction material: its high strength to weight ratio, its impressive record for ductility in certain modes of loading and its good insulting properties against heat and sound. The use of wood-based I-joist in the floor structures of residential buildings are fast growing across Europe and North America. In today’s construction industry it is well accepted. (Anon., 2001). They are of high strength, high stiffness, lightweight and low cost in comparison to other conventional framing. Holes may be cut in its web depending on the manufacturer's recommendations, hence allowing the ducts and utilities to pass through it. I-joists are structurally-engineered timber comprising of flanges and web. Flanges can be made of solid sawn lumber, structural composite lumber or laminated veneer lumber while webs are usually made of plywood, fibre boards, particle boards or oriented strand board (OSB). I-joists are also used as studs where long lengths and high strengths are required. (Anon., 2001). The flanges and the web are glued together to form an I-shaped cross-section, alternative to conventional solid timber. I-joists are economical and versatile structural elements in which the geometry permits efficient use of the material by concentrating the timber in the outmost area of the cross-section where it is required to resist the stress. The flanges are commonly designed to provide for the moment capacity of the beam and the web to predominantly carry the shear force. The stresses between the adjacent components of I-joist are transmitted through the flange-web glueline. Load capacities depend significantly on web material; I-beams with OSB webs carried greater ultimate loads. (Leichti et al.,1990) A number of studies have been performed to investigate the influence of web openings on I-joist showing that openings in the web affect the performance of I-joists. According to Fergus (1979) the circular openings in the web does not affect the bending strength of
6
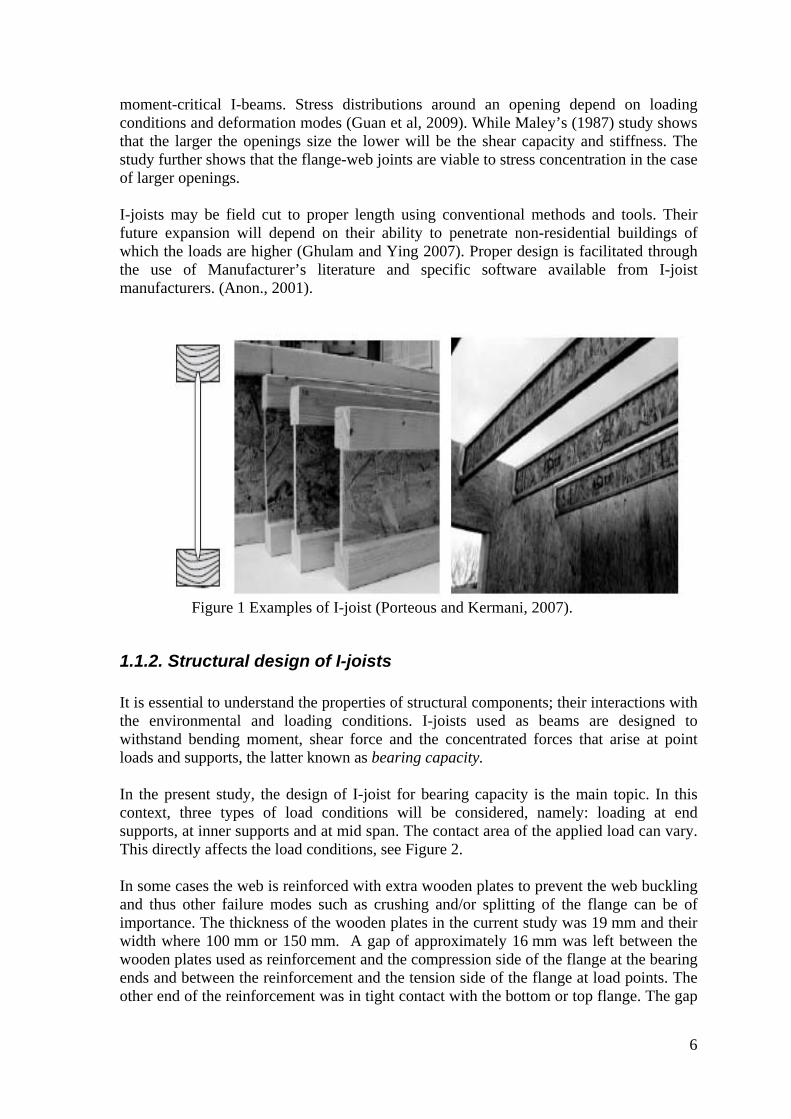
moment-critical I-beams. Stress distributions around an opening depend on loading conditions and deformation modes (Guan et al, 2009). While Maley’s (1987) study shows that the larger the openings size the lower will be the shear capacity and stiffness. The study further shows that the flange-web joints are viable to stress concentration in the case of larger openings. I-joists may be field cut to proper length using conventional methods and tools. Their future expansion will depend on their ability to penetrate non-residential buildings of which the loads are higher (Ghulam and Ying 2007). Proper design is facilitated through the use of Manufacturer’s literature and specific software available from I-joist manufacturers. (Anon., 2001).
Figure 1 Examples of I-joist (Porteous and Kermani, 2007).
1.1.2. Structural design of I-joists It is essential to understand the properties of structural components; their interactions with the environmental and loading conditions. I-joists used as beams are designed to withstand bending moment, shear force and the concentrated forces that arise at point loads and supports, the latter known as bearing capacity. In the present study, the design of I-joist for bearing capacity is the main topic. In this context, three types of load conditions will be considered, namely: loading at end supports, at inner supports and at mid span. The contact area of the applied load can vary. This directly affects the load conditions, see Figure 2. In some cases the web is reinforced with extra wooden plates to prevent the web buckling and thus other failure modes such as crushing and/or splitting of the flange can be of importance. The thickness of the wooden plates in the current study was 19 mm and their width where 100 mm or 150 mm. A gap of approximately 16 mm was left between the wooden plates used as reinforcement and the compression side of the flange at the bearing ends and between the reinforcement and the tension side of the flange at load points. The other end of the reinforcement was in tight contact with the bottom or top flange. The gap

7
between reinforcement and flange prevents the reinforcement from pushing the flanges apart in case where the bending deflection is large. (Leichti et al., 1990)
Figure 2 Support and load conditions

8
1.1.3 Failure modes in bearing capacity tests When load is applied to an I-joist in the case of insufficient lateral stiffness it may buckle out of plane. There are two kinds of buckling: lateral buckling and local buckling. Lateral buckling occurs under the combined action of twisting and lateral bending of the cross-section. In local buckling the element of a member buckle locally over a short length, causing local changes in cross sectional shapes. (Avik Samantha, Ashwini Kumar) Concentrated forces applied perpendicularly to the upper flanges of an I-beam, a load case usually referred to as patch loading, are common in most timber structures. The web, being thin is sensitive for this load case and might collapse by web buckling. Although a lot of effort has been directed towards this problem, general analytical solutions have not been obtained due to the complexity of the problem. Therefore, most investigators used the finite element method to study the behaviour of the webs under patch loading.
1.2 Purpose This project deals with the development of FE-models for different types of I-joists. The design of I-joists for bearing capacity for a Swedish manufacturer is today based on purely empirical results. The conventional method of testing different geometries, different loading and support conditions is costly since extensive tests are required. Therefore, if a theoretical model which is fit to the experimental results could be used instead, much would be gained. The main purpose of this work is therefore to compare the results from the developed FE-models with experimental results, and with a previously proposed design formula (which was obtained by curve fitting), to see if the current design recommendations are adequate from a theoretical point of view (e.g. is the influence of loading conditions or beam height properly accounted for).
1.3 Hypothesis and limitations The bearing capacity of the I-joists is affected by a large number of parameters, e.g. the height of the flange, the height of the web, the web thickness, flange width, contact area of the load, and contact area of the support. The analyses performed in this project are compared with the results of a set of experiments performed on I-joists to determine their bearing capacity. In this project the bearing capacity of the I-joists regarding web bucking and splitting of the flange will be analyzed. According to the experimental results provided by the Swedish manufacturer a number of samples were tested with beam depths ranging from 200 to 500 mm and with different web and flange dimensions. In this report the failure modes referred to as flange crushing, web splitting, flange buckling and end rotation will not be considered since these are less common than web buckling and flange splitting. The adhesive joints between the parts of the I-joists will also not be taken into account. Finally, the influence of moisture content of the timber, density and temperature will also not be considered.

9
In the experiments the web was reinforced with timber plates glued to web and flange, providing also support to the flange, as described above. In the finite element (FE) model the web reinforcement is modelled by increasing the thickness of the shell elements of the web over a sub area. Thus, the local support of the flange that the web reinforcement provides in the real tests, is not taken into consideration in the FE-analyses The assumptions mentioned above, together with other simplifications and e.g. the use of literature values for material properties, may have some effect on the final results of this study and, consequently also could have an impact on the validity of e.g. the specific numeric values of load bearing capacities. However, it is estimated that the general trends obtained in the present study (e.g. the influence on the load bearing capacity of the parameters studied) are still valid.
1.4 Literature review The development of I-joists can be traced back to the early 20th century when light weight materials were being explored for the use in the aircraft industry, but were limited primarily to site fabrication. In response to the customer demands for open floor plans and the increased scarcity of traditional wood joists of >6m in length, in 1969 the company Trusjoist began mass production of prefabricated I joists. Historically, the engineering and manufacturing of I-joists has been proprietary with individual companies developing design guidelines. However, over the last three decades there has been a gradual shift to industrial-wide standardisation, in North America by the efforts of industry associations and in Europe by EOTA (European Organization for Technical Approvals). Further, in 1997, the APA–the engineering wood association–released the APA performance rated I-joist standard, a standard used for approximately 39% of standard I-joists sold in the United States in 2006 (Morrisey et al., 2009). In Europe, the standardisation is based on the demand of obtaining a European Technical Approval (ETA). These approvals are issued based on a so-called ETA-guideline (ETAg), issued by an organisation called EOTA. EOTA comprises of Approval Bodies nominated by EU member states and EFTA States who have contracted to the European Economic Area Agreement. According to Forest & Wood Products Australia, the bearing capacity of an I-joist can be determined based on three different capacities, namely:
• Bearing capacity of the flange immediately adjacent to the bearing. • Bearing capacity of the web immediately adjacent to the flange above the bearing • Buckling of the web above the bearing.
They further stated that the bearing capacity of the flange immediately adjacent to the bearing can be calculated using the usual method for bearing capacity perpendicular to grain. Also, the bearing capacity of the web immediately adjacent to the flange can be found from the bearing capacity of the web material. Similarly, the buckling capacity of the web can be obtained by calculating the buckling capacity of the web above the bearing and comparing that value with the reaction at the bearing. To determine the bearing capacity of I beam it is necessary to understand the geometry of the cross section and the materials from which the members are manufactured.

10
3. Experiments and proposed design formula
3.1 Experiments A series of tests were performed by SP Technical Research Institute of Sweden on behalf of a I-joist manufacturing company. In addition to the tests, also a semi-empirical design equation was developed, with the aim of inclusion in a European Technical Approval (ETA). The material used and the test procedure are described below.
3.1.1 Material The beams had the following composition: Flanges: 47x47 mm sawn and planed spruce timber .machine strength graded K30 for depths 200 to 250 mm and K24 for depths 300 to 400 mm. Moisture content at production is 12 to 18 %. Web: 8 mm Masonite hard fibreboard K40. Table 1 Beam dimensions and moisture content
Beam depth
Flange dimension
Web thickness
Flange moisture content
Web moisture content
Depth Width (mm) (mm) (mm) (%) (%)
250 47.0 46.8 8.3 13.0 9.0 300 46.5 46.9 8.3 13.0 9.0
In some of the test series the web was reinforced by nailing plywood with a thickness of 19 mm on each side. Nails with a diameter of 3.4 mm and length of 50 mm were used.
3.1.2 Test procedure Tests were performed in accordance with EOTA Technical report (EOTA 2000). As illustrated in Figure 2, load was applied in the plane of the beam through 20 mm thick steel plates. Table 8 shows the test results and width of the steel plates at the loading point and at the supports. The rate of loading was adjusted so that the ultimate load occurred within a period of 5 to 15 minutes. The bearing capacity is define as the ultimate load and the failure modes were divided into Flange compression (FB), Web crushing (WC), Flange split (FS), Web buckling (WB) and End rotation (ER).
3.2 Proposed design formula Based on calculations assisted by testing a design formula has been proposed for the prediction of bearing capacity of I-joists1. This was obtained by fitting of the characteristic values of test results. Equation (1a) and (1b) are the proposed design expressions for the characteristic load capacity (kN). The one giving the lowest failure load is the governing equation.
1 The derivation of this is presented in SITAC (2011), a report not publically available

11
⎪⎪⎩
⎪⎪⎨
⎧⋅⎟
⎠⎞
⎜⎝⎛
=
20
1
5.0
45mina
hF
al
F k
)b1(
)a1(
Here l is the bearing length in mm a1 is a parameter depending on the flange width and the support conditions h is the beam depth in mm a2 is a parameter depending on the support conditions (risk for buckling) Equation (1a) gives the load bearing capacity in failure modes related to the strength of the materials involved while equation (1b) gives the load bearing capacity in a failure mode related to web buckling. Fitting of the parameters a1, a2 and F0 gave the values for the various loading conditions shown in Table 2.
Tabel 2: Parameter values
End bearing Inner bearing/mid support
Parameter bf=47 mm
bf=70 mm bf=97 mm bf=47 mm
bf=70 mm
bf=97 mm
a1 9 13 18 16 20 25 a2 1 1 1 2l/45 2l/45 2l/45 F0 4000 4000 4000 4000 4000 4000
a1 and a2 are stress distribution factors for the various loading conditions and support lengths respectively. The factor a1 relates to the load level at which failure due to flange crushing/splitting will occur while a2 relates to the load level at which web buckling occurs. F0 is a scaling parameter which can be seen as the inherent load bearing capacity with respect to buckling of the web for a beam of a certain depth. As equation (1b) gives the failure load for web buckling it is applicable for cases where the web is not reinforced. Another case where it is assumed that web buckling is not of concern is if a point load is applied directly above the support for beam depths exceeding 250 mm. (SITAC, 2011)

12
4. Theory The finite element method (FEM) is based on the idea of subdividing the continuum into a discrete number of smaller elements. Therefore FEM allows the behavior of complex geometries to be modeled with simplicity. The elements are connected by nodes with certain degrees of freedom (in 3D elasticity 3 degrees of freedom per node representing the node’s displacement in 3D). By modeling these elements mathematically a stiffness matrix representing the force-displacement relation for each element can be established. The stiffness matrices of all elements can then be assembled to a global stiffness matrix representing the force-displacement relation for the complete problem. According to Bozeos and Xykis (2002) the FEM has been used for the analysis of elastic stability of structural members such as beam-columns, plane- and space trusses and frames in the framework of either a linear analysis involving small deformations or a nonlinear analysis involving large deformations. The basic steps of FEM theory are to derive a governing differential equation, and from this obtain a global balance equation. In this procedure a constitutive relation, i.e. a material law connecting the stress with the strain, is introduced. Approximating functions, also known as shape functions, are introduced to construct piecewise continuous approximations of the primary unknowns. The procedure usually starts with the application of a balance equation which leads to the so called strong formulation by introducing the constitutive relations, kinematic relations and boundary conditions. The weak formulation is then obtained by introducing an almost arbitrary function (weighting function) into the strong form and integrating over the entire region. Introducing an approximation of the primary unknown variable into the weak form, often using the Galerkin method, results in the finite element formulation. Shape functions are used to construct the approximations of the primary unknown, for example the displacement. To illustrate the above procedure, an example of one dimensional elasticity is shown below. Consider a bar with body force b and normal force N as indicated below.
Applying the principle of equilibrium gives:
0)()( =+++− dxxNbdxxN
- 0)()( =+++ dxdxdNxNbdxxN
0=+ bdxdN
.................................................. (1)
By definition, normal force N is equal to the product of stress σ and area A.

13
AN σ=
By introducing a constitutive relation, e.g. Hooke's law, we obtain
εσ E= and by the definition of strain we get
dxdu
=ε
Where u is the displacement. By inserting these relations into equation (1) we obtain
0)( =+ bdxduAE
dxd 0 Lx ≤≤
If AE is constant then:
gLxu
hdxduAEAxN
Lxbdx
udAE
xx
==
====
≤≤=+
==
)(
)()()0(
)2........(..........).........0(,0
00
2
2
σ
Equation 2 and the accompanying boundary conditions constitute a strong form. By multiplying (2) with an arbitrary scalar weighting function v(x) and integrate over the entire region we obtain
0)(0
2
2
=+∫ dxbdx
udAEvL
Partial integration of this relation gives
[ ] ∫∫ +=L
LL
vbdxAvdxdxduAE
dxdv
00
0
()( σ ........................... (3)
( ) ∫∫ +−= ==
L
xLx
L
vbdxhvAvdxdxduAE
dxdv
00
0
)()( σ ……… (4)
Equation (4) constitutes what is known as the weak form of the problem. We now introduce the approximation

14
adxduau BN == ;
where N is the shape functions matrix and B is the matrix containing the derivatives of the shape functions. By using the Galerkin method in introducing the scalar weight function, v,
v= Nc and since
Nc=v=v TTT Nc= we obtain
TT
dxdv Bc=
By inserting these relations into equation (4) we arrive at
[ ] bdxAadxAEL
TLTL
T ∫∫ +=0
00
)( NNBB σ ................ (5)
Equation (5) finally is the finite element formulation of the problem. In standard form this can be written
lb ffKa +=
Where ∫=L
T dxAE0
BBK , [ ]LTb A 0σNf = , bdx
LT
l ∫=0
Νf
The FE method makes it possible to obtain an accurate, but approximate, solution to the problem, or rather to the original differential equation. Using today’s commercial FE-software systems it is easy to solve complex problems, involving complex geometries and to repeat the process for different loading, support and boundary conditions with or without changing the properties of materials and geometry once the different parts of the structure have been created and properties have been assigned. The above description relates to one-dimensional linear elastic (first order theory). Similar relations can be established for two- or three-dimensional problems. Web buckling occurs in cases where the web is too slender to carry the transverse force from the flange. In this case the web acts more like a strut in compression. The flange can be more or less restrained in the lateral direction preventing it to move laterally or to rotate along the flange length axis.

15
All structures deform when load is applied, although the effect upon overall geometry may often be ignored. Lateral deflection may, however, add a significant effect to bending moments which in turn increase deformation, in some cases. Therefore, the deformed geometry must be considered while forming the governing equilibrium equation of a structure. This type of analysis is referred to as second order analysis. While the analysis in which the equilibrium equation is formed by considering the undeformed geometry is called first order analysis. (Moreno, 2008) The outcome from such an approach is thus that a compressive normal force (e.g. in an axially loaded column) will reduce the transverse stiffness of the column, up to point where a deformed state of equilibrium exists, even for an initially perfectly straight and centrically loaded member. It is possible that different buckling loads may be predicted from seemingly equivalent pressure and force loads in an eigenvalue buckling analysis. For the evaluation of the effective length of members the critical buckling load is required which can be determined by the use of either eigenvalue analysis or second order elastic analysis. Contrary to the first order analysis, second order analysis is an iterative type procedure to obtain solutions. Therefore eigenvalue analysis is the simplest way to obtain the critical buckling load. Figure 3 shows the load deflection behaviours of a structure analysed by first and second order elastic methods.
Figure 3: Load displacement curve (Chen et al., 1996)

16
5. Method In this project the I-joists are modelled using Abaqus FE software, starting by creating the different parts (geometrical entities) of the problem. A description of the different models dealt with is given in Table 3. Creating the part means that the geometry of the I-joists is drawn. Then the material properties are assigned to each part. After this the parts are assembled, followed by the definition of the analysis type and output requests to be used. Mechanical interactions are defined and loads and boundary conditions are then applied. As an approximation to the geometrical model, an FE mesh is created. Finally the job is submitted for analysis and the results can then be visualized. Table 4 shows the dimensions used in the models. An illustration of cross-section of the model is shown in Figure 4. The different parts of the I-joist are given different element types as shown in Table 5.
Tabel 3: Description of models
Mod
el
Beam
Dep
th(m
m)
Beam
Length(m
m)
Load
ing
Plate length at
Supp
ort(mm)
Plate length at
Load
ing
Point(mm)
Reinforcem
ent
Position
of
Reinforcem
ent
A1 200 800 A2 250 1000 A3 300 1200 A4 500 2000
At End support 45 70 No N.A
B1 200 800 B2 250 1000 B3 300 1200 B4 500 2000
At End Support 45 70 Yes At end
C1 200 800 C2 250 1000 C3 300 1200 C4 500 2000
at End support 145 145 No N.A
D1 200 800 D2 250 1000 D3 300 1200 D4 500 2000
at End support 145 145 Yes At end
E1 200 800 E2 250 1000 E3 300 1200 E4 500 2000
at Inner Support 70 70 No N.A
F1 200 800 F2 250 1000 F3 300 1200
At Inner Support
70 70 Yes At mid‐span

17
F4 500 2000 G1 200 800 G2 250 1000 G3 300 1200 G4 500 2000
At Inner Support 145 70 No N.A
H1 200 800 H2 250 1000 H3 300 1200 H4 500 2000
At Inner Support 145 70 Yes
At mid‐span
K1 200 800
K2 250 1000
K3 300 1200
K4 500 2000 At Mid span 100 70 Yes
At both ends
Table 4: Beam Dimensions
h (mm) bf(mm) hf(mm) wf(mm) bw(mm) tw(mm)
200
250
300
500
47 47 20 3.9 8
Figure 4: Cross-section of the model.

18
Table 5 Element types used in FE-modelling.
Part 1 Web Shell Element
Part 2 Flange Solid Element
Part 3 Steel Plate Solid Element Different types of analyses can be used in Abaqus. In this project web buckling and flange splitting will be analyzed. As mentioned above, some of the samples tested were reinforced while others were not. The various models analysed using the FE-software are schematically shown in Figure 5. The splitting load was obtained from the maximum stress in the transverse direction of the flange (out of plane direction in Figure 5). The lowest eigenvalue obtained in the linear buckling analysis is used to determine the ultimate buckling load for web.
Figure 5: Different models analysed with the FE-software.

19
In studying the different modes of failures, parametric study will be performed, i.e. all parameters (necessary to define the model) but one will be kept constant. The parameters that will be considered here are length of the beam (in order to check how large part of the tested beam needs to be included in the analysis), height of flange, height of web, web thickness (at reinforcement), width of flange, contact area of the load and contact area of the support. The purpose is to determine the influence of these parameters on failure load in terms of web buckling and flange splitting. To understand the influence of length of the beam on failure load, the length varied ranging from 800mm to 2000mm with a difference of 200mm, keeping other parameters constant. Similarly the influence of the depth of the beams was checked by varying the beam depth with a difference of 50mm ranging from 200mm to 550mm. The influence of steel plate length was checked both at support and loading position. The steel plate length either at support or loading point varied from 45mm to 150mm with a difference of 15mm, while keeping the other constant. The model consists of three parts, the web, the flange and the steel plates, all with different material properties. The web is modelled with shell elements of homogenous type with Young’s modulus 4500MPa and Poisson’s ratio of 0.3, thus assuming an isotropic material. The flange is taken as an orthotropic material with Young’s modulus of 12 000MPa, 600MPa and 500MPa in the longitudinal, radial and tangential directions respectively. Poisson’s ratio of 0.4 in all directions and shear modulus of 600MPa, 600MPa and 50MPa in the longitudinal-tangential, longitudinal-radial and tangential-radial directions respectively. The steel plate is considered as an isotropic material with Young’s modulus of 210GPa and Poisson ratio of 0.3. The analyses are done in two different steps, where the first is a so-called static (general) step and the second one is a buckling perturbation analysis. There are two interactions between the steel plates and the flanges with small sliding formulation and surface to surface contact is enforced between the steel plates and the flanges. Boundary conditions are applied to the steel plates both at the support and loading positions. The supports are assumed to be fixed in all directions while the loading point is fixed except in the y-direction, to allow downward displacement. A concentrated force is applied as a load in each step at the centre of the steel plate, in the y-direction. The model was meshed with the same global (approximate) element size all over a part. Running the analysis from ABAQUS CAE gives the results. The results consist of a number of eigenvalues from the second step of the analysis, and from the first step the displacements and stresses for the applied reference load are obtained. The eigenvalue obtained from the second step of the analysis gives a load multiplier to calculate the ultimate load for buckling of the web, as stated in theory section. The corresponding stresses (i.e. at buckling) are similarly obtained by multiplication of the eigen value by the stresses obtained in the first step. The load at which splitting occurs is obtained by multiplying the reference load with a factor obtained by dividing the stress at the reference load by the material strength. As can be seen in Figure 5, models A, B, C and D are end support cases. Models B and D are reinforced while models A and C are not. The difference between model A and C is

20
the length of the steel plates at support and loading points. The same is applicable to models B and D. Similarly, models E, F, G and H are inner support cases. Model F differs from Model H in length of reinforcement. Model E is the same as F but without reinforcement. The same is the case of model G and H. Model K is the mid span case, see Table 3. In this study, for beams with the largest geometry and for the end support and inner support cases, the analysis was performed by cutting the length of the beam while in the mid span case, the symmetry was used.

21
6. Analysis of Results
6.1. Experimental results The results from the experiments are summarised in Table 6. In Table 6 the terms FB, FS, WB stand for flange compression, flange splitting and web buckling respectively.
Table 6 :Summary of experimental results
Specim
en
Beam
Dep
th(m
m)
Beam
Length(m
m)
Loading
Plate length at
Supp
ort(mm)
Plate length at
Loading
Point(mm)
Reinforcem
ent
Positio
n of
Reinforcem
ent
Ultimate Load
(KN)
Failure M
ode
A1 200 800 12.8 FS A2 250 1000 13.82 FS, WB, FB A3 300 1200 12.71 WB,FS A4 500 2000
At End support 45 70 No N.A 11.11 FS, WB
B1 200 800 12.58 FS B2 250 1000 14.61 FS, FB B3 300 1200 14.52 FS, FB B4 500 2000
At End Support 45 70 Yes At end 14.12 FS, FB
C1 200 800 18.92 FS, FB, WB C2 250 1000 20.51 FS, WB C3 300 1200 17.65 WB, FS C4 500 2000
at End support 145 145 No N.A 13.22 FS, WB
D1 200 800 19.86 FB, FS D2 250 1000 20.99 FS, WB D3 300 1200 23.55 FS, FB D4 500 2000
at End support 145 145 Yes At end 22.43 FS, FB
E1 200 800 25.46 FB E2 250 1000 24.91 FB, WB E3 300 1200 22.54 FB, WB E4 500 2000
at Inner Support 70 70 No N.A 18.7 WB
F1 200 800 24.6 FB F2 250 1000 28.46 FB F3 300 1200 26.17 FB F4 500 2000
At Inner Support 70 70 Yes
At mid‐span 25.23 FB
G1 200 800 26.48 FB, FS, WB G2 250 1000 24.23 FB, FS, WB G3 300 1200 25.7 FB, FS, WB G4 500 2000
At Inner Support 145 70 No N.A 21.81 FB, WB
H1 200 800 30.74 FB, WB H2 250 1000 35.69 FB, H3 300 1200 35.12 FB, FS H4 500 2000
At Inner Support 145 70 Yes
At mid‐span 33.85 FB, WB
22
K1 200 800 21.15 FB, FS, WB
K2 250 1000 25.2 FS, FB K3 300 1200 24.48 FS, FB, WB K4 500 2000
At Mid span 100 70 Yes
At both ends 21.47 FS, WB, FB
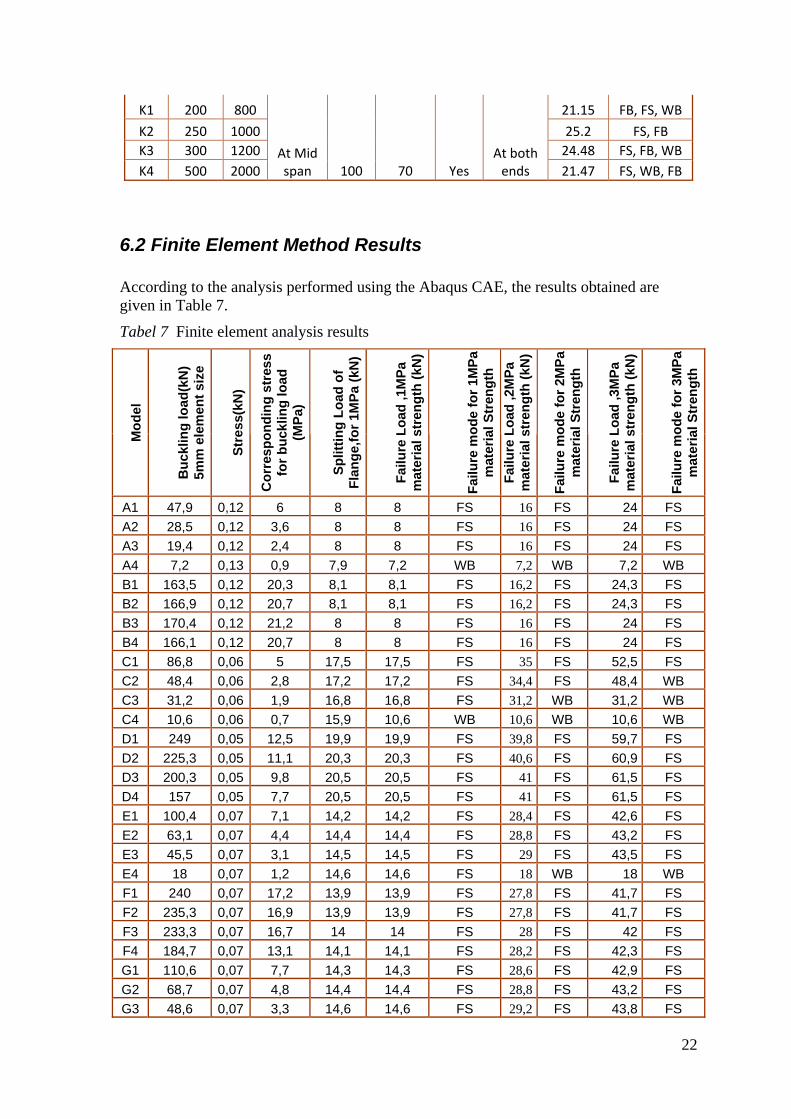
6.2 Finite Element Method Results According to the analysis performed using the Abaqus CAE, the results obtained are given in Table 7.
Tabel 7 Finite element analysis results
Mod
el
Buc
klin
g lo
ad(k
N)
5mm
ele
men
t siz
e
Stre
ss(k
N)
Cor
resp
ondi
ng s
tres
s fo
r buc
klin
g lo
ad
(MPa
)
Split
ting
Load
of
Flan
ge,fo
r 1M
Pa (k
N)
Failu
re L
oad
,1M
Pa
mat
eria
l str
engt
h (k
N)
Failu
re m
ode
for 1
MPa
m
ater
ial S
tren
gth
Failu
re L
oad
,2M
Pa
mat
eria
l str
engt
h (k
N)
Failu
re m
ode
for 2
MPa
m
ater
ial S
tren
gth
Failu
re L
oad
,3M
Pa
mat
eria
l str
engt
h (k
N)
Failu
re m
ode
for 3
MPa
m
ater
ial S
tren
gth
A1 47,9 0,12 6 8 8 FS 16 FS 24 FS A2 28,5 0,12 3,6 8 8 FS 16 FS 24 FS A3 19,4 0,12 2,4 8 8 FS 16 FS 24 FS A4 7,2 0,13 0,9 7,9 7,2 WB 7,2 WB 7,2 WB B1 163,5 0,12 20,3 8,1 8,1 FS 16,2 FS 24,3 FS B2 166,9 0,12 20,7 8,1 8,1 FS 16,2 FS 24,3 FS B3 170,4 0,12 21,2 8 8 FS 16 FS 24 FS B4 166,1 0,12 20,7 8 8 FS 16 FS 24 FS C1 86,8 0,06 5 17,5 17,5 FS 35 FS 52,5 FS C2 48,4 0,06 2,8 17,2 17,2 FS 34,4 FS 48,4 WB C3 31,2 0,06 1,9 16,8 16,8 FS 31,2 WB 31,2 WB C4 10,6 0,06 0,7 15,9 10,6 WB 10,6 WB 10,6 WB D1 249 0,05 12,5 19,9 19,9 FS 39,8 FS 59,7 FS D2 225,3 0,05 11,1 20,3 20,3 FS 40,6 FS 60,9 FS D3 200,3 0,05 9,8 20,5 20,5 FS 41 FS 61,5 FS D4 157 0,05 7,7 20,5 20,5 FS 41 FS 61,5 FS E1 100,4 0,07 7,1 14,2 14,2 FS 28,4 FS 42,6 FS E2 63,1 0,07 4,4 14,4 14,4 FS 28,8 FS 43,2 FS E3 45,5 0,07 3,1 14,5 14,5 FS 29 FS 43,5 FS E4 18 0,07 1,2 14,6 14,6 FS 18 WB 18 WB F1 240 0,07 17,2 13,9 13,9 FS 27,8 FS 41,7 FS F2 235,3 0,07 16,9 13,9 13,9 FS 27,8 FS 41,7 FS F3 233,3 0,07 16,7 14 14 FS 28 FS 42 FS F4 184,7 0,07 13,1 14,1 14,1 FS 28,2 FS 42,3 FS G1 110,6 0,07 7,7 14,3 14,3 FS 28,6 FS 42,9 FS G2 68,7 0,07 4,8 14,4 14,4 FS 28,8 FS 43,2 FS G3 48,6 0,07 3,3 14,6 14,6 FS 29,2 FS 43,8 FS

23
G4 18,7 0,07 1,3 14,6 14,6 FS 18,7 WB 18,7 WB H1 315,5 0,07 22,6 14 14 FS 28 FS 42 FS H2 318,2 0,07 22,8 13,9 13,9 FS 27,8 FS 41,7 FS H3 322,2 0,07 23,1 13,9 13,9 FS 27,8 FS 41,7 FS H4 280,3 0,07 19,6 14,3 14,3 FS 28,6 FS 42,9 FS K1 145,9 0,06 9,3 15,6 15,6 FS 31,2 FS 46,8 FS K2 97,9 0,06 6,3 15,6 15,6 FS 31,2 FS 46,8 FS K3 72,5 0,06 4,7 15,4 15,4 FS 30,8 FS 46,2 FS K4 31,8 0,07 2,2 14,5 14,5 FS 29 FS 31,8 WB
6.3 Graphical presentation of finite element analysis results In the below sections, additional results from parameter studies performed are presented.
6.3.1 End Support
Influence of beam depth on buckling and splitting load without reinforcement for End support
0
10
20
30
40
50
60
0 50 100 150 200 250 300 350 400 450 500 550 600Beam depth (mm)
Pcr(
KN
)
Buckling loadSpilitting load
Figure 6 Influence of beam depth on buckling and splitting load for end-support case

24
Influence of beam length on Buckling and Splitting for beam depth 500mm without reinforcement for End support
0
2
4
6
8
10
0 200 400 600 800 1000 1200 1400 1600 1800 2000 2200
Length of beam (mm)
Pcr (
kN)
Buckling load (kN)Splitting Load(kN)
Figure 7 Influence of beam length on buckling and splitting load for end support case
Infulence of steel plate length on buckling and spliting for 200mm beam depth with reinforcement for End support
0102030405060708090
100110120130140150160170180190200210220230
0 10 20 30 40 50 60 70 80 90 100 110 120 130 140 150 160Steel plate length(mm)
Pcr(
kN)
Buckling LoadSpliting Load
Figure 8 Influence of steel plate length on buckling and splitting load for end support case

25
6.3.2 Inner Support
Infulence of beam depth on buckling and splitting load without reinforcement for Inner support
0
10
20
30
40
50
60
70
80
90
100
0 50 100 150 200 250 300 350 400 450 500 550 600
Beam Depth(mm)
Pcr(
KN
)
Buckling LoadSplitting Load
Figure 9 Influence of beam depth on buckling and splitting load for Inner support case
Influence of beam length on buckling and splitting loads for 200mm beam depth without reinforcement for Inner support
0102030405060708090
100110
0 200 400 600 800 1000 1200 1400 1600 1800 2000 2200
Length of beam (mm)
Pcr (
KN
)
Buckling loadSplitting loads
Figure 10 Influence of beam length on buckling and splitting load for Inner support case

26
Influence of beam length on buckling and splitting load for 500mm beam depth without reinforcement for Inner support
0
10
20
30
0 200 400 600 800 1000 1200 1400 1600 1800 2000 2200
Length of beam (mm)
Pcr (
KN
)
Buckling loadSplitting load
Figure 11 Influence of beam length on buckling and splitting load for Inner support case
Influence of steel plate length on buckling and splitting loads for 200mm beam depth with reinforcement for Inner support
020406080
100120140160180200220240260280300320
0 20 40 60 80 100 120 140 160Steel plate length (mm)
Pcr(
KN
)
Buckling loadSplitting load
Figure 12 Influence of support steel plate length on buckling and splitting load for Inner support case

27
Influence of steel plate length on buckling and splitting loads for 200mm beam depth with reinforcement for inner support
020406080
100120140160180200220240
0 20 40 60 80 100 120 140 160
Steel plate length (mm)
Pcr(
KN
)
Buckling loadSplitting load
Figure 13 Influence of loading steel plate length on buckling and splitting load for Inner support case
6.3.3 Mid Span
Infulence of Beam depth on buckling and splitting load without reinforcement for Mid span
0102030405060708090
100110120130140150
0 50 100 150 200 250 300 350 400 450 500 550 600
Beam Depth(mm)
Pcr(
kN)
Bucklin loadSplitting load
Figure14 Influence of beam depth on buckling and splitting load for Mid span case

28
Infulence of the steel plate length on buckling and splitting for 300mm beam depth with out reinforcement for Mid span
0
10
20
30
40
0 10 20 30 40 50 60 70 80 90 100 110 120 130 140 150 160
Steel Plate length(mm)
Pcr(
kN)
Buckling LoadSplitting Load
Figure 15 Influence of steel plate length on buckling and splitting load for mid span case
Infulence of steel plate length for buckling and spliting for 200mm beam depth with reinforcement for Mid span
0102030405060708090
100110120130140150160170180190200
0 10 20 30 40 50 60 70 80 90 100 110 120 130 140 150 160Steel Plate length(mm)
Pcr(
kN)
Buckling Load
Splitining Load
Figure 16 Influence of steel plate length on buckling and splitting load for mid span case

29
7. Discussion
7.1. Experimental results From the experimental results shown in Table 6 the depth of the beam has a more significant influence on the failure mode due to buckling of web. The higher the depth of beam the lesser is the buckling load. When the web is reinforced, the buckling load increases. Consequently, splitting of the flange is more common in cases where the web is reinforced and where the beam depth is less. The steel plate length influences both the buckling of the web and the splitting of the flange. With the increasing length of steel plate the buckling and splitting load increases in all the cases.
7.2 Finite Element Method Results A wide parametric study, varying the dimensions of section components has been done by FE analysis. The purpose was to determine the influence of these parameters on failure load in terms of web buckling and flange splitting. From the finite element analysis results shown in Table 7 it can be seen that the critical load for buckling decreases as the depth of the beam increases. From Figures 6, 9 and 14 the effect of beam depth on buckling is given. In general, the buckling load diminishes going from the mid span case to the inner support case by about 35%. Going from the inner support case to the end support case, the buckling load diminishes approximately by an additional 45%. The splitting load is more or less constant with varying depth of the beam within the same loading case but differs from case to case. With increasing length of the steel plates the critical load for buckling increases in all cases. From Figure 8, 12 and 15 the effect of length of steel plate on buckling load differs from End Support case to Inner support case with about -35%, from Inner support to Mid span with about 35% and from End support and Mid span with about 12%. The splitting load is more or less constant with varying length of steel plate for End support and Inner support cases but in Mid span case the splitting load increases with the increase in steel plate length. From Figures 7 and 11 it can be seen that the length of the beam has little or no influence on the critical load for buckling of the web and splitting of the flange for the end support and inner support cases. This justifies the use of a smaller beam length in the analyses for beams with largest depth, as stated in the methods section. From the analyses it can be seen that the reinforcement of the web does not have that much influence on the splitting load of the flange but it has, of course, a significant effect on the buckling load for all cases. cf. e.g. Figure 10.

30
7.3 Comparison of experimental and numerical results In establishing the load at which splitting occurs, a choice has to be made regarding the material strength. Thus a number of such choices were made in an effort to obtain as good fit as possible in the comparison between the numerical and experimental results. Note that since two different failure modes are considered here, and since only the splitting mode depends on the choice of material strength value, a different choice of material strength can change the predicted failure mode. Table 8 shows the comparison between the experimental results and the FE-analysis results for different choices of material strength.
Tabel 8 Failure loads (kN) and failure modes as predicted by FE-analyses for different choices of material strength.
Mod
el
Expe
rimen
tal r
esul
t Fa
ilure
Mod
e fo
r ex
perim
ent
FE A
naly
sis
resu
lts
for 1
MPa
Failu
re m
ode
for
1MPa
Mat
eria
l st
reng
th
Expe
rimen
tal /
(FE-
Ana
lysi
s 1M
Pa)
FE A
naly
sis
resu
lts
for 1
,6 M
Pa
Failu
re m
ode
for
1,6M
Pa M
ater
ial
stre
ngth
FE A
naly
sis
resu
lts
for 2
MPa
Failu
re m
ode
for
2MPa
Mat
eria
l st
reng
th
FE A
naly
sis
resu
lts
for 3
MPa
Failu
re m
ode
for
3MPa
Mat
eria
l st
reng
th
A1 12,8 FS 8 FS 1,592 12,9 FS 16 FS 38,7 FS
A2 13,8 FS 8 FS 1,725 12,8 FS 16 FS 38,4 FS
A3 12,7 FS 8 FS 1,588 12,8 FS 16 FS 38,4 FS
A4 9,1 WB 7,2 WB 1,155 7,2 WB 7,2 WB 7,2 WB
B1 12,6 FS 8,1 FS 1,561 12,9 FS 16,2 FS 38,7 FS
B2 14,6 FS 8,1 FS 1,813 12,9 FS 16,2 FS 38,7 FS
B3 14,5 FS 8,1 FS 1,804 12,9 FS 16,2 FS 38,7 FS
B4 14,1 FS 8 FS 1,758 12,8 FS 16 FS 38,4 FS
C1 18,9 FS 17,5 FS 1,079 28 FS 35 FS 84 FS
C2 20,5 FS 17,2 FS 1,194 27,5 FS 34,4 FS 48,4 WB
C3 17,7 WB 16,8 FS 1,051 26,9 FS 31,2 WB 31,2 WB
C4 13,2 WB 15,8 WB 0,836 10,6 WB 10,6 WB 10,6 WB
D1 19,9 FS 19,9 FS 0,996 31,9 FS 39,8 FS 95,7 FS
D2 21 FS 20,3 FS 1,032 32,5 FS 40,6 FS 97,5 FS
D3 23,6 FS 20,6 FS 1,144 32,9 FS 41,2 FS 98,7 FS
D4 22,4 FS 20,5 FS 1,096 32,7 FS 41 FS 98,1 FS
E1 25,5 FB 14,2 FS 1,797 22,7 FS 28,4 FS 68,1 FS
E2 24,9 FB 14,4 FS 1,736 23 FS 28,8 FS 69 FS
E3 22,5 FB 14,5 FS 1,556 23,2 FS 29 FS 69,6 FS
E4 18,7 WB 14,6 FS 1,277 18 WB 18 WB 18 WB
F1 24,6 FB 13,9 FS 1,767 22,3 FS 27,8 FS 66,9 FS
F2 28,5 FB 13,9 FS 2,046 22,3 FS 27,8 FS 66,9 FS

31
F3 26,2 FB 14 FS 1,875 22,3 FS 28 FS 66,9 FS
F4 25,2 FB 14,1 FS 1,793 22,5 FS 28,2 FS 67,5 FS
G1 26,5 FS 14,3 FS 1,853 22,9 FS 28,6 FS 68,7 FS
G2 24,2 FS 14,4 FS 1,678 23,1 FS 28,8 FS 69,3 FS
G3 25,7 FS 14,6 FS 1,765 23,3 FS 29,2 FS 69,9 FS
G4 21,8 WB 14,7 FS 1,489 18,7 WB 18,7 WB 18,7 WB
H1 30,7 FB 14 FS 2,2 22,4 FS 28 FS 67,2 FS
H2 35,7 FB 14 FS 2,558 22,3 FS 28 FS 66,9 FS
H3 35,1 FS 14 FS 2,518 22,3 FS 28 FS 66,9 FS
H4 33,6 FB 14,3 FS 2,348 22,9 FS 28,6 FS 68,7 FS
K1 21,2 FS 15,6 FS 1,356 25 FS 31,2 FS 75 FS
K2 25,2 FS 15,6 FS 1,615 25 FS 31,2 FS 75 FS
K3 24,5 FS 15,4 FS 1,585 24,7 FS 30,8 FS 74,1 FS
K4 21,5 WB 14,5 FS 1,481 23,2 FS 29 FS 31,8 WB The trend of the failure modes from finite element analysis was in relatively good agreement with that of the experiment. In the case of 3 MPa, material strength, the trend is the same except in the cases where the failure mode was flange compression (FB), which is not considered in this study, as shown in Table 8. However, with that choice of material strength, the load levels predicted by the FE-analyses are rather poor. The ratios of experimental results to finite element analysis results ranged from 0.84 to 2.56 with an average of 1.6 when the FE analyses were evaluated based on a 1MPa material strength. Thus, to obtain a better overall estimate, the material strength was set to 1.6 MPa, (i.e. equal to the ratio of experimental results to FE analysis based on 1MPa). The comparison graphs of 1MPa and 1.6MPa material strengths are given in Figure 17 and Figure 18 respectively. It can be seen from figure 17 that the experimental results do not fit to the FE analyses results very well. This might be as a result of several factors not being considered in the finite element analyses, as already mentioned in section 1.3. Especially the web reinforcement with plywood of 19mm thickness nailed to web, may affect the splitting load by providing support to the flange during testing. However, in the FE analyses the web reinforcement is modelled by increasing the thickness of the shell elements, which does not give such support to the flanges. The influence of beam height on the buckling load is assumed to be 1/h in the previously proposed formula but it is estimated to be 1/h2 from the FE analysis results. No clear explanation to this discrepancy has been found, although it might in part be explained by the fact that the empirically fitted expression contains other parameters that might obscure the influence of h.

32
Comparision of Experimental and FE Analysis Results(1MPa material Strength)
0,0
5,0
10,0
15,0
20,0
25,0
30,0
35,0
40,0
0,0 5,0 10,0 15,0 20,0 25,0 30,0 35,0 40,0
Failure Load,Experimental Results Load(kN)
Failu
re L
oad,
FE A
naly
sis
Resu
lts(k
N)
Model A Model BModel CModel DModel EModel FModel GModel HModel Ky=x
Figure 17 Comparison of experimental and FE Analysis results for 1MPa material strength
Comparision of experimental and FE Analysis(For 1.6MPa material strength)
0,0
5,0
10,0
15,0
20,0
25,0
30,0
35,0
40,0
0,0 5,0 10,0 15,0 20,0 25,0 30,0 35,0 40,0
Failure load,Experimental Load(kN)
Failu
re L
oad,
FE A
naly
sis
Resu
lts(k
N)
Model AModel BModel CModel DModel EModel FModel GModel HModel Ky=x
Figure 18 Comparison of experimental and FE Analysis results for 1.6MPa material strength.

33
Comparision of Proposed Design Formula and FE Analysis results for End Support Case
0
2
4
6
8
10
12
14
0 50 100 150 200 250 300 350 400 450 500 550 600
Beam Depth(mm)
Pcr(
kN)
Finite ElementAnalysis ResultProposed DesignFormula
Figure 19 Comparison of Proposed Design formula and FE Analysis results
Comparision of Proposed Design Formula and the FE Analysis result for Inner support or Mid Span case
0
2
4
6
8
10
12
14
16
18
0 50 100 150 200 250 300 350 400 450 500 550 600
Beam Depth(mm)
Pcr(
kN)
Proposed Design FormulaFE Analysis Results
Figure 20 Comparison of Proposed Design formula and FE Analysis results

34
8. Conclusions The bearing capacity of the I-joists can be estimated by FE models, although it is difficult to obtain accurate predictions without calibrating the FE-models to experimental data. This study shows also that steel plate length and length of beam have little or no impact on the splitting and buckling load. The reinforcement of the web does not have any influence on splitting of flange while it has decisive influence on the buckling of web which especially for inner support cases. The buckling load decreases as the depth of the beam increases. The depth of the beam has no impact on the splitting of the flange. The study shows that the influence of depth of the beam on the buckling is 1/h2.

35
9. Literature References Anon., (2001), “Guideline wood I-Joists”, Boston: American Forest & Paper Association Inc. Avik Samanta, Ashwini Kumar (2005), “Distortional buckling in monosymmetric I-beams” Department of Civil Engineering, Indian Institute of Technology Kanpur, India. Bazeos, N. and Xykis, C. (2002) “Elastic Buckling Analysis of 3-D trusses and frames with thin-walled members.” Computational Mechanics 29, 459–470. Springer Verlag. Dinwoodie, J.M. (2000), “Timber, Its Nature and Behaviour”, Boston: Spon Press. EOTA(2000), “Test methods for light composite wood-based beams and columns” European Organization for Technical Approval. Forest & Wood Products Australia, (2007), “I-Beam Design”. Available at: http://www.timber.org.au/NTEP/menu.asp?id=151 [accessed May 31, 2011] Guana, Z.W. and Zhub, E.C. (2009), “Finite element modelling of anisotropic elasto-plastic timber composite beams with openings”, Department of Engineering (Civil), University of Liverpool, UK. Available at: http://www.elsevier.com/locate/engstruct [Accessed April 28, 2011] Moreno, E.N. (2008) “Web bearing and Buckling BS EN 1993-1” NSC Morrisey, G. C., Dinehart, D. W., and Dunn, W., G. (2009), “Wood I-Joists with excessive web openings: an experimental and analytical investigation”. Journal of structural engineering, vol. 135, no 6, pp. 655-665. Pirzada, G. and Chui, Y. H. (2007), “Optimized design of I-joists”, Research report 2007, New Brunswick: University of New Brunswick. Porteous, J. and Kermani, A. (2007), “Structural Timber Design to Eurocode 5”, John Wiley and Sons Ltd. Leichti R.J., Falk, R. H. and Laufenberg, T. L. (1990) “Prefabricated wood Composite I-Beams: A literature review”. Wood and Fiber Science, 2(1), pp. 62-79 SITAC(2011) “Evaluation Report” (Not publically available).
36
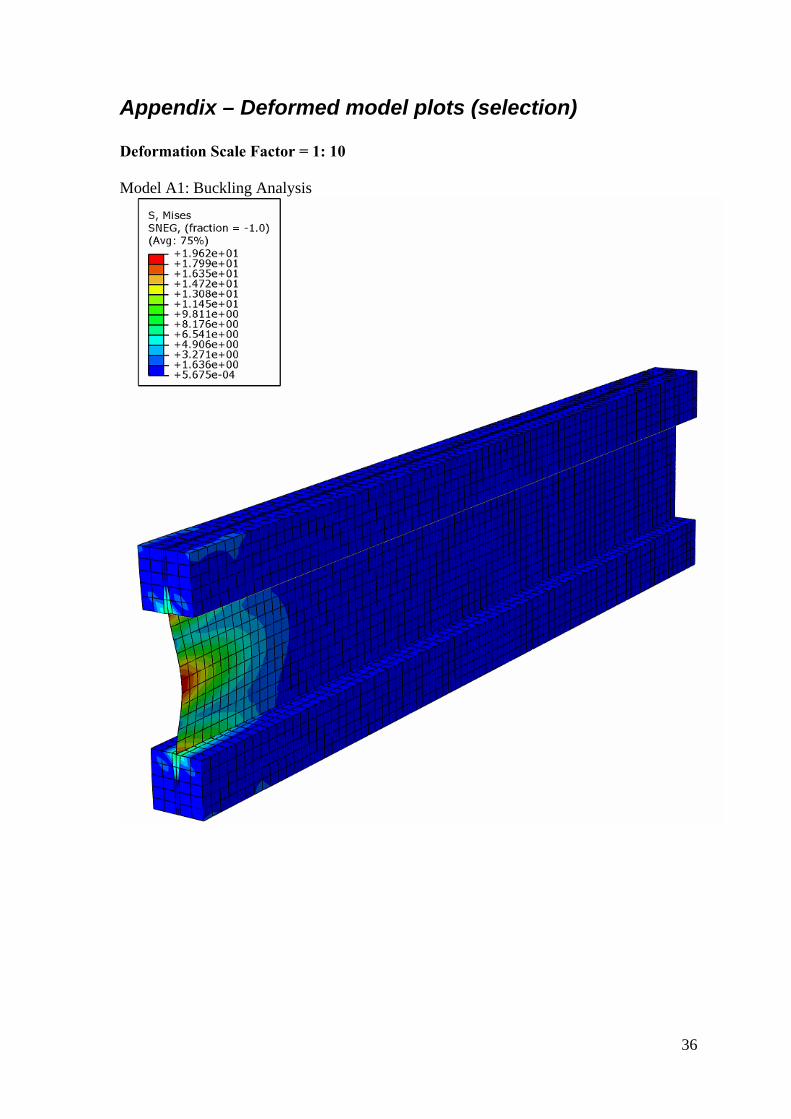
Appendix – Deformed model plots (selection) Deformation Scale Factor = 1: 10 Model A1: Buckling Analysis

37
Model B2: Static (Stress) Analysis

38
Model C3: Buckling Analysis

39
Model D1: Static (Stress) Analysis

40
Model E1: Buckling Analysis

41
Model F1: Static (Stress) Analysis

42
Model G1: Buckling Analysis

43
Model H1: Static (Stress) Analysis

44
Model K1: Buckling Analysis

School of Technology and Design SE- 351 95 Växjö
Sweden Tel: +46 470-70 80 00, fax +46 470-76 85 40
www.lnu.se