bedrock channel geometry along an orographic rainfall gradient...
TRANSCRIPT

Bedrock channel geometry along an orographic rainfall gradient in
the upper Marsyandi River valley in central Nepal
William H. Craddock,1,2 Douglas W. Burbank,1 Bodo Bookhagen,3
and Emmanuel J. Gabet4
Received 7 June 2006; revised 9 March 2007; accepted 31 March 2007; published 25 July 2007.
[1] Pronounced rainfall gradients combined with spatially uniform exhumation of rocks atQuaternary timescales and uniform rock strength make the upper Marsyandi River valleyin central Nepal a useful natural laboratory in which to explore variations in bedrockchannel width. We focus on small catchments (0.6–12.4 km2) along a more than tenfoldgradient in monsoon rainfall. Rainfall data are gathered from a dense weather network andcalibrated satellite observations, the pattern of Quaternary exhumation is inferred fromapatite fission track cooling ages, and rock compressive strength is measured in the field.Bedrock channel widths, surveyed at high scour indicators, scale as a power law functionof discharge (w a Qw
0.38±0.09) that is estimated by combining rainfall data with 90-mdigital topography. The results suggest that power law width scaling models apply (1) toregions with pronounced rainfall gradients, (2) to tributary catchments distributed across aclimatically diverse region, and (3) to large, rapidly denuding orogens. An analysis ofrainfall data indicates that the regional gradient of rainfall during storms that drive erosivedischarge events is about half as large as the gradient of seasonal rainfall across thesame area. Finally, numerical models in which the maximum rainfall is displacedsignificantly downstream from the headwaters predict a midcatchment zone of relativelyrapid decreases in channel gradient and increases in channel concavity that are driven bylocally enhanced discharge. Because differential rock uplift can produce analogouschanges in gradients, the influence of rainfall gradients should be assessed before tectonicinferences are drawn.
Citation: Craddock, W. H., D. W. Burbank, B. Bookhagen, and E. J. Gabet (2007), Bedrock channel geometry along an orographic
rainfall gradient in the upper Marsyandi River valley in central Nepal, J. Geophys. Res., 112, F03007, doi:10.1029/2006JF000589.
1. Introduction
[2] Observations of concurrent late Cenozoic climatechange and uplift of rocks across the globe inspired a debateabout whether rock uplift led to climate change or vice versa[Molnar and England, 1990; Raymo and Ruddiman, 1992].The debates soon gave way to modeling studies investigat-ing geodynamic and surface-process coupling [Howard etal., 1994; Small and Anderson, 1995; Kooi and Beaumont,1996; Willett, 1999]. Within the last 5 years, severalempirical studies have attempted to test some of thepredictions of coupled geodynamic-surface process models[Burbank et al., 2003; Dadson et al., 2003; Reiners et al.,2003; Wobus et al., 2003, 2005]. Mountain river networks
play an integral role in coupling surface processes to geo-dynamics because they route water, delivered as precipita-tion, through a landscape, erode bedrock, and redistributesediment [Howard et al., 1994]. Over geologic timescales(106–108 years), the removal of mass from the top ofactively deforming orogens alters the distribution of stressacross the range [Willett, 1999]. Moreover, rivers set thelocal base level of erosion for adjacent hillslopes, therebymodulating hillslope angles and stability. In rapidly denud-ing landscapes, the rate of river lowering dictates the overallrate of hillslope erosion [Burbank, 2002]. Consequently,knowledge of the characteristics, controls, and processes ofmountain river systems underpins understanding of land-scape evolution [Whipple, 2004].[3] In this study, we combine meteorological records
from the Marsyandi valley in Nepal, detailed measurementsof bedrock channel width, and numerical models in order toaddress three problems concerning the geometry of moun-tain river channels and the evolution of rapidly denudingorogenic landscapes characterized by pronounced rainfallgradients. First, we examine spatial changes in bedrockchannel width across a more than tenfold rainfall gradient.Most recent studies that assessed the width of bedrockchannels as a function of discharge [Montgomery and Gran,
JOURNAL OF GEOPHYSICAL RESEARCH, VOL. 112, F03007, doi:10.1029/2006JF000589, 2007ClickHere
for
FullArticle
1Department of Earth Science, University of California, Santa Barbara,Santa Barbara, California, USA.
2Now at Department of Geosciences, Pennsylvania State University,University Park, Pennsylvania, USA.
3Department of Geological and Environmental Sciences, StanfordUniversity, Stanford, California, USA.
4Department of Environmental Science, University of California,Riverside, Riverside, California, USA.
Copyright 2007 by the American Geophysical Union.0148-0227/07/2006JF000589$09.00
F03007 1 of 17

2001; Snyder et al., 2003a; Duvall et al., 2004; Wohl et al.,2004] did so in regions with subdued or poorly knownspatial gradients in rainfall. With a focus on small tributarycatchments, we find systematic, discharge-related changesin width, such that narrower channels in drier areas effec-tively focus the erosive power of rivers onto a smaller areaof the channel bed, tending to increase the rate of verticalfluvial incision.[4] Second, in the context of a simple stream power
model, we compare spatial patterns of erosion driven by(1) individual storms and (2) rainfall averaged over severalyears. The pronounced gradient in annual monsoon rainfallacross the Marsyandi valley has led past researchers topredict corresponding large gradients in erosion rates[Burbank et al., 2003]. Given that moderate to large floodsgenerally do the bulk of the geomorphic work [e.g., Leopoldand Maddock, 1953], spatial gradients in the magnitude andfrequency of such large events are more likely than averageseasonal rainfall to control landscape evolution [e.g., Gabetand Dunne, 2003]. Thus the erosion of a landscape shouldbe set by the distribution of large storms and not averagerainfall. Nonetheless, in many studies of mountainousregions for which climatic data are available, annual orseasonal averages are used to characterize spatial variationsin rainfall [e.g., Reiners et al., 2003] and hence bothdischarge and stream power. In this study, we use rainfallrecords, typically 5 or 6 years long, with half hourly data at18 sites from the Marsyandi valley to investigate thedistribution of rainfall during storms in the centralHimalaya. We show that, during 5-day storms that recur1–5 times per year, spatial gradients in rainfall are abouthalf as large as those found for average monsoon rainfall.This difference suggests that apparent contrasts across theHimalaya in predicted erosion as a function of stream powerare not as great as previously described [e.g., Burbank et al.,2003].[5] Third, we examine the theoretical impact on longitu-
dinal river profiles of a rainfall maximum that is displacedsignificantly downstream of the catchment headwaters.Previous work has explored river longitudinal profiles inthe context of rainfall that either increases or decreasestoward the headwaters of catchment [Roe et al., 2002,2003]. In large orogens, rainfall maxima tend to correlatewith thresholds in topographic relief and can be displacedmany kilometers upwind of drainage divides [Roe et al.,2003; Anders et al., 2006; Bookhagen and Burbank, 2006].Using idealized catchments and rainfall distributions fromthe Himalaya, we predict a rapid decrease in the slope of thetrunk stream in and around the zone of maximum precip-itation. Whereas such a trend might be interpreted to resultfrom differential rock uplift or variations in rock strength[Snyder et al., 2000; Kirby et al., 2003; Duvall et al., 2004],our results show that these changes can also derive solelyfrom rainfall gradients.
2. Marsyandi Valley Field Area
[6] The Marsyandi River is a transverse river that flowsperpendicular to the strike of the Himalaya (Figure 1). Theheadwaters are located on the southern margin of theTibetan Plateau, which is composed of Paleozoic andMesozoic sedimentary rocks and low-grade metasedimen-
tary rocks [Hodges et al., 1996; Searle and Godin, 2003](Figure 1a). Downstream, the river crosses two strands ofthe South Tibetan Detachment Fault (STD): one which isrepresented by the Chame Detachment and the other by thePhu Detachment (PD) in the eastern part of the study area(Figure 1a). The latter circumscribes a large portion of theNar drainage basin [Searle and Godin, 2003] (Figure 1b).After crossing the STD, the Marsyandi cuts the Proterozoicand lower Paleozoic Greater Himalayan Sequence (GHS)and is flanked to either side by 8000-m peaks. The GHS issubdivided into three units: the lowest unit, Formation I, is amicaceous gneiss; the middle unit, Formation II, is acalcareous gneiss; and the highest unit, Formation III; isan augen gneiss [Searle and Godin, 2003]. Finally, aftercrossing the Main Central Thrust (MCT), the Marsyandiflows through the Lesser Himalayan Sequence (LHS) andthen joins the Trisuli River. The MCT was originallymapped on the basis of lithologic and metamorphic faciescriteria [Colchen et al., 1986]. In the Marsyandi region, theMain Central Thrust was active from the Oligocene to theMiocene [Searle and Godin, 2003]. Subsequently, majorthrusting was transferred into the Lesser Himalaya in themiddle to late Miocene. Geomorphic, structural, and ther-mochronologic evidence, however, suggest Quaternary de-formation on the Main Central Thrust [Huntington et al.2006; Blythe et al., 2007] and in its proximal footwall[Wobus et al., 2003, 2005; Hodges et al., 2004]. Evidencefor post-Miocene deformation has prompted some to definea second, more southerly Main Central Thrust II (Figure 1b)[Searle and Godin, 2003]. Diverse and highly fracturedmetasedimentary rocks crop out in the LHS, dominantlyschist and quartzite. Apatite fission track (AFT) coolingages [Burbank et al., 2003; Blythe et al., 2007] have beeninterpreted to reflect rapid and generally spatially uniformrates of exhumation during the last 1 Ma from the MCT tothe Phu Detachment (Figure 2b). Increasingly old AFT agesare found to the south of the MCT (Figure 2b).[7] A weather network consisting of 18 stations measur-
ing rainfall half hourly was in place from 1999 to 2003 withmore limited data from 2004 in and near the Marsyandidrainage basin [Barros et al., 2000]. Roughly three quartersof the total annual rainfall at any given station falls duringthe monsoon. Limited data suggest that rainfall totals in thesouthern margin of the study area are �1.0 m during thesummer monsoon months (June–September) (Figure 2c).As moist air is orographically lifted at the High Himalayantopographic front, mean annual monsoon rainfall abruptlyincreases to �3.5 m at an average elevation of �2000–3000 m. A key feature of the orographic gradient is that therainfall maximum is offset to the south of the crest of theHimalaya by �15 km (Figure 2c). North of the rainfallmaximum, rainfall steadily decreases to �0.3 m per mon-soon. Thus monsoon rainfall totals decrease by over anorder of magnitude over �30 km distance. If the fissiontrack ages across the Greater Himalaya [Blythe et al., 2007]can be viewed as a proxy for long-term erosion rates, thenthe absence of a significant south-to-north gradient incooling ages stands in sharp contrast to the pronouncedrainfall gradient across the same area (Figure 2). Thisapparent decoupling of patterns of modern rainfall fromgradients in long-term erosion [Burbank et al., 2003] poses
F03007 CRADDOCK ET AL.: CHANNEL WIDTH ALONG RAINFALL GRADIENT
2 of 17
F03007

a challenge to models and interpretations in which rainfalland erosion rates are correlated [e.g., Reiners et al., 2003].[8] A network of 10 stream gauges provides water
discharge data along the Marsyandi and for a few tributar-ies. For most of the year, the discharge at each station is low.Discharge increases as the monsoon begins to intensify inMay, maximizes during the monsoon months of June–September, and, beginning in October and November,tapers to winter base flow levels. About 1–10 times duringthe monsoon season, discharges �50% larger than meanmonsoon flows occur. Such events typically correspond toconsecutive rainy days. In relatively small catchments,storms cause more pronounced discharge spikes than inlarger catchments.[9] Numerous small catchments (<30 km2) drain the
slopes adjacent to the Marsyandi. Hillslopes throughoutthe landscape are steepened to critical angles for failure[Burbank et al., 1996] as indicated by abundant fieldevidence of bedrock landslides [Gabet et al., 2004b] andcorrelations of hillslope angles with rainfall amounts [Gabetet al., 2004a]. On the basis of 90-m SRTM and DTEDdigital elevation models (DEMs), an analysis of channelsegments �500 m long in 3–20 km2 catchments demon-strates that the channels are very steep, with reach-averageslopes commonly �0.35 m/m [Burbank et al., 2003]. Thechannels are bedrock or mixed bedrock-alluvial, and at low
flow are most commonly mantled with a sediment veneerranging from sand to boulders. Whereas erosion at Quater-nary timescales appears rather uniform across the breadth ofGreater Himalaya [Burbank et al., 2003], tributaries to thisstretch of the Marsyandi receive strikingly differentamounts of monsoon rainfall, making the upper MarsyandiRiver valley an intriguing location, well suited for a study ofchannel geometry along a climate gradient.
3. Erosion and Scaling in Bedrock Rivers
[10] In some natural settings, the suite of processesresponsible for eroding bedrock channels may be repre-sented by models based on unit stream power [Howard etal., 1994; Hancock et al., 1998; Whipple and Tucker, 1999;Whipple et al., 2000]. In its simplest expression, the stream-power model states that rates of bedrock river incision (E)are linearly related to stream power per unit area of channelbed using the following expression:
E ¼ krgQS=w; ð1Þ
where k is a coefficient related to the erodibility of thesubstrate, r is the density of the water in the river channel, gis gravitational acceleration, Q is the discharge of thechannel, S is the channel slope, and w is channel width. This
Figure 1. (a) Geologic map of Annapurna region after Brewer et al. [2006] and Searle and Godin[2003]. Study area shown in box. PD, Phu Detachment; CD, Chame Detachment; MCT, Main CentralThrust. (b) Marsyandi catchment with locations of weather stations (stars), channel width measurementsites (boxes), and rock strength measurement sites (circles). Numbers inside black circles/white boxesindicate the number of rock strength measurement sites/channel width measurement sites in the area. Nar,Khudi, and upper Marsyandi catchment and the towns of Khudi and Chame are shown.
F03007 CRADDOCK ET AL.: CHANNEL WIDTH ALONG RAINFALL GRADIENT
3 of 17
F03007

model is often simplified by subsuming the constants, k, r,and g into one constant, K, and by expressing w as afunction of Q [Leopold and Maddock, 1953]. By addingexponents, m and n, to the discharge and slope termsrespectively, the assumption that river incision is related tounit stream power can be relaxed, and the commonlyapplied model for river incision is obtained,
E ¼ KQmSn: ð2Þ
[11] In landscape-scale fluvial studies that are relevant toorogenic evolution, several assumptions are typicallyemployed to facilitate estimates of the erosive role of rivers.Width is assumed to scale as a power of discharge,
w ¼ kwQb; ð3Þ
where kw and b are empirical constants. In alluvial channelsand in varying climatic regimes, b is typically �0.5[Knighton, 1998, and references therein]. Because dischargein individual rivers is poorly known in many landscapestudies, discharge is commonly expressed as a function ofupstream drainage area, A, such that
Q ¼ kqAc; ð4Þ
where kq and c are empirical constants. For drainage basinswith limited orographic effects and homogeneous vegeta-
tion, the value of c is assumed to be �1, and kq is assumedto be uniform on a regional scale, such that discharge anddrainage area are linearly related and roughly interchange-able [Knighton, 1998; Snyder et al., 2003a]. Most recentstudies that assessed the width of bedrock channels as afunction of discharge [Montgomery and Gran, 2001; Snyderet al., 2003a; Duvall et al., 2004; Wohl et al., 2004] did soin regions with subdued or poorly known spatial gradientsin rainfall, such that it was reasonable and/or necessary touse A as a proxy for Q. In individual, small drainage basins(<15 km2), such as those studied here, orographic rainfallgradients are commonly modest, and c may be �1.However, kq cannot be the same for two nearby catchmentsdraining an equal area, but receiving strikingly differentamounts of rainfall. Moreover, in larger catchments draining100s to 1000s km2 and displaying pronounced rainfallgradients, the value of c will depart from 1. Given thereasonable expectation that drainage area and discharge arenot related linearly in the Himalaya and high-resolutionrainfall measurements, we compare width to discharge inthis study.
4. Methods
4.1. Field Methods
[12] The texture of an orogenic landscape requires that alarge portion of the total erosion occurs within smalldrainage basins. Therefore river incision laws should be
Figure 2. Data for cross-Himalaya transect oriented 15�E through the study area. (a) Mean Schmidthammer measurements with 1s errors plotted against topography and main lithotectonic zones.(b) Apatite fission track cooling ages [Blythe et al., 2007] plotted above maximum, minimum, and meantopography along a 15� trend. (c) Mean annual monsoon rainfall (dots) plotted above maximum, mean,and minimum topography along a 15� trend. Error bars on rainfall are 1s and greater error bars reflectgreater seasonal variations. GHS, Greater Himalayan Sequence; LHS, Lesser Himalayan Sequence; TSS,Tibetan Sedimentary Series; PD, Phu Detachment.
F03007 CRADDOCK ET AL.: CHANNEL WIDTH ALONG RAINFALL GRADIENT
4 of 17
F03007

calibrated to small basins. We restricted our channel-widthmeasurements to sites in tributary catchments drainingbetween 0.6 and 12.4 km2. Following Montgomery andGran [2001], width measurements were made at the highestlevel on the channel margin showing evidence of recentscour, commonly indicated by vegetation trimlines, but alsoby sediment trimlines, staining, and/or tool marks. A clearindication of high scour and the nature of the bank were keycriteria for site selection. Although most measurements ofchannel width were made at bedrock sites, some mixedbedrock-alluvial sites were included if the bank materialappeared to be stationary on timescales much greater thanthe mean annual flood. Thus, where boulders exceeded�3 m diameter on one bank and the other wall was bedrock,the channel was considered as a bedrock channel. At each of71 sites, 3–4 channel width measurements were made witha laser range finder and/or a tape measure. Width measure-ments at a site were generally reproducible to within 10 cm.At each site, 2–3 longitudinal river profiles were surveyedalong the water surface, usually over a distance of �2–10channel widths, such that each profile contains �20–50points and its upstream and downstream limits are definedby breaks in channel slope. The survey points were pro-jected onto a line and a linear regression was used to definechannel gradient. For a few sites, a hand inclinometer wasused to measure slope.[13] In order to constrain spatial variations in rock
strength, rock compressive strength was quantified with aSchmidt hammer on relatively unweathered bedrock surfa-ces at channel-width sites and other outcrops, generallysteep cliff faces. Individual measurements returning values<10 R probably indicate highly weathered or fractured rockand were discarded. Consequently, intact, but weak rockwas not measured with this method. At each site, 40 mea-surements were made at 10- to 20-cm intervals, along4 transects containing 10 measurements each.
4.2. Uncertainty in Channel Width Measurements
[14] The validity of channel-width measurements is af-fected by measurement error, along-channel width variabil-ity, and uncertainties about the reference discharge. Giventhat laser-ranger measurements are reproducible to �10 cmand channel width measurements were 1–10 m, we estimatethe measurement error to be <10% for a single cross-channel profile. Given the diverse width-depth ratios ofmountain rivers [Montgomery and Buffington, 1997], wetried to reduce uncertainties by avoiding pools, choosing
reaches of relatively uniform width, and making replicatemeasurements. The mean standard deviation for 3–4 widthprofiles at a site is 12%. Uncertainty also results from thedifficulty of defining a reference discharge, such as themean annual flood, at which to measure bedrock channelwidth [Montgomery and Gran, 2001]. Unfortunately, find-ing an indication of a flow with a known return time isexceedingly difficult in ungauged bedrock rivers. In order toassign an uncertainty to discharges that formed channelscour lines, we use an empirical relationship for at-a-stationchannel width derived from gauged rivers to estimate thewidth of the largest and smallest flood likely to set observedhigh scour marks. At-a-station channel width (wa) is mod-eled by the following:
wa ¼ kaQa; ð5Þ
where ka and a are empirical constants. The maximum valueof a is 0.26 for alluvial channels [Knighton, 1998, andreferences therein]. Given that bedrock rivers should havesmaller widths due to greater bank strength, we considerthis exponent to be an upper limit on width estimates thatmaximizes the sensitivity of width to discharge. At threesites, we calculate the width of the largest event likely toestablish high scour indicators using the maximumdischarge for 2001–2002. The 2001 and 2002 monsoonseasons are selected because they are they only years forwhich complete discharge data are available at two of thethree sites. The calculation is done for two catchmentssimilar in size to those measured for width scaling, Danaqueand Temang (6 and 19 km2 respectively), and a largercatchment, Khudi (130 km2) (Figure 1). Given the rapidlygrowing vegetation and consistent summer rainfall in Nepal,most of our indicators of high scour are likely to have beenestablished within the last 2–3 years, such that it isreasonable to use this 2-year discharge record. Thedischarge with a return time of three weeks during themonsoon is used to estimate the width of the smallest eventlikely to establish a high scour mark. The selection of the3-week discharge is somewhat arbitrary, but given theobserved frequency of high discharges (�10 events/monsoon season: see below), this defines an acceptablelower boundary. We estimate a 10–20% difference inwidth between the large and small discharge events(Table 1). Because this is the largest source of error, weassign a 20% total uncertainty to channel widthmeasurements.
4.3. Estimating Discharge
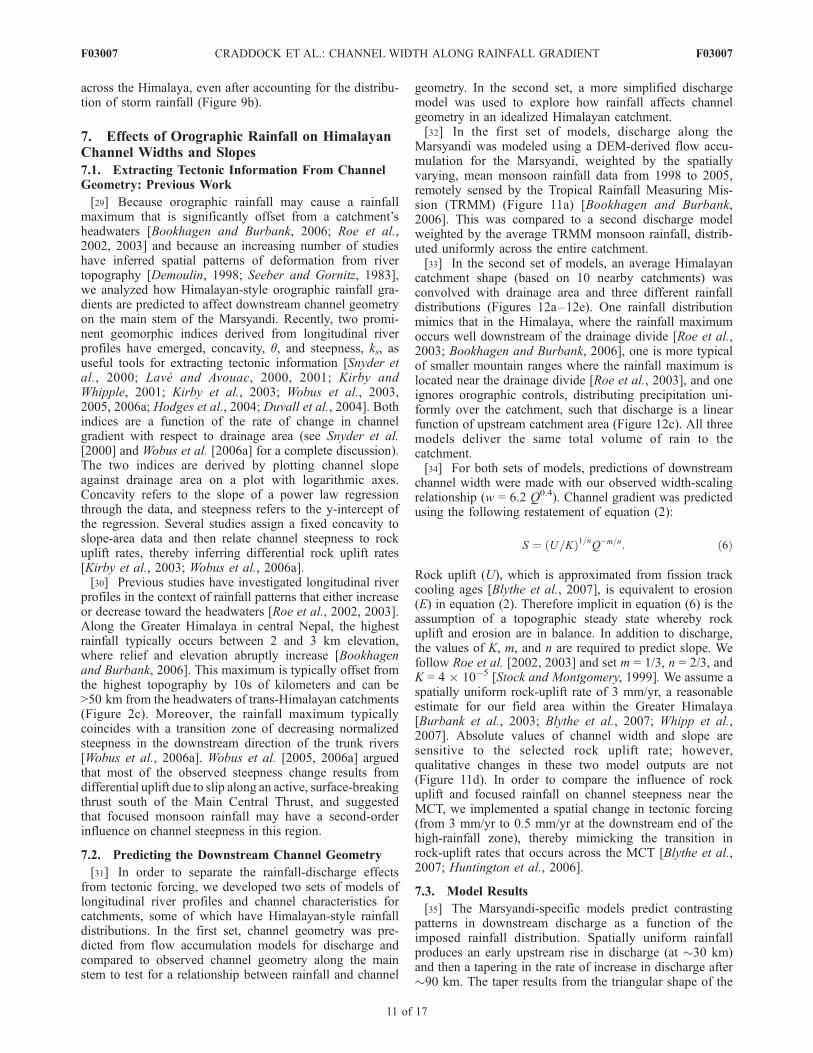
[15] Although discharge data are available at 10 gaugingstations in the Marsyandi catchment, only two were onsmall tributaries of the size studied for width variations.Given that variation in bedrock channel width is more likelyrelated to discharge than drainage area, we developed amethod for estimating average monsoon discharge at achannel-width measurement site based on point rainfalldata. First, the correlation between rainfall and dischargewas verified in the Khudi catchment using data from a densenetwork of 9 weather stations in the 130 km2 catchment andfrom a stream gauge at the outlet. Half-hourly rainfall datawere initially converted to daily rainfall data which werethen areally averaged using a Thiessen weighted average
Table 1. Smallest and Largest Floods Likely to Set High Scour
Marks in the Marsyandi Valleya
Temang Danaque Khudi
Q3 week, m3/day 480000 130000 6500000
Q2 year, m3/day 670000 190000 17000000
Q3 week/Q2 year 0.72 0.68 0.38Q3 week
0.26/Q2 year0.26 0.92 0.90 0.78
aThe 3-week monsoon season and 2-year flood are used as estimates ofthe smallest and largest events likely to set high scour marks in a channel.The magnitude and channel width of the two floods are compared for threerivers: the Temang Khola (19 km2), the Danaque Khola (6 km2), and theKhudi Khola (130 km2).
F03007 CRADDOCK ET AL.: CHANNEL WIDTH ALONG RAINFALL GRADIENT
5 of 17
F03007
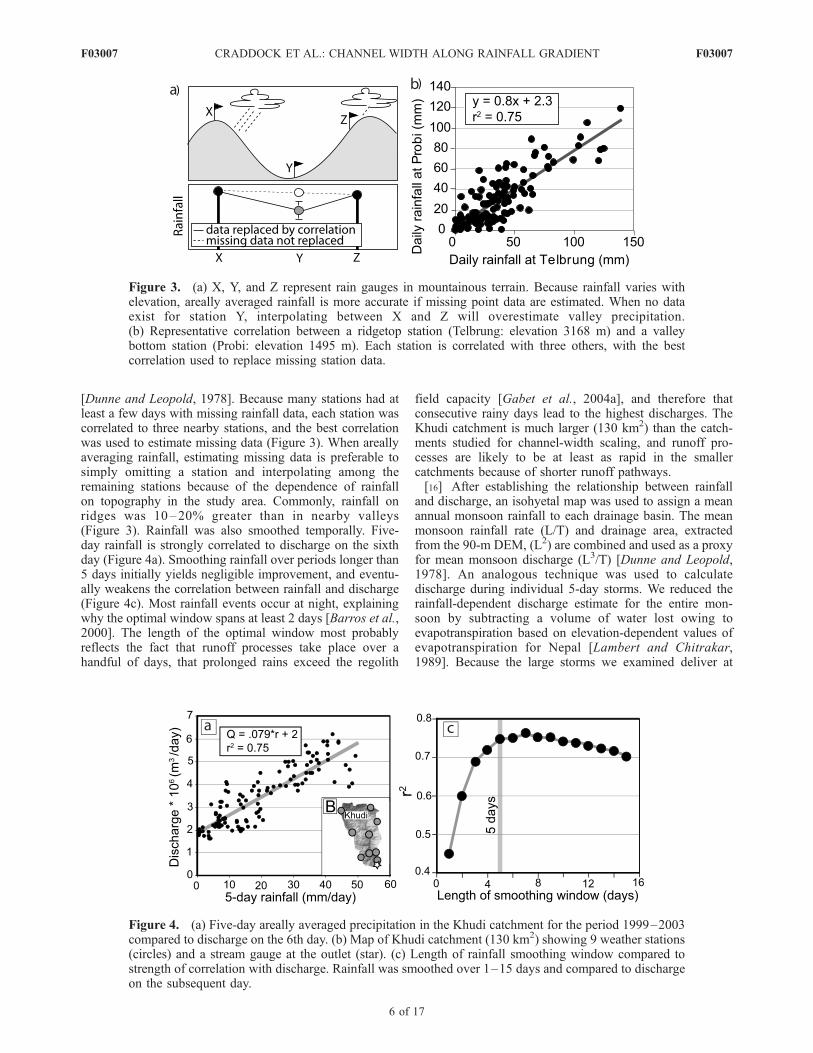
[Dunne and Leopold, 1978]. Because many stations had atleast a few days with missing rainfall data, each station wascorrelated to three nearby stations, and the best correlationwas used to estimate missing data (Figure 3). When areallyaveraging rainfall, estimating missing data is preferable tosimply omitting a station and interpolating among theremaining stations because of the dependence of rainfallon topography in the study area. Commonly, rainfall onridges was 10–20% greater than in nearby valleys(Figure 3). Rainfall was also smoothed temporally. Five-day rainfall is strongly correlated to discharge on the sixthday (Figure 4a). Smoothing rainfall over periods longer than5 days initially yields negligible improvement, and eventu-ally weakens the correlation between rainfall and discharge(Figure 4c). Most rainfall events occur at night, explainingwhy the optimal window spans at least 2 days [Barros et al.,2000]. The length of the optimal window most probablyreflects the fact that runoff processes take place over ahandful of days, that prolonged rains exceed the regolith
field capacity [Gabet et al., 2004a], and therefore thatconsecutive rainy days lead to the highest discharges. TheKhudi catchment is much larger (130 km2) than the catch-ments studied for channel-width scaling, and runoff pro-cesses are likely to be at least as rapid in the smallercatchments because of shorter runoff pathways.[16] After establishing the relationship between rainfall
and discharge, an isohyetal map was used to assign a meanannual monsoon rainfall to each drainage basin. The meanmonsoon rainfall rate (L/T) and drainage area, extractedfrom the 90-m DEM, (L2) are combined and used as a proxyfor mean monsoon discharge (L3/T) [Dunne and Leopold,1978]. An analogous technique was used to calculatedischarge during individual 5-day storms. We reduced therainfall-dependent discharge estimate for the entire mon-soon by subtracting a volume of water lost owing toevapotranspiration based on elevation-dependent values ofevapotranspiration for Nepal [Lambert and Chitrakar,1989]. Because the large storms we examined deliver at
Figure 3. (a) X, Y, and Z represent rain gauges in mountainous terrain. Because rainfall varies withelevation, areally averaged rainfall is more accurate if missing point data are estimated. When no dataexist for station Y, interpolating between X and Z will overestimate valley precipitation.(b) Representative correlation between a ridgetop station (Telbrung: elevation 3168 m) and a valleybottom station (Probi: elevation 1495 m). Each station is correlated with three others, with the bestcorrelation used to replace missing station data.
Figure 4. (a) Five-day areally averaged precipitation in the Khudi catchment for the period 1999–2003compared to discharge on the 6th day. (b) Map of Khudi catchment (130 km2) showing 9 weather stations(circles) and a stream gauge at the outlet (star). (c) Length of rainfall smoothing window compared tostrength of correlation with discharge. Rainfall was smoothed over 1–15 days and compared to dischargeon the subsequent day.
F03007 CRADDOCK ET AL.: CHANNEL WIDTH ALONG RAINFALL GRADIENT
6 of 17
F03007

least a few tens of millimeters of rainfall per day and�3.5 mm/day of rainfall is lost to evapotranspiration, nocorrection was made for evapotranspiration when estimatingdaily discharge from 5-day rainfall.
5. Results
5.1. Monsoon Rainfall: Seasonal Averages and Storms
[17] Fluvial geomorphic work is ultimately driven byprecipitation. The arithmetic average of monsoon rainfallvaries by over an order of magnitude along the upperMarsyandi River valley for the 5- or 6-year monitoringperiod (Figure 2c). The standard deviation in monsoonalrainfall at a site is, on average, 20% of the total monsoonrainfall.[18] Given that channel-forming discharges most likely
occur during moderate to large storms [e.g., Leopold andMaddock, 1953; Snyder et al., 2003b], we also investigatedthe spatial distribution of rainfall during large storms. As aproxy for discharge during these storms, rainfall (1) duringthe single storm that delivered the largest total rainfall overa 5-day interval in each of 5 years (i.e., 5 storms in all) and(2) during the five storms that delivered the largest to thefifth-largest 5-day total rainfall in each of 5 years (i.e.,25 storms) was averaged over the length of the record(Figure 5a). One striking result, when viewed across thestrike of the Himalaya, is that the south-to-north gradient ofstorm rainfall varies only by a factor of �4, whereas itvaries at the same stations by a factor of �11 for totalmonsoon rainfall. The standard deviation in annual maxi-mum storm rainfall at a site is, on average, 30%. The data
indicate that large storms penetrate deeper into the moun-tains than do average storms, thereby reducing dischargedifferences across the Greater Himalaya in comparison todifferences based on the mean monsoonal rainfall.[19] We also measured interannual storm variability by
calculating the ratio of the largest to smallest annualmaximum storm at a station over the duration of the rainfallrecord. The resultant ratios increase sharply at the northernmargin of the Marsyandi valley, such that the driest catch-ments are characterized by the most interannual stormvariability (Figure 5b). Additionally, annual maximumseries constructed with over 30 years of annual maximum24-hour storm data from rain gauges at Chame and Khudi(Figure 1b) [Department of Hydrology and Meteorology,1977, 1982, 1984, 1986, 1988, 1997, 1999, 2001, 2002,2005a, 2005b] demonstrate that the rate of increase in stormmagnitude with respect to return time is more rapid in thenorth (Figure 6). Thus the 2-year storm is 4–5 times smallerin the drier region compared to the wetter region, whereasthe 20-year storm is only 2 times smaller.[20] The >30-year record also suggests that rainfall dur-
ing the period from 1999 to 2003 was representative ofrainfall patterns on decadal timescales. For any 5-yearwindow that encompasses a given year and the fourpreceding years, the ratio of the largest to smallest annualmaximum storm between 1971 and 2003 can be comparedto the equivalent ratio from our 1999–2004 network data(Figure 7). At Chame (Figure 1b), where mean monsoonrainfall is �0.8 m, ratios of 24-hour storms in a 5-yearwindow vary from 1.6 to 5.3 with a mean of 3.0 ± 1.2. AtKhudi (Figure 1b), where mean monsoon rainfall is much
Figure 5. (a) Mean of the largest storm in each of 5 years and the mean of the five largest storms in eachof 5 years, 1999–2003, plotted above maximum, mean, and minimum topography along a 15� trendline.Error bars represent 1 standard deviation. (b) Largest annual maximum 5-day storm from 1999 to 2003divided by the smallest annual maximum 5-day storm from the same time period. Also shown is meanannual monsoon rainfall. Hand-drawn thick gray lines highlight the spatial trend in the data.
F03007 CRADDOCK ET AL.: CHANNEL WIDTH ALONG RAINFALL GRADIENT
7 of 17
F03007

higher (�2.8 m), these ratios only vary from 1.2 to 2.5 witha mean of 1.9 ± 0.5. Encouragingly, for the period from1999 to 2003 that coincides with the rainfall data that weexploit in our analysis, year-to-year storm variability hoversnear the 30-year mean for both stations (Figure 7), indicat-ing that our data do not include years with anomalouslylarge or small annual maximum storms. Furthermore, thedata highlight the far greater interannual variability of themost intense rainfall in relatively dry catchments.
5.2. Rock Strength
[21] Channel narrowing may be expected to occur overreaches with stronger rocks because they can support higherwall stresses. Although the Greater Himalayan gneisses inthe study area are considered to have relatively uniformstrength [Lave and Avouac, 2001], Schmidt hammer mea-surements were made in order to assess compressive rockstrength across the study area (Figure 2a). Strength meas-urements (reported in Schmidt hammer units, R) at anygiven site typically vary widely, such that the standarddeviation in at-a-site strength is, on average, 7.5 R in theGreater Himalaya. Despite such variability, average rockstrength across the Greater Himalaya, where most bedrockchannel width measurements were made, is fairly uniform(44.2 ± 4.4 R) (Figure 2b). Rock strength varies more in theTibetan Sedimentary Series (TSS), ranging from 20 to 50 R.For the sites where we made width measurements in theTSS, more than half yielded Schmidt hammer measure-ments equivalent to the Greater Himalayan rocks. Six TSSsites have a mean value of 32.1 R; somewhat lower than inGreater Himalayan rocks. Where studied, the Lesser Hima-layan rocks have mean Schmidt hammer measurements of44.8 ± 8.9 R which are indistinguishable from the GreaterHimalaya. At two Lesser Himalayan channel-width sites,mean rock strength is 30.2 R for foliated schists constitutingthe banks of the channel, and a measured channel at anearby site flows over still weaker rock (17.5 R). The vastmajority of channels measured in this study, however, flow
over rocks with uniform strength to within 10%. Whererock strength is more variable, as in the Tethyan and LesserHimalaya, we expect channel widths to also display greaterreach-scale variation.
5.3. Channel Width
[22] On the basis of measurements at 71 sites, we findthat bedrock channel width scales as a power law functionof mean monsoon discharge with a scaling exponent of 0.38+0.092/�0.094 (2s error) (Figure 8a). When width is scaledby drainage area, a width scaling exponent of 0.33 ± 0.17(Figure 8b) is obtained. The 2s errors on this exponent areconsiderably larger because at any given drainage area, awide range of mean monsoon discharges occur owing torainfall differences between catchments (Figure 8d). For thestudied channels, the estimated average monsoon dischargesspan a factor of �65 (0.02 to 1.3 m3/s), whereas drainageareas span a factor of �20 (0.6–12.4 km2). When stormdischarge is compared to channel width, a similar width-scaling exponent of 0.40 +0.20/�0.17 is obtained(Figure 8c). The 2s errors for channel width versus stormdischarge are greater than for channel width versus meanmonsoonal discharge because of the larger errors associatedwith storm rainfall (Figure 5). Although no statisticallysignificant difference exists among any of the three scalingexponents, the correlation coefficients show notable varia-tion: both storm discharge and mean monsoon discharge aresignificantly better predictors of width than is drainage area(Figure 8).
6. Denudation Rates in the Marsyandi
6.1. Impact of Channel Width on PredictedModern Erosion Rates
[23] In order to estimate how channel characteristicsaffect erosion across the Marsyandi catchment, we createdmaps that use specific stream power as a proxy for modern
Figure 7. Year-to-year variability in annual maximumstorms within a moving 5-year window for two locations,Khudi (1971–2003) and Chame (1978–2003). Each pointrepresents the largest annual maximum 24-hour storm tooccur in 5 years divided by the smallest annual maximum24-hour storm to occur in 5 years. The data reported for anygiven year represent that year and the four previous years.Average annual monsoon rainfall at Khudi is �2.8 m and�0.8 m at Chame. The horizontal lines represent theaverage of each series.
Figure 6. Annual maximum series for 24 hour storms atKhudi (1971–2003) and Chame (1978–2003) Data fromNepalese Department of Meteorology and Hydrology.Average annual monsoon rainfall at Khudi is �2.8 m and�0.8 m at Chame. The rate of increase in storm size withrespect to return time is higher in relatively dry catchments.
F03007 CRADDOCK ET AL.: CHANNEL WIDTH ALONG RAINFALL GRADIENT
8 of 17
F03007

erosion rates. After accounting for bedrock channel widthvariations, an approximately sixfold south-to-north gradientin specific stream power emerges (Figure 9a), although thissame area displays a >11-fold change in monsoon rainfalland relatively uniform channel gradients in small (<20 km2)catchments [Burbank et al., 2003]. Because dischargerelated to individual multiday storms may be more appro-priate for defining specific stream power (Figures 9band 9c), we also model specific stream power during meanannual maximum discharges.
6.2. Probable Channel-Forming Dischargein the Marsyandi Valley
[24] Although we have measured channel widths at recentscour lines, we have no direct proof that the flows thatcreated the scour lines are analogous to those responsiblefor forming and eroding the channel. Instead, we useerosion rate and discharge data to argue that approximatelyannual maximum discharges provide reasonable approxi-mations of the channel-forming flows. Erosion rates of 2–4 mm/yr have been measured at millennial scales [Neimi etal., 2005] and at Ma scales [Blythe et al., 2007;Whipp et al.,2007] in the Khudi River watershed (Figure 1b): a wettributary catchment (�3.5 m rainfall/monsoon) to the Mar-syandi. A time series of water and suspended-sedimentdischarge from this catchment (Figure 10a) displays 1 to10 flooding events per monsoon season with water dis-charge >6 � 106 m3/day. The floods frequently correspondto high sediment discharges, and roughly 2–8 times/yr,sediment discharge exceeds 1 � 104 m3/day. Although thesethresholds are chosen arbitrarily, the key observation is thateach year, �1–10 events that have a similar magnitudetransport most of the sediment through the channel. In theKhudi catchment, the average sediment discharge over the5 years of observation is equivalent to a catchment-averagedlowering rate of �3 mm/yr [Gabet et al., 2004a; Neimi etal., 2005] when estimates of bed load [Pratt-Sitaula et al.,2007] are added to the observed suspended load. Theequivalence between the modern, millennial, and Ma ero-sion rates suggests that today’s high discharges should beproxies for channel-forming events; that is, the channels areadjusted to convey an amount of sediment equal to the long-term sediment load.[25] Despite fewer high-discharge peaks in drier, more
northerly catchments (Figure 10b), the modern sedimentdischarge is equivalent to an erosion rate of �1 mm/yr (E. J.Gabet et al., Modern erosion rates in the High Himalayas ofNepal, submitted to Geomorphology, 2007): a rateapproaching the long-term rate inferred from fission trackdating [Blythe et al., 2007; Whipp et al., 2007]. Hence weargue that, in both wet and dry catchments, modern chan-nels convey sediment loads analogous to long-term loadsand that the observed high-discharge events (1 to 10 peryear) are the same ones that shape the channel. There is noneed to invoke or expect flows significantly larger thanthose observed to represent the appropriate channel-formingevents.[26] For rivers that are eroding into bedrock at rapid rates
(�2 mm/yr), the overall channel erosion is unlikely to bedone by floods larger than those observed nearly every year.Even when Supertyphoon Bilis drenched the rapidly erod-ing (�2 mm/yr) Taroko Gorge in Taiwan, the averagebedrock lowering in the channel was 6–9 mm [Hartshornet al., 2002]. Bilis was 5 times larger than any other storm inthe previous 17 years: an interval over which >35 mm ofbedrock would be predicted to have been eroded from thechannel. Consequently, Hartshorn et al. [2002] inferredthat, in Taiwan, several large floods per year are requiredto sustain or approach the long-term rate of a few mm/yr.We invoke a similar rationale in our Nepalese study: thestorms observed over a 5-year period determine the geom-etry and erosion of the channels that we measured.
Figure 8. (a) Channel width plotted against meanmonsoon discharge. X-error bars are the mean standarddeviation for total monsoon rainfall at a station (20%). Y-error bars are ±20%. (b) Channel width plotted againstdrainage area. X-error bars are 5%. Y-error bars are thesame as Figure 8a. (c) Channel width plotted against annualmaximum discharge. X-error bars are the mean standarddeviation for the annual maximum storm at a station (30%).Y-error bars are the same as Figure 8a. (d) Mean monsoondischarge plotted against drainage area. At any givendrainage area, discharge varies widely owing to spatialpatterns of precipitation. Because of this, width is moreaccurately scaled by discharge than drainage area. Note thatr2 values calculated assuming no error in width anddischarge/drainage area.
F03007 CRADDOCK ET AL.: CHANNEL WIDTH ALONG RAINFALL GRADIENT
9 of 17
F03007

[27] Whereas debris flows are argued to influence, if notcontrol, channel erosion in some steep (0.03–0.10) chan-nels elsewhere [Stock et al., 2005; Stock and Dietrich,2006], we argue that they have a lesser role in the mon-soon-dominated Himalaya. From 1999 to 2004, only 3debris-charged, high-flow events were observed in the 10monitored channels in the Marsyandi valley. Although someflows displaced boulders >2–3 m in diameter, the channelerosion that they caused is unknown. However, as withSupertyphoon Bilis, these infrequent events would have tocause much greater erosion than has been documented forthem elsewhere: �0.1 mm/yr [Stock et al., 2005]. Hence wedeem it unlikely that relatively rare large debris flows can beprimarily responsible for carving steep Himalayan channels.
6.3. Erosion Rates Based on Storm Rainfall
[28] We have previously demonstrated that maximumannual storms show an across-strike gradient in rainfall thatis less than half as large as that of mean monsoon rainfall(Figure 5), and we interpret that �1-year floods are likely todrive geomorphic work. Compared to mean monsoon flows,specific stream power during annual maximum storms ismore uniformly distributed across the Marsyandi catchment(Figure 9b). To compare the map patterns of stream powerquantitatively, we scale the two maps such that sum of allpixels in either map yields the same total stream power.Then an anomaly map is created by subtracting the mon-soon stream power from the normalized storm streampower. The entire northern portion of the catchment ischaracterized by a positive stream-power anomaly (1–17%: Figure 9c), indicating that intense storms penetratefarther into the mountains and reduce the deficit that ispredicted on the basis of average monsoon rainfall in the
drier areas. The southern flank of the Greater Himalaya(near Khudi: Figures 1b and 8) is characterized by astrikingly negative stream-power anomaly (�50 to�16%), again emphasizing the more even distribution ofspecific stream power during annual maximum floods.Nonetheless, a pronounced stream-power gradient persists
Figure 9. (a) Specific stream power (SSP) across the Marsyandi valley for the mean monsoon discharge(m3/s). (b) SSP across the Marsyandi valley for the annual maximum discharge (m3/s). (c) Differencebetween SSP during annual maximum discharge and mean monsoon discharge, showing greater relativestream power (positive anomalies) in the north during large storms. Annual maximum stream power isnormalized to mean monsoon stream power by reducing each pixel in the annual maximum grid by theratio of (1) the sum of all pixels in mean monsoon grid to (2) the sum of all pixels in the annual maximumgrid, such that both grids have equivalent total stream power. The anomaly map is then created bysubtracting mean monsoon stream power from normalized annual maximum stream power. Even afteraccounting for bedrock channel width adjustments and storm rainfall, significant gradients persist inspecific stream power across the Himalaya.
Figure 10. (a) Water and suspended sediment dischargefor the Khudi catchment (130 km2). One to ten floods permonsoon season have water discharge >6 � 106 m3/day andtwo to eight sediment discharge events exceed 1 � 104 m3/day. (b) Water and suspended sediment discharge for theNar catchment (840 km2). One to eight floods per year havewater discharge >6 � 106 m3/day, and zero to one sedimentdischarge events exceed 1 � 104 m3/day.
F03007 CRADDOCK ET AL.: CHANNEL WIDTH ALONG RAINFALL GRADIENT
10 of 17
F03007
across the Himalaya, even after accounting for the distribu-tion of storm rainfall (Figure 9b).
7. Effects of Orographic Rainfall on HimalayanChannel Widths and Slopes
7.1. Extracting Tectonic Information From ChannelGeometry: Previous Work
[29] Because orographic rainfall may cause a rainfallmaximum that is significantly offset from a catchment’sheadwaters [Bookhagen and Burbank, 2006; Roe et al.,2002, 2003] and because an increasing number of studieshave inferred spatial patterns of deformation from rivertopography [Demoulin, 1998; Seeber and Gornitz, 1983],we analyzed how Himalayan-style orographic rainfall gra-dients are predicted to affect downstream channel geometryon the main stem of the Marsyandi. Recently, two promi-nent geomorphic indices derived from longitudinal riverprofiles have emerged, concavity, q, and steepness, ks, asuseful tools for extracting tectonic information [Snyder etal., 2000; Lave and Avouac, 2000, 2001; Kirby andWhipple, 2001; Kirby et al., 2003; Wobus et al., 2003,2005, 2006a; Hodges et al., 2004; Duvall et al., 2004]. Bothindices are a function of the rate of change in channelgradient with respect to drainage area (see Snyder et al.[2000] and Wobus et al. [2006a] for a complete discussion).The two indices are derived by plotting channel slopeagainst drainage area on a plot with logarithmic axes.Concavity refers to the slope of a power law regressionthrough the data, and steepness refers to the y-intercept ofthe regression. Several studies assign a fixed concavity toslope-area data and then relate channel steepness to rockuplift rates, thereby inferring differential rock uplift rates[Kirby et al., 2003; Wobus et al., 2006a].[30] Previous studies have investigated longitudinal river
profiles in the context of rainfall patterns that either increaseor decrease toward the headwaters [Roe et al., 2002, 2003].Along the Greater Himalaya in central Nepal, the highestrainfall typically occurs between 2 and 3 km elevation,where relief and elevation abruptly increase [Bookhagenand Burbank, 2006]. This maximum is typically offset fromthe highest topography by 10s of kilometers and can be>50 km from the headwaters of trans-Himalayan catchments(Figure 2c). Moreover, the rainfall maximum typicallycoincides with a transition zone of decreasing normalizedsteepness in the downstream direction of the trunk rivers[Wobus et al., 2006a]. Wobus et al. [2005, 2006a] arguedthat most of the observed steepness change results fromdifferential uplift due to slip along an active, surface-breakingthrust south of the Main Central Thrust, and suggestedthat focused monsoon rainfall may have a second-orderinfluence on channel steepness in this region.
7.2. Predicting the Downstream Channel Geometry
[31] In order to separate the rainfall-discharge effectsfrom tectonic forcing, we developed two sets of models oflongitudinal river profiles and channel characteristics forcatchments, some of which have Himalayan-style rainfalldistributions. In the first set, channel geometry was pre-dicted from flow accumulation models for discharge andcompared to observed channel geometry along the mainstem to test for a relationship between rainfall and channel
geometry. In the second set, a more simplified dischargemodel was used to explore how rainfall affects channelgeometry in an idealized Himalayan catchment.[32] In the first set of models, discharge along the
Marsyandi was modeled using a DEM-derived flow accu-mulation for the Marsyandi, weighted by the spatiallyvarying, mean monsoon rainfall data from 1998 to 2005,remotely sensed by the Tropical Rainfall Measuring Mis-sion (TRMM) (Figure 11a) [Bookhagen and Burbank,2006]. This was compared to a second discharge modelweighted by the average TRMM monsoon rainfall, distrib-uted uniformly across the entire catchment.[33] In the second set of models, an average Himalayan
catchment shape (based on 10 nearby catchments) wasconvolved with drainage area and three different rainfalldistributions (Figures 12a–12e). One rainfall distributionmimics that in the Himalaya, where the rainfall maximumoccurs well downstream of the drainage divide [Roe et al.,2003; Bookhagen and Burbank, 2006], one is more typicalof smaller mountain ranges where the rainfall maximum islocated near the drainage divide [Roe et al., 2003], and oneignores orographic controls, distributing precipitation uni-formly over the catchment, such that discharge is a linearfunction of upstream catchment area (Figure 12c). All threemodels deliver the same total volume of rain to thecatchment.[34] For both sets of models, predictions of downstream
channel width were made with our observed width-scalingrelationship (w = 6.2 Q0.4). Channel gradient was predictedusing the following restatement of equation (2):
S ¼ U=Kð Þ1=nQ�m=n: ð6Þ
Rock uplift (U), which is approximated from fission trackcooling ages [Blythe et al., 2007], is equivalent to erosion(E) in equation (2). Therefore implicit in equation (6) is theassumption of a topographic steady state whereby rockuplift and erosion are in balance. In addition to discharge,the values of K, m, and n are required to predict slope. Wefollow Roe et al. [2002, 2003] and set m = 1/3, n = 2/3, andK = 4 � 10�5 [Stock and Montgomery, 1999]. We assume aspatially uniform rock-uplift rate of 3 mm/yr, a reasonableestimate for our field area within the Greater Himalaya[Burbank et al., 2003; Blythe et al., 2007; Whipp et al.,2007]. Absolute values of channel width and slope aresensitive to the selected rock uplift rate; however,qualitative changes in these two model outputs are not(Figure 11d). In order to compare the influence of rockuplift and focused rainfall on channel steepness near theMCT, we implemented a spatial change in tectonic forcing(from 3 mm/yr to 0.5 mm/yr at the downstream end of thehigh-rainfall zone), thereby mimicking the transition inrock-uplift rates that occurs across the MCT [Blythe et al.,2007; Huntington et al., 2006].
7.3. Model Results
[35] The Marsyandi-specific models predict contrastingpatterns in downstream discharge as a function of theimposed rainfall distribution. Spatially uniform rainfallproduces an early upstream rise in discharge (at �30 km)and then a tapering in the rate of increase in discharge after�90 km. The taper results from the triangular shape of the
F03007 CRADDOCK ET AL.: CHANNEL WIDTH ALONG RAINFALL GRADIENT
11 of 17
F03007

lower half of the Marsyandi catchment (see inset,Figure 11a). For the orographic rainfall model, the rise indischarge begins farther downstream and is more sustained.Increases in discharge at tributary junctions are muted in theupper part of the catchment and amplified in the lower partof the catchment in the orographic rainfall model comparedto the uniform rainfall model. Model-predicted width andslope follow these discharge trends. We compared themodeled to the observed channel width and slope to assesswhether channel geometry is better predicted after account-ing for orographic rainfall (Figures 11b and 11c). Channelwidth measurements were taken from Lave and Avouac[2001] and based on a variety of topographic data, includingDEMs, SPOT imagery, topographic maps, and air photos.The remotely sensed data were supplemented with fieldmeasurements, made with a laser range finder, from kilo-meter 57 to 102 at �1 km intervals. Downstream slope was
measured from 40-m contour interval topographic maps(Figures 11b and 11c).[36] In the idealized catchments (Figure 12a), Himalayan-
style orographic rainfall distributions are predicted to causepronounced differences in downstream discharge and chan-nel geometry compared to the other modeled rainfall dis-tributions (Figures 12f and 12g). The Himalayan-styleorographic rainfall model induces spatially abrupt changesin discharge, channel width, and gradient as opposed to theother two models (Figures 12f and 12g). Plots of channelgradient against drainage area show that Himalayan-styleorographic rainfall produces a sharp increase in concavity inthe longitudinal river profile in the zone affected by highestrainfall (Figures 12f and 12g). Importantly, steepnessdecreases significantly on the downstream side of the zoneof high concavity by a factor of �2. This change is causedsolely by orographic rainfall and is independent of any
Figure 11. (a) Rainfall-weighted flow accumulation models for discharge on the Marsyandi River. Theblack line is weighted by TRMM data averaged from 1998 to 2005. The gray line is weighted by theaverage of the TRMM data (0.8 m/monsoon). (b) Channel widths (w = 6.2 * Q0.4) compared to observedvalues [from Lave and Avouac, 2001]. The thick gray line shows remotely sensed channel widths and thethick black line shows remotely sensed channel widths smoothed over 5 km. Those data aresupplemented with measurements made in the field (points). (c) The thick black line shows channel slopepredicted by equation (6) using on TRMM rainfall derived discharge. The thick gray line shows channelslope predicted by equation (6) using uniform rainfall derived discharge. Both curves are compared toslope measured from a 40-m topographic map (thin black line). (d) The influence of rock uplift rates onchannel gradient. The black lines show channel slope against drainage area predicted for various rockuplift rates. (e) Absolute value of the difference between observed width and modeled width downstreamof the previously glaciated portion of the valley and upstream of the MCT. The gray and black linesrepresent the average mismatch between observed and modeled widths based uniform rainfall andTRMM rainfall, respectively. (f) Absolute value of the difference between observed channel slope andmodeled channel slope downstream of the previously glaciated portion of the valley and upstream of theMCT. The gray and black lines show the average mismatch between observed and modeled channel slopebased on uniform rainfall and TRMM rainfall, respectively.
F03007 CRADDOCK ET AL.: CHANNEL WIDTH ALONG RAINFALL GRADIENT
12 of 17
F03007
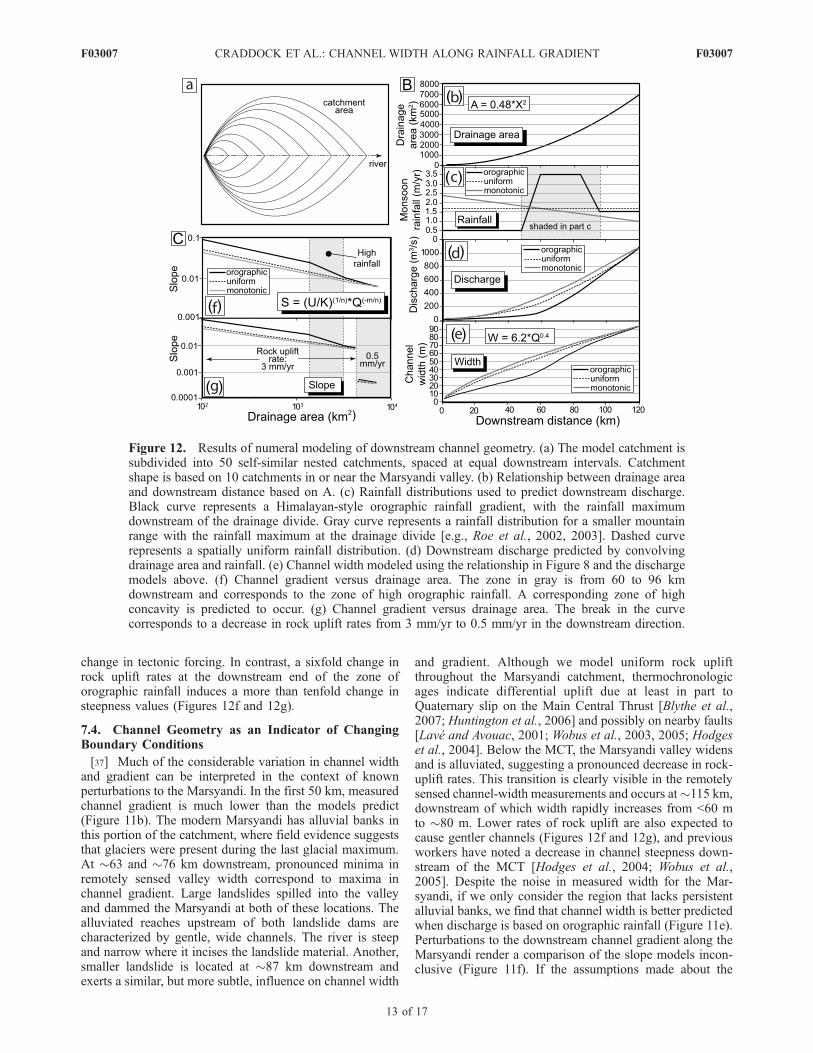
change in tectonic forcing. In contrast, a sixfold change inrock uplift rates at the downstream end of the zone oforographic rainfall induces a more than tenfold change insteepness values (Figures 12f and 12g).
7.4. Channel Geometry as an Indicator of ChangingBoundary Conditions
[37] Much of the considerable variation in channel widthand gradient can be interpreted in the context of knownperturbations to the Marsyandi. In the first 50 km, measuredchannel gradient is much lower than the models predict(Figure 11b). The modern Marsyandi has alluvial banks inthis portion of the catchment, where field evidence suggeststhat glaciers were present during the last glacial maximum.At �63 and �76 km downstream, pronounced minima inremotely sensed valley width correspond to maxima inchannel gradient. Large landslides spilled into the valleyand dammed the Marsyandi at both of these locations. Thealluviated reaches upstream of both landslide dams arecharacterized by gentle, wide channels. The river is steepand narrow where it incises the landslide material. Another,smaller landslide is located at �87 km downstream andexerts a similar, but more subtle, influence on channel width
and gradient. Although we model uniform rock upliftthroughout the Marsyandi catchment, thermochronologicages indicate differential uplift due at least in part toQuaternary slip on the Main Central Thrust [Blythe et al.,2007; Huntington et al., 2006] and possibly on nearby faults[Lave and Avouac, 2001; Wobus et al., 2003, 2005; Hodgeset al., 2004]. Below the MCT, the Marsyandi valley widensand is alluviated, suggesting a pronounced decrease in rock-uplift rates. This transition is clearly visible in the remotelysensed channel-width measurements and occurs at�115 km,downstream of which width rapidly increases from <60 mto �80 m. Lower rates of rock uplift are also expected tocause gentler channels (Figures 12f and 12g), and previousworkers have noted a decrease in channel steepness down-stream of the MCT [Hodges et al., 2004; Wobus et al.,2005]. Despite the noise in measured width for the Mar-syandi, if we only consider the region that lacks persistentalluvial banks, we find that channel width is better predictedwhen discharge is based on orographic rainfall (Figure 11e).Perturbations to the downstream channel gradient along theMarsyandi render a comparison of the slope models incon-clusive (Figure 11f). If the assumptions made about the
Figure 12. Results of numeral modeling of downstream channel geometry. (a) The model catchment issubdivided into 50 self-similar nested catchments, spaced at equal downstream intervals. Catchmentshape is based on 10 catchments in or near the Marsyandi valley. (b) Relationship between drainage areaand downstream distance based on A. (c) Rainfall distributions used to predict downstream discharge.Black curve represents a Himalayan-style orographic rainfall gradient, with the rainfall maximumdownstream of the drainage divide. Gray curve represents a rainfall distribution for a smaller mountainrange with the rainfall maximum at the drainage divide [e.g., Roe et al., 2002, 2003]. Dashed curverepresents a spatially uniform rainfall distribution. (d) Downstream discharge predicted by convolvingdrainage area and rainfall. (e) Channel width modeled using the relationship in Figure 8 and the dischargemodels above. (f) Channel gradient versus drainage area. The zone in gray is from 60 to 96 kmdownstream and corresponds to the zone of high orographic rainfall. A corresponding zone of highconcavity is predicted to occur. (g) Channel gradient versus drainage area. The break in the curvecorresponds to a decrease in rock uplift rates from 3 mm/yr to 0.5 mm/yr in the downstream direction.
F03007 CRADDOCK ET AL.: CHANNEL WIDTH ALONG RAINFALL GRADIENT
13 of 17
F03007

boundary conditions controlling channel geometry (i.e.,rock uplift rates, substrate erodibility, m, and n) are accurate,then this analysis demonstrates the importance of orographicrainfall patterns in setting bedrock channel geometry, inparticular channel width.
7.5. Orographic and Tectonic Influenceson Channel Geometry
[38] Himalayan rainfall patterns, typified by a midcatch-ment zone of intense rainfall, induce a midcatchment zoneof high concavity. The high-concavity zone is similar inappearance to tectonic perturbations in the longitudinal riverprofile but is caused solely by spatial variation in rainfall. Inregions where changes in tectonic forcing are subtle andrainfall gradients are pronounced, it may be very difficult toseparate the two signals. Pronounced changes in tectonicforcing, however, are predicted to be a more importantcontrol on river topography than pronounced rainfall gra-dients, suggesting that even in regions like the Himalaya,river topography may be used to extract tectonic rates. If thetectonic signal in channel geometry is sufficiently strong,then it may be distinguished from rainfall-related perturba-tions by comparing channel slope to discharge, not drainagearea. Such an analysis, however, requires rainfall data with ahigh spatial (<10 km) resolution [e.g., Bookhagen andBurbank, 2006]. Fortunately, such data are becoming in-creasingly available through satellite observations.
8. Discussion
[39] The proposed coupling between geodynamic andsurface processes [Howard et al., 1994; Small and Anderson,1995; Kooi and Beaumont, 1996; Willett, 1999] has broughtthe mountain river network to the forefront of geomorphic
research. Because fluvial incision rates are dependent uponchannel width, the applicability of power law width-scalingrelationships that were developed for alluvial channels is akey unknown for mountain rivers. In light of this, fieldcampaigns have been devoted to calibrating the relationshipbetween downstream channel width in bedrock rivers anddischarge or upstream area [Montgomery and Gran, 2001;Snyder et al., 2000, 2003a; Duvall et al., 2004; Wohl andWilcox, 2004]. Few of these previous studies explicitlyfocused on regions where both rock strength and pro-nounced variations in rainfall were well defined. Moreover,many previous studies of bedrock channel width havefocused on downstream width-scaling relationships withwidth measurements spanning orders of magnitude indrainage area [Montgomery and Gran, 2001; Duvall etal., 2004]. In this study, we have quantified bedrock channelwidth in a large, rapidly denuding orogen across drainagebasins with threshold hillslopes and within which bothlithology and rates of rock exhumation are relatively uni-form, but across which pronounced rainfall gradients areevident. Because tributary catchments do much of thegeomorphic work in a given landscape, we focused onwidth scaling in those smaller catchments. Previous workon catchments of a similar size has demonstrated that acrossan eightfold gradient in rock-uplift rates, a single relation-ship that scales channel width to discharge appears appli-cable [Snyder et al., 2003a]. We have demonstrated that onewidth-scaling relationship can be used to model manycatchments across a region experiencing highly nonuniformrainfall, as long as either discharge or spatial variations inrainfall are known.[40] Recent numerical modeling studies hold that bedrock
channel width is dependent upon both discharge and chan-nel gradient [Finnegan et al., 2005; Wobus et al., 2006b].We expect that, at a given discharge, if the channel steepens,flow will accelerate and the channel will become narrower,and in an active tectonic environment, we might expectsteepening and narrowing as a response to enhanced rockuplift. Recent work in alluvial and bedrock channels cross-ing growing folds [Amos and Burbank, 2007; Lave andAvouac, 2001] suggests that reductions in channel width,without changes in gradient, represent the initial response toincreased rates of rock uplift. If rates of uplift continue toincrease downstream, then a minimum in channel width isapproached, and subsequently the channel gradient mayalso steepen to augment erosive power. In field settingswhere slope has been inversely correlated with width forbedrock rivers, channel slope has been measured overspatial scales on the order of �10 km or more [Duvall etal., 2004; Finnegan et al., 2005]. At similar scales along themain stem of the Marsyandi, channel width and channelgradient do appear to covary in response to major changesin boundary conditions, such as tectonic forcing or thepresence of landslide dams (Figures 11b and 11c). However,at the scale of an individual reach in the small catchmentsthat we surveyed, we found no consistent correlationbetween width and slope (Table 2). Whereas this mightreflect the possibility that width adjustments are enough tomodulate channel erosion, we suspect the absence of asystematic relationship results from inherent noise in widthdata at the reach scale (as in work by Lave and Avouac[2001]). At such limited spatial scales, the internal dynamics
Table 2. Correlations Between Channel Width and Channel Slope
for Selected Discharge Binsa
Discharge, m3/s n Power Law Exponent r2
0.0–0.1 18 0.36 0.340.1–0.2 8 0.084 0.0640.2–0.3 12 �0.016 0.00150.3–0.4 11 �0.017 0.0790.4–0.5 1 n/a n/a0.5–0.6 3 0.88 0.940.6–0.7 9 �0.16 0.0210.7–0.8 0 n/a n/a0.8–0.9 0 n/a n/a0.9–1.0 1 n/a n/a1.0–1.1 5 �0.70 0.411.1–1.2 3 �0.11 0.270.0–1.2 71 �0.20 0.11
aReach average channel width and channel gradient measured at thereach scale were binned by discharge and compared using a power lawregression. In general, almost no correlation between the two variablesexists. Each discharge bin spans 0.1 m3/s of mean annual monsoondischarge. Reach average channel widths and reach-scale channel gradientwere also compared across all discharge bins (see final row). The secondcolumn, labeled ‘n,’ represents the number of measurement sites withineach discharge bin. The third column, labeled ‘power law exponent,’contains scaling exponents for power law regressions between channelwidth and channel gradient. The fourth column, labeled ‘r2, shows thestrength of the correlation between channel width and channel slope for apower law regression.
F03007 CRADDOCK ET AL.: CHANNEL WIDTH ALONG RAINFALL GRADIENT
14 of 17
F03007

of bedrock channels (e.g., pools, riffles, and roughness) andthe character of the substrate control channel geometries,rather than variations in erosion rates. A significantly largernumber of measurements for any given discharge areprobably needed to quantify slope-width-discharge correla-tions at reach scales.[41] The magnitude of channel-forming discharges in
bedrock rivers is not well known and probably differsdepending on at least three factors: channel substratematerial, sediment supply, and basin hydrology. Given theavailable hydrologic and geologic data and the apparentneed to maintain an erosion rate of 2–5 mm/yr across theGreater Himalaya in central Nepal [Blythe et al., 2007;Burbank et al., 2003; Neimi et al., 2005; Whipp et al.,2007], a strong case can be made that channels tend toactively erode their beds at least every other year. To theextent that discharges driven by individual large stormsmodulate channel erosion rates, average annual or seasonalrainfall may not be the most appropriate climatic parameterto compare to exhumation rates [e.g., Burbank et al., 2003;Reiners et al., 2003]. Across the region with uniform ratesof exhumation in the Marsyandi, spatial gradients in specificstream power, as predicted by storms on the order of theannual maximum storm, are less pronounced than thegradient predicted for specific stream power using seasonalrainfall values (Figure 9b). Nonetheless, a striking north-south, storm-driven specific stream-power gradient existsand is broadly consistent with gradients in modern sedimentfluxes, but stands in contrast to the uniform long-termerosion rates across this same area that are inferred fromextensive fission track data [Blythe et al., 2007].[42] The explanation for the absence of a gradient in long-
term erosion rates corresponding to the calculated gradientin specific stream power across the Himalaya may reside inseveral different realms. First, modern or Holocene rainfallpatterns may not mimic the average pattern of rainfall overthe past 1 Ma. Unless the organization of atmosphericsystems (the monsoon) or Himalayan topography and
drainage divides experience a massive change over thisinterval, however, orographic rainfall will always be greateron the southern flank of the range, far south of thecatchment headwaters. Moreover, comparison of modernand past snow lines shows a steeper south-to-north snowline gradient during glacial times [Burbank et al., 2003] andsuggests a more pronounced glacial climatic gradient than atpresent. In comparison to the northern flank of the range,this should consistently enhance fluvial erosion on thesouthern flank. Second, efficient glacial erosion [Hallet etal., 1996] during times of expanded Pleistocene glaciersmight dominate the long-term denudation history in drier,but higher and more heavily glaciated areas, such as thenorth side of the Himalaya. During interglacial times, suchas at present, this effect would be minimized. Third, the roleof bed load in modulating channel erosion [e.g., Sklar andDietrich, 2004] is undefined in these rivers: we have nomodern bed load data. Our sediment discharge data, despitetheir noise and sparse numbers, suggest that suspended-loadconcentrations are greater in drier areas than in wetter ones(Figure 13). If Himalayan rivers are underloaded withrespect to sediment, higher bed loads might drive moreefficient channel erosion in drier areas. Fourth, at high ratesof erosion (>1 mm/yr), closure temperatures that scale withcooling rates [Reiners, 2005] and larger relative uncertain-ties on very young fission track ages introduce increasingamounts of ambiguity into erosion-rate calculations [Whippet al., 2007] and might mask modest spatial variations inrates in the upper Marsyandi catchment. Finally, rainfallmay not be the dominant control on patterns of exhumationin the Marsyandi. Spatially uniform vertical transport ofrocks above a planar, crustal-scale ramp beneath the GreaterHimalaya may be the first-order control on spatial patternsof exhumation [Burbank et al., 2003; Godard et al., 2006].[43] Extracting tectonic information from river topogra-
phy can be a powerful neotectonic tool for understandingspatial patterns of deformation and predicting geologichazards [e.g., Kirby et al., 2003]. The quality of analysesthat depend on geomorphic indices of channel concavityand steepness will only be improved by a more completeunderstanding of the controls on downstream channelgradient. For example, peak monsoon rainfall in the Hima-laya, rather than systematically increasing toward a catch-ment’s headwaters, is persistently offset south of the rangecrest. Such a pattern exerts a first-order control on down-stream discharge and channel geometry which differs mark-edly from catchments for which rainfall gradually increasestoward the headwaters. For catchments with strong oro-graphic rainfall gradients, changes in channel slope andsteepness can be independent of any changes in rock upliftor erosion and may confound attempts to extract reliabletectonic inferences, especially in regions where tectonicgradients are relatively subtle.
9. Conclusions
[44] Whereas spatially uniform rock strength and long-term erosion rates characterize the Greater Himalaya inMarsyandi valley of central Nepal, Himalayan topographycreates pronounced rainfall gradients. Such gradients facil-itate attempts to quantify the influence of rainfall patterns on
Figure 13. Sediment concentration plotted against specificdischarge: total monsoon discharge divided by drainagearea.Analysis is based on 2–5 years of data fromnine differentgauging stations. On average, rivers in wet catchments havelower concentrations of suspended sediment.
F03007 CRADDOCK ET AL.: CHANNEL WIDTH ALONG RAINFALL GRADIENT
15 of 17
F03007

channel width and gradient in the context of an evolvinglandscape.[45] 1. An analysis of small Himalayan catchments
(<15 km2) indicates that the primary control on bedrockchannel width is discharge. No single scaling factor thatrelates catchment area to discharge can be validly applied inregions with pronounced orographic rainfall gradients. Othermethods of modeling discharge, such as using stream gaugesor combining observed or modeled rainfall and drainage area,are preferable.[46] 2. The appropriate value of the width-scaling expo-
nent with respect to discharge is �0.4 in bedrock rivers.This is lower than the commonly accepted exponent inalluvial rivers and suggests that greater bank strength inbedrock rivers causes them to be narrower. This width-scaling exponent can be used to model catchments across aregion, regardless of the amount of rainfall they receive, solong as rainfall or discharge is known and other boundaryconditions remain constant. The width-scaling exponent isvalid across large, rapidly denuding orogenic landscapes.For a given catchment size, bedrock channels are narrowerin drier areas, thereby focusing stream power on a smallerarea of bedrock, Such width adjustments reduce, but do noteliminate, the mismatch between Quaternary exhumationacross the Annapurna Himalaya versus estimated erosionrates that are linearly dependent on modern rainfallgradients.[47] 3. Average seasonal rainfall does not necessarily
mimic the spatial distribution of the storm events that driveerosion. We estimate that events with annual to subannualreturn periods dominate channel erosion in the Himalaya. Incomparison to monsoonal averages, individual large stormevents penetrate farther into the Himalaya and can deliversignificant moisture to normally dry catchments. Annualmaximum storm rainfall varies by a factor of �4 across thestudy area, whereas monsoon rainfall varies by a factor of>10. Gradients in monsoon rainfall may significantly over-predict spatial gradients in erosion rates in the Himalaya.Furthermore, greater interannual variability in maximumannual rainfall intensity is observed in dry catchments.[48] 4. In catchments where the rainfall maximum occurs
downstream of the headwaters, longitudinal river profilescan develop zones of high concavity and changing channelsteepness in direct response to orographic rainfall gradients.Because such changes can be unrelated to variations in ratesof rock uplift or rock strength, they need to be accounted forbefore making interpretations about spatial patterns ofcrustal deformation based on topographic indices. In regionswhere gradients in tectonic rates are sufficiently strongcompared to rainfall gradients, river topography may reli-ably be used to infer differences in rock-uplift rates.
[49] Acknowledgments. This research was funded by NSF grantEAR-9909488. We thank Beth Pratt-Sitaula and Jerome Lave for providingthe empirical data used in Figures 12b–12e and Mike Oskin for GISassistance. We also thank Tank Ojha and the team at Himalayan Experiencefor assistance in the field. Thoughtful reviews by Cam Wobus, AlexDensmore, and an anonymous reviewer greatly improved this manuscript.
ReferencesAmos, C. B., and D. W. Burbank (2007), Channel width response to differ-ential uplift, J. Geophys. Res., 112, F02010, doi:10.1029/2006JF000672.
Anders, A. M., G. H. Roe, B. Hallet, D. R. Montgomery, N. Finnegan, andJ. Putkonen (2006), Spatial patterns of precipitation and topography in
the Himalaya, in Tectonics, Climate, and Landscape Evolution, PenroseConference Series, Spec. Pap. 398, edited by S. D. Willett et al., pp. 39–53, Geol. Soc. of Am., Boulder, Colo.
Barros, A. P., M. Joshi, J. Putkonen, and D. W. Burbank (2000), A study ofthe 1999 monsoon rainfall in a mountainous region in central Nepal usingTRMM products and rain gauge observations, Geophys. Res. Lett., 27,3683–3686.
Blythe, A. E., D. W. Burbank, A. Carter, K. Schmidt, and J. Putkonen(2007), Plio-Quaternary exhumation history of the central Himalaya:1. Apatite and zircon fission track and apatite [U-Th]/He analyses,Tectonics, 26, TC3002, doi:10.1029/2006TC001990.
Bookhagen, B., and D. W. Burbank (2006), Topography, relief, andTRMM-derived rainfall variations along the Himalaya, Geophys. Res.Lett., 33, L08405, doi:10.1029/2006GL026037.
Brewer, I. D., D. W. Burbank, and K. V. Hodges (2006), Downstreamdevelopment of a detrital cooling-age signal: Insights from 40Ar/39Armuscovite thermo-chronology in the Nepalese Himalaya, in Tectonics,Climate, and Landscape Evolution, Penrose Conference Series, Spec.Pap. 398, edited by S. D. Willett et al., pp. 321–338, Geol. Soc. ofAm., Boulder, Colo.
Burbank, D. W. (2002), Rates of erosion and their implications for exhu-mation, Mineral. Mag., 66, 25–52.
Burbank, D. W., J. Leland, E. Fielding, R. S. Anderson, N. Brozovic, M. R.Reid, and C. Duncan (1996), Bedrock incision, rock uplift and thresholdhillslopes in the northwestern Himalayas, Nature, 379, 505–510.
Burbank, D. W., A. E. Blythe, J. Putkonen, B. A. Pratt-Sitaula, A. Barros,and T. P. Ojha (2003), Decoupling of erosion and precipitation in theHimalayas, Nature, 426, 652–655.
Colchen, M., P. LeFort, and A. Pecher (1986), Annapurna-Manaslu-Ganesh Himal, 136 pp., Cent. Natl. de la Rech. Sci., Paris.
Dadson, S. J., et al. (2003), Links between erosion, runoff, variability andseismicity in the Taiwan orogen, Nature, 426, 648–651.
Demoulin, A. (1998), Testing the tectonic significance of some parametersof longitudinal river profiles: The case of the Ardenne (Belgium, NWEurope), Geomorphology, 24, 189–208.
Department of Hydrology and Meteorology (1977), Climatological Recordsof Nepal 1971–1975, vol. I, 366 pp., Kathmandu.
Department of Hydrology and Meteorology (1982), Climatological Recordsof Nepal 1976–1980, vol. I, 410 pp., Kathmandu.
Department of Hydrology and Meteorology (1984), Climatological Recordsof Nepal 1981–1982, vol. I, 174 pp., Kathmandu.
Department of Hydrology and Meteorology (1986), Climatological Recordsof Nepal 1983–1984, vol. I, 187 pp., Kathmandu.
Department of Hydrology and Meteorology (1988), Climatological Recordsof Nepal 1985–1986, 232 pp., Kathmandu.
Department of Hydrology and Meteorology (1997), Climatological Recordsof Nepal 1991–1994, 378 pp., Kathmandu.
Department of Hydrology and Meteorology (1999), Climatological Recordsof Nepal 1995–1996, 323 pp., Kathmandu.
Department of Hydrology and Meteorology (2001), Climatological Recordsof Nepal 1997–1998, 193 pp., Kathmandu.
Department of Hydrology and Meteorology (2002), Climatological Recordsof Nepal 1999–2000, 194 pp., Kathmandu.
Department of Hydrology and Meteorology (2005a), Precipitation Recordsof Nepal 1987–1990, 253 pp., Kathmandu.
Department of Hydrology and Meteorology (2005b), Precipitation Sum-mary of Nepal 2001–2003, 278 pp., Kathmandu.
Dunne, T., and L. B. Leopold (1978), Water in Environmental Planning,818 pp., W.H. Freeman, San Francisco, Calif.
Duvall, A., E. Kirby, and D. W. Burbank (2004), Tectonic and lithologiccontrols on bedrock channel profiles and processes in coastal California,J. Geophys. Res., 109, F03002, doi:10.1029/2003JF000086.
Finnegan, N. J., D. R. Roe, D. R. Montgomery, and B. Hallet (2005),Controls on the channel width of rivers: Implications for modeling fluvialincision of bedrock, Geology, 33(3), 229–232.
Gabet, E. J., and T. Dunne (2003), A stochastic sediment delivery model fora steep Mediterranean landscape, Water Resour. Res., 39(9), 1237,doi:10.1029/2003WR002341.
Gabet, E. J., D. W. Burbank, J. K. Putkonen, B. A. Pratt-Sitaula, and T. Ojha(2004a), Rainfall thresholds for landsliding in the Himalayas of Nepal,Geomorphology, 63, 131–143.
Gabet, E. J., B. A. Pratt-Sitaula, and D. W. Burbank (2004b), Climaticcontrols on hillslope angle and relief in the Himalayas, Geology, 32(7),629–632.
Godard, V., J. Lave, and R. Cattin (2006), Numerical modeling of erosionprocesses in the Himalayas of Nepal: Effects of spatial variations of rockstrength and precipitation, in Analogue and Numerical Modeling ofCrustal-Scale Processes, edited by S. J. H. Buiter and G. Schreurs, Geol.Soc. Spec. Publ., 253, 341–358.
F03007 CRADDOCK ET AL.: CHANNEL WIDTH ALONG RAINFALL GRADIENT
16 of 17
F03007

Hallet, B., L. Hunter, and J. Bogen (1996), Rates of erosion and sedimentevacuation by glaciers: A review of field data and their implications,Global Planet. Change, 12, 213–235.
Hancock, G. S., R. S. Anderson, and K. X. Whipple (1998), Beyond power:Bedrock river incision process and form, in Rivers Over Rock: FluvialProcesses in Bedrock Channels, Geophys. Monogr. Ser., vol. 107, editedby K. J. Tinkler and E. E. Wohl, pp. 35–60, AGU, Washington, D. C.
Hartshorn, K., N. Hovius, W. B. Dade, and R. L. Slingerland (2002),Climate-driven bedrock incision in an active mountain belt, Science,297, 2036–2038.
Hodges, K. V., R. R. Parrish, and M. P. Searle (1996), Tectonic evolution ofthe central Annapurna Range, Nepalese Himalayas, Tectonics, 15(6),1264–1291.
Hodges, K. V., C. Wobus, K. Ruhl, T. Schildgen, and K. X. Whipple(2004), Quaternary deformation, river steepening, and heavy precipitationat the front of the Higher Himalayan ranges, Earth Planet. Sci. Lett., 220,379–389.
Howard, A. D., W. E. Dietrich, and M. A. Seidl (1994), Modeling fluvialerosion on regional to continental scales, J. Geophys. Res., 99(B7),13,971–13,986.
Huntington, K. W., A. E. Blythe, and K. V. Hodges (2006), Climate changeand Late Pliocene acceleration of erosion in the Himalaya, Earth Planet.Sci. Lett., 252, 107–118.
Kirby, E., and K. X. Whipple (2001), Quantifying differential rock-upliftrates via stream profile analysis, Geology, 29(5), 415–418.
Kirby, E., K. W. Whipple, W. Q. Tang, and Z. L. Chen (2003), Distributionof active rock uplift along the eastern margin of the Tibetan Plateau:Inferences from bedrock channel longitudinal profiles, J. Geophys.Res., 108(B4), 2217, doi:10.1029/2001JB000861.
Knighton, D. (1998), Fluvial Forms and Processes: A New Perspective,218 pp., Edward Arnold, London.
Kooi, H., and C. Beaumont (1996), Large-scale geomorphology: Classicalconcepts reconciled and integrated with contemporary ideas via a surfaceprocesses model, J. Geophys. Res., 101(B2), 3361–3386.
Lambert, L., and B. D. Chitrakar (1989), Variation of potential evapotran-spiration with elevation in Nepal, Mountain Res. Dev., 9(2), 145–152.
Lave, J., and J. P. Avouac (2000), Active folding of fluvial terraces acrossthe Siwaliks Hills, Himalayas of central Nepal, J. Geophys. Res.,105(B3), 5735–5770.
Lave, J., and J. P. Avouac (2001), Fluvial incision and tectonic uplift acrossthe Himalaya of Central Nepal, J. Geophys. Res., 106(B11), 26,561–26,591.
Leopold, L. B., and T. Maddock (1953), The hydraulic geometry of streamchannels and some physiographic implications, U.S. Geol. Surv. Prof.Pap., 252, 1–57.
Molnar, P., and P. England (1990), Late Cenozoic uplift of mountain rangesand global climate change: Chicken or egg?, Nature, 346, 29–34.
Montgomery, D. R., and J. M. Buffington (1997), Channel-reach morphol-ogy in mountain drainage basins, Geol. Soc. Am. Bull., 109, 596–611.
Montgomery, D. R., and K. B. Gran (2001), Downstream variations in thewidth of bedrock channels, Water Resour. Res., 37(6), 1841–1846.
Neimi, N. A., M. Oskin, D. W. Burbank, A. M. Heimsath, and E. J. Gabet(2005), Effects of bedrock landslides on cosmogenically determined ero-sion rates, Earth Planet. Sci. Lett., 237, 480–498.
Pratt-Sitaula, B., M. Garde, D. W. Burbank, M. Oskin, A. Heimsath, andE. Gabet (2007), Bedload-to-suspended load ratio and rapid bedrockincision from Himalayan landslide-dam lake record, Quat. Res., 68,111–120.
Raymo, M. E., and W. F. Ruddiman (1992), Tectonic forcing of late Cen-ozoic climate, Nature, 359, 117–122.
Reiners, P. W. (2005), Zircon (U-Th)/He thermochronometry, Rev. Mineral.Geochem., 58, 151–179.
Reiners, P. W., T. A. Ehlers, S. G. Mitchell, and D. R. Montgomery (2003),Coupled spatial variations in precipitation and long-term erosion ratesacross the Washington Cascades, Nature, 426, 645–647.
Roe, G. H., D. R. Montgomery, and B. Hallet (2002), Effects of orographicprecipitation variations on the concavity of steady-state river profiles,Geology, 30(2), 143–146.
Roe, G. H., D. R. Montgomery, and B. Hallet (2003), Orographic precipita-tion and the relief of mountain ranges, J. Geophys. Res., 108(B6), 2315,doi:10.1029/2001JB001521.
Searle, M. P., and L. Godin (2003), The South Tibetan Detachment and theManaslu Leucogranite: A structural reinterpretation and restoration of theAnnapurna-Manaslu Himalaya, Nepal, J. Geol., 111, 505–523.
Seeber, L., and V. Gornitz (1983), River profiles along the Himalayan Arcas indicators of active tectonics, Tectonophysics, 92(4), 335–367.
Sklar, L. S., and W. E. Dietrich (2004), A mechanistic model for riverincision into bedrock by saltating bed load, Water Resour. Res., 40,W06301, doi:10.1029/2003WR002496.
Small, E. E., and R. S. Anderson (1995), Geomorphically driven late Cen-ozoic rock uplift in the Sierra Nevada, California, Science, 270, 277–280.
Snyder, N. P., K. X. Whipple, G. E. Tucker, and D. J. Merritts (2000),Landscape response to tectonic forcing: digital elevation model analysisof stream profiles in the Mendocino triple junction region, northern Ca-lifornia, Geol. Soc. Am. Bull., 112, 1250–1263.
Snyder, N. P., K. X. Whipple, G. E. Tucker, and D. J. Merritts (2003a),Channel response to tectonic forcing: Field analysis of stream morphol-ogy and hydrology in the Mendocino triple junction region, northernCalifornia, Geomorphology, 53, 97–127.
Snyder, N. P., K. X. Whipple, G. E. Tucker, and D. J. Merritts (2003b),Importance of a stochastic distribution of floods and erosion thresholds inthe bedrock river incision problem, J. Geophys. Res., 108(B2), 2117,doi:10.1029/2001JB001655.
Stock, J. D., and W. E. Dietrich (2006), Erosion of steepland valleys bydebris flows, Geol. Soc. Am. Bull, 118(9/10), 1125–1148, doi:10.1130/B25902.1.
Stock, J. D., and D. R. Montgomery (1999), Geologic constraints on bed-rock river incision using the stream power law, J. Geophys. Res.,104(B3), 4983–4993.
Stock, J. D., D. R. Montgomery, B. D. Collins, W. E. Dietrich, and L. Sklar(2005), Field measurements of incision rates following bedrock exposure:Implications for process controls on the long profiles of valleys cut byrivers and debris flows, Geol. Soc. Am. Bull., 117, 174–194, doi:10.1130/B25560.1.
Whipp, D. M., Jr., T. A. Ehlers, A. E. Blythe, K. W. Huntington, K. V.Hodges, and D. W. Burbank (2007), Plio-Quaternary exhumation historyof the central Himalaya: 2. Thermo-kinematic model of thermochron-ometer exhumation, Tectonics, 26, TC3003, doi:10.1029/2006TC001991.
Whipple, K. X. (2004), Bedrock rivers and the geomorphology of activeorogens, Annu. Rev. Earth Planet Sci., 32, 151–185.
Whipple, K. X., and G. E. Tucker (1999), Dynamics of the stream powerriver incision model: Implications for height limits of mountain ranges,landscape response timescales and research needs, J. Geophys. Res., 104,17,661–17,674.
Whipple, K. X., G. S. Hancock, and R. S. Anderson (2000), River incisioninto bedrock: Mechanics and relative efficacy of plucking, abrasion, andcavitation, Geol. Soc. Am. Bull., 112, 490–503.
Willett, S. D. (1999), Orogeny and orography: the effects of erosion on thestructure of mountain belts, J. Geophys. Res., 104(B12), 28,957–28,982.
Wobus, C. W., K. V. Hodges, and K. X. Whipple (2003), Has focuseddenudation sustained active thrusting at the Himalayan topographic front,Geology, 31(10), 861–864.
Wobus, C., A. Heimsath, K. X. Whipple, and K. Hodges (2005), Activeout-of-sequence thrust faulting in the central Nepalese Himalaya, Nature,434, 1008–1011.
Wobus,C.W.,K.X.Whipple,E.Kirby,N.Snyder, J. Johnson,K.Spyropolou,B.Crosby,andD.Sheehan(2006a),Tectonicsfromtopography:Procedures,promise, and pitfalls, in Tectonics, Climate, and Landscape Evolution,Penrose Conference Series, Spec. Pap. 398, edited by S. D. Willett et al.,pp. 55–74, Geol. Soc. of Am., Boulder, Colo.
Wobus, C. W., G. E. Tucker, and R. S. Anderson (2006b), Self-formedbedrock channels, Geophys. Res. Lett., 33, L18408, doi:10.1029/2006GL027182.
Wohl, E. E., and A. Wilcox (2004), Channel geometry of mountain streamsin New Zealand, J. Hydrol., 300, 252 –266, doi:10.1016/j.jhydrol.2004.06.006.
Wohl, E. E., J. N. Kuzma, and N. E. Brown (2004), Reach-scale geometryof a mountain river, Earth Surf. Processes Landforms, 29, 969–981,doi:10.1002/esp.1078.
�����������������������B. Bookhagen, Department of Geological and Environmental Sciences,
Stanford University, Stanford, CA 94305, USA. ([email protected])D. Burbank, Department of Earth Science, University of California, Santa
Barbara, CA 93106, USA. ([email protected])W. Craddock, Department of Geosciences, Pennsylvania State University,
University Park, PA 16802, USA. ([email protected])E. J. Gabet, Department of Environmental Science, University of
California, Riverside, CA 92521, USA. ([email protected])
F03007 CRADDOCK ET AL.: CHANNEL WIDTH ALONG RAINFALL GRADIENT
17 of 17
F03007