before the board of inquiry waterview connection project · groundwater modelling of a 1200m long...
TRANSCRIPT

Statement of evidence of Ann Williams (Groundwater) on behalf of the
NZ Transport Agency
Dated: 8 November 2010
REFERENCE: Suzanne Janissen ([email protected])
Cameron Law ([email protected])
Before the Board of Inquiry
Waterview Connection Project
in the matter of: the Resource Management Act 1991
and
in the matter of: a Board of Inquiry appointed under s 149J of the
Resource Management Act 1991 to decide notices of
requirement and resource consent applications by the
NZ Transport Agency for the Waterview Connection
Project
2
091212799/1587176.
INDEX
INTRODUCTION...................................................................................... 3
SCOPE OF EVIDENCE .............................................................................. 6
EXECUTIVE SUMMARY ............................................................................ 6
BACKGROUND AND ROLE........................................................................ 8
SUMMARY OF METHODOLOGY................................................................. 9
SUMMARY OF ASSESSMENT OF GROUNDWATER EFFECTS..................... 12
POST-LODGEMENT EVENTS................................................................... 18
COMMENTS ON SUBMISSIONS.............................................................. 19
COMMENTS ON REPORTS TO THE BOARD.............................................. 24
PROPOSED GROUNDWATER CONDITIONS ............................................ 25
ANNEXURE A: DISTRIBUTION OF HYDROGEOLOGICAL UNITS......................................26
ANNEXURE B: TABLE 8.1 OF THE REPORT - SUMMARY OF PREDICTED EFFECTS.............27
ANNEXURE C: ADDENDUM TO REPORT G.7................................................................28
ANNEXURE D: AMENDED PROPOSED GROUNDWATER CONDITIONS .............................29

3
091212799/1587176.
STATEMENT OF EVIDENCE OF ANN WILLIAMS ON BEHALF OF THE
NZ TRANSPORT AGENCY
INTRODUCTION
1 My full name is Ann Louisa Williams. I am a Technical Director in
the fields of Hydrogeology and Engineering Geology with the firm
Beca Infrastructure Ltd (Beca).
2 I am a graduate of the University of Auckland with the degrees of
Bachelor of Science and Master of Science in Geology (Honours),
specialising in Engineering Geology. I have completed post-
graduate studies in Resource and Environmental Management and in
Hydrogeology. I have 21 years post-graduate experience in
engineering geological and hydrogeological investigations and
analysis.
3 I am the immediate past Chair of the New Zealand Geotechnical
Society and have been elected Vice-President representing
Australasia on the Executive of the International Association for
Engineering Geology and the Environment (IAEG) for the period
2011 to 2014. I am a Fellow of the Geological Society of London
(FGS) and member of the International Association of
Hydrogeologists (IAH), and an associate editor of the international
journal, Quarterly Journal of Engineering Geology and Hydrogeology
(QJEGH).
4 As leader of Beca’s geological and hydrogeological teams, I have
had a key role in a wide range of projects that have required an
understanding of the interaction of water and soil and effects of
seepage and ground movement. Of particular relevance to the
Waterview Connection Project (Project) are the following:
4.1 Evaluation of the effect of deep basement excavation as part
of the Sky City and Sky Tower development in central
Auckland on groundwater levels and existing neighbouring
structures and overview of engineering geological mapping of
excavations;
4.2 Two-dimensional modelling of seepage from a sludge landfill
into the existing groundwater regime and harbour as part of
the upgrade of the Manukau Wastewater Treatment Plant in
Auckland;
4.3 Assessment of the nature, strength and piezometric variation
within the ‘mudcrete’ (cement-stabilised marine silt) backfill
used in the construction of Fisherman's Wharf at the Viaduct
Basin, Auckland, including 2-dimensional modelling of
seepage flows through the wharf;
4
091212799/1587176.
4.4 Review of technical evidence addressing the reasons for
differences between the predicted and observed effects of
dewatering of the 3 Kings Quarry located in a residential part
of Auckland on behalf of Housing New Zealand and most
recently, review of the potential effects on groundwater of the
proposed filling of the quarry for WaterCare;
4.5 Direction of investigations for and 2- and 3-dimensional
groundwater modelling of a 1200 m long underground railway
station (including a 720 m long “Rail Trench”) at New Lynn,
central Auckland (recently completed). The station was
constructed beneath the groundwater table in Tauranga
Group alluvial deposits overlying Waitemata Group
sandstone/ mudstone at variable depth (which also occur at
the Waterview Project site). Modelling was used to assess
likely groundwater drawdown, associated settlement effects,
excavation inflows, uplift pressures beneath the trench,
potential damming of groundwater upgradient of the box and
monitoring requirements during construction and in the
long-term. I reviewed monitoring data through construction;
4.6 Investigation and 2– and 3-dimensional groundwater
modelling of a new trunk watermain to distribute water from
Auckland’s southern water sources to central Auckland
(Hunua 4), that will comprise a pipeline of 1.3 to 1.9 m
diameter with a length of some 30 km including pipe bridges
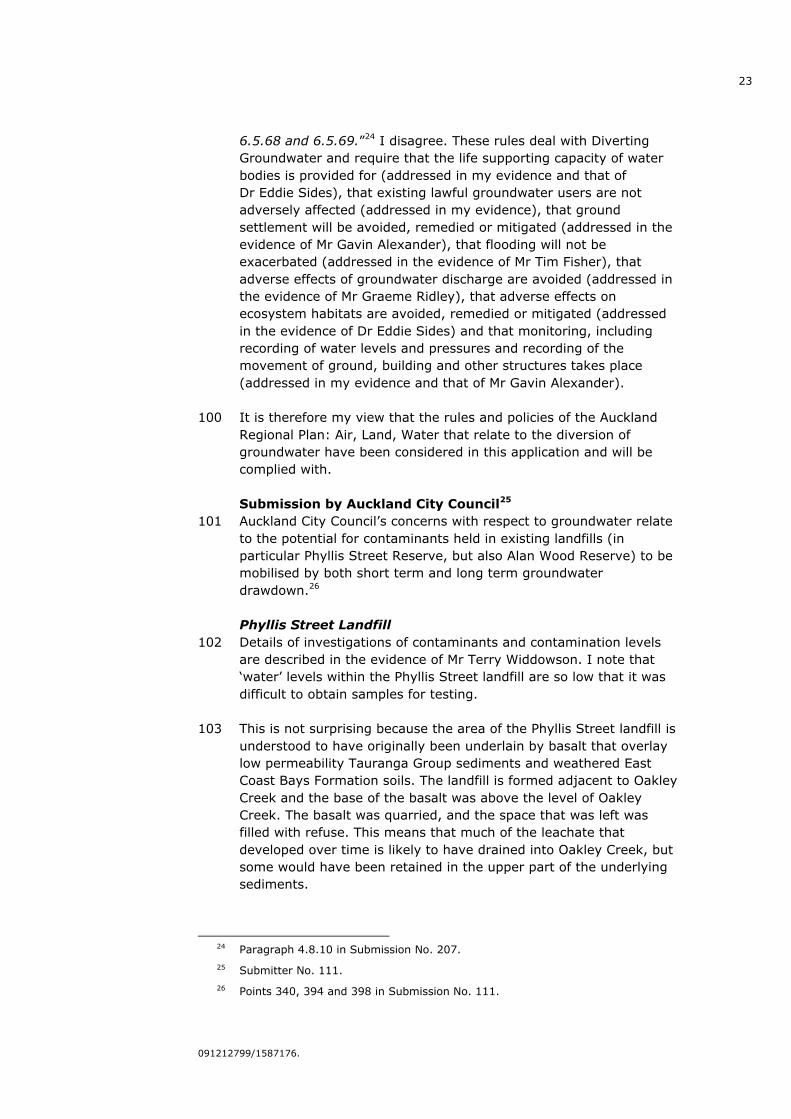
and trenchless crossings;
4.7 Investigation and development of 2– and 3-dimensional
groundwater models for a 3-lane motorway tunnel being built
by cut and cover techniques beneath Victoria Park (Victoria
Park Tunnel), central Auckland (under construction). This
included assessment of likely groundwater drawdown and
inflows associated with tunnel construction, assessment of the
impact of different tunnel designs on regional groundwater
flow and the potential for contaminant migration and saline
intrusion. I am the in-team reviewer for groundwater aspects
of the design-build phase of the project;
4.8 Preliminary investigation, 2-dimensional groundwater
modelling and identification of construction and cost risks (in
particular the potential extent of groundwater drawdown
induced settlements) for a Rail Loop between Britomart
Station and Newton which will comprise some 3.5 km of
tunnel and 6 stations in the Central Business District of
Auckland (currently in the notice of requirement phase);
4.9 Eden Park playing fields are estimated to flood during a
1:2 year or greater rainfall event, due for the most part to the
rise of groundwater to the surface. Auckland City is required

5
091212799/1587176.
to manage a 1:10 year event to meet criteria for the Rugby
World Cup hosting. I have managed the design and direction
of investigations, analyses and 3-dimensional groundwater
modelling for feasibility stage design of a system to allow
drawdown of the complex basaltic aquifer sufficient that Eden
Park will assimilate a 10 year rainfall event; and
4.10 Guidance of desk-based assessment of groundwater issues
associated with an alternative crossing of the Waitemata
Harbour – bridge and tunnel (this project is currently in the
option selection phase).
5 In each case these underground projects required assessment of the
effect of different designs on regional and perched groundwater
flow, the potential for contaminant migration or saline intrusion and
for dewatering adjacent watercourses and affecting existing
groundwater supplies.
6 In addition I have directed investigation and development of deep
groundwater as a strategy for meeting NZ Drinking Water Standards
for municipal, commercial and industrial supplies in centres
throughout New Zealand. I have also had the role of technical
expert addressing the potential effects of the proposed Waitahora
Wind Farm (Manawatu) to be constructed in part on karstic
limestone, on groundwater and water supplies, in the Environment
Court.
7 My evidence is given in support of notices of requirement and
applications for resource consents lodged with the Environmental
Protection Authority (EPA) by the NZ Transport Agency (NZTA) on
20 August 2010 in relation to the Project. The Project comprises
works previously investigated and developed as two separate
projects, being:
7.1 The State Highway 16 (SH16) Causeway Project; and
7.2 The State Highway 20 (SH20) Waterview Connection Project.
8 I am familiar with the area that the Project covers, and the State
highway and roading network in the vicinity of the Project.
9 I have read the Code of Conduct for Expert Witnesses as contained
in the Environment Court Consolidated Practice Note (2006), and
agree to comply with it. In preparing my evidence, I have not
omitted to consider material facts known to me that might alter or
detract from my opinions expressed.

6
091212799/1587176.
SCOPE OF EVIDENCE
10 My evidence will deal with the following:
10.1 Executive summary;
10.2 Background and role;
10.3 Summary of methodology;
10.4 Summary of assessment of groundwater effects;
10.5 Post-lodgement events;
10.6 Comments on submissions;
10.7 Comments on Reports to the Board; and
10.8 Proposed Groundwater conditions.
EXECUTIVE SUMMARY
11 Two and three dimensional numerical groundwater modelling has
been undertaken, under my direction, to assess the effects of the
proposed cut-and-cover tunnels, driven tunnel, portals and
approaches on the existing groundwater regime.
12 The models are based on data from 305 boreholes, 231
piezometers, 171 in-situ permeability tests, 7 pumping tests and
water level monitoring undertaken over the periods 2001 to 2003
and 2006 to 2010.
13 The geology of the area has been grouped into seven units that
each respond in a different way to changes in groundwater.
14 Water level monitoring indicates a north to northwesterly gradient
on the regional water table towards the coast. The gradient within
the East Coast Bays Formation is 3 % to 4 % with seasonal variation
of up to +/- 1 m. Water levels in the basalt are on average 2 m
higher and have a seasonal variation of +/- 1.5 m.
15 Base case modelling assumes that the driven twin tunnels will be
progressed with a 50 m lag between the northbound and
southbound tunnels and that the tunnels are excavated in two
sections: the upper half being excavated and shotcreted first,
followed by the lower half. The cut-and-cover tunnels are assumed
to be drained, whereas the driven tunnels will be undrained (sealed)
once the lining is in place.

7
091212799/1587176.
16 Modelling suggests that the northern portals and approaches can be
permanently drained, resulting in a drawdown of groundwater levels
of up to 10 m, with measureable drawdown extending some 300 m
from the portals.
17 For the construction of undrained driven tunnels, short term
drawdown of around 8 m to 15 m immediately adjacent to the
tunnels is predicted, but this rapidly reduces away from the tunnels
with measureable drawdown typically extending less than 100 m.
Where the tunnels are driven through more permeable Parnell Grit,
a greater magnitude and extent of drawdown is predicted to occur.
This could be mitigated by pre-grouting, adopting shorter
construction timeframes and managing the open tunnel length.
18 In the long term, the tunnels will be sealed to limit the inflow of
groundwater. A maximum drawdown of 3 m immediately adjacent
to the tunnels is anticipated with measureable drawdown extending
less than 100 m from the tunnels.
19 At the southern portal a permanent drain in the basalt to relieve
pressure on retaining walls is proposed. In this case the greatest
magnitude and extent of drawdown occurs in the long term.
Drawdown of 2 m to 13 m is expected in the compressible soils
immediately adjacent to retaining walls, with measureable
drawdown typically extending less than 50 m (and no more than
100 m) from the walls.
20 Monitoring of boreholes screened in the Phyllis Street Reserve
through the summer of 2009/2010 and winter of 2010 suggest
there is almost no water residing within the fill. The potential to
spread contaminants through the underlying low permeability soils
in response to the predicted drawdown is therefore almost nil.
21 Analyses suggest a reduction of Oakley Creek baseflow by 6 % over
the length of the approaches to the southern portal, reducing to 2 %
over the length of the driven tunnel and northern cut-and-cover
tunnel.
22 I therefore consider the adverse effects of the Project on
groundwater overall to be minor.
23 A monitoring programme has been proposed to record groundwater
levels prior to, through and following construction. This will allow
actual changes in groundwater levels to be checked against those
predicted and appropriate responses to be implemented, if needed.
8
091212799/1587176.
BACKGROUND AND ROLE
24 The NZTA retained Beca as part of a consortia team to assist with
the investigation, engineering and planning of the Project and to
prepare the assessment of the groundwater effects of the Project.
Ms Sian France (Senior Hydrogeologist) and Ms Erica Cammack
(Engineering Geologist), both of whom work in my team at Beca,
undertook field investigations and testing, data analysis, 2- and 3-
dimensional groundwater modelling and prepared an Assessment of
Groundwater Effects (the Report) under my direction, and with my
review and input.
25 The Report has been peer reviewed by Graeme Twose (Senior
Geotechnical Engineer) of Tonkin & Taylor Ltd and by Brett Sinclair
(Senior Hydrogeologist) of Golder Associates Ltd.
26 The Report was lodged with the EPA on 20 August 2010 as part of
the overall Assessment of Environmental Effects (AEE) (specifically,
Part G, Technical Report G.7).
27 The Report was supported by Geotechnical Factual Reports, also
lodged with the AEE (see Part G), being:
27.1 Report G.28 (500 series), Volumes One to Three; and
27.2 Report G.29 (700 series), Volumes One to Three.
28 The Report was informed by, relies upon, and informs other
technical reports lodged with the EPA in support of the Project,
those reports being primarily:
28.1 Geotechnical Interpretive Report (Technical Report G.24);
28.2 Assessment of Land and Groundwater Contamination
(Technical Report G.9); and
28.3 Assessment of Ground Settlement Effects (Technical Report
G.13).1
29 The 2- and 3- dimensional groundwater modelling and assessment
of groundwater effects uses, as a base, the geological data and
model developed with Tonkin & Taylor Ltd and described in the
Geotechnical Interpretive and Factual Reports (being Technical
Reports G.24, G.28 and G.29).
30 Details of contaminants that presently reside in groundwater at
different locations along the proposed alignment are described in
Technical Report G.9 Assessment of Land and Groundwater
Contamination.
1 All contained within the AEE, Part G.
9
091212799/1587176.
31 The 2- and 3- dimensional groundwater modelling provides the
expected groundwater drawdown profiles that have been used to
assess groundwater drawdown-induced ground settlement described
in Technical Report G.13 Assessment of Ground Settlement Effects.
SUMMARY OF METHODOLOGY
32 My evidence considers the interaction of the construction phase and
long term operation of the tunnels with groundwater. Some of the
interactions inform tunnel design and some allow identification and,
if necessary, mitigation of potential effects on the environment.
33 Issues investigated that inform tunnel design include the:
33.1 Rate of inflow of groundwater to the tunnels, portals and
excavations during construction and in the long term;
33.2 Uplift pressures beneath portal and tunnel floors, and
groundwater pressures on tunnel lining; and
33.3 Efficacy of limiting these effects by wall and tunnel design
elements and construction sequencing.
34 Issues investigated that are important to understand because of
their potential to impact on the environment include the:
34.1 Potential to cause groundwater drawdown that might result in
ground settlement and affect existing structures;
34.2 Potential to affect Oakley Creek base flows and flow regime
by altering groundwater flow in the vicinity of the tunnels, in
particular during construction;
34.3 Potential to spread contaminants residing in areas of past
landfilling by drawing groundwater down toward the tunnel
excavations where they pass beneath such areas;
34.4 Potential to affect yield or quality of water at existing
abstraction bores or springs by altering groundwater flow
patterns; and
34.5 Opportunities to mitigate potential environmental effects
through design and construction sequencing.
Investigations
35 In order to understand the groundwater systems, an understanding
of the geology of the Project area is needed.
10
091212799/1587176.
36 Subsurface investigations, local field mapping, in-situ testing and
laboratory testing have been carried out for earlier alignments and
the finally proposed alignment.2 Field investigations included:
36.1 305 machine drilled boreholes to depths of less than 10 to
more than 100 metres;
36.2 231 piezometer installations;
36.3 171 in-situ permeability tests (lugeon tests and rising head
tests); and
36.4 7 pumping tests.
37 The locations of investigation sites are shown in drawings presented
in Appendix A of the Geotechnical Interpretive Report, Technical
Report G.24.
38 The data obtained from the above investigations was used to
develop a 3-dimensional geological model that could be used to take
off long-sections and cross-sections for both geotechnical and
groundwater analysis.
39 I understand that further data is now available following installation
of a suite of the proposed monitoring bores. This data will be
considered in detailed design.
Construction assumptions modelled3
40 Key construction method assumptions made in the assessment of
the groundwater effects are:
40.1 Construction of the cut-and-cover section of the tunnel at the
northern end will commence prior to work on the driven
tunnel.
40.2 The floor of the northern and southern cut-and-cover sections
of the tunnel are unsealed (drained) in the long term.
40.3 The driven twin tunnels will be progressed on two fronts from
the southern portal, with the northbound tunnel commencing
first and a 50 m lag maintained between the northbound and
southbound tunnels. Should the contractor instead wish to
progress each tunnel from opposite ends (i.e. one tunnel from
the north and one from the south), the effects will be less
than those described here because of the greater separation
of work fronts.
2 See Technical Reports G.24, G.28, G.29 (AEE, Part G).
3 See section 3, pages 5-10 of Technical Report G.7.

11
091212799/1587176.
40.4 The tunnels will be excavated in 50 m lengths.
40.5 The tunnels will be excavated in two sections: the upper half
being excavated and shotcreted first, and the lower half
following. As tunnelling proceeds, the cross-passages will be
excavated 50 m behind the main excavation front.
40.6 During excavation, temporary support will be installed directly
behind the open face and will comprise combinations of bolts,
lattice arches, grouted spiles and sprayed steel fibre
reinforced shotcrete.
40.7 The permanent support will comprise a waterproof membrane
and either cast in-situ concrete or sprayed shotcrete.
Installation of the tunnel lining may be undertaken
progressively behind the excavation face (assumed base case
for modelling) or could commence following completion of
both driven tunnels (up to 2 years later, considered as an
alternative modelling scenario).
41 Due to the higher groundwater table within the basalt, a grout
curtain will be constructed adjacent to the Southern portal to limit
groundwater flows into the portal area both during construction and
in the long term. Once the grout curtain is in place, the basalt will
be excavated out in a series of narrow benches. Secant pile walls
(piles of around 900 mm diameter) will then be constructed along
each side of the portal. These will be tied back with multiple rows of
ground anchors and excavation extended down in stages to road
formation level. The portal will remain permanently unsealed.
Approach to modelling4
42 Both 2-dimensional (2D) and 3-dimensional (3D) groundwater
modelling have been undertaken in order to more fully assess the
likely effects of the construction and long-term operation of the
proposed driven tunnels, cut-and-cover tunnel, portals and
approaches on the existing groundwater regime.
43 The 3D model was developed to consider overall groundwater flow
trends and broad scale effects resulting from tunnel construction.
3D groundwater flow modelling was carried out using the computer
software Visual MODFLOW Pro v4.3 (Schlumberger, Canada).
44 Because of the complex geology and 3D nature of flow, the 3D
model is used for assessment of:
44.1 Effects on water balance and groundwater flows into and from
Oakley Creek;
4 See section 3.3, pages 7-8 of Technical Report G.7.

12
091212799/1587176.
44.2 Magnitude of drawdown at more than 100 m from the tunnel
centreline (in combination with the outputs from the 2D
modelling);
44.3 The extent of drawdown; and
44.4 Effects of dual tunnel construction sequencing.
45 In order to examine the effects of the tunnels on groundwater flow
around the tunnel structure and walls in more detail, 2D
groundwater seepage modelling (SEEP/W 2007) was undertaken.
Because of the finer scale of the 2D models, and the software’s
ability to model unsaturated flow (such as that which occurs when
an excavation is dewatered), the 2D modelling was used to consider
the likely effects close to the tunnel (100 m either side). However,
as regional groundwater flow is roughly perpendicular to the 2D
sections (along the length of the tunnel), this modelling cannot be
used to assess effects on Oakley Creek. The 2D model is used for
assessment of:
45.1 The rate of groundwater seepage into the tunnels, both
during construction and in the long term;
45.2 Uplift pressures beneath the tunnel floor;
45.3 The influence of pile depth on drawdown and uplift pressures;
45.4 The amount of drawdown and how it varies along and within
100 m either side of the tunnels; and
45.5 The effects of constructing cross-passages between the dual
tunnels.
SUMMARY OF ASSESSMENT OF GROUNDWATER EFFECTS
46 In this section of my evidence, I discuss the Groundwater Report
and my conclusions on groundwater effects associated with the
Project.
Purpose of groundwater assessment5
47 The potential effects of the Project on groundwater are:
47.1 The potential to affect Oakley Creek Base Flows. Drawdown
of groundwater in the vicinity of Oakley Creek to facilitate
tunnel construction might reduce the amount of groundwater
that naturally flows towards Oakley Creek; it might also
increase the volume of water that naturally discharges
5 See section 4, pages 8-9 of Technical Report G.7.
13
091212799/1587176.
through the bed of the Creek to recharge the underlying
groundwater system;
47.2 The potential to spread contaminants from landfill areas.
Drawdown of groundwater at the tunnel could result in
draw-in of contaminants that normally reside within near-
surface materials, such as landfill or areas of basalt used for
stormwater discharge; and
47.3 The potential to draw down (or lower) groundwater to the
extent that it results in ground settlement that causes
damage to existing structures. Drawdown of groundwater at
the tunnel will result in a cone of depression (lowering) of the
groundwater table/s that extends outwards from the tunnels.
The amount of drawdown will decrease with distance from the
tunnels. The drawdown of groundwater below the normal
seasonal variation can cause settlement of compressible soils,
which in turn may result in settlement of structures founded
on or in those soils, depending on the amount of settlement
that is induced and how this changes beneath the structure,
the nature of the structure and its foundations.
48 I note that groundwater drawdown in itself is not an effect, but
potential effects result from drawdown - such as pore pressure
reduction that might result in ground settlement, or changes to
groundwater flow and direction that might affect surface water or
movement of contaminants. Accordingly, while my evidence
addresses drawdown, the potential effects of drawdown (e.g. on
ground settlement and contaminants) will be covered by other
technical witnesses (respectively, Gavin Alexander and Terry
Widdowson).
Geological model6
49 The tunnels are to be located in the western-central suburbs of
Auckland, within a stream valley (in part occupied by Oakley Creek),
between Mt Albert Volcano and the Great North Road / Blockhouse
Bay Road ridge. The ridge is made up of East Coast Bays Formation
(ECBF) sandstone and siltstone that forms the bedrock of the area.
The ECBF rocks include lenses of volcaniclastic sandstone (Parnell
Grit) found to occur in the Phyllis Reserve and Waterview Downs
area. Younger Tauranga Group alluvial sediments were deposited in
low lying areas, in particular in the Oakley Creek paleo-valley.
Mt Albert (also known as Owairaka Volcano) erupted through and
over a now buried ridge and cliff line of ECBF rocks more than
30,000 years ago with basalt lava and ash filling the valley.
50 A geological map of the tunnel area is included as Figure 3 in the
Report. The soils and rocks encountered in investigations have been
6 See section 5, pages 11-15 of Technical Report G.7.

14
091212799/1587176.
grouped into hydrogeological units (that is, units that behave in a
similar way with respect to storage and transmission of
groundwater). This is important because the different units will
respond differently to drawdown of groundwater levels as some are
compressible, but others are not. Seven hydrogeological units are
recognised and the broad distribution of these units is shown in
Figure 3 and in long-section in Annexure A. The units are:
50.1 Fill - variable in nature and thickness (including some pockets
of industrial waste);
50.2 Auckland Volcanic Field (AVF) - high permeability, variably
jointed basalt lava flows;
50.3 Tauranga Group Alluvium (TGA) - low permeability,
compressible clays, silts and sands;
50.4 Weathered East Coast Bays Formation (WECBF) - low
permeability silts, sands and clays;
50.5 Weathered Parnell Grit (WPG) - soft to firm sensitive low
permeability silts and clays;
50.6 East Coast Bays Formation (ECBF) - moderately permeable
interbedded sandstone and siltstone; and
50.7 Parnell Grit (PG) - high permeability, coarse volcaniclastic
sandstone.
51 Groundwater levels within the ECBF and Parnell Grit are similar to
the water level in Oakley Creek and indicate a northerly gradient of
3 % to 4 % falling to close to sea-level at the coast, with a small
local component of flow toward Oakley Creek. These water levels
are considered to represent the regional groundwater system, which
is semi-confined.
52 Water levels in the basalt, Tauranga Group and weathered ECBF and
weathered Parnell Grit respond directly to rainfall events and
represent perched water levels that exist because of the contrast in
permeability between these units. That is, water resides in higher
permeability layers (such as the basalt or sand lenses within the
Tauranga Group) and is ‘hung up’ on top of lower permeability
layers. Water ‘leaks’ more slowly through these lower permeability
layers, which can be described as aquitards because they slow the
rate of groundwater flow.
53 Groundwater drawdown will be greatest in the ECBF and Parnell Grit
as the tunnel is, for the most part, driven through these units.
However, the effect of the drawdown (in terms of resultant ground
15
091212799/1587176.
settlement) will be greatest in the Tauranga Group and weathered
Parnell Grit because these soils are compressible.
54 In the next section of my evidence, I will describe the key points of
the Report.
Conclusions in my assessment7
55 Numerical groundwater modelling has been undertaken to provide
an assessment of effects on the existing groundwater regime
associated with the short term construction and long term operation
of the driven and cut-and-cover tunnels, the portals and the tunnel
approaches. The results are summarised in Table 8.1 of the Report
(a copy of which is attached as Annexure B to my evidence.)
Portals
56 For the northern tunnel portals and approaches, maximum inflows
of groundwater occur during excavation of the tunnel floor because
the walls will have been installed prior to excavation and the water
table resides just above floor level at the northernmost end,
deepening to the south. Modelling indicates a peak groundwater
inflow of 0.02 to 2.0 m3/d/m length of tunnel, depending on the
depth and width of cut and cover excavation and geology; a total
inflow of 280 m3/d (3.2 litres/second) of groundwater to the 400 m
length of fully drained cut and cover tunnel is expected.
57 The short term dewatering associated with construction is expected
to result in drawdown of up to 6 m immediately adjacent to the
structural walls, with measureable drawdown extending no more
than 130 m and a negligible effect on Oakley Creek base flows. As
such, the potential effects on Oakley Creek associated with the
construction and short term dewatering are considered to be less
than minor.
58 The settlement effects associated with this amount of drawdown are
reported in Technical Report G.13 Assessment of Ground Settlement
Effects (AEE, Part G) and discussed in the evidence in chief (EIC) of
Mr Gavin Alexander.
59 In the long-term steady state condition (that is, once the tunnels
are completed and groundwater levels are allowed to stabilise) the
drained portals and tunnel approaches will have resulted in up to
10 m of drawdown, with measureable drawdown extending up to
300 m from the tunnels. Associated ground settlement effects are
expected to be minor.8
7 See pages 26 and 17 of Technical Report G.7.
8 See Technical Report G.13 Assessment of Ground Settlement Effects and Mr Alexander’s evidence in chief.

16
091212799/1587176.
Tunnels
60 Construction of the ‘undrained’9 driven tunnels is expected to result
in short term drawdown of 8 m to 15 m immediately adjacent to the
tunnel, which rapidly reduces with distance from the tunnels. Peak
groundwater inflows to the tunnels during construction are expected
to range from 1.5 to 5.3 m3/d/m length of tunnel in ECBF up to
120 m3/d/m length of tunnel in ungrouted Parnell Grit. Measureable
drawdown is predicted to typically extend less than 100 m from the
tunnels. Where the tunnel is driven through more permeable
fractured Parnell Grit, generally in the vicinity of the Phyllis Reserve,
a greater magnitude and extent of drawdown is predicted to occur.
However, this could be mitigated by pre-grouting10, adopting shorter
construction to lining time-frames through this section of the
tunnels and managing the open drained tunnel length. Such
mitigative construction techniques are most likely to be adopted as
there are associated risks to the tunnelling process with high
groundwater inflow.
61 The driven tunnels will be sealed to limit the inflow of groundwater
either progressively (base case modelled) or up to 2 years following
completion of the tunnels. The long term effects of tunnel
construction (i.e. some 3 years following completion of the tunnels
when groundwater levels will have stabilised) are expected to be up
to 3 m of drawdown immediately adjacent to the tunnels, with
measureable drawdown extending generally less than 100 m from
the tunnels.
62 The potential effects on the groundwater regime associated with the
short-term construction and long-term operation of the driven
tunnels are therefore considered to be minor.
Southern Portal
63 A permanent drain in the basalt to relieve pressure on the retaining
walls is proposed at the Southern Portal. Modelling suggests the
average inflow during construction will range from 0.2 to
1.7 m3/d/m length of tunnel (peak inflows of up to 75 m3/d/m
length of tunnel in basalt), reducing to less than 0.5 m3/d/m length
of tunnel in the long term.
64 Some 2 m to 13 m of drawdown is expected in the compressible
soils immediately adjacent to retaining walls, with measureable
drawdown typically extending for less than 50 m (and no more than
100 m) beyond them. The potential effects associated with this
9 The cut and cover sections of tunnel at the northern and southern portals are
likely to be ‘drained’, such that the groundwater can freely drain into the excavation. Once drainage is complete and the permanent concrete lining/ segments have been installed, the driven tunnels will be essentially watertight, that is they will be ‘undrained’.
10 This means injecting grout through the excavation face from centres in a radial pattern ahead of excavating the higher permeability Parnell Grit.

17
091212799/1587176.
dewatering are described in Technical Report G.13 Assessment of
Ground Settlement Effects and the EIC of Mr Alexander, and are
considered to be minor.
Spread of contaminants
65 Areas of landfill exist in the Phyllis Reserve area. In this area the
tunnels will be driven through more permeable Parnell Grit at depth.
During construction, a significant increase in the vertical component
of groundwater flow will be induced by drawdown, potentially
allowing some vertical migration of mobile contaminants. However
a 7 m to 21 m thick layer of low permeability soil derived from
weathering of the Parnell Grit (Weathered Parnell Grit, WPG)
separates the fill from the more permeable unweathered Parnell Grit
(PG) and will act as an aquitard (as described in para 40) and
dissuade such groundwater movement.
66 Because the period for maximum vertical flow is limited to the time
of breakout and shotcreting of the tunnels, the potential for
contaminants to travel with groundwater into the excavation or
deeper rock aquifers is very low. Furthermore, monitoring of water
levels in piezometers screened in the landfill over the summer of
2009/2010 suggests there is almost no water residing within the fill
and therefore the potential for contaminant spread is almost nil.
Groundwater users
67 The Auckland Regional Council (ARC) well database identifies 5
existing water wells within the wider Project area. Four of the 5
wells have expired consents and no information is available for the
remaining well. The fifth well has co-ordinates some 1.5 km south of
the tunnel and should it exist, is located beyond the extent of
predicted drawdown. No effects on well users are therefore
anticipated.
68 Groundwater springs emerge from basalt in the Unitec grounds.
Limited data is available on the springs, which are likely to have
been modified over time and currently discharge to a small pond.
No effect on spring flows is anticipated because modelling indicates
that no drawdown within the basalt in this area will occur.
Oakley Creek
69 Long-term continuous flow monitoring of Oakley Creek indicates
that the Creek can be described as a flashy stream with significant
flow variations and a low base flow component.11 This means that
most of the water is sourced from quick flow (rainfall runoff,
stormwater discharges etc). About one third of the stream flow is
sourced from stored sources such as in-stream flow from
upgradient, upgradient and local groundwater recharge. As
groundwater recharge along the length of the alignment comprises
11 See Appendix D of Technical Report G.7.

18
091212799/1587176.
only a small portion of all flows, the effect of the potential reduction
in contribution from groundwater, estimated to be between less
than 2 % and 6 % (at the southern portal) of baseflow contribution,
would be less than minor, as described in the evidence of Dr Eddie
Sides.
Monitoring and mitigation
70 Monitoring of groundwater levels, ground surface elevations
(settlement) and surface water flows will be undertaken to confirm
the results of predictive modelling and to refine models if early
monitoring indicates that actual behaviour of the groundwater is
different to that predicted. As groundwater drawdown in the
relatively incompressible ECBF occurs in advance of drawdown and
drawdown induced settlement in the Tauranga Group soils,
groundwater monitoring can also serve as a trigger to initiate more
settlement monitoring and or implement mitigation measures in a
particular area.
71 A monitoring programme will be established well before construction
commencing to record natural variations in groundwater levels and
seasonal ground settlement. A draft monitoring programme has
been prepared as part of Technical Report G.21, the Construction
Environmental Management Plan (CEMP) described in the evidence
of Mr Hugh Leersnyder.
72 Overall, the adverse effects of the Project on groundwater are
considered to be minor, with a large number of potential mitigation
options available to manage unexpected effects, should these occur.
POST-LODGEMENT EVENTS
73 Since the Project application was lodged, a Technical Addendum
Report (Addendum) has been completed and lodged by the NZTA.12
The section of the Addendum that is relevant to my Report provides
further comments on the interpretation of groundwater systems
(perched and regional) within the Waitemata Group (ECBF)
Richardson Road ridge, and the associated model calibration on the
western side of the tunnel alignment. 13
74 In the Project area, a cascading series of perched water tables is
recorded within the Waitemata Group soils and rocks, as occurs
throughout the Waitemata Group rocks in the Auckland Region.
Infiltrating groundwater is held up on lower permeability layers,
slowly discharging through fractures and the rock mass to the
underlying higher permeability layers until again being “caught”
above a further low permeability layer.
12 See Technical Addendum Report G.31 (September 2010).
13 Appendix 4, Technical Addendum Report G.31 (copy provided in Annexure C to my evidence).

19
091212799/1587176.
75 The head of water on each successive water table is only a fraction
of the total head between the regional (lowest recorded) water table
and the uppermost (near-surface) water table. This is the case
even where the hydrostatic levels in successive groundwater lenses
overlap. This means that when deep excavations are made in
Waitemata Group rock, these local perched water tables discharge
without inducing wider ground settlement. (Examples I am familiar
with include the 23 m deep Sky City excavation, the 8 m deep New
Lynn Rail Trench excavation and the Maioro Street interchange,
which is itself a part of the Richardson Road ridge).
76 A similar situation arises on the Waterview Project. For this reason
the 2D and 3D groundwater models have been calibrated to
representative water levels recorded within groups of piezometers at
particular locations. This does not mean that the models are poorly
calibrated, but simply that the recorded water levels apply to
different cascading groundwater levels and cannot all be used for
calibrating to one water level.
77 The Addendum also includes an updated Figure 3 from Technical
Report G.7, to show the revised geology as determined from the
2010 investigations. See Figure F1 in Annexure C.
COMMENTS ON SUBMISSIONS
78 I have read submissions lodged on the Project that raise
groundwater or related issues relevant to my area of expertise. In
this section of my evidence I will address these submissions to the
extent that they raise issues not already addressed in my evidence
or the groundwater assessment report.
Oakley Creek
79 A number of submitters have identified concerns that the Project will
affect Oakley Creek and its environment.14
80 The flow within Oakley Creek is made up of base flow and quick
flow. Quick flow is the portion of stream flow from rainfall runoff,
stormwater discharges and water discharges from the near surface
unsaturated soils. Base flow is the portion of stream flow received
from groundwater discharge and delayed shallow near surface flow.
In the case of Oakley Creek, quick flow makes up about two thirds
of Creek flow and base flow makes up about one third.
81 The portion of stream flow that can be influenced by tunnel
construction is base flow. Modelling indicates that the effect on
base flow is likely to be of the order of <2 % to 4 % along the
length of the northern portal and driven tunnels (<2 % in the long
term), and up to 6 % at the southern portal. This is a very small
14 Submitter Nos. 02, 017, 181, 185, 206 and 166.

20
091212799/1587176.
effect and will not be noticeable, given the natural variability in
stream flows (two thirds of flow varies in response to rainfall). The
greatest change in base flow is likely at the southern portal. As
described in the evidence of Dr Eddie Sides, this change, a reduction
of base flow by about 6 %, would not deleteriously impact the
ecology of the Creek. Essentially, this means that the Project will
not cause the drying up of Oakley Creek.
82 As identified in the proposed Groundwater Management Plan15, I
have recommended that a series of flow gauges be established
along the length of Oakley Creek to allow Creek flows to be
monitored for a period of at least 12 months prior to
commencement of construction. Monitoring of Creek flows will allow
two things: first, the calibration of the groundwater modelling
carried out as part of detailed design to actual flow changes, which
will refine predictions of effects on Creek flows; and second, actual
changes in Creek flows can be monitored and mitigation measures
implemented, should flow losses exceed those expected.
Groundwater level changes
83 Submissions made by the North Western Community Association
and Friends of Oakley Creek – Te Auaunga identify general concerns
about changes to groundwater levels and seek that the effects of
these changes be further assessed and mitigated accordingly.16
84 As described in the Report, and summarised in my evidence, both
2D and 3D computer groundwater modelling have been carried out.
The models were developed from data gathered over several years
from a large number of investigation sites to provide our best
understanding of the potential effects of the Project on groundwater
levels. Further investigations are planned to support detailed design.
A comprehensive suite of monitoring sites is being installed (along
Oakley Creek, within the area of predicted drawdown effects, and
beyond) to allow modelled water levels to be compared with actual
water levels and mitigative action to be taken in advance of effects
being realised, should potentially deleterious differences between
modelled and actual levels be recorded.
85 As there are no operational wells known to exist in the vicinity of the
tunnels, lowering of water levels is not expected to impact well
users.
86 As I describe in my evidence above, the effect of groundwater
lowering on Oakley Creek is expected to be less than minor.
15 See page 15, Appendix H of Technical Report G.7.
16 Submission Nos. 185 and 179.

21
091212799/1587176.
87 Ground settlement resulting from groundwater drawdown and
monitoring and mitigation of this are described in the evidence of
Mr Gavin Alexander.
88 I therefore consider that changes in groundwater level have been
adequately assessed as part of this application and confirm that this
assessment will be updated as part of detailed design, as will design
of any further mitigation, should this be required.
Submission by Auckland Regional Council17
Phyllis Street Reserve
89 The Auckland Regional Council (ARC) is concerned that ground
settlement at the Phyllis Street Reserve, which is a closed refuse
landfill, might result in cracking of the landfill cap which would allow
more rainfall to infiltrate the fill, potentially generating further
leachate which could then contaminate groundwater.18
90 As described in my evidence and in more detail in the Report, the
Phyllis Street Reserve is underlain by some 7 m to 21 m of low
permeability residual soils and Tauranga Group sediments. These
soils behave as an aquitard, significantly reducing the risk of
contaminants moving downward towards the tunnel excavation or
migrating into the deeper rock aquifer.
91 Groundwater modelling indicates that the vertical velocity of
groundwater within the layers underlying the fill is likely to be in the
order of 0.02 m/d during periods of maximum drawdown. Leachate
travelling at this rate would take some 650 days to reach the base
of the soils, with the average travel time being some 1800 days. As
the period of maximum vertical flow is limited to the time taken to
breakout and shotcrete each tunnel, the potential for leachate to
travel with groundwater into the rock below the landfill or into the
tunnel excavation is very low. Therefore, even if leachate were to be
generated within the landfill, it is unlikely that the Project would
exacerbate the spread of contaminants.
92 Nevertheless, it is agreed that it is preferable to avoid the potential
for generation of additional leachate, and as described in the
Groundwater Management Plan,19 the recording of water levels in
and around the Phyllis Street Reserve is proposed.
93 In order to address this concern, it is proposed that a trigger level
be established such that should water levels recorded in the shallow
piezometers installed within the Phyllis Street landfill rise above the
trigger, then an inspection of the surface of the landfill will be made
17 Submission No. 207.
18 Paragraphs 4.8.6 and 4.8.7 in Submission No. 207.
19 See section 6, pages 10-16 of Groundwater Management Plan, Appendix H, Technical Report G.7.
22
091212799/1587176.
and the surface re-levelled in areas where cracking of the cap or
ponding of water on the surface is indicated (other than exists prior
to commencement of the works).
Groundwater and ground settlement
94 The ARC identifies that groundwater drawdown will result in ground
settlement and that limits need to be set to provide warning of
potential problems with sufficient time for implementation of
remedial works.20
95 I agree, and have for this reason set out in Appendix A of the
Groundwater Management Plan a comprehensive suite of existing
and proposed monitoring locations. In section 6.1.7 of the Plan
Alert and Alarm levels are identified that have been derived from
the groundwater modelling performed.
96 Because groundwater drawdown occurs in advance of ground
settlement associated with the drawdown, monitoring of water
levels provides the necessary warning needed to initiate mitigative
works if drawdowns exceed those anticipated. Alert and alarm
trigger responses are set out in the Groundwater Management Plan.
Mitigation options are outlined in the Report.21
97 The ARC expresses concern that settlements have been calculated
along representative cross-sections, and that the geology between
sections might vary and therefore result in a different settlement
profile.22 While this aspect is addressed more fully in the evidence
of Mr Gavin Alexander, it is important to understand that while 2D
cross-sections are used to facilitate calculation of settlements, the
sections modelled were taken from 3D geological and ground
models and the drawdown profiles used are comparable or more
conservative than those derived from the 3D groundwater modelling
work. I therefore consider that an appropriately conservative
approach has been adopted.
98 The monitoring details requested at parts a, b and c of point 4.8.18
of the ARC submission are set out in the Groundwater Management
Plan. Details of settlement monitoring are described by Mr Gavin
Alexander and are set out in the Settlement Effects Management
Plan.23
99 The ARC submission suggests “that some of the proposed consent
conditions will not address matters in rules of the Proposed
Auckland Regional Plan: Air, Land, Water, such as rules 6.4.47,
20 Paragraphs 4.8.13 and 4.8.18 in Submission No. 207.
21 See section 7, pages 23-24 of Technical Report G.7.
22 Paragraph 4.8.16 in Submission No. 207.
23 See Appendix H of Technical Report G.13.
23
091212799/1587176.
6.5.68 and 6.5.69.”24 I disagree. These rules deal with Diverting
Groundwater and require that the life supporting capacity of water
bodies is provided for (addressed in my evidence and that of
Dr Eddie Sides), that existing lawful groundwater users are not
adversely affected (addressed in my evidence), that ground
settlement will be avoided, remedied or mitigated (addressed in the
evidence of Mr Gavin Alexander), that flooding will not be
exacerbated (addressed in the evidence of Mr Tim Fisher), that
adverse effects of groundwater discharge are avoided (addressed in
the evidence of Mr Graeme Ridley), that adverse effects on
ecosystem habitats are avoided, remedied or mitigated (addressed
in the evidence of Dr Eddie Sides) and that monitoring, including
recording of water levels and pressures and recording of the
movement of ground, building and other structures takes place
(addressed in my evidence and that of Mr Gavin Alexander).
100 It is therefore my view that the rules and policies of the Auckland
Regional Plan: Air, Land, Water that relate to the diversion of
groundwater have been considered in this application and will be
complied with.
Submission by Auckland City Council25
101 Auckland City Council’s concerns with respect to groundwater relate
to the potential for contaminants held in existing landfills (in
particular Phyllis Street Reserve, but also Alan Wood Reserve) to be
mobilised by both short term and long term groundwater
drawdown.26
Phyllis Street Landfill
102 Details of investigations of contaminants and contamination levels
are described in the evidence of Mr Terry Widdowson. I note that
‘water’ levels within the Phyllis Street landfill are so low that it was
difficult to obtain samples for testing.
103 This is not surprising because the area of the Phyllis Street landfill is
understood to have originally been underlain by basalt that overlay
low permeability Tauranga Group sediments and weathered East
Coast Bays Formation soils. The landfill is formed adjacent to Oakley
Creek and the base of the basalt was above the level of Oakley
Creek. The basalt was quarried, and the space that was left was
filled with refuse. This means that much of the leachate that
developed over time is likely to have drained into Oakley Creek, but
some would have been retained in the upper part of the underlying
sediments.
24 Paragraph 4.8.10 in Submission No. 207.
25 Submitter No. 111.
26 Points 340, 394 and 398 in Submission No. 111.

24
091212799/1587176.
104 Our assessment of the potential for spread of contaminants as a
result of the strong vertical hydraulic gradient induced during tunnel
construction utilised the groundwater models established and
tracked the time taken for a ‘particle’ of water located just above
the base of the landfill to travel through the soils underlying the
landfill. As I describe above, the model indicates a minimum travel
time of 650 days, well in excess of the time in which a 50 m section
of tunnel below the landfill will have been broken out and
shotcreted. I note also that this is the travel time of water and that
many contaminants travel more slowly than water.
105 I therefore consider that the assessment of the potential for spread
of contaminants from the Phyllis Street landfill and the monitoring
identified in the Groundwater Management Plan are appropriate.
Alan Wood Reserve
106 Assessments of the extent of landfilling at Alan Wood Reserve have
shown that contaminated fill is localised and will be removed and
replaced with inert fill where it is encountered as described in the
evidence of Mr Terry Widdowson.
COMMENTS ON REPORTS TO THE BOARD
107 The ARC, in its s149G Key Issues Report suggests that “the
interpretation of site characterisation and irregularities in
groundwater model calibration has resulted in a less conservative
estimate of groundwater drawdown effects to the west of the tunnel
alignment.” This is responded to in Appendix 4 of the Addendum
(attached in Annexure C) and paragraphs 73 to 77 of my evidence.
108 The ARC identifies that if the ground is fully saturated from near the
ground surface in the Waitemata Group ridge to the west of the
alignment, then the drawdown will be larger than predicted and
extend further than predicted. If this were the case, then the
amount and extent of ground settlement would be greater than
predicted.
109 However, the collective data demonstrate that the groundwater
profile in the Waitemata Group ridge is not a single fully saturated
soil mass but is a cascading series of perched water tables with
lower separated water lenses occurring within the Waitemata Group
soils and rocks. This has been shown to occur elsewhere in the
Waitemata Group in Auckland, and at cuts as part of the Maioro
Street interchange work close by.
110 I therefore conclude that the modelled drawdowns represent our
best estimate of what will occur in response to tunnelling.
111 The models have been calibrated to a representative groundwater
level profile recorded within one horizon. There are no irregularities

25
091212799/1587176.
in model calibration. This approach is equally representative of the
other perched water tables that exist at each location.
PROPOSED GROUNDWATER CONDITIONS
112 In the documentation lodged with the AEE, the NZTA included a set
of Proposed Consent Conditions (see Part E, Appendix E.1). This
included proposed groundwater conditions which I recommended
would be appropriate to attach as conditions to the designations
sought. A copy of the proposed conditions is contained in
Annexure D to my evidence.
113 I consider that those conditions are still appropriate with some
minor modifications as marked in Annexure D to my evidence.
________________
Ann Williams
November 2010
Annexures:
Annexure A – Distribution of Hydrogeological Units
Annexure B – Summary of Predicted Effects (Table 8.1)
Annexure C – Addendum to Technical Report G.7
Annexure D – Amended Proposed Groundwater Conditions

26
091212799/1587176.
ANNEXURE A: DISTRIBUTION OF HYDROGEOLOGICAL UNITS


27
091212799/1587176.
ANNEXURE B: TABLE 8.1 OF THE REPORT - SUMMARY OF
PREDICTED EFFECTS27
27 See page 28 of Technical Report G.7.

Waterview Connection
Status Final Rev B Page 28 July 2010 Document Reference No 20.1.11 3 R N 1014 Assessment of Groundwater Effects
Table 8.1 Summary of Predicted Effects
Northern Cut and Cover Tunnels (Sealed)
Effect Lower Bound Upper Bound
Construction Maximum Long Term Maximum Construction Maximum Long Term Maximum
Inflow to Tunnel 0.02 to 1 m3/day/m of tunnel
0.02 m3/day/m of tunnel 0.5 to 2 m3/day/m of tunnel 1.0 m3/day/m of tunnel
Drawdown magnitude at base
TGA/ WPG
< 0.5 m to 2 m 3.0 m 2 m to 8 m 5.0 m
Drawdown extent at base TGA/
WPG1
< 25 m < 25 m 30 m to 180 m 150 m
Drawdown magnitude at top of
Rock
0.6 m to 1 m 5.0 m 10 m to 20 m 15 m
Drawdown extent at top of Rock1 30 m 100 m 180 m 300 m
Oakley Creek Leakage ~2 % reduction throughout
Driven Tunnel
Effect Lower Bound Upper Bound
Construction Maximum Long Term Maximum Construction Maximum Long Term Maximum
Inflows 2 m3/day/m of tunnel 0.07 m3/day/m of tunnel 118 m3/day/m of tunnel
(8 to 20 m3/day/m of tunnel if pre-grouted)
0.02 m3/day/m of tunnel
(0.02 m3/day/m of tunnel if pre-grouted)
Drawdown magnitude at base
TGA/ WPG
0.5 m to 4.5 m 0.2 m 15 m to 32 m
(8m to 15 m if pre-grouted)
0.65 m
(3m if pre-grouted)
Drawdown extent at base TGA/
WPG1
50 m to 100 m < 50 m 400 m
(250 m if pre-grouted)
300 m
(<50m if pre-grouted)
Drawdown magnitude at top of
Rock
7 m to 15 m 0.2 m 35 m
(31 m if pre-grouted)
0.3 m to 1 m
(<0.5m if pre-grouted)
Drawdown extent at top of Rock1 150 m < 50 m 350 m
(280 m if pre-grouted)
< 50 m
Oakley Creek Leakage 0 % Reduction 0 % Reduction 5 % Reduction
(2.5 – 3.5 % if pre-grouted)
3.5 % Reduction
Southern Portal and Approaches
Effect Lower Bound Upper Bound
Construction Maximum Long Term Maximum Construction Maximum Long Term Maximum
Inflows 0.2 m3/day/m of tunnel <0.2 m3/day/m of tunnel 73 m3/day/m of tunnel 0.5 m3/day/m of tunnel
Drawdown magnitude at base
TGA/ WPG
1.8 m 1.8 m 12.8 m 13.4 m
Drawdown extent at base TGA/
WPG1
< 30 m < 30 m 60 m 60 m
Drawdown magnitude at top of
Rock
2.5 m 3 m 25 m 25 m
Drawdown extent at top of Rock1 50 m to 100 m throughout
Oakley Creek Leakage 7 % reduction throughout
Results from 2D and 3D modelling combined. As a rule, the lower bound is where the tunnel is driven through ECBF, and the upper bound is where the tunnel is driven through PG, actual magnitude encountered at any specific location will range between the two end values and is dependent on geological profile. Refer to, Appendices F and G.
1 Maximum extent of drawdown taken as the distance where drawdown = < 0.5m
PG = Parnell Grit, ECBF = East Coast Bays Formation, TGA = Tauranga Group, WPG = Weathered Parnell Grit

28
091212799/1587176.
ANNEXURE C: ADDENDUM TO REPORT G.728
28 Appendix 4, Technical Report G.31.

! "#$%&'(%)!*+,,%-$(+,!
!
! ! ! !
! ! ! "#$%!&'(!! )*+(!,--%.-/0!1%2345!! ! ! !
! ! ! !! !!
.%-/,(-#0!122%223%,$6!)*7!,88%880%.5!39!)43/.-:#5%4!;99%<58!
4%25+,6%,$6!,..!=>??>#08@!A%<#!
!
BC>8!,--%.-/0!>8!24%2#4%-!53!243D>-%!9/45C%4!<?#4>5E!3.!5C%! >.5%424%5#5>3.!39!$43/.-:#5%4!8E85%08!F2%4<C%-!
#.-!4%$>3.#?G!:>5C>.! 5C%!=#>5%0#5#!)43/2! F;HAIG! 4>-$%@!#.-!5C%!#883<>#5%-!03-%?!<#?>J4#5>3.!3.!5C%!:%85%4.!
8>-%!39!5C%!5/..%?!#?>$.0%.5*!!
./%!7+6%0!
,8!3<</48!5C43/$C3/5!5C%!=#>5%0#5#!)43/2!43<K8!>.!5C%!,/<K?#.-!1%$>3.@!#!<#8<#->.$!8%4>%8!39!2%4<C%-!:#5%4!
!"#$%&'())*+&',-!.-/'!.%'0"-!%1"!"'2+(*34'0"!%+'5."/6&'*37'(/'$(,%+'3%+1%"#-$-!8'$"8%+&9'&$(,$8':-&)."4$>.$!
!.+(*6.';+")!*+%&'"/:'!.%'+()<'1"&&'!('!.%'*/:%+$8-/6'.-6.%+'3%+1%"#-$-!8'$"8%+&'*/!-$'"6"-/'#%-/6'5)"*6.!7'
#J3D%!#!9/45C%4!?3:!2%40%#J>?>5E!?#E%4*!BC%!C%#-!39!:#5%4!3.!%#<C!8/<<%88>D%!:#5%4!5#J?%!>8!3.?E!#!94#<5>3.!39!
5C%!535#?!C%#-!J%5:%%.!5C%!4%$>3.#?!F?3:%85!4%<34-%-G!:#5%4!5#J?%!#.-!5C%!/22%40385!.%#4'8/49#<%!:#5%4!5#J?%*!
BC>8!>8!<344%<5!!"!#$%&!'!$(&!$)*++!)),"!$%-(!'$(-./!$&!-0)$1"!'/-2*!BC%4%934%!:C%.!-%%2!%L<#D#5>3.8!#4%!
0#-%!>.!=#>5%0#5#!)43/2!43<K@!5C%8%!?3<#?!/22%4!2%4<C%-!:#5%4!5#J?%8!->8<C#4$%!:>5C3/5!>.-/<>.$!.35><%#J?%!
$43/.-!8%55?%0%.5*!
M%#-!->99%4%.<%8!39!N!0!#4%!<3003.?E!3J8%4D%-!J%5:%%.!8/<<%88>D%!:#5%4!5#J?%8*!O.!830%!#4%#8!5C%!->99%4%.<%!
>8!?%88!243.3/.<%-*!BC%!03-%?!<#?>J4#5>3.!2?35!8C3:8!#??!2>%P30%5%4!4%#->.$8!F%L<%25!5C%!/22%40385!?%D%?8!
9430!AMN(Q!#.-!AMNRSG*!!M3:%D%4!5C%!03-%?!C#8!.35!J%%.!<#?>J4#5%-!53!5C%!2%4<C%-!:#5%4!5#J?%8!#8!5C>8!>8!
<?%#4?E!.35!#224324>#5%!#.-!:3/?-!J%!>.<344%<5*!!O.!03-%?!<#?>J4#5>3.@!<3.8>-%4#5>3.!C#8!J%%.!$>D%.!53!5C38%!
2>%P30%5%48!>.!<?38%!243L>0>5E!53!5C%!#?>$.0%.5@!:C><C!#4%!#?83!$%.%4#??E!<?38%4!53!5C%!4%$>3.#?!:#5%4!?%D%?!
J%<#/8%!5C%!#?>$.0%.5!4/.8!934!5C%!0385!2#45!J%.%#5C!?3:%4!%?%D#5>3.!$43/.-!#883<>#5%-!:>5C!T#K?%E!H4%%K*!
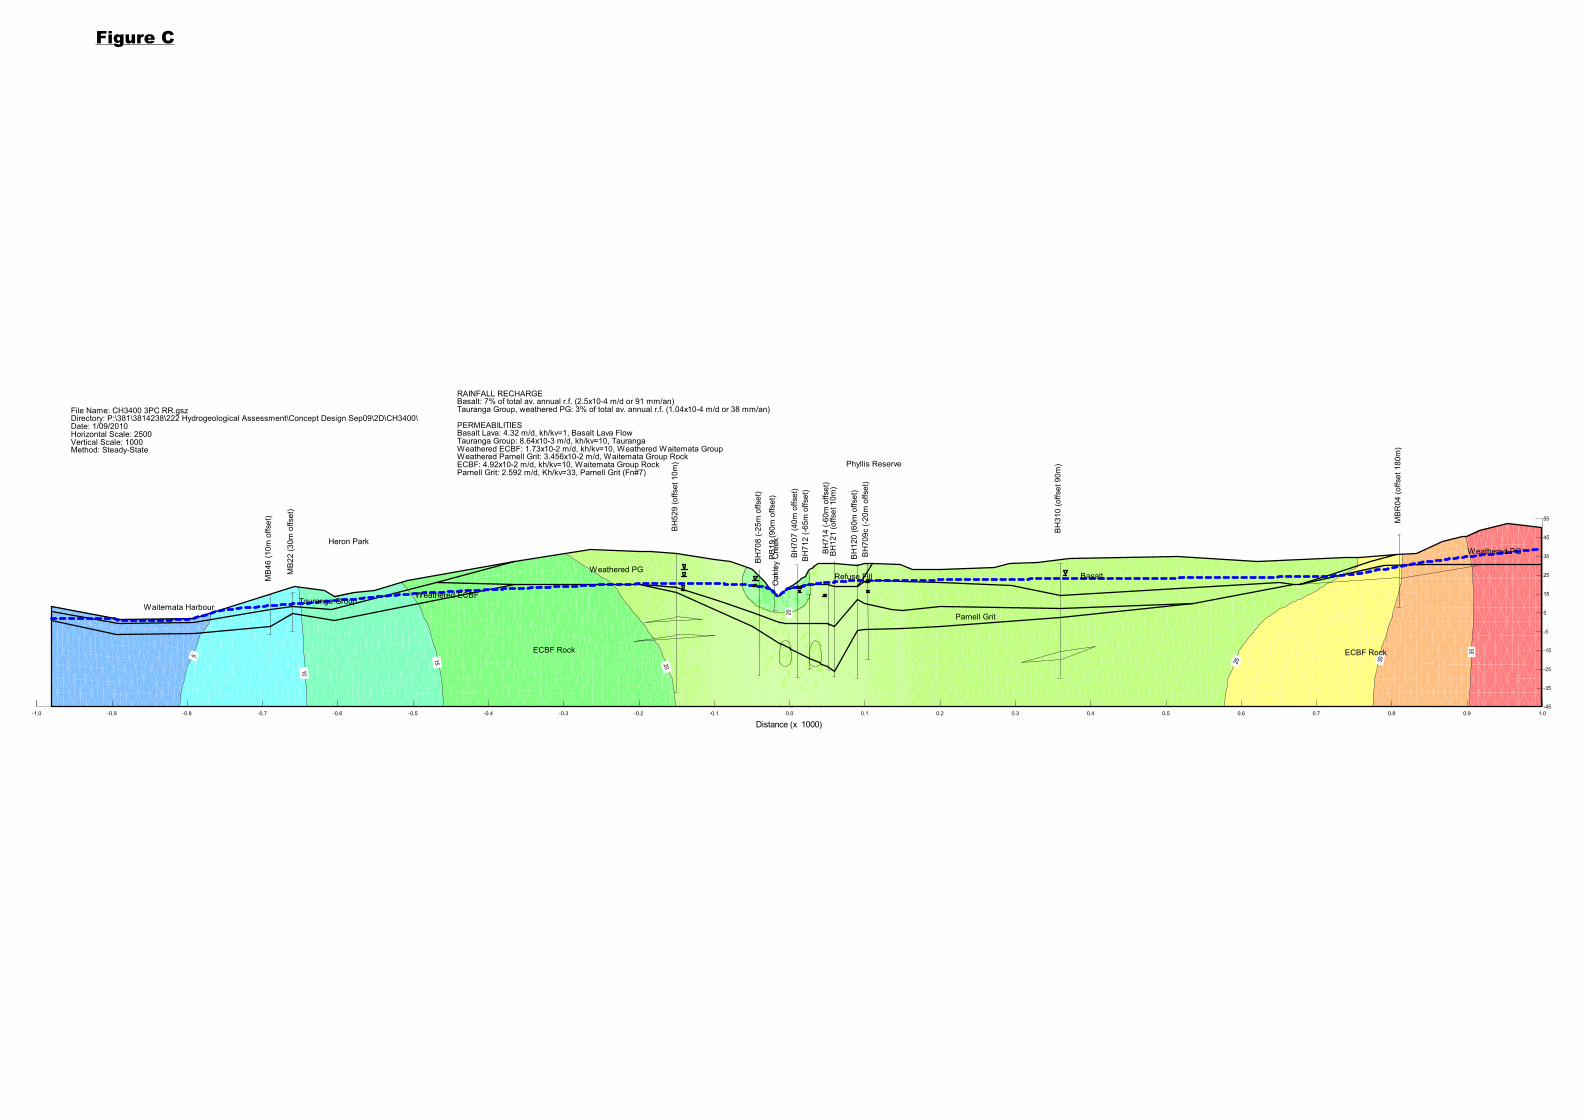
I>$/4%!I(!24%8%.5%-!>.!5C%!!"#$!%&'()&*++"++,"-%&$.&'!$/-012%"!&3.."4%+&52+&6""-&/#02%"0(&75"&!28-.299&
!"452!:"&;$-"+&,$0"99"0&2!"&+5$1-&8-&%5"&<8:/!"&<=2%%245"0&8-&*##"-08>&*(!!
89!1,#0:2%2!
O.!2?#<%8!5C%!:#5%4!5#J?%!03-%??%-!>8!U/85!J%?3:!5C#5!4%<34-%-!>.!2>%P30%5%48*!HC%<K!#.#?E8%8!:%4%!<#44>%-!3/5!
#5!HM!Q7NR!0!#.-!HM!+&RR!0!53!<3.8>-%4!5C%!%99%<5!39!#!:#5%4!5#J?%!U/85!#J3D%!:#5%4!?%D%?8!4%<34-%-!>.!
2>%P30%5%4!8/>5%8*!!
O5!:#8!8/$$%85%-!5C#5!5C>8!J%!#55%025%-!JE!>.<4%#8>.$!5C%!#.>835432E!F?3:%4>.$!5C%!D%45><#?!CE-4#/?><!
<3.-/<5>D>5EG!#.-!JE!>.<4%#8>.$!4%<C#4$%*!!
,-U/85>.$!5C%!D%45><#?!#.>835432E!53!D#?/%8!D%4E!0/<C!?3:%4!5C#.!93/.-!>.!5%85>.$!34!%?8%:C%4%!>.!,/<K?#.-!>8!
.%%-%-!53!4#>8%!5C%!:#5%4!5#J?%!J%.%#5C!5C%!4>-$%@!C3:%D%4!:>5C!8/<C!?3:!D%45><#?!CE-4#/?><!<3.-/<5>D>5E!5C%!
%L5%.5!#.-!#03/.5!39!-4#:-3:.!>8!80#??!F?%88!5C#.!>.!5C%!34>$>.#?!J#8%!<#8%!03-%??>.$G*!!
! "#$%&'(%)!*+,,%-$(+,!
!
! ! ! !
! ! ! "#$%!&'(!! )*+,!-..%/.01!2%3456!! ! ! !
! ! ! !! !!
-33789/$!+!:!5#9/;#77!64!6<%!(=!14.%7>!?#>!#75%#.8!#3379%.!9/!+=!14.%779/$@!.4%>!9/A5%#>%!6<%!14.%77%.!B#6%5!
6#C7%!64!#!5%#>4/#C7%!7%D%7E!F0>6!#C4D%!6<%!74B%>6!5%A45.%.!B#6%5!7%D%7>!?G9$05%>!-E!H!#/.!I!9/!-33%/.9J!-@*!K<%!
14.%7>!B%5%!6<%/!50/!B96<!6<%!14.9;9%.!B#6%5!6#C7%*!
.%$$/%0%,$!
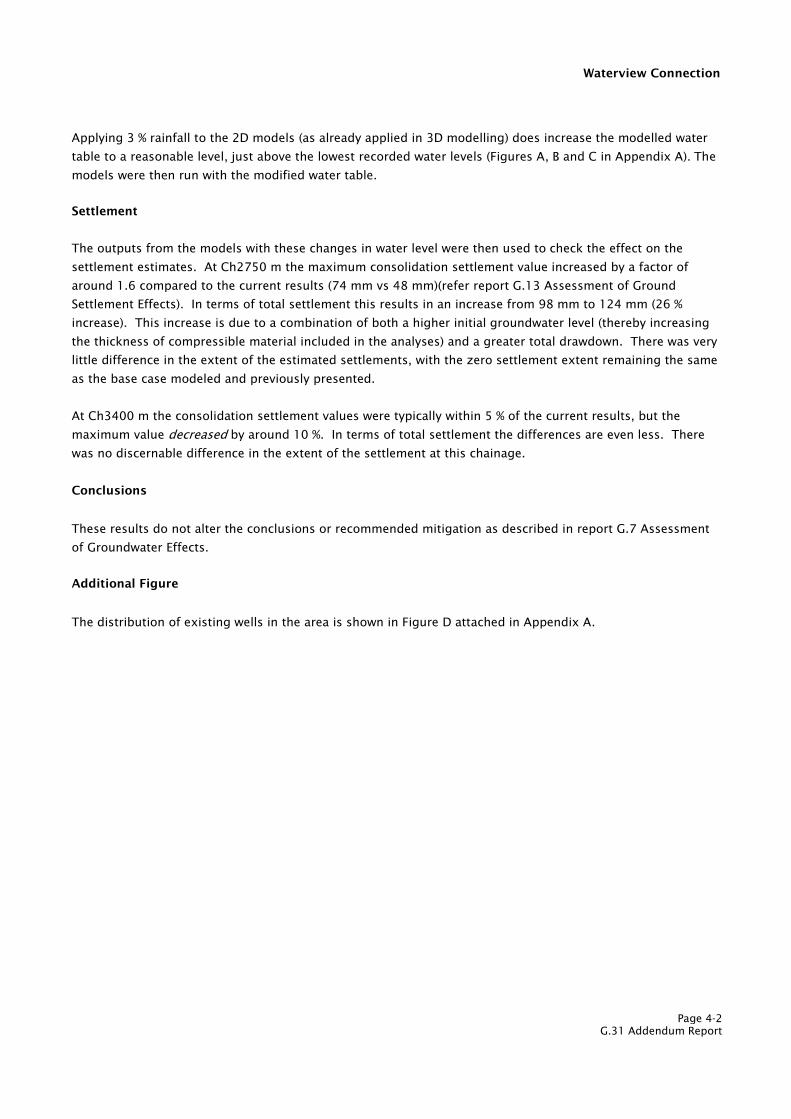
!"#$%&'(&')$*+%,$'"#$,%-#.)$/0'"$'"#)#$1"234#)$03$/2'#+$.#5#.$/#+#$'"#3$&)#-$'%$1"#16$'"#$#**#1'$%3$'"#$
)#''.#,#3'$#)'0,2'#)7$$8'$9":;<=$,$'"#$,2>0,&,$1%3)%.0-2'0%3$)#''.#,#3'$52.&#$031+#2)#-$?@$2$*21'%+$%*$
2+%&3-$A7B$1%,(2+#-$'%$'"#$1&++#3'$+#)&.')$C;D$,,$5)$DE$,,FC+#*#+$+#(%+'$G7AH$8))#)),#3'$%*$G+%&3-$
I#''.#,#3'$J**#1')F7$$K3$'#+,)$%*$'%'2.$)#''.#,#3'$'"0)$+#)&.')$03$23$031+#2)#$*+%,$LE$,,$'%$A:D$,,$C:B$M$
031+#2)#F7$$!"0)$031+#2)#$0)$-&#$'%$2$1%,?032'0%3$%*$?%'"$2$"04"#+$030'02.$4+%&3-/2'#+$.#5#.$C'"#+#?@$031+#2)034$
'"#$'"0163#))$%*$1%,(+#))0?.#$,2'#+02.$031.&-#-$03$'"#$232.@)#)F$23-$2$4+#2'#+$'%'2.$-+2/-%/37$$!"#+#$/2)$5#+@$
.0''.#$-0**#+#31#$03$'"#$#>'#3'$%*$'"#$#)'0,2'#-$)#''.#,#3')N$/0'"$'"#$O#+%$)#''.#,#3'$#>'#3'$+#,203034$'"#$)2,#$
2)$'"#$?2)#$12)#$,%-#.#-$23-$(+#50%&).@$(+#)#3'#-7$$$
8'$9"HD==$,$'"#$1%3)%.0-2'0%3$)#''.#,#3'$52.&#)$/#+#$'@(012..@$/0'"03$<$M$%*$'"#$1&++#3'$+#)&.')N$?&'$'"#$
,2>0,&,$52.&#$-#1+#2)#-$?@$2+%&3-$A=$M7$$K3$'#+,)$%*$'%'2.$)#''.#,#3'$'"#$-0**#+#31#)$2+#$#5#3$.#))7$$!"#+#$
/2)$3%$-0)1#+32?.#$-0**#+#31#$03$'"#$#>'#3'$%*$'"#$)#''.#,#3'$2'$'"0)$1"20324#7$
*+,-/12(+,2!
!"#)#$+#)&.')$-%$3%'$2.'#+$'"#$1%31.&)0%3)$%+$+#1%,,#3-#-$,0'042'0%3$2)$-#)1+0?#-$03$+#(%+'$G7;$8))#)),#3'$
%*$G+%&3-/2'#+$J**#1')7$
344($(+,#/!5(61&%!
K<%!.9>659C0694/!4;!%J9>69/$!B%77>!9/!6<%!#5%#!9>!><4B/!9/!G9$05%!=!#66#A<%.!9/!-33%/.9J!-*!
!
!
!
!
!
!

! "#$%&'(%)!*+,,%-$(+,!
!
! ! ! !
! ! ! "#$%!&'(!! )*(+!,--%.-/0!1%2345!! ! ! !
! ! ! !! !!
.//%,0(1!.

Figure F1 Addendum
1 27 2%
2 0 0%
3 0 0%
4 38 3%
5 91 7%
Based on average rainfall 1350 mm/yr
"Typical" background ECBF, higher % to encourage elevated GWLs as
recorded through this zone.
Areas of basalt or thick (and coarse) tephra deposits therefore greater
recharge, as demonstrated by monitoring records.
Recharge
(mm / yr)
Zone % Rainfall Comments
"Typical" background ECBF, at lower end of typically accepted range (2
- 10%) due to urbanisation.
Steep banks > 30 degrees therefore most rainfall will run off into creek
so negligible recharge.
Groundwater springs / artesian conditions therefore negligible
downward recharge likely.

BH
52
2 (
30
m o
ffse
t)
BH
50
8 (
20
m o
ffse
t)
BH
30
7
MB
R0
3 (
off
se
t 1
20
m)
BH
11
7 (
off
se
t 9
0m
)
MB
45
(o
ffse
t -7
0m
)
BH
51
8 (
60
m o
ffse
t)
RAINFALL RECHARGE
Basalt: 7% of total av. annual r.f. (2.5x10⁻⁴ m/d or 91 mm/an)
Tauranga Group: 3% of total av. annual r.f. (1.04x10⁻⁴ m/d or 38 mm/an)
Weathered Waitemata Group: 3% of total av. annual r.f. (1.04x10⁻⁴m/d or 38mm/an)
PERMEABILITIES
Basalt Lava: 4.32 m/d, kh/kv=1, Basalt Lava Flow Tauranga Group: 8.64x10⁻³ m/d, kh/kv=10, Tauranga
Weathered ECBF: 1.73x10⁻² m/d, kh/kv=10, Weathered Waitemata Group
ECBF Rock: 4.92x10⁻² m/d, kh/kv=10, Waitemata Group Rock
File Name: CH2750 3PC RR.gszDirectory: P:\381\3814238\222 Hydrogeological Assessment\Concept Design Sep09\2D\CH2750\
Date: 30/08/2010
Last Edited By: Erica Cammack
Horizontal Scale:2500Vertical Scale: 1000
Method: Steady-State
Oa
kle
y C
ree
k
MB
20
(2
0m
off
se
t)
ECBF Rock
ECBF Rock
Weathered ECBF
Weathered ECBF
Weathered ECBF
Weathered PG
BasaltTGA
BH
70
3 (
57
m o
ffse
t)
Distance (x 1000)
-0.6 -0.5 -0.4 -0.3 -0.2 -0.1 0.0 0.1 0.2 0.3 0.4 0.5 0.6 0.7 0.8 0.9 1.0-40
-30
-20
-10
0
10
20
30
40
50
60
Figure A

26
30
32
3
4
34
36
36
38
38
BH
52
2 (
30
m o
ffse
t)
BH
50
8 (
20
m o
ffse
t)
BH
30
7
MB
R0
3 (
off
se
t 1
20
m)
BH
11
7 (
off
se
t 9
0m
)
MB
45
(o
ffse
t -7
0m
)
BH
51
8 (
60
m o
ffse
t)
Basalt: 7% of total av. annual r.f. (2.5x10⁻⁴ m/d or 91 mm/an)
Tauranga Group: 3% of total av. annual r.f. (1.04x10⁻⁴ m/d or 38 mm/an)
Weathered Waitemata Group: 3% of total av. annual r.f. (1.04x10⁻⁴m/d or 38mm/an)
PERMEABILITIES
Basalt Lava: 4.32 m/d, kh/kv=1, Basalt Lava Flow
Tauranga Group: 8.64x10⁻³ m/d, kh/kv=10, Tauranga
Weathered ECBF: 1.73x10⁻² m/d, kh/kv=10, Weathered Waitemata Group
ECBF Rock: 4.92x10⁻² m/d, kh/kv=10, Waitemata Group Rock
File Name: CH2750 3PC RR.gsz
Directory: D:\Users\ec2\Desktop\
Date: 30/08/2010
Horizontal Scale:2500
Vertical Scale: 1000
Method: Steady-State
Oa
kle
y C
ree
k
MB
20
(2
0m
off
se
t)
ECBF Rock
ECBF Rock
Weathered ECBF
Weathered ECBF
Weathered ECBF
Weathered PG
BasaltTGA
BH
70
3 (
57
m o
ffse
t)
Distance (x 1000)
-0.6 -0.5 -0.4 -0.3 -0.2 -0.1 0.0 0.1 0.2 0.3 0.4 0.5 0.6 0.7 0.8 0.9 1.0
-40
-30
-20
-10
0
10
20
30
40
50
60
Figure B
5
10
15
20
20
25
30
35
Oa
kle
y C
ree
k
Waitemata Harbour
Refuse Fill
Phyllis Reserve
BH
12
1 (
offse
t 1
0m
)
BH
31
0 (
offse
t 9
0m
)
Heron Park
BH
70
8 (
-25
m o
ffse
t)
BH
52
9 (
offse
t 1
0m
)
MB
R0
4 (
off
se
t 1
80
m)
BH
70
7 (
40
m o
ffse
t)
BH
71
2 (
-65
m o
ffse
t)
MB
22
(3
0m
offse
t)
MB
46
(1
0m
offse
t)
BH
12
0 (
60
m o
ffse
t)
PB
19
(9
0m
offse
t)
RAINFALL RECHARGEBasalt: 7% of total av. annual r.f. (2.5x10⁻⁴ m/d or 91 mm/an)Tauranga Group, weathered PG: 3% of total av. annual r.f. (1.04x10⁻⁴ m/d or 38 mm/an)
PERMEABILITIESBasalt Lava: 4.32 m/d, kh/kv=1, Basalt Lava FlowTauranga Group: 8.64x10⁻³ m/d, kh/kv=10, TaurangaWeathered ECBF: 1.73x10⁻² m/d, kh/kv=10, Weathered Waitemata GroupWeathered Parnell Grit: 3.456x10⁻² m/d, Waitemata Group RockECBF: 4.92x10⁻² m/d, kh/kv=10, Waitemata Group RockParnell Grit: 2.592 m/d, Kh/kv=33, Parnell Grit (Fn#7)
File Name: CH3400 3PC RR.gszDirectory: P:\381\3814238\222 Hydrogeological Assessment\Concept Design Sep09\2D\CH3400\Date: 1/09/2010Horizontal Scale: 2500Vertical Scale: 1000Method: Steady-State
ECBF Rock ECBF Rock
Weathered ECBF
Weathered PG
Weathered PG
Basalt
Parnell Grit
Tauranga Group
BH
70
9c (
-20
m o
ffse
t)
BH
71
4 (
-60
m o
ffse
t)
Distance (x 1000)
-1.0 -0.9 -0.8 -0.7 -0.6 -0.5 -0.4 -0.3 -0.2 -0.1 0.0 0.1 0.2 0.3 0.4 0.5 0.6 0.7 0.8 0.9 1.0
-45
-35
-25
-15
-5
5
15
25
35
45
55
Figure C

Figure D Addendum
Rec BORE IDFILE
REFERENCE
CONSENT
HOLDER
EXPIRY
DATE
CONSENT
STATUSPURPOSE EASTING NORTHING LOCATION DIAMETER
SCREEN
FROM
SCREEN
TO
STATIC
WATER
LEVEL
22 C512-12-2094
Fulton Hogan
Limited 19981208 Expired
Irrigation
supply 1750330 5916080
203 Rosebank
Rd, Avondale
College 100 91.4 300 11
23 C512-12-1724*
Auckland City
Council 19970222 Expired
Stock /
domestic
supply 1753100 5917400
Roadside
berm, Cnr
Leone Terrace
& Martin
Terrace 65
39 1754000 5916800
40 C512-12-1285
Kings Plant
Barn Limited 19950623 Expired
Irrigation
supply 1753738 5917642
118 Asquith
Ave 100 15 30 10
42 C512-12-1574
LAYTONS
LINEN HIRE
LTD 19960508 Expired
Industrial
use 1752246 5917538
Star Laundry,
1A Carrington
Road 100 91 300 2
Map Showing Location of Private Wells (relative to modelled area)
No informationNo information
2661000 2661500 2662000 2662500 2663000 2663500 2664000
6476000
6476500
6477000
6477500
6478000
6478500
6479000
6479500
6480000
20069
5205
2618
13654819

29
091212799/1587176.
ANNEXURE D: AMENDED PROPOSED GROUNDWATER
CONDITIONS29
29 Contained in AEE, Appendix E.1, pages 45 - 47. Underlined text indicates
amended or new conditions.
G.1 The NZTA shall finalise, and implement through the CEMP, the Groundwater Management Plan (GWMP), submitted with this application and provide it to the [Auckland Council] prior to commencement of tunnelling. The GWMP shall include, but not be limited to:
(a) The location of the groundwater monitoring bores;
(b) The location of the continuous monitoring stations on Oakley Creek;
(c) The methods and frequency for groundwater monitoring;
(d) The groundwater trigger levels;
(e) Procedures to follow in the event of trigger levels being exceeded;
(f) Reporting requirements;
G.2 The NZTA shall install and maintain the groundwater monitoring boreholes shown in Appendix A of the GWMP, for the period of monitoring specified in this Consent.
G.3 The NZTA shall monitor groundwater levels in the groundwater monitoring boreholes shown in Appendix A of the GWMP and keep records of the water level measurement and corresponding date in accordance with the GWMP. These records shall be compiled and submitted to the [Auckland Council] at three monthly intervals.
G.4 The NZTA shall monitor groundwater levels monthly in existing boreholes and in newly installed monitoring boreholes shown in Appendix A of the GWMP (required as part of this consent, as far as practicable) for a period of at least 12 months before the commencement of tunnelling. The variability in groundwater levels over this period, together with the monitoring trends obtained during the investigation and detailed design phases, will be used to establish seasonal groundwater level variability and establish trigger levels.
G.5 Prior to the commencement of tunnelling, and then at 3 monthly intervals while tunnelling, the NZTA shall review the results of monitoring as compared with expected effects on groundwater levels due to tunnelling. This review will consider the final tunnel alignment construction methodology and progress at the time of the review.
The output of the first review shall be used to define the expected range of groundwater levels at each borehole during tunnelling activities and check the potential for damage to structures due to ground settlement. A factor for natural seasonal variability shall be allowed for in this review based on the monitoring completed under Condition G.4.

30
091212799/1587176.
G.6 From commencement of tunnelling, the NZTA shall monitor groundwater levels in each borehole at a minimum of monthly intervals and records shall be kept of each monitoring date and the corresponding water level in each borehole. In addition, all boreholes located within 100 metres of the tunnel excavation face shall be monitored for groundwater level at least twice weekly. These records shall be compiled and submitted to the [Auckland Council] at three monthly intervals.
G.7 From commencement of tunnelling, the NZTA shall monitor groundwater level in boreholes established in the Phyllis Street Reserve. Should water levels rise more than 0.6 m above the highest recorded pre-construction water level in the period where tunnelling is taking place within 100 m of the Reserve, then an inspection of the surface of the landfill will be made and the surface re-levelled in areas where cracking of the cap or ponding of water on the surface is indicated (other than exists prior to commencement of the works).
G.8 All monitoring data obtained pursuant to Condition G.6 shall be compared to the predicted groundwater levels for each borehole. Where groundwater levels are exceeded the appropriate actions as set out in the GWMP shall be undertaken and the [Auckland Council] shall be notified, forthwith, advising of the exceedance, the risk of settlement that might cause damage to structures or adverse effects in Oakley Creek, and details of the actions undertaken.
G.9 The NZTA shall continue to monitor groundwater levels in each borehole at monthly intervals for a period of up to 12 months following completion of tunnelling, then 3 monthly thereafter for a further 24 months, or for a lesser period if groundwater levels in any particular borehole show either:
(a) Recovery of the groundwater level to within 2 metres of the pre-tunnelling
groundwater level as recorded in accordance with Condition G.5; or,
(b) A trend of increasing groundwater level in at least 3 consecutive monthly
measurements; or,
(c) An equilibrium in the groundwater level, allowing for the seasonal variation,
has been reached,
In which case monitoring at that borehole may cease, subject to the written approval of the [Auckland Council].

31
091212799/1587176.
G.10 The NZTA shall establish continuous flow monitoring stations at the following approximate locations within Oakley Creek:
(a) Chainage 1800 - 1900 (Waterview Connection Operational Plan, Drawing No:
20.1.11-3-D-C-910-117);
(b) Chainage 2200 (Waterview Connection Operational Plan, Drawing No:
20.1.11-3-D-C-910-116);
(c) Chainage 3500 (Waterview Connection Operational Plan, Drawing No:
20.1.11-3-D-C-910-114); and
(d) Between Chainage 3900 to 4200 ((Waterview Connection Operational Plan, Drawing No: 20.1.11-3-D-C-910-113).
The NZTA shall establish a continuous flow monitoring station at the upstream major tributary at Chainage 1000.
The NZTA shall continue to monitor the flow monitoring station installed at CH2900 (Waterview Connection Operational Plan, Drawing No: 20.1.11-3-D-C-910-116).
The exact location of the gauges shall be determined based on stream bed conditions such that they record the full range of flows as far as practical, with the locations detailed in the GWMP.
G.11 The continuous monitoring required by Condition G.9, shall record in-stream flows, at 15 minute intervals, for a period of:
(a) At least 12 months prior to tunnelling commencing;
(b) During tunnelling; and
(c) Up to 12 months following completion of tunnelling, or a shorter period if no
effects on base flows are recorded.
G.12 The continuous monitoring results shall be reviewed on a monthly basis to determine if there is any effect of the tunnelling on base flows in Oakley Creek. The results shall be included in the 3 monthly groundwater reports, and provided to the [Auckland Council].
G.13 The NZTA shall, within 10 working days of completion of tunnelling, advise the Manager [Auckland Council], in writing, of the date of completion.