behavior based energy efficiency (bbee) - bpa.gov ... behavior based energy efficiency program...
TRANSCRIPT

Residential Behavior Based Energy Efficiency Program Profiles 2011
Bonneville Power Administration
Residential
Behavior Based Energy Efficiency
Program Profiles
2011
Prepared by Skip Schick and Summer Goodwin,
Bonneville Power Administration
December 2011
Residential Behavior Based Energy Efficiency Program Profiles 2011
Table of Contents
Introduction .................................................................................................................................................. 3
Summary of Key Features and Results from Profiled Programs ................................................................... 4
Residential Behavior Based Energy Efficiency – Programs Summary Matrix ............................................... 9
Residential Behavior Based Energy Efficiency Program Profiles ................................................................ 10
Regional Profiles ..................................................................................................................................... 10
Puget Sound Energy Home Energy Reports (with OPower) ............................................................... 10
Seattle City Light Home Energy Reports (with OPower) ..................................................................... 15
Snohomish Public Utility District Energy Challenge ............................................................................ 19
Energy Trust of Oregon Home Energy Reports Pilot (with OPower) .................................................. 22
National/North American Profiles .......................................................................................................... 24
B.C. Hydro Team Power Smart ............................................................................................................ 24
Illinois Citizens Utility Board (CUB) Energy Saver With Efficiency 2.0 ................................................ 27
Western Massachusetts Electric Company Western Mass Saves! (with Efficiency 2.0) .................... 32
Sacramento Municipal Utility District (SMUD) Home Electricity Reports (with Opower) .................. 36
Payson City Power Energy Efficiency Reports (with Enerlyte) ............................................................ 39
Cape Light Compact Residential Smart Energy Monitoring Pilot ........................................................ 44
Behavior Based Energy Efficiency Programs Interview Questions ............................................................. 48

Residential Behavior Based Energy Efficiency Program Profiles 2011
Introduction
Behavior based energy efficiency (BBEE) programs focus on energy savings resulting
from changes in individual or organizational behavior and decision-making. BBEE programs have been growing in prominence around the country as a means of achieving energy savings beyond what is obtained through traditional efforts focused on encouraging the adoption of energy efficient technology. There is a substantial body of knowledge and experience associated with behavior change that is rooted in the social sciences, with transfer now taking place to utilities and others with an energy efficiency focus. Some experts claim the potential energy savings may rival or even exceed the savings available from new technology.
BPA’s goal is to enable, validate and increase the amount and persistence of energy
savings achieved through BBEE programs in the Northwest. To accomplish this goal BPA is focused on three near-term objectives:
1. Monitor and assess national and regional behavior based energy efficiency (BBEE) programs
and activities, identify and promote use of best practices; 2. Create policies that help build program infrastructure that all Northwest public utilities can
use to operate BBEE programs and achieve related energy savings; and 3. Collaborate with three to five Northwest public utilities and market partners to implement
and evaluate innovative BBEE pilot programs. This report addresses objective #1, summarizing the results of recent research assessing
national and regional residential BBEE programs and activities. The report builds on a market scan conducted in 2010, updating BBEE program information and results, and identifying promising new program activity. A basic foundation for behavior change is providing energy consumers with feedback on their energy consumption, with customer engagement strategies and tactics employed to get customers to take action and drive greater levels of energy savings. The residential BBEE programs profiled here do not represent a comprehensive inventory of programs across the continent. Instead, the approach taken was to identify select programs that collectively represent a range of BBEE customer engagement strategies and tactics, and programs that have a good base of experience to learn from.
Undoubtedly, there are programs we have overlooked that fit this definition. In fact, a
key finding from conducting this research is how quickly market activity is advancing, along with the evolution of products and services available to support market activity. Much has changed in the market in just the last year. The information, program design features and motivational tactics that work best in getting energy consumers to be more efficient in their use of energy are being investigated, tested, and applied. What works best for different types of customers is being explored. New evaluation methods are being used to document energy savings and examine the persistence of energy savings over time. It is an exciting time, with the promise associated with BBEE programs too significant to ignore.
Residential Behavior Based Energy Efficiency Program Profiles 2011
Summary of Key Features and Results from Profiled
Programs
In the residential sector, customer feedback on energy use can be provided via paper
reports, in-home displays, or on-line; and can be independent of, or leverage, utility advanced metering infrastructure (AMI) investments. Utilities, both nationally and regionally, have been operating customer feedback programs, including use of normative or comparative information, for several years now, with documented energy savings of 2-3% common across program participants. Using customer feedback as a foundation, a number of customer engagement strategies and tactics to encourage behavior change are being employed. Some examples include:
Marketing and Communications – Use of traditional marketing channels and newer social media options (ie., Facebook, Twitter, You Tube, etc.) and devices (computers, mobile phone apps, etc.) to communicate messages and encourage dialogue that stimulates customers to be more efficient.
Tips and Assistance – Customers may not know what behavior changes make the most sense and are likely to have the biggest impact on their energy consumption. Educating customers on the most effective actions to take, and assisting them in taking those actions, can help them move forward.
Goal Setting – Once a customer or community commits to an energy reduction goal they may be more likely to change some of their energy use related behaviors.
Rewards and Recognition – Monetary rewards or prizes can be motivating in stimulating behavior change, as can recognizing customers (or communities) that have been successful. Rewards can be fixed or random, with random rewards adding an entertainment component that customers may find appealing.
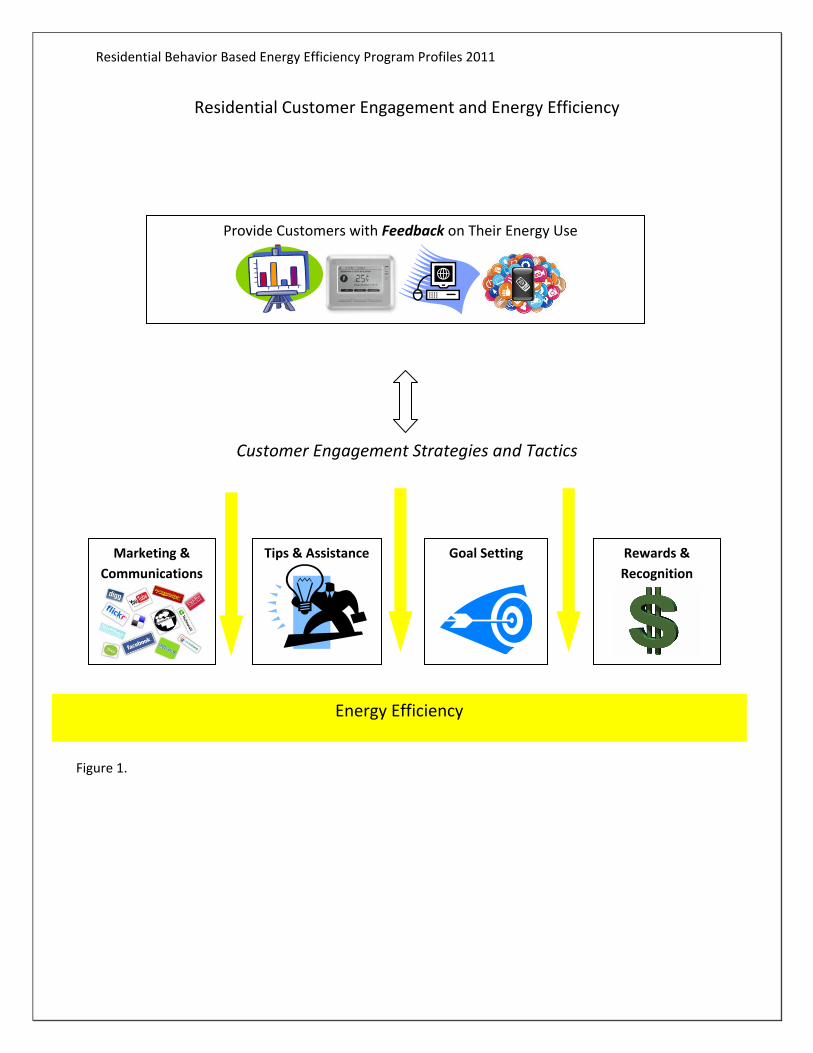
The graphic on the next page (Figure 1) is a visual representation of these residential
sector customer feedback and customer engagement options. As mentioned in the introduction to this report, the programs researched and profiled here use some or all of these options, yet do not represent a comprehensive inventory of residential BBEE programs across the continent. The approach taken was to identify select programs that collectively represent a range of BBEE customer engagement strategies and tactics, and that have a good base of experience to learn from. Emphasis is placed on programs that seek to validate and document energy savings, as well as examine the persistence of energy savings. For utilities looking to count on BBEE as a conservation resource, this is of critical importance. Program results indicate that significant progress is being made along these lines.

Residential Behavior Based Energy Efficiency Program Profiles 2011
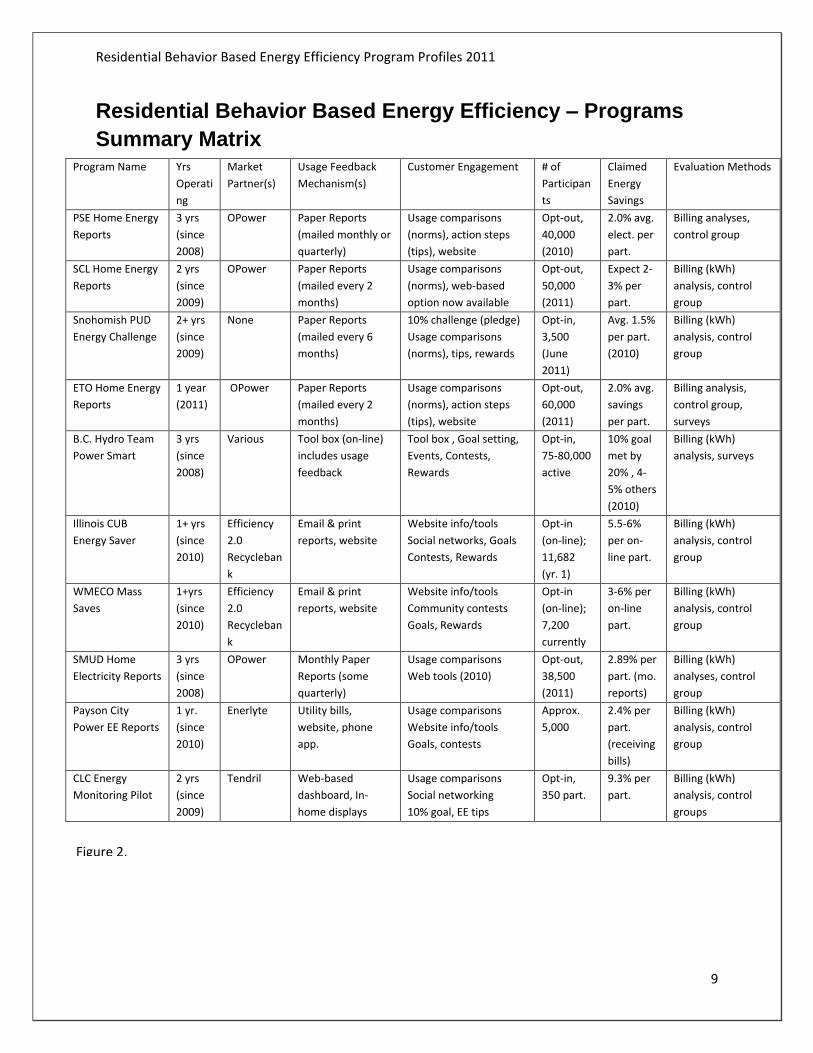
Energy savings of 2-3% from customer feedback is now well documented, and programs that employ additional customer engagement strategies and tactics are claiming much higher per participant energy savings, often two to three times as much (Figure 2). A key finding from the research is that each type of customer engagement activity has the potential to yield significant benefits (i.e., energy savings), and programs that employ multiple strategies and tactics are achieving greater per participant savings. Leading edge programs are moving beyond simply providing customers with energy use feedback by deploying an array of innovative customer engagement strategies; including use of social marketing techniques, individual and community goal setting, energy saving tips and assistance, and events, contests, rewards and recognition. Practitioners report that achieving higher savings levels requires looking outside the energy industry to others that have experience using social science research to impact human behavior. Leading edge programs are transferring this knowledge and experimenting with what works to influence energy use related behaviors.
Residential Behavior Based Energy Efficiency Program Profiles 2011
Residential Customer Engagement and Energy Efficiency
Customer Engagement Strategies and Tactics
Provide Customers with Feedback on Their Energy Use
Paper Reports, In-Home Displays, On-Line
Goal Setting
Tips & Assistance
Rewards &
Recognition
Energy Efficiency
Marketing &
Communications
Figure 1.

Residential Behavior Based Energy Efficiency Program Profiles 2011
7
The residential BBEE programs summary on pages 8-9 tells this story, as does the comments and advice from program managers and their market partners. The program manager for WMECO’s Mass Saves Program stresses the importance of “on the ground” community involvement, and says that those communities joining the community challenge are reaching their 3% savings goal. WMECO uses “surround sound” marketing, with emphasis on the rewards component of the program to achieve greater customer engagement. B.C. Hydro’s program manager says that regular communications and interaction is critical. Their research indicates a strong correlation between engagement and savings. They are focused on growing the amount of participants at the enjoyment (challenge) level of the program, where members are more engaged and the bulk of the energy savings occur. One important principle B.C. Hydro has learned is to meet customers where they are. In other words, customers are not necessarily interested in energy savings. Understand customer interests and motivations, and engage them accordingly.
Sacramento Municipal Utility District (SMUD) has found that normative messaging is
more effective with some customers than others. SMUD segments its customer base, and is tailoring its messaging for various segments. SMUD also reports that its voluntary “pledge to save” goal participants have achieved approximately three times as much energy savings as the average savings from all program participants. Snohomish PUD’s Energy Challenge program is structured around getting customers to commit to a 10% energy reduction goal, with 10% of those pledging having already met their goal. Cape Light Compact’s (CLC’s) program manager says providing basic feedback to customers is one thing, achieving significant reductions in usage is another. People informing each other about energy saving actions to take can be important. CLC has found that awareness of energy use by program participants increases. Some program participants have self-diagnosed increases in energy usage, uncovering causes such as the heat being left on, refrigerator cycling issues, or other problems.
There is a breadth and depth factor to consider in providing energy use feedback and engaging customers. Designed as a customer “opt-out” program, paper reports provide customers with feedback on their energy use (including normative comparisons) and have a high customer acceptance rate, with very few customers opting out. As a result, even though energy savings per participant are modest (2-3%), overall program energy savings can be quite large. In contrast, customers in programs that emphasize on-line participation and engagement must “opt-in”. These programs achieve significantly greater per participant energy savings (2 to 3 times as much), but have lower participation rates, which impacts overall program energy savings. There is some convergence taking place, resulting in both options being applied within programs, with an aim towards driving more customers to “on-line” participation. For example, the CUB Energy Saver program provides customers with both print and email reports, and access to a program website. The print reports are sent to the entire target population, and customers “opt-in” to the email reports and program website. Ongoing communications, rewards, community contests and customer engagement are all geared towards getting more people to actively participate on-line.

Residential Behavior Based Energy Efficiency Program Profiles 2011
8
It is important to recognize the role market partners are playing in creating, operating and evolving these programs. There are a few utilities profiled here that are developing and operating their own residential BBEE programs (B.C. Hydro and Snohomish PUD), but they appear to be the exceptions. Companies such as OPower, Efficiency 2.0, Tendril and Enerlyte are providing the products and services behind the other programs profiled here; partnering with utilities and others to brand and provide BBEE programs in the marketplace. And these companies are not the only ones providing these types of products and services. Others include metering companies, power monitoring companies, and technology (home automation) companies. However, these other companies are not focused on delivering comprehensive BBEE marketplace solutions utilities and others can tap into (at least not yet). Their products and services are being picked up and included within comprehensive solutions delivered by others. For example, Efficiency 2.0 used Greenlet’s plug-in appliance (DR) product in its recent DR pilot within the CUB Energy Saver program. Another factor to consider is economies of scale. Virtually all the program managers and their market partners contacted said much of the cost of operating these types of programs is in addressing initial program set up requirements. This can include aligning with the utility billing system/data, characterizing target markets, establishing baseline energy consumption, creating normative groups for comparison purposes, marketing messages and customer outreach strategies, customizing the website and basic tips, and establishing a control group and the M&V methodology. The point is these items are largely fixed costs, and must be addressed whether the target population is 10,000 or 200,000 customers. Variable costs are mainly related to customer marketing and outreach. As a result, there can be significant variations in per participant costs, with lower costs for large target populations. Based on economies of scale, per participant costs can vary by up to 50%. So this is a very different cost structure than utility rebate or incentive programs, where most costs are inherently associated with a per measure or project financial incentive. A last point to be made is how quickly these types of programs seem to be advancing. More is
being learned all the time. This means the information contained in these profiles will become outdated
soon, as more programs are initiated and existing programs continue to evolve and change. All of the
practitioners contacted indicated their companies are convinced that these programs provide value and
there is much more to be learned.
Residential Behavior Based Energy Efficiency Program Profiles 2011
9
Residential Behavior Based Energy Efficiency – Programs
Summary Matrix Program Name
Yrs
Operati
ng
Market
Partner(s)
Usage Feedback
Mechanism(s)
Customer Engagement # of
Participan
ts
Claimed
Energy
Savings
Evaluation Methods
PSE Home Energy
Reports
3 yrs
(since
2008)
OPower Paper Reports
(mailed monthly or
quarterly)
Usage comparisons
(norms), action steps
(tips), website
Opt-out,
40,000
(2010)
2.0% avg.
elect. per
part.
Billing analyses,
control group
SCL Home Energy
Reports
2 yrs
(since
2009)
OPower Paper Reports
(mailed every 2
months)
Usage comparisons
(norms), web-based
option now available
Opt-out,
50,000
(2011)
Expect 2-
3% per
part.
Billing (kWh)
analysis, control
group
Snohomish PUD
Energy Challenge
2+ yrs
(since
2009)
None Paper Reports
(mailed every 6
months)
10% challenge (pledge)
Usage comparisons
(norms), tips, rewards
Opt-in,
3,500
(June
2011)
Avg. 1.5%
per part.
(2010)
Billing (kWh)
analysis, control
group
ETO Home Energy
Reports
1 year
(2011)
OPower Paper Reports
(mailed every 2
months)
Usage comparisons
(norms), action steps
(tips), website
Opt-out,
60,000
(2011)
2.0% avg.
savings
per part.
Billing analysis,
control group,
surveys
B.C. Hydro Team
Power Smart
3 yrs
(since
2008)
Various Tool box (on-line)
includes usage
feedback
Tool box , Goal setting,
Events, Contests,
Rewards
Opt-in,
75-80,000
active
10% goal
met by
20% , 4-
5% others
(2010)
Billing (kWh)
analysis, surveys
Illinois CUB
Energy Saver
1+ yrs
(since
2010)
Efficiency
2.0
Recycleban
k
Email & print
reports, website
Website info/tools
Social networks, Goals
Contests, Rewards
Opt-in
(on-line);
11,682
(yr. 1)
5.5-6%
per on-
line part.
Billing (kWh)
analysis, control
group
WMECO Mass
Saves
1+yrs
(since
2010)
Efficiency
2.0
Recycleban
k
Email & print
reports, website
Website info/tools
Community contests
Goals, Rewards
Opt-in
(on-line);
7,200
currently
3-6% per
on-line
part.
Billing (kWh)
analysis, control
group
SMUD Home
Electricity Reports
3 yrs
(since
2008)
OPower Monthly Paper
Reports (some
quarterly)
Usage comparisons
Web tools (2010)
Opt-out,
38,500
(2011)
2.89% per
part. (mo.
reports)
Billing (kWh)
analyses, control
group
Payson City
Power EE Reports
1 yr.
(since
2010)
Enerlyte Utility bills,
website, phone
app.
Usage comparisons
Website info/tools
Goals, contests
Approx.
5,000
2.4% per
part.
(receiving
bills)
Billing (kWh)
analysis, control
group
CLC Energy
Monitoring Pilot
2 yrs
(since
2009)
Tendril Web-based
dashboard, In-
home displays
Usage comparisons
Social networking
10% goal, EE tips
Opt-in,
350 part.
9.3% per
part.
Billing (kWh)
analysis, control
groups
Figure 2.

Residential Behavior Based Energy Efficiency Program Profiles 2011
10
Residential Behavior Based Energy Efficiency Program
Profiles
The information and data contained in the following program profiles was gathered from a variety of source information; including conference presentations and proceedings, information available on the internet, evaluation findings and reports, and through interviews with program managers and market partners. We would like to thank those that have given us some of their time and shared their insights. They are the BBEE pioneers, their commitment is admirable and the progress they are making is inspiring. The programs profiled include the following:
Regional Profiles
Puget Sound Energy Home Energy Reports (with OPower)
Overview
Puget Sound Energy (PSE) was the first utility company in the Northwest and one of the first
utilities in the nation to partner with OPower to provide home energy reports to single family
residential customers. The program has been in operation since November 2008. The home
energy reports are mailed separately from energy bills and includes feedback on usage (current
and historical), social norms (comparisons to neighbors, efficient use), and energy savings tips.
Goals PSE is examining new and innovative ways to achieve energy savings. PSE sees the home
energy reports as a means to save energy through behavior modification and also through
increased participation in other PSE programs.
Main Design Features
In the initial pilot approximately 84,000 single family homes were randomly selected, with
about 40,000 assigned to the treatment (participant) group and the rest to the control group.
All the homes are dual fuel, single family structures with at least one year of billing data. Of
those assigned to the treatment group, 75% received the home energy reports monthly and
25% received the reports quarterly. The home energy reports provide feedback on the
household’s energy use and compare the receiving household’s energy usage with that of
Residential Behavior Based Energy Efficiency Program Profiles 2011
11
neighboring homes. The idea is that peer pressure is used to motivate and achieve energy
savings, with tips on using energy wisely provided (no cost, low cost equipment change,
medium cost appliance upgrade). Participants can also set energy savings goals. Through
OPower, PSE now also offers participants a website (https://pse.opower.com/) that provides
other useful tips, tools, and information on conserving energy.
Program Delivery
OPower creates and mails the reports. Areas of utility involvement include utility data transfer,
experimental design parameters and selection of participants/control group, customizing
report, messaging and tips. Utility involvement in the initial launch includes preparing
customers for what they are going to see on the home energy reports by providing Q&As, opt-
out provisions, etc. The vast majority of customers are satisfied with the reports, but a vocal
minority isn’t satisfied (1-1.5% of targeted customers have opted out). After 2+ years with the
initial pilot group, PSE has been making changes, with an additional 115,000 customers
receiving bi-monthly home energy reports (6 reports per yr.) and discontinuing the reports for
one third of the initial treatment group to evaluate the persistence of the energy savings.
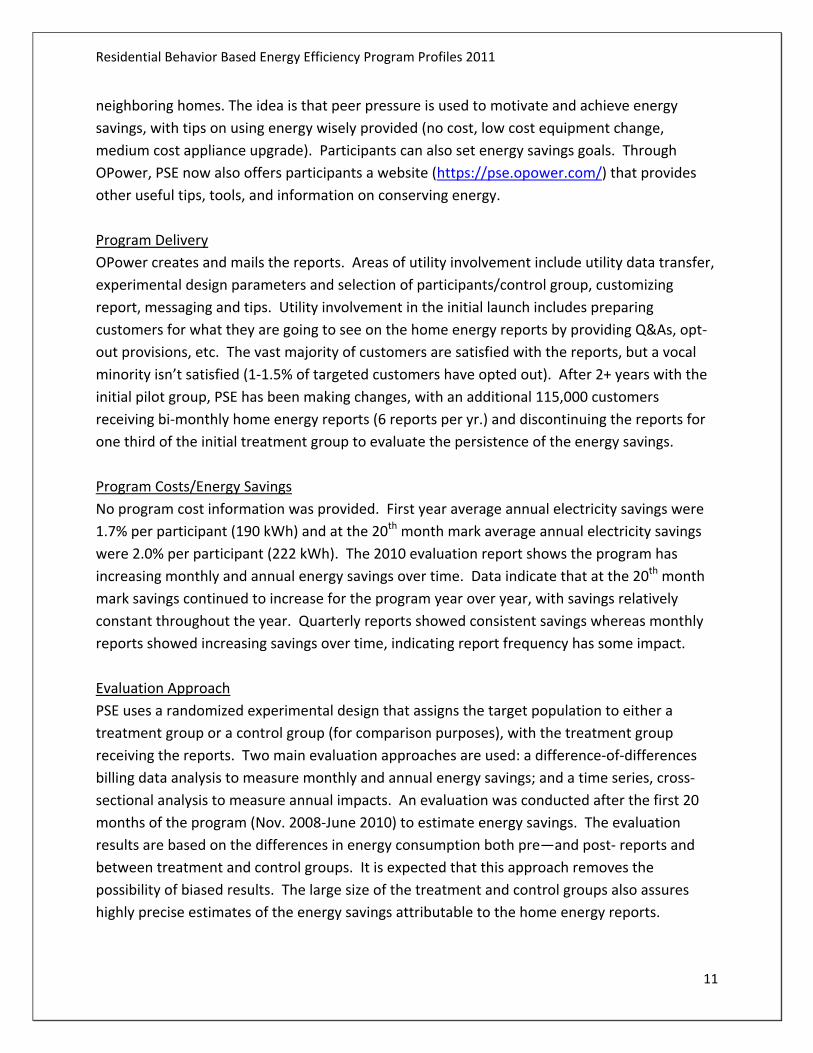
Program Costs/Energy Savings
No program cost information was provided. First year average annual electricity savings were
1.7% per participant (190 kWh) and at the 20th month mark average annual electricity savings
were 2.0% per participant (222 kWh). The 2010 evaluation report shows the program has
increasing monthly and annual energy savings over time. Data indicate that at the 20th month
mark savings continued to increase for the program year over year, with savings relatively
constant throughout the year. Quarterly reports showed consistent savings whereas monthly
reports showed increasing savings over time, indicating report frequency has some impact.
Evaluation Approach
PSE uses a randomized experimental design that assigns the target population to either a
treatment group or a control group (for comparison purposes), with the treatment group
receiving the reports. Two main evaluation approaches are used: a difference-of-differences
billing data analysis to measure monthly and annual energy savings; and a time series, cross-
sectional analysis to measure annual impacts. An evaluation was conducted after the first 20
months of the program (Nov. 2008-June 2010) to estimate energy savings. The evaluation
results are based on the differences in energy consumption both pre—and post- reports and
between treatment and control groups. It is expected that this approach removes the
possibility of biased results. The large size of the treatment and control groups also assures
highly precise estimates of the energy savings attributable to the home energy reports.

Residential Behavior Based Energy Efficiency Program Profiles 2011
12
Lessons Learned
The initial launch was a little rocky; it is important to prepare customers and be ready to respond to questions and concerns
Six powerful words for learning the most from your behavior based pilots; experimental design, experimental design, experimental design
Expected savings, and what you want to measure, have *everything* to do with how you design and implement your program, use expected savings as guidance on how many customers to target
Small saving are extremely difficult to measure in a billing analysis, the smaller your expected savings, the larger your program needs to be for accurate measurement.
Future Plans
PSE feels they are just scratching the surface on behavior based energy savings. PSE will be examining results from recent design changes, including energy savings trends and the persistence of savings.
Contacts
Bobette Wilhelm, PSE Evaluation Analyst 425-462-3432 [email protected] Brad Simcox, Program Manager 425-462-3463 [email protected]

Residential Behavior Based Energy Efficiency Program Profiles 2011
13
Figure 3.

Residential Behavior Based Energy Efficiency Program Profiles 2011
14
Figure 4.

Residential Behavior Based Energy Efficiency Program Profiles 2011
15
Seattle City Light Home Energy Reports (with OPower)
Overview
Seattle City Light (SCL) is partnering with OPower to provide home energy reports to some of its
single family residential customers. The reports use behavioral science to encourage energy
efficiency. OPower research indicates that people are motivated by what their neighbors are
doing, and the reports emphasize normative comparisons with similar neighbors. SCL began
offering the reports to 20,000 customers via OPower in October 2009, and recently expanded
the offering to an additional 30,000 customers.
Goals
Seattle City Light sees behavior based programs as a promising new approach to get significant
energy savings. SCL’s goals are as follows:
kWh savings
Making energy relevant and interesting to consumers
A complement to measures – and minimizing the take back effect
Engaging customers in a dialogue
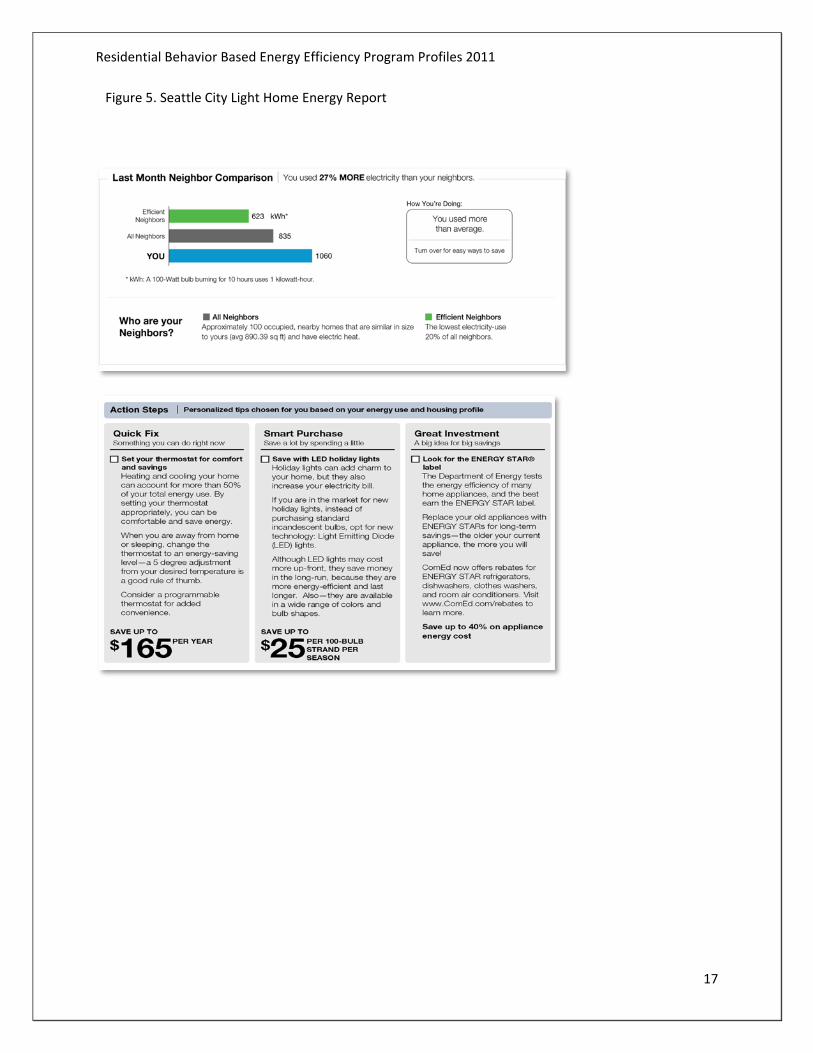
Main Design Features
The home energy reports are currently mailed to 50,000 single family residential customers
every two months, independently of their electricity bills. The reports provide customers with
feedback on their current and historical energy use, normative comparisons with similar
neighbors, and conservation messages and tips tailored to target specific household profiles
(see attached example). A web-based option is now available to customers to access data and
receive information on-line.
Program Delivery
OPower creates and mails the reports. Three areas of utility involvement include (1)
development of data transfer protocols and automated weekly data uploads, (2) choosing
participants for the program (random for evaluation purposes), and (3) customizing the report
and messaging to fit the customer base (including ongoing updating of tips). SCL currently has
one program manager and a call center person working on the program. Neither works on the
program full-time. Interactions with customers take the most time, which is good because it
shows customers care. The reports are now one of the top three reasons why people call the
utility (100 calls/mo.). The majority of calls are positive (“What does this mean?”, “What can I
do?”), and those that initially complain can be turned around if handled properly.

Residential Behavior Based Energy Efficiency Program Profiles 2011
16
Program Costs/Energy Savings
SCL calculates it is currently paying $9 per participant for 300 kWh savings per year (assuming a
1 year measure life). The savings trend per customer is up over time, indicating persistence of
energy savings isn’t an issue (to-date). OPower says to expect 2-3% savings per participant on
average, however, SCL recently got closer to 4%. 2010 program savings totaled 5.4 GWhs and
2011 looks likely to be more than that. SCL calculated that the program achieved one million
kWh savings in the month of March 2011 alone, with per household savings of 55 kWh. Savings
follow seasonal usage, with customers saving more when they use the most. Less than 1% of
SCL customers opt-out of the program.
Evaluation Approach
The program is set up with evaluation in mind. Once the target customer population is
determined (in SCL’s case, the lowest 25% of users were excluded), a randomized control group
and participants are selected. SCL’s control group includes 20,000 customers, while the
participant group is now at 50,000 customers. The pretreatment differences between the
participant and control groups are designed to be indiscernible and statistically insignificant.
This allows for a comparison between the two to determine the program energy savings
impacts, which are calculated on a monthly basis. A third party evaluation is underway to
confirm the energy savings.
Lessons Learned
Normative messaging seems to be effective in driving energy savings, and the savings
appear to be significant and cost-effective.
Using behavioral science for energy efficiency is an evolving and improving field.
Make sure your utility is ready – procurement, legal, communications, executive
A strong advocate is needed to make sure everyone is aware and supportive
An enthusiastic conservation-focused call center is very important
Some customers will be initially unhappy, but can often be talked through it.
Future Plans
The program is part of Seattle City Light’s current 5 year conservation plan. SCL intends to
expand its web engagement possibilities through the program and try new approaches to
further customer engagement, including program promotions and messaging (via post-its, etc.).
Contact
Lars Henrikson, Energy Planning Analyst, Seattle City Light
206-615-1683 [email protected]
Residential Behavior Based Energy Efficiency Program Profiles 2011
17
Figure 5. Seattle City Light Home Energy Report
Residential Behavior Based Energy Efficiency Program Profiles 2011
18
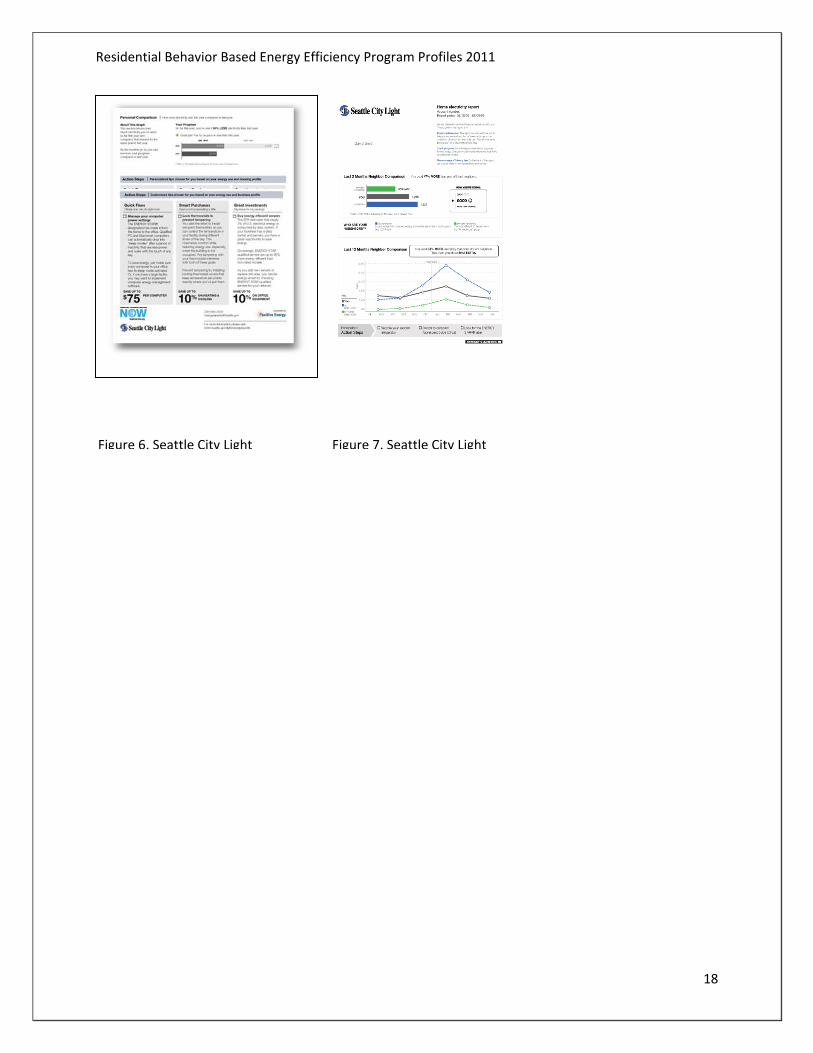
Figure 6. Seattle City Light Figure 7. Seattle City Light
Residential Behavior Based Energy Efficiency Program Profiles 2011
19
Snohomish Public Utility District Energy Challenge
Overview
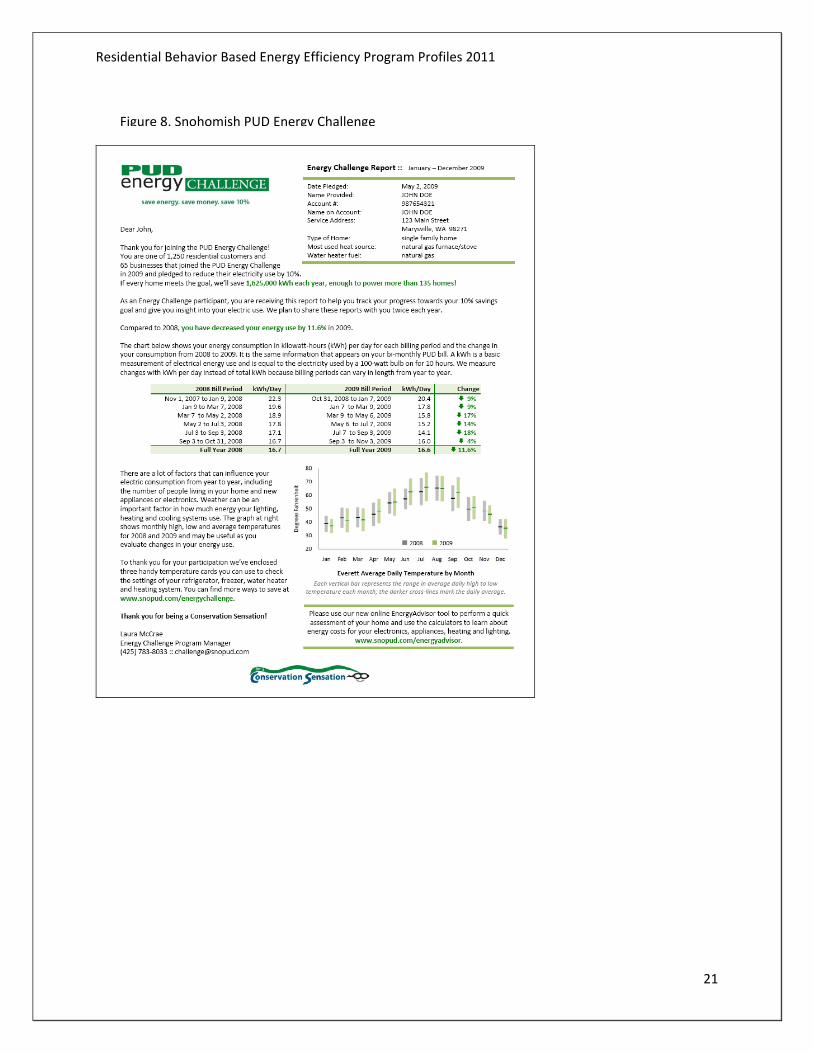
Snohomish Public Utility District (PUD) launched its Energy Challenge program in late 2008 – early 2009. The Energy Challenge is a call to action, a community wide invitation to voluntarily reduce use by ten percent. The Energy Challenge includes customer feedback on energy use,, social norms, energy savings tips, and rewards. Goals Snohomish PUD has had success with residential EE programs and campaigns in the past, and sees behavior change as a new energy efficiency opportunity. Snohomish PUD wants its program to be inclusive of all customers, approachable, adaptable and scalable, and easily implementable. Snohomish PUD is looking to stimulate customer interest in energy efficiency, move customers from concern to action, and influence behavior change and utility EE program participation. Metrics for measuring program effectiveness include
Customer Awareness
Customer Participation
Customer Engagement
Customer Satisfaction
Energy Savings
Main Design Features
Participants commit to use 10% less electricity. The Energy Challenge creates an ongoing two way dialogue with Snohomish PUD’s customers about their energy use. The Energy Challenge includes customer feedback on their energy use via mailed paper reports (not part of the utility bill), social norms (comparisons), energy savings tips, and rewards (drawings for prizes). The paper reports are mailed semi-annually with customer progress towards meeting the challenge goal including utility generated feedback. The PUD has regular, targeted contact with participating customers. Participants are entered in a quarterly drawing to win prizes including energy efficiency related products, such as home energy use monitors (TED, Blue line, etc.), and a free home energy audit. Program Delivery
Snohomish PUD is implementing the program itself, without third party vendor assistance. Snohomish PUD has segmented its residential customer base and is currently targeting four demographic slices of customers: practical idealists, green idealists, affluent conservers, follows the crowd. A variety of marketing tactics are used to recruit participants, including direct mail, advertising, emails, customer contact and referrals. In addition to customer feedback on their energy consumption, the PUD offers each participant three approachable energy-saving tips: free and easy, low cost, and smart investment. The PUD uses an adaptive management model (define, research, design, implement, adjust) to guide its activities.

Residential Behavior Based Energy Efficiency Program Profiles 2011
20
Program Costs/Energy Savings
No cost information was provided, however, the PUD has said that the program is low cost, relying on staff time and involves no vendors. As of June 2011, nearly 3,500 residential pledges had been made with an estimated 4,375,000 kWh in potential savings. Pledging households are representative of the customer base, with 75% single family homes and approximately half with electric heat. The PUD’s evaluation of 2009 vs. 2008 (Jul-Dec) shows that 50% of participants reduced their consumption. Overall, participants achieved a ~1% decrease in gross consumption, compared to a ~0.5% increase in control group consumption. Approximately 10% of those pledging have already met their goal. The 2010 evaluation is underway now.
Evaluation Approach
Snohomish PUD is measuring success by looking at awareness, participation, engagement, customer satisfaction, and energy savings. The energy savings evaluation methodology is based on Northwest regional protocols (RTF-approved). The PUD is reviewing individual participant changes and for the program as a whole, tracking participants in 3 groups, and comparing their usage to control groups.
Lessons Learned
Everything has been harder to do than we thought. Learn as much as you can from utilities
and others that are already doing this.
Customer communication is key. Use an independent marketing firm to obtain customer
feedback and help structure customer messages and content.
The challenge approach works for commercial too. We tried it first at the PUD, which was a
great learning experience.
It would be great to have some interval meter data to tailor information to specific
customer usage and provide more timely feedback.
Future Plans
Snohomish PUD offers the Energy Challenge to its commercial customers as well, with quarterly
reporting and a 1-3 year pledge period. The response has been great, with a number of
businesses already exceeding goals (up to 34% savings) and total savings over double the
residential sector to-date. In the future the PUD sees recruiting additional residential and
commercial customer to the Challenge. They are also considering outside support to help them
further evolve and operate the program.
Contact
Laura McCrae, EE Planning & Evaluation 425-783-8033 [email protected]
Residential Behavior Based Energy Efficiency Program Profiles 2011
21
Figure 8. Snohomish PUD Energy Challenge
Residential Behavior Based Energy Efficiency Program Profiles 2011
22
Energy Trust of Oregon Home Energy Reports Pilot (with OPower)
Overview
The Energy Trust of Oregon (ETO) initiated its Home Energy Reports Pilot with OPower in January 2011. The pilot uses paper home energy reports mailed bi-monthly over 12 months. The reports show the standard OPower information as described earlier in this report. Recipients have the option to go to a website to view similar and more detailed energy efficiency information.
Goals
The ETO became interested in residential customer energy use feedback in 2007 after seeing promising results from other studies, showing possible savings anywhere from 1-18% of household energy usage. The ETO decided to conduct a pilot in Oregon to examine the energy savings potential and cost-effectiveness, and determine the feasibility of a full-scale program in the future. The ETO’s primary goal is to drive energy savings from non-program actions and behaviors, a secondary goal is to encourage greater participation in other ETO programs.
Main Design Features
The home energy reports are dual-fuel, co-branded with the local utilities (Portland General Electric and Northwest Natural Gas). There are 60,000 households in the pilot, with another 60,000 households in the control group. Reports are mailed bi-monthly over a 12 month period. The reports contain the standard OPower information (benchmarking usage, peer comparisons, and tips for energy savings). Participants can also go to a website to view similar and additional energy efficiency information.
Program Delivery
The Energy Trust of Oregon has contracted with OPower to deliver the home energy reports.
This is the first time that two utilities (gas and electric) and a third party (ETO) have worked
together to implement OPower’s home energy reports.
Program Costs/Energy Savings
The Energy Trust of Oregon (ETO) estimates its costs for the pilot at approximately $1 million. ETO is estimating a 2% reduction in electricity usage and a 1% reduction in natural gas usage for the pilot. This equates to annual electricity savings of 13,470,000 kWh (229 kWh/household) and annual natural gas savings of 420,000 therms (7 therms per household). Preliminary indicators, based on participants receiving 5 of 6 home energy reports, suggest both gas and electric energy savings are meeting or exceeding initial estimates.

Residential Behavior Based Energy Efficiency Program Profiles 2011
23
Evaluation Approach
The Energy Trust of Oregon (ETO) is conducting both a process and impact evaluation. For evaluation purposes, ETO is tracking results in 60,000 comparable homes that do not receive the home energy reports. Savings from measures installed are being tracked separately from savings resulting from behavioral changes. The evaluation includes billing analyses and three surveys by phone of 200 participants during the year. Research objectives include determining if the reports are resulting in measurable behavior changes, the types of behavior changes the reports are driving, as well as how the service can be improved.
Lessons Learned
Less than 1% of participants have opted out, a very small percentage
The customer service calls related to the home energy reports have been low
ETO had an in-home display pilot (for customer feedback), but there were no verified energy savings from the pilot and it was discontinued.
Future Plans
The pilot evaluation is ongoing and has not yet been completed. Preliminary indicators suggest both gas and electric energy savings are meeting or exceeding initial estimates. The ETO is unsure whether there has been any lift in other program participation. If the preliminary indicators are validated, the ETO will probably expand the program to include more households, including those served by Pacific Power and Cascade Natural Gas.
Contact
Kate Scott, Residential Project Manager 503-459-4079 [email protected]

Residential Behavior Based Energy Efficiency Program Profiles 2011
24
National/North American Profiles
B.C. Hydro Team Power Smart
Overview
B.C. Hydro’s Team Power Smart is a behavioral based opt-in loyalty program launched in 2008
that applies social marketing principles to engage residential customers and encourage energy
efficiency. Members (participants) commit to a 10% electricity reduction goal over a 12 month
period; with B.C. Hydro providing tools, feedback, support, motivation and rewards.
Goals
B.C. Hydro’s Conservation Potential Review confirmed the value of behavior change
opportunities, and recommended they be pursued. In relying on a behavioral approach, the
program complements B.C. Hydro’s existing end-use focused programs. B.C. Hydro’s key
performance metrics for the Team Power Smart program focus on customer engagement (level
of participation) and related kWh savings. B.C. Hydro sees the program as a long-term effort
impacting the way people live, requiring stamina and persistence to achieve energy savings.
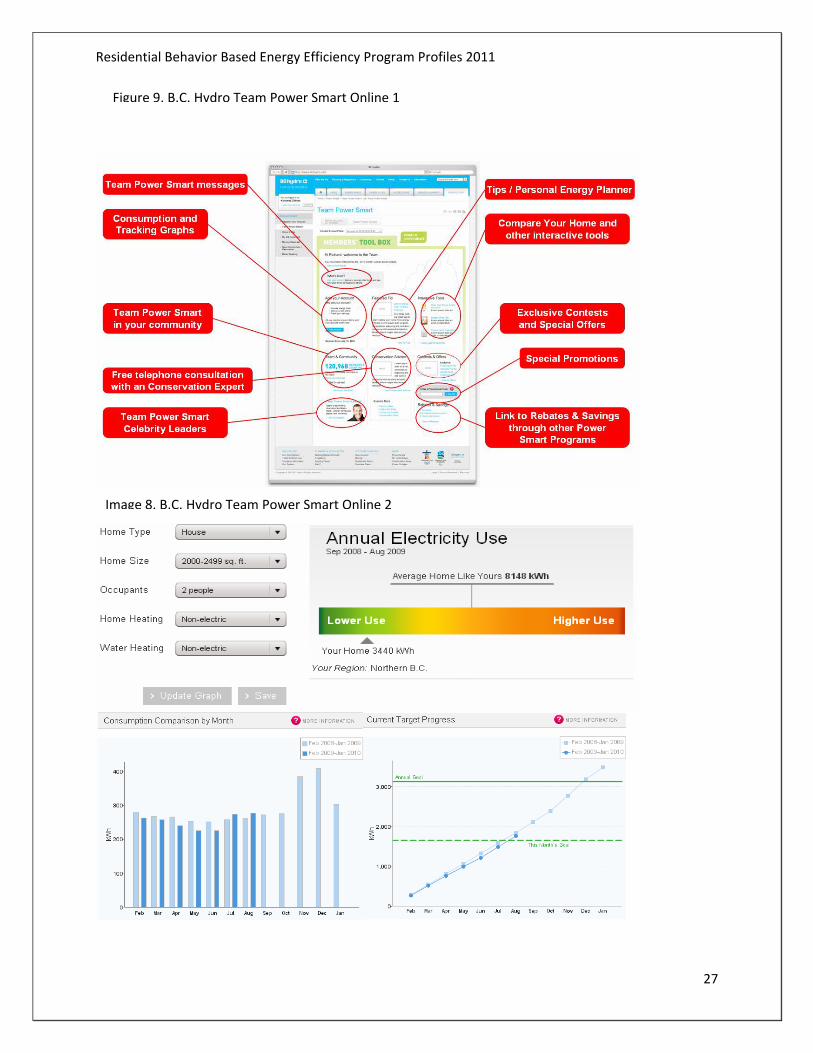
Main Design Features
Team Power Smart is web-enabled, with an on-line members toolbox, and applies a wide range
of social marketing concepts to engage and motivate participants. B.C. Hydro uses a multi-
channel marketing approach to get customers to sign up on-line; including advertising,
outreach teams, sign-up kiosks, partnering, and member-to-member sign up campaigns.
Members’ on-line tool box contains
Feedback tools (consumption graphs, usage comparisons, home analysis)
Instructional tools (tips & to-do’s, consultations, personal energy planner)
Motivational tools (messages, contests, special offers and promotions)
B.C. Hydro communicates regularly with members through a monthly e-newsletter,
complimentary magazines, and special correspondence and events. There are three levels of
participation in the program; residence (logging in), enjoyment (10% challenge participant,
attending events), and affiliation (hosting). Members at the affiliation level act as ambassadors
for the program. Members that achieve their 10% reduction goal receive a $75 reward.
Residential Behavior Based Energy Efficiency Program Profiles 2011
25
Program Delivery
Team Power Smart is designed, operated and delivered by B.C. Hydro. The program’s value
proposition is to get customers to join team power smart, get them to use the on-line tool box,
and to increase the level and frequency of customer engagement. Because Team Power Smart
is an opt-in program, creative marketing tactics can be employed. Social marketing, events,
contests, and rewards are all geared toward increasing engagement. Examples of innovative
engagement tactics include member ambassadors (volunteers), celebrity endorsements,
member stickers and a customized monopoly game. B.C. Hydro continues to experiment.
Research shows a strong correlation between engagement and kWh savings.
Program Costs/Energy Savings
B.C. Hydro declined to discuss specific program costs, however, they did indicate the program is
cost-effective using standard utility cost-effectiveness tests. Categories of program costs
include the website, the call center, communications, events and campaigns. Most costs are
variable marketing costs, and can be ramped up or down. Regularly communicating with
members is seen as critical to program success.
B.C. Hydro has approximately 300,000 participants in the program at all three levels combined.
In 2010
25,000 Challenge participants (10% goal) saved a total of 5.2 GWhs
20% of challenges were successful, with some getting savings of 15-16%
For those that didn’t reach goal, savings still averaged 4-5%
Some participants didn’t save at all.
B.C. Hydro is focused on growing the amount of participants at the enjoyment (challenge) level
of the program, which is where members are more engaged and the bulk of the energy savings
occur. This year participation at this level has reached 75-80,000 households, and continues to
grow. Early participants in the challenge were devoted conservationists. The program is now
attracting other customer segments, and is shifting its marketing strategy to better engage
them (i.e., do a few things often and move from there). In a loyalty program it is very important
to meet people where they are at, and talk about what people are interested in. Initially, only
41% of challenge participants contributed to energy savings, now the figure is 75% and B.C.
Hydro expects it to climb higher.
Evaluation Approach
B.C. Hydro validates its program concepts using a social marketing firm, conducts billing and
statistical analyses and participant/non-participant surveys to attribute kWh saved to the
Residential Behavior Based Energy Efficiency Program Profiles 2011
26
program. The billing and statistical analyses show significant energy savings (see results
summarized above). The surveys show no specific dominate behavior action, with 35 different
actions (in aggregate) where members out-perform non-participants. Power Smart cross
promotes with its transactional (technology oriented) programs and has seen greater
participation in those programs as a result, but the Power Smart program does not take credit
for these savings (to avoid double counting).
Lessons Learned
In an opt-in loyalty program regular communication and interaction is important. Research
indicates a strong correlation between engagement and savings.
Segment your customer base, target the segments likely to participate. Shift your marketing
strategy over time to better engage them.
Connect with what people really care about; B.C. Hydro categories include health & wellness,
family & friends, food & drink, home and garden, life & leisure, gadgets & technology.
Follow social marketing knowledge, look outside the energy industry for examples (a growing
number of industries/companies have effective loyalty programs) and experiment.
Don’t give away incentives just for signing up, reward customers for engagement and
performance.
Performance is improving, and the best is yet to come; it takes 5-6 years to build up an effective
social marketing program.
Future Plans
B.C. Hydro continues to build and evolve the program. Team Power Smart’s value proposition
is intended to increase member engagement levels over time. While the program has a critical
mass and is using the power of norms, a next phase is to make members feel more special. B.C.
Hydro is also exploring how to use the challenge model to continue to reward those that are
green and remain green. In addition to Team Power Smart, B.C. Hydro has an inclining
residential block rate and is deploying smart meters. Smart meters will provide program
participants with real-time or near real-time feedback via the website. Use of in-home displays
and devices can help enable program participants to achieve greater levels of savings.
Contact
Arien Korteland, Power Smart Program Manager 604-453-654 [email protected]
Residential Behavior Based Energy Efficiency Program Profiles 2011
27
Figure 9. B.C. Hydro Team Power Smart Online 1
Toolbox
Image 8. B.C. Hydro Team Power Smart Online 2
Residential Behavior Based Energy Efficiency Program Profiles 2011
28
Illinois Citizens Utility Board (CUB) Energy Saver With Efficiency 2.0
Overview
The Illinois Citizens Utility Board (CUB) has been offering the Energy Saver program to
customers of Commonwealth Edison and People’s Gas since June of 2010. The CUB Energy
Saver program provides participants with tools and information developed and administered by
Efficiency 2.0 to encourage energy efficiency related behavior change. Through Recyclebank
participants can redeem points earned by saving energy for discounts on purchases from
national and local merchants. CUB recently initiated a related 100 home direct response (DR)
pilot with Efficiency 2.0 using Greenlet Technologies’ plug-in appliance DR product to dispatch
washers, dryers and air conditioning units.
Goals
The Illinois Citizens Utility Board (CUB) is a non-profit consumer group created in 1983 to
represent the interests of residential utility customers across the state. CUB sees the Energy
Saver program as contributing to fulfilling its mission. Specific goals for the program include
Create ways for consumers to save money (and energy)
Empower consumers to engage with their local community to help solve critical energy
and environmental issues
Reward smart decisions with discounts at national and local retailers.
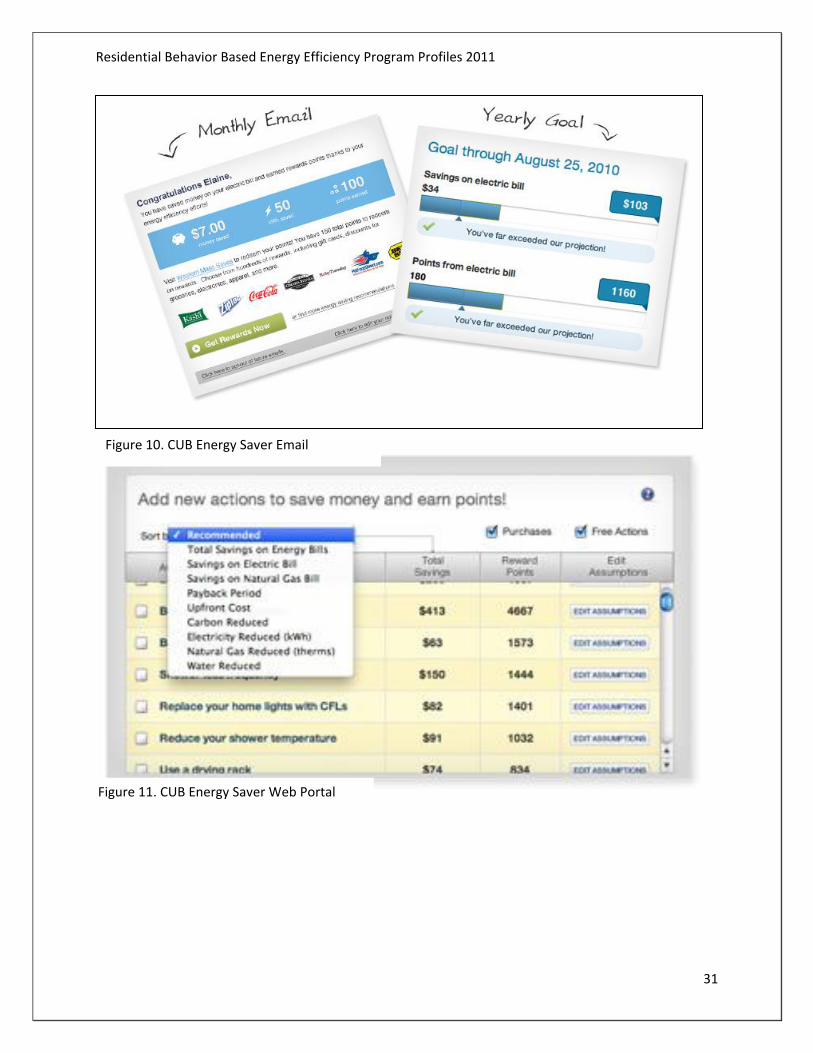
Main Design Features
The CUB Energy Saver program provides participants with personalized print and email Energy
Savings Reports, access to a program website, and rewards points for saving energy. The print
reports are sent to the entire target population, and customers opt-in to the program website,
becoming eligible for rewards for saving energy and gaining access to additional savings tools.
The website includes
Participants’ usage, comparison to neighbors
Personal goal, community contests, social networking
Customized tips/recommendations, feedback on goal progress
Additional tools, such as an on-line audit (Resnet Personal Energy Advisor)
Reward points based on energy savings, redeemable for retailer discounts
Program participants get a personalized savings plan and regular email updates that
communicate their plan/goal progress, reward points accrual, and redemption opportunities.
The program engages communities in contests to encourage greater participation and energy
savings. For example, in Evanston the city is launching a push to triple the number of people

Residential Behavior Based Energy Efficiency Program Profiles 2011
29
registered by sponsoring seven teams associated with the city’s largest employers to compete
for the most energy savings.
Program Delivery
The program is administered by Efficiency 2.0, a provider of energy efficiency software and
marketing programs based in New York. The main program platform is the website, yet the
program includes both mail and electronic reports. Mailings are used to recruit on-line
participants, with mail recipients considered “passive” participants until they sign up. Once
they opt-in to the program and sign up they are “active” participants. Engagement is the key to
customer recruitment, with a 25%+ conversion rate achieved in the first year of the program.
Customers are recruited by direct mail; but other marketing activity, such as press coverage,
competitions, and referring a friend are credited with the high conversion rate.
Three primary delivery focus areas are (1) program set-up; including billing integration, web-
site customization, local merchant recruitment and customer targeting (including evaluation
control group); (2) program marketing; which varies depending on level of aggressiveness
(direct mail, advertising, media events, etc.); and (3) program management; which includes
ongoing stakeholder relations and community engagement (typically less than 1 FTE).
Community level engagement plays an important part in generating customer participation
(organizations, government, schools, businesses, churches, etc.). Rewards via discounts with
national and local retailers are set up and administered by Recyclebank.
Program Costs/Energy Savings
Efficiency 2.0 calculates its costs $7-11 per household to deliver the program given a 25-50,000
household minimum. The biggest variable cost is the customer engagement (or marketing)
budget. Efficiency 2.0 says its products and services are cost-effective compared to other utility
energy efficiency program options (excluding lighting). The program typically costs $35-55 per
MWh of energy savings. A report on the first year of operation documented average bill
savings of 5.5-6% by the 11,682 active participants that opt-in and sign up for the on-line
component of the program. According to Efficiency 2.0, passive program participants, that just
receive reports by mail, average between 1.5 - 2.5% energy savings. More information on an
evaluation of these participants will be released soon.
Evaluation Approach
Efficiency 2.0 uses a difference-of-differences analysis to determine energy savings. The change
in usage from one year to another for participant households is compared to similar changes
from a control group. All weather, economic, price, building code and other exogenous factors
are net out via the difference-differences analysis to determine the impact of the program. The
Residential Behavior Based Energy Efficiency Program Profiles 2011
30
control group is determined based on random assignment for opt-out participants (mail reports
only) and using a matching process for opt-in participants (those that sign-up on-line). The
matching process identifies non-participants that are similar to participating customers. Any
savings that are attributable to other programs are net out to prevent double counting.
Lessons Learned
Get the program logic and evaluation plan/data worked out in advance.
There are no silver bullets, utilize a combination of behavioral strategies and effectively
integrate the components, goal setting and rewards are key motivators.
Customization, accuracy and timing of feedback and communication is important to
customer engagement, we are getting a lot better at messages that work.
Make room for innovation and learning, integrate it into the design (using quick feedback).
For example, a flag added to the website giving participants positive reinforcement when
they take an action has become an important motivator.
Future Plans
In addition to continuing to operate and innovate with the core Energy Saver program, a recent
100 home direct response (DR) pilot in suburban Chicago used Greenlet’s plug-in appliance DR
product to dispatch washers, dryers and air conditioning units. Neither the hardware nor
software from Greenlet requires professional installation. Customers plug the product into an
electrical outlet and then connect the appliance plug to it. The “Greenlets” communicate with
a wireless router. CUB controls activity from a central command center, dialing power down for
AC to either 50% or 80% and can prevent washers and dryers from operating during power
curtailment events. CUB activated load-reduction cycles several times each week to look at the
energy and ancillary service value in addition to the peak response value. Customers, recruited
from the Energy Saver program, received incentives of $20-$30 per appliance for the summer,
and received award points. CUB and Efficiency 2.0 know the technology works, so the pilot was
geared more towards learning about customer interaction and motivations. A post pilot
analysis is underway. CUB and Efficiency 2.0 plan to expand pilot program participation and
deployment of the technology next summer.
Contacts
Andy Frank, Efficiency 2.0 646-478-8509 [email protected]
David Kolata, CUB Exec Dir. 312-263-4282 [email protected]
Residential Behavior Based Energy Efficiency Program Profiles 2011
31
Figure 9. CUB Energy Saver
Figure 11. CUB Energy Saver Web Portal
Figure 10. CUB Energy Saver Email

Residential Behavior Based Energy Efficiency Program Profiles 2011
32
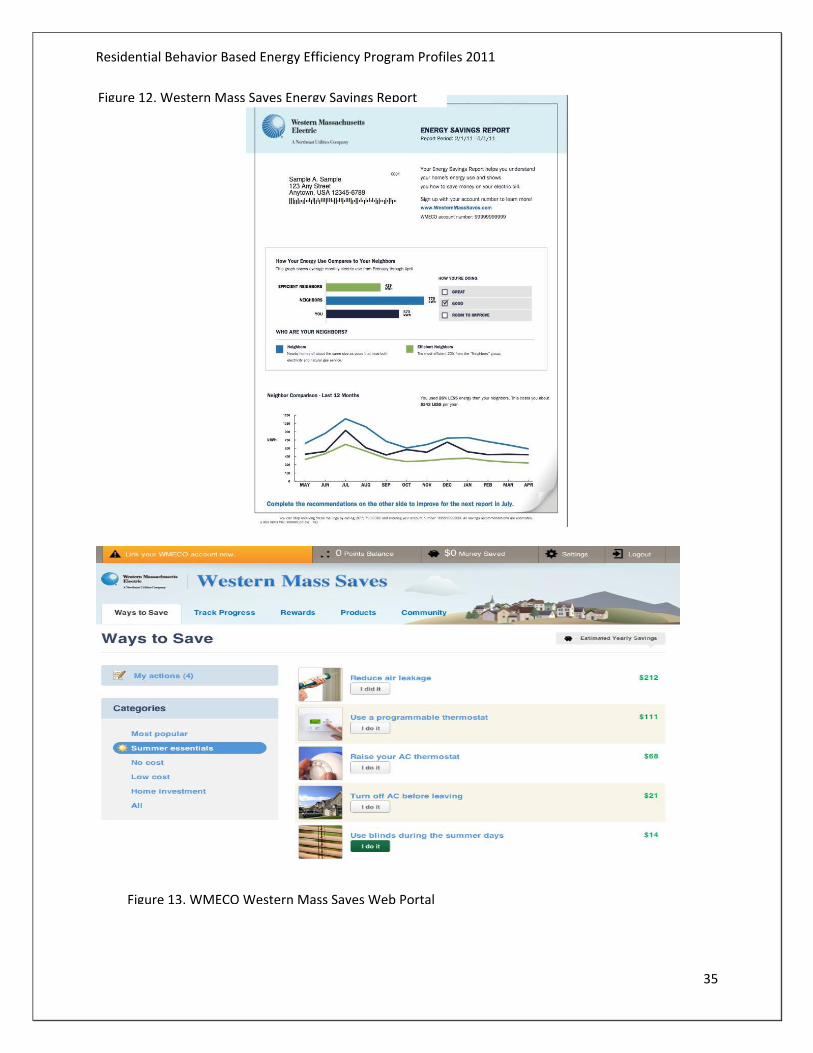
Western Massachusetts Electric Company Western Mass Saves! (with
Efficiency 2.0)
Overview
Western Massachusetts Electric Company (WMECO) is partnering with Efficiency 2.0 to market and operate a residential behavior based energy efficiency pilot (Western Mass Saves!) using a “multi-channel approach” to capture both broad and deep energy savings. The approach includes direct mail, targeted email communication, advanced web experience, and local community teams, contests and prizes. Direct mail energy savings reports and other marketing tactics (community teams, contests, prizes) are designed to encourage deeper on-line customer engagement, where more energy savings can be achieved at less cost. Goals WMECO serves 182,000+ residential customers in 59 cities and towns across 1,500 square miles of service territory. As part of the Green Communities Act, WMECO has been encouraged to explore all possible cost-effective energy efficiency measures, including behavioral. The Western Mass Saves! Pilot includes eight communities and has the following goals:
Community engagement (including towns and cities, schools and classrooms)
Community wide (broad based) 3% energy savings goal
Engage 5,000+ customers online for deeper energy savings
Main Design Features
WMECO’s multi-channel approach uses the Efficiency 2.0 platform; including direct mail energy
savings reports, a utility branded web-site designed to further engage customers “on the
ground” community engagement tactics (including challenges, contests) and customer rewards.
The energy savings reports (showing home energy use and comparisons) are a tool for
customer engagement. While they result in “passive” energy savings, the reports and
other marketing tactics are designed to encourage customers to be “active” on-line.
Examples of community engagement include town competitions (including local teams,
messaging, events and prizes) and school/classroom competitions (selling EE products
and signing up households into the online program).
The advanced web experience (website) includes more detailed energy consumption
information, customized tips and ways to save, targeted messaging and personalized
recommendations, community/social engagement, and customer rewards.
Customers earn points for energy savings through a rewards program administered by
RecycleBank (as part of the Efficiency 2.0 platform). Points can be redeemed for
discounts from local and national retailers.

Residential Behavior Based Energy Efficiency Program Profiles 2011
33
Program Delivery
Through partnering with Efficiency 2.0 the pilot has been largely turn-key. WMECO has a part-
time program manager for the pilot and uses less than one FTE of IT resources. The Efficiency
2.0 online platform went live November 2010 (with utility branding) with 25,000 customers
selected to receive direct mail energy savings reports and another 25,000 customers serving as
the “control” group (do not receive reports). Customers can opt-out from the paper reports
(very few do so), and others can opt-in via referrals, interest, or email outreach (as long as they
aren’t part of the control group). Customer call-ins have been manageable because WMECO
explained things well up-front when the pilot was launched, and is able to refer customers to
the website. A challenge has been dealing with senior citizens that don’t use computers.
Different recruitment methods (direct mail, bill stuffer, email) have been used to help convert
“passive” paper report recipients to “active” online participants. Offering Recyclebank reward
points for signing up (opting-in) online has resulted in a high conversion rate. The pilot
currently has 7,200 online participants, well beyond the initial goal of 5,000.
Program Costs/Energy Savings
No cost information was provided by WMECO. Energy savings results are as follows:
Mailed Participant Results
Verified kWh savings (%) est. 0.98% as of 6/15
Projected annual kWh savings (%) est. 1-2%
Households receiving mail at least once 59,019
Conversion to online 0.2 – 5.9%
Opt-out rate 0.1% (61 total)
Online Participant Results
Verified kWh savings (%) est. 4.2% as of 6/15/11
Projected annual kWh savings (%) est. 3.5 – 6.5%
Online members 6,142
Ways to save marked as “doing” or “done” 14 per member
Customer satisfaction increase 7-11%
Monthly email open rate 53%
% who say WMS led to taking EE measures 94%
Evaluation Approach
WMECO/Efficiency 2.0 are using an experimental and quasi-experimental evaluation design.
Aggregate and individual savings are tracked on a monthly basis using billing analysis with

Residential Behavior Based Energy Efficiency Program Profiles 2011
34
comparison control groups (difference of differences analysis). Independent interim and final
evaluations are planned for the pilot. Control group considerations include:
Statistical tests determine heterogeneity in participant versus control bills
Regressions run for mean usage, geography, property characteristics, demographic
characteristics, etc. to filter any biases
Temporal constraints imposed for rolling control group, with minimum of 500 control
customers in each period
Bills normalized for duration through daily use values
“Passive” savings from customers who receive direct marketing, but do not sign up
online executed through traditional experimental design, with random assignment
Other evaluation metrics include customer acquisition metrics (website hits, web sign-ups from
mailer and no-mailer customers, mailer customer opt-outs), customer activation metrics
(rewards program registration, savings plan commitments), and customer engagement metrics
(cross program referrals, number and most common committed actions, estimated resource
savings from committed actions).
Lessons Learned
Online channel appears to be more cost-effective and scalable than the printed report
channel
Rewards can drive increased customer satisfaction and increased energy efficiency benefits
for online participating customers
Strong engagement with customers (over 50% email open rate) but very little discernible
call center impact due to vendor program support management
Future Plans
WMECO is pleased with the results to-date. Third party evaluation needed to confirm energy
savings and persistence. If the savings are independently verified the pilot will be very cost-
effective. WMECO is looking to continue the pilot and expand local business, non-profit and
service organization engagement with energy saving “teams”.
Contact
Tony Fornuto, Residential Program Administrator 413-787-9329 [email protected]
Residential Behavior Based Energy Efficiency Program Profiles 2011
35
Figure 12. Western Mass Saves Energy Savings Report
Figure 13. WMECO Western Mass Saves Web Portal

Residential Behavior Based Energy Efficiency Program Profiles 2011
36
Sacramento Municipal Utility District (SMUD) Home Electricity Reports
(with Opower)
Overview
As one of the first utilities to partner with Opower, Sacramento Municipal Utility District
(SMUD) has the best documented and longest running home energy reports program. SMUD
began its 3 year program in the spring of 2008 with a 12-month pilot using an experimental
design that randomly assigned 35,000 single family residential customers to a treatment group
and 50,000 customers to a control group. The treatment group regularly receives “home
electricity reports” comparing their usage to their historical use, and to that of similar and
“efficient” neighbors. The reports also contain tips or suggested actions the household can take
to reduce electricity use. Since the pilot, SMUD has adjusted the program to measure the
persistence of savings after the reports are stopped (for a sub-set of households) and has
expanded the number of households receiving reports to target customer segments achieving
the highest rates of savings in the pilot.
Goals
SMUD has been very widget oriented (in promoting energy efficient equipment) in the past,
and sees normative messaging as a means to impact customer behavior and achieve additional
energy savings. SMUD now has enough experience to know it works, and has learned it is more
effective with some people than others. SMUD’s goals are as follows:
kWh savings
Customer engagement
Increasing customer satisfaction over time.
Main Design Features
The home electricity reports are received monthly by the majority of participants, with others
receiving them quarterly. The reports provide customers with feedback on their current and
historical electricity use, normative comparisons with similar neighbors, and conservation
messages and tips tailored to target specific household profiles. Participants can voluntarily
make a “pledge to save” goal. In October 2010, SMUD launched OPower’s suite of interactive
web tools that compliment the paper reports. Customers access these tools via a single sign-on
through SMUD’s web portal. The online tools include more detailed energy saving tips, energy
use reports, and the ability to set and track progress towards savings goals.
Program Delivery

Residential Behavior Based Energy Efficiency Program Profiles 2011
37
Customers are selected by SMUD to receive the reports, and cannot opt-in. They may contact
SMUD to opt-out, and opt-out rates have ranged from 2% per year at the beginning of the pilot
to less that 1% in 2011. OPower creates and mails the reports. SMUD has been involved in
structuring a rigorous experimental design and evaluation protocols for the pilot. SMUD sees
this as particularly important given that the savings being measured per customer are relatively
small.
In July 2010, SMUD ceased sending reports to approximately 9,000 recipients to measure the
persistence of savings after reports were stopped. The remaining recipients continue to receive
reports to measure long term savings trends. In October 2010 reports were sent to 20,000
additional recipients representing three customer target segments that had the highest rates of
energy savings in the pilot. This expansion included 15,000 who receive reports monthly plus a
test of a “summer burst” for 5,000 recipients who receive the reports for only four summer
months. It also includes a group of 5,000 recipients who receive no paper reports, but instead a
monthly email notification with a link to an electronic version of the report.
OPower’s preliminary energy savings estimates for the three additional “high saver” customer
target segments indicates that the group selected based on highest annual kWh consumption is
saving the most. Therefore, SMUD is targeting an additional 18,700 customers from this
customer segment beginning in October 2011.
Program Costs/Energy Savings
The 2011 program cost is forecast to be $412,000 including all administrative and overhead
costs. The average 2011 participation is expected to be approximately 38,500 customers, at an
average annual cost per recipient of $10.70.
The average gross energy savings per recipient in the pilot was 213 kWh/year as measured by
ADM Associates in a SMUD sponsored impact evaluation, with at most 53 kWh of the savings
attributable to other SMUD rebate programs. In February 2011 Navigant Consulting reported
on its latest energy savings analysis:
Year 2 savings = 2.89% for high consumption households (HCH) receiving monthly reports
(22% increase over year 1) and 1.70% for low consumption households (LCH) receiving
quarterly reports (a 36% increase)
Year 2 average household savings is 381 kWh for HCH and 104 kWh for LCH
Highest savings occur during SMUD’s peak season, 3.56% savings in July/August of 2009
There are no signs of energy savings impact deterioration to-date (30 months).

Residential Behavior Based Energy Efficiency Program Profiles 2011
38
The gross annual savings for the “high savers” group first targeted in 2010 is forecast to be in
the neighborhood of 360 kWh/year. Actual savings through year three including the various
sub-group tests will be measured by a third party impact evaluation in late 2011, with results
available in February 2012.
Evaluation Approach
SMUD uses an experimental design that randomly assigns customers to the treatment group
(participants) or the control group. For the Navigant evaluation, two statistical analyses were
used to estimate savings, a difference-in-difference (DID) analysis and a linear fixed effects
regression (LFER) analysis. The latest evaluation results are summarized above.
Lessons Learned
Normative messaging is effective in driving energy savings, and while the savings are small
per household, they are significant and cost-effective in aggregate.
Set up the experimental design and evaluation in advance to assure valid energy savings results.
An opt-out strategy results in very high participation rates (less than 3% of customers have
opted out)
Normative messaging is more effective with some customers than others. Initially target
those more likely to save (such as high users). Segment your customer base, and tailor your
messaging for various segments.
Voluntary “pledge to save” goal participants have achieved approximately 3 times as much
savings as the average savings from all participants.
Savings to-date from recipients of electronic reports are far lower than for paper reports
because click-through rate for SMUD’s test were only 12%, compared to open rates for the
paper reports above 90%.
Future Plans
SMUD is exploring ways to integrate the lessons learned from the Home Electricity Reports
program into tools and products being created and tested as part of its Smart Grid initiative.
Normative messaging will be incorporated into analytical and feedback tools that utilize hourly
energy use data. It is possible that paper versions similar to the current OPower reports will
continue to have a role given the significantly higher rates of engagement experienced to-date
compared to electronic communications. SMUD will complete its smart meter rollout by March
2012, and plans to test new customer-facing applications through 2013 and roll out a variety of
new customer products and programs gradually through 2014.
Contact
Bruce Ceniceros, SMUD Program Planner 916-732-6747 [email protected]

Residential Behavior Based Energy Efficiency Program Profiles 2011
39
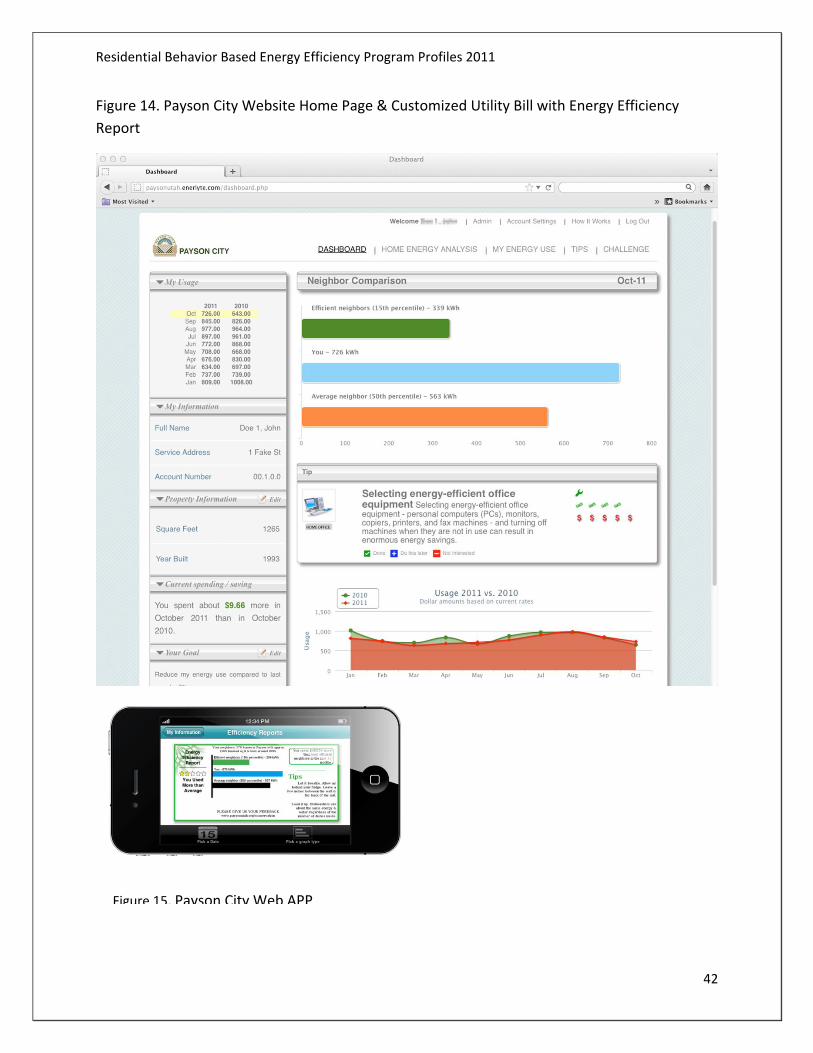
Payson City Power Energy Efficiency Reports (with Enerlyte)
Overview
Since 2010 Payson City Power (Utah) has been partnering with Enerlyte to provide energy use
and efficiency information on its residential customer energy bills. The information provided
on the customer’s bill can be customized; and typically includes a graphic display of current
energy use with comparisons to previous usage, neighbor’s usage, and efficient use. Customers
are directed to an interactive web portal dedicated to further educating and motivating
customers to take action to save energy, including setting goals and creating challenge groups,
with progress updates included on the customer’s bill.
Goals
Payson City Power is looking to reduce the utility’s peak power demands, educate and motivate
customers to use energy efficiently, and help customers save money on their energy bills. This
contributes to lower utility system costs and good customer service.
Main Design Features
Program features begin with a customized utility bill, including the “energy efficiency report”,
that provides customers with feedback on their energy use and comparisons to others (see
attached examples). Customers can access an online web portal that contains additional
information and tools for managing energy use, including an online audit and efficiency tips.
Customers can set personal goals and create challenge groups with neighbors and friends (with
progress reported on their bills). Website information can tie into utility energy efficiency
programs and customers can create an action plan and report what they have done. A smart
phone application has recently been added to communicate peak alerts. The program includes
a utility reporting center. Customer service representatives can review customer information
and change the energy efficiency report information presented on the customer’s bill (per
customer reporting preferences). The center also gives the utility analytical capabilities to
segment and target customers based on their energy consumption profile and other factors.
Program Delivery
Enerlyte works with Payson City Power to customize customer bills and the web-based
presentation, which now includes the new smart phone application. Payson City’s Power
Director indicated that Enterlyte does most of the work, including bill redesign, integrating with
the utility’s billing software and printing. The customized bills were first delivered to Payson
City Power’s 5,500 residential customers (except for the control group) beginning in October

Residential Behavior Based Energy Efficiency Program Profiles 2011
40
2010. The website is utility branded and is hosted and maintained by Enerlyte. The Power
Director says they are very pleased with the program and results to-date, indicating that given
their size, it would not have been possible for the utility to develop and offer the program on its
own. They have had few customer issues, with some customer calls when the program was
first launched asking questions about the new energy efficiency report information contained
with their bill. Enerlyte continues to improve the customer engagement system and has added
a number of customer service tools and utility reporting capabilities over the past year.
Program Costs/Energy Savings
Participant’s usage for the twelve months ending October 2011 was 2.4% less than the control
group (control group customers have never received Enerlyte’s consumption comparison data
on their bills). Since the beginning of the program (1 year) Payson City Power customers have
saved approximately 726,000 kWh, equating to $84,600. Payson City Power’s cost to run the
program over the first year has been approximately $15,000; with about $5,400 in one-time set
up costs and $9,700 in annual operating costs.
Evaluation Approach
Enerlyte compares participants (treatment group) with a control group (non-participants) to
determine energy savings. The control group represents approximately 10% of customers. The
analysis is based on monthly energy usage for the median consumer in both the treatment and
control groups. The difference between each group’s median kWh usage when multiplied by
the number of consumers in the treatment group is indicative of the total energy savings for
that month. Consumption data is not “temperature adjusted” (weather normalized) because
both groups experience the same weather and have the same number of “usage days” between
meter reads.
Lessons Learned
Educating and informing customers when the program is launched is important. Although
few customers had problems with the revised bill and report, a number of customers called
in during the first few months asking questions, such as “Who are my neighbors?” The
utility got better at explaining to customers what they were looking at and directing callers
to the website for further information. Payson City Power continues to learn about its
residential customer base through the program.
Future Plans
Payson City Power is looking to add more conservation and product information to the website,
and make better use of the additional customer engagement features (goal setting, challenge
groups, phone app) and administrative functions (customer service, reporting, segmentation).

Residential Behavior Based Energy Efficiency Program Profiles 2011
41
Contact
Ron Crump, Power Director, Payson City Power 801-465-5279 [email protected]
Sam Steele, Enerlyte 801-214-8484 [email protected]
Residential Behavior Based Energy Efficiency Program Profiles 2011
42
Figure 14. Payson City Website Home Page & Customized Utility Bill with Energy Efficiency
Report
Figure 15. Payson City Web APP
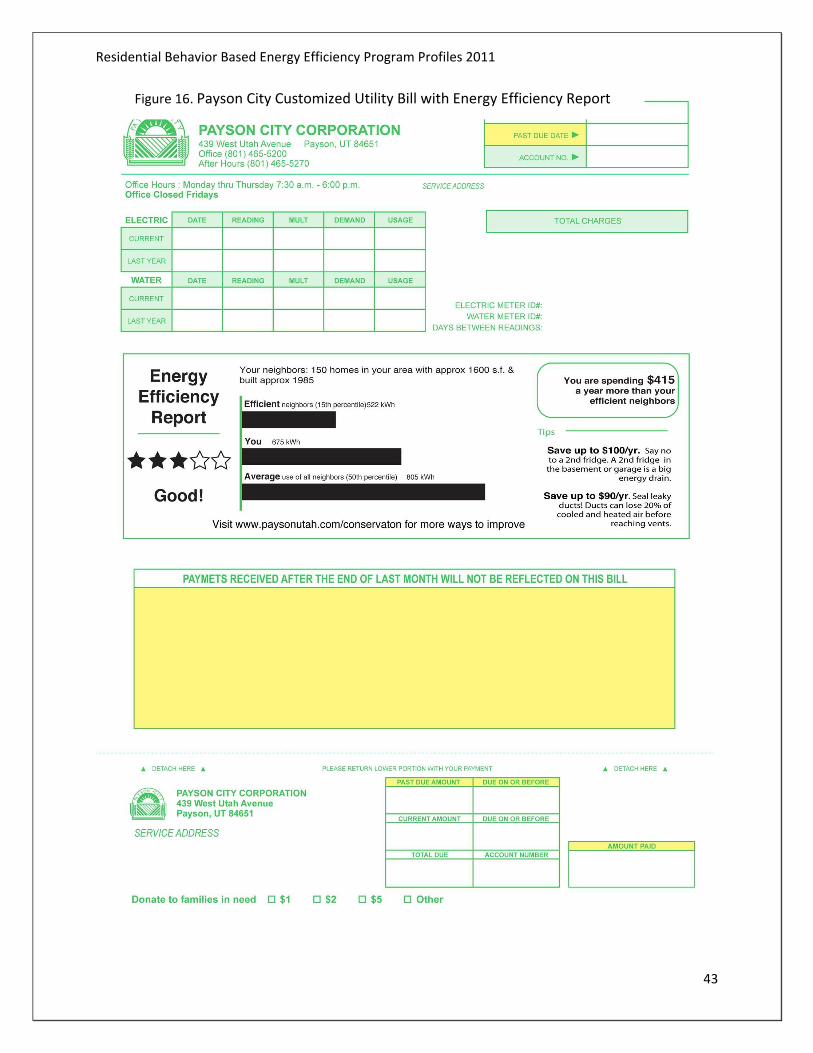
Residential Behavior Based Energy Efficiency Program Profiles 2011
43
Figure 16. Payson City Customized Utility Bill with Energy Efficiency Report
Residential Behavior Based Energy Efficiency Program Profiles 2011
44
Cape Light Compact Residential Smart Energy Monitoring Pilot
Overview
Cape Light Compact initiated its Residential Energy Monitoring Pilot with Grounded Power (now
Tendril) in 2009. The initial pilot used an web-based dashboard, with in-home displays added
later. The in-home display added in Phase 2 provides customers with real time information
about electricity use and costs; and an interactive web-site that contains a suite of features,
such as sign up for energy savings actions, setting a goal, etc.
Goals
Cape Light Compact (CLC) is a municipal aggregator serving 21 towns on Cape Cod and Martha’s
Vineyard. CLC has regulatory support to apply 1% of its revenues to R&D. Specific goals for the
pilot include
Evaluate energy use feedback as a strategy to reduce electricity consumption
Gain insight into behavioral aspects of energy use
Inform future smart grid projects
Main Design Features
The original pilot used an web-based dashboard. The website includes
Recipients’ current and historical energy use
Comparison to similar neighbors
Energy saving/cost saving/carbon saving tips
Social networking aspect, 10% personal goal
The larger Phase 2 effort provides customers with advanced versions of both the in-home
displays and the website. Three devices are installed in the home, a meter bridge that enables
the customer’s meter to talk to the gateway, a gateway that gathers the data and sends it over
the internet, and the in-home display. Unlike the original pilot, phase 2 product installation
does not require an electrician. The website uses the Tendril Energize energy application suite
to encourage customer behavior change.
Program Delivery
The original pilot included three key program design and implementation staff. There were 100
customer participants. Customer interest was high with more than enough participant sign ups
from fairly limited marketing activity. CLC experienced significant customer interaction in the
original pilot and said participants took special handholding. Questions needed to be

Residential Behavior Based Energy Efficiency Program Profiles 2011
45
anticipated and sorted based on appropriate responder, the contractor or the utility. Phase 2
started in June and includes at total of 380 participating customers.
For phase 2, CLC is partnering with a vendor (Tendril) providing turn-key services that minimize
utility staff involvement. In the original pilot CLC scheduled and coordinated product installs
and answered customer questions. In phase 2 the vendor team handles all of that. So even
though phase 2 is a larger effort the CLC staff impact is less, just a few hours per week, while
the vendor team is approximately 2 FTE, including a program manager, data management and
analytical support. Besides general program oversight, CLC responsibilities include getting
participant data to Tendril and referring any customer inquiries that come directly into the
utility to the vendor team (the program is set up for primary contact directly with the vendor).
Program Costs/Energy Savings
Hardware costs for phase 2 are averaging $292 per participant, including the meter bridge,
gateway and in-home display. Product installation, software (Tendril Energize) and vendor
services average an additional $152 per customer, for a total first year program cost of under
$500 per participant. Annual software licensing renewal is $36 per participant. The other costs
are considered one-time costs. The initial pilot resulted in 9.3% average energy savings per
participant, with 75% of participants reducing their energy consumption. Approximately a third
of the participants reduced their usage by 4 or more kWh per day (compared to control group).
Phase 2 evaluation will be completed in August 2012.
Evaluation Approach
CLC selected PA Consulting Group to conduct a process and impact evaluation for the initial
pilot. Evaluation activities included in-depth interviews, telephone surveys, a comprehensive
energy use analysis, and a literature review. The impact evaluation included an analysis of
monthly energy consumption (kWh) across both time (compared to previous year) and with
two control groups (one random and one that expressed interest in the pilot).
Lessons Learned
Cape Light Compact is convinced there are savings available from providing customers with
feedback on their energy consumption.
Be clear about your utility’s goals to inform the program design and product/services.
Providing customers with basic feedback is one thing, achieving significant reductions in
usage is another.
Think through required staff support before initiating the program. CLC moved to more of a
turn-key approach for phase 2 to minimize utility staff impacts.

Residential Behavior Based Energy Efficiency Program Profiles 2011
46
Identify important questions to ask vendors/service providers. What are they providing
beyond the product(s)? What are the data requirements? (frequency, format, etc.)
Tell customers what the pilot is and what it isn’t, get their informed consent before
participating.
Technical challenges with completing installation and connectivity of the energy monitors
can impact or delay implementation.
Awareness of energy use by participants increases. They have self-diagnosed spikes due to
heat being left on, refrigerator cycling issue, etc. People informing each other about energy
saving actions they can take is important.
Correlation is low between self-reported habits and tasks to save energy and actual energy
savings, the strongest predictor of savings to-date is interaction with the energy monitor
(website).
Future Plans
This is a different approach to promoting energy efficiency with use of new technology. It is
enhancing utility customer interaction and participants learn more about CLC and its energy
efficiency programs, resulting in greater customer awareness and program cross-selling
opportunities. The persistence (or lifetime) of the energy savings is the key to program cost-
effectiveness, which CLC will learn more about through the phase 2 evaluation (which includes
original pilot participants). If the persistence is there, CLC may offer program services to more
customers. Adjustments can be made to the program, including customer fees charged for the
service, to help assure it is cost-effective.
Contacts
Briana Kane, CLC Program Manager 508-744-177 [email protected]
Kevin Galligan, CLC EE Manager 508-375-6828 [email protected]

Residential Behavior Based Energy Efficiency Program Profiles 2011
47
Figure 17. Cape Light Compact Energy Monitoring Portal
Figure 17. Cape Light Compact Energy Monitoring Portal Tips

Residential Behavior Based Energy Efficiency Program Profiles 2011
48
Residential Behavior Based Energy Efficiency Programs
Interview Questions
1. Program Goals
a. Customer engagement/satisfaction?
b. BBEE energy savings?
c. Uptake in other EE program (EE technology) offerings?
d. Other?
2. Regulatory or Board Support
a. How was initial regulatory or board support obtained?
b. What do you see as the key to maintaining support in the future?
3. Main Program Design Elements/Features
a. Energy consumption feedback? Products? [on-line, in-home, mail?] Please
describe [info presented, how displayed? frequency?]
b. Further customer engagement? Strategies and tactics?
Marketing & communications?
Messages, stimulate customer dialogue? Use of traditional marketing channels,
newer social media options and devices?
Customer tips & assistance?
Effective actions to take? [tailored to targeted customers?] Integration with
other EE offerings? Any assistance in taking BBEE action?
Customer goal setting?
Energy reduction challenge and commitments? [personal goal/commitment, any
community goals?]
Rewards and recognition?
Prizes? Financial rewards? [fixed reward amount, random rewards]
Recognition? [for what, how?]
Other?
Any other customer engagement strategies and tactics?
4. Delivery or Implementation Approach
a. Marketing and customer sign-up?
Scope? [all customers or specific targets?]
Opt-in or opt-out?
Marketing approach? [direct contact, collateral, etc.]

Residential Behavior Based Energy Efficiency Program Profiles 2011
49
Contractor or utility initiated?
b. Product/service offering?
Product/service installation? [any customer/data requirements?]
On-going customer service? [updates?, customer interaction?]
c. Staff expertise/support?
Areas of expertise needed? [IT, marketing/customer service, operations, etc.]
Use of contract resources? [for what? why? how identified? who selected?]
5. Program Costs
a. Program design costs?
b. Start-up costs?
c. On-going operational costs? [Internal and contract, economies of scale?]
d. Evaluation costs? [Process and impact evaluations]
6. Program Evaluation
Program Results or Outcomes Achieved To-Date?
a. Participation rates? (opt-in or opt-out?)
b. Customer feedback/satisfaction?
c. Energy savings? Persistence?
How are/were energy savings results evaluated?
d. Pre & post usage comparison?
e. Control group (randomized)?
f. Surveys? Focus groups?
Main lessons learned to-date? [Pros and cons]
7. Does your organization have plans to continue BBEE program activity in the future? If not,
why not? If so, how? Any additional thoughts or advice to others interested in BBEE?