behavior & energy - stanford...
TRANSCRIPT

1
Behavior & EnergyK. Carrie Armel

2
Energy Efficiency Compared to CO2-Free Energy Supply
• A 10% reduction in all energy intensity implies that 8.5 quads of fossil fuels are not used, reducing CO2 emissions by 8.5%
• A 25-fold increase in wind plus solar can displace about 8.5 quads of fossil fuels.
• A doubling of nuclear power can displace 8 quads of fossil fuels.
• 1 billion tons per year of celluosic conversion of biomass can displace 5 quads of gasoline.

3
EngineeringEconomics
Toolbox
Behavioral Sciences
How?
To date, the main tools that have been applied to improving energy efficiency or reducing energy use have mostly been technological and economic. However, I’d like to add the behavioral sciences to the toolbox. I think this is particularly appropriate for the residential sector.
Addressing energy use in the residential sector can have a large impact:~1/3 of non-transportation energy use is from residential buildings~60% of transportation energy use is from cars and light trucks – which are primarily used in the residential and small business sectors
Barriers to adoption of technologies and behaviors in the residential sector have a large behavioral component.
So I’m going to focus on how behavioral approaches can reducing energy use in the residential sector for most of the rest of this talk.

4
Typical Approaches
BehaviorChange Attitudes ?Use Standard Marketing Approaches ?
?Provide Monetary (Dis)Incentives
ATTITUDESMetareviews as early as the 1960s have shown that correlations between attitudes and behavior are very weak, often near zero (e.g., (Wicker, 1969)
STANDARD MARKETING •Small changes in market share are sufficient.• Target easy behaviors: switch to a new brand or indulge.• Messages based primarily on creative inspiration.
Product, price, placement, & promotion.
MONEY•Other barriers are not addressed• Incentives are expensive, fees unpopular• Small incentives not very motivating•Behavior reverts back or even boomerangs
I’m going to start by briefly covering several approaches that tend to come to mind for many people on how to produce environmental behavior change. Unfortunately, these are often not as successful as we’d like.
Financial (Dis)Incentives can be successful, but they often have disappointing results. For example, this graph corresponds to a review of utility-sponsored incentive programs to promote home retrofits. The last bar represents 7 utilities that each offered a 93% rebate – so they almost completely paid for the retrofit –the dashed line shows that on average, only 5% of people made these retrofits. The ends of the bar represent the range of results, and illustrate how other non-financial characteristics of the programs influenced outcomes.
The problem is that money doesn’t address other barriers to behavior, they may not be politically feasible, small incentives tend to not be very motivating to people, and after incentives are removed behavior reverts back to baseline or becomes even worse.
Regarding attitudes, metareviews as early as the 1960s have shown that correlations between attitudes and behavior are very weak, often near zero. (attitude: sustainability is important)
Regarding standard marketing approaches, these techniques tend to focus on small shifts in market share for behaviors that people are already engaged in, like drinking coffee. They also tend to encourage indulgence not restraint. In contrast, with energy efficiency we want to change behavior in a significant portion of the population, as well as shifting people to new behaviors that aren’t inherently motivating.
These approaches do have things to offer, but alone they will likely be insufficient to achieve our goals.

5
PolicyPhysical Env.SocioculturalInterpersonalIndividual
• Interactions between levels• Complementary interventions
Levels of Interventions
Based on the socio-ecological model of health behavior
Built Env.BuildingsTechnology
So what should we do to change behavior? For at least several decades the field of public health has put an exerted effort into changing behavior in order to address problems like smoking and heart disease. The field has employed interventions at multiple levels. I’ll illustrate some of these with examples related to climate change:
•There’s policy interventions – here I mean formal rules, which may be instituted by the government, as well as other organizations like utility companies etc. •And there’s interventions at the level of the physical environment. These include characteristics of the built environment, like whether a city is walkable, and of technology, like whether programmable thermostats are intuitive so that people actually use them.•The sociocultural level includes media communications– such as serial dramas and public service announcements, through TV, newspaper, etc.•Interventions where there is interpersonal or face-to-face contact, include programs at schools, faith-based organizations, Girl Scout troops, YMCAs, etc.•At the individual level there is no intervention - people do research on their own and figure out how to make lifestyle changes. That’s incredibly effortful and we can’t reasonably expect that the majority of people will do this.There are lots of interactions between all of these levels [For example, new technologies can facilitate changes in individual behavior, media coverage, and policies.]
Furthermore, complementary interventions at multiple levels seem to be more effective at producing change – that is, making a city walkable but not promoting walking clubs and having media coverage will produce minimal effect.
I’m going to be talking in more depth about interventions at each level.

6
PolicyPhysical Env.SocioculturalInterpersonalIndividual

7
PolicyTake advantage of cognitive dispositions1. “Opt-out” instead of “Opt-in”
- For green electricity or carbon creditsPicherta et al. (In Press). J of Env Psy.
2. Use a loss-aversion frame - Have electricity company customers use a home
meter that deducts money from their account as they use energy
3. Address high discount rates- The cost of solar panels
Here are a couple of policies that utilities could use. They take advantage of cognitive dispositions that people have. These principles tend to be studied in behavioral economics.
People tend to have a lot of inertia when it comes to DM. For example, when automobile drivers decide whether to donate their organs, we see participation in such programs to be ~20% in countries where the default option is NOT donating, but 80-90% in countries where the default option is TO participate. Similar results are found in many other programs, like 401(k) retirement plans and insurance choices.
There is some work in Germany suggesting that this technique could be effective when applied to green electricity or carbon credits. [[For example, one utility company got rid of its old plan and sent letters to 150,000 customers with three new plans. Two months later, 6% of the customers had switched to a different brand or carrier, but 94% had stuck to the green default option. This is compared to 1% who switch to green energy in other parts of Germany and Europe.]]
Another example takes advantage of the fact that people are loss averse. Some companies in Canada and the U.S. have installed devices in peoples’ homes that require that they swipe their credit card through and that they then display the money being deducted. They found that many people reduce their energy use by as much as 20%.
In order to address the high up front cost of solar panels and the tendency of individuals to have steep discount rates over the time during which they’d recoop their savings from having installed solar, Berkeley CA is trying a new program in which the cost of solar is incorporated into homeowners’ property taxes and spread out over 30 yrs.

8
PolicyPhysical Env.SocioculturalInterpersonalIndividual
Built Env.BuildingsTechnology
Let’s move on to the physical environment – specifically, the built environment.

9
This graph shows the proportion of trips in urban areas made by walking or bike. In the US this totals 7% whereas in many European countries this figure lies between 30-45%.
If you’re worried that public transit wasn’t taken into account, in 1990 the most common percent of trips made by car in the US was 84%, whereas the average in these other developed countries was less than 50% (47%).

10
InfrastructureSafety, etc. Promotion
Model City: Muenster, Germany
Education & Tests
Bike Police
• 35% of all vehicle trips made by bike
• Popul.: 300,000
There are several cities in Europe that are good models, Münster Germany being one of them. About 35% of all vehicle trips there are made by bike. This is accomplished in several ways.
Infrastructure-Special bike lanes and promenades-Special rules for cars on all residential streets that give priority to bikes.-ordinances requiring the inclusion of bike parking facilities.
Safety -Cycling education is given in school by police starting in kindergarten.-A mobile repair service comes to customers with replacement parts to get broken-down bikes back on the road.
Promotion- postcards, billboards- a virtual bike tour on our Web site that highlights Münster’s bike transportation facilities.
A recent book by top public health and civil engineering professionals (Larry Frank, Richard Jackson, ?) describes great research currently being done in Atlanta and other U.S. cities on how changes to the built environment are able to get people to walk more.
And I don’t have to tell most of you here that getting people to bike and walk more addresses other important public health issues like obesity, heart disease, etc.! Such co-benefits are fantastic in and of themselves, and are also useful for motivating political will and funding.

11
PolicyPhysical Env.SocioculturalInterpersonalIndividual
Built Env.BuildingsTechnology

12
Green BuildingsVisual
• Natural daylighting, windows, & pleasant views (greenery) increase productivity (Heschong)
Acoustic• Open spaces may be noisy acoustic
design, white noise generators, or earplugs.
Thermal• Are temperature shifts less aversive when
adjusted slowly over long periods?
Social Contact, Privacy, & Creativity
Buildings and transportation use the most energy in the residential and commercial sectors. Green buildings can cut energy use dramatically. If these buildings are desirable to work in, builders will be more likely to build them.
There are various subdisciplines in psychology that are relevant to making the buildings more desirable. For example, relating to visual perception, natural daylighting and greenery improves productivity. There are also acoustic, thermal, and social issues that are relevant to building design.

13
PolicyPhysical Env.SocioculturalInterpersonalIndividual
Built Env.BuildingsTechnology
Let’s move on to technology.

14
Design
•Only 20% Americans own one•70% of those don’t program it•Designed from engineer’s perspective of what’s easiest to implement
•Should be designed from user’s perspective of what’s easiest to use
Elements of Design:•Learnability•Usability•Motivation, incl. identity signaling•Aesthetics
Tom Kelley. (2001). The Art of Innovation. BJ Fogg BJ. (2003). Persuasive Technology. Don Norman. (1998). The Design of Everyday Things.Francis Durso (ed.). (1999). The Handbook of Applied Cognition.
We can begin with the example of programmable thermostats. According to a 2004 study cited in Energy Star's Programmable Thermostats Stakeholders Meeting, only about 20% of Americans own programmable thermostats, and of those 70% admit to not using their programmable features because they're too complicated. I should qualify I’ve been doing more research on this issue and I think that these figures might be older because for the last few years, these figures are not nearly as dramatic. But my points will still hold.
Why is this?
Many items are designed from the engineer’s perspective of what’s easiest to implement. The user is given a manual that is several pages long, even though we know that people rarely read instructions, and it requires them to push various sequences of arbitrary symbols, resulting in errors and frustration.
Instead, items need to be designed from the user’s perspective of what’s easiest to use. In this Honeywell thermostat, the thermostat walks the user through a series of questions, and based on this information lays out a visually approachable schedule of temperature changes which the user can then modify if necessary.
The difficulty with this approach is that oftentimes the simpler the device is made for the user, the more complex it becomes to design, because we need to understand how the user thinks. Several elements of design are relevant to this:
LearnabilityUsabilityMotivation, including Identity SignalingAesthetics

15
Numerous possible places to get stuckeach leading to poor performance!
Minimum Physical Limit(correct and efficient usage)
Asymptotic Practice
Phase
Many Errors
FewS
low Speed
Fast
Amount of Time Doing Task (“Practice”)
AccommodateBoundedRationality
Provide Feedback
Motivate
How the User Thinks
Etc.
Based on Rosenbloom & Newell
I’m going to go into a little more detail on how the user thinks to give you a feeling for this field. A useful framework for understanding how users learn comes from the Power Law of Practice (Rosenbloom & Newell). The law is a robust finding that people make fewer errors and are faster with the more time they spend doing the task. About 80% of improvement along the power function comes from figuring out a good strategy for getting the task done, while about 20% of improvement comes from getting better at the same strategy.
There is good evidence that the steep part of the power function is actually composed of a combination of step functions where each step is a learning event – where one acquires new knowledge or develops a better model for how the system works. The designer needs to understand what learning events occur so that individuals don’t get stuck and stop using the technology or some of its features.
There is an enormous body of literature in cognitive science speaking to issues of how we can improve users’ performance, yet often this knowledge fails to be incorporated into design. I’m going to illustrate a few principles using the Prius’Energy Monitor, which does an excellent job of implementing several important principles. Using the feedback from the energy monitor, as well as some other approaches, drivers learn how to exceed the average 60mpg to sometimes achieve over 100mpg. These people are referred to as hypermilers in the U.S., ecodrivers in Europe, and the obsession is known as Nempimania in Japan (literally meaning fuel economy and mania). The improved mileage is accomplished through a variety of techniques including slow starts, "Pulse and Glide", timing at stoplights, forced stop, driving barefoot, etc.
So how does the Energy Monitor improve performance?
The display addresses bounded rationality, or constraints on [perception,] attention, memory, and reasoning.
1. The display limits the number of items that need to be held in mind to about 4 (the battery, engine, etc.). That’s important because the capacity of visual working memory is 4 items. This means that most people can’t process more than that number simultaneously.
2. The display builds on familiar icons to speed learning. Rather than having arbitrary shapes, the pictures of the engine, battery, etc. match prototypical images of these objects, and labels are used to avoid ambiguity.
3. The monitor shows these items on the car chassy so that users can map the functionality onto their overall spatial representation of their car. This allows the information to be integrated into a larger framework of how their car works and enhances memory.
The display also provides feedback.
And does so in a way that allows for competition with oneself or others, which is motivating.

16
Feedback
• 10-14% reductions in use
• Greater reductions with more specific feedback
If you can count it, you can change it!- Prof. Thomas Robinson, Stanford University
Sarah Darby. Making it obvious: designing feedback into energy consumption.
Let’s talk a little more about feedback.
In the area of electricity use, close to 40 studies were performed between 1975 and 2000 showing that simply having a meter inside the home in a central location reduces energy use by between 10-14% on average. Up here we have some current inexpensive devices for doing this – the Kill-A-Watt that provides feedback on a specific appliance, the central device shows overall home electricity use, and the energy orb on the right provides feedback as to the overall demand on the grid.
The second major finding is that the most successful studies were those that provided more frequent feedback, and also feedback about specific behaviors. One of the projects I’m working on relates to collaborating with companies to provide almost immediate feedback to a personalized website about specific rooms or even appliances within your home. Then you can prioritize changes, and also find out when an appliance is so inefficient it needs to be replaced, etc. You can imagine enhancing this feedback further in a bunch of ways, like having your cell phone tell you you’ve done a “good job” when you reduce your energy use etc.

17
PolicyPhysical Env.SocioculturalInterpersonalIndividual
The sociocultural level includes media and marketing interventions.

18
Communication
NO DESIRED BEHAVIOR
DES
IRED
B
EHA
VIO
R
Attend to it? - Vivid, concrete, & personal- Biased attention
Yes
No
Understand it?
No
YesBelieve it?
-Messenger-Frame
No
YesRemember it?
-Chunk -Prompts / Cues
No
YesDecide to actAccordingly?
No
Yes
Persuasion Models
Framing Approaches
• Personal Welfare• Ethics• Economics
There is a huge academic literature relevant to communication in ads – in the fields of communications, consumer behavior, psychology, and public health. This applies to the design and deployment of PSAs.
Persuasion models articulate a series of stages that individuals must go through before they will perform the desired behavior, and if failure occurs at any stage then the desired behavior does not occur. I’ll describe a simplified model. In order for a public service announcement to influence your behavior, you must attend to it, understand it, believe it, remember it at the appropriate time, and then execute decision processes that weigh in favor of performing it. Although this may seem obvious, there are many, many points along this path that could produce failure, and many tools that can enhance success, and a lot of research on how to do this (that unfortunately is most commonly not implemented).
There are some more recent models that more accurately reflect decision making and emotional processing in the brain, but in the interest of time I won’t talk about these.
I’ll elaborate on a couple of techniques that may be important for climate change. The messenger is important to whether the person believes the message. These cigarette ads make interesting use of messengers. Alliance for Climate Protection, Al Gore’s marketing group, has done some field work suggesting that people find Oprah and Bill Gates more credible than scientists for the majority of the public.
Framing is another important technique. For example, messages can be framed in terms of personal welfare, ethics, or economics.
NORMS - More than 30 years of research shows that social norms are more powerful at determining behavior than most people believe. [Norms are an individual’s beliefs about the common and accepted behavior in a specific situation]
• For example, a 2005 study showed that utility customers reduced household energy consumption the most [Get %]when they learned that the vast majority of their neighbors were conserving, rather than when they were told about environmental benefits or about personal cost savings (Cialdini et al., 2005). What is particularly striking is that the participants generally thought information about the behavior of their peers would be less likely to influence them personally than environmental benefits or cost.
• This finding has been replicated many times with hotel guests reusing their towels, national park visitors staying on trails, and in other situations.
- However, we have to be careful with how we portray norms bcse if few people are doing the behaviors, a boomerang effect can occur and actually reduce compliance [cause behavior to fall] below its initial levels.
This last technique has to do with understanding individuals’ mental models. Mental models are models that individuals have of how the world works. Depending on one’s mental model of how sensitive the environment is to disturbances, individuals may be more or less disposed to change their behavior. The first picture depicts a model in which the environment is very sensitive as represented by the ball sliding down the sides due to even a small disturbance. The second represents a mental model in which it would be difficult to affect the environment, and the third between the two. Often, assumptions are made about individuals’ mental models, but understanding them provides one more control in influencing the receiver.

19
Habits & MythsStudies of nearly identical units have reported large (e.g., 200-300%) variations in energy use. (for a review, see Loren Lutzenhiser 2003)
• Cultural habits– 1996 study on energy related behaviors in Norway and Japan – Age related differences, e.g., teens take more frequent and longer showers
• Personal habits– People are surprised by the frequency of habits like peering into the refrigerator
or running hot water that the self-monitoring causes them to “catch”.
• Myths or erroneous mental models of how the world works– Turning things off and back on again uses more energy than leaving them on– When devices are turned off they’re not drawing power– Turning thermostats down only a few degrees is more efficient than turning them
down a lot
Changing habits or myths could be another important role for the media.
For example, there studies of nearly identical units have reported large (e.g., 200-300%) variations in energy use. Although some of this is due to factors like family size, studies have shown that a large amount is due to ethnic as well as local cultural differences, and personal habits.
In a 1996 study that explored cultural differences more deeply, it was found that people in Norway and Japan differed on a variety of energy related behaviors. For example, Norwegians washed their clothes at 50 or 60 degrees Celsius, while the Japanese washed their clothes in cold water. This was due to the fact that the Japanese did not associate hot water with cleanliness. [need to go to Japanese articles more]
Myths or misunderstandings also result in wasteful behavior. For example, a common belief is that turning things off and back on again uses more energy than just leaving them on. In actuality, it is more energy efficient to shut off your car if youhave been idling for more than 10 seconds [[, and more efficient to shut off your lights if you are leaving the room for more than 1 second.]]
Many people do not realize that when devices are turned off they’re drawing power.

20
Implicit Marketing
• Product placement and quantity• Buzz or viral marketing
In message dense environments it is often difficult to get significant attention to one’s cause. But there are other effective approaches that can be used. For example, there are implicit marketing strategies in which the receiver doesn’t realize that they’re being marketed to. Examples are placing products at eye level on shelves and increasing their quantity so that people believe the item must be in high demand.
Another example is buzz or viral marketing - when individuals are paid to promote something to other people without them knowing. Cigarette and alcohol companies have used this [[in insidious ways]] – for example, having attractive women hang out at bars with a pack ofcigarettes in their clear plastic purses.
21
Entertainment Education• Serial dramas are extremely effective for prosocial change• Few environmental shows
How do they work?• 2/3 Entertainment• Modeling
Social Cognitive TheoryAlbert Bandura• Instruct• Create norms• Build self-efficacy (confidence) • Demonstrate expected outcomes
• Pos., Neg., & transitional chars.
Another sociocultural technique comes from the field of Entertainment Education. Serial dramas, which are similar to US soap operas but are designed to facilitate prosocial change, have been powerful forces for change, mostly in developing countries.
Some examples to illustrate their success include: •In Mexico, where the serial dramas began, a serial drama on literacy urged viewers to get their reading materials at the capitol’s distribution center. Fully 25,000 viewers showed up to get their reading materials the day after they were urged to do so (Bandura). •From 1977 to 1986, when the Televisa family planning soap operas were on the air, the country underwent a 34 percent decline in its population growth rate, causing USAID in Mexico to write, "[These] soap operas have made the single most powerful contribution to the Mexican population success story.“•Today, the serial dramas have been adapted in over 25 countries on issues ranging from domestic violence to personal hygiene and HIV prevention.
How do they work?
•Humans love stories, so the formula is 2/3 entertainment.
But the important element is that these shows allow people to learn about new behavior through modeling, or by observing and imitating others, which humans do perhaps more than any other species. In this case, the models, or TV actors, serve to:
•instruct by providing information about real-life resources•create norms based on what is observed, even if it does not accurately reflect the state of the real world. •Build self-confidence by viewing a model developing ways of successfully coping with barriers. •demonstrate expected outcomes by showing models taking a course of action which is then rewarded or punished, either through material outcomes or social approval. It accomplishes this by having positive, negative, and transitional characters. The positive characters are ones who exhibit the desired social behavior and experience good outcomes as a result. The negative ones are the opposite. And the transitional ones are individuals who begin by exhibiting the undesirable behavior but transition to the desirable, like the producers hope the audience will do.
Perhaps elements of this technique could be applied to energy efficiency issues, through climate change reality TV shows or other media.

22
PolicyPhysical Env.SocioculturalInterpersonalIndividual
The next intervention level is the interpersonal.

23
Face-to-Face Contact– Hood River Project– Australia’s EnergyMark program– Gore’s 1000 soldiers– Interfaith Power and Light
This mostly involves personal or face-to-face contact, whether it be from friends, block leaders, or representatives of organizations.
One example is the Hood River weatherizing project, undertaken by the NRDC and the Pacific Northwest’s largest electricity suppliers. Initially, less than 10% of customers signed up for the voluntary program. However, when the project switched to relying heavily on local residents, such as Citizen Advisory Councils and speakers at schools and churches, 85% of households had enrolled in 2 years, and 95% by the end (Cavanagh and Hirst, 1987; Engels, Kaplan and Peach, 1987).
Environmental project coordinators have caught on that this approach is effective - community based social marketing approaches. For example, Australia’s Commonwealth Scientific and Industrial Research Organization has organized the Energymark initiative, based on their successful Watermark program in which hundreds of individuals met with thousands of citizens in their homes in an iterative process of conveying best practices for conserving water to the citizens and learning new strategies from them in order to improve the repository of best practices.
Gore and Interfaith Power and Light have also used this strategy. Interfaith is a group that motivates members of religious organizations to make climate-positive changes in their lives.
24
Advantages of Interpersonal• Face-to-face contact
– Messages feel personal (not anonymous)– Norms of close others
• Increased specificity of the intervention– Information for people like me
• Enhanced learning – Direct experience
• Additional tools– Group feedback & competitions– Commitment
Why use this approach compared to the others that I’ve discussed today?

25
55 1L Balloons of CO2
Photo by Rod Golden
1.45 ounces of oil17 teaspoons of sugar
$1.50 x 4/wk x 52wks = $230 extra per year
Costs & Benefits
Some of the techniques that have been shown to be successful in interpersonal interventions (not necessarily these particular examples) include: Making explicit, concrete, and vivid for people the costs and benefits of their behaviors. Drinking one 16oz bottle of soda results in the production of 66 1L balloons of CO2 and it contains 17 teaspoons of sugar. Drying one load of laundry produces about 800 1L balloons of CO2 balloons (enough to fill about 12 dryers), and driving one mile in a midsize car produces about 190 balloons (or 1.3 car trunks full).

26
Name_____________________________________My goal is _________________________________I will report my progress to my challenge buddy, __________________________ every ___________(a day of the week) during ________ (activity)Something that might get in the way is ________ ___________________________________________ I will deal with this by ______________________ ___________________________________________Adapted from materials by Jane Rothstein, LCSW
Goals Feedback
Barriers Skills
Evaluations of real-world interventions, particularly in public health, have shown that each of the following play an important role in promoting behavior change: explicitly setting goals (c/o Jane Rothstein), receiving feedback, addressing barriers (in the case of the seafood watch card it’s by providing information), and developing skills (this is a picture representing a clothesline relay race one of our students developed).

27
Group goals & feedback
Competition
•One of the problems with energy efficiency is that individuals wonder why they should bother changing their behavior because alone they won’t make a big difference. However, this can in part be addressed with communal feedback. When residents of the Midland-Odessa area in Texas were provided with daily evening television feedback and conservation tips, they reduced gasoline usage by 32%, and usage remained at 15% lower several months after the program compared to what it had been prior. •Competition can also be a strong motivator. Oberlin College, and now many other campuses as well, have a Campus Resource Monitoring System website developed by LucidDesign that compares the energy usage of all the dorms on campus on an ongoing basis.

28
PolicyPhysical Env.SocioculturalInterpersonalIndividual
• Interactions between levels• Complementary interventions• Co-benefits
Levels of Interventions
Based on the socio-ecological model of health behavior

29
Can we expedite the development of successful interventions?

30
Design
The field of Design has established methods for developing innovative solutions to difficult problems. It achieves this by employing a variety of cognitive activities represented here by the spokes of the wheel (like data gathering, inductive and deductive analysis sessions, and directed brainstorming) – these bring designers through the process of identifying the problem through defining its solution. A key to success is prototyping solutions early and often, and testing these prototypes on real people.
31
Relevant Fields
PublicHealth Entertainment
Education
Social Marketing
CommunityBased SM
ConsumerBehavior
CommunicationTheories
PersuasionTheories
BehavioralEconomics
DiffusionTheory
TechnologyDesign
Anthropology& Sociology
CityPlanning
Social,Cognitive,
& PerceptualPsychology
Marketing
Communication
Economics
Sociology
PublicPolicy
Medicine
Education
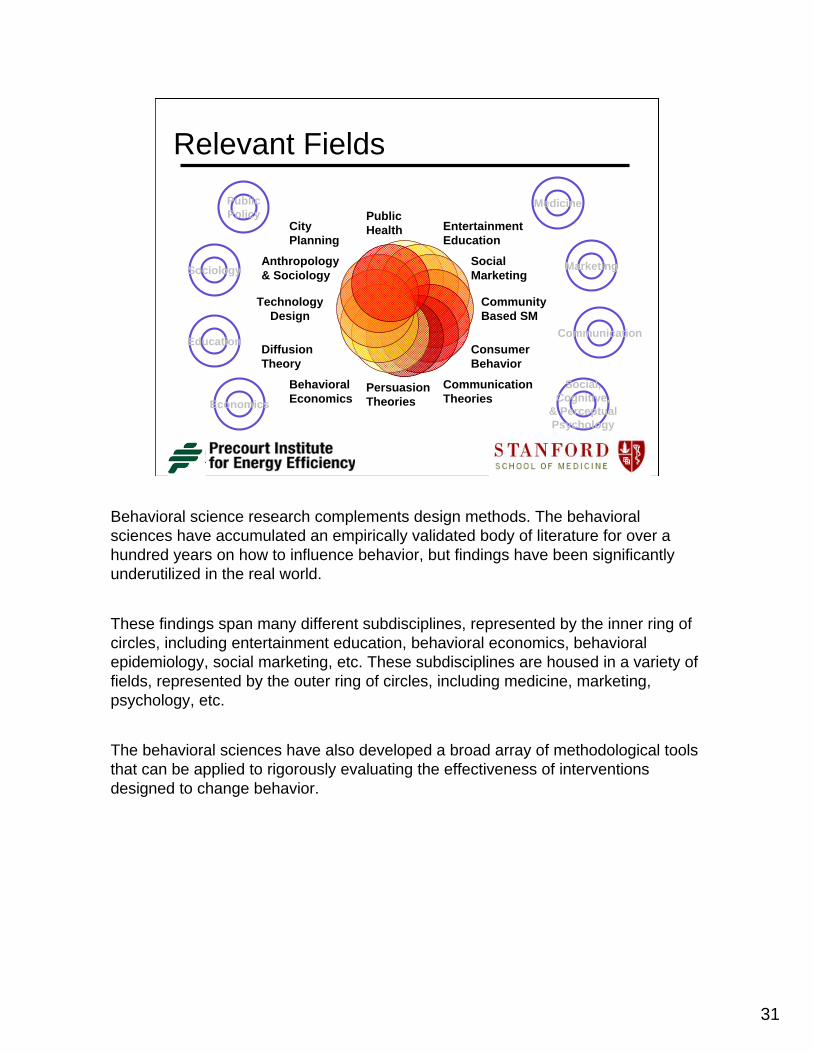
Behavioral science research complements design methods. The behavioral sciences have accumulated an empirically validated body of literature for over a hundred years on how to influence behavior, but findings have been significantly underutilized in the real world.
These findings span many different subdisciplines, represented by the inner ring of circles, including entertainment education, behavioral economics, behavioral epidemiology, social marketing, etc. These subdisciplines are housed in a variety of fields, represented by the outer ring of circles, including medicine, marketing, psychology, etc.
The behavioral sciences have also developed a broad array of methodological tools that can be applied to rigorously evaluating the effectiveness of interventions designed to change behavior.

32
Diffusion
Everett Rogers. (2003). Diffusion of Innovation.Malcolm Gladwell. Bass Diffusion Model. Huggy Rao. Marc Granovetter. Bernardo Huberman.
Perc
ent o
f Tot
al
Popu
latio
n
Adopter Groups Through Time
Hub and Spoke
Characteristics of People Characteristics of Networks
Characteristics of Innovations• Simplicity - Is it easy to understand and use? • Observability - Are the results of using it visible?• Trialability - Can it be experimented with? • Compatibility - Is it consistent with existing values/needs?• Relative Advantage - Is it better than the prior thing?• Aesthetics & Identity Signaling…
There are three classes of variables that are relevant to how quickly an innovation diffuses: characteristics of people, of networks, and of the innovations themselves.
Regarding characteristics of people, There are standard marketing approaches – like targeting different segments of the population differently to improve the likelihood of getting people to change; however, there is little work done on this WRT targeting programs to people to improve energy efficiency, so this is an area of low-hanging fruit.
However, we can even take these techniques a step further… There is a large academic literature in applied mathematics, cognitive science, sociology, and marketing on how to get products, ideas, or cultural practices to diffuse. This diffusion curve showing increased rates of adoption with time. Different segments of the population adopt things at different points in the diffusion process, based on their personality and other traits.
After about 10% adoption, diffusion hits a take-off point, so a key is how to get it to that point. There seem to be several subgroups of individuals who play key roles around this time, so special attention can be paid to those individuals. [[The recent popular book Tipping Point talks about this.]]
How the innovations spread is also contingent upon the network structure. In these diagrams, each circle represents a person, and the lines represent communication channels between them. The one on the far left could represent Oprah Winfrey – last year she had a show in which she encouraged people to do 3 things to save the planet from Climate Change –one of them was to buy CFLs. Within a week, stores all over the country reported being sold out of CFLs.
One could imagine other network models to speed diffusion. For example, the Girl Scouts sell cookies to 40% of American households! They could sell energy-efficient items on a sheet in addition to one with cookies!
In addition to characteristics of people and network structures, there are characteristics of innovations themselves. This listwas developed based on at least hundreds of studies performed across various cultures and innovations. The characteristics include…
The quantitative literature also reports non-obvious insights that could be useful to facilitating diffusion – I haven’t looked much at this literature, but something I came across that was initially counterintuitive to me is that under real-world conditions, innovations tend to diffuse faster in less dense networks. It’s interesting to note that there are some people working at Harvard and UCLA studying such things in online communities like MySpace.

33
Additional Behavior Topics• Policy• Business
– Identifying and addressing barriers, within companies (getting silos to talk) and across actors in a product chain (e.g., contractors, developers, bankers)
– Diffusion of tech, within and across companies, and in the marketplace
– Improving the venture process (e.g., business models, etc.)• Modeling• Training programs (e.g., home retrofitters to put in EE
items)• In-depth reviews of what has been effective in non-
energy disciplines (e.g., public health)…• Etc.
Although I mostly covered the residential sector today, there are other domains in which behavior could be very useful.

34
Initiatives• Web Resources & Database• BECC Conference Nov. 16-19
• Book • Course• Faculty Research Group
– Design – Banny Banerjee– Interface Design – Scott Klemmer, Cliff Nass– Media – Martha Russell, Byron Reeves– Psychology – Greg Walton, Sam McClure, Hazel Markus– Public Health – Abby King, Tom Robinson– Buildings – John Haymaker, Greg Deierlein– Electrical Engineering – Philip Levis– Behavior & Energy – Carrie Armel
At Precourt, we’re working on several initiatives to build the Behavior, Energy, and Design community and to perform high-impact research in this area.
For example, we’ve developed a set of resources at the Precourt website. These include a database with over 800 abstracts and links to full articles on behavior, energy, and climate change; behavior measurement tools; conference presentations, etc.
We co-convene BECC, or the Behavior, Energy, and Climate Change Conference. This conference brings together professionals from government, industry, utilities, non-profit, and academia. Last year we expected about 150 people andinstead sold out a month early at 500. This year the conference will be held November 16-19th in Sacramento, and we have expanded our program to 2.5 days of presentations on the broad range of topics I described in my opening slide. Registration is currently open. I should note that the conference is co-convened with the California Institute for the Environment and the American Council for an Energy Efficient Economy.
I’m co-authoring a book on these issues, and I co-teach a course with Professor Tom Robinson on developing behavior change interventions.
Importantly, there is a group of over a dozen faculty mobilized around these issues. Their expertise spans a variety of disciplines, ranging from interface design, to media, public health, and building research.
I’d like to go into just a little more depth on the main project that this group of researchers has recently begun working on.---------------------------------Design – You just heard from Banny. He’s head of the Joint Program in Design, and has strong connections to IDEO, one of the world’s top design firms.Interface Design – Scott Klemmer develops tools for aiding in the design of interface hardware and software. Cliff Nass studies how psychological principles can improve interface design.Media – Martha Russell is the associate director of Media-X. Media-X is a collaborative between Stanford faculty and industry that develops and studies how interactive media can be used in entertainment, commerce, education, and other real world applications. Byron Reeves is a communications professor whose most recent work has applied principles of video games to motivate workers at IBM and other corporations.Psychology – Greg Walton is a social psychologist. Sam McClure is a cognitive neuroscientist who studies why people aren’t willing to invest now to save money later. The psychology department also claims Albert Bandura, who you’ll hear from later, and Mark Lepper. Their work has had profound and widespread influence on behavior change and educational programs.Public Health – Abby King and Tom Robinson are at the School of Medicine. They develop behavioral interventions to reduce cardiovascular disease, obesity, television watching, etc.Buildings – John Haymaker and Greg Deierlein are interested in building energy use.Electrical Engineering – Philip Levis has developed inexpensive, very low-energy wireless sensors that he is using for measuring energy use.Behavior and Energy – And I’m working on a variety of initiatives through PIEE related to the intersection of behavior and energy.

35
It’s a design failure, not a people failure.
-Craig Lawrence, IDEO
So to sum up the essence of this talk, if we want to realize the energy efficiency gains that are possible, it will take acknowledging that the problem is a design failure, not a people failure, and fixing this.

36
Additional Slides
So to sum up the essence of this talk, if we want to realize the energy efficiency gains that are possible, it will take acknowledging that the problem is a design failure, not a people failure, and fixing this.

37
Electricity FeedbackSMART METER DEPLOYMENT•Plans or existing installations throughout the U.S., Europe, and parts of Asia to install smart meters (NARUC w/DOE & EPA) •CA - All residential and commercial buildings are expected to have smart meters by 2012, but plans for HANs unclear.
FEEDBACK & CONTROL TECHNOLOGIES•Web interfaces that analyze and display data from smart meters•Wireless home area networks or disambiguation algorithms that provide appliance specific data •Chips embedded in appliances that allow for control of those appliances over power lines
Source: California Energy Commission
Google Map showing smart metering initiatives around the world, including details of technology used, dates, volumes etc. Key: red=electricity, green=gas, blue=water and triangle=trial or pilot where circle=project Created and updated regularly under the auspices of the SRSM smart metering project being run by the Energy Retail Association in the UK.
Electricity feedback is a very hot topic right now. Smart meters are being deployed throughout the U.S., Europe, and parts of Asia. At a national level, the DOE, EPA, and NARUC (the National Association of Regulatory Utility Commissioners) are discussing how this infrastructure might achieve upcoming energy efficiency goals. In CA,
all residential and commercial buildings are expected to have smart meters by 2012 – you can see in this graph that 32% of electricity consumption in CA occurs in the residential sector, and 37% occurs in the commercial sector. The utilities and CPUC do not have clear plans for HANs, which would enable consumers and commercial business owners to monitor and control their energy use – although they are very interested, this will mostly be left up to third party vendors.
So what are third party vendors working on? Technologies are emerging that are much more advanced than the familiar Kill-A-Watt and Energy Orb. There are dozens of companies working technologies, such as web interfaces that analyze and display data from smart meters, wireless home area networks or disambiguation algorithms that provide appliance specific data on electricity use, and chips embedded in appliances that allow for the control of those appliances over power lines.

38
ORGANIZATIONS - Lawrence Berkeley National Laboratories; Electric Power Research InstituteUTILITIES - PG&E, SCE, SDG&E
INDUSTRY - Google, IDEO, Accel Partners, Brattle Group, General Electric, Itron, Echelon, Silver Spring Technologies, Greenbox, Positive Energy, Widefield Technologies, Sustainable Spaces…
GOVERNMENT - EPA, CA PUC, CA Energy CommissionACADEMIA - Stanford, UC Berkeley, MIT, RPI
Develop tools for key stakeholders that take advantage of end-use data from energy measurement technologies, with a primary goal of maximizing energy reductions. PARTICIPANTS
OBJECTIVE
PROGRAM
Electricity Feedback Workshop
MEASUREMENT - Current smart meter measurement capabilities and inexpensive cutting-edge end-use measurement technologies.
COLLABORATIVE WORKING SESSION - Based on all of the insights generated about information needs, design and behavior modification techniques, and technological possibilities, we have a structured collaborative strategy session to generate innovative directions for large-scale reductions in energy consumption.
CONTROL, INTELLIGENCE, & BEHAVIOR - Various instantiations of Home Area Networks (HAN) are reviewed, from advanced active end-user control to fully automated home appliances.
BEHAVIOR - After a brief review of traditional approaches to changing energy-related behaviors, effective behavior change techniques are surveyed across several fields.
DESIGN - Industry leaders and university researchers survey interface hardware and software, as well as how design decisions influence behavior.
INFORMATION - What types of energy use information may be useful, for whom, and in what form.
It ends up that there are a lot of people working in this space, particularly in northern CA, but there has been little coordination between their efforts. Surprisingly, there has also been little work on how to deliver the information to the consumer, or determining other ways that the data might be used for maximizing energy reductions. For example higher resolution electricity use data can help building researchers better understand the discrepancy between modeled and actual building energy use. Higher resolution data also enables utility companies to use a more diverse intervention tool kit because they can more easily prove energy savings to the gov’t which results in money for them.
To address these issues, we put together a workshop and invited a wide range of participants across different academic departments and institutions, government agencies, utilities, energy organizations, and industry. The objective of the workshop was to begin developing tools for key stakeholders that take advantage of end-use data from energy measurement technologies, with the ultimate goals of maximizing energy reductions and shifting peak demand.
The program surveyed findings from design, behavior, and new media, as well as technological advances and plans for electricity measurement and control (like I mentioned on the last slide). We also covered work on electricity rate structures, business plans, and privacy issues. Some of the highlights included talks by the director of research at Google, and by the third most cited psychologist ever.The workshop culminated in a collaborative strategy session led by facilitators trained at IDEO, one of the leading design firms.