behavior genetic analyses in chickens and … siegel.pdf · behavior genetic analyses in chickens...
TRANSCRIPT

BEHAVIOR GENETIC ANALYSES IN CHICKENS AND QUAIL
Paul B. Siegel
Virginia Polytechnic Institute & State University
Blacksburg, VA 24061
Behavior-genetic analysis requries an interfacing of geneticsand behavior. This may be accomplished by studying the genetic
architecture of specific behaviors and by examining how behaviors
influence selection and thereby modify the gene pools of subse-
quent generations. The behaviors emphasized in our research in-clude those associated with reproduction, feeding and social
strife. This morning's presentation will include experiments
conducted to study mating and feeding behaviors.
MATING BEHAVIOR
Response to selection. Mating behavior of chickens and
quail is influenced by a complex of genetic and nongenetic fac-tors. We have conducted divergent selection and crossing exper-
iments with both species, using mating frequency of the male as
the primary trait. The testing procedure was simple in that anadult male was released singly into a flock of females and the
frequency of matings recorded. The selected trait was the numberof matings completed in eight 10-minute trials for the chickens
and eight 8-minute trials for the quail.
Random mating lines of chickens and quail served as the
base populations for the selected lines. Samples from-these
random mating populations were hatched each generation of se-
lection and grown as contemporaries with chicks from the selec-ted lines. Since there was no evidence in the random mating
lines for changes in the selected trait over generations, datafor the selected lines are presented as control adjustedvalues.
Also, there was replication for the lines of quail.
The response to divergent selection for high and low mating
frequency of chickens through Ii generations of selection and
the means of progeny from line crosses of SI0 generation parents
are shown in Slide i. Although the response to selection was
small in both lines through the S2 generation, considerable
change was noted thereafter. Overall the response for high
mating frequency was approximately three times greater than thatfor low mating frequency. Crosses were intermediate to the par-
ent lines and reciprocal crosses did not differ from each other.
When responses and selection differentials were expressedin standard deviation units (Slide 2) the heritability for low
mating frequency was twice that for high mating frequency. In
contrast, because of the zero limit for low mating frequency,
selection pressure was considerably greater in the high thanin the low line. When realized heritabilities were calculated
by periods (Slide 3), there was little evidence to suggest that
additive genetic variation was being depleted in either line.
-i-

14
12 o C
U _ • • .e Czi
I C/z 6_ .
4
e
2 *
i0 I " I i I i I I I I 1 I
O. 2 4 6 8 t0GENERATIONS
Slide i. Responses to selection for high and low mating fre-quency of chickens
1.0 ' 6_
0
• " 0 O
g . ,' x_ o-/."X._1_o • " ^
-I.0 ' " * " .
I --_ I _ - I ° , I' J I : i " , ; , f'I 2 3 4 5 6 7 8
CUMULATIVE SELECTION .OIFE (CNCM) .....
Slide 2. Responses and selection differentials in standard
deviations for high and low mating frequency in chickens
Slide 3. Realized heritabilities for high and low mating fre-quency of chickens
Generation High Low
P0 to S6 .14 .30
S6 to SII .20 .36
P0 to SII .16 .32
-2-

The situation that existed when selection was made for
high and low mating frequency of male Japanese quail is shown
in Slides 4 and 5. There was essentially no response in the
high direction during the early generations of selection,
whereas in the later generations, the heritability increased
to .22 in one replicate and to .12 in the other. In the low
lines, the heritabilities of mating frequency were of a mod-
erate magnitude during early generations, and then appeared
to decrease in Replicate I and increase in Replicate II.
32
HI
24 A / \.
=E20 _^__..j// \H2U •Z
U 16
4
0 'l I I I t J
Po Sz s4 s+ s8 % s_2GENERATIONS
Slide 4. Responses to selection for high and low mating fre-quency in Japanese quail
Slide 5. Realized heritabilities for high and low mating in
Japanese quail
Hish Line Low LineGeneration 11 II i I II
P0 to S6 .03 -.08 .28 .17
S7 to S12 .22 .12 .13 .30
P0 to S12 .19 .05 .25 .19
iReplicate
The error structure of the realized heritabilities was ex-
amined according to the model of Hill. This model is based on
several assumptions, the primary one being that genetic and en-vironmental variances and covariances do not change during the
course of selection. This should be true when an experiment is
of short duration, inbreeding is low, and the trait under selec-
tion is determined by many genes'with small effects. Although
-3-
not all of these conditions were fulfilled in this experiment,
it is believed that the last twoassumptions are valid. Esti-
mates of the phenotypic variance (22) were obtained by poolingall estimates on awithin-generation-line basis. The values of
22 , along with estimated values of heritability obtained fromregression analysis, were then used to derive estimated values
of drift and error variance (o2d + _2e) for each Of the selectedlines.
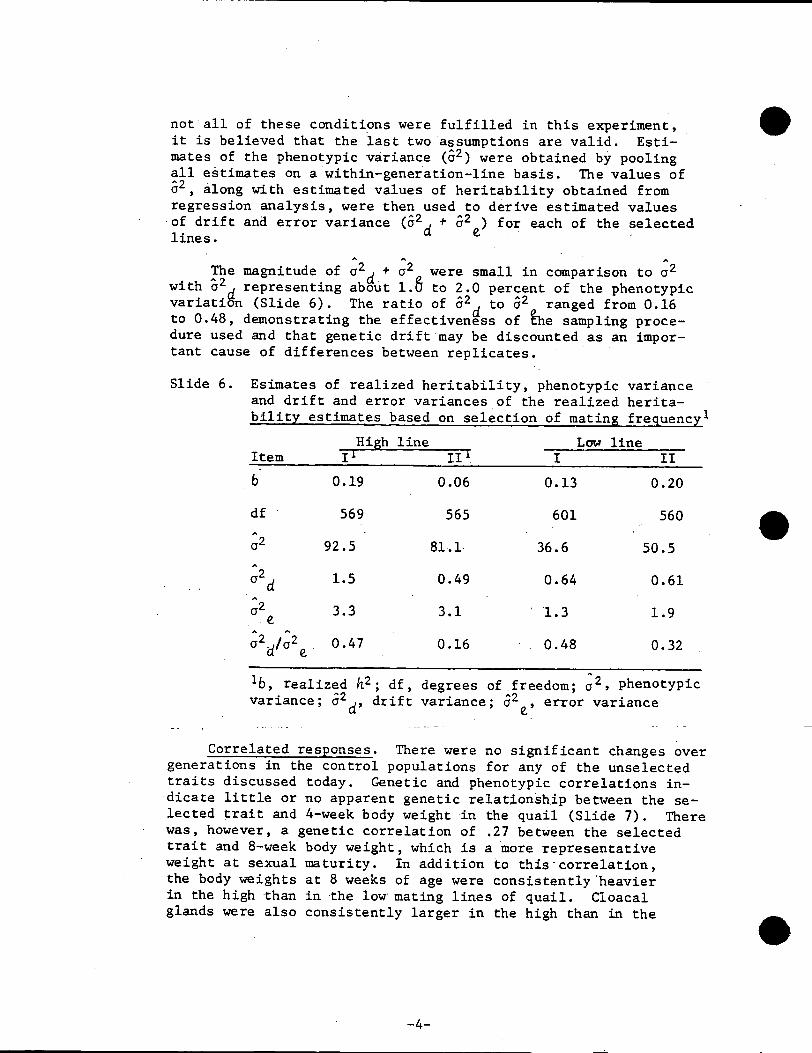
The magnitude of A_2d + o2 were small in comparison towith o2_ representing about 1.6 to 2.0 percent of the phenotypic
variation (Slide 6). The ratio of _2d to 02^ ranged from 0.16to 0.48, demonstrating the effectiveness of _he sampling proce-
dure used and that genetic drift may be discounted as an impor-
tant cause of differences between replicates.
Slide 6. Esimates of realized heritability, phenotypic varianceand drift and error variances of the realized herita-
bility estimates based on selection of matin 8 frequency I
High line Low lineItem Ii II i_ I II
b 0.19 0.06 0.13 0.20
df 569 565 601 560
_2 92.5 81.1 36.6 50.5^
o2d 1.5 0.49 0.64 0.61
o2 3.3 3.1 :1.3 1.9e^ ^
o2d/o2 e 0.47 0.16 0.48 0.32
^
Ib, realized h2; df, degrees of freedom; o2 , phenotypic
variance; _2d, drift variance; _2e, error variance
Correlated responses. There were no significant changes over
generations in the control populations for any of the unselected
traits discussed today. Genetic and phenotypic correlations in-
dicate little or no apparent genetic relationship between the se-
lected trait and 4-week body weight in the quail (Slide 7). Therewas, however, a genetic correlation of .27 between the selected
trait and 8-week body weight, which is a more representatiVe
weight at sexual maturity. In addition to this-correlation,
the body weights at 8 weeks of age were consistently heavier
in the high than in the low mating lines of quail. Cioacal
glands were also consistently larger in the high than in the
-4-
low lines with values for the control being intermediate. This
and the genetic correlation of .28 support the common relation-
ship between cloacal gland and mating activity in quail, which
was first described by Sachs in 1967. The positive correlations
between relative aggressiveness and mating frequency may reflect
a situation that compensates for the effect of sexual dimorphism
in a species where the body size of females is larger than that
of males. Physical aggressiveness may play a vital part in the
completion of a mating act which does not involve an elaborate
courtship.
Slide 7. Phenotypic and genetic correlations of unselected
traits with mating frequency in quail_ $I? seneration
Trait r rPP $$
4 wk wt. .15 .00
8 wk wt. .08 .27
Cloacal gland size .33 .28
Relative aggressiveness .36 .36
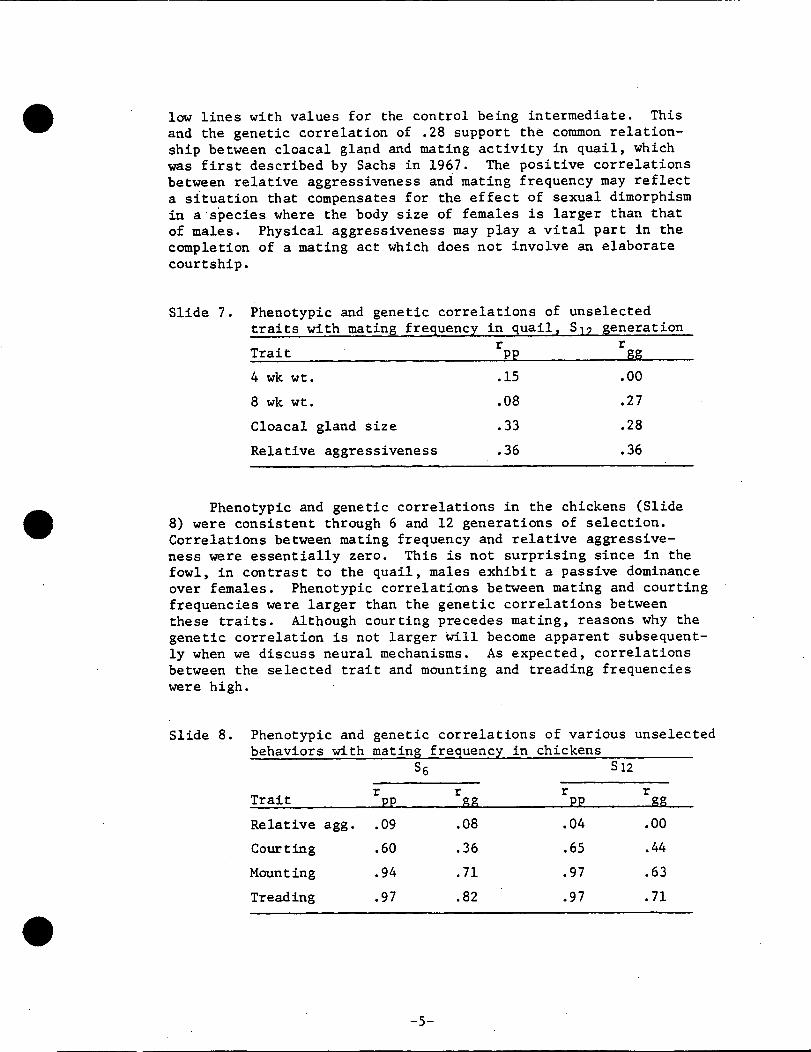
Phenotypic and genetic correlations in the chickens (Slide
8) were consistent through 6 and 12 generations of selection.
Correlations between mating frequency and relative aggressive-
ness were essentially zero. This is not surprising since in the
fowl, in contrast to the quail, males exhibit a passive dominance
over females. Phenotypic correlations between mating and courting
frequencies were larger than the genetic correlations between
these traits. Although courting precedes mating, reasons why the
genetic correlation is not larger will become apparent subsequent-
ly when we discuss neural mechanisms. As expected, correlations
between the selected trait and mounting and treading frequencies
were high.
Slide 8. Phenotypic and genetic correlations of various unselected
behaviors with mating frequency in chickens
S6 S12
r r r rTrait pR _ pp gg
Relative agg. .09 .08 .04 .00
Courting .60 .36 .65 .44
Mounting .94 .71 .97 .63
Treading .97 .82 .97 .71
-5-
Physiological mechanisms. Several items should be borne
in mind when discussing the genetics and physiology of matingbehaviors. The neural basis for mating behavior of cockerels
_is _resent early in life, and our experiments provide no evi-
dence that selection has altered the nature of the mating se-quence. Rather, it appears that the changes observed involve
the thresholds and frequencies of the mating act.
Intramuscular injections of testosterone do not stimulate
the mating frequency of gonadally intact adult chickens or
Japanese quail. When capons are given intramuscular injectionsof testosterone, their mating frequency returns to levels that
approximate those of non-caponized males from their respective
lines. We have had no success, regardless of dosage, in achiev-
ing, via androgen therapy, levels of mating in capons that ex-
ceed those of intact males of the same genetic background.
Meyer and Salzen at the University of Waterloo and Glickand his students at Mississippi State showed that lesions in
the anterior hypothalamus abolishes the ma:ting response of male
chickens. Gardner and Fisher at Pittsburg, Barfield at Rutgers.....and Phillips at Minnesota demonstrated that implants of testos-
terone in this area stimulates mating in cockerels and capons.
Phillips and Barfield and Richard Balander in our laboratory,
showed that capons implanted with testosterone in the hypothal-
amus would not exhibit mating behavior unless placed withla
_emale immobilized into a Crouching position. A capon so im-planted mating an immobilized hen is shown in Slide 9_ The
-: reason that the hen must be immobilized is because the implanted
' capon does not exhibit aggressiveness and courting. This con-firms that mating and aggressive centers are located in differ-
ent areas of the brain, and supports the hypothesis that court-. ship commences as an aggressive behavior which then shifts to
a sexual act. It also explains why the genetic correlation be-
tween courtship and mating frequencies would be _f a lower mag-
nitude than that of mating with mounting and treading.
o_ Since the neural basis for mating behavior is present early
in life and androgen therapy does not stimulate mating activityin adult intact males, it is evident that proper internal and
external environments are essential for mating to occur. Actually,we see from the capon in Slide 9 that only minute amounts of tes-tosterone (0.5 mg) are needed to stimulate the relevant neural
receptor sites in the hypothalamus.
Fred Benoff, while at Virginia Tech, measured _testosterone
uptake in hypothalamic tissue of cockerels in the high, low and
control mating lines of chickens. The uptake pattern was similar
-6-

for the three lines with the composite shown in Slide I0. Uptake
was rapid with the concentration of testosterone increasing up to60 minutes postinjection and then declining. Benoff's experimentshows that the differences observed among these lines in mating
frequency do not stem from an impairment of the hypothalamus toconcentrate testosterone.
2oo[153-
67 - HYPOTHALAMIC dpm (x I02)
0 t t I !30 60 120 240
TIME OF SACRIFICE (MIN.)
Slide i0. Means and standard errors of uptake of radioactive
testosterone in hypothalamic tissue over time
If neither endogenous androgen titers nor the ability of the
hypothalamus to concentrate androgens are responsible for thedifferences among these lines -- what then is happening? Unfor-
tunately, we do not yet have the answer. There are, however,leads which need to be explored. Elizabeth Adkins at Cornell
has shown that the aromatization of androgens is required for the
expression of male sexual behavior in Japanese quail. RichardBalander in our lab has obtained preliminary evidence that se-
lection for low mating frequency has affected the capacity for
the quail to aromatize androgens. Experiments to pursue this
point are currently in progress.
-7-

Aspects of husbandry. If the potential for males to mateis present at hatching, can husbandry enhance or mask such be-
havior subsequently in life when androgen titers are sufficientto achieve threshold levels for the neural receptors? Another
question is how do populations with different genetic backgrounds
respond in different environmental situations? In an attempt to
address these questions, we have conducted several experiments.
One was to evaluate the effects of prior social experiences on
the sexual behavior of the mating lines of chickens. Males fromeach of the three lines were raised in unisexual and in hetero-
sexual flocks and their mating behavior measured as adults. The
data shown in Slide ii show that the effect of the prior social
environment was not the same in all lines. The implications of
this to breeder husbandry is obvious.
Slide ii. Number of maters and nonmaters by lines and social
environments, S12
Social
environment Line Maters Nonmaters % Maters
Unisexual HM 22 0 I00
AC 24 ii 69
LM 12 16 43
...... Sexual .HM 19 i 93
AC 32 3 91
LM 15 8 65
One of our students, Cathy Blohowiak, was interested in the
effect of sexual dimorphism in body size on mating frequency in
chickens. Her experiment involved mating trials among dwarf and
nondwarf males and females from lines widely divergent in body
weight. As can be seen from the data in Slide 12, Cathy had ma-
ting combinations where sires and dams were 4 to 5 times larger
than their respective mates.
Slide 12. Mean body weights of males and females at :232 days of ase
•Line Genotype Males Females
High Normal 4.4 3.9
Dwarf 2.4 2.i
Low Normal 2.0 i.8
Dwarf .9 .8
-8-

It can be seen in Slide 13 that there were significant diff-
erences among male genotypes with males from the high weight line
courting less than those from the low weight line. Within the
low weight line, the dwarf males courted less than their nondwarf
counterparts. The number of courts received by female gen_otypesdid not differ from each other.
Slide 13. Mean no. courts in two 10-minute observation periods
Females
Males H line L line
Line Genotype Normal Dwarf Normal Dwarf
High Normal 8 ii 7 4
Dwarf 8 7 7 i0
Low Normal 32 28 24 22
Dwarf 21 i0 13 18
The differences among male and among female populations and
the male x female interaction for frequency of matings were sig-
nificant (Slide 14). Normal males from the high weight line
mated significantly less than males from the other genotypes, an
effect which may be attributed to libido. CompariSons among fe-
male populations show that normal hens from the high line also
were involved in fewer matings than those from the other popula-
tions. Of particular interest was the male x female interaction.
This was caused by the high frequency of mating between dwarf
males and dwarf females from the low weight line and the near
absence of matings involving dwarf males from the low line with
normal and dwarf hens from the high line. These effects may be
attributable to differences in body size where the males were
considerably smaller than the females. They also show that the
size differential was not of a sufficient magnitude to be detri-
mental in the production of broiler progeny from matings of nor-mal broiler sires to dwarf broiler dams. This is because the
typical passive dominance of cocks over hens, when males are lar-
ger than females, enhances the probability of mating in chickens.
Slide 14. Mean cumulative number of completed matings in two
10-minute observation periods by line and genotype
Females
Males H line L line
Line Genotype Normal Dwarf Normal Dwarf
High Normal 0 .3 .4 .2
Dwarf .2 .6 .9 1.2
Low Normal 2.3 3.3 3.0 3.4
Dwarf 0 .i i.1 3.9
-9-

"" FEEDING BEHAVIOR
I would now like to shift to a different topic -- that of
feeding behavior. The next two speakers on the program, Dr.
Marks and Dr. Washburn, will discuss feed intake:and _feed
efficiency. Thus, my comments will be restricted to a spe-
cific area that we are studying at Virginia Tech, namely
differences and similarities in feeding behavior among pop-ulations of chickens.
We have dwarf and nondwarf chickens from lines diver-
gently selected for eight-week body weight. These line by
dwarf-genotype combinations were known to differ in growth,
feed consumption and feed efficiency. We reasoned that if
the regulation of feed intake was manifested as an overt be-
havioral adaptation, then genetic variation in specific appe-
tite control mechanisms would induce phenotypic differences
in feeding behavior. One of our students, Guy Barbato, has
been obtaining data to test this reasoning using males of
four, genotypes (i.e., high weight normals, high weight dwarfs,
low weight normals and low weight dwarfs).
.... Slide 15 shows an experimental battery constructed to
allow continuous monitoring of feed consumption and feeding
behavior. A feeder is suspended in front of the cage from a
...._ photoelectric force transducer. Each transducer is connectedto a recorder using a transducer coupler and channel amplifler.
This arrangement enables weight changes to be transformed into
volt,age changes which are recorded (Slide 16). Thus, we can
measure both feeding activity and feed consumption. Feeding
activity is defined as any measurable disruption of the feeder
and a meal is defined as any period of feeding activity asso-ciated with feed intake, regardless of the length of the bout.
The data presented this morning are for males 50 and 70 days
of age maintained under continuous lighting and with feed andwater provided ad _bit_.
- Feed _take at 50 and 70 days of age (Slide 17) paralleledbody weights. Males from the high weight line ate significantly
more than those from the low line and normals ate significantly .
more than dwarfs. The line x genotype interaction was not sig-nificant.
The mean number of meals eaten per 24-hour period are shown
in Slide 18. As with feed consumed, the line x genotype inter-
action was not significant. Chicks from the high weight line
ate significantly more meals than those from the low weight line
and normals ate significantly more meals than the dwarfs. Also,
-i0-

the number of meals appears to have declined with age for all
groups.
Slide 17. Mean feed intake (g_)at 50 and 70 days of age
50 days 70 days
Line
High i02 b i00 b
Low 45a 50 a
Normal 75b 80b •
Dwarf 66a 60a
Slide 18. Mean number of meals per day at 50 and 70 days
of age
50 days 70 days
Line
High 17 b lob
Low 9a 5a
Genoty_e
Normal 15 b 8b
Dwarf ii a 6a
In contrast to meal number, the amount of feed eaten per
meal (Slide 19) did not differ among populations. This suggeststhat meal number and not meal size is the principal factor con-
tributing to differences among populations in feed consumption.This conclusion was not consistent with that of the Edinburgh
group who noted an interplay between meal number and meal size
in determining differences in the feed consumption of heavy and
light strains of chickens.
Differences between lines and genotypes for the mean length
of feeding bouts (Slide 20) were significant at both ages. It
may be inferred from these data that once a meal is initiated,
the high weight line and normal males spent longer times con-
suming the same amount of feed as dwarfs and low weight line
-ii-

•chickens. One, however, should also distinguish _between appe-
titive and consummatory behaviors.
Slide 19. /Mean fee_ intake per meal (g) at 50 and 70 days
of age
50 days 70 days
Line
High 6a i0a
Low 5a i0a
Genotype
Normal 5a i0a
Dwarf •• "6a • i0a
..... Slide 20. Mean length of each feeding bout (min) at 50 and
70 days of agez
_ _ 50 days 70 days
Line
High 17b 15b
Low i0a 7a
Genotype
Normal 15b 14b
Dwarf Iia 8a
_ _ It may be seen in Slide 21 that males from the low weight
_' line spent significantiy more time engaged in nonco_su_atory_ feeding activity than those from the high line, and that normal
males spent significantly more time in such activities than
dwarfs. These results were consistent at both ages. It is
interesting to speculate on the effect of "playing" on the effi-
ciency of feed utilization. Our data appear to support, in
part, the reasoning by the Edinburgh and Guelph groups, who pro-
posed that the increased activity about the feeding areas by egg
strains increased relative energy expenditures and decreased
their overall efficiency of feed utilization in comparison tomeat strains of Chickens.
-12-
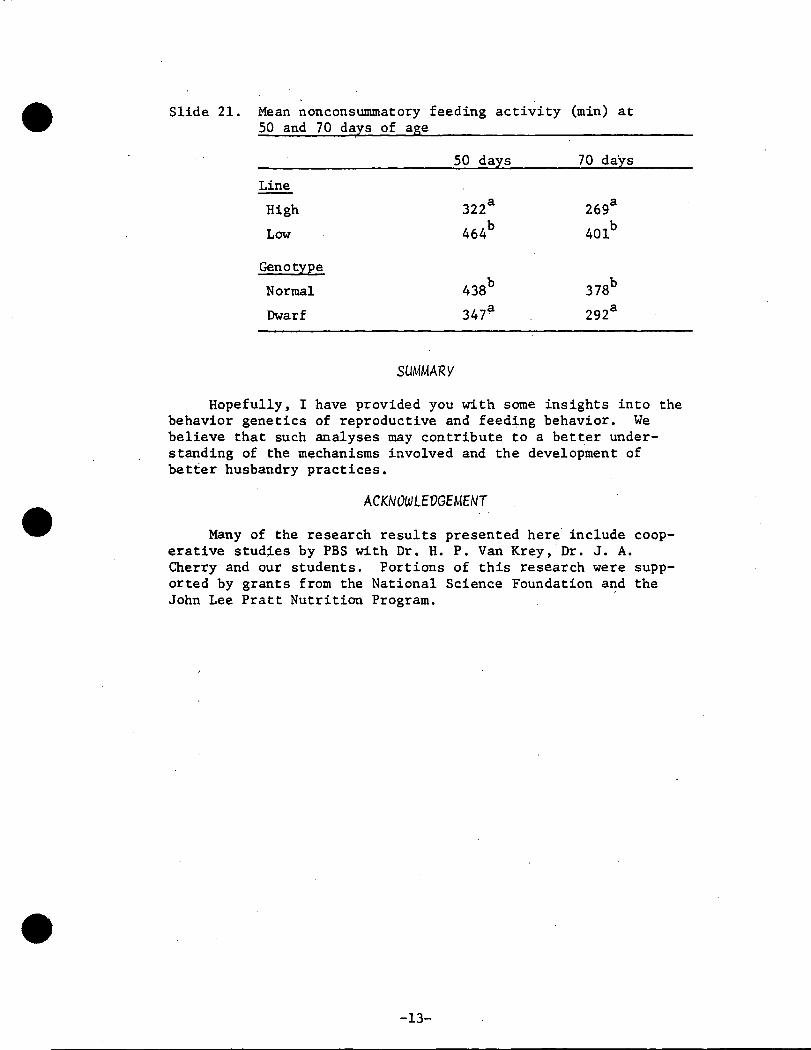
Slide 21. Mean nonconsummatory feeding activity (min) at
50 and 70 days of age
50 days 70 days
Line
High 322 a 269 a
Low 464 b 401 b
Normal 438 b 378 b
Dwarf 347 a 292 a
SUMMARY
Hopefully, I have provided you with some insights into the
behavior genetics of reproductive and feeding behavior. We
believe that such analyses may contribute to a better under-
standing of the mechanisms involved and the development of
better husbandry practices.
ACKNOWLEDGEMENT
Many of the research results presented here include coop-
erative studies by PBS with Dr. H. P. Van Krey, Dr. J. A.
Cherry and our students. Portions of this research were supp-
orted by grants from the National Science Foundation and the
John Lee Pratt Nutrition Program.
-13-

P. B. Siegel - "Behavior-Genetic Analyses in Chicken and Quail"
Jim Arthur With reproduction of birds by means of AI generation
after generation, is there a risk of a genetic drifting away from goodmating behavior? ............... -
P. B. Siegel -The changes we observed were in the frequency of
mating, not the mating sequence per se. The asymmetry of responseseen in the experiment wlth chickens has been attributed to unequal
initial gene frequencies in a polygenetic situation withlow to mod-erate heritability. I fail to see a problem from drift in the short-
run (i0 to 12 generations).
Hans Ab_lanalp- In quail you show a positive (0.28) correlation
of mating frequency and body weight. Our observations with size
selected quail were just the opposite. Large males rarely mated.
Have you tested large quail?
P. B. Siegel - Pieces of information were obtained for one of
the heavy !ines developed by Henry Marks, however, no analyses were
madeand i am reluctant to draw Conc!_sidns from the meager data.The adult weight Of the male quail discussed this morning rarely
exceeded 120 g, Which is Certainly not large. The observation foryour size selected quail is not surprising since increased body
size in chickens reduces libido. We saw this in the frequency of
mating of dwarf and normal_chlckens (see Slide 14).
B0bSmythl-Doyouthinkitispossiblelformalestobetooaggressive, to the point where;they_bring about avoidance behavior
: in some females? _j:
P. B. Siegel - Definitely, -- in our hlghmatlng lines the females
flee from the males. Frequently the matings of such males may beconsidered as rapes.
Lee Ehrman - A statement, Paul's asymmetric response to selection
for mating speed (or cumulative matings) has been recorded for a varietyof organisms and always in the same direction; i.e., response for selec-
tion for LOWERED instanc@ of mating are more emphatic than those to
selection for enhanced matings. Natural or artificial selection has
fixed mating speeds at the fastest physiologically reasonable rates.
Not much or no variability exists in natural populations for greater
speed. This is especially so in thoseanlmals; e.g., insects, where
many adult males exist ephemerally, just to mate. They even cease eating.
Charles Darwin, not informed about Mendel'swork nor about mutation, wrote
that men (and males of many species) are bigger than women because women
like them that way. This is sexual selection. In the human case, he wasprobably right.
P. B. Siegel - Being somewhat on the tall side, I naturally agreewith Darwin.
-14-
Ed Buss - i. Have you attempted to produce F2's from the diver-
gent lines to determine the association of size and behavioral traitsamong full sibs studied? Is it possible that some associatlonsoccurred
fortuitously in developing the lines? 2. Have you determined water
consumption after moving birds?
P. B. Siegel - I. Yours is a very cogent comment. FI crosses
have been made in both the chicken and quail. F2 and backcross data
are currently being obtained for the quail. 2. We have some lines
that go off feed and water when moved and other lines that adapt quickly.
We can force feed, but at this point I am reluctant to describe what
happens. Water consumption is measured by inverted soda bottles andintake is variable when the birds are first moved.
G. E. Dickerson - Why so few matings from H x H , H x L, L x L,N x N relative to dw x dw?
P. B. Siegel - It is difficult to provide a definitive explanation
for the male x female interaction. My guess is that the low libido of
the H males is evident regardless of the who they are mated to, while
the L males do quite well. The mating expression of the nondwarf geno-
type is dependent on the background genome, while the dwarf males are
considerably more successful when they are larger than their potentialmates.
Dean Jones - What would you expect would happen if you selected
for increased female receptivity in mating?
P. B. Siegel - We don't have any data on this topic. Galpern
and Dukhno from the USSR, reported at the World Poultry Congress in
New Orleans that they observed a positive correlated response in fecun-
dity when selection was for increased mating of both males and females.
Alan Emsley - Were the different genotypes brooded and reared in-termixed? Were males and females of the same genotype brooded together?
P. B. Siegel - We have done it both ways. For those used in theselection experiment, the lines are not intermingled and the sexes are
separated at 4 and 8 weeks of age in the quail and chickens, respectively.
Walt Collins - Do you have a guess as to the number of locl perti-
nent to mating frequency in your mating frequency lines?
P. B. S_- No.
-15-