behaviors contributing to native american business success
TRANSCRIPT

Walden UniversityScholarWorks
Walden Dissertations and Doctoral Studies Walden Dissertations and Doctoral StudiesCollection
2015
Behaviors Contributing to Native AmericanBusiness SuccessStacey BolinWalden University
Follow this and additional works at: https://scholarworks.waldenu.edu/dissertations
Part of the Entrepreneurial and Small Business Operations Commons
This Dissertation is brought to you for free and open access by the Walden Dissertations and Doctoral Studies Collection at ScholarWorks. It has beenaccepted for inclusion in Walden Dissertations and Doctoral Studies by an authorized administrator of ScholarWorks. For more information, pleasecontact [email protected].

Walden University
College of Management and Technology
This is to certify that the doctoral study by
Stacey Bolin
has been found to be complete and satisfactory in all respects,
and that any and all revisions required by
the review committee have been made.
Review Committee
Dr. Yvette Ghormley, Committee Chairperson, Doctor of Business Administration
Faculty
Dr. Cheryl Lentz, Committee Member, Doctor of Business Administration Faculty
Dr. Steven Munkeby, University Reviewer, Doctor of Business Administration Faculty
Chief Academic Officer
Eric Riedel, Ph.D.
Walden University
2015
Abstract
Behaviors Contributing to Native American Business Success
by
Stacey Bolin
MBA, University of Oklahoma, 2004
BS, East Central University, 2000
BS, East Central University, 2000
Doctoral Study Submitted in Partial Fulfillment
of the Requirements for the Degree of
Doctor of Business Administration
Walden University
November 2015

Abstract
Native Americans start fewer businesses than do other U.S. populations, and the receipts
and employment of those businesses are 70% lower than the U.S. average. However,
little knowledge exists concerning Native American (NA) business success. The purpose
of this quantitative study was to examine the likelihood that attitudes toward
entrepreneurship, subjective norms, and perceived behavioral control predict business
success amongst NA business owners. Understanding the factors that contribute to NA
business success is imperative to developing best practices for business owners and
business support agencies. The theory of planned behavior served as the theoretical
framework for this study. Of the 550 invited NA business owners registered within a
single tribe in the South Central United States, 79 participated in this study. A binary
logistic regression analysis produced conflicting results: significant goodness-of-fit yet
insignificant individual predictors. Information obtained from this study could assist NA
and other underdeveloped business populations with understanding factors influencing
entrepreneurial endeavors; however, readers must interpret findings with caution because
of conflicting logistic regression results. NA business formation and success could
enhance economic prosperity and decrease unemployment in NA communities.

Behaviors Contributing to Native American Business Success
by
Stacey Bolin
MBA, University of Oklahoma, 2004
BS, East Central University, 2000
BS, East Central University, 2000
Doctoral Study Submitted in Partial Fulfillment
of the Requirements for the Degree of
Doctor of Business Administration
Walden University
November 2015

Dedication
I dedicate this dissertation to my husband, Brandon Bolin, my children, Ava and
Jessica, and the rest of my family. Without their support and encouragement, I could not
have achieved this degree.

Acknowledgments
I began this journey with the full support of my family and colleagues. I
acknowledge the newfound support of my new colleagues and faculty at Walden
University. My committee chairperson, Dr. Yvette Ghormley, encouraged and guided me
even before she became my chairperson. Not only was Dr. Ghormley a significant
proponent of my own personal growth as a scholar, but she facilitated a fantastic working
relationship among those in our doctoral study courses. This arena allowed for sharing of
ideas and encouragement in a way to help us all improve. I would also like to thank two
of my Walden colleagues who have helped me continually improve: Phat Pham and Anne
Williams. Additionally, I would like to express my sincere appreciation for the support of
Dr. Lentz, Dr. Taylor, Dr. Goes, Dr. Turner, and Dr. Munkeby.
i
Table of Contents
List of Tables ...........................................................................................................v
List of Figures ........................................................................................................ vi
Section 1: Foundation of the Study ..........................................................................1
Background of the Problem ...............................................................................1
Problem Statement .............................................................................................3
Purpose Statement ..............................................................................................3
Nature of the Study ............................................................................................4
Research Question .............................................................................................5
Hypotheses .........................................................................................................6
Survey Questions .........................................................................................6
Theoretical Framework ......................................................................................6
Operational Definitions ......................................................................................7
Assumptions, Limitations, and Delimitations ....................................................9
Assumptions .................................................................................................9
Limitations ...................................................................................................9
Delimitations ..............................................................................................10
Significance of the Study .................................................................................10
Contribution to Business Practice ..............................................................11
Implications for Social Change ..................................................................12
A Review of the Professional and Academic Literature ..................................13
Entrepreneurship ........................................................................................15

ii
Small Business Success .............................................................................16
Contributions of Small Business Entrepreneurship to the Economy .........18
Entrepreneurs .............................................................................................21
Entrepreneurial Intention ...........................................................................28
Theories of Entrepreneurial Intention ........................................................28
Theory of Planned Behavior ......................................................................30
Sources of Entrepreneurial and Small Business Assistance ......................36
Entrepreneurship Among NAs ...................................................................42
Examining NA Entrepreneurship Using the EIQ.......................................45
Transition and Summary ..................................................................................48
Section 2: The Project ............................................................................................50
Purpose Statement ............................................................................................50
Role of the Researcher .....................................................................................51
Participants .......................................................................................................53
Research Method .............................................................................................55
Research Design...............................................................................................56
Population and Sampling .................................................................................57
Ethical Research...............................................................................................59
Instrumentation ................................................................................................62
Data Collection Technique ..............................................................................65
Data Analysis ...................................................................................................67
Study Validity ..................................................................................................70

iii
Reliability ...................................................................................................71
Validity ......................................................................................................71
Transition and Summary ..................................................................................72
Section 3: Application to Professional Practice and Implications for Change ......74
Overview of Study ...........................................................................................74
Presentation of the Findings.............................................................................75
Statistical Assumptions Tests ....................................................................76
Descriptive Statistics ..................................................................................77
Hypothesis Tests ........................................................................................81
Relating Findings to the TPB .....................................................................86
Relating Findings to the Literature ............................................................87
Applications to Professional Practice ..............................................................90
Implications for Social Change ........................................................................91
Recommendations for Action ..........................................................................93
Recommendations for Further Study ...............................................................95
Reflections .......................................................................................................97
Summary and Study Conclusions ....................................................................97
References ..............................................................................................................99
Appendix A: Survey Instrument ..........................................................................135
Appendix B: Permission to use Entrepreneurial Intention Questionnaire ...........139
Appendix C: Email Message Sent to Participants ...............................................140
Appendix D: Letter Sent to Participants without Email Addresses .....................141

iv
Appendix E: Reminder Message Sent to Participants .........................................142
Appendix F: Reminder Phone Call Script ...........................................................143
Appendix G: Protecting Human Research Participants Certificate of
Completion ...............................................................................................144
Appendix H: Permission Letter to use Business Registry Data for Research
Purposes ...................................................................................................145
Appendix I: Informed Consent Document for Online Surveys ...........................146
Appendix J: Informed Consent Document for Mailed Surveys...........................148
Appendix K: IRB Approval Letter ......................................................................150

v
List of Tables
Table 1. Synopsis of Sources in the Literature Review ................................................... 15
Table 2. Descriptive Statistics for Population Description Variables.............................. 78
Table 3. Participant Gender Frequency and Percentages ................................................ 79
Table 4. Reliability Coefficients (α) for Independent Variables .................................... 80
Table 5. Descriptive Statistics for Independent Variables .............................................. 81
Table 6. Dependent Variable Frequency and Percentages............................................... 81
Table 7. Logistic Regression Predicting Business Success ............................................ 83
Table 8. Logistic Regression Analysis Summary ........................................................... 85

vi
List of Figures
Figure 1. Theory of planned behavior elements with added entrepreneurial cues and
dependent variable .............................................................................................................31
Figure 2. Histogram showing ages of study participants ...................................................78
Figure 3. Histogram showing number of years in business for study participants ............79

1
Section 1: Foundation of the Study
Despite widespread agreement on the importance of entrepreneurs who start new
businesses, Native Americans (NA) start new businesses less often and create smaller
businesses than other U.S. citizens (Franklin, Morris, & Webb, 2013; Minority Business
Development Agency [MBDA], 2014). The motivational factors that inspire persons to
engage in venture creation include attitudes toward entrepreneurship, perceived control
over success, and the value culture or society places on entrepreneurship (Schlaegel, He,
& Engle, 2013). Despite the smaller number of NAs who start businesses as compared to
other U.S. citizens, researchers in the field have yet to conduct research to explain why
(Franklin et al., 2013). In this study, I examined the relationship between elements of NA
entrepreneurial intention and NA small business success.
Background of the Problem
Local, regional, and national economies need new entrepreneurial endeavors to
succeed (Owoseni & Adeyeye, 2012). Entrepreneurs stimulate economies by starting and
growing businesses that create jobs and by providing innovative products and services
(Liñán, Rodríguez-Cohard, & Rueda-Cantuche, 2011). Moreover, entrepreneurship
provides a viable option for millions of women, minorities, and immigrants to succeed in
business (Elmuti, Khoury, & Omran, 2012).
Because of the social and economic contribution of entrepreneurship to
economies, researchers increasingly focus on the topic. Elmuti et al. (2012) and Petridou
and Sarri (2011) found that successful entrepreneurs rank training as the most significant
element in the success of business ventures. Moreover, Jusoh, Ziyae, Asimiran, and Kadir

2
(2011) conducted a statistical analysis of survey results to identify skills needed for
entrepreneurship success and found that entrepreneurs desire more training in business
finance and innovation. Boyles (2012); Do Paço, Ferreira, Raposo, Rodrigues, and Dinis
(2011); Sardeshmukh and Smith-Nelson (2011); and Vance, Groves, Gale, and Hess
(2012) cited the positive correlation between the motivations to start a business and
entrepreneurial education. In addition, Omar (2011) explored entrepreneurs from a
minority ethnicity to uncover the push and pull factors that influenced the participants’
decisions to pursue business ownership. The aforementioned researchers addressed
entrepreneurship among different countries and cultural groups. However, a gap in
business practice remains because of the lack of research focusing on NA venture
creation and business success (Franklin et al., 2013).
NAs actively engaged in the trade of natural resources, crops, and goods before
Euro-American contact and until removal from their homelands (Miller, 2012). Miller
(2012) explained that NAs’ motivations to pursue entrepreneurial endeavors changed
during the removal process. Mathers (2012) and Stewart and Pepper (2011) supported
Miller’s assertions. Though NAs compose 1.5% of the U.S. population, NAs own only
0.9% of businesses within the United States (MBDA, 2014). The MBDA (2014) listed
236,691 NA-owned firms within the United States. Broader disparity exists with revenue
and employment comparisons. Revenue and employment generated by NA businesses
accounted for 0.3% of total U.S. business revenue and employment (MBDA, 2014). The
U.S. Small Business Administration (SBA) and the U.S. Executive Office called attention
to business creation among NAs (U.S. Small Business Administration, 2014b); however,

3
researchers in the field failed to examine the documented discrepancy between NA
venture creation and business success.
Problem Statement
Fifty percent of new small businesses failed to survive beyond 4 years (Rauch &
Rijsdijk, 2013). Despite the failure rate, small businesses accounted for 99% of all U.S.
firms (Labedz & Berry, 2011). On average, businesses owned by NAs earned 70% lower
gross receipts than those earned by other U.S. firms (MBDA, 2014). The general business
problem was that although small business support services exist for NAs (Benson, Lies,
Okunade, & Wunnava, 2011), few NAs pursued entrepreneurial ventures and established
successful small businesses. The specific business problem was that NA small business
owners may not understand the likelihood that attitudes toward entrepreneurship,
subjective norms, and perceived behavioral control predict small business success.
Purpose Statement
The purpose of this quantitative correlational study was to examine the likelihood
that NA attitudes toward entrepreneurship, subjective norms, and perceived behavioral
control predict small business success. Independent variables included those that
constitute the theory of planned behavior: (a) attitudes toward entrepreneurship, (b)
subjective norms, and (c) the entrepreneur’s perceived behavioral control of the venture
creation process (Liñán & Chen, 2009). A positive profit in the previous business year
constituted the dependent variable: business success (Owens, Kirwan, Lounsbury, Levy,
& Gibson, 2013).

4
The study population included approximately 550 business owners registered with
a single NA tribe’s small business office in the South Central region of the United States.
NA business owners are an underdeveloped source of entrepreneurialism and are rarely
studied (Franklin et al., 2013). Findings could contribute to social change in a seldom-
studied population by offering insight into the relationship between entrepreneurial
intention and small business success leading to job creation and innovative new products
and services.
Nature of the Study
I used a quantitative research methodology and correlational design to examine
the likelihood that entrepreneurial intention factors predict small business success among
NAs. A quantitative correlational approach allows for the collection of data from a large
population from various locations using a survey (Castellan, 2010). Jaén and Liñán
(2013); Liñán and Chen (2009); and Liñán, Urbano, and Guerrero (2011) used surveys to
collect data and quantitative methods to analyze data. Du and Kamakura (2012) used
quantitative research to measure survey participants’ thoughts and attitudes. Additionally,
the use of quantitative research provides the ability to determine relationships among data
through statistical analysis (Castellan, 2010; Cohen, Cohen, West, & Aiken, 2003).
Therefore, in this study, I utilized a quantitative method with a correlational design to
study factors contributing to entrepreneurial intention among NAs and the likelihood, if
any, that these factors predict the success of NA businesses. For the purpose of this study,
the existence of a business profit in the preceding business year constituted business
success.

5
Other research methods considered for the study included qualitative and mixed
methods. A qualitative method allows the researcher to explore a concept using
interviews or observation to uncover unidentified factors (Mobaraki & Zare, 2012).
Though a qualitative method proves appropriate to uncover new information, the goals of
this study included the comparison of motivational factors and success metrics rather than
the pursuit of new information. Therefore, a qualitative method did not meet the
requirements of this study.
A mixed methods approach blends qualitative and quantitative methods to
combine both statistical analysis of data and the search for new information (Fretschner
& Weber, 2013). However, neither the exploration of new information nor the
complexity involved with mixed methods aligned with the goal of this study: to
determine the likelihood that attitudes toward entrepreneurship, subjective norms, and
perceived behavioral control predict small business success among NAs. Based on the
purpose of this study, I chose a positivistic approach of collecting quantitative data from
which measurable results can be determined (Cole, Chase, Couch, & Clark, 2011). A
quantitative method guides the researcher in generating relationship measurements and
generalizable results (Castellan, 2010).
Research Question
The research question in this study stems from the theory of planned behavior
(TPB). According to the TPB, only three elements influence intention; therefore, any
other variable proposed would only influence the outcome of the three antecedents to
intention (Jaén & Liñán, 2013). The central research question guiding this study was the

6
following: What is the likelihood that attitudes toward entrepreneurship, subjective
norms, and perceived behavioral control predict Native American small business
success?
Hypotheses
The null and alternative hypotheses tested in the study were as follows:
H0: Attitudes toward entrepreneurship, subjective norms, and perceived
behavioral control do not predict the likelihood of NA small business success.
H1: Attitudes toward entrepreneurship, subjective norms, and perceived
behavioral control do predict the likelihood of NA small business success.
Survey Questions
I collected data to address the research question using the Entrepreneurial
Intention Questionnaire (EIQ). Liñán and Chen (2009) developed the EIQ based on the
TPB. The full survey instrument in Appendix A includes slight language revisions
appropriate to the study population. Liñán granted permission to use and revise the EIQ
(see Appendix B).
Theoretical Framework
The theoretical framework for the study originated from Ajzen’s (1991) theory of
planned behavior. Ajzen declared that the best indicator of future action is current
intention and includes (a) attitude, (b) subjective norms, and (c) perceived behavioral
control. Explanations of behavior resulting from intentions using the TPB influence
various fields of study, including entrepreneurship (Vissa, 2011). Wide use and
acceptance of the TPB provides support for the continued application of the theory in

7
research (Malebana, 2014; Schlaegel et al., 2013; Wurthmann, 2013). Therefore, the TPB
provided a valid theoretical framework for the study regarding the relationship between
NA entrepreneurial intention and business success.
The combination of the three elements of the TPB affects intention. An
individual’s attitude or behavioral belief involves the desirability of the outcome of a
behavior (Mobaraki & Zare, 2012). In addition, subjective norms or normative beliefs
include the effect one’s network of influencers has on one’s plans (Iakovleva, Kolvereid,
& Stephan, 2011). Moreover, perceived behavioral control exists when the participant
feels confident in exercising the skills and knowledge required to be successful
(Fretschner & Weber, 2013).
Attitudes toward entrepreneurship, subjective norms, and perceived behavioral
control combine to affect intention. Furthermore, intention drives behavior for actions
requiring prior planning (Sonenshein, DeCelles, & Dutton, 2014). Variations in attitudes
toward entrepreneurship, subjective norms, and perceived behavioral control might
influence business success.
Operational Definitions
Business profit: Business profit is reflected on a business’s income statement
when the revenue earned by the business exceeds all costs required to earn that revenue
in a given time period (Vranceanu, 2014).
Business success: Business success was defined as a business reporting a profit
rather than a loss on the company’s income statement in the preceding business year
(Owens et al., 2013).

8
Minority Business Development Agency (MBDA): The MBDA of the U.S.
Department of Commerce administers programs and support centers to promote the
creation and growth of minority-owned small businesses (Liu, 2012).
Nascent entrepreneur: A nascent entrepreneur is an individual engaged in
activities to start a new business (Zanakis, Renko, & Bullough, 2012).
Native American (NA): NAs, also referred to as American Indians, are the original
inhabitants of the Americas before European settlements (Parham, 2012). The U.S. SBA
classifies NAs as a group that qualifies for the small disadvantaged business program
(Fernandez, Malatesta, & Smith, 2012).
Perceived behavioral control: Perceived behavioral control, one element of the
TPB that is similar to self-efficacy, indicates a person’s perception of how well he will
perform to handle a situation (Nabi & Liñán, 2013).
Small business: A small business is a privately held, independent business with
fewer than 500 employees (SBA, 2014a).
Small Business Development Center (SBDC): SBDCs are educational outreach
branches of the U.S. SBA designed to help community members start and run businesses
(Knotts, 2011).
Small Disadvantaged Business (SDB) Program: Created in response to federal
legislation calling on the U.S. SBA to promote fairness in how government contracts are
awarded (Fernandez et al., 2012), the SDB program offers contractual assistance to
qualifying firms. Small firms that are at least 51% owned and operated by a member of a
disadvantaged group also receive additional support through loan and educational

9
programs (SBA, 2014b).
Subjective norms: Subjective norms are the thoughts and pressures from those in a
position to influence the decisions of a person, typically family and friends (Hattab,
2014).
Assumptions, Limitations, and Delimitations
Assumptions
Martin and Parmar (2012) defined assumptions in research as the items that a
researcher accepts as true despite no known or anticipated documentation of such truth.
This study included four assumptions. First, I assumed that a quantitative correlational
approach would serve as an appropriate design to examine the likelihood that attitudes
toward entrepreneurship, subjective norms, and perceived behavioral control predict
small business success among NAs. A second assumption was that the business owners in
the study would answer the survey questions honestly and thoughtfully. Third, the
respondents of the survey represented only NA business owners. A final assumption
involved the use of the EIQ instrument to collect data to examine the likelihood that
attitudes toward entrepreneurship, subjective norms, and perceived behavioral control
predict small business success among NAs. Liñán, Rodríguez-Cohard, et al. (2011);
Moradi, Papzan, and Afsharzade (2013); Sánchez (2013); and Tsai, Chang, and Peng
(2014) validated, used, and cited other uses of the EIQ in studies of students, aspiring and
current entrepreneurs, and entrepreneurs from different countries.
Limitations
Limitations exist for all studies and guide study procedures (Solesvik, 2013).

10
Limitations arise from the research method and design chosen by the researcher for
conducting the study and consist of shortcomings in the research (Brutus, Aguinis, &
Wassmer, 2013; Kirkwood & Price, 2013). First, using a survey requiring Likert-type
scale responses may not capture enough information to explain the thoughts and
perspectives of those participating in the study (Yusoff & Janor, 2014). Qualitative
researchers could explore these concepts in more depth; however, the results of a
qualitative study would not be generalizable to other similar populations (Cronin-
Gilmore, 2012). Additionally, time constraints and lack of incentives likely limited the
number of participants who completed the survey.
Delimitations
Delimitations are boundaries set to define scope of a study (Wlodarcqyk, 2014).
The scope of this study only included NAs who owned a business registered with the
tribal government. Business owners register with the tribal support office to receive
opportunities for assistance and to do business with the tribal government (B. Joplin,
personal communication, September 20, 2013). The defined scope of the study delimited
the implications of results to one tribe in the South Central region of the United States.
Furthermore, much of the area where members of the NA tribe live consists of rural areas
and small towns. Therefore, results of the study may not be generalizable to groups in
other geographic areas or those having a different socioeconomic status.
Significance of the Study
The significance of the study includes two areas of potential influence:
contribution to business practice and implications for social change. NAs compose 1.5%

11
of the U.S. population (MBDA, 2014). However, NAs own 0.9% of all businesses in the
United States, and NA-owned businesses account for only 0.3% of U.S. business revenue
(MBDA, 2014). I surveyed NA business owners and compared attitudes toward
entrepreneurship, subjective norms, and perceived behavioral control with business
success. Results from this study may provide information to business owners and
business support programs to increase business success rates. Improved business success
rates among NAs might initiate business changes with widespread implications for social
change.
Contribution to Business Practice
Other researchers explored or examined aspects of entrepreneurship,
entrepreneurship education, entrepreneurial motivation, entrepreneurial intention, and
success factors for small business owners (Carsrud & Brännback, 2011; Jusoh et al.,
2011; Mars & Ginter, 2012; Rideout & Gray, 2013; Schmidt, Soper, & Bernaciak, 2013).
Scholars identified factors that contribute to a firm’s success (Elmuti et al., 2012;
Grafton, 2011; Heinonen, Hytti, & Stenholm, 2011; Morris, Webb, Fu, & Singhal, 2013;
Volery, Müller, Oser, Naepflin, & del Rey, 2013; Yallapragada & Bhuiyan, 2011).
However, the previously mentioned studies lack information on specific demographic
effects.
Carey, Flanagan, and Palmer (2010); Douglas (2013); Fitzsimmons and Douglas
(2011); and Liñán, Rodríguez-Cohard, et al. (2011) focused on intention aspects
associated with entrepreneurship. Only Malebana (2014) examined entrepreneurial
intention in a rural setting. Moreover, Liñán, Urbano, et al. (2011) and Ugwu and Ugwu

12
(2012) studied entrepreneurial intention with respect to cultural or ethnic differences.
Based on the results of Liñán, Urbano, et al.; Malebana; and Ugwu and Ugwu, the factors
that influence business formation varies based on location and culture.
Liñán, Urbano, et al. (2011) informed readers that culture influences
entrepreneurial intention. Liñán, Urbano, et al. found that people in developed regions of
Spain placed a higher value on entrepreneurship and exhibited higher levels of
entrepreneurial intention. Malebana (2014) found the motivation to start a business to be
lower among residents in rural areas of South Africa. In a 14 nation quantitative study,
Schlaegel et al. (2013) found that social norms, one of the three elements of the TPB,
vary with culture and explain 67% of the variance of entrepreneurial intention. Despite
the documented disparity of NA-owned businesses when compared to the general U.S.
population and the recognized findings of the influence of culture on entrepreneurial
intention, few researchers have focused on NA entrepreneurship (Franklin et al., 2013;
Miller, 2012).
This study may contribute to positive social change by educating NA small
business owners and business support offices regarding relationships between
entrepreneurial intention elements and small business success. Information regarding
small business success specific to NA entrepreneurs could support positive social change
for both NA populations as well as the economies where NAs live and work. An
improved local economy might aid the larger U.S. economy.
Implications for Social Change
Historical records show that NAs engaged in entrepreneurship until removal from

13
their original homes in the Americas to reservations more central to the United States
(Miller, 2012). Following this removal, NAs became less apt to engage in trade or
agriculture and instead relied upon government support for their families (Miller, 2012).
As a result, unemployment among NAs rose to a level twice the U.S. national average in
2010 and up to 80% in some locations (Juntunen & Cline, 2010). Furthermore, fewer
NAs start businesses as compared to the overall U.S. population, and those businesses
earn an average of 70% less profit than other U.S. businesses (MBDA, 2014; Stewart &
Pepper, 2011).
With the knowledge that entrepreneurs create 86% of new jobs at the national
level (Neumark, Wall, & Zhang, 2011), tribal leaders could assist NA communities by
supporting entrepreneurship. If armed with knowledge regarding the likelihood that
attitudes toward entrepreneurship, subjective norms, and perceived behavioral control
predict small business success, support services for NAs might be more effective.
Acquiring knowledge about entrepreneurial intention and small business success aligns
with the overarching research question guiding this study. Understanding contributing
factors for NA business success may help those who plan support and training programs
designed to encourage and assist NAs in their quest to start a business. An increase in
business ownership and business success rates among NAs might decrease
unemployment and improve prosperity and overall wellness in the community.
A Review of the Professional and Academic Literature
The search for relevant sources included applicable databases at Walden
University on the topics of attitudes toward entrepreneurship, subjective norms, perceived

14
behavioral control, and small business success. Initial databases explored included
Business Source Complete, ABI/INFORM Complete, Emerald Management Journals,
SAGE Premier, and PsycINFO. Next, I mined the bibliographies of these articles and
citation chains to ensure an in-depth search of all available literature. A citation chain
examination included the use of Google Scholar to search for additional applicable
articles. The combination of searching databases in the business and psychology sections
of the Walden library, following useful sources from scholarly works, and reviewing the
citation chain list from references resulted in over 150 peer-reviewed articles published
since 2011.
The articles used as references in this study included information relevant to the
field of entrepreneurship, the factors that motivate individuals to start a business, business
success, and the history and challenges of NA entrepreneurship. In an effort to organize
this research logically, I arranged the literature review first to communicate information
concerning entrepreneurship and the economic value of small businesses to economies. I
then presented information about the motivating factors to start a business and business
success. Finally, I included a review of the literature covering the history and
contemporary situation of NA economies to illustrate the significance of this research.
The content of the literature review supports the need for research regarding the
likelihood that attitudes toward entrepreneurship, subjective norms, and perceived
behavioral control predict small business success among NAs. Peer-reviewed articles
published since 2011 constitute 88% of the sources referenced in the review of the
professional and academic literature (see Table 1).

15
Table 1
Synopsis of Sources in the Literature Review
2011-2015 2010 - Prior
Reference Type Number % of Total Number % of Total
Peer-reviewed Articles 128 90.1 6 4.2
Government sources 2 1.4 0 0.0
Books 1 0.7 0 0.0
Non Peer-reviewed
Articles
2 1.4 3 2.1
Entrepreneurship
Defining entrepreneurship presents a challenge for scholars and practitioners
based on the varied nature of the field. In a study concerning entrepreneurship concepts,
Mars and Rios-Aguilar (2010) reviewed 44 peer-reviewed articles on entrepreneurship
and found no specific definition of entrepreneurship. Moreover, Lahm and Heriot (2013)
argued that the definition of entrepreneurship lacked scholarly consensus because of the
derivation of entrepreneurship from various business disciplines and social sciences. This
lack of consensus might have caused disparity among frameworks used for study in the
field (Mars & Rios-Aguilar, 2010).
Despite the disagreement on a single definition in the field, a standard definition
of entrepreneurship provides clarity. Therefore, for the purposes of this study, I defined
entrepreneurship as the process of identifying and exploiting opportunities while taking
responsibility for the risk (Uddin & Bose, 2012). The SBA refers to those who start
businesses as entrepreneurs; therefore, this study used the term entrepreneur to refer to an
individual who starts a business.
When an entrepreneur creates a new business, something of value arises from an

16
idea yielding benefit to both the entrepreneur and those with whom the entrepreneur does
business (Elmuti, Khoury, & Abdul-Rahim, 2011). Yallapragada and Bhuiyan (2011)
defined a small business entrepreneur as a business founder and manager with growth
and profit goals. The small business entrepreneur’s actions boost the economy in the area
where the business is located as well as the overall economy (Bharadwaj, Osborne, &
Falcone, 2010).
Small Business Success
A small business is a privately held, independent business with fewer than 500
employees (SBA, 2014a). According to the SBA (2014a), small businesses accounted for
99.7% of U.S. employer firms with 28.2 million small businesses. In comparison, the
SBA reported that only 17,700 firms existed in 2011 with over 500 employees.
The SBA (2014a) also reported that similar numbers of businesses open and close
each year. Additionally, the SBA reported that sustainability rates have changed little
over time, with 50% of firms surviving 5 years or more and 33% surviving 10 years or
more. The Global Entrepreneurship Monitor (GEM) project considered a business
established when sustaining operations for 3.5 years or more (Bosma & Schutjens, 2011;
Jones-Evans, Thompson, & Kwong, 2011; Xavier, Kelley, Kew, Herrington, &
Vorderwülbecke, 2013). Bharadwaj et al. (2010) and Rauch and Rijsdijk (2013) noted
that almost half of all new businesses do not survive the first 4 years of operations.
Yallapragada and Bhuiyan (2011) reported that 34% of entities do not survive the first 2
years in a new small business. Despite the varied terms of measurement, the reported
sustainability rates demonstrated the challenging task of business success for small

17
business owners.
Small business success measurements proved challenging for researchers in
previous research studies (Soriano & Castrogiovanni, 2012). Soriano and Castrogiovanni
(2012) observed that the difficulty in measuring success stemmed from differing
definitions of success by business owners. Not all entrepreneurs start a new business
because of financial reasons (Carsrud & Brännback, 2011; Eijdenberg & Masurel, 2013;
Zanakis et al., 2012). Boyer and Blazy (2014) concurred and added that entrepreneurs
measure their own financial success against their desired standard of living rather than a
percentage of revenue growth. However, in a survey of Australian business owners,
Vilkinas, Cartan, and Saebel (2012) found that business owners rank making a profit as
the most important measure of business success. Considering the number of business
failures, Soriano and Castrogiovanni used business profit as an indicator variable
depicting business survivability and success.
Soriano and Castrogiovanni (2012) found profitability to be a key measure of
business performance. Similarly, Owens et al. (2013) defined entrepreneurial business
success as a business with a positive economic profit. Additionally, Keelson (2014) and
Ngo and O’Cass (2013) equated business success with profitability. Shehu (2014)
confirmed that using profit to define business success applies to small- to medium-sized
enterprises (SME). Moreover, Gorgievski, Ascalon, and Stephan (2011) discovered that
business profit ranked high among business owners driven by both economic and social
motivations. Although other measures of business success exist, business profit pervades
the small business and entrepreneurship literature.

18
For my study, business success measured by profitability was the dependent
variable. Business profitability applies to both economic and socially driven small
business owners (Gorgievski et al., 2011). Vranceanu (2014) defined business profit as
the difference between income earned and all costs incurred to earn that income.
Similarly, Jacobides, Winter, and Kassberger (2012) stated that business profit occurs
when revenue exceeds expenses. Additionally, Ortiz-Walters and Gius (2012) identified
profit as the business income minus expenses and taxes. Therefore, for the purposes of
this study, business profit was defined as the existence of positive business income.
To collect profit information, I included a survey question asking participants
about their business profit in the most recent business year. If participants reported a
profit on their income statement, they responded with a yes. A year with no or negative
profit warranted a no answer. Ortiz-Walters and Gius (2012) and Welsch, Desplaces, and
Davis (2011) collected business success information by asking study participants if they
reported a profit in the most recent business year. Correspondingly, Halabí and Lussier
(2014) collected business success information from small businesses using profitability
without asking for actual profitability values. Hallak, Assaker, and O’Connor (2014)
added that small business owners would only answer questions concerning profitability
when dollar values were not requested. Profitability is a business success measure
common among entrepreneurs and appropriate as a dependent variable for this study.
Contributions of Small Business Entrepreneurship to the Economy
Entrepreneurship plays a constructive role in all economies. Entrepreneurs
contribute to prosperity, create jobs, and fuel innovation (Solomon, Bryant, May, &

19
Perry, 2013; Yallapragada & Bhuiyan, 2011). The positive effects on the economy
generated by entrepreneurs spark continued research on the topic (Leung, Lo, Sun, &
Wong, 2012). Making three positive influences on the economy, entrepreneurs create
jobs, produce innovation, and generate manufacturing production (Ates & Bititci, 2011;
Nazir, 2012; Neumark et al., 2011; Winkel, Vanevenhoven, Drago, & Clements, 2013).
In the United States alone, small business entrepreneurship creates 86% of new jobs
(Neumark et al., 2011). Job creation promotes economic growth and reduces
unemployment. Moreover, SMEs account for 70% of the world’s production (Ates &
Bititci, 2011). Entrepreneurs often begin a new business based on a breakthrough or
improvement innovation (Nazir, 2012), and small businesses create 67% of new
inventions (Winkel et al., 2013). Not only do entrepreneurs offer innovation, the
innovative activity of entrepreneurs pushes established companies to innovate to remain
competitive (Kuratko, 2011). This continual cycle of innovation drives economic growth
(Kuratko, 2011). The combination of new job creation and the high rate of innovation
coupled with the 51% of the U.S. gross domestic product that small businesses generate
shows the value of entrepreneurship to national prosperity (Winkel et al., 2013).
The international recognition of the contribution of entrepreneurship to economies
led to the creation of the GEM project (Kuratko, 2011). The GEM project, which began
in 1999 with 10 countries, grew to include survey responses from 104 economies in the
2013 report to determine their entrepreneurial activities (Amorós & Bosma, 2014;
Thompson, Jones-Evans, & Kwong, 2010). University partners conducted the GEM
survey annually among the general population and business owners (Thompson et al.,

20
2010). In each participating economy, at least 2,000 randomly selected adults ages 18-64
answered GEM survey questions via telephone or face-to-face interaction in their own
language (Amorós & Bosma, 2014; Griffiths, Gundry, & Kickul, 2013).
Adults surveyed in the GEM project answered questions that cover the entire life
cycle of the entrepreneurial process including nascent activity, new business ownership,
established business ownership, and business exit (Jones-Evans et al., 2011). The
translated results of the surveys provided data to allow entrepreneurship researchers to
study the collected data (Griffiths et al., 2013; Thompson et al., 2010). Researchers using
data collected from the GEM surveys demonstrated a statistically significant relationship
between national entrepreneurial activity and national economic growth (Nazir, 2012).
The large sample allowed researchers to conduct reliable studies and offer information to
legislators and officials who guide policy decisions for continued stimulation of
entrepreneurship.
While the GEM project encompassed the entire entrepreneurial life cycle, a study
by University of Michigan researchers focused on U.S. nascent entrepreneurs (Edelman,
Brush, Manolova, & Greene, 2010). With an objective of understanding who becomes
entrepreneurs and how they accomplish starting a new business, the Panel Study of
Entrepreneurial Dynamics (PSED) included questions about motivations, knowledge, and
support (Zanakis et al., 2012). The 5-year time span of the PSED allowed data collection
about start-up activities and new business operational activities (Hopp & Stephan, 2012).
Understanding the transition from nascent entrepreneur to business owner is important
because only one-third of the PSED respondents made the shift from business planning to

21
business operations (Zanakis et al., 2012). The creation and support of the PSED project
provided evidence of the contributions of new businesses and longitudinal data for
ongoing research to improve the understanding of business formation and success (Hopp
& Stephan, 2012; Zanakis et al., 2012).
Entrepreneurs
As with the challenge of defining the discipline of entrepreneurship, narrowing
the definition or characteristics of an entrepreneur also presented a challenge.
Researchers in the field of management and entrepreneurship characterized an
entrepreneur as an innovator and as adept at recognizing and acting on opportunities
(Carsrud & Brännback, 2011). Ahmad, Xavier, and Bakar (2014) found that trait research
conducted on entrepreneurs provided contradictory results. Similarly, Carsrud and
Brännback (2011) shared that attempts to identify personality traits unique to
entrepreneurs failed to differentiate managers from entrepreneurs to ensure that
investigators adapted their research to focus on intentions and motivations.
Entrepreneurship appeals to individuals for a number of reasons. Sometimes, no
better job alternative exists (Ekpe, Razak, & Mat, 2013). At other times, opportunities
seem too good to pass up (Bridgstock, 2013). These push and pull factors influence
entrepreneurial decisions (Bauer, 2011; Omar, 2011).
Push factors. Individuals may start a new business because of a factor or factors
pushing them towards these entrepreneurial endeavors. Push factors include (a)
insufficient income, (b) discrimination, (c) underemployment, and (d) unemployment
(Bauer, 2011). The unemployed may look to entrepreneurship for economic survival

22
(Liu, 2012). Unsatisfied employees may see entrepreneurship as a way to change their
disappointing employment situation (Fairlie & Marion, 2012; Gibson, Harris, Walker, &
McDowell, 2014). Both economic survival and unsatisfactory employment may push
some to start their own business.
Push factors may vary depending on the economic climate. Xavier et al. (2013)
reported that incidences of necessity-driven entrepreneurship, those pushed into
entrepreneurship because of no other means to earn an income, remained highest for
factor-driven economies that rely on unskilled labor and natural resources. More
developed economies report fewer instances of necessity-driven entrepreneurship
(Amorós & Bosma, 2014).
Pull factors. In contrast, some individuals may become entrepreneurs because of
one or more factors pulling them towards entrepreneurship (Eijdenberg & Masurel,
2013). Pull factors include (a) personal interest or passion, (b) flexibility, (c) ethnic
enclaves, (d) higher earnings potential, (e) upgrade in social status, (f) role models, and
(g) a good opportunity (Omar, 2011). Pull factors entice potential entrepreneurs to engage
in something better than their current situation (Bauer, 2011).
Similar to push factors, the incidence of pull factors may vary based on the
economic climate of the country or region (Bosma & Schutjens, 2011; Xavier et al.,
2013). Economies in the innovation-driven phase of development, where the service
sector and knowledge-driven businesses dominate, exhibited higher numbers of
opportunity-driven entrepreneurs (Xavier et al., 2013). Entrepreneurship pull factors in
innovation-driven economies or economies experiencing growth competed with the
23
opportunity costs of employment opportunities (Bosma & Schutjens, 2011).
Variance on push and pull factors. Eijdenberg and Masurel (2013) argued that
push and pull factors do not have to be mutually exclusive. Eijdenberg and Masurel’s
research of a factor-driven economy in Africa included results that motivations might be
a mixture of push and pull factors rather than only one or the other. This finding counters
the GEM model of describing entrepreneurs as either necessity-driven or opportunity-
driven (Amorós & Bosma, 2014; Figueroa-Armijos & Johnson, 2013; Jones-Evans et al.,
2011).
Entrepreneurs pulled toward venture creation to pursue an opportunity may
succeed more often than those pushed into self-employment. Fairlie and Marion (2012)
noted that disadvantaged groups, who often experience reduced employment prospects,
commonly turn to self-employment for survival. The businesses started by necessity-
driven entrepreneurs tend to fail more often than the businesses founded by opportunity-
driven entrepreneurs (Kariv, 2011). Additionally, entrepreneurs pulled into business tend
to experience lower profitability and slower growth (Kariv, 2011; Liu, 2012). Carsrud
and Brännback (2011) argued that some entrepreneurs might not seek the lifestyle that
they can create as a business owner rather than just to maximize economic gains. Carsrud
and Brännback’s argument could explain some of the findings of lower profitability for
necessity-driven entrepreneurs, as they may focus more on job flexibility or a social
cause.
Other factors. Other factors push or pull a potential entrepreneur depending upon
the content and context of the factor. Because the decision to venture into

24
entrepreneurship requires planning, numerous factors can influence the decision (Carey et
al., 2010). These factors may include age, gender, and entrepreneurship training, which
often contribute to the decision to pursue entrepreneurship (Rasli, Khan, Malekifar, &
Jabeen, 2013).
Age. Age might influence an individual’s motivation to start a business.
According to the U.S. SBA (2014a), fewer individuals age 25 and under pursued
entrepreneurship in 2012 as than in the previous 10 years. The 23% decline in
entrepreneurship among the 25 and younger group over the 10-year period contrasts the
66% increase in those over age 65 (SBA, 2014a). Self-employment for all ages in the
same 10 years increased 1% (SBA, 2014a).
Results in the 2013 GEM Global Report revealed that the highest rate of early-
stage entrepreneurship existed among the 25-34 and 35-44 age groups (Amorós &
Bosma, 2014). Allen and Curington (2014) determined that the probability of self-
employment increases with age peaking between 50 and 55 years. Additionally,
Jayawarna, Rouse, and Kitching (2013) found age to be a factor in entrepreneurial
intention.
Gender. Similarly, gender might affect venture creation motivations. The 7.8
million women-owned firms in the United States account for 36% of the total number of
businesses in 2012 (SBA, 2014a). While the number of women involved in business
ownership varies across countries, women own fewer businesses in most societies
(Amorós & Bosma, 2014; Gupta, Goktan, & Gunay, 2014). However, the number of new

25
women-owned firms has increased of the past 40 years at a rate of two to three times the
overall business start-up rate (Sciglimpaglia, Welsh, & Harris, 2013).
Women may approach entrepreneurial ventures differently than men (Jayawarna
et al., 2013; Saridakis, Marlow, & Storey, 2014). Allen and Curington (2014) and
Figueroa-Armijos and Johnson (2013) reported that women engage in entrepreneurship
because of a desire for more flexibility to deal with family-related issues and financial
independence. Conversely, Allen and Curington supported previous research findings
that men are motivated to start a business for pecuniary reasons (Kariv, 2011).
Additionally, van Hulten (2012) found that women entrepreneurs depended more on
family and social networks for business support.
Entrepreneurship Training. Entrepreneurship training offerings have grown from
their beginnings in the 1940s until now. Entrepreneurship education began at the
university level at Harvard University in 1947 (Abduh, Maritz, & Rushworth, 2012).
Many other schools followed, and by 2012 over 1,000 institutions in the United States
offered entrepreneurship courses (Abduh et al., 2012). Despite debate whether
individuals can learn entrepreneurship (Lautenschlager & Haase, 2011), the
preponderance of entrepreneurship education studies cite the ability to teach
entrepreneurship (Morris et al., 2013; Raposo & do Paco, 2011; Schmidt et al., 2013).
The growth of entrepreneurship preparation was encouraged and supported by
government and private resources. Both governments and private foundations provided
funding and resources to entrepreneurship training with the goal of developing more
entrepreneurs (Mars & Ginter, 2012; Rideout & Gray, 2013). For example, The Ewing
26
Marion Kauffman Foundation in Kansas City, MO, supports entrepreneurship and
entrepreneurship instruction with dollars, curriculum development, and initiatives to spur
entrepreneurship (Rideout & Gray, 2013). In addition, the Coleman Foundation provides
grant funding specifically for entrepreneurship preparation (Mars & Ginter, 2012).
Entrepreneurship education at universities and entrepreneurship training organizations
benefit from the influx of support (Mars & Ginter, 2012).
Training programs exist in different lengths, modalities, and targeted audiences.
Some entrepreneurship training programs carry the name of boot camp in their title to
connote the brief yet thorough nature of the program (Bharadwaj et al., 2010). Others
meet once per week or month to offer entrepreneurs the opportunity to educate
themselves at a slower pace, while continuing to run their businesses (Pruett, 2012).
Participants in these types of training programs report high satisfaction with the type and
quality of instruction received (Bauer, 2011). These programs offer training to those who
might not otherwise have the opportunity for formal entrepreneurship education at a
higher education institution.
Higher education institutions offer entrepreneurship education courses, certificate
programs, minors, and majors. Over 1600 universities offer at least one entrepreneurship
course (Winkel et al., 2013). While entrepreneurship programs exist as an extension to
the school of business, recent trends show that entrepreneurship programs exist outside
the school of business (Winkel et al., 2013).
Winkel et al. (2013) argued that entrepreneurship housed in the business school
might be less than ideal because business schools structure programs around functional

27
areas. Entrepreneurship education programs require coverage of the entire scope of
business (Buller & Finkle, 2013; Wielemaker, Gaudes, Grant, Mitra, & Murdock, 2010).
Some entrepreneurship programs reside in their own departments or within centers of
entrepreneurship or small business (Bridgstock, 2013; Parthasarathy, Forlani, & Meyers,
2012; Wielemaker et al., 2010). These arrangements encourage cross-disciplinary use
(Bridgstock, 2013; Parthasarathy et al., 2012; Rideout & Gray, 2013; Zarafshani, Cano,
Sharafi, Rajabi, & Sulaimani, 2011).
Entrepreneurship education may provide benefits to students in many fields.
Cross-disciplinary entrepreneurship education offers the necessary knowledge, skills, and
abilities to those involved in fields that lend themselves to self-employment
(Parthasarathy et al., 2012). The entrepreneurship education of students in fields outside
business schools and of secondary students supports economic growth by stimulating
entrepreneurial activity (Parthasarathy et al., 2012; Sánchez, 2013).
Entrepreneurship training, along with age and gender, exist as factors that might
influence an individual either toward or away from entrepreneurship. However, according
to the TPB, only attitudes toward entrepreneurship, subjective norms, and perceived
behavioral control influence intention (Jaén & Liñán, 2013). Furthermore, Ajzen’s TPB
exists in the literature as the dominant model with no serious challenges from other
researchers in the field of entrepreneurial intention (Carsrud & Brännback, 2011;
Mobaraki & Zare, 2012). Because of the acceptance and credibility of the TPB, I
analyzed results in this study through the lens of the TPB.

28
Entrepreneurial Intention
Choices with significant or long-term outcomes compel the decision maker to
consider options before making decisions. Options may include intentionality to fulfill
the action of the decision. Mobaraki and Zare (2012) defined intention as the temporary,
mental state prior to taking action. Mueller (2011) posited that intention is the immediate
antecedent of behavior. Thus, intention includes the thought process of the decision
maker prior to taking action or performing a behavior. Planned behavior incorporates the
mental precursor to behavior, defined as intention (Dinis, do Paco, Ferreira, Raposo, &
Gouveia, 2013). Further, reactionary behavior lacks the mental precursor or intention
(Ajzen, 1991).
Intention presupposes a planned behavior. Psychological literature shows that
intention is the best predictor of future behavior (do Paço et al., 2011). Any planned
behavior, such as career choice, is intentional (Mobaraki & Zare, 2012). For example, a
career choice to start a new business involves intentionality. The relationship between
decisions and intentionality may lead to an examination of the intentionality aspect of
entrepreneurship.
Theories of Entrepreneurial Intention
Literature on intentionality among those who start new businesses predominantly
included content concerning entrepreneurial intention. Entrepreneurial intention is a
measure of intentionality commonly used in entrepreneurship research literature (Liñán,
Rodríguez-Cohard et al., 2011; Rasli et al., 2013). The opportunity recognition process
associated with entrepreneurship is clearly intentional; therefore, entrepreneurial

29
intention merits the attention of entrepreneurship researchers (Douglas, 2013; Ferreira,
Raposo, Gouveia Rodrigues, Dinis, & do Paço, 2012; Schlaegel & Koenig, 2014). Three
models subsist among research studies on the topic of entrepreneurial intention: (a)
Shapero’s model of the entrepreneurial event, (b) Bird’s model of implementing
entrepreneurial ideas, and (c) Ajzen’s TPB (Uygun & Kasimoglu, 2013). While these
models include overlapping entrepreneurial intention elements, differences exist among
the models.
Entrepreneurial event model. Shapero introduced the entrepreneurial event
model, the earliest model commonly used in entrepreneurial intention research, in 1982
(Uygun & Kasimoglu, 2013). Leung et al. (2012) explained that the model of the
entrepreneurial event includes intention arising from the perceived feasibility and
desirability of the opportunity, as well as from a propensity to take action. The
entrepreneurial event model includes an assumption that actions continue until an
interruption occurs. These interruptions might cause decision makers to re-examine the
feasibility and desirability presented opportunities (Schlaegel & Koenig, 2014). However,
the entrepreneurial event model may lack the elements necessary for researchers to
examine cultural influences on a person’s decisions to enter entrepreneurship.
Model of implementing entrepreneurial ideas. Bird’s model of implementing
entrepreneurial ideas includes individual and contextual conditions that interact with the
thought process of forming entrepreneurial intention (Uygun & Kasimoglu, 2013).
Individual conditions include personal history, personality, talents, and skills (Uygun &
Kasimoglu, 2013). Contextual conditions arise from the effect of the outside social,

30
political, and economic environment (Uygun & Kasimoglu, 2013). The blend of
individual and contextual conditions combines with time to yield entrepreneurial
intentions that lead may to entrepreneurial behavior. Bird’s model of implementing
entrepreneurial ideas includes elements to address the influence of others on an
entrepreneur’s decisions; however, the model does not contain elements to address an
entrepreneur’s perceived control.
Theory of Planned Behavior
The third theory, Ajzen’s (1991) TPB, stipulates three attitudinal antecedents of
intentions: (a) attitude toward the behavior, (b) subjective norms, and (c) perceived
behavioral control. Ajzen affirmed that the motivational factors that exist when a person
desires to perform a specific behavior comprise intention. Furthermore, Ajzen stated that
intentions can be weak or strong. The greater the intention, the more likely the action will
occur (Ajzen, 1991). The TPB is the dominant model in the literature with no serious
challenges from other entrepreneurial intention researchers (Carsrud & Brännback, 2011;
Mobarak & Zare, 2012). Because of the acceptance and credibility of the TPB, I
emphasized the TPB and the use of the TPB in this study.
Liñán and Chen (2009) applied elements of the TPB to entrepreneurial intention
through research based on the EIQ. Liñán and Chen created, tested, and validated the EIQ
through survey research on 519 participants from two diverse countries to confirm its
applicability for entrepreneurial intention research. Through the examination of survey
results, Liñán and Chen further validated previous findings of applicability. The elements
of the TPB include (a) attitude toward start-up, (b) subjective norms, and (c) perceived

31
behavioral control (do Paço et al., 2011; Liñán & Chen, 2009). The TPB, as shown in
Figure 1, will guide my analysis of the likelihood that attitudes toward entrepreneurship,
subjective norms, and perceived behavioral control predict business success among NAs.
Figure 1. Theory of planned behavior elements with added entrepreneurial cues and
dependent variable (based on Ajzen, 1991).
Attitude toward start-up. Attitude encompasses a person’s personal mindset
toward a behavior. Attitude toward start-up refers to the level of positive or negative
valuation of the advantages and disadvantages of venture creation (Liñán & Chen, 2009).
In the TPB, attitudes towards a behavior correspond to perceived desirability in the
entrepreneurial event model (Guzman-Alfonso & Guzman-Cuevas, 2012). Attitudes
toward entrepreneurship and the effect of these attitudes on entrepreneurial intention have
energized new interest among researchers (Gibson, Harris, Mick, & Burkhalter, 2011;
Moi, Adeline, & Dyana, 2011; Solesvik, 2013). Additionally, many studies regarding
current and future entrepreneurs include literature on attitudes toward entrepreneurship as
Attitude - Did starting a business seem desirable?
Subjective Norms - Was starting a business looked upon favorably by those in
your network?
Entrepreneurial Intention -The decision to start a
business.
Started a Successful New Business.
Perceived Behavioral Control - Did you think
you had the skills required to be successful?

32
an element even when not using the TPB (Moi et al., 2011; Petridou & Sarri, 2011;
Thompson et al., 2010; Wurthmann, 2013). The consistent use of attitudes toward
entrepreneurship in entrepreneurial intention literature shows the importance of attitude
as a factor influencing intention.
Subjective norms. Whereas the TPB includes elements of a person’s personal
attitude, the TPB also involves the attitudes of those around the decision maker.
Subjective norms or normative beliefs incorporate the effect a network of influencers has
on a person’s plans (Mueller, 2011). Ajzen (1991) noted that subjective norms refer to the
actual or perceived social or peer pressure to perform a behavior. The pressure not to
perform a behavior may be just as great (Ajzen, 1991).
Subjective norms arise from the approval or disapproval of a person’s behavior
multiplied by the person’s motivation to comply (Ajzen, 1991). Aslam, Awan, and Khan
(2012) found that a family background of entrepreneurship positively influences
subjective norms associated with entrepreneurial intention. Because some cultures or
groups place more or less value on entrepreneurship, the influence of subjective norms
varies by population (Ajzen, 1991; Schlaegel et al., 2013). Edelman et al. (2010)
observed, when examining data from the PSED, that parents of African American
entrepreneurs offered greater support to their children for entrepreneurship than
Caucasian parents. African American nascent entrepreneurs also sought backing from
peers and church members (Edelman et al., 2010). Shoebridge, Buultjens, and Peterson
(2012) added that spouses and extended family exerted influence on entrepreneurial
decisions among indigenous populations. Pisani (2012) discovered that the greatest

33
influence on the decision to engage in entrepreneurship between Latino’s in South Texas
was encouragement from family. Molaei, Zali, Mobaraki, and Farsi (2014) added that
subjective norms affect entrepreneurial intention even when the opinions of one’s
influencers mislead.
Perceived behavioral control. Similar to the concept of self-efficacy, perceived
behavioral control entails individuals’ perceptions of how well they can perform or
handle a situation (De Clercq, Honig, & Martin, 2011). Perceived behavioral control and
perceived feasibility share common elements. Lown (2011) characterized (a) perceived
behavioral control, (b) perceived feasibility, and (c) self-efficacy as an individual’s
ability to handle a situation without becoming overwhelmed. Bullough, Renko, and Myatt
(2014) described entrepreneurial self-efficacy as the level of confidence in carrying out
the duties required to start-up and manage a business. The stronger the sense of one’s
entrepreneurial self-efficacy or perceived behavioral control, the more likely the
individual is to engage in venture creation activities and persist in business start-up and
management (Bullough et al., 2014).
Chou, Shen, and Hsia (2011) stated that entrepreneurial self-efficacy has a
positive influence on entrepreneurial intention and learning behavior. While a learner
benefits more from training or experience when they possess self-efficacy, the reverse is
also true (Chou et al., 2011). Entrepreneurship training, entrepreneurial experiences, and
entrepreneurial role-models or mentors positively affect the perceived behavioral control
component of entrepreneurial intention (Pittaway, Rodriguez-Falcon, Aiyegbayo, &
King, 2011; Rideout & Gray, 2013; Sánchez, 2013; Studdard, Dawson, & Jackson,
34
2013). Mobaraki and Zare (2012) explored and confirmed the importance of self-efficacy
among entrepreneurs in a qualitative study.
Applications of the TPB elements. Researchers investigating behavioral
domains applied the TPB elements in more than 18,000 published research articles
(Ajzen, 2012). Kibler (2013) supported the wide spread use of the TPB elements with
notations of the wide acceptance for examining human behavior. Particularly relevant to
this study, Kibler found the TPB elements to be useful in studying regional and cultural
conditions associated with entrepreneurial intention. Kibler, like Liñán, Urbano, et al.
(2011), found cultural context to both positively and negatively influence both attitudes
toward entrepreneurship and subjective norms. Krueger, Liñán, and Nabi (2013) added
that when a culture highly values entrepreneurship, attitudes toward entrepreneurship and
subjective norms remain more positive. Krueger et al. continued with confirmation that
positive perceived behavioral control arises from an environment that values venture
creation. Schlaegel et al. (2013) offered similar results to those of Krueger et al., finding
that in a study involving different cultures subjective norms explained most of the
variance in entrepreneurial intention.
In a different approach to research on business creation among differing regions,
Fernández-Serrano and Romero (2013) conducted empirical research on SMEs in low-
versus high-income areas. Through their analysis of survey data collected from 663 SME
managers and owners in four different provinces in Spain, Fernández-Serrano and
Romero utilized entrepreneurial quality as a framework for their research. The
entrepreneurial quality framework approach included both descriptive and correlational

35
statistical calculations. Fernández-Serrano and Romero found that SMEs in the low-
income regions of the study yielded a lower entrepreneurial quality score than SMEs in
the high-income regions. In a different study comparing entrepreneurial intention in
different economic situations, Iakovleva et al. (2011) found that entrepreneurial intention
is higher among those in developing economies as compared to developed economies.
Carey et al. (2010) studied entrepreneurial intention by size and type of venture
using the elements of the TPB. Carey et al. calculated descriptive and correlational
statistics on the survey data finding support for the TPB elements to examine
entrepreneurial intention. However, Carey et al. found that the TPB elements did not
correlate well with the intentions of participants who desired to start a small, lifestyle
venture. Vissa (2011) explained that attitudes, subjective norms, and perceived
behavioral control influenced the desire of an entrepreneur to convert personal ties to ties
with economic results. Carey et al. and Vissa demonstrated that some entrepreneurs start
businesses for reasons other than financial goals.
Sánchez (2013) studied attitudes toward entrepreneurship, subjective norms, and
self-efficacy (perceived behavioral control) among 14 to 17 year-olds. Self-efficacy
correlates with proactiveness (Sánchez, 2013). Sánchez’s use of the TPB elements
provided an example of including an additional variable of comparison. Sommer (2011)
offered additional empirical research examining the relationship of the TPB variables to
an additional variable.
Additionally, Fretschner and Weber (2013) expanded on the use of TPB variables
by adding a qualitative component. Their new model, the entrepreneurship education

36
model (EEM), was designed specifically to measure the impact of entrepreneurship
awareness education on students’ attitudes, subjective norms, and perceived behavioral
control. Fretschner and Weber created their survey questions from Liñán and Chen’s
(2009) EIQ and added open-ended questions to collect additional responses from
students. Through application of the EEM with German university students, Fretschner
and Weber confirmed the applicability of adding research specific questions to the EIQ
for the purposes of measuring attitudes toward entrepreneurship, subjective norms, and
perceived behavioral control. Leung et al. (2012) included elements of both the TPB and
the EEM in their empirical research involving engineering students and entrepreneurial
activity.
Sources of Entrepreneurial and Small Business Assistance
Multiple sources of assistance exist beyond the formal training programs
previously mentioned. Business incubators lower the barriers to entry into
entrepreneurship by offering support services, as well as space to nascent entrepreneurs
to pursue their business idea without a large outlay of funds (Al-Mubaraki & SchröL,
2011; Mars & Ginter, 2012). Moreover, business accelerators help businesses grow by
offering networking support with other entrepreneurs and experts in the field (Audretsch,
Aldridge, & Sanders, 2011). The physical spaces provided for entrepreneurs to gather and
work amongst peers and support personnel exist to increase the likelihood of business
success. Business supporters can help businesses get started in business incubators and
facilitate business growth in accelerators.
Government support. Further reaffirming the contribution of small businesses to
37
the economy, the U.S. Congress passed the Small Business Act of 1953 creating the SBA
(Litwin & Phan, 2013). The SBA’s mission included support of small businesses and
programs designed to help small businesses compete for government contracts and secure
appropriate financing for their firms (Fernandez et al., 2012; Litwin & Phan, 2013;
Mihajlov, 2012; Yallapragada & Bhuiyan, 2011). The SBA creates and operates outreach
and financial support programs for small businesses (Fernandez et al., 2012; Mihajlov,
2012). In 2010, the SBA Office of Advocacy advocated business expansion and new
venture creation to stimulate job growth for economic recovery (Sciglimpaglia et al.,
2013). The SBA’s support for small business substantiates the positive economic benefit
of small businesses; thereby, justifying the SBA’s expenditures on support programs and
outreach assistance for U.S. small businesses.
SBDCs exist as an outreach program of the SBA, which works to benefit small
businesses (Knotts, 2011). For business support at any stage, entrepreneurs may turn to a
small business support office for assistance. Support for existing small- to medium-sized
business growth derives from SBDC short-term assistance and referrals (Knotts, 2011;
Mars & Ginter, 2012). SBDCs, while sometimes housed on university campuses, focus
on community members with businesses or business ideas (Knotts, 2011). Additionally,
SBDCs offer training courses for interested community members, personal assistance to
entrepreneurs and business owners, online resources, and economic development support
for their location (Knotts, 2011). SBDCs offer formal part-time consulting or support to
small businesses without the size necessary to employ experts in all areas of business
development.
38
The consulting offered by SBDCs may vary according to the client. Nascent
entrepreneurs may benefit from SBDC market and financial analyses (Sciglimpaglia et
al., 2013). Sciglimpaglia et al. (2013) found that existing businesses seek operations
assistance from SBDCs more often than they seek strategic or administrative assistance.
Small existing businesses rated marketing as the most important operations service
offered by SBDCs (Sciglimpaglia et al., 2013). Sciglimpaglia et al.’s survey results from
the broad range of business industries included responses ranking financial and strategic
planning highest in the strategic category of services and special government programs
highest among administrative services needed. When considering gender and minority
status with the results, Sciglimpaglia et al. found that minority women entrepreneurs
desired a broader range of services than men and nonminority women.
Another program supported by the SBA, the Service Corps of Retired Executives
(SCORE) began in 1970 (St-Jean & Audet, 2013). Bharadwaj et al. (2010) likened the
individualized services of SCORE volunteers to the assistance provided by SBDCs.
SCORE volunteers provided 12,000 volunteer hours to mentor over eight million small
businesses across the United States (Miles, 2012; St-Jean & Audet, 2013). St-Jean and
Audet (2013) discovered that mentoring programs like SCORE increased the mentees’
business competence as well as their entrepreneurial self-efficacy.
In addition to SCORE and SBDCs, the SBA promotes small business formation
and success among disadvantaged groups through the SDB program (Fernandez et al.,
2012). A firm must be at least 51% owned and controlled by an African American,
Hispanic American, Asian Pacific American, Subcontinent Asian American, or NA and

39
meet size qualifications to be eligible for the SDB program (Fernandez et al., 2012).
These firms receive government contract advantages as well as additional support from
the SBA and other governmental agencies (Fernandez et al., 2012; SBA, 2014b).
Added government assistance for minority business owners arose from the U.S.
Department of Commerce MBDA (Liu, 2012). Focused not only on small businesses, the
MBDA programs encouraged growth of small, medium, and large minority-owned
businesses (Liu, 2012). The existence of the MBDA within another branch of the U.S.
government further demonstrates the level of significance placed on firm creation and
growth.
The U.S. government created another program to help small businesses innovate.
The Small Business Innovation Research (SBIR) program began in the 1970s to
encourage small businesses to bring innovative products to market (Link & Scott, 2012).
Hargadon and Kinney (2012) found the SBIR program to be effective in encouraging
small businesses research and development. Link and Scott’s (2012) research provided
evidence that the SBIR program also succeeded in encouraging small businesses to
commercialize federally funded research and development projects. The SBIR funding
for innovation stimulates small business development and growth (Hargadon & Kenney,
2012).
Loan assistance. Entrepreneurs also may benefit from special loan programs
designed to help financial institutions make loans to businesses that might otherwise lack
collateral or a credit score to meet bank requirements. The SBA provides loan backing to
local banks that lend to entrepreneurs (Yallapragada & Bhuiyan, 2011). Despite SBA and

40
other programs for entrepreneurial loan assistance, minorities find even greater financial
capital barriers than other entrepreneurs because of fewer network contacts and a lack of
understanding about how outside investment works (Bates & Robb, 2013). Bates and
Robb (2013) also found that minority-owned small businesses lack equal access to capital
as compared to non-minority small businesses as illustrated in their findings that revealed
that 37% of nonminority-owned start-ups used borrowed funds. However, Bates and
Robb discovered that only 29% of African American-owned start-ups used borrowed
funds. In addition to this discrepancy, the loans provided to African American-owned
start-ups were 43% smaller than loans provided to nonminority-owned start-ups (Bates &
Robb, 2013).
Minority-owned firms relied heavily on credit cards and other bootstrapping
techniques to fund the operations of their start-ups (Bates & Robb, 2013). Some minority
entrepreneurs do not seek financing because they fear denial (Servon, Visser, & Fairlie,
2010). Instead, minority entrepreneurs may rely on personal credit cards that further
restrict growth because the use of the credit cards also affects the credit scores of the
individual entrepreneurs resulting in difficulty in securing a loan (Servon et al., 2010).
According to Okpala (2012), minority entrepreneurs in the Lagos State do not
understand venture capital and tend to avoid using outside equity financing. Similarly,
indigenous populations also tend not understand equity financing and may be unwilling
to give up ownership to an outside party (Peredo & McLean, 2010). New entrepreneurs
may balk at giving up ownership of their company for cultural or personal reasons
(Peredo & McLean, 2010; Rubin, 2011). Others do not understand or agree with the

41
estimates of value and are unwilling to give up the percent of ownership that makes the
deal feasible for the investor (Amatucci & Swartz, 2011; Anshuman, Martin, & Titman,
2012). Ortiz-Walters and Gius (2012) determined that many minority entrepreneurs lack
knowledge on debt management to benefit a business. Entrepreneurship training
influences entrepreneurial capacity through affecting cultural and social norms (Diaz-
Casero, Hernandez-Mogollon, & Roldan, 2011); therefore, support programs educating
minorities about entrepreneurship could help alleviate challenges to business survival and
growth.
Support for minority business owners. Research on training and support
programs revealed positive results. Benson et al. (2011) found that business support
programs located in an area where a minority group lives increased business start-ups and
reduced poverty. The Lakota Fund provided microfinance loans requiring no collateral to
citizens to create businesses that, in turn, created jobs in the area (Benson et al., 2011).
Benson et al.’s results provide evidence that microfinance loans and small business
support can boost entrepreneurial endeavors, increase job creation, and reduce poverty
among groups with lower rates of entrepreneurship.
As more minorities succeed as entrepreneurs, new entrepreneurial networks will
grow (Rubin, 2011). New investors may arise from the pool of new entrepreneurial
network members to support nascent women and minority business owners (Rubin,
2011). The entrepreneurs who benefited from this support program can now provide
support to others in the area with entrepreneurial intentions, thereby, potentially reducing
the need for the government subsidized support office over time. Bates and Robb (2013)

42
showed that despite the growth of minority-owned businesses, challenges still exist. The
challenges faced by minority entrepreneurs may stem from different cultural or personal
background, and few studies have examined the differences in the business formation
process among different racial/ethnic groups (Liu, 2012; Peredo & McLean, 2010; Rubin,
2011). The cultural and personal background of NAs entrepreneurs may differ from that
of other entrepreneurs; therefore, different factors may contribute to entrepreneurship
decisions among NAs.
Entrepreneurship Among NAs
Entrepreneurship has not always been scarce among NAs. NAs traded the fruits of
their labors with other tribes and European settlers in the years preceding American
expansion westward (Miller, 2012). Miller (2012) explained that this system of trade
continued until the U.S. government removed NAs from their homelands and forced them
to give up their property. Miller noted that U.S. leaders in the early 1800s did not seem to
understand the property and economic systems of the NAs caused by the dissimilar
nature of the NA culture to the Euro-American culture. This misunderstanding or
indifference toward the NAs that resulted in their removal from their homelands
subsequently caused losses of tribal populations, higher unemployment, and little
entrepreneurial activity (Harmon, 2010; Miller, 2012). With no way to support their
families economically, NAs became dependent upon tribal or governmental assistance
(Miller, 2012).
Because of the poor health of tribes after their removal, many turned to
dependence upon government assistance (Miller, 2012). This dependence led to a cycle

43
of poverty. More than 20% of NAs live on one of the 310 NA Indian reservations
managed by the U.S. Department of the Interior’s Bureau of Indian Affairs (Benson et al.,
2011). Through 2011, unemployment rates reached 80% on the reservations compared to
an average of 6% in most other regions in the United States (Benson et al., 2011).
Household income on Indian reservations averages 75% lower than the U.S. average, and
poverty rates average 36%, which is three times the U.S. average (Benson et al., 2011).
Flynn, Duncan, and Evenson (2013) examined 2008 U. S. census information to establish
the low median annual income of $33,627 for NAs.
In other measures of socioeconomic position, less than 1% of NAs on reservations
earn bachelor’s degrees and 15% do not own a vehicle or a telephone (Frantz, 2010). The
lack of adequate water, sewage, and telecommunications infrastructure in NA
communities (Mathers, 2012) also perpetuates poverty and hinders progress. The external
factors that exist more prevalently in NA communities than in other areas hinder small
business creation, growth, and survival (Miller, 2012). Dayanim (2011) also found that
the resources available in a location affect firm survival. The resource challenge for NAs
living on reservations decreases their likelihood to start and grow businesses.
The socioeconomic status of NAs living off reservation is less dismal than the
status of those who live on the reservations but is still below U.S. averages. Overall NA
unemployment and poverty levels are twice as high as the national averages (Juntunen &
Cline, 2010; Mathers, 2012). Four percent of NAs earned a bachelor’s level degree as
compared to 27% of the general population (Association for the Study of Higher
Education, 2012). The dropout rate of American Indians, 36%, ranked higher than any

44
other U. S. minority group (Flynn et al., 2013). The lower education attainment rates by
NAs also diminished their chances of business success (van den Born & van
Witteloostuijn, 2013). An increase in entrepreneurial activity could improve the
socioeconomic outlook of NA communities as has occurred in other regions of the United
States (Miller, 2012). The outlook improvement could spur additional interest in business
formation.
Increased entrepreneurial activity spurred by tribal organizations offers greater
benefit than support from organizations not specifically focused on NAs. Dreveskraght
(2013) covered the fundamentals of NA economic development and how solar energy
could positively benefit reservations and tribal development without compromising
cultural values. The commitments of the U.S. presidential administration to NA economic
development offer funds to support endeavors in entrepreneurship and entrepreneurship
training (Dreveskracht, 2013; SBA, 2014b). Dreveskraght insisted that the key to
successful implementation of programs for NA economic development lies in the tribal
administration being in control rather than outsiders. Because of many past exploitation
and fraud attempts from outside business interests, tribal communities view outside
attempts at boosting the tribal economy skeptically (Dreveskracht, 2013). Dreveskraght
also emphasized the importance of tribal sovereignty to create capable institutions that
can sustain economic growth within a tribe. Consequently, efforts to assist in
entrepreneurial development of NAs must align culturally and come from trusted sources
or tribal organizations to be well received and effective.

45
Examining NA Entrepreneurship Using the EIQ
An exhaustive literature search provided a clear description of entrepreneurship,
the importance of entrepreneurship to the economy, the factors that contribute to
entrepreneurial intention, entrepreneurship training and assistance, and how these topics
relate to NA business ownership. Entrepreneurship involves forming a new business,
creating new products or services, and creating jobs, all of which stimulate the economy
(Nazir, 2012; Uddin & Bose, 2012). The importance of entrepreneurship and small
businesses to the economy has resulted in many research studies on the topic.
Of the research studies concerning the factors contributing to a decision to pursue
entrepreneurship as a career and start a new business, some employ qualitative methods
while others employ quantitative methods. Zellweger and Sieger (2012) completed a
qualitative, case study research project to explore the entrepreneurial orientation of long-
lived family-owned firms. Other researchers interviewed small business owners to
explore the factors contributing to entrepreneurship (Abduh et al., 2012; Bauer, 2011).
Furthermore, Gerba (2012b) explored curriculum and approaches to teaching
entrepreneurship. Gerba found that experiential learning fostered venture creation
aptitude and skills. These qualitative studies provide textual information to aid in
understanding of different entrepreneurial contributing factors for women, students, and
different nationalities but not NAs.
Other researchers concerned with the field of entrepreneurial intention utilized
quantitative methods to conduct their research. The entrepreneurial attitudes orientation
(EAO) survey builds upon Shapero and Sokol’s entrepreneurial event model (SEE) with a
46
focus on perceived feasibility and perceived desirability as contributing factors to a
decision to start a business (Wurthmann, 2013). Gibson et al. (2011) employed the EAO
survey instrument to compare the entrepreneurial intention of community college
students to 4-year college students. Wurthmann (2013) compared propensity toward
innovation with EAO results from business students to compare attitude toward
innovation with attitude toward starting a business. The EAO and SEE do not align as
closely as the EIQ with the research goals of this study because of their lack of focus on
the influence of network participants in deciding to start a business.
While some scholars examined push, pull, and other factors that influence a
person’s decision to pursue entrepreneurship rather than other career choices, the strong
linkage between intention and behavior warrants a research approach inclusive of
entrepreneurial intention (Bauer, 2011; Elmuti et al., 2012; Liñán & Chen, 2009;
Mobaraki & Zare, 2012). The decision to use an entrepreneurial intention approach using
Liñán and Chen’s (2009) EIQ to answer the research questions stemmed from the
literature review. During the literature review, I explored other frameworks. The
entrepreneurial event model lacked an element that considered the influence of culture on
a person’s decisions to start a business (Uygun & Kasimoglu, 2013).
The TPB included a subjective norms variable to measure the effect of culture
(Iakovleva et al., 2011). Furthermore, the variables included in the TPB dominate the
literature with wide acceptance and credibility for studies of entrepreneurial intention
(Mobaraki & Zare, 2012). By examining the results of the EIQ instrument completed by
NA small business owners, I uncovered information about the likelihood that attitudes

47
toward entrepreneurship, subjective norms, and perceived behavioral control predict
small business success among NAs.
This study utilized the EIQ as the instrument for data collection. Liñán and Chen
(2009) developed the EIQ in hopes of standardizing entrepreneurial intention
measurement to allow for meaningful comparisons across multiple research studies
performed by scholars across the world. Liñán and Chen utilized the EIQ to compare
entrepreneurial intention scores between Spanish and Taiwanese university students.
Liñán, Urbano, et al. (2011) then used the EIQ to study regional variations of
entrepreneurial intention in Spain. Gerba (2012a) used the EIQ in Africa to study the
effect of entrepreneurship instruction on entrepreneurial intention.
Do Paço et al. (2011) found that subjective norms do not influence entrepreneurial
intention as strongly among 14 and 15 year old study participants using the EIQ. Each of
these uses of the EIQ supports the utilization of the EIQ for studies involving multiple
different ages and locations of groups (Liñán, Urbano, et al., 2011), yet none of the
documented studies examined these factors among NAs. The EIQ offers the ability to
capture information relating to all three elements of the TPB, the theoretical framework
guiding this study.
Elements of the TPB guided the creation of the research questions for this study
(Iakovleva et al., 2011). The first element of the TPB is a person’s attitude toward
starting a business (Liñán & Chen, 2009). The responses from five EIQ questions
averaged to create the attitude variable (Liñán, Urbano, et al., 2011). The average of three
EIQ responses combined to create the subjective norms variable that measures the

48
influence of others on entrepreneurial decisions (Liñán, Urbano, et al., 2011).
The average of another seven question responses combined to create the
perceived behavioral control variable (Liñán, Urbano, et al., 2011). I compared these
variables with the success of each NA-owned business. The EIQ elicited the responses
necessary to answer the research questions of the study (Iakovleva et al., 2011). Other
survey instruments exist similar to the EIQ; however, the similar instruments do not elicit
the responses required to answer the research questions in this study (Iakovleva et al.,
2011). Section 2 contains detailed information concerning the research approach and
participants.
Transition and Summary
In Section 1, I called attention to the contributions of new business formation on
the economy. Some studies have addressed different aspects of entrepreneurship and
small business success and failure, but few studies address NA businesses despite the
disparity in the number of businesses started and owned by NAs in comparison to others
in the United States (Franklin et al., 2013; MBDA, 2014; Stewart & Pepper, 2011). The
purpose of this study was to describe the factors related to NA business formation and
success by surveying successful NA business owners. I applied a quantitative
correlational methodology to examine the relationships, if any, between attitudes toward
entrepreneurship, subjective norms, perceived behavioral control, and business success.
The theoretical framework, Ajzen’s (1991) TPB, provides guidance for the analysis of
factors contributing to the decision to start a business.
Entrepreneurship adds value to societies. First, entrepreneurship stimulates

49
economic growth (Hitt, Ireland, Sirmon, & Trahms, 2011). Additionally,
entrepreneurship provides opportunities for people to improve their employment
situation, pursue personal interests, and upgrade their income and social status while
providing jobs to others (Bauer, 2011; Neumark et al., 2011; Omar, 2011). The SBA
supports small businesses through online resources, local support offices, and the SDB
program to assist disadvantaged businesses (Fernandez et al., 2012; Mars & Ginter,
2012). Despite the appeal and support available, NAs lag other groups in new business
formation and business growth (MBDA, 2014; Stewart & Pepper, 2011). Liu (2012)
called for additional research on the factors that contribute to new venture creation
among minority groups. NAs compose 1.5% of the U.S. population (MBDA, 2014). This
study might address a gap in business practice regarding the likelihood that attitudes
toward entrepreneurship, subjective norms, and perceived behavioral control predict
small business success among NAs.
In Section 2, I included a detailed description of the role of the researcher, study
participants, research methodology, population, sampling criteria, data collection
instruments and techniques, data analysis, and reliability and validity measures. Section 3
includes a presentation of study findings, explanation of how the findings apply to
professional practice, and a discussion concerning the implications for social change.
Additionally, I offered recommendations for future actions and further study and
reflected on the research process and experiences.

50
Section 2: The Project
NAs engage in entrepreneurship at lower rates than other demographic groups
within the United States despite widespread agreement on the benefits of
entrepreneurship (Franklin et al., 2013). I explored the gap in business practice related to
NA venture creation and business success. By surveying NA business owners and
performing statistical analyses of the resulting survey data, I examined the relationships
between attitudes toward entrepreneurship, subjective norms, perceived behavioral
controls, and business success. This section of the study includes a description of (a) the
purpose of the research study, (b) my role as the researcher, (c) the participants, (d) the
research method and design, (e) the ethical treatment of the participants and data, (f) data
collection and analysis, and (g) the reliability and validity of the data.
Purpose Statement
The purpose of this quantitative correlational study was to examine the likelihood
that NA attitudes toward entrepreneurship, subjective norms, and perceived behavioral
control predict small business success. Independent variables included those that
compose the theory of planned behavior: (a) attitudes toward entrepreneurship, (b)
subjective norms, and (c) the entrepreneur’s perceived behavioral control of the venture
creation process (Liñán & Chen, 2009). A positive profit in the previous business year
constituted the dependent variable: business success (Owens et al., 2013).
The study population included approximately 550 business owners registered with
a single NA tribe’s small business office in the South Central region of the United States.
NA business owners are an underdeveloped source of entrepreneurialism and are rarely

51
studied (Franklin et al., 2013). Findings might contribute to social change in a rarely
studied population by offering insight into the relationship between entrepreneurial
intention and small business success leading to job creation and innovative new products
and services.
Role of the Researcher
My involvement as the researcher included the selection of the survey instrument,
delivery of the survey via email or postal mail, and analysis of the survey data. Liñán,
Urbano, et al. (2011) used the EIQ, the survey instrument selected for this research study,
to collect data related to cultural influences on entrepreneurial intention. I modified the
survey instrument, with permission from the author (see Appendix B), with wording
appropriate to the NA population to prepare the survey for use in this study. Members of
the tribal business support office of the targeted population verified that this language
was appropriate for the participants (H. Williams, personal communication, March 24,
2014).
After acquiring approval for the study, I transferred the survey questions to an
online survey instrument hosted on SurveyMonkey.com® for use with participants with
access to email and the Internet. Those business owners without a listed email address in
the business registry received a paper version of the survey instrument. Dodou and
Winter (2014) found no differences in a meta-analysis of online and offline survey
responses. Distribution of the survey to participants included no plans for in-person
contact, as survey distribution occurred via email and postal mail invitations (see
Appendices C & D). All business owners whose contact information was published on

52
the tribal public business registry website received an invitation to participate.
Survey responses were collected from the SurveyMonkey.com® website after the
initial 2-week survey window had closed. After the 2-week survey window, not enough
participants had responded to meet sample requirements; a reminder email was sent via
SurveyMonkey.com®. By using unique links in SurveyMonkey.com®, reminder emails
went only to invitees who had not yet responded (see Appendix E). Similarly, single
phone call reminders went out to 35 survey recipients who had yet to respond via listed
phone numbers on the public NA business registry website (see Appendix F). After the
email reminder and phone call reminders, 79 participants had completed either the online
or the paper survey. After the required sample had responded, I combined the online
responses and the paper-based responses in a password-protected Excel® spreadsheet for
data analysis.
As the director of an entrepreneurship program at a university, I have studied
entrepreneurial intention only among students. Moustakas (1994) indicated that
researchers must recognize potential for bias. To avoid the potential for bias in this study,
the population selected did not include students.
My responsibility in this study was to ensure that principles outlined in the
Belmont Report were upheld. The Belmont Report protocol calls for respect for persons,
beneficence, and justice in the selection of participants (Manasanch et al., 2014).
Beneficence refers to a researcher’s ability to maximize benefit while minimizing risks
(Annoni, Sanchini, & Nardini, 2013; C. R. Quinn, 2015). For ethical guidance
compliance, I completed the online course entitled Protecting Human Research
53
Participants earning certificate number 1079401 (see Appendix G).
Participants
Participants in the study received invitations via email or postal mail (see
Appendices C & D). The small business support center for the tribe, which is located in
the South Central region of the United States, maintains a listing of all businesses owned
by tribal members. This listing resides on a publicly available website and contains all
necessary contact information for the study. A tribal procurement officer granted
permission for the use of the information for this study (see Appendix H).
Each of the business owners who had an email address on the list received an
email invitation to participate in the online survey (see Appendix C). The email invitation
included a brief explanation of the study and an individual link to the survey to ensure
that participants did not answer questions multiple times. Similarly, those on the list
without an email address received a postal mail invitation to complete the survey (see
Appendix D). The participation package included the survey and an informed consent
document. Paper surveys included sequential numbering to prevent duplication of survey
submissions from a single participant or from others outside the invited members of the
business registry. Participants returned survey documents in an included, postage-paid
return envelope. Dodou and Winter (2014) confirmed that response rates of online and
paper surveys are similar and do not lead to response bias. Similarly, researchers in
numerous fields studying various age groups found no variance between online and paper
surveys (Davidov & Depner, 2011; Perrett, 2013; Raghupathy & Hahn-Smith, 2013).
Furthermore, Fang, Wen, and Prybutok (2014) confirmed the lack of variance among

54
paper, online, and social media data collection.
The selection of participants for this study involved purposive sampling of NA
business owners. Purposive sampling requires knowledge of the population and
participants to reach the required sample size (Barratt, Ferris, & Lenton, 2015).
Additionally, a purposive sampling method allows selection based on a participant’s
relevance to the research (Orser, Elliott, & Leck, 2011). The majority of the participants
live in the South Central region of the United States. A few participants with ties to this
region who participate in tribal small business activities received an invitation to
participate. The tribal registry identifies 550 independent businesses owned or founded
by tribal members (H. Williams, personal communication, March 24, 2014). The business
must be at least 51% owned by a citizen of the tribe for listing in the registry (H.
Williams, personal communication, March 24, 2014).
The email invitation shown in Appendix C and the postal mail invitation shown in
Appendix D list the data security measures and include the informed consent language.
By clicking the link to participate in the email (see Appendix C), participants were able to
review the informed consent document featured in Appendix I. Upon completion of the
informed consent document, the participants gained access to an online version of the
survey shown in Appendix A. Failure to complete the informed consent document
terminated the survey. The informed consent document was included in the envelope
with the postal mail invitation and survey instrument for those on the business registry
list without an email address (see Appendix J). The postal mail invitation included

55
language guiding the participants to read and retain the informed consent document
before completing and returning the completed survey (see Appendix D).
Research Method
After framing research questions, the researcher must determine which method
can best answer those questions (Case & Light, 2011). The method chosen by a
researcher dictates the actions taken during data collection and analysis (Martin,
Surikova, Pigozne, & Maslo, 2011). Qualitative research involves an attempt to improve
the understanding of patterns of behavior or responses (Moustakas, 1994). Using a
qualitative approach, researchers collect data such as words and phrases from interviews
and observations (Moustakas, 1994). Qualitative research methods enable researchers to
seek a subjective understanding of the topic. In contrast, quantitative research involves
the use of deductive reasoning, an objective approach that results in consistency of
measurement (Patterson & Morin, 2012). Positivist researchers call for a method to
collect quantitative data that produces measureable results from which a researcher can
draw conclusions or determine relationships (Cohen et al., 2003; Cole et al., 2011).
Mixed methods researchers employ both qualitative and quantitative research methods
(Östlund, Kidd, Wengström, & Rowa-Dewar, 2011).
The goal of this research study was to examine the likelihood that attitudes toward
entrepreneurship, subjective norms, and perceived behavioral control predict NA small
business success. Consequently, a quantitative research method aligned with the research
question and produced measurable results from which conclusions could be drawn.
Though a qualitative method could allow for a subjective understanding of a research

56
topic, a qualitative method would not facilitate the discovery of generalizable results
(Cole et al., 2011). A mixed methods approach would have complicated the scope of this
study beyond the goal of examining the relationships between NA entrepreneurial
intention factors and NA business success (Östlund et al., 2011). A quantitative method
was the best choice for a study addressing the relationships of TPB elements of a person
of NA heritage choosing to pursue entrepreneurship, based on alignment of the method
with this study’s goals.
Research Design
I used the correlational research design to analyze data collected from surveys
completed by NA business owner participants. A correlational design facilitates
examination of the relationships between independent variables for predictive or
explanatory purposes (Cohen et al., 2003; Welford, Murphy, & Casey, 2012). Other
quantitative designs, quasi-experimental and experimental, involve a goal of establishing
cause and effect (Cronholm & Hjalmarsson, 2011). Cantrell (2011) and Tabachnick and
Fidell (2013) illustrated differences between a correlational design and experimental
designs as the lack of manipulation of the independent variable and no random
assignment to groups in a correlational study as opposed to an experimental study. Quasi-
experimental designs differ from experimental designs by allowing nonrandom
assignment of individuals in the research study (Venkatesh, Brown, & Bala, 2013). With
no control over any of the variables included in this research study, neither an
experimental nor a quasi-experimental design proved feasible.
Castellan (2010) listed other nonexperimental designs of descriptive and ex post
57
facto approaches. However, neither a descriptive nor an ex post facto approach includes
design elements for the examination of relationships among data. I chose a correlational
design for this study because the purpose was to examine possible relationships between
entrepreneurial intention factors and small business success among NAs.
Population and Sampling
The population for this study included NA business owners in the South Central
region of the United States. I included a purposive sample of business owners from a
tribe in this area to examine the relationship between entrepreneurial intention factors and
small business success among NAs. Each of the business owners listed on the tribe’s
public registry website who provided an email address received an email invitation to
participate in the survey (see Appendix C). Similarly, each of the business owners listed
without an email address received a postal mail invitation (see Appendix D). In addition
to providing information pertinent to the research topic, I planned to share a summary of
the research findings with all invited participants of the study.
I considered both probability and nonprobability sampling procedures for this
study. A probability sampling method would give every NA business owner the
opportunity to participate through random selection of a specified number of participants
(Daniel, 2012). Nonprobability sampling allows sampling when a researcher cannot
determine the total population at the time of sampling (Daniel, 2012). Membership and
inclusion on the tribal registry allows the business to be eligible for preferential treatment
in some tribal purchasing situations and to receive business support services from the
tribe. Members of the tribal business support offices verify NA ownership before adding

58
the business to the registry; all 550 businesses recorded are at least 51% owned by a NA
(H. Williams, personal communication, March 24, 2014). Because the tribal office asked
that all members of the registry receive an invitation to participate, a probability sampling
method was not required.
A purposive sampling approach offered the best plan for acquiring survey
responses from NA entrepreneurs. Petty, Thompson, and Stew (2012) stated that a
purposive sample is selected based on relevance to the study. A purposive sampling
procedure involves selecting members of the population based on their fit for the
purposes of the study (Daniel, 2012). Additionally, purposive sampling allows a
researcher to maximize the depth of the collected data for the purposes of the research
(Marais & Van Wyk, 2014).
Other nonprobabilistic sampling methods exist. Convenience sampling involves a
researcher choosing participants based on the ease of contact (Petty et al., 2012).
However, convenience sampling might not lead to a sample representative of the
population under investigation (Daniel, 2012). Snowball sampling builds upon a
convenience or purposive sample by asking participants to suggest others to participate
(Siciliano, Yenigun, & Ertan, 2012). However, snowball sampling opens the study to the
potential of obtaining data from participants who might not meet study requirements
(Hyysalo et al., 2015). Therefore, I employed a purposive sampling strategy for this
study.
The purpose of this study was to examine the relationship between entrepreneurial
intention factors and small business success among NAs. By employing a purposive

59
sampling procedure to survey NA small business owners, I collected data to examine the
relationship between the independent variables (the three elements of the TPB) and
business success. In addition, the choice to use purposive sampling in this study affirmed
the tribal office’s desire to extend an invitation to all registry members for inclusion in
the study.
I utilized the formula provided by Tabachnick and Fidell (2013) to calculate the
appropriate sample size. Tabachnick and Fidell stated that the sample size should exceed
50 + 8(m), where m = the number of predictor variables. This study included three
independent variables. Therefore, 74 or more samples (50 + 8(3) = 74) would be required
for the study. To give every member on the tribal registry the opportunity to participate,
all 550 members listed received an invitation. Participants returned 79 completed
surveys; therefore, a 14.4% response rate was achieved.
Ethical Research
According to Wester (2011), the researcher assumes the responsibility to maintain
ethical standards in conducting research. Ethical practices include respect, beneficence,
and justice (Manasanch et al., 2014). I assured that the research design and
implementation for this study maintained high ethical standards to ensure the protection
of the survey participants and their responses. Additionally, the Walden institutional
review board (IRB) reviewed and approved (IRB Approval No. 06-30-15-0390849) the
study before the research was conducted (see Appendix K). IRB applications are
subjected to review for the principles of respect, beneficence, and justice for participants
(Kelly et al., 2013).
60
I sent invitations to participate in the survey via email or postal mail using
information published on a single tribe’s public business registry website (see
Appendices C & D). For those with a listed email address, the invitations included
language to explain that participation in the survey was voluntary. Voluntarism embodies
respect for persons and must be clear in informed consent documents (Enama et al.,
2012). Additionally, informed consent documents should explain data collection, storage,
and utilization clearly to participants (Griffith, 2014). If a person chose to participate in
the survey, the email link routed the participant to an online informed consent document
that included information regarding the research study and how data was collected,
stored, and utilized (see Appendix I).
If participants chose to continue to the survey after reviewing and electronically
signing the informed consent document, they gained access to the survey. Participants
could choose to exit the survey at any time by closing the browser window. Participants
could also choose to withdraw their completed survey from the study by sending an email
request noting their desire to leave the study. Participants completed the surveys online
using the tools available from SurveyMonkey.com® at the convenience of the participants
and in privacy. Only I have the password to access the survey responses on
SurveyMonkey.com® and downloaded the responses after all surveys were complete.
For those without a listed email address, the letter they received in the mail
explained that participation in the survey was voluntary. If a person chose to participate
in the survey, the letter included language requesting that the participant read the
included informed consent document that included information about the research study

61
and how I collected, stored, and used the data (see Appendix I). Completion and return of
the survey implied informed consent. All research studies should include informed
consent documents to protect participants and document that the study is voluntary
(Johnsson, Eriksson, Helgesson, & Hansson, 2014). Participants then chose to complete
or not complete the paper survey after reviewing the informed consent document.
Participants could also choose to withdraw their completed survey from the study by
sending me a letter requesting to leave the study. A preaddressed, stamped envelope
accompanying the letter, informed consent document, and survey allowed participants to
return completed survey to my personal mailbox.
Corti (2012) stated that researchers should store data securely for future findings
verification. After the survey window closed, I developed an Excel® spreadsheet
containing the online and paper survey responses. Carpenter, Stoner, Mundt, and Stoelb
(2012) recommended replacing participant names with a unique number to ensure
privacy. Participant names were replaced with a unique number and the data input into a
statistical software package (SPSS®) for analysis. All participant and organizational
identities remain stored electronically on a password-protected external hard drive. Sole
access to all data resides with me as the researcher. The final study results included only
aggregate data to protect the identity of the participants. Furthermore, neither any
individual participant’s name nor the name of any business appeared in the study
documents. Study data will be destroyed after 5 years. Participants in the study did not
receive an incentive to complete a survey. However, participants received a summary of
the final research results.

62
Instrumentation
The EIQ, developed by Liñán and Chen (2009), allows researchers to collect
information aligning with the TPB, as well as demographic variables and a measure of
business success for comparison purposes. Block, Hoogerheide, and Thurik (2013);
Liñán, Rodríguez-Cohard, et al. (2011); and Liñán, Urbano, et al. (2011) used the EIQ to
collect entrepreneurial intention data. Extensive use of the EIQ with multiple different
cultures and ages shows that the EIQ survey instrument is a trusted and effective survey
instrument for collecting entrepreneurial intention data (do Paço et al., 2011; Gerba,
2012a; Liñán, Urbano, et al., 2011).
The EIQ includes groupings of questions. In addition to elements that directly
influence the three elements of the TPB, the EIQ includes demographic information
questions that may relate to personal attitudes toward entrepreneurship, subjective norms,
and perceived behavioral control (Liñán & Chen, 2009). In this study, Part 1 contained
the questions related to the TPB and Part 2 contained the demographic and informational
questions.
The format of the survey questions varies among short answer, yes or no, and
multiple-choice arrangements to fit each of demographic questions. The EIQ instrument
includes statements to which the participant responds on a 7-item Likert-type scale to
collect data on the three elements of the TPB (Liñán & Chen, 2009). A researcher
developed the Likert scale to measure attitudes (Boone Jr. & Boone, 2012). The use of an
ordinal scale, such as a Likert-type scale, allows participants to indicate the level of
agreement yielding more accurate results than with dichotomization (Iselin, Gallucci, &
63
DeCoster, 2013). The collection of data via Likert-type scales prompts participants to
report varying levels agreement or disagreement but without equally defined intervals
(Gadermann, Guhn, & Zumbo, 2012). I combined the responses to achieve an aggregate
score for each of the three elements of the TPB.
The study used the aggregate scores from each section to calculate descriptive
statistics to describe the attitudes toward entrepreneurship, subjective norms, and
perceived behavioral control of the sample. Boone Jr. and Boone (2012) suggested
combining multiple Likert-type scale items measuring the same construct into one
variable for data analysis. Hayes and Preacher (2014) referred to this process of
aggregating scores as collapsing multiple items into one variable. Aggregating scores
requires calculating the mean for each individual question then computing the overall
mean of the group of responses for a single variable (Smock, Ellison, Lampe, & Wohn,
2011).
I combined the mean scores of each of the Likert-type scale responses from Part
1, Item 1, to report the total mean to calculate scores for attitudes toward
entrepreneurship. Then, a similar process was performed for the three subjective-norm
items in Part 1, Item 2, and six perceived-behavioral-control items in Part 1, Item 3.
Appendix A includes a copy of the complete survey instrument.
A calculation of aggregate scores concerning the exposure of the participants to
other entrepreneurs and the participants’ knowledge of sources of assistance for
entrepreneurs provided data for population description and comparison purposes. These
questions are located in Part 2 of the survey instrument. Comparisons among

64
demographic data points offered additional descriptive information about the population
(Sousa & Rojjanasrirat, 2011; Tabachnick & Fidell, 2013).
A business success question in the survey included wording to request a yes or no
response for my inquiry regarding whether or not the owner reported profit on the
business income statement in the previous year. I employed correlational statistics to
examine the likelihood that attitudes toward entrepreneurship, subjective norms, and
perceived behavioral control predict business success. According to Tabachnick and
Fidell (2013), logistic regression allows the prediction of a dichotomous dependent
variable from a group of independent variables. The study utilized logistic regression to
examine the research question.
Liñán and Chen (2009) developed and validated the EIQ survey instrument. In the
development process, Liñán and Chen crosschecked the EIQ with previously developed
instruments for applying the TPB variables to entrepreneurship. After development, the
instrument’s psychometric properties were tested. Cronbach’s alpha reliability measures
ranged from .773 to .943 for each of the newly developed scales to measure the factors
affecting entrepreneurial intention (Liñán & Chen, 2009). Solesvik, Westhead, and
Matlay (2014) stated that the EIQ development team performed convergent validity
analysis using factor analysis and discriminant validity analysis by examining
correlations. Furthermore, Ferreira et al. (2012); Gerba (2012a); Liñán, Rodríguez-
Cohard, et al. (2011); Liñán, Urbano, et al. (2011); and Solesvik et al. (2014) cited the
reliability and validity of the EIQ. The results of the aforementioned analyses revealed
that the EIQ fulfilled both reliability and validity requirements.

65
I made minor modifications to utilize the EIQ in the current study. Because this
study focused on current entrepreneurs rather than students, attitudinal questions required
adaption to ask participants to reflect on their attitudes toward entrepreneurship before
they started their business. Howard (2011) demonstrated that persons could accurately
recall retrospective data and yield usable survey data. Additionally, a question about the
participant’s NA status was added to the survey instrument with permission from the
original developer of the EIQ (see Appendix B). Because this study is an empirical study
concerning the relationship between attitudes toward entrepreneurship, subjective norms,
perceived behavioral control, and small business success among NAs, the EIQ instrument
was an appropriate tool to collect data for the research study.
Data Collection Technique
A few businesses on the public tribal business registry website do not use email
for communication. These business owners received an invitation via postal mail using
the mailing address listed on the public tribal business registry website using a paper
version of the EIQ shown in Appendix A. Those businesses using email received an
email invitation with a link to a SurveyMonkey.com® online version of the EIQ shown in
Appendix A. Following completion of informed consent, volunteers for the study
participated by either completing the EIQ paper survey or an electronic version of the
EIQ survey instrument. Participants completed the survey privately through the
individual link in the invitation email or on the paper version of the EIQ received in the
postal mailed invitation. Appendix A includes a full listing of the survey questions.
Concerns about the dual modality of data collection are minimal. Using a dummy

66
variable to identify online versus paper survey responses, Dodou and Winter (2014)
found the effect of administration to have an effect of close to zero. Dodou and Winter
also found that sub-groups based on Internet connectivity, surveys including questions of
a sensitive-nature, and the possibility to skip answers or backtrack to answers were not
significantly different from zero either. Similarly, researchers in various fields studying
multiple age groups found no variance between online versus paper surveys (Davidov &
Depner, 2011; Fang, Wen, & Prybutok, 2014; Perrett, 2013; Raghupathy & Hahn-Smith,
2013). Furthermore, de Bernardo and Curtis (2013) supported the use of Internet surveys
with groups including participants over the age of 50 despite others’ assumptions of older
persons being less likely to have online access. Prior researchers confirmed that paper
and online data collection methods provide analogous data among populations ranging in
age from teen to older adult (de Bernardo & Curtis, 2013; Raghupathy & Hahn-Smith,
2013).
With the knowledge that paper and online surveys offer essentially no variance in
response data, I used both online and paper surveys to increase efficiency and decrease
costs. Although paper surveys increase the expense of conducting research because of
paper and postage costs, mailing paper surveys to those without email addresses
mitigated the reliability risks associated with Internet accessibility challenges, inadequate
response rates, and inaccurate populations (Chang & Vowles, 2013). Using online
surveys when possible not only reduces costs but also increases response time (Sharp,
Moore, & Anderson, 2011). Chang and Vowles (2013) and Sharp et al. (2011) found that
over half of online survey participants respond within 48 hours of a survey’s launch. In
67
addition to the time and cost advantages associated with online data collection, online
survey data allows for fewer data processing errors (Chang & Vowles, 2013).
All survey responses from both online and paper surveys remain confidential.
After collecting more than the required 75 responses, I downloaded the online responses
to a password-protected Excel® spreadsheet and keyed in the responses from the
completed paper surveys on the spreadsheet. Additionally, a dummy variable was
included to identify if the data in each record derived from an online or paper survey. A
unique number identified each group of data. Furthermore, I have exclusive access to the
data to ensure confidentiality. Raw data was uploaded into SPSS® for analysis. The
Excel® spreadsheet containing the raw data and the paper surveys will be stored securely
for 5 years, and then destroyed.
Data Analysis
The central research question guiding this study was the following: What is the
likelihood that attitudes toward entrepreneurship, subjective norms, and perceived
behavioral control predict Native American small business success?
The null and alternative hypotheses to be tested were as follows:
H0: Attitudes toward entrepreneurship, subjective norms, and perceived
behavioral control do not predict the likelihood of NA small business success.
H1: Attitudes toward entrepreneurship, subjective norms, and perceived
behavioral control do predict the likelihood of NA small business success.
The study used the inferential statistical analysis technique, logistic regression
analysis, to examine the research question. Logistic regression is the statistical technique
68
used when the research goal is to examine the likelihood of a set of independent variables
predicting a dependent variable (Streletzki & Schulte, 2013; Tabachnick & Fidell, 2013).
I found logistic regression appropriate for this study because the intent is to examine the
likelihood of the independent variables (attitudes toward entrepreneurship, subjective
norms, and perceived behavioral control) predicting the dependent variable, business
success, as measured by profit. Kawada and Yoshimura (2012) stated that logistic
regression is the appropriate statistical method for predicting a dichotomous dependent
variable, as is used in the study. The study included descriptive statistics, such as means
(M) and standard deviations (SD) for scale variables using results produced by IBM
SPSS® Version 22.0.
Because the goal of this study was to examine the likelihood of predicting a
dichotomous dependent variable, logistic regression provided the best option for
statistical analysis. Researchers employ regression analysis to examine relationships
among data absent from manipulation of variables (Field, 2013). Multiple regression
allows a researcher to assess the relationship between independent variables and a
continuous dependent variable (Cohen et al., 2003; Tabachnick & Fidell, 2013). When
independent variables are prioritized, hierarchical regression is appropriate (Tabachnick
& Fidell, 2013). In this study, I examined three ordinal independent variables determined
from participant Likert-type scale responses to determine the likelihood of predicting a
dichotomous dependent variable, business success. Both multiple and hierarchical
regression require a continuous dependent variable dismissing their applicability to the
research goal of this study.
69
After collecting the data for the independent and dependent variables, appropriate
data cleaning and screening procedures commenced before data analysis. Data cleaning
refers to the process of examining of data for outliers, normality, and missing data
(Osborne, 2013). A basic step of data cleaning is to proofread data entry for errors
(Osborne, 2013); therefore, I carefully proofread entered data for accuracy. Field (2013)
listed producing scatterplots to check for outliers and linearity as the first step in
conducting regression analysis. Garson (2012) stated that outliers, data points more than
three standard deviations away from the mean, resulting from data entry errors and
unintended sampling must be removed to avoid model error. Scatterplots created using
SPSS® allowed for outlier checks.
Data screening refers to testing data for normality. Normal data distribution
occurs in the shape of a bell curve (Garson, 2012). A researcher can observe normality by
creating a histogram of each variable (Field, 2013). Additionally, a Kolmogorov-Smirnov
D test run in SPSS® tests for normality (Field, 2013; Garson, 2012). However,
Tabachnick and Fidell (2013) stated that residual plots for regression created in SPSS®
that look normal eliminate the need for screening each individual variable for normality.
However, Tabachnick and Fidell stated that logistic regression has no assumptions for
normality or linearity.
The final data-cleaning step involves missing data. Missing data occurs when
participants do not respond or because of recording errors (Osborne, 2013). Randomly
missing data poses little threat; however, data missing in a nonrandom fashion may yield
meaning and cannot be ignored (Tabachnick & Fidell, 2013). Cohen et al. (2003)

70
suggested assigning a dummy variable to missing data since the missing data might
predict the dependent variable. Additionally, Tabachnick and Fidell (2013) recommend
that researchers repeat analysis with and without the missing data. Because none of the
79 completed surveys included missing data points for independent or dependent
variables, I determined that repeated analysis was unnecessary.
Field (2013) listed the four most important assumptions in statistical analysis as
(a) linearity, (b) normality, (c) homoscedasticity, and (d) independent errors. As
previously discussed, linearity and normality checks are not required for logistic
regression (Tabachnick & Fidell, 2013). Homoscedastic, homogeneity of variance, will
be tested using Levene’s test (Garson, 2012). If violations of homogeneity occur,
Tabachnick and Fidell (2013) recommend correction via transformation of the dependent
variable scores, but no violations of homogeneity occurred. I tested for independent
errors with a Durbin-Watson test looking for values less than one or greater than three
(Field, 2013). If a lack of independence of variables had existed, a Box-Cox
transformation in SPSS® could have been performed (Garson, 2012).
Study Validity
Quantitative research studies should utilize reliable and valid instruments to
conduct reliable and valid results (Drost, 2011). Researchers consider data reliable when
they achieve similar results when repeating the same measurement (Cohen et al., 2003;
Drost, 2011). According to Cohen et al. (2003), validity refers to the ability of an
instrument to measure what it is intended to measure. The following two subsections
include the reliability and validity information related to the EIQ.

71
Reliability
Liñán and Chen (2009) tested the reliability of the EIQ survey instrument. Each of
the instrument’s reliability properties was measured and resulted in Cronbach’s alpha
scores ranging from .773 to .943. Lown (2011) considered these scores to be high
measures of internal reliability of a survey instrument. The Likert-type scale used for
participant responses in the EIQ remains a reliable tool for collecting quantitative, closed-
end question responses (Sardar, Rehman, Yousaf, & Aijaz, 2011). The evidence in the
literature offers assurance that the EIQ is a reliable survey instrument for measuring
entrepreneurial intention factors (do Paço et al., 2011; Gerba, 2012a; Liñán, Rodríguez-
Cohard, et al., 2011; Liñán, Urbano, et al., 2011). I presented the same entrepreneurial
intention factor questions using the EIQ with Likert-type scale responses to all NA
business owner participants in the study and checked for completion on each returned
survey to ensure reliability.
Validity
Liñán and Chen (2009) considered internal validity measures throughout the
development of the survey instrument. The EIQ developers contemplated the structural
and content validities during development (Solesvik & Matlay, 2014). Moreover, the
designers ensured that the EIQ questions aligned with the TPB (Liñán, Rodríguez-
Cohard, et al., 2011).
After performing reliability checks, Liñán and Chen (2009) tested the EIQ for
external validity. The EIQ developers performed convergent validity analysis using factor
analysis and discriminant validity analysis by examining correlations (Solesvik et al.,

72
2014). Using factor analysis, they performed convergent validity analysis with a high
result of .912. Furthermore, Liñán and Chen used correlational analysis to test and
confirm discriminant validity for the EIQ. Each of the three independent variables
correlated more strongly with their own construct than the others (Liñán & Chen, 2009).
Personal-attitudes questions correlated with personal attitudes at .834, correlated with
subjective norms, and perceived-behavioral-control questions in a range between .242
and .363 (Liñán & Chen, 2009). Similarly, subjective-norms correlation scores were .766
with the correlations with questions on the other two constructs ranging between .152 and
.318 (Liñán & Chen, 2009). Finally, perceived-behavioral-control correlation scores were
.793 with the correlations with questions on the other two constructs ranging between
.164 and .447. Additionally, Do Paco et al. (2012); Ferreira et al. (2012); Gerba (2012a);
Liñán, Rodríguez-Cohard, et al. (2011); Liñán, Urbano, et al. (2011); and Solesvik et al.
(2014) cited the reliability and validity of the EIQ and each of the factors addressed on
the EIQ. By examining the results from each analysis, I confirmed that the EIQ fulfills
reliability and validity requirements.
Transition and Summary
The purpose of this study was to examine likelihood that attitudes toward
entrepreneurship, subjective norms, and perceived behavioral control predict NA
business success. The study included the process used for data collection, organization,
and analysis in Section 2. NA business owners responded via a modified EIQ survey
instrument during the data collection phase of the research process. The EIQ, as a survey
instrument for collecting entrepreneurial intention data, has endured reliability and

73
validity testing by the developers (Liñán & Chen, 2009; Liñán, Urbano, et al., 2011). I
utilized descriptive and correlational analyses for the survey data using SPSS® Version
22.0. The next section includes the results, analysis, and discussion of the findings.
Furthermore, Section 3 also includes how the results this study concerning NA
entrepreneurship may contribute to professional practice and social change. Finally, I
shared recommendations for future research and reflect on the research process and
experience.

74
Section 3: Application to Professional Practice and Implications for Change
The purpose of this correlational study was to examine the likelihood that NA
attitudes toward entrepreneurship, subjective norms, and perceived behavioral control
predict small business success. I presented the business problem and purpose of this
research study in Section 1. Section 1 also included the research question guiding this
study, the hypotheses, the nature of the study, and a review of the literature. Section 2
included detailed information regarding (a) quantitative analysis, (b) logistic regression,
(c) ethical considerations, (d) data collection, and (e) reliability and validity. Section 3
includes (a) an overview of the study, (b) a comprehensive presentation of the findings,
(c) application to professional practice, and (d) implications for social change. This
section concludes with recommendations for action and further study, and my reflections
on the research process.
Overview of Study
Though NAs compose 1.5% of the U.S. population, NAs own only 0.9%
(236,691) of businesses within the United States (MBDA, 2014). Although the U.S. SBA
and the U.S. Executive Offices have called attention to business creation among NAs
(SBA, 2014b), researchers have not examined the documented discrepancies between NA
venture creation and business success (Franklin et al., 2013). My study includes a survey
of NA small business owners to determine whether attitudes toward entrepreneurship,
subjective norms, and perceived behavioral control predict small business success.
Using logistic regression, I examined the correlations between the independent
variables and dependent variable for the research problem by testing the following

75
hypotheses:
H0: Attitudes toward entrepreneurship, subjective norms, and perceived
behavioral control do not predict the likelihood of NA small business success.
H1: Attitudes toward entrepreneurship, subjective norms, and perceived
behavioral control do predict the likelihood of NA small business success.
Based on the logistic regression analysis, the null hypothesis was supported.
Therefore, I could not accept the alternative hypothesis. Attitudes toward
entrepreneurship, subjective norms, and perceived behavioral control did not predict the
likelihood of NA small business success in this study.
Presentation of the Findings
The research question that guided this study was the following: What is the
likelihood that attitudes toward entrepreneurship, subjective norms, and perceived
behavioral control predict NA small business success? The study findings did not support
the alternative hypothesis and indicated conflicting results regarding the correlation
between the independent variables (attitudes toward entrepreneurship, subjective norms,
and perceived behavioral control) to predict the dependent variable (likelihood of NA
small business success).
The independent variables were based on the theory of planned behavior: (a)
attitudes toward entrepreneurship, (b) subjective norms, and (c) the entrepreneur’s
perceived behavioral control of the venture creation process (Liñán & Chen, 2009). A
positive profit in the previous business year constitutes the dichotomous dependent
variable: business success (Owens et al., 2013). Descriptive statistics for the variables

76
were calculated in SPSS® Version 22.0 after I determined that the data met all statistical
assumptions (see Table 2).
Statistical Assumptions Tests
I examined the data with regard to statistical assumptions for logistic regression
analysis. First, the data was proofread for entry errors. Finding no data entry issues, I
examined the data for missing values. Osborne (2013) recommended that the first step in
examining data is to proofread data for entry errors and missing data. Two missing data
points existed in the data: one point in the age field and one point in the years in business
field. However, the age and years in business data were collected only to describe the
sample and not for analysis; therefore, the missing values were ignored in calculating the
descriptive statistics.
Logistic regression analysis does not require linearity or normally distributed data
(Tabachnick & Fidell, 2013). However, the selection of a proper Levene’s test for
homogeneity of variance does require knowledge of the distribution (Nordstokke,
Zumbo, Cairns, & Saklofske, 2011). Homogeneity of variance, or homoscedasticity,
refers to the residuals at each level having the same variance (Tabachnick & Fidell,
2013). Violations of homoscedasticity invalidate confidence intervals and significance
tests in logistic regression (Field, 2013). Because the histogram indicated that the data for
the independent variables did not include normal distribution, I used a nonparametric
Levene’s test in SPSS® to test for differences in variances. A nonparametric Levene’s test
should be employed to test for homogeneity of variance when data is not normally
distributed (Nordstokke et al., 2011). Results for attitudes toward entrepreneurship,

77
subjective norms, and perceived behavioral control were not significant with p values of
0.38, 0.31, and 0.57, respectively. A p value less than 0.05 in a Levene’s test constitutes
significance (Field, 2013); therefore, I found no violation of homogeneity of variance.
Finally, I included an evaluation of statistical assumptions with a test for
independent errors using a Durbin-Watson test, which allows a researcher to verify a lack
of autocorrelation (Durbin & Watson, 1950). The result of the Durbin-Watson test for
study variables was 1.64. With a value between 1 and 3, no transformation of variables is
required (Field, 2013). With no transformation required, I concluded that study data met
all statistical assumptions.
Descriptive Statistics
Descriptive statistics allow a researcher to describe data in terms of numbers
(Tabachnick & Fidell, 2013). I collected data to describe the population and to address
the research question using the EIQ developed by Liñán and Chen (2009). Invitations to
participate went to the 550 NA businesses listed on a single tribe’s business registry list.
All participants received an invitation via email to an online version of the EIQ hosted on
Survey Monkey® or via postal mail with a paper copy of the EIQ. Seventy-nine business
owners responded; 66 respondents completed online surveys and 13 completed paper
surveys. Seventy-nine participants exceeded the required sample size of 75 and resulted
in a response rate of 14.36%. Table 2 includes statistics describing the sample. The
average participant age was 52.14 years, and the average business age was 16.63 years
with a median of 13 years.

78
Table 2
Descriptive Statistics for Population Description Variables
Min Max M SD N
Age in years 25 78 52.14 12.84 78
Years in business 1 99 16.63 15.64 78
For an additional description of the participants in the study, I included two
histograms to explain the distribution of participant ages and years in business. While the
average age was 52.14 years, the histogram in Figure 2 illustrates that most participants
were between the ages of 40 and 70 years. Similarly, Figure 3 includes a histogram
showing the number of years in business for study participants.
Figure 2. Histogram showing ages of study participants.

79
Figure 3. Histogram showing number of years in business for study participants.
Table 3 includes frequency and percentages for gender of participants.
Frequencies and percentages characterize the demographics of participants in a study
(Anderson, Sweeney, & Williams, 2015). Forty-eight males participated, accounting for
60.76% of the participants. Females accounted for 39.24% (N = 31) of the participants.
Table 3
Participant Gender Frequency and Percentages
Category Frequency Percent
Male 48 60.76
Female 31 39.24

80
I conducted a Cronbach’s alpha (α) measure of reliability for each composite
score. Cronbach’s alpha measures allow a researcher to measure the reliability of a scale
(Pallant, 2013). The reliability coefficients (α) of the three independent variables ranged
from 0.83 to 0.90. Field (2013) stated that the minimum standard for reliability should be
0.80. All three independent variables exceeded the minimum standard of 0.80. Table 4
includes the reliability coefficients (α) for the three independent variables.
Table 4
Reliability Coefficients (α) for Independent Variables (N = 79)
Cronbach’s α No. of Items
Attitudes Toward Entrepreneurship 0.90 5
Subjective Norms 0.83 3
Perceived Behavioral Control 0.90 6
Descriptive statistics data contains information to assist the reader of a study in
understanding the variables (Anderson et al., 2015). Table 5 shows the descriptive
statistics for the independent and dependent variables. The 79 participants responded to
five attitudes-toward-entrepreneurship questions on a 7-point Likert-type scale (M = 5.87,
SD = 1.40). Similarly, participants responded to three subjective-norms statements (M =
5.48, SD = 1.42). Additionally, participants responded to six perceived-behavioral-control
questions (M = 4.77, SD = 1.42).
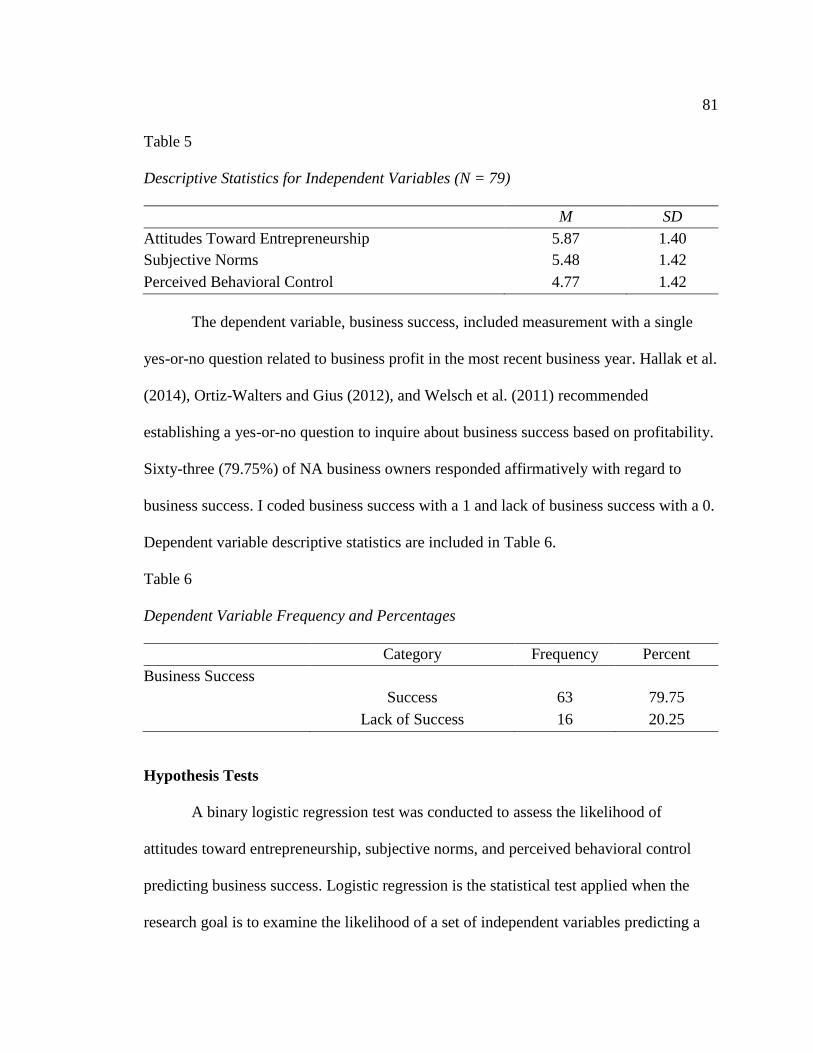
81
Table 5
Descriptive Statistics for Independent Variables (N = 79)
M SD
Attitudes Toward Entrepreneurship 5.87 1.40
Subjective Norms 5.48 1.42
Perceived Behavioral Control 4.77 1.42
The dependent variable, business success, included measurement with a single
yes-or-no question related to business profit in the most recent business year. Hallak et al.
(2014), Ortiz-Walters and Gius (2012), and Welsch et al. (2011) recommended
establishing a yes-or-no question to inquire about business success based on profitability.
Sixty-three (79.75%) of NA business owners responded affirmatively with regard to
business success. I coded business success with a 1 and lack of business success with a 0.
Dependent variable descriptive statistics are included in Table 6.
Table 6
Dependent Variable Frequency and Percentages
Category Frequency Percent
Business Success
Success 63 79.75
Lack of Success 16 20.25
Hypothesis Tests
A binary logistic regression test was conducted to assess the likelihood of
attitudes toward entrepreneurship, subjective norms, and perceived behavioral control
predicting business success. Logistic regression is the statistical test applied when the
research goal is to examine the likelihood of a set of independent variables predicting a

82
dichotomous dependent variable (Streletzki & Schulte, 2013; Tabachnick & Fidell,
2013). The predictor variables were attitudes toward entrepreneurship, subjective norms,
and perceived behavioral control. The dependent variable was business success.
To interpret results from the binary logistic regression test, I first reviewed the
Omnibus test of model coefficients from the SPSS® output. An Omnibus test of model
coefficients measures how well a model performs (Tabachnick & Fidell, 2013). Based on
the Omnibus test of model coefficients, the full model containing all predictors was not
significantly significant, 2 (3, N = 79) = 4.38, p = 0.22. Nonsignificant results from the
Omnibus test of model coefficients indicated that the tested model was not significantly
different than the null model (Tabachnick & Fidell, 2013). This nonsignificant result for
the study model indicated that the tested model was not superior to the null model for
distinguishing business success. In this study, the tested study model as a whole
accounted for between 5% (Cox and Snell R2) and 9% (Nagelkerke R2) of improvement
over the null model. Cox and Snell R2 and Nagelkerke R2 are two different pseudo R2 that
reflect the ratio of likelihood improvement over the null model (Field, 2013). As shown
in Table 7, none of the predictor variables significantly contributed to the model.
The confidence interval for the odds ratios (OR) each cross the value one. When
both the lower and upper values for the confidence interval are above one, then as the
predictor variable increases, the odds of a positive dependent variable increases (Field,
2013). An OR greater than one reflects the increase in odds for a dependent variable
outcome of one when the predictor variable increases by one unit (Tabachnick & Fidell,
2013). If the value of the OR is less than one, the odds for a dependent variable outcome

83
of 1 decreases with an increase in value by the predictor variable (Tabachnick & Fidell,
2013). With the 95% confidence interval overlapping the value one, I cannot confirm that
the predictor has a directional influence on predicting the dependent variable.
Table 7
Logistic Regression Predicting Likelihood of Business Success
SE Wald df p OR 95% C.I. for OR
Lower Upper
Attitudes Toward
Entrepreneurship
0.34 0.19 3.17 1 0.08 1.41 0.97 2.06
Subjective Norms 0.10 0.21 0.24 1 0.63 1.11 0.73 1.69
Perceived Behavioral
Control
0.05 0.23 0.05 1 0.82 1.05 0.67 1.66
(Constant) -1.38 1.49 0.86 1 0.35 0.25
A Hosmer and Lemeshow test of the full model with three predictor variables was
statistically different from the null model, 2 (8, N = 79) = 6.61, p = 0.58. The Hosmer
and Lemeshow test, the preferred goodness-of-fit indicator for logistic regression,
indicates good fit with a result greater than 0.05 (S. J. Quinn, Hosmer, & Blizzard, 2015;
Tabachnick & Fidell, 2013). Therefore, with conflicting goodness-of-fit indicators and
prediction efficiency, caution should be used when interpreting these results. Results
from different logistic regression tests may lead to varied conclusions requiring the reader
to display cautiousness when interpreting the predictive capacity of models (Mendard,
2002).
In logistic regression, another method used to evaluate the ability of independent
variables to predict the outcome is classification of cases (Tabachnick & Fidell, 2013).
Using the full model to classify each case using the independent variables from the

84
sample data set, 81.0% of the cases were classified correctly, with 98.4% of business
success cases and 12.5% of lack of business success cases predicted correctly. However,
the full model’s classification rate only exceeded the classification rate of the constant
model by 1.3%. A good model includes few cases of misclassification (Field, 2013).
With only 19% misclassification but only slight improvements over the null model in
classifications using the full model, the classification test confirms that results should be
interpreted with caution.
As shown in Table 8, binary logistic regression yielded conflicting results when
used to analyze the likelihood that attitudes toward entrepreneurship, subjective norms,
and perceived behavioral control predict busines success. Despite the Hosmer and
Lemeshow test yielding results indicating significance, the Omnibus test of model
coefficients resulted in a lack of significance for the full model. Additionally, not one of
the three predictors was significant individually. Furthermore, classification of cases
resulted in only minimal improvement over the null model. A researcher should apply
caution when making conclusions based on conflicting logistic regression analysis results
from different types of tests of model fit and predictive efficiency (Menard, 2002).
Without a majority of the logistic regression tests providing results to support the fit of
the model, I must fail to reject the null hypothesis.
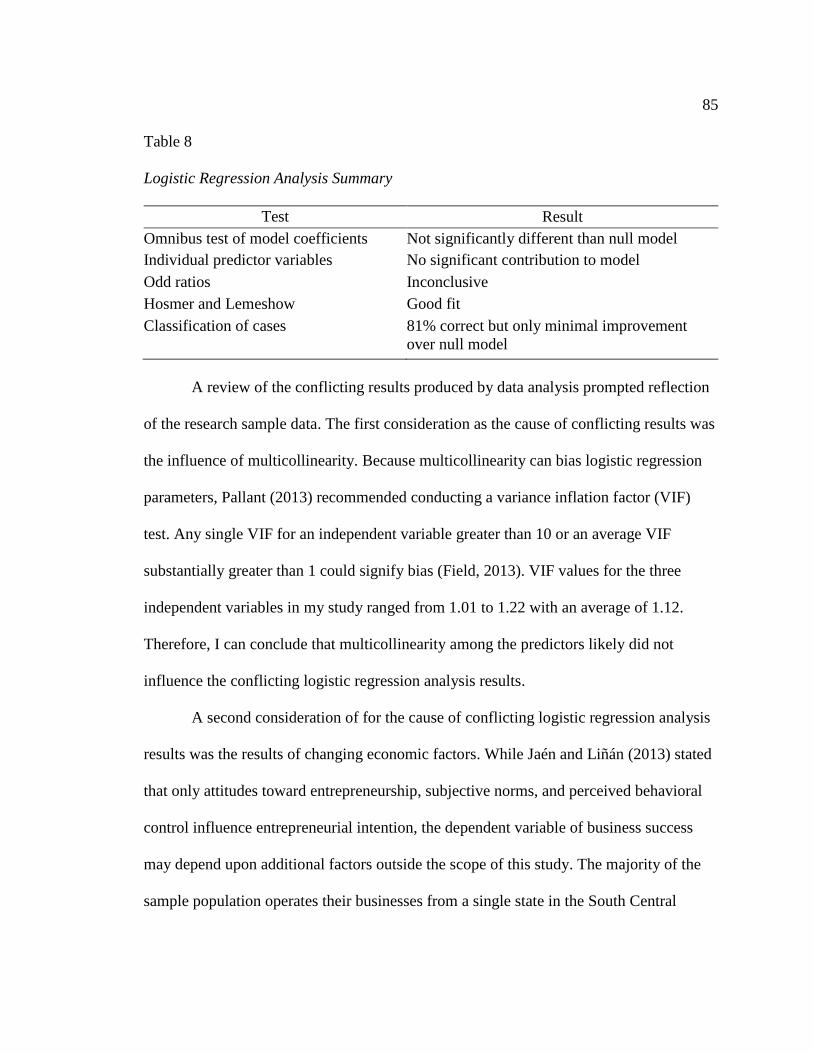
85
Table 8
Logistic Regression Analysis Summary
Test Result
Omnibus test of model coefficients
Not significantly different than null model
Individual predictor variables No significant contribution to model
Odd ratios Inconclusive
Hosmer and Lemeshow Good fit
Classification of cases 81% correct but only minimal improvement
over null model
A review of the conflicting results produced by data analysis prompted reflection
of the research sample data. The first consideration as the cause of conflicting results was
the influence of multicollinearity. Because multicollinearity can bias logistic regression
parameters, Pallant (2013) recommended conducting a variance inflation factor (VIF)
test. Any single VIF for an independent variable greater than 10 or an average VIF
substantially greater than 1 could signify bias (Field, 2013). VIF values for the three
independent variables in my study ranged from 1.01 to 1.22 with an average of 1.12.
Therefore, I can conclude that multicollinearity among the predictors likely did not
influence the conflicting logistic regression analysis results.
A second consideration of for the cause of conflicting logistic regression analysis
results was the results of changing economic factors. While Jaén and Liñán (2013) stated
that only attitudes toward entrepreneurship, subjective norms, and perceived behavioral
control influence entrepreneurial intention, the dependent variable of business success
may depend upon additional factors outside the scope of this study. The majority of the
sample population operates their businesses from a single state in the South Central

86
region of the United States. Oil production drives the economy of this state (Kang, Penn,
& Zietz, 2011). During 2015, many businesses experienced fluctuations in profitability
because of the economic downturn from falling oil prices (Fort, Haltiwanger, Jarmin, &
Miranda, 2013); therefore, business profits of the study participants could have been
abnormal during the study period. The degree of influence is stronger for firms that have
been in operation for less than 5 years (Fort et al., 2013); my study includes 15 businesses
that have been in operation less than 5 years accounting for 19% of the sample. With data
originating from an area heavily influenced by a decline in oil prices, the success of some
businesses could have been affected by the fluctuation in the economy rather than the
predictors.
Relating Findings to the TPB
Ajzen (1991) specified three attitudinal antecedents of intentions within the TPB:
(a) attitude toward the behavior, (b) subjective norms, and (c) perceived behavioral
control. I collected information aligning with the TPB as well as demographic variables
and a measure of business success to address the research question in this study using the
EIQ, developed by Liñán and Chen (2009). Data emerged regarding the likelihood that
attitudes toward entrepreneurship, subjective norms, and perceived behavioral control
predict small business success among NAs.
In this study, findings were consistent with previous research utilizing the TPB as
a theoretical framework. The combination of the three elements of the TPB may have
affected intention to start a business; however, the relationship to subsequent business
success was not supported. Attitudes toward entrepreneurship involve the desirability of

87
the outcomes of a behavior (Mobaraki & Zare, 2012). Subjective norms include the effect
a network of influencers has on an individual’s plans (Iakovleva et al., 2011). Moreover,
perceived behavioral control exists when the participant feels confident in exercising the
skills and knowledge required to be successful (Fretschner & Weber, 2013). As shown in
Table 7, the three TPB elements did not significantly contribute to the model.
Additionally, the 95% confidence interval overlapped the value one leading to the
conclusion that the predictors may not have a directional influence on predicting the
dependent variable.
According to the TPB, only three elements influence intention; therefore, any
other variable proposed would only influence the outcome of the three antecedents to
intention (Jaén & Liñán, 2013). Conversely, Carey et al. (2010) found that the TPB
elements do not correlate well with business owners who own and operate lifestyle
businesses, where owners seek to maintain a comfortable income rather than to grow, to
those managed by growth-oriented owners, who continually strive for business growth.
Additionally, Zanakis et al. (2012) confirmed that many entrepreneurs start businesses for
reasons of work flexibility and independence rather than wealth or growth. Wright and
Stigliani (2012) added that some business leaders make decisions to benefit the family
owners rather than to grow the firm. The conflicting logistic regression results might be a
result of some participants’ choices to operate lifestyle or family businesses with no
lower regard for profitability.
Relating Findings to the Literature
The findings in this study did not allow the rejection of the null hypothesis:

88
Attitudes toward entrepreneurship, subjective norms, and perceived behavioral control do
not predict the likelihood of NA small business success. As discussed in the previous
section, a model using the combination of the three independent variables from the TPB
accurately predicted 81.0% of cases of business success. However, readers should
interpret results with caution because of conflicting results from binary logistic regression
tests. Considering the SBA reported 50% failure rate among new businesses (SBA,
2014a), Soriano and Castrogiovanni (2012) used business profit as an indicator variable
depicting business survivability and success. Conclusions from the tested model
developed for this study provide information that could guide business decisions that may
increase business success among NA business owners; further research should be
conducted to confirm results.
The three elements of the TPB illustrated in Figure 1, attitudes toward
entrepreneurship, subjective norms, and perceived behavioral control, did not
significantly predict the likelihood of business success in the study results. Table 7 shows
the regressions statistics associated with each individual element. The results indicate that
attitudes toward entrepreneurship may be the most influential of the predictor variables
but is not significant on its own. The OR for attitudes toward entrepreneurship, 1.41,
indicates that for every unit increase in attitudes toward entrepreneurship, the business is
1.41 times more likely to exhibit business success. However, an examination of the 95%
confidence interval of the odd ratio shows a small chance that an increase in attitudes
toward entrepreneurship might decrease the likelihood of business success. The strong
influence of attitudes toward entrepreneurship aligns with findings in previous research.

89
The effect of attitudes toward entrepreneurship on venture creation and success is
recognized among researchers (Gibson et al., 2011; Moi et al., 2011; Solesvik, 2013).
Additionally, many studies regarding current and future entrepreneurs include literature
on attitudes toward entrepreneurship as an influential element even when not using the
TPB (Moi et al., 2011; Petridou & Sarri, 2011; Thompson et al., 2010; Wurthmann,
2013).
Consistent with the findings of Franklin et al. (2013), this study confirmed that
subjective norms influence business start-up and success. Because some cultures or
groups place more or less value on entrepreneurship, the influence of subjective norms
varies by population (Ajzen, 1991; Schlaegel et al., 2013). Shoebridge et al. (2012) added
that spouses and extended family exerted influence on entrepreneurial decisions among
indigenous populations. Franklin et al. noted that norms are more favorable among NA
tribes that are more favorable toward entrepreneurship and that have a more
transformational tribal leadership. Franklin et al. described attributes similar to those of
the tribe included in this study. These findings support the notion that subjective norms
influence business start-up and success. However, the direction of influence by subjective
norms identified in this study was non-confirmable.
Similar to the concept of self-efficacy, perceived behavioral control entails
individuals’ perceptions of how well they can perform or handle a situation (De Clercq et
al., 2011). Further, Bullough et al. (2014) described entrepreneurial self-efficacy as the
level of confidence in carrying out the duties required to start-up and manage a business.
Perceived behavioral control, the third element of the TPB shown in Figure 1, does not

90
significantly predict business success on its own.
Applications to Professional Practice
This research may be valuable to NA business owners, prospective business
owners, nascent entrepreneurs, and business support organizations. The results of the data
analysis in this study showed that attitudes toward entrepreneurship, subjective norms,
and perceived behavioral control might combine to predict the likelihood of business
success. However, the results from binary logistic regression tests of the model were
conflicting causing the need for caution when interpreting results. The results from this
study may provide knowledge to increase business success rates; however, I recommend
further analysis.
Business success, as measured by profitability, may increase for NA business
owners armed with the new knowledge from this study. Vilkinas et al. (2012) found that
business owners rank making a profit as the most important measure of business success.
Moreover, Gorgievski et al. (2011) discovered that business profit ranked high among
business owners driven by both economic and social motivations. The SBA (2014a)
reported that sustainability rates remain consistent with 50% of firms surviving 5 years or
more and 33% surviving 10 years or more. The mean age in years of NA firms
participating in this study was 16.63 years with a median age of 13 years. With
knowledge obtained from the study findings of well-established businesses, current and
aspiring business owners may learn valuable information to improve the probability
business success.
Armed with the knowledge that attitudes toward entrepreneurship, subjective

91
norms, and perceived behavioral control may combine to predict the likelihood of
business success, NA business support offices may be able to exert positive influences on
attitudes toward entrepreneurship, subjective norms, and attitudes toward
entrepreneurship among NA entrepreneurs. While the influence of subjective norms
varies by culture (Ajzen, 1991; Schlaegel et al., 2013), Franklin et al. (2013) confirmed
that NA government structure and support services could offer a positive influence.
Liñán, Santos, and Fernández (2011) added that positive subjective norms encourage
positive attitudes toward entrepreneurship. Entrepreneurship training, entrepreneurial
experiences, and entrepreneurial role models or mentors positively affect the perceived
behavioral control component of entrepreneurial intention (Pittaway et al., 2011; Rideout
& Gray, 2013; Sánchez, 2013; Studdard et al., 2013). Therefore, NA business support
organizations may positively influence NA business success by offering training or
mentorship programs for nascent entrepreneurs and business owners.
Implications for Social Change
From the findings in this study and the literature review, awareness that attitudes
toward entrepreneurship, subjective norms, and perceived behavioral control may predict
the likelihood of business success among NA businesses may help more business
succeed. However, readers must interpret findings from this study with caution because
of conflicting logistic regression test results. New business owners stimulate economies
by starting and growing businesses that create jobs and by providing innovative products
and services (Liñán, Rodríguez-Cohard, et al., 2011). With the knowledge that
entrepreneurs create 86% of new jobs (Neumark et al., 2011), tribal leaders could assist

92
NA communities by offering support for nascent entrepreneurs and business owners.
Armed with knowledge regarding the likelihood that attitudes toward
entrepreneurship, subjective norms, and perceived behavioral control may predict small
business success, support services for NAs might result in more NA business success.
NA’s motivation to start and run successful businesses, as was the norm before Euro-
American contact, changed after the removal of NAs from their homelands (Miller,
2012). Within the United States, NAs only own 0.9% of businesses despite composing
1.5% population (MBDA, 2014). Understanding contributing factors for NA business
success may help those who plan support and training programs designed to encourage
and assist NAs in their quest to start a business. Because of analysis results that do not
allow confirmation of the predictive capacity of the model including the independent
variables, readers should interpret results with caution. Nevertheless, the study adds to
information regarding a gap in business practice concerning the potential relationship
between the predictors and business success that might benefit business owners.
An increase in business ownership and business success rates among NAs might
decrease unemployment and improve prosperity and overall wellness in the NA and
surrounding community. Revenue and employment generated by NA businesses
accounted for 0.3% of total U.S. business revenue and employment (MBDA, 2014).
Unemployment among NAs reached a 12.3% in 2012, compared to 8.1% for the general
population (U.S. Bureau of Labor Statistics, 2013). Unemployment rates exceed 15% on
222 NA reservations and exceed 50% on 13 NA reservations (U.S. Census Bureau,
2013). More than 20% of NAs live on one of 310 NA reservations where average
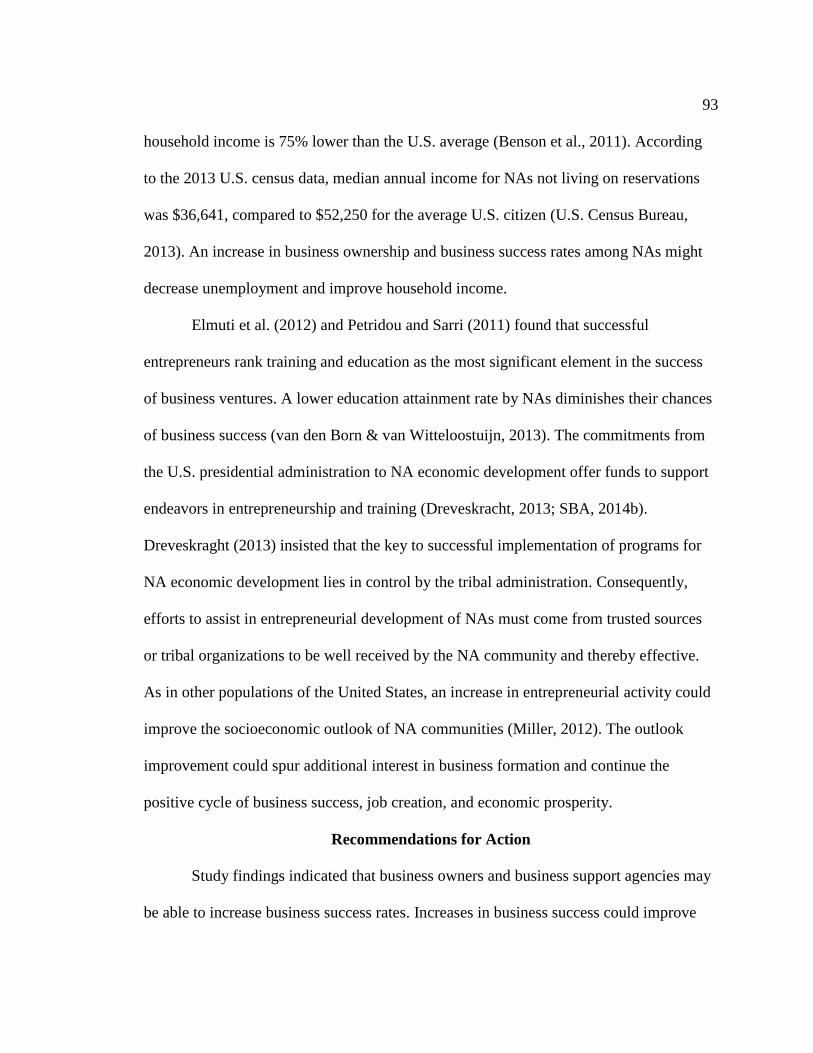
93
household income is 75% lower than the U.S. average (Benson et al., 2011). According
to the 2013 U.S. census data, median annual income for NAs not living on reservations
was $36,641, compared to $52,250 for the average U.S. citizen (U.S. Census Bureau,
2013). An increase in business ownership and business success rates among NAs might
decrease unemployment and improve household income.
Elmuti et al. (2012) and Petridou and Sarri (2011) found that successful
entrepreneurs rank training and education as the most significant element in the success
of business ventures. A lower education attainment rate by NAs diminishes their chances
of business success (van den Born & van Witteloostuijn, 2013). The commitments from
the U.S. presidential administration to NA economic development offer funds to support
endeavors in entrepreneurship and training (Dreveskracht, 2013; SBA, 2014b).
Dreveskraght (2013) insisted that the key to successful implementation of programs for
NA economic development lies in control by the tribal administration. Consequently,
efforts to assist in entrepreneurial development of NAs must come from trusted sources
or tribal organizations to be well received by the NA community and thereby effective.
As in other populations of the United States, an increase in entrepreneurial activity could
improve the socioeconomic outlook of NA communities (Miller, 2012). The outlook
improvement could spur additional interest in business formation and continue the
positive cycle of business success, job creation, and economic prosperity.
Recommendations for Action
Study findings indicated that business owners and business support agencies may
be able to increase business success rates. Increases in business success could improve

94
business decisions and contribute to social change. The knowledge that attitudes toward
entrepreneurship, subjective norms, and perceived behavioral control may predict the
likelihood of business success may provide information to improve business success
rates. To confirm these findings, researchers should conduct additional research.
Based on this study, NA business owners may increase their likelihood of success
by learning more about attitudes toward entrepreneurship, subjective norms, and
perceived behavioral control. Attitudes toward entrepreneurship refer to the level of
positive or negative valuation of the advantages and disadvantages of venture creation
(Liñán & Chen, 2009). Subjective norms incorporate the effect a network of influencers
has on a person’s plans (Mueller, 2011). Moreover, perceived behavioral control entails
individuals’ perceptions of how well they can perform or handle a situation (De Clercq et
al., 2011). Subsequent to acknowledging the potential influence of the three predictors
from this study, business owners could make decisions for improvement leading to a
greater likelihood of business success.
Tribal business support agencies may improve their support offerings by adopting
policies congruent to findings in this study. An increase in the availability of
entrepreneurial training and mentors could positively affect the perceived behavioral
control and subjective norms for NA business owners and nascent entrepreneurs
(Pittaway et al., 2011; Rideout & Gray, 2013; Sánchez, 2013; Studdard et al., 2013). St-
Jean and Audet (2013) discovered that mentoring programs increased the mentees’
business competence as well as their entrepreneurial self-efficacy. Therefore, establishing
formal mentoring opportunities for NA small business owners might increase perceived

95
behavioral control, equivalent to self-efficacy, thereby increasing NA business start-ups
and successes.
Benson et al.’s (2011) study results provided evidence that microfinance loans
and small business support can boost business creation and success. Benson et al. found
that an increase in business formation leads to additional entrepreneurial endeavors,
increased job creation, and reduced poverty. As more NAs succeed in business, networks
will grow to support upcoming business owners (Rubin, 2011). As evidenced by the
literature and findings in this study, NA business support offices could strive to increase
training and mentoring opportunities for NA business owners and nascent entrepreneurs.
These new support offerings might encourage positive attitudes toward entrepreneurship,
subjective norms, and perceived behavioral control that could subsequently increase the
likelihood of business success.
Recommendations for Further Study
This study serves as a starting point for further research on NA business
formation and success. Little research exists concerning NA business success (Franklin et
al., 2013). Liu (2012) called for additional research business formation among minority
groups. NAs compose 1.5% of the U.S. population (MBDA, 2014). This study might
address a gap in business practice regarding the likelihood that attitudes toward
entrepreneurship, subjective norms, and perceived behavioral control predict small
business success among NAs.
Although my study findings did not demonstrate significant results, future
researchers might conduct qualitative studies with NA business owners to explore

96
business success characteristics. The U.S. government recognizes 565 tribes (Franklin et
al., 2013), and this study drew participants from one. To improve generalizability, further
research could begin by repeating the study with additional tribes. Furthermore,
differences exist between the 310 tribes living on reservations and those living off
reservations (Benson et al., 2011); therefore, researchers should investigate the potential
different results from different tribal living arrangements.
The purpose of this correlational study was to examine the likelihood that NA
attitudes toward entrepreneurship, subjective norms, and perceived behavioral control
predict NA small business success. The challenges faced by NA entrepreneurs may stem
from different cultural or personal backgrounds, and few studies have examined the
differences in the business formation process among different racial/ethnic groups (Liu,
2012; Peredo & McLean, 2010; Rubin, 2011). Comparative studies between NA business
success and non-native business success in the same geographic area could also relevant
information. A comparative study could help to determine if economic factors influenced
the conflicting results of this study. A study comparing lifestyle businesses, where
owners seek to sustain a level of income but not grow, to those managed by growth-
oriented owners, who strive for business growth, could substantiate the findings of Carey
et al. (2010) and possibly explain the conflicting logistic regression results from this
study. Additional information about the predictors and their relationship to business
success in the same geographic area might enhance the ability make good business
decisions by both NA and other local business owners; therefore, improving the
economic situation for all populations in the geographic area.

97
Reflections
My interest in this topic arose from my personal interest in business formation
and success and my geographic proximity to NA populations. As a non-NA living and
working near several tribal organizations who support the local economy, my hope was to
offer insight that could benefit NA businesses and spur economic growth. Previous use of
the TPB to conduct studies among students enhanced my curiosity of its applicability to
NA business success. Because of my possible bias toward the TPB, I drafted a research
question answerable by using a quantitative method to prevent any potential bias from
inadvertently influencing the study results.
Despite not offering an incentive to participate, collection included four more
completed surveys than required for statistical significance. Future researchers may
consider avoidance of postal mail invitations to participate, as this process greatly
increased research cost and time. Response rates via postal mail were low (25%), because
many addresses listed in the database were incorrect.
Summary and Study Conclusions
Small businesses account for 99% of all U.S. firms (Labedz & Berry, 2011).
Though NAs compose 1.5% of the U.S. population, NAs only own 0.9% of businesses
within the United States (MBDA, 2014). Furthermore, on average, NA-owned businesses
earned 70% lower gross receipts than those earned by other U.S. firms (MBDA, 2014).
Additionally, unemployment among NAs rose to a level twice as high as the U.S.
national average in 2010 and up to 80% in some locations (Juntunen & Cline, 2010).
New businesses create 86% of new jobs (Neumark et al., 2011); therefore, NA small

98
business owners, aspiring and nascent entrepreneurs, and tribal business support offices
could benefit from increased knowledge about NA business formation and success.
I conducted a correlational study to examine the likelihood that NA attitudes
toward entrepreneurship, subjective norms, and perceived behavioral control predict
business success. A logistic regression analysis failed to reject the null hypothesis:
Attitudes toward entrepreneurship, subjective norms, and perceived behavioral control do
not predict the likelihood of NA small business success. A statistical model using the
combination of the three independent variables from the TPB accurately predicted 81.0%
of cases of business success; however, additional tests provided conflicting information
prompting the need for interpreting the results with caution. The study included data from
a single tribe. Additional studies could investigate additional NA tribes and other groups.
Business owners who apply knowledge acquired from this study may increase their
likelihood of success. Additionally, tribal business support offices might improve the
quality of offerings to their constituents. Both applications of the study findings
contribute to positive business and social change.

99
References
Abduh, M., Maritz, A., & Rushworth, S. (2012). An evaluation of entrepreneurship
education in Indonesia: A case study of Bengkulu University. International
Journal of Organizational Innovation, 4(4), 21–47. Retrieved from
http://www.ijoi.org
Ahmad, S., Xavier, S., & Bakar, A. (2014). Examining entrepreneurial intention through
cognitive approach using Malaysia GEM data. Journal of Organizational Change
Management, 27, 449–464. doi:10.1108/JOCM-03-2013-0035
Ajzen, I. (1991). The theory of planned behavior. Organizational Behavior and Human
Decision Processes, 50, 179–211. doi:10.1016/0749-5978(91)90020-T
Ajzen, I. (2012). Martin Fishbein’s legacy: The reasoned action approach. The ANNALS
of the American Academy of Political and Social Science, 640(1), 11–27.
doi:10.1177/0002716211423363
Allen, W. D., & Curington, W. P. (2014). The self-employment of men and women:
What are their motivations? Journal of Labor Research, 35, 143–161.
doi:10.1007/s12122-014-9176-6
Al-Mubaraki, H., & SchröL, H. (2011). Measuring the effectiveness of business
incubators: A four dimensions approach from a Gulf Cooperation Council
perspective. Journal of Enterprising Culture, 19, 435–452.
doi:10.1142/S0218495811000842
100
Amatucci, F. M., & Swartz, E. (2011). Through a fractured lens: Women entrepreneurs
and the private equity negotiation process. Journal of Developmental
Entrepreneurship, 16, 333–350. doi:10.1142/S1084946711001872
Amorós, J. E., & Bosma, N. (2014). Global Entrepreneurship Monitor 2013 Global
Report. Retrieved from http://www.gemconsortium.org/docs/download/3106
Anderson, D. R., Sweeney, D. J., & Williams, T. A. (2015). Essentials of modern
business statistics with Microsoft Office Excel (6th ed.). Boston, MA: Cengage
Learning.
Annoni, M., Sanchini, V., & Nardini, C. (2013). The ethics of non-inferiority trials: A
consequentialist analysis. Research Ethics, 9(3), 109–120.
doi:10.1177/1747016113494649
Anshuman, V. R., Martin, J., & Titman, S. (2012). An entrepreneur’s guide to
understanding the cost of venture capital. Journal of Applied Corporate Finance,
24(3), 75–83. doi:10.1111/j.1745-6622.2012.00391.x
Aslam, T. M., Awan, A. S., & Khan, T. M. (2012). An empirical study of family
background and entrepreneurship as career selection among university students of
Turkey and Pakistan. International Journal of Business and Social Science, 3(15),
118–123. Retrieved from http://www.ijbssnet.com
Association for the Study of Higher Education. (2012). Postsecondary education for
American Indians and Alaska Natives. ASHE Higher Education Report, 37(5), 1–
154. doi:10.1002/aehe.3705

101
Ates, A., & Bititci, U. (2011). Change process: A key enabler for building resilient
SMEs. International Journal of Production Research, 49, 5601–5618.
doi:10.1080/00207543.2011.563825
Audretsch, D. B., Aldridge, T. T., & Sanders, M. (2011). Social capital building and new
business formation: A case study in Silicon Valley. International Small Business
Journal, 29, 152–169. doi:10.1177/0266242610391939
Barratt, M. J., Ferris, J. A., & Lenton, S. (2015). Hidden populations, online purposive
sampling, and external validity: Taking off the blindfold. Field Methods, 27, 3–
21. doi:10.1177/1525822X14526838
Bates, T., & Robb, A. (2013). Greater access to capital is needed to unleash the local
economic development potential of minority-owned businesses. Economic
Development Quarterly, 27, 250–259. doi:10.1177/0891242413477188
Bauer, K. (2011). Training women for success: An evaluation of entrepreneurship
training programs in Vermont, USA. Journal of Entrepreneurship Education, 14,
1–24. Retrieved from http://www.alliedacademies.org/entrepreneurship-education
Benson, D. A., Lies, A. K., Okunade, A. A., & Wunnava, P. V. (2011). Economic impact
of a private sector micro-financing scheme in South Dakota. Small Business
Economics, 36, 157–168. doi:10.1007/s11187-009-9191-9
Bharadwaj, P. N., Osborne, S. W., & Falcone, T. W. (2010). Assuring quality in
entrepreneurship training: A quality function deployment (QFD) approach.
Journal of Entrepreneurship Education, 13, 107–132. Retrieved from
http://www.alliedacademies.org/entrepreneurship-education

102
Block, J. H., Hoogerheide, L., & Thurik, R. (2013). Education and entrepreneurial
choice: An instrumental variables analysis. International Small Business Journal,
31, 23–33. doi:10.1177/0266242611400470
Boone Jr., H. N., & Boone, D. A. (2012). Analyzing Likert data. Journal of Extension,
50(2), 1–5. Retrieved from http://www.joe.org/joe
Bosma, N., & Schutjens, V. (2011). Understanding regional variation in entrepreneurial
activity and entrepreneurial attitude in Europe. The Annals of Regional Science,
47, 711–742. doi:10.1007/s00168-010-0375-7
Boyer, T., & Blazy, R. (2014). Born to be alive?: The survival of innovative and non-
innovative French micro-start-ups. Small Business Economics, 42, 669–683.
doi:10.1007/s11187-013-9522-8
Boyles, T. (2012). 21st century knowledge, skills, and abilities and entrepreneurial
competencies: A model for undergraduate entrepreneurship education. Journal of
Entrepreneurship Education, 15, 41–55. Retrieved from
http://www.alliedacademies.org/entrepreneurship-education
Bridgstock, R. (2013). Not a dirty word: Arts entrepreneurship and higher education. Arts
and Humanities in Higher Education, 12(2-3), 122–137.
doi:10.1177/1474022212465725
Brutus, S., Aguinis, H., & Wassmer, U. (2013). Self-reported limitations and future
directions in scholarly reports: Analysis and recommendations. Journal of
Management, 39, 48–75. doi:10.1177/0149206312455245

103
Buller, P. F., & Finkle, T. A. (2013). The Hogan Entrepreneurial Leadership Program:
An innovative model of entrepreneurship education. Journal of Entrepreneurship
Education, 16, 113–132. Retrieved from
http://www.alliedacademies.org/entrepreneurship-education
Bullough, A., Renko, M., & Myatt, T. (2014). Danger zone entrepreneurs: The
importance of resilience and self-efficacy for entrepreneurial intentions.
Entrepreneurship Theory and Practice, 38, 473–499. doi:10.1111/etap.12006
Cantrell, M. A. (2011). Demystifying the research process: Understanding a descriptive
comparative research design. Pediatric Nursing, 37(4), 188–189. Retrieved from
http://www.pediatricnursing.net
Carey, T. A., Flanagan, D. J., & Palmer, T. B. (2010). An examination of university
student entrepreneurial intentions by type of venture. Journal of Developmental
Entrepreneurship, 15, 503–517. doi:10.1142/S1084946710001622
Carpenter, K. M., Stoner, S. A., Mundt, J. M., & Stoelb, B. (2012). An online self-help
CBT intervention for chronic lower back pain. The Clinical Journal of Pain, 28,
14–22. doi:10.1097/AJP.0b013e31822363db
Carsrud, A., & Brännback, M. (2011). Entrepreneurial motivations: What do we still
need to know? Journal of Small Business Management, 49, 9–26.
doi:10.1111/j.1540-627X.2010.00312.x
Case, J. M., & Light, G. (2011). Emerging methodologies in engineering education
research. Journal of Engineering Education, 100, 186–210. Retrieved from
http://www.jee.org

104
Castellan, C. M. (2010). Quantitative and qualitative research: A view for clarity.
International Journal of Education, 2(2), 1–14. Retrieved from
http://www.macrothink.org/ije
Chang, T.-Z., & Vowles, N. (2013). Strategies for improving data reliability for online
surveys: A case study. International Journal of Electronic Commerce Studies, 4,
131–140. doi:10.7903/ijecs.1121
Chou, C.-M., Shen, C.-H., & Hsiao, H.-C. (2011). The influence of entrepreneurial self-
efficacy on entrepreneurial learning behavior: Using entrepreneurial intention as
the mediator variable. International Business and Management, 3(2), 7–11.
Retrieved from http://www.ccsenet.org/journal/index.php/ijbm
Cohen, J., Cohen, P., West, S. G., & Aiken, L. S. (2003). Applied multiple
regression/correlation analysis for the behavioral sciences (3rd ed.). Mahwah,
NJ: Lawrence Erlbaum.
Cole, C., Chase, S., Couch, O., & Clark, M. (2011). Research methodologies and
professional practice: Considerations and practicalities. The Electronic Journal of
Business Research Methods, 9(2), 141–151. Retrieved from
http://www.ejbrm.com
Corti, L. (2012). Recent developments in archiving social research. International Journal
of Social Research Methodology, 15, 281-290.
doi:10.1080/13645579.2012.688310

105
Cronholm, S., & Hjalmarsson, A. (2011). Experiences from sequential use of mixed
methods. Electronic Journal of Business Research Methods, 9(2), 87–95.
Retrieved from http://www.ejbrm.com
Cronin-Gilmore, J. (2012). Exploring marketing strategies in small businesses. Journal of
Marketing Development and Competitiveness, 6(1), 96–107. Retrieved from
http://www.na-businesspress.com/jmdcopen.html
Daniel, J. (2012). Sampling essentials: Practical guidelines for making sampling choices.
Thousand Oaks, CA: Sage.
Davidov, E., & Depner, F. (2011). Testing for measurement equivalence of human values
across online and paper-and-pencil surveys. Quality & Quantity, 45, 375–390.
doi:10.1007/s11135-009-9297-9
Dayanim, S. L. (2011). Do minority-owned businesses face a spatial barrier? Measuring
neighborhood-level economic activity differences in Philadelphia. Growth &
Change, 42, 397–419. doi:10.1111/j.1468-2257.2011.00558.x
de Bernardo, D. H., & Curtis, A. (2013). Using online and paper surveys: The
effectiveness of mixed-mode methodology for populations over 50. Research on
Aging, 35, 220–240. doi:10.1177/0164027512441611
De Clercq, D., Honig, B., & Martin, B. (2011). The roles of learning orientation and
passion for work in the formation of entrepreneurial intention. International Small
Business Journal, 31, 652–676. doi:10.1177/0266242611432360

106
Diaz-Casero, J. C., Hernandez-Mogollon, R., & Roldan, J. L. (2011). A structural model
of the antecedents to entrepreneurial capacity. International Small Business
Journal, 30, 850–872. doi:10.1177/0266242610385263
Dinis, A., do Paco, A., Ferreira, J., Raposo, M., & Gouveia, R. (2013). Psychological
characteristics and entrepreneurial intentions among secondary students.
Education + Training, 8/9, 763–780. doi:10.1108/ET-06-2013-0085
Dodou, D., & de Winter, J. C. F. (2014). Social desirability is the same in offline, online,
and paper surveys: A meta-analysis. Computers in Human Behavior, 36, 487–495.
doi:10.1016/j.chb.2014.04.005
Do Paco, A., Ferreira, J., Raposo, M., Rodrigues, R., & Dinis, A. (2011). Behaviours and
entrepreneurial intention: Empirical findings about secondary students. Journal of
International Entrepreneurship, 9, 20–38. doi:10.1007/s10843-010-0071-9
Douglas, E. J. (2013). Reconstructing entrepreneurial intentions to identify predisposition
for growth. Journal of Business Venturing, 28, 633–651.
doi:10.1016/j.jbusvent.2012.07.005
Dreveskracht, R. D. (2013). Economic development, native nations, and solar projects.
American Journal of Economics and Sociology, 72, 122–144. doi:10.1111/j.1536-
7150.2012.00866.x
Drost, E. A. (2011). Validity and reliability in social science research. Education
Research and Perspectives, 38, 105–124. Retrieved from
http://www.education.uwa.edu.au/research/journal

107
Du, R. Y., & Kamakura, W. A. (2012). Quantitative trendspotting. Journal of Marketing
Research, 49, 514–536. doi:10.1509/jmr.10.0167
Durbin, J., & Watson, G. S. (1950). Testing for serial correlation in least squares
regression. Biometrika, 37, 409. doi:10.2307/2332391
Edelman, L. F., Brush, C. G., Manolova, T. S., & Greene, P. G. (2010). Start-up
motivations and growth intentions of minority nascent entrepreneurs. Journal of
Small Business Management, 48, 174–196. doi:10.1111/j.1540-
627X.2010.00291.x
Eijdenberg, E. L., & Masurel, E. (2013). Entrepreneurial motivation in a least developed
country: Push factors and pull factors among MSEs in Uganda. Journal of
Enterprising Culture, 21, 19–43. doi:10.1142/S0218495813500027
Ekpe, I., Razak, R. C., & Mat, N. B. (2013). The performance of female entrepreneurs:
Credit, training and the moderating effect of attitude towards risk-taking.
International Journal of Management, 30(3), 10–22. Retrieved from
http://search.proquest.com
Elmuti, D., Khoury, G., & Abdul-Rahim, B. (2011). Entrepreneurs’ personality,
education and venture effectiveness: Perceptions of Palestinian entrepreneurs.
Journal of Developmental Entrepreneurship, 16, 251–268.
doi:10.1142/S1084946711001823
Elmuti, D., Khoury, G., & Omran, O. (2012). Does entrepreneurship education have a
role in developing entrepreneurial skills and ventures’ effectiveness? Journal of

108
Entrepreneurship Education, 15, 83–98. Retrieved from
http://www.alliedacademies.org/entrepreneurship-education
Enama, M. E., Hu, Z., Gordon, I., Costner, P., Ledgerwood, J. E., & Grady, C. (2012).
Randomization to standard and concise informed consent forms: Development of
evidence-based consent practices. Contemporary Clinical Trials, 33, 895–902.
doi:10.1016/j.cct.2012.04.005
Fairlie, R., & Marion, J. (2012). Affirmative action programs and business ownership
among minorities and women. Small Business Economics, 39, 319–339.
doi:10.1007/s11187-010-9305-4
Fang, J., Wen, C., & Prybutok, V. (2014). An assessment of equivalence between paper
and social media surveys: The role of social desirability and satisficing.
Computers in Human Behavior, 30, 335–343. doi:10.1016/j.chb.2013.09.019
Fernández-Serrano, J., & Romero, I. (2013). Entrepreneurial quality and regional
development: Characterizing SME sectors in low income areas. Papers in
Regional Science, 92, 495–513. doi:10.1111/j.1435-5957.2012.00421.x
Fernandez, S., Malatesta, D., & Smith, C. R. (2012). Race, gender, and government
contracting: Different explanations or new prospects for theory? Public
Administration Review, 73, 109–120. doi:10.111/j.1540-6210.2012.02684.x
Ferreira, J. J., Raposo, M. L., Gouveia Rodrigues, R., Dinis, A., & do Paço, A. (2012). A
model of entrepreneurial intention: An application of the psychological and
behavioral approaches. Journal of Small Business and Enterprise Development,
19, 424–440. doi:10.1108/14626001211250144

109
Field, A. (2013). Discovering statistics using SPSS (4th ed.). Los Angeles, CA: Sage.
Figueroa-Armijos, M., & Johnson, T. G. (2013). Entrepreneurship in rural America
across typologies, gender and motivation. Journal of Developmental
Entrepreneurship, 18(2), 1–37. doi:10.1142/S1084946713500143
Fitzsimmons, J. R., & Douglas, E. J. (2011). Interaction between feasibility and
desirability in the formation of entrepreneurial intentions. Journal of Business
Venturing, 26, 431–441. doi:10.1016/j.jbusvent.2010.01.001
Flynn, S. V., Duncan, K. J., & Evenson, L. L. (2013). An emergent phenomenon of
American Indian secondary students’ career development process. The Career
Development Quarterly, 61(2), 124–140. doi:10.1002/j.2161-0045.2013.00042.x
Fort, T., Haltiwanger, J., Jarmin, R., & Miranda, J. (2013). How firms respond to
business cycles: The role of firm age and firm size. IMF Economic Review, 61,
520–559. doi:10.1057/imfer.2013.15
Franklin, R. J., Morris, M. H., & Webb, J. W. (2013). Entrepreneurial activity in
American Indian nations: Extending the GEM methodology. Journal of
Developmental Entrepreneurship, 18(2), 1–25. doi:10.1142/S108494671350009X
Frantz, K. (2010). The Salt River Indian Reservation: Land use conflicts and aspects of
socioeconomic change on the outskirts of Metro-Phoenix, Arizona. GeoJournal,
77, 777–790. doi:10.1007/s10708-010-9375-5
Fretschner, M., & Weber, S. (2013). Measuring and understanding the effects of
entrepreneurial awareness education. Journal of Small Business Management, 51,
410–428. doi:10.1111/jsbm.12019
110
Gadermann, A., Guhn, M., & Zumbo, B. (2012). Estimating ordinal reliability for Likert-
type and ordinal item response data: A conceptual, empirical, and practical guide.
Practical Assessment, Research & Evaluation, 17(3), 1–13. Retrieved from http://
http://pareonline.net
Garson, G. D. (2012). Testing statistical assumptions. Asheboro, NC: Statistical
Publishing Associates.
Gerba, D. T. (2012a). Impact of entrepreneurship education on entrepreneurial intentions
of business and engineering students in Ethiopia. African Journal of Economic
and Management Studies, 3, 258–277. doi:10.1108/20400701211265036
Gerba, D. T. (2012b). The context of entrepreneurship education in Ethiopian
universities. Management Research Review, 35(3/4), 225–244.
doi:10.1108/01409171211210136
Gibson, S., Harris, M., Mick, T., & Burkhalter, T. (2011). Comparing the entrepreneurial
attitudes of university and community college students. Journal of Higher
Education Theory and Practice, 11(2), 11–18. Retrieved from http://www.na-
businesspress.com/jhetpopen.html
Gibson, S., Harris, M., Walker, P., & McDowell, W. (2014). Investigating the
entrepreneurial attitudes of African Americans: A study of young adults. The
Journal of Applied Management and Entrepreneurship, 19(2), 107–125.
Retrieved from http://www.huizenga.nova.edu/jame

111
Gorgievski, M. J., Ascalon, M. E., & Stephan, U. (2011). Small business owners’ success
criteria, a values approach to personal differences. Journal of Small Business
Management, 49, 207–232. doi:10.1111/j.1540-627X.2011.00322.x
Grafton, M. (2011). Growing a business and becoming more entrepreneurial: The five
traits of success. Strategic Direction, 27(6), 4–7.
doi:10.1108/02580541111135526
Griffith, M. A. (2014). Consumer acquiescence to informed consent: The influence of
vulnerability, motive, trust and suspicion. Journal of Customer Behaviour, 13,
207–235. doi:10.1362/147539214X14103453768741
Griffiths, M., Gundry, L., & Kickul, J. (2013). The socio-political, economic, and cultural
determinants of social entrepreneurship activity: An empirical examination.
Journal of Small Business and Enterprise Development, 20, 341–357.
doi:10.1108/14626001311326761
Gupta, V. K., Goktan, A. B., & Gunay, G. (2014). Gender differences in evaluation of
new business opportunity: A stereotype threat perspective. Journal of Business
Venturing, 29, 273–288. doi:10.1016/j.jbusvent.2013.02.002
Guzman‐Alfonso, C., & Guzman‐Cuevas, J. (2012). Entrepreneurial intention models as
applied to Latin America. Journal of Organizational Change Management, 25(5),
721–735. doi:10.1108/09534811211254608
Halabí, C. E., & Lussier, R. N. (2014). A model for predicting small firm performance:
Increasing the probability of entrepreneurial success in Chile. Journal of Small

112
Business and Enterprise Development, 21, 4–25. doi:10.1108/JSBED-10-2013-
0141
Hallak, R., Assaker, G., & O’Connor, P. (2014). Are family and nonfamily tourism
businesses different? An examination of the entrepreneurial self-efficacy-
entrepreneurial performance relationship. Journal of Hospitality & Tourism
Research, 38, 388–413. doi:10.1177/1096348012461545
Hargadon, A. B., & Kenney, M. (2012). Misguided policy?: Following venture capital
into clean technology. California Management Review, 54(2), 118–139.
doi:10.1525/cmr.2012.54.2.118
Harmon, A. (2010). Rich Indians: Native people and the problem of wealth in American
history. Chapel Hill, NC: The University of North Carolina Press.
Hattab, H. W. (2014). Impact of entrepreneurship education on entrepreneurial intentions
of university students in Egypt. Journal of Entrepreneurship, 23, 1–18.
doi:10.1177/0971355713513346
Hayes, A. F., & Preacher, K. J. (2014). Statistical mediation analysis with a
multicategorical independent variable. British Journal of Mathematical and
Statistical Psychology, 67, 451–470. doi:10.1111/bmsp.12028
Heinonen, J., Hytti, U., & Stenholm, P. (2011). The role of creativity in opportunity
search and business idea creation. Education + Training, 53, 659–672.
doi:10.1108/00400911111185008
Hitt, M. A., Ireland, R. D., Sirmon, D. G., & Trahms, C. A. (2011). Strategic
entrepreneurship: Creating value for individuals, organizations, and society.

113
Academy of Management Perspectives, 25(2), 57–75.
doi:10.5465/AMP.2011.61020802
Hopp, C., & Stephan, U. (2012). The influence of socio-cultural environments on the
performance of nascent entrepreneurs: Community culture, motivation, self-
efficacy and start-up success. Entrepreneurship & Regional Development, 24,
917–945. doi:10.1080/08985626.2012.742326
Howard, R. W. (2011). Testing the accuracy of the retrospective recall method used in
expertise research. Behavior Research Methods, 43, 931–941.
doi:10.3758/s13428-011-0120-x
Hyysalo, S., Helminen, P., MäKinen, S., Johnson, M., Juntunen, J. K., & Freeman, S.
(2015). Intermediate search elements and method combination in lead-user
searches. International Journal of Innovation Management, 19(1), 1–41.
doi:10.1142/S1363919615500073
Iakovleva, T., Kolvereid, L., & Stephan, U. (2011). Entrepreneurial intentions in
developing and developed countries. Education + Training, 53, 353–370.
doi:10.1108/00400911111147686
Iselin, A.-M. R., Gallucci, M., & DeCoster, J. (2013). Reconciling questions about
dichotomizing variables in criminal justice research. Journal of Criminal Justice,
41, 386–394. doi:10.1016/j.jcrimjus.2013.07.002
Jacobides, M. G., Winter, S. G., & Kassberger, S. M. (2012). The dynamics of wealth,
profit, and sustainable advantage. Strategic Management Journal, 33, 1384–1410.
doi:10.1002/smj.1985

114
Jaén, I., & Liñán, F. (2013). Work values in a changing economic environment: The role
of entrepreneurial capital. International Journal of Manpower, 34, 939–960.
doi:10.1108/IJM-07-2013-0166
Jayawarna, D., Rouse, J., & Kitching, J. (2013). Entrepreneur motivations and life course.
International Small Business Journal, 31, 34–56. doi:10.1177/0266242611401444
Johnsson, L., Eriksson, S., Helgesson, G., & Hansson, M. G. (2014). Making researchers
moral: Why trustworthiness requires more than ethics guidelines and review.
Research Ethics, 10, 29–46. doi:10.1177/1747016113504778
Jones-Evans, D., Thompson, P., & Kwong, C. (2011). Entrepreneurship amongst
minority language speakers: The case of Wales. Regional Studies, 45, 219–238.
doi:10.1080/00343400903241493
Juntunen, C. L., & Cline, K. (2010). Culture and self in career development: Working
with American Indians. Journal of Career Development, 37, 391–410.
doi:10.1177/0894845309345846
Jusoh, R., Ziyae, B., Asimiran, S., & Kadir, S. A. (2011). Entrepreneur training needs
analysis: Implications on the entrepreneurial skills needed for successful
entrepreneurs. International Business & Economics Research Journal, 10, 143–
148. Retrieved from http://www.cluteinstitute.com/journals/international-
business-economics-research-journal-iber
Kang, W., Penn, D. A., & Zietz, J. (2011). A regime-switching analysis of the impact of
oil price changes on economies of U.S. states. The Review of Regional Studies,
41(2), 81–101. Retrieved from http://www.srsa.org/rrs

115
Kariv, D. (2011). Entrepreneurial orientations of women business founders from a
push/pull perspective: Canadians versus non-Canadians - A multinational
assessment. Journal of Small Business and Entrepreneurship, 24, 397–425.
Retrieved from http://www.tandfonline.com/loi/rsbe20#.U96XqWMQG8B
Kawada, T., & Yoshimura, M. (2012). Results of a 100-point scale for evaluating job
satisfaction and the occupational depression scale questionnaire survey in
workers. Journal of Occupational and Environmental Medicine, 54, 420–423.
doi:10.1097/JOM.0b013e31824173ab
Keelson, S. A. (2014). The moderating role of organizational capabilities and internal
marketing in market orientation and business success. Review of Business and
Finance Studies, 5, 1–17. Retrieved from http://www.theibfr.com/rbfcs.htm
Kelly, P., Marshall, S. J., Badland, H., Kerr, J., Oliver, M., Doherty, A. R., & Foster, C.
(2013). An ethical framework for automated, wearable cameras in health behavior
research. American Journal of Preventive Medicine, 44, 314–319.
doi:10.1016/j.amepre.2012.11.006
Kibler, E. (2013). Formation of entrepreneurial intentions in a regional context.
Entrepreneurship & Regional Development, 25, 293–323.
doi:10.1080/08985626.2012.721008
Kirkwood, A., & Price, L. (2013). Examining some assumptions and limitations of
research on the effects of emerging technologies for teaching and learning in
higher education: Examining assumptions and limitations of research. British
Journal of Educational Technology, 44, 536–543. doi:10.1111/bjet.12049

116
Knotts, T. L. (2011). The SBDC in the classroom: Providing experiential learning
opportunities at different entrepreneurial stages. Journal of Entrepreneurship
Education, 14, 25–38. Retrieved from
http://www.alliedacademies.org/entrepreneurship-education
Krueger, N., Liñán, F., & Nabi, G. (2013). Cultural values and entrepreneurship.
Entrepreneurship & Regional Development, 25, 703–707.
doi:10.1080/08985626.2013.862961
Kuratko, D. F. (2011). Entrepreneurship theory, process, and practice in the 21st century.
International Journal of Entrepreneurship and Small Business, 13, 8.
doi:10.1504/IJESB.2011.040412
Labedz, C. S., & Berry, G. R. (2011). Making sense of small business growth: A right
workforce template for growing firms. Journal of Applied Management and
Entrepreneurship, 16(2), 61–79. Retrieved from
http://www.huizenga.nova.edu/jame
Lahm, Jr., R. J., & Heriot, K. C. (2013). Creating an entrepreneruship internship
program: A case study. Journal of Entrepreneurship Education, 16, 73–98.
Retrieved from http://www.alliedacademies.org/entrepreneurship-education
Lautenschlager, A., & Haase, H. (2011). The myth of entrepreneurship education: Seven
arguments against teaching business creation at universities. Journal of
Entrepreneurship Education, 14, 147–161. Retrieved from
http://www.alliedacademies.org/entrepreneurship-education

117
Leung, K.-Y., Lo, C.-T., Sun, H., & Wong, K.-F. (2012). Factors influencing engineering
students’ intention to participate in on-campus entrepreneurial activities. Journal
of Entrepreneurship Education, 15, 1–19. Retrieved from
http://www.alliedacademies.org/entrepreneurship-education
Liñán, F., & Chen, Y. (2009). Development and cross-cultural application of a specific
instrument to measure entrepreneurial intentions. Entrepreneurship Theory and
Practice, 33, 593–617. doi:10.1111/j.1540-6520.2009.00318.x
Liñán, F., Rodríguez-Cohard, J. C., & Rueda-Cantuche, J. M. (2011). Factors affecting
entrepreneurial intention levels: A role for education. International
Entrepreneurship and Management Journal, 7, 195–218. doi:10.1007/s11365-
010-0154-z
Liñán, F., Santos, F. J., & Fernández, J. (2011). The influence of perceptions on potential
entrepreneurs. International Entrepreneurship and Management Journal, 7, 373–
390. doi:10.1007/s11365-011-0199-7
Liñán, F., Urbano, D., & Guerrero, M. (2011). Regional variations in entrepreneurial
cognitions: Start-up intentions of university students in Spain. Entrepreneurship
& Regional Development, 23, 187–215. doi:10.1080/08985620903233929
Link, A. N., & Scott, J. T. (2012). Employment growth from the Small Business
Innovation Research program. Small Business Economics, 39, 265–287.
doi:10.1007/s11187-010-9303-6

118
Litwin, A. S., & Phan, P. H. (2013). Quality over quantity: Reexamining the link between
entrepreneurship and job creation. Industrial & Labor Relations Review, 66, 833–
873. Retrieved from http://www.ilr.cornell.edu/ilrreview
Liu, C. Y. (2012). The causes and dynamics of minority entrepreneurial entry. Journal of
Developmental Entrepreneurship, 17(1), 1–23. doi:10.1142/S1084946712500033
Lown, J. M. (2011). 2011 outstanding AFCPE® conference paper: Development and
validation of a financial self-efficacy scale. Journal of Financial Counseling &
Planning, 22(2), 54–63. Retrieved from http://www.afcpe.org/publications
Malebana, J. (2014). Entrepreneurial intentions of South African rural university
students: A test of the theory of planned behaviour. Journal of Economics and
Behavioral Studies, 6, 130–143. Retrieved from
http://www.ifrnd.org/JournalDetail.aspx?JournalID=2
Manasanch, E. E., Korde, N., Mailankody, S., Tageja, N., Bhutani, M., Roschewski, M.,
& Landgren, O. (2014). Smoldering multiple myeloma: Special considerations
surrounding treatment on versus off clinical trials. Haematologica, 99, 1769–
1771. doi:10.3324/haematol.2014.107516
Marais, C., & Van Wyk, C. de W. (2014). Methodological reflection on the co-
construction of meaning within the South African domestic worker sector:
Challenging the notion of “voicelessness.” Mediterranean Journal of Social
Sciences, 5, 726–738. doi:10.5901/mjss.2014.v5n20p726
Mars, M. M., & Ginter, M. B. (2012). Academic innovation and autonomy: An
exploration of entrepreneurship education within American community colleges

119
and the academic capitalist context. Community College Review, 40, 75–95.
doi:10.1177/0091552111436209
Mars, M. M., & Rios-Aguilar, C. (2010). Academic entrepreneurship (re)defined:
Significance and implications for the scholarship of higher education. Higher
Education, 59, 441–460. doi:10.1007/s10734-009-9258-1
Martin, C., Surikova, S., Pigozne, T., & Maslo, I. (2011). Needs and perspectives in
developing the students’ entrepreneurship competences: A case study from
CReBUS research project. Journal of Educational Sciences, 13, 38–50. Retrieved
from http://www.resjournal.uvt.ro
Martin, K., & Parmar, B. (2012). Assumptions in decision making scholarship:
Implications for business ethics research. Journal of Business Ethics, 105, 289–
306. doi:10.1007/s10551-011-0965-z
Mathers, R. (2012). The failure of state-led economic development on American Indian
reservations. The Independent Review, 17, 65–80. Retrieved from
http://www.independent.org/publications/tir
Menard, S. (2002). Applied logistic regression analysis (2nd ed.). Thousand Oaks, CA:
Sage.
Mihajlov, T. P. (2012). SBA 504 loans help improve balance sheets: A micro analysis.
Journal of Marketing Development and Competitiveness, 6(1), 22–33. Retrieved
from http://www.na-businesspress.com/jmdcopen.html
Miles, D. A. (2012). Are Hispanic-owned businesses different? An empirical study on
market behavior and risk patterns of Hispanic-owned business ventures. Journal

120
of Business and Entrepreneurship, 24(1), 25–42. Retrieved from
http://www.usfsp.edu/jbe
Miller, R. J. (2012). Reservation “capitalism”: Economic development in Indian country.
Santa Barbara, CA: Praeger.
Minority Business Development Agency. (2014). American Indian & Alaska Native-
owned business growth and global reach. U.S. Department of Commerce.
Retrieved from http://www.mbda.gov/pressroom/research-library/us-business-
fact-sheets
Mobaraki, M. H., & Zare, Y. B. (2012). Designing pattern of entrepreneurial self-efficacy
on entrepreneurial intention. Information Management and Business Review, 4,
428–433. Retrieved from http://www.ifrnd.org/JournalDetail.aspx?JournalID=1
Moi, T., Adeline, Y. L., & Dyana, M. L. (2011). Young adult responses to
entrepreneurial intent. Researchers World, 2(3), 37–52. Retrieved from
http://www.researchersworld.com
Molaei, R., Zali, M. R., Mobaraki, M. H., & Farsi, J. Y. (2014). The impact of
entrepreneurial ideas and cognitive style on students entrepreneurial intention.
Journal of Entrepreneurship in Emerging Economies, 6(2), 140–162.
doi:10.1108/JEEE-09-2013-0021
Moradi, K., Papzan, A., & Afsharzade, N. (2013). Entrepreneurial intention determinants:
An empirical model and case of Iranian students in Malaysia. Journal of
Entrepreneurship, Management and Innovation, 3, 43–55. Retrieved from
http://www.jemi.edu.pl

121
Morris, M. H., Webb, J. W., Fu, J., & Singhal, S. (2013). A competency-based
perspective on entrepreneurship education: Conceptual and empirical insights.
Journal of Small Business Management, 51, 352–369. doi:10.1111/jsbm.12023
Moustakas, C. (1994). Phenomenological research methods. Thousand Oaks, CA: Sage.
Mueller, S. (2011). Increasing entrepreneurial intention: Effective entrepreneurship
course characteristics. International Journal of Entrepreneurship and Small
Business, 13, 55. doi:10.1504/IJESB.2011.040416
Nabi, G., & Liñán, F. (2013). Considering business start-up in recession time: The role of
risk perception and economic context in shaping the entrepreneurial intent.
International Journal of Entrepreneurial Behaviour & Research, 19, 633–655.
doi:10.1108/IJEBR-10-2012-0107
Nazir, M. A. (2012). Contribution on entrepreneurship in economic growth. Journal of
Contemporary Research in Business, 4(3), 273–294. Retrieved from
http://ijcrb.webs.com
Neumark, D., Wall, B., & Zhang, J. (2011). Do small businesses create more jobs? New
evidence for the United States from the national establishment time series. Review
of Economics and Statistics, 93(1), 16–29. doi:10.1162/REST_a_00060
Ngo, L. V., & O’Cass, A. (2013). Innovation and business success: The mediating role of
customer participation. Journal of Business Research, 66, 1134–1142.
doi:10.1016/j.jbusres.2012.03.009
Nordstokke, D. W., Zumbo, B. D., Cairns, S. L., & Saklofske, D. H. (2011). The
operating characteristics of the nonparametric Levene test for equal variances
122
with assessment and evaluation data. Practical Assessment, Research &
Evaluation, 16(5), 1–8. Retrieved from http://pareonline.net
Okpala, K. E. (2012). Venture capital and the emergence and development of
entrepreneurship: A focus on employment generation and poverty alleviation in
Lagos State. International Business and Management, 5(2), 130–137.
doi:10.3968/j.ibm.1923842820120502.1060
Omar, H. (2011). Arab American entrepreneurs in San Antonio, Texas: Motivation for
entry into self-employment. Education, Business and Society: Contemporary
Middle Eastern Issues, 4, 33–42. doi:10.1108/17537981111111256
Orser, B. J., Elliott, C., & Leck, J. (2011). Feminist attributes and entrepreneurial
identity. Gender in Management: An International Journal, 26, 561–589.
doi:10.1108/17542411111183884
Ortiz-Walters, R., & Gius, M. (2012). Performance of newly-formed micro firms: The
role of capital financing in minority-owned enterprises. Journal of Developmental
Entrepreneurship, 17(3), 1–22. doi:10.1142/S1084946712500148
Osborne, J. W. (2013). Best practices in data cleaning: A complete guide to everything
you need to do before and after collecting your data. Thousand Oaks, CA: Sage.
doi:10.4135/9781452269948
Östlund, U., Kidd, L., Wengström, Y., & Rowa-Dewar, N. (2011). Combining qualitative
and quantitative research within mixed method research designs: A
methodological review. International Journal of Nursing Studies, 48, 369–383.
doi:10.1016/j.ijnurstu.2010.10.005

123
Owens, K. S., Kirwan, J. R., Lounsbury, J. W., Levy, J. J., & Gibson, L. W. (2013).
Personality correlates of self-employed small business owners’ success. Work, 45,
73–85. doi:10.3233/WOR-121536
Owoseni, O. O., & Adeyeye, T. C. (2012). The role of entrepreneurial orientations on the
perceived performance of small and medium-scale enterprises (SMEs) in Nigeria.
International Business and Management, 5(2), 148–154.
doi:10.3968/j.ibm.1923842820120502.1130
Pallant, J. (2013). SPSS survival manual: A step by step guide to data analysis using IBM
SPSS. New York, NY: McGraw Hill.
Parham, V. (2012). “These Indians are apparently well to do”: The myth of capitalism
and Native American labor. International Review of Social History, 57, 447–470.
doi:10.1017/S002085901200051X
Parthasarathy, M., Forlani, D., & Meyers, A. (2012). The University of Colorado
certificate program in bioinnovation and entrepreneurship: An interdisciplinary,
cross-campus model. Journal of Commercial Biotechnology, 18, 70–78.
doi:10.5912/jcb.468
Patterson, B., & Morin, K. (2012). Methodological considerations for studying social
processes. Nurse Researcher, 20(1), 33–38. doi:10.7748/nr2012.09.20.1.33.c9306
Peredo, A. M., & McLean, M. (2010). Indigenous development and the cultural captivity
of entrepreneurship. Business & Society, 52, 592–620.
doi:10.1177/0007650309356201
124
Perrett, J. J. (2013). Exploring graduate and undergraduate course evaluations
administered on paper and online: a case study. Assessment & Evaluation in
Higher Education, 38, 85–93. doi:10.1080/02602938.2011.604123
Petridou, E., & Sarri, K. (2011). Developing “potential entrepreneurs” in higher
education institutes. Journal of Enterprising Culture, 19, 79–99.
doi:10.1142/S0218495811000647
Petty, N. J., Thomson, O. P., & Stew, G. (2012). Ready for a paradigm shift? Part 2:
Introducing qualitative research methodologies and methods. Manual Therapy,
17, 378–384. doi:10.1016/j.math.2012.03.004
Pisani, M. J. (2012). Latino informal immigrant entrepreneurs in South Texas:
Opportunities and challenges for unauthorized new venture creation and
persistence. American Journal of Business, 27, 27–39.
doi:10.1108/19355181211217625
Pittaway, L., Rodriguez-Falcon, E., Aiyegbayo, O., & King, A. (2011). The role of
entrepreneurship clubs and societies in entrepreneurial learning. International
Small Business Journal, 29, 37–57. doi:10.1177/0266242610369876
Pruett, M. (2012). Entrepreneurship education: Workshops and entrepreneurial intentions.
Journal of Education for Business, 87, 94–101.
doi:10.1080/08832323.2011.573594
Quinn, C. R. (2015). General considerations for research with vulnerable populations:
Ten lessons for success. Health & Justice, 3(1). doi:10.1186/s40352-014-0013-z

125
Quinn, S. J., Hosmer, D. W., & Blizzard, C. L. (2015). Goodness-of-fit statistics for log-
link regression models. Journal of Statistical Computation and Simulation, 85,
2533–2545. doi:10.1080/00949655.2014.940953
Raghupathy, S., & Hahn-Smith, S. (2013). The effect of survey mode on high school risk
behavior: A comparison between web and paper-based surveys. Current Issues in
Education, 16(2), 1–11. Retrieved from http://cie.asu.edu
Raposo, M., & do Paco, A. (2011). Entrepreneurship education: Relationship between
education and entrepreneurial activity. Psicothema, 23, 453–457. Retrieved from
http://www.psicothema.com
Rasli, A., Khan, S., Malekifar, S., & Jabeen, S. (2013). Factors affecting entrepreneurial
intention among graduate students of Universiti Teknologi Malaysia.
International Journal of Business and Social Science, 4(2), 182–18. Retrieved
from http://www.ijbssnet.com
Rauch, A., & Rijsdijk, S. A. (2013). The effects of general and specific human capital on
long-term growth and failure of newly founded businesses. Entrepreneurship
Theory and Practice, 37, 923–941. doi:10.1111/j.1540-6520.2011.00487.x
Rideout, E. C., & Gray, D. O. (2013). Does entrepreneurship education really work? A
review and methodological critique of the empirical literature on the effects of
university-based entrepreneurship education. Journal of Small Business
Management, 51, 329–351. doi:10.1111/jsbm.12021
126
Rubin, J. S. (2011). Countering the rhetoric of emerging domestic markets: Why more
information alone will not address the capital needs of underserved communities.
Economic Development Quarterly, 25, 182–192. doi:10.1177/0891242410388935
Sánchez, J. C. (2013). The impact of an entrepreneurship education program on
entrepreneurial competencies and intention. Journal of Small Business
Management, 51, 447–465. doi:10.1111/jsbm.12025
Sardar, S., Rehman, A., Yousaf, U., & Aijaz, A. (2011). Impact of HR practices on
employee engagement in banking sector of Pakistan. Interdisciplinary Journal of
Contemporary Research in Business, 2, 378–389. Retrieved from
http://ijcrb.webs.com
Sardeshmukh, S. R., & Smith-Nelson, R. M. (2011). Educating for an entrepreneurial
career: Developing opportunity recognition ability. Australian Journal of Career
Development, 20(3), 47–55. Retrieved from http://www.acer.edu.au/press/ajcd
Saridakis, G., Marlow, S., & Storey, D. J. (2014). Do different factors explain male and
female self-employment rates? Journal of Business Venturing, 29, 345–362.
doi:10.1016/j.jbusvent.2013.04.004
Schlaegel, C., He, X., & Engle, R. (2013). The direct and indirect influences of national
culture on entrepreneurial intentions: A fourteen nation study. International
Journal of Management, 30(2), 597–609. Retrieved from
http://www.internationaljournalofmanagement.co.uk/

127
Schlaegel, C., & Koenig, M. (2014). Determinants of entrepreneurial intent: A meta-
analytic test and integration of competing models. Entrepreneurship Theory and
Practice, 38, 291–332. doi:10.1111/etap.12087
Schmidt, J. J., Soper, J. C., & Bernaciak, J. (2013). Creativity in the entrepreneurship
program: A survey of the directors of award winning programs. Journal of
Entrepreneurship Education, 16, 31–44. Retrieved from
http://www.alliedacademies.org/entrepreneurship-education
Sciglimpaglia, D., Welsh, D. H. B., & Harris, M. L. (2013). Gender and ethnicity in
business consulting assistance: Public policy implications. Journal of
Entrepreneurship and Public Policy, 2, 80–95. doi:10.1108/20452101311318693
Servon, L. J., Visser, M. A., & Fairlie, R. W. (2010). The continuum of capital for small
and micro enterprises. Journal of Developmental Entrepreneurship, 15, 301–323.
doi:10.1142/S1084946710001579
Sharp, A., Moore, P., & Anderson, K. (2011). Are the prompt responders to an online
panel survey different from those who respond later? Market & Social Research,
19, 25–33. Retrieved from
http://www.amsrs.com.au/publicationsresources/market-social-research-formerly-
ajmsr
Shehu, A. M. (2014). Market orientation and firm performance among Nigerian SMEs:
The moderating role of business environment. Mediterranean Journal of Social
Sciences, 5(23), 158–164. doi:10.5901/mjss.2014.v5n23p158

128
Shoebridge, A., Buultjens, J., & Peterson, L. S. (2012). Indigenous entrepreneurship in
Northern NSW, Australia. Journal of Developmental Entrepreneurship, 17(3), 1–
31. doi:10.1142/S1084946712500173
Siciliano, M. D., Yenigun, D., & Ertan, G. (2012). Estimating network structure via
random sampling: Cognitive social structures and the adaptive threshold method.
Social Networks, 34, 585–600. doi:10.1016/j.socnet.2012.06.004
Smock, A. D., Ellison, N. B., Lampe, C., & Wohn, D. Y. (2011). Facebook as a toolkit: A
uses and gratification approach to unbundling feature use. Computers in Human
Behavior, 27, 2322–2329. doi:10.1016/j.chb.2011.07.011
Solesvik, M. Z. (2013). Entrepreneurial motivations and intentions: Investigating the role
of education major. Education + Training, 55, 253–271.
doi:10.1108/00400911311309314
Solesvik, M., Westhead, P., & Matlay, H. (2014). Cultural factors and entrepreneurial
intention: The role of entrepreneurship education. Education + Training, 56, 680–
696. doi:10.1108/ET-07-2014-0075
Solomon, G. T., Bryant, A., May, K., & Perry, V. (2013). Survival of the fittest:
Technical assistance, survival and growth of small businesses and implications for
public policy. Technovation, 33(8-9), 292–301.
doi:10.1016/j.technovation.2013.06.002
Sommer, L. (2011). The theory of planned behaviour and the impact of past behaviour.
International Business & Economics Research Journal, 2011(10), 91–110.
Retrieved from http://journals.cluteonline.com/index.php/IBER

129
Sonenshein, S., DeCelles, K. A., & Dutton, J. E. (2014). It’s not easy being green: The
role of self-evaluations in explaining support of environmental issues. Academy of
Management Journal, 57, 7–37. doi:10.5465/amj.2010.0445
Soriano, D. R., & Castrogiovanni, G. J. (2012). The impact of education, experience and
inner circle advisors on SME performance: Insights from a study of public
development centers. Small Business Economics, 38, 333–349.
doi:10.1007/s11187-010-9278-3
Sousa, V. D., & Rojjanasrirat, W. (2011). Translation, adaptation and validation of
instruments or scales for use in cross-cultural health care research: A clear and
user-friendly guideline: Validation of instruments or scales. Journal of Evaluation
in Clinical Practice, 17, 268–274. doi:10.1111/j.1365-2753.2010.01434.x
Stewart, D., & Pepper, M. B. (2011). Close encounters: Lessons from an indigenous
MBA program. Journal of Management Education, 35, 66–83.
doi:10.1177/1052562910384375
St-Jean, E., & Audet, J. (2013). The effect of mentor intervention style in novice
entrepreneur mentoring relationships. Mentoring & Tutoring: Partnership in
Learning, 21, 96–119. doi:10.1080/13611267.2013.784061
Streletzki, J.-G., & Schulte, R. (2013). Which venture capital selection criteria distinguish
high-flyer investments? Venture Capital, 15, 29–52.
doi:10.1080/13691066.2012.724232

130
Studdard, N. L., Dawson, M., & Jackson, N. L. (2013). Fostering entrepreneurship and
building entrepreneurial self-efficacy in primary and secondary education.
Creative and Knowledge Society, 3(2), 1–14. doi:10.2478/v10212-011-0033-1
Tabachnick, B. G., & Fidell, L. S. (2013). Using multivariate statistics (6th ed.). Boston,
MA: Pearson.
Thompson, P., Jones-Evans, D., & Kwong, C. C. Y. (2010). Education and
entrepreneurial activity: A comparison of White and South Asian men.
International Small Business Journal, 28, 147–162.
doi:10.1177/0266242609355858
Tsai, K.-H., Chang, H.-C., & Peng, C.-Y. (2014). Extending the link between
entrepreneurial self-efficacy and intention: A moderated mediation model.
International Entrepreneurship and Management Journal, 10, 1–19.
doi:10.1007/s11365-014-0351-2
Uddin, M. R., & Bose, T. K. (2012). Determinants of entrepreneurial intention of
business students in Bangladesh. International Journal of Business and
Management, 7(24), 128–137. doi:10.5539/ijbm.v7n24p128
Ugwu, F. O., & Ugwu, C. (2012). New venture creation: Ethnicity, family background
and gender as determinants of entrepreneurial intent in a poor economy.
Interdisciplinary Journal of Contemporary Research in Business, 4(4), 338–357.
Retrieved from http://ijcrb.webs.com
U.S. Bureau of Labor Statistics. (2013). Labor force characteristics by race and ethnicity,
2012. Retrieved from http://www.bls.gov/cps/cpsrace2012.pdf

131
U.S. Census Bureau. (2013). American fact finder. Retrieved from
http://factfinder.census.gov
U.S. Small Business Administration. (2014a). Frequently asked questions. Retrieved
from http://www.sba.gov/advocacy/7495/29581
U.S. Small Business Administration. (2014b). Native Americans. Retrieved from
http://www.sba.gov/content/native-americans-0
Uygun, R., & Kasimoglu, M. (2013). The emergence of entrepreneurial intentions in
indigenous entrepreneurs: The role of personal background on the antecedents of
intentions. International Journal of Business and Management, 8(5), 24–40.
doi:10.5539/ijbm.v8n5p24
Vance, C., Groves, K., Gale, J., & Hess, G. (2012). Would future entrepreneurs be better
served by avoiding university business education? Examining the effect of higher
education on business student thinking style. Journal of Entrepreneurship
Education, 15(SI), 127–141. Retrieved from
http://www.alliedacademies.org/entrepreneurship-education
van den Born, A., & van Witteloostuijn, A. (2013). Drivers of freelance career success.
Journal of Organizational Behavior, 34, 24–46. doi:10.1002/job.1786
van Hulten, A. (2012). Women’s access to SME finance in Australia. International
Journal of Gender and Entrepreneurship, 4, 266–288.
doi:10.1108/17566261211264154

132
Venkatesh, V., Brown, S. A., & Bala, H. (2013). Bridging the qualitative-quantitative
divide: Guidelines for conducting mixed methods research in information
systems. MIS Quarterly, 37(1), 21–54. Retrieved from http://misq.org
Vilkinas, T., Cartan, G., & Saebel, J. (2012). Understanding managers of businesses in
desert Australia. Management Research Review, 35, 490–511.
doi:10.1108/01409171211238262
Vissa, B. (2011). A matching theory of entrepreneurs’ tie formation intentions and
initiation of economic exchange. Academy of Management Journal, 54, 137–158.
doi:10.5465/AMJ.2011.59215084
Volery, T., Müller, S., Oser, F., Naepflin, C., & del Rey, N. (2013). The impact of
entrepreneurship education on human capital at upper-secondary level. Journal of
Small Business Management, 51, 429–446. doi:10.1111/jsbm.12020
Vranceanu, R. (2014). Corporate profit, entrepreneurship theory and business ethics.
Business Ethics: A European Review, 23, 50–68. doi:10.1111/beer.12037
Welford, C., Murphy, K., & Casey, D. (2012). Demystifying nursing research
terminology: Part 2. Nurse Researcher, 19(2), 29–35.
doi:10.7748/nr2012.01.19.2.29.c8906
Welsch, D. H. B., Desplaces, D. E., & Davis, A. E. (2011). A comparison of retail
franchises, independent businesses, and purchased existing independent business
startups: Lessons from the Kauffman firm survey. Journal of Marketing
Channels, 18, 3–18. doi:10.1080/1046669X.2011.533109
133
Wester, K. L. (2011). Publishing ethical research: A step-by-step overview. Journal of
Counseling & Development, 89, 301–307. doi:10.1002/j.1556-
6678.2011.tb00093.x
Wielemaker, M., Gaudes, A. J., Grant, E. S., Mitra, D., & Murdock, K. (2010).
Developing and assessing university entrepreneurial programs: The case of a new
program in Atlantic Canada. Journal of Small Business and Entrepreneurship, 23,
565–579,649–650. Retrieved from
http://www.tandfonline.com/loi/rsbe20#.U96XqWMQG8B
Winkel, D., Vanevenhoven, J., Drago, W. A., & Clements, C. (2013). The structure and
scope of entrepreneurship programs in higher education around the world.
Journal of Entrepreneurship Education, 16, 15–29. Retrieved from
http://www.alliedacademies.org/entrepreneurship-education
Wright, M., & Stigliani, I. (2012). Entrepreneurship and growth. International Small
Business Journal, 31, 3–22. doi:10.1177/0266242612467359
Wlodarcqyk, B. (2014). Space in tourism, tourism in space: On the need for definition,
delimitation and classification. Turzym, 24, 25–34. doi:10.2478/tour-2014-0003
Wurthmann, K. (2013). Business students’ attitudes toward innovation and intentions to
start their own business. International Entrepreneurship and Management
Journal, 1–21. doi:10.1007/s11365-013-0249-4
Xavier, S. R., Kelley, D., Kew, J., Herrington, M., & Vorderwülbecke, A. (2013). Global
Entrepreneurship Monitor 2012 Global Report. Retrieved from
http://www.gemconsortium.org/docs/2645/gem-2012-global-report

134
Yallapragada, R. R., & Bhuiyan, M. (2011). Small business entrepreneurships in the
United States. Journal of Applied Business Research, 27(6), 117–122. Retrieved
from http://www.cluteinstitute.com/journals/journal-of-applied-business-research-
jabr
Yusoff, R., & Janor, R. (2014). Generation of an interval metric scale to measure attitude.
SAGE Open, 4(1), 1–16. doi:10.1177/2158244013516768
Zanakis, S. H., Renko, M., & Bullough, A. (2012). Nascent entrepreneurs and the
transition to entrepreneurship: Why do people start new businesses? Journal of
Developmental Entrepreneurship, 17(1), 1–25. doi:10.1142/S108494671250001X
Zarafshani, K., Cano, J., Sharafi, L., Rajabi, S., & Sulaimani, A. (2011). Using the
Myers-Briggs Type Indicator (MBTI(R)) in the teaching of entrepreneurial skills
at an Iranian university. NACTA Journal, 55(4), 14–22. Retrieved from
http://www.nactateachers.org/journal.html
Zellweger, T., & Sieger, P. (2012). Entrepreneurial orientation in long-lived family firms.
Small Business Economics, 38, 67–84. doi:10.1007/s11187-010-9267-6

135
Appendix A: Survey Instrument
Native American Entrepreneurship Survey
Thank you for taking the time to complete the voluntary survey below in its entirety. The
survey data will be entered into an electronic database for storage. Only the researcher will
have access to the data.
Part 1
1. – Before beginning your business, did you know other entrepreneurs. Indicate by
checking the box if you knew an entrepreneur in any of these categories personally.
□ Family □ Friend □ Employer / Manager
Attitudes toward entrepreneurship
2. Think back to before you began your business, indicate your level of agreement with
the following sentences. Indicate from 1 (total disagreement) to 7 (total agreement).
1 2 3 4 5 6 7
a- Being an entrepreneur implied more advantages
than disadvantages to me □ □ □ □ □ □ □
b- A career as an entrepreneur was attractive for me □ □ □ □ □ □ □
c- I wanted to start a firm □ □ □ □ □ □ □
d- Becoming an entrepreneur entailed great
satisfactions for me
□ □ □ □ □ □ □
e- Among various options, I chose to become an
entrepreneur
□ □ □ □ □ □ □
Subjective Norms
3. Think back to before you started/began your business, what did people in your
close environment approve of the decision? Indicate from 1 (total disapproval) to 7
(total approval).
1 2 3 4 5 6 7
a- Your close family □ □ □ □ □ □ □
b- Your friends □ □ □ □ □ □ □
c- Your colleagues □ □ □ □ □ □ □

136
Perceived Behavioral Control
4. Think back to before you began your business. To what extent would you have
agreed with the following statements regarding your entrepreneurial capacity? Value
them from 1 (total disagreement) to 7 (total agreement).
1 2 3 4 5 6 7
a- To start a firm and keep it working would be easy for me □ □ □ □ □ □ □
b- I was prepared to start a viable firm □ □ □ □ □ □ □
c- I could control the creation process of a new firm □ □ □ □ □ □ □
d- I knew the necessary practical details to start a firm □ □ □ □ □ □ □
e- I knew how to develop an entrepreneurial project □ □ □ □ □ □ □
f- I knew I would have a high probability of succeeding □ □ □ □ □ □ □
Entrepreneurial Intention
5. Think back to before you began your business, indicate your level of agreement with
the following statements. Indicate from 1 (total disagreement) to 7 (total agreement)
1 2 3 4 5 6 7
a- I was ready to do anything to be an entrepreneur □ □ □ □ □ □ □
b- My professional goal was to become an entrepreneur □ □ □ □ □ □ □
c- I planned to make every effort to start and run my own firm □ □ □ □ □ □ □
d- I was determined to create a firm in the future □ □ □ □ □ □ □
e- I had very seriously thought of starting a firm □ □ □ □ □ □ □
f- I had the firm intention to start a firm some day □ □ □ □ □ □ □

137
Part 2
1. How do you rate yourself on the following entrepreneurial abilities/skill sets?
Indicate from 1 (no aptitude at all) to 7 (very high aptitude).
1 2 3 4 5 6 7
a- Recognition of opportunity □ □ □ □ □ □ □
b- Creativity □ □ □ □ □ □ □
c- Problem solving skills □ □ □ □ □ □ □
d- Leadership and communication skills □ □ □ □ □ □ □
e- Development of new products and services □ □ □ □ □ □ □
f- Networking skills, and making professional contacts □ □ □ □ □ □ □
2. To what extent do you consider the following factors to contribute to entrepreneurial
success? Indicate from 1 (not at all important) to 7 (extremely important).
1 2 3 4 5 6 7
a- Earning business profit □ □ □ □ □ □ □
b- Reaching a high level of income □ □ □ □ □ □ □
c- Doing the kind of job I really enjoy □ □ □ □ □ □ □
d- Achieving social recognition □ □ □ □ □ □ □
e- Helping to solve the problems of my community □ □ □ □ □ □ □
f- Keeping the business alive □ □ □ □ □ □ □
g. Keeping a path of positive growth □ □ □ □ □ □ □
3. Indicate your level of knowledge about business associations, support bodies and other
sources of assistance for entrepreneurs from 1 (no knowledge) to 7 (complete
knowledge).
1 2 3 4 5 6 7
a- Private associations (e.g. i2e, Chambers of
Commerce, etc.) □ □ □ □ □ □ □
b- Public support bodies (e.g. SBDC, REI, etc.) □ □ □ □ □ □ □
c- Specific training for entrepreneurs □ □ □ □ □ □ □
d- Loans in specially favorable terms □ □ □ □ □ □ □
e- Technical aid for business start-ups □ □ □ □ □ □ □

138
Personal Data
1. Age: __________
2. Gender: □ Male □ Female
3. City of Residence: ______________________
4. State of Residence: _____________________________
5. Are you Native American? □ Yes □ No
6. Did you start the business that you currently operate? □ Yes □ No
7. How many years has your business been in operation? ________________
8. Did you record a business profit on the income statement of your most recent business
year?
□ Yes □ No
9. What is the highest level of education you have achieved?
□ Primary □ Secondary □ Vocational training □ University □ Other
10. Did you complete any entrepreneurial or business training before beginning your
business?
□ Yes □ No
11. Have you pursued any additional entrepreneurial training or counseling since
beginning your business?
□ Yes □ No

139
Appendix B: Permission to use Entrepreneurial Intention Questionnaire
From: Francisco Liñán [mailto:[email protected]]
Sent: Wednesday, May 15, 2013 1:56 AM
To: Bolin, Stacey D.
Subject: Re: entrepreneurial intention questionnaire
Dear Stacey,
Thank you for your interest in our work.
Please find attached 2 versions of the EIQ and the papers in which they were used.
…
You can used them as you feel is best, but do please acknowledge your source.
Best regards,
--
Prof. Francisco Liñán
Universidad de Sevilla // University of Seville
Av. Ramon y Cajal, 1. 41018 - Sevilla (Spain)
140
Appendix C: Email Message Sent to Participants
As a Native American business owner, I invite you to participate in a research study
examining Native American attitude towards entrepreneurship, subjective norms, and perceived
behavioral control and any relationship they might have to small business success. The study
could benefit both current and aspiring Native American business owners as well as the
tribal support offices by providing information to guide business support services. Study
participation involves completing a one-time survey that takes an average of 8 minutes to
complete. All invited participants will receive a 1-2 page summary of the final study
results. If you have any questions, you may contact me via email
([email protected]) or phone (580-559-5596). I am conducting this study in
partial fulfillment of the requirements for the degree of Doctor of Business
Administration from Walden University.
To participate in the study, click the link below to access the survey.

141
Appendix D: Letter Sent to Participants without Email Addresses
As a Native American business owner, I invite you to participate in a research study
examining Native American attitude towards entrepreneurship, subjective norms, and perceived
behavioral control and any relationship they might have to small business success. The study
could benefit both current and aspiring Native American business owners as well as the
tribal support offices by providing information to guide business support services. Study
participation involves completing a one-time survey that takes an average of 8 minutes to
complete. All invited participants will receive a 1-2 page summary of the final study
results. If you have any questions, you may contact me via email
([email protected]) or phone (580-559-5596). I am conducting this study in
partial fulfillment of the requirements for the degree of Doctor of Business
Administration from Walden University.
To participate in the survey, please review the consent letter before beginning the survey.
If you choose to participate after reviewing the consent letter, complete the two-page
survey, and return the survey in the included postage paid envelope. You may keep both
this letter and the informed consent document for your records.

142
Appendix E: Reminder Message Sent to Participants
Recently you received an invitation to participate in a study that could benefit both
current and aspiring Native American business owners as well as tribal business support
offices. The survey window is still open and your input as a Native American business
owner is desired. I invite you to participate in a research study examining Native
American attitude towards entrepreneurship, subjective norms, and perceived behavioral
control and any relationship they might have to small business success.
Study participation involves completing a one-time survey that takes an average of 8
minutes to complete. All invited participants will receive a 1-2 page summary of the final
study results. If you have any questions, you may contact me via email
([email protected]) or phone (580-559-5596). I am conducting this study in
partial fulfillment of the requirements for the degree of Doctor of Business
Administration from Walden University.
To participate in the study, click the link below to access the survey.

143
Appendix F: Reminder Phone Call Script
Recently you received an invitation to participate in a study that could benefit both
current and aspiring Native American business owners as well as tribal business support
offices. The survey window is still open and your input as a Native American business
owner is desired. I invite you to participate in a research study examining Native
American attitude towards entrepreneurship, subjective norms, and perceived behavioral
control and any relationship they might have to small business success.
Study participation involves completing a one-time survey that takes an average of 8
minutes to complete. All invited participants will receive a 1-2 page summary of the final
study results. If you have any questions, you may contact me via email
([email protected]) or phone (580-559-5596). I am conducting this study in
partial fulfillment of the requirements for the degree of Doctor of Business
Administration from Walden University.
Do you still have the original survey packet, or should I mail you another packet?
Thank you for your time.
144
Appendix G: Protecting Human Research Participants Certificate of Completion

145
Appendix H: Permission Letter to use Business Registry Data for Research Purposes
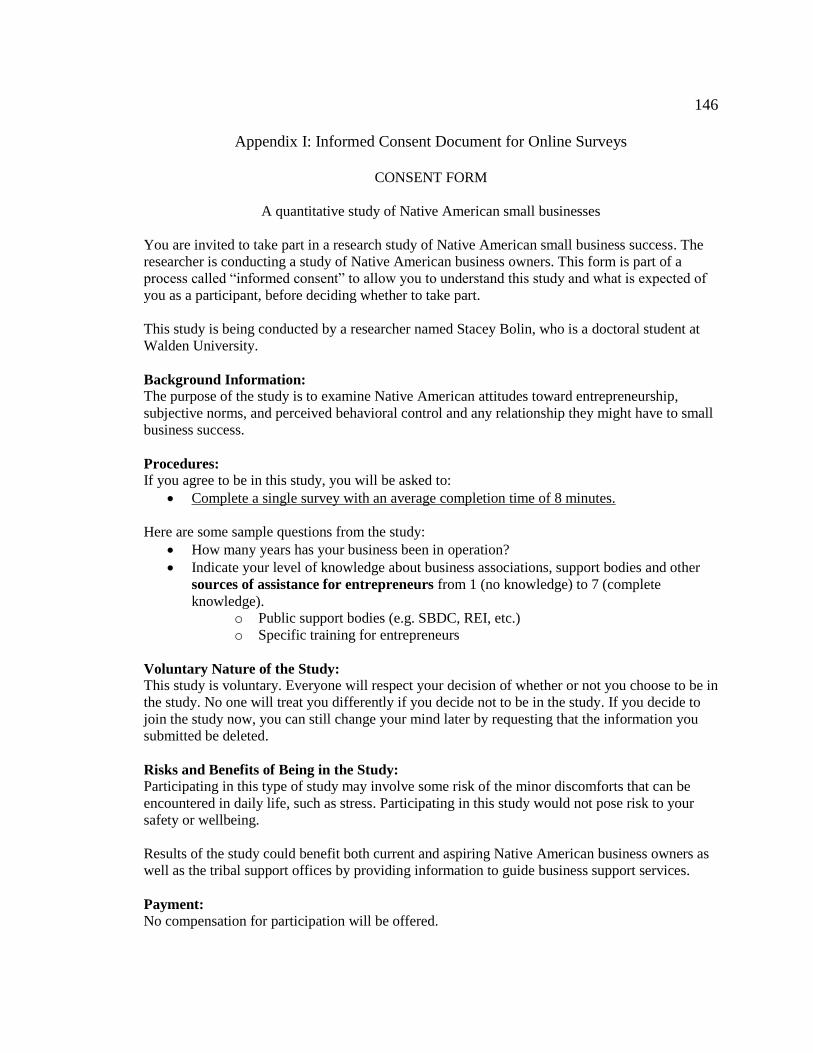
146
Appendix I: Informed Consent Document for Online Surveys
CONSENT FORM
A quantitative study of Native American small businesses
You are invited to take part in a research study of Native American small business success. The
researcher is conducting a study of Native American business owners. This form is part of a
process called “informed consent” to allow you to understand this study and what is expected of
you as a participant, before deciding whether to take part.
This study is being conducted by a researcher named Stacey Bolin, who is a doctoral student at
Walden University.
Background Information: The purpose of the study is to examine Native American attitudes toward entrepreneurship,
subjective norms, and perceived behavioral control and any relationship they might have to small
business success.
Procedures: If you agree to be in this study, you will be asked to:
Complete a single survey with an average completion time of 8 minutes.
Here are some sample questions from the study:
How many years has your business been in operation?
Indicate your level of knowledge about business associations, support bodies and other
sources of assistance for entrepreneurs from 1 (no knowledge) to 7 (complete
knowledge).
o Public support bodies (e.g. SBDC, REI, etc.)
o Specific training for entrepreneurs
Voluntary Nature of the Study: This study is voluntary. Everyone will respect your decision of whether or not you choose to be in
the study. No one will treat you differently if you decide not to be in the study. If you decide to
join the study now, you can still change your mind later by requesting that the information you
submitted be deleted.
Risks and Benefits of Being in the Study: Participating in this type of study may involve some risk of the minor discomforts that can be
encountered in daily life, such as stress. Participating in this study would not pose risk to your
safety or wellbeing.
Results of the study could benefit both current and aspiring Native American business owners as
well as the tribal support offices by providing information to guide business support services.
Payment: No compensation for participation will be offered.

147
Privacy: Any information you provide will be kept confidential. The researcher will not use your personal
information for any purposes outside of this research project. Also, the researcher will not include
your name or anything else that could identify you in the study reports. At no point will any
response you make in the survey be identified with you. Data will be kept secure by not
associating names or email addresses with survey data and, by storing survey data in a password-
protected file on a password-protected computer that only the researcher will be able to access.
Data will be kept for a period of at least 5 years as required by the university, and then securely
destroyed.
Contacts and Questions: You may ask any questions you have now. Or if you have questions later, you may contact the
researcher via email at [email protected] or by phone at 580-559-5596. If you want to
talk privately about your rights as a participant, you can call Dr. Leilani Endicott. She is the
Walden University representative who can discuss this with you. Her phone number is 612-312-
1210. Walden University’s approval number for this study is 06-30-15-0390849 and it expires on
June 29, 2016.
Please print or save this consent form for your records.
Statement of Consent: I have read the above information and I feel I understand the study well enough to make a
decision about my involvement. Completing and submitting the survey will indicate your consent
to participate. By clicking the link below, I understand that I am agreeing to the terms described
above.

148
Appendix J: Informed Consent Document for Mailed Surveys
CONSENT FORM
A quantitative study of Native American small businesses
You are invited to take part in a research study of Native American small business success. The
researcher is conducting a study of Native American business owners. This form is part of a
process called “informed consent” to allow you to understand this study and what is expected of
you as a participant, before deciding whether to take part.
This study is being conducted by a researcher named Stacey Bolin, who is a doctoral student at
Walden University.
Background Information: The purpose of the study is to examine Native American attitudes toward entrepreneurship,
subjective norms, and perceived behavioral control and any relationship they might have to small
business success.
Procedures: If you agree to be in this study, you will be asked to:
Complete a single survey with an average completion time of 8 minutes.
Here are some sample questions from the study:
How many years has your business been in operation?
Indicate your level of knowledge about business associations, support bodies and other
sources of assistance for entrepreneurs from 1 (no knowledge) to 7 (complete
knowledge).
o Public support bodies (e.g. SBDC, REI, etc.)
o Specific training for entrepreneurs
Voluntary Nature of the Study: This study is voluntary. Everyone will respect your decision of whether or not you choose to be in
the study. No one will treat you differently if you decide not to be in the study. If you decide to
join the study now, you can still change your mind later by requesting that the information you
submitted be deleted.
Risks and Benefits of Being in the Study: Being in this type of study may involve some risk of the minor discomforts that can be
encountered in daily life, such as stress. Being in this study would not pose risk to your safety or
wellbeing.
Results of the study could benefit both current and aspiring Native American business owners as
well as the tribal support offices by providing information to guide business support services.
Payment: No compensation for participation will be offered.

149
Privacy: Any information you provide will be kept confidential. The researcher will not use your personal
information for any purposes outside of this research project. Also, the researcher will not include
your name or anything else that could identify you in the study reports. At no point will any
response you make in the survey be identified with you. Data will be kept secure by not
associating names or email addresses with survey data and, by storing survey data in a password-
protected file on a password-protected computer that only the researcher will be able to access.
Data will be kept for a period of at least 5 years as required by the university, and then securely
destroyed.
Contacts and Questions: You may ask any questions you have now. Or if you have questions later, you may contact the
researcher via email at [email protected] or by phone at 580-559-5596. If you want to
talk privately about your rights as a participant, you can call Dr. Leilani Endicott. She is the
Walden University representative who can discuss this with you. Her phone number is 612-312-
1210. Walden University’s approval number for this study is 06-30-15-0390849 and it expires on
June 29, 2016.
You may keep this consent form for your records.
Statement of Consent: I have read the above information and I feel I understand the study well enough to make a
decision about my involvement. To protect your privacy, no signature confirming consent will be
collected. Completing and returning the survey will indicate your consent to participate. By
completing and returning the survey, I understand that I am agreeing to the terms described
above.

150
Appendix K: IRB Approval Letter