benchmark index is a business link service cranfield ...€¦ · benchmark index is a business link...
TRANSCRIPT

Benchmark Index is a Business Link ServiceFor further information contact Benchmark Index atField House, Mount Road, Stone, Staffordshire. ST15 8LJBenchmark Index Hotline 08700 111143e-mail [email protected] www.benchmarkindex.com
Cranfield University - School of ManagementData analysis in this publication has been carried out by the Centrefor Business Performance at the Cranfield School of Management,Cranfield University. The analysis has been headed by the Centre’sDirector, Professor Andy Neely with support from Chris Adams.
URN 02/345
CTG 3 - AW 20/9/02 9:28 am Page 1

Closing the Gap 3
CTG 3 - AW 20/9/02 9:28 am Page 2
Contents
3 introduction to Benchmark Index
4 executive summary
6 sector comparisons
11 case study - contract trade frames
21 case study - linden foods
22 closing the gap
32 appendix 1. benchmarking glossary
34 appendix 2. public policy implications
36 appendix 3. benchmark data sources
37 appendix 4. benchmark index analysts
38 case study - aqua cure
2
CTG 3 - AW 20/9/02 9:28 am Page 3

3
Benchmark Index
Benchmarking can play a key part in boosting business performance.
Benchmarking provides a structured process that enables individual businesses to
measure their performance in key areas, such as staff retention levels and
productivity. It also provides an opportunity to compare that business with its
sector’s counterparts.
Acting on the findings of the snapshot of where the business is now can make a
real difference to where that business goes in the future.
Facilitated by trained business advisers, the Small Business Service’s Benchmark
Index takes a holistic look at a company in around 80 aspects of performance,
highlighting strengths and weaknesses and resulting in an action plan from which
organisations can develop the policies and strategies that will enable them to bring
about sustained improvement.
This approach has proved remarkably successful, with over 6,000 companies
having benefited from the service since its introduction in late 1996, resulting in
Benchmark Index’s current position as the biggest service of its kind in the world.
Indeed, the companies that have taken part
have boosted their profits by tens of
thousands of pounds.
A by-product of this extensive benchmarking
activity has been the accumulation of a
considerable amount of performance data, which
has provided a mine of information in recent years
on trends in SME performance across the board.
So not only do individual businesses reap the benefits of benchmarking, but it
also helps the Government to make decisions to help the small business sector.
This report draws extensively upon the invaluable information resource that
Benchmark Index has amassed and provides telling insights into company
performance and also presents potential lessons that managers and policy
makers may utilise to set a course for future development.
It is an important contribution to the drive for improved productivity and
competitiveness.
Nigel Griffiths - Minister for Small Business
over 6,000companies havingbenefited fromthe service sinceits introduction
CTG 3 - AW 20/9/02 9:28 am Page 4

6
Executive summary
At one point in the new economy, people were waitingfor normality to return. Today, many acknowledgethat they can not even define what normal is anymore.We are living today in an economy where the fastsimply eat the slow! The painful upheavals in somany companies in recent years reflect the failureof one-time industry leaders to keep up with theaccelerating pace of industry changes.
The painful upheavals in so many companies in recent years
reflect the failure of one-time industry leaders to keep up
with the accelerating pace of industry changes.
Organisations need to continually re-think their structures,
products, processes, and markets. They must re-establish
themselves to be quicker to market, more customer focused,
more innovative, nimbler, flexible and to handle rapid
change. This continuous change and improvement translates
into one key capability that no future organisation can afford
not to excel in - continuous learning. Learning from one’s
own mistakes, learning from industry leaders, learning from
competitors, customers, suppliers, academic partners, and
other sectors. A main tool in this learning arsenal is
benchmarking; Benchmarking one’s performance with the
world’s best and adapting and adopting best practice as
appropriate. This type of comparing, studying, adapting, and
learning from other’s best practices is not simply popular, but
virtually mandatory for future success.
Moreover, this learning through benchmarking should
not only relate to traditional views of performance (namely
financial) but should cover a balanced portfolio of practices
and capabilities that ensure both short and long term
success. Managers now have to take a balanced view of the
organisation and must manage and improve all aspects from
shareholders’ requirements to customer satisfaction to
employee motivation to corporate social responsibility.
Developing best practice through benchmarking
features as a critical activity in the business world. Companies
across the globe have embraced these concepts, but have
done so with a varied level of success. Some have managed
to create huge market place advantages, whilst others have
fared less favourably. In this regard, this report aims to
provide some insights to help UK managers and public
policy makers to set a course for future development. Relying
on data gathered using Benchmark Index, the report
presents performance comparisons and potential lessons
from the Manufacturing and Service sectors in the UK.
The organisations that took part in the study used
Benchmark Index as the main tool to submit data that
allowed over 60 performance measures to be calculated
under the general headings of finance, customers, suppliers,
employee, growth and future investments.
4
Benchmarking - comparing, studying,adapting and learning from other’s bestpractices is not simply popular, but virtuallymandatory for future success.
CTG 3 - AW 20/9/02 9:28 am Page 5

The average organisationin the UK is spendingaround £140 peremployee per annum ontraining & development.This is equivalent to anaverage employeereceiving one day of poorquality training each year!
In both service andmanufacturingsectors, turnoverper employee inthe upper quartileis at least doublethat of the lowerquartile
The bottom 25%
receive 3 times
more complaints
per customer
than the top 25%
25% of firms (acrossall sectors) aredestroying valueand achieving lessthan half of theaccepted cost ofcapital
On average, upper
quartile firms
spend at least four
times as much on
marketing than do
lower quartile firms
The top 25% oforganisations in theUK are achievingaround eight timesmore return on capitalthan the bottom 25%This is a huge gap invalue creation
5
CTG 3 - AW 20/9/02 9:28 am Page 6

Sector comparisons - financial performance
The sector comparison uses eight sectors, illustrated inthe Sector Coding table below. Benchmark Index uses a series of measures to track the financial performanceof companies. Clearly there are differences within thesectors when it comes to the benchmarking data andthis section will show that companies in all sectors canbe potentially successful with the right combination ofpeople, product and processes.
Sector coding
Sector
■ Chemical■ Metal products■ General machinery■ Electrical & electronic■ Food, drink & tobacco■ Transport manufacture■ Manufacturing (all sectors)
■ Service industries (all sectors)
6
Financial performance
Benchmark Index relies on two subcategories of measures to track the financialperformance of firms. These are – (i) sales and profit performance, and (ii) valuecreation and asset management.
Colour codingIn the graphs throughout the this section, the various industry sectors arerepresented by a specific colour as indicated in the table below.
section one
CTG 3 - AW 20/9/02 9:28 am Page 7

Given that these firms are operating in more or less the same
markets, from the same country, and thus arguably subject to
similar external conditions and pressures, one can conclude
that those in the top 25% are managing their operations in a
way that is resulting in no less than double the sales per
employee. This is a huge difference, and is only the first
measure in this report that shows what a difference
advanced management and operations can make.
Moreover, when comparing different sectors based on their
reported sales turnover per employee, the following is noted:
• on average, the service sector has the lowest sales
turnover per employee (less than all the
manufacturing sectors)
• within the manufacturing sectors, there are variations
between upper quartile organisations where the
Chemical and Food, Drink, and Tobacco sectors have
markedly higher (20% or more) sales turnover per
employee than other sector averages.
However, the sales turnover is just one aspect, and it is
interesting to note who is retaining most of their sales
turnover as profit. In terms of pre-tax profit per employee the
service sector is ahead of all others. One reason could be to
do with the fundamental differences between service and
manufacturing industries where the service sector has a
mush smaller cost base in terms of physical assets (and all
the related fixed costs like maintenance, machine
depreciation, etc.). In numbers, the service sector is making
double the pre-tax profit per employee than the
manufacturing sector. Within the manufacturing sector, it is
interesting to note that while the Food, Drink, and Tobacco
sector had the highest sales turnover per employee, it has
the lowest pre-tax profit per employee levels. Within this
sector, this might be explained not by the lack of good cost
management practices, but by the low margins the end
products in the sector command from the external customer.
Food, Drink and Tobacco command premium prices in the UK
market but a huge proportion of these do go to the cost
base and governmental taxes. On the other hand, we note
that the Electronics sector is achieving the highest pre-tax
profits per employee in the manufacturing industry (and very
comparable to the service results).
The differences between the upper and lower quartile
firms in terms of pre-tax profits per employee are startling.
On average, and for all sectors, the bottom 25% organisation
are making 10% (or less) of the pre-tax profit per employee
the top 25% organisations are making. Again, when we
consider that those organisations are operating under the
same regulations, same markets, and have the potential to
command similar premiums, then the implications are that
the upper quartile organisations either have much better
cost base management, superior marketing and brand
management practices for market penetration and growth,
or a combination of both. Whatever it is, there are a lot of
lessons that need to be learned by the median and lower
quartile organisations, and fast.
These figures and argument points are again reflected in
the data regarding the per-tax profit levels as a percentage of
turnover, where the service sector is achieving around 6% while
the average for the manufacturing sector is no more than 4%,
with upper quartile organisations in both sectors achieving 16%
and 10% respectively. Across all sectors, this percentage is, on
average, 1% for lower quartile organisations and the variation is
startling when studied in each sector between upper and lower
quartile organisations.Within the manufacturing industry, the
Electronics sector seems to be ahead by a comfortable margin
in terms of per-tax profit as a percentage of turnover while the
Food, Drink and Tobacco sector seems to be doing the worst.
This is the opposite of the sale turnover per employee picture
and does highlight the importance to study the cost
management practices of the Electronics sector.
0
2000
4000
6000
8000
10000
12000
14000
Pre-tax profit per employee (£)
lower quartile median upper quartile0
2
4
6
8
10
12
14
16
18
Pre-tax profit/turnover (%)
lower quartile median upper quartile
Sales and profit performance
When looking at the sales turnover per employee, thegap between the upper quartile and lower quartileorganisations in all UK industry sectors is evident.On average, and within the Manufacturing sector as awhole, sales turnover per employee in the upper quartileorganisations is double that in the lower quartile ones,while in the service sector, the ratio is more than double.
0
20000
40000
60000
80000
100000
120000
Sales turnover per employee (£)
lower quartile median upper quartile
7
CTG 3 - AW 20/9/02 9:28 am Page 8

0
5
10
15
20
25
30
35
40
45
Return on capital employed
lower quartile median upper quartile0.0
0.5
1.0
1.5
2.0
2.5
Acid test
lower quartile median upper quartile0
5
10
15
20
25
30
35
40
45
Return on net assets
lower quartile median upper quartile
Value creation & asset management
The key to achieving these goals is through successful asset
management, which is related to the firm’s strategy.
Strategies vary based on the firm’s sector, stage in the life
cycle, external conditions and so on. Well planned and
managed strategies usually have short and long terms
visions and tactics. In this regard, some organisations might
accept low returns in the short term if they are investing in a
major project and/product for the long term. All
organisations will require a form of investment at every life
stage they go through. Depending on the firms’ size, risk
factors, and management
strategies and views, the
investment can come from banks,
venture capitalists or private
finance. A key role of management
is to optimise the amount of
capital that has to be invested and,
more importantly, to maximise the
return on that investment. In the
longer term, however, it is essential
that the return on capital
employed and the return on net assets is driven up.
Two significant levers for driving up returns can be
identified through Benchmark Index data – cash
management and overhead management.
Cash rich investors have various options to invest in
today’s markets. The main options are usually investing them
in firms on the stock market or simply in banks and bonds.
Should one choose the latter option, the investor can achieve
a guaranteed return of approximately 3-4% by placing the
money in no risk bonds. However, one must consider
inflation (roughly 2-3%) which will result in the money
becoming worthless over time. Add to that the tax that has
to be paid on any returns received (equivalent to another
3%). These numbers amount to the cost of capital being in
the region of 8-10%. Therefore, if an organisation is
generating less than 8-10% return on capital employed, then
the capital that has been invested will effectively be worth
less at the end of the investment period than it was at the
start, and the firm is effectively destroying value.
From the data we have from UK organisations, 25% of UK
organisations (across all sectors) are destroying value and
achieving less than half the accepted cost of capital.
Moreover, the variations between upper and lower quartile
firms are startling. The top 25% of organisations are
achieving around eight times more return on capital that the
bottom 25%. This is a huge gap in value creation. A closer
look also reveals that service organisations are also ahead of
all other sectors in the upper quartile results where the top
25% service organisations are achieving a return on capital of
just over 40% while the average of their manufacturing
counterparts and just under 30%. It is noted however that
within the manufacturing industry, the Electronics sector and
the Food, Drink and Tobacco are both achieving better
median return on capital employed than the service, and
indeed, manufacturing averages.
While sales and profit performance data are useful inassessing how well a firm is performing, they do notreflect the whole picture. Indeed, their mainshortcoming as measures is that they do notestablish whether or not a firm is creating value.Organisations need to create value by demonstratinghigh returns on capital and net assets.
8
25% of UK organisationsare destroying value -
achieving less than halfthe accepted cost
of capital
value
CTG 3 - AW 20/9/02 9:28 am Page 9

900
20
40
60
80
100
120
Debtor days
lower quartile median upper quartile0
2
4
6
8
10
12
14
Cash in bank/turnover (%)
lower quartile median upper quartile0
5
10
15
20
25
Interest cover
lower quartile median upper quartile
The picture for return on net assets is equally alarming, with
the bottom 25% organisations all achieving percentages
below 3% and the average manufacturing median is just over
10%. Again, the upper quartile firms are ahead by comfortable
margin (up to 8 times more in the case of the Service and
Electronics sectors).What is interesting is that while in the
upper quartile Service organisations are ahead of the
manufacturing average (manufacturing 27%, service 41%), one
sector in manufacturing (Electronics) is achieving levels similar
to those of the Service sector in the upper quartile range and
is achieving higher return on net assets in the median range.
The key to achieving high return on capital and return
on net assets is asset management. Clearly from the data we
have, there seem to be some sectors, like Service and
Electronics, that seem to be doing something better than the
others. Experience shows that there are two main
components to driving up these returns, namely managing
the organisation’s cash and its overhead.
In this context, the acid test can be a very useful
indicator. The acid test compares the value of liquid assets to
the value of current liabilities. If the ratio is less than 1 it
means that the organisation does not have enough liquid
assets to cover its current liabilities. Looking at the UK
industry sectors, over 25% of them do not seem to have
enough liquid assets to cover liabilities. All the lower quartile
organisations, along with some median ones (such as Food,
Drink and Tobacco) fall in this category. Moreover, the gap is
again evident between upper quartile and lower quartile
organisations. It is interesting to note here that the Service
sector is among those with the worst acid test ratio amongst
all sectors, lower than the manufacturing average, and far
behind manufacturing sectors like Electronics.
A significant reason why so many firms have a problem
with the acid test is that they have very little, if any, cash in
the bank. Lower quartile firms have, on average, less than
0.5% of their sales turnover as cash in the bank. Even the
median firms only have around 3% of their sales turnover as
cash in the bank. Interestingly upper quartile firms are cash
rich and have, on average, 10% of their sales turnover as cash
in the bank. Within the upper quartile, there are also
significant variations. The Service sector demonstrates a
higher percentage than the overall manufacturing sector but
less than specific sectors within manufacturing like
Electronics and General Machinery. It is interesting to note
that while the Service sector reports some of the highest
percentages of cash in bank, they still reported the lowest in
the acid test measure – potentially revealing higher liabilities.
In fact, the more revealing numbers are the percentages
reported by the upper quartile firms within the
manufacturing sector. Organisations in the Electronics and
General Machinery have more than 12% of their sales as cash
in the bank, Chemical and Food, Drink, and Tobacco sectors
have over 8%. There might be a lesson here for all the upper
quartile firms as rather than simply leaving cash in the bank,
some of these firms should be looking to expand their
investments, most of all in high paced sectors like Electronics
where research is generating daily changes.
Having studied their incoming cash practices, we can
now look at the organisations debts and how they manage
those. Interest cover measures the proportion of profits that
are required to cover interest payments. On this dimension of
performance the difference between upper and lower
quartile firms varies between 7 and over 22 depending on
the sector. That is, some firms are spending 7 - 22 times as
much of their profits as others to simply cover interest
payments. The sectors particularly badly hit by this are the
General Machinery, Electronics, and Services (confirming the
earlier notes on its liabilities). It is interesting to note here
that the same three sectors have previously scored the
highest cash in bank as percentage of turnover.
On top of having to make these interest payments (resulting
in the firms having such small amounts of cash),
organisations are having to wait, on average, for 70 days
before their debts are settled. Even upper quartile firms suffer
with an average number of debtor days of just under 52.5.
However, this still compares very favourably with lower
quartile firms, who have to wait on average of 90 days before
their debts are settled. Looking at differences between
sectors, the organisations in the Service sectors upper
quartile seem to demonstrate best practice and are thus the
ones to learn from with an average debtor days of 24. Within
the manufacturing industry, the least number of days was
reported by the Food, Drink and Tobacco organisations. On
the other hand, the worst performers are the lower quartile
firms in the Metal Products and Electronics sectors that
averaged over 100 days.
lower quartile companies are having
to wait over 90 days to have their
invoices paid... at the same time
they spend between 7-22 times the
amount of upper quartile companies
simply covering interest payments
9
CTG 3 - AW 20/9/02 9:28 am Page 10

0
1
2
3
4
5
6
7
8
Direct to indirects
lower quartile median upper quartile0
2
4
6
8
10
12
14
Number of employees per manager
lower quartile median upper quartile
Value creation & asset management
The final piece in the financial puzzle is the overhead
management. In this area, the top 25% organisations across
all sectors reported having at least double the ratio of directs
to indirect than those in the bottom 25%. This means that
the lower quartile firms require around two times as many
indirect employees as do upper quartile firms with the same
number of direct employees. The better performers are
noted to be the Service sector along with the Food, Drinks,
and Tobacco firms, while the worst performing sector is
Electronics. These differences, in the ratio of directs to
indirect, can stem from various reasons. They do however
point to one main issue, which is that lower quartile firms
require far greater management
intervention to run their business
process. Whether this is due to
poorly designed process, lack of
employee ability and skills, or
management style is not clear.
Quality management and Business
Excellence advocates would argue
that there are various practices
that have been preached for some
time to help organisations improve
their business processes and
develop performance measurement and management
systems that would streamline operations and minimise
management interventions (the traditional command,
inspect, and control manner which is now seen as a waste of
resources). Still, the data shows that while upper quartile
organisations seem to have understood and implemented
the better practices, median and lower quartile firms have a
lot of learning and improvement to pursue.
The same themes are also reflected in the data regarding
the number of employees per manager, which swings from
14 in upper quartile organisations in the Food, Drink and
Tobacco to just over 2 in lower quartile Service organisations.
Overall, and as an average of the whole UK sample, managers
are responsible for just under 8 employees. Managers in
upper quartile firms are responsible for at least double the
employees as are managers in lower quartile firms. This lends
support to the argument that the lower quartile firms require
more management intervention, because they have not
taken control of their basic business processes and indeed
do not trust their performance measurement systems to
monitor and control the operation. Experience has shown
that leading organisations have all focused on empowering
employees to reduce the need for control. Employees are
given the support and development they need to be able to
handle larger responsibilities with less control. At the same
time, leading organisations have focused on state of the art
performance measurement systems to help act as means of
improvement, control, warning, and navigation systems thus
reducing the need for traditional managers who used to be
mainly inspectors over other people’s work and acting as the
‘process police’.
10
8xthe top 25% of organisations areachieving around eight times more
return on capital than the bottom 25%
managers in the upperquartile are responsible
for at least double theamount of employees as
their lower quartileequivalents
CTG 3 - AW 20/9/02 9:28 am Page 11

Case Study
ContractTrade
Frames
Contract Trade Frames started business in South Wales in
1997 with just Alun and two colleagues using a converted
school as premises to make windows, doors and
conservatories for sale to building contractors. Over the next
four years the staff grew to 43 and the company relocated to
a modern industrial estate on the outskirts of Cardiff. In 2001
the company achieved sales of more than £2m on which it
made profits of 11%.
By the end of 2001, Contract Trade Frames was working
regularly for 12 different house builders including Westbury,
Wilcon Homes and Kings Oak Homes. At any one time its
products were being supplied to more than 30 building sites,
varying in size from ten to 200 homes. The value of sales
ranges from £1400 to £12,000 per property, depending on
the number and specification of windows and doors.
"Our rapid growth has been based on very simple
principles," says Alun. "We make quality products and we
deliver them promptly to our customers, exactly when and
where they are required. It might sound so simple it’s crass,
but there are lots of rival companies that cannot even get
those basics right."
Alun knew his company would have to reach greater
heights if it was to achieve his sales targets of £3m in 2002
and £10m by 2004. He sought advice from business adviser
John Huish of Fooks Business Development, who strongly
recommended Benchmark Index as a way of quantifying
the company’s strengths and weaknesses against
comparable firms.
"It was an easy process," says Alun. "John was able to
draw on information that was readily available and came
back a week later with the results and his analysis."
Benchmark Index showed Contract Trade Frames was
achieving a high standard in terms of production quality,
internal controls and customer relations. But it was very
unimpressive in having achieved no formal qualifications
and its future was threatened by the fact it was under
funded and over-trading.
"We took immediate action," says Alun. "We set about
gaining accreditation such as ISO 9001 for design and
manufacturing and ISO14001 for environmental care, as well
as Investors In People and Secure by Design."
Despite increasing prices to raise money, funding
remained an issue, so Alun agreed a package of financial
support from UK Steel Enterprise and Welsh Fund Managers.
Benchmark Index report was helpful in supporting the case
for investment. "Benchmark Index has helped us in lots of
ways," says Alun. "It provided a real boost for our
management team in helping us identify where to focus our
attentions. Doing Benchmark Index regularly – as we now do
every year - is an excellent discipline."
"I really don’t know why every business doesn’t get
benchmarked," Alun adds. "They are really missing
something valuable. The only thing that can be holding some
people back is a lack of professionalism – and they are the
ones who are going to be the losers."
Benchmark Index is a business must. I reallydon’t know if we would have achieved so much if wehadn’t done it. But now we have been through thebenchmarking process and seen how much it has tooffer, it has become a regular part of our business.Alun Ware - Managing Director, Contract Trade Frames
“”
11
It was an easy process, Johnwas able to draw on informationthat was readily available andcame back a week later withthe results and his analysis.
“”Alun Ware - Managing Director, Contract Trade Frames
CTG 3 - AW 20/9/02 9:28 am Page 12

0
1
2
3
4
5
6
Complaints per customer (%)
lower quartile median upper quartile0
1
2
3
4
5
6
7
8
9
Complaints per order (%)
lower quartile median upper quartile
0.0
0.2
0.4
0.6
0.8
1.0
1.2
1.4
1.6
1.8
2.0
Order value of complaints/turnover (%)
lower quartile median upper quartile0
5
10
15
20
25
30
35
Order not delivered on time (%)
lower quartile median upper quartile0.0
0.5
1.0
1.5
2.0
2.5
3.0
Order rejected during warranty (%)
lower quartile median upper quartile
Customer perspective
The statement that ‘the customer is king’ is now more
valid than ever. This is an age where customers have vast
choice of products and services, and the internet is giving
more power to these customers by providing knowledge
and the ability to compare products and services globally.
In this context, customer focus is
the key driver for sustainability
and measuring customer
satisfaction, and managing it as a
process becomes crucial. It is
important to realise here that
various sources of research work
have demonstrated that only one
out of ten dissatisfied customers
actually complain while each
dissatisfied customer will tell of his/her experience to up
to ten other people. This, in an age where even loyal
customers are more liable to move to a competitor
offering marginally better value propositions. Thus, it is
crucial for firms to realise that no customer dissatisfaction
(absence of complaints) does not equate to customer
satisfaction. Moreover, zero complaints per customer
might simply indicate that the firm does not make it easy
for frustrated customers to complain and has no
mechanism in place for capturing, and presumably
resolving, complaints once they are received.
In capturing data about customer satisfaction,
Benchmark Index acknowledges the fact that it is a
complex and multi-dimensional issue. The data captured
thus comprises various indicators of customer
satisfaction and covers: complaints per customer,
complaints per order, order value of complaints as a
percentage of turnover, orders not delivered on time as a
% of total orders and orders rejected during warranty as
a % of total orders.
The customer is king. Without customers thereare no revenues, profits or any value to theshareholders. Yet, many organisations these daysseem to forget this fact and take the customer forgranted. In today’s competitive environment, excellentservice is quickly becoming an organisation’s ‘licenceto practice’ as opposed to a competitive advantage.
it is crucial for firms torealise that no customerdissatisfaction does not
necessarily equate tocustomer satisfaction
12
CTG 3 - AW 20/9/02 9:28 am Page 13

Overall, the median number of complaints per customer
across the UK manufacturing industry is 0.6% (i.e. an average
of 6 complaints per 1000 customers) while the service sector
is averaging 0.5 complaints per 1000 customers (0.05%). The
data on complaints per customer reveals three major points:
1. Although lower quartile organisations are averaging
less than 2% complaints per customer, these figures are
at least three times more than what the upper quartile
organisations reported. Thus, again, there is a major gap
between the top 25% and bottom 25% and a lot of
learning and knowledge transfer can, and should, take
place in either direction as the reason for this gap might
be that those reporting higher percentages have better
measurement systems that capture such data, cultural
differences that encourage people to complain more
often, or simply have more defectives in their outputs.
2. Within all sectors, the Service sector is the one
reporting the least percentage of complaints per
customer. It is not clear if this is due to the Service
sector providing better value (less defects) or if it is
that customers are more prone to complain about
manufactured goods (tangible complaints).
3. Within manufacturing, the Chemical sector is reporting
almost five times the average percentage of complaints
per customer across all the categories (lower quartile,
median, and upper quartile). The data does not reveal
the causes, but it clearly points out to that either the
sector needs immediate attention to this issue, or that it
is more strictly regulated (due to nature of products) and
thus has to capture these complaints more systemically.
From another angle, Benchmark Index collects data on the
complaints per order (%). This is usually revealing as many
organisations find it easier to capture complaints in this
format as opposed to the previous (per customer). Indeed,
the data reveals that the percentage complaints per order
are slightly higher across the board which give more backing
to the theory that while they cannot track complaints per
customer, firms seem to be able to track complaints by
orders, a reflection of most traditional accounting systems
where the unit cost is the measure basis. The average for
manufacturing organisations here is that they report 13
complaints per 1000 orders while the service organisations
average 6. Interestingly, the Chemical sector is reporting the
least number of complaints per order (possibly indicating
that they do not capture their data in this format and focus
on per customer basis). However, comparing service with
manufacturing, the Service sector is still reporting the least
percentage of complaints per order. This data might be
useful for some cross learning. The numbers are not
necessarily telling us that service providers have better
processing capabilities, or better processes. It might be
indicating that due to the nature of the service delivery
process and the face-to-face engagements, issues might be
quickly resolved by competent staff as they arise and before
they escalate to a complaints.
For both sets of measures, the comments made earlier
apply. These low percentage of complaints are not automatic
symptoms of good performance. Instead they may be noting
that the organisation does not make it easy for customers to
complain, or potentially does not capture the data when the
customer does complain.
The third customer related measure analysed is the order
value of complaints as a percentage of turnover. This
measure illustrates what proportion of the firm’s total order
value spent on resolving customer complaints and is usually
a good wake up call. The bottom 25% performers receive
complaints totalling about 1.5% of their orders by turnover,
which comes straight off the bottom line. More worrying is
the well known fact that this reflects the direct costs
associated with the complaint and is usually accompanied by
a substantial set of hidden costs (potentially more than the
direct cost itself ) – i.e. the cost of collecting the faulty
goods/services, replacing them, scrapping them (if necessary)
and re-building the relationship with the customer (when
possible). Within the bottom 25% firms The General
Machinery seems to be doing the worst (potentially due to
the nature of the industry and size of the orders). Across the
sectors, the better performers in this measure were the
Service sector and Chemical sector. While expected in the
case of the services (who reported the least complaints per
customer and per order), it is interesting to see the Chemical
sector in this category as firms there reported the highest
complaints per customer. Upper quartile firms claim that the
order value of complaints they receive is less than 0.18% on
average emphasising the gap and learning opportunities.
Another measure that is incorporated in Benchmark
Index is delivery on time. The definition of ‘on time’ can vary
from sector to sector, but the benchmark definition is ‘on
time in full’ (OTIF) – i.e. everything the customer ordered
should be delivered at the time requested by the customer.
The data from this measure is alarming, mostly for the lower
quartile organisations who, on average, do not deliver on
time for 15.6% of the orders. In an age where this customer is
king and competitors are fiercely fighting to gain their
business, 15.6% of the orders not delivered on time could
mean 15.6% of the customers defecting to another supplier
(due to lack of operational efficiency on the firm’s side, i.e.
‘pushing’ customers away). On the other hand, upper quartile
organisations reported only 2% of the orders not delivered
on time. While the goal for everyone should be 100% on time
delivery, there is a huge gap between the bottom 25% and
the top 25%. Within the manufacturing sector, the best
performers seem to be Food, Drink, and Tobacco sector (as
one would expect by an industry strongly governed by
product freshness and expiry dates), and the worst
performers are General Machinery.
Finally, the measure of % of orders rejected during warranty
is analysed.While the top 25% organisations have reported less
than 0.5%, the bottom 25% have another significant gap (and
thus learning) to think about, as they are averaging 1.7%.
13
CTG 3 - AW 20/9/02 9:28 am Page 14
0
5
10
15
20
25
30
Early leavers/total employees (%)
lower quartile median upper quartile
0
5
10
15
20
25
30
35
40
45
New leavers/total employees (%)
lower quartile median upper quartile0
5
10
15
20
25
30
35
40
45
New employees/total employees (%)
lower quartile median upper quartile
0
1
2
3
4
5
6
7
8
9
10
Days lost to absenteeism per employee
lower quartile median upper quartile0.0
0.1
0.2
0.3
0.4
0.5
0.6
0.7
Accidents per employee
lower quartile median upper quartile
People - the employees perspective
It is firmly believed that the success of an organisation lies
more in its intellectual and systems capabilities than in
physical assets. Without altering human knowledge, skill, and
behaviour, change in technology, processes, and structures is
unlikely to yield long-term benefits. People are not the most
important resource of the organisation, they are the
organisation. Everything else is part of a ‘system’ that can be
implemented, copied, adapted, removed, and improved by
people.
Research and experience clearly note that although the
statement so often articulated ‘the most important resource
of this business is its people’ is
increasingly meaningful, not
merely as rhetoric but also in
practice, the type of people that
today’s organisations require, and
are dealing with, today and
tomorrow, are different from a
decade ago.
In an age defined as the
‘knowledge’ era, organisations depend more and more on
fewer people; people whose loyalty can no longer be assumed
but rather must be earned and retained, then clearly they need
to be concerned about how they utilise them, develop them
and resource them and about the opportunities for rewards,
promotion and success which they provide.
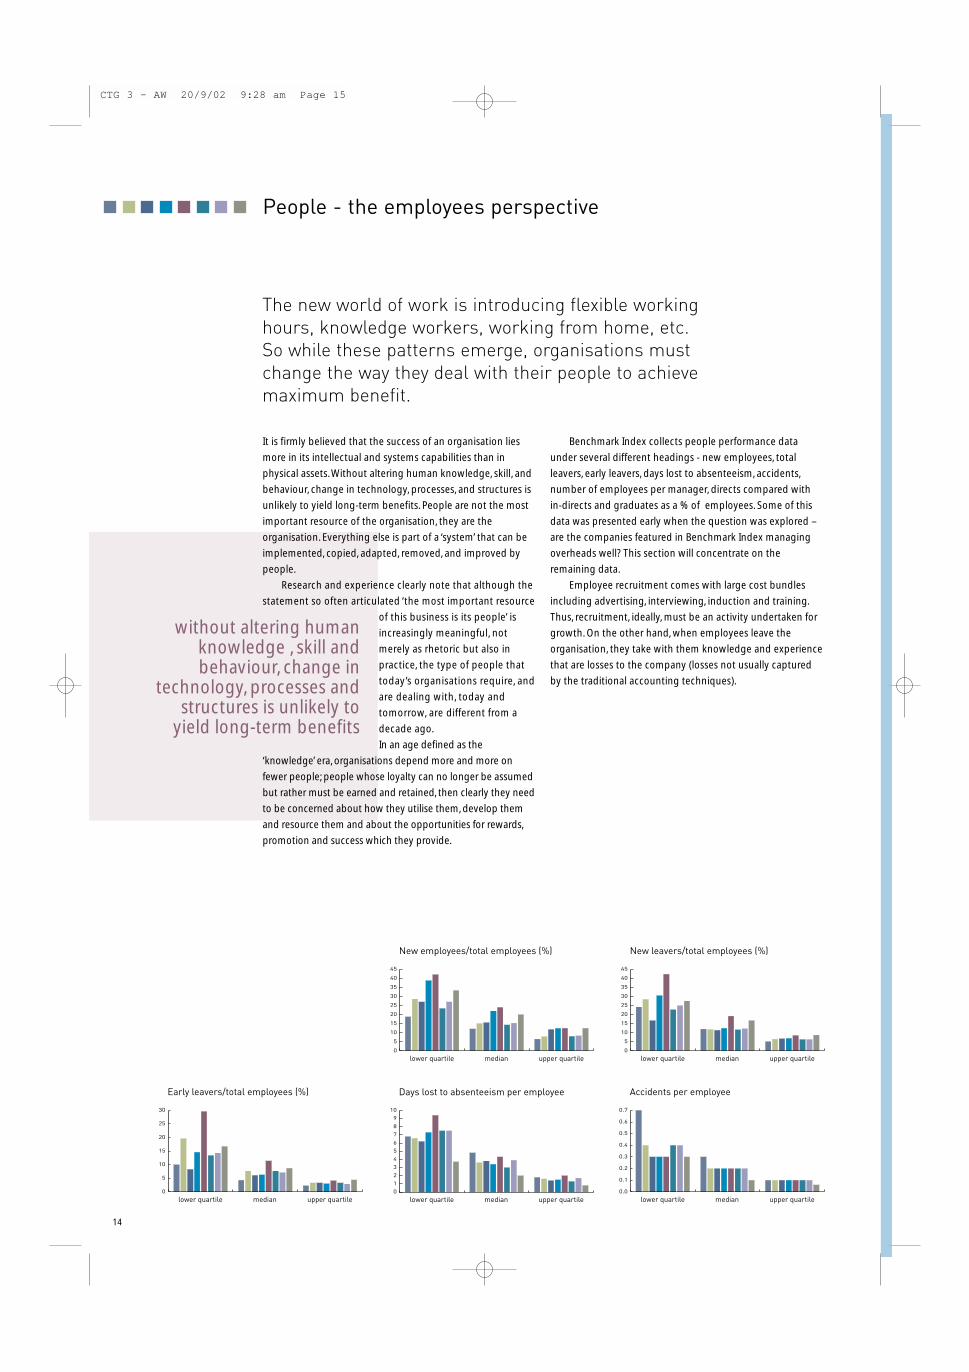
Benchmark Index collects people performance data
under several different headings - new employees, total
leavers, early leavers, days lost to absenteeism, accidents,
number of employees per manager, directs compared with
in-directs and graduates as a % of employees. Some of this
data was presented early when the question was explored –
are the companies featured in Benchmark Index managing
overheads well? This section will concentrate on the
remaining data.
Employee recruitment comes with large cost bundles
including advertising, interviewing, induction and training.
Thus, recruitment, ideally, must be an activity undertaken for
growth. On the other hand, when employees leave the
organisation, they take with them knowledge and experience
that are losses to the company (losses not usually captured
by the traditional accounting techniques).
The new world of work is introducing flexible workinghours, knowledge workers, working from home, etc.So while these patterns emerge, organisations mustchange the way they deal with their people to achievemaximum benefit.
without altering humanknowledge , skill andbehaviour, change in
technology, processes andstructures is unlikely to
yield long-term benefits
14
CTG 3 - AW 20/9/02 9:28 am Page 15

Looking at the data gathered, and on average, UK
organisations seem to be recruiting around 17% of their
employees annually – while this might be positive if it is
done for growth, diversity, and bringing new ideas in, it is
expensive, most of all if it is happening due to the
organisations loosing a similar percentage. The data for total
leavers does show that about 15% of the employees actually
do leave annually. A certain percentage of those might fall
under natural attrition (like retirement), but chances are the
majority are moving between jobs for better offers. The term
‘war for talent’ is more true than ever in this environment
where even the life span of a CEO has dropped to just over
three years as some research studies revealed. A more
worrying measure is the percentage of early leavers (those
who joined the firm in the last 6 months). The UK
organisations are averaging around 7% of their total employees
falling in the early leavers category – these are people who cost
the organisation all the recruitment and induction costs, and
most probably did not have any time to add real value. A more
detailed look at these three measures reveals:
1. The gap is huge between upper and lower quartile
organisations when it comes to the percentage of their
employees that they have to recruit annually. The lower
quartile organisations recruit 30% of their staff annually
while the upper quartile ones recruit 10%.
2. Most probably, the new employees recruited are to replace
leavers. Lower quartile organisations are averaging just under
30% leavers annually while the upper quartile ones are
reporting around 7%. If this is the case, then the recruitment
is not taking place for ideal reasons like growth and knowledge
development and acquisition.With 30% leaving the bottom
25% firms annually, these firms are required to undertake a
serious rethink about the way they manage their people.
3. Again, the gap is also wide between the upper and lower
quartile organisations in terms of early leavers/total employees.
This percentage is more than double in the bottom 25% firms.
4. Overall, the Service sector is averaging more recruits, more
leavers, and more early leavers than the Manufacturing sector.
Not surprisingly as the Service sector is more focused on
‘knowledge’ workers who seem to be in the most demand.
5. Within the Manufacturing sector, most sectors are
demonstrating around average performance expect two:
Food, Drink and Tobacco and Electronics. Both are reporting
new employee percentages that are higher than the average,
and simultaneously more than average total leavers
(markedly less so in the Electronics sector). In the Food, Drink
and Tobacco sector, the percentage of early leavers is also
high and it seems that this sector is most affected by staff
turnover, and thus has most to learn.
In terms of measuring employee satisfaction, it has
become generally accepted that one alternative measure of
employee satisfaction and motivation is absenteeism. Lower
quartile firms lose, on average, 6.9 days a year per employee
through absenteeism. To put this in perspective, this is
equivalent to a 1000 person firm losing 31.4 person years
through absenteeism for every year worked! (assuming a
person year has 220 working days). In the upper quartile, the
days lost to absenteeism per employee come up to an
average of 1.5. This is clearly far better than the bottom 25%
firms (a gap that must be closed by cross learning).
Absenteeism is worst in the lower quartile performers in
Food, Drinks, and Tobacco sector potentially reflecting less
employee motivation than other sectors. Combining this with
the total leavers/total employees percentage in this sector, we
can see that there is an issue to be tackled here. Meanwhile,
the service sector reports the least days lost to absenteeism
across all quartiles, making it the sector to learn from.
The final measure for the employee’s category is the
number of accidents per employee (a measure of employee
motivation and indeed the effectiveness of the health and
safety procedures in the firm). The assumption here being
that motivated employees are more likely to be engaged in
their jobs and will be thus paying more attention while at
work and suffering less accidents. The upper quartile firms
reported an average of 0.1 accidents per employee, while the
lower quartile ones reported 0.4. While there is a gap that
can be addressed and reduced, the data demonstrates that
attention is being paid these days to reducing these
occurrences (the overall sample average for UK organisations
is 0.2 accidents per employee). As one would expect, the
Service sector reported the least number of accidents.
However, one sector that is markedly over the average, and
thus needs more attention is the Chemical sector.
15
UK firms lose about 7% of their staff within6 months of taking them on – these peoplecost the organisation recruitment andinduction costs, and have little or no timeto add any real value
CTG 3 - AW 20/9/02 9:28 am Page 16
0
10
20
30
40
50
60
70
80
90
100
Supplies delivered on time (%)
lower quartile median upper quartile0
20000
40000
60000
80000
100000
120000
140000
160000
180000
200000
Value of supplies per supplier (£)
lower quartile median upper quartile0
10
20
30
40
50
60
70
80
Stock turns
lower quartile median upper quartile
Supplier performance
However, as the trend grew and encompassed most of the
firms’ direct inputs and indirect support processes, it did
result in firms becoming ever more reliant upon their
suppliers. Organisations learned that quality, responsiveness,
service, and problem solving are
every bit as important as price in
developing effective supplier
partnerships. In parallel, there has
been a lot of work and
developments in Supply Chain
Management highlighting how
an effective approach could drive
substantial costs out of the supply chain. When coupled
together, these factors have caused an increasing interest in
supplier management approaches and techniques.
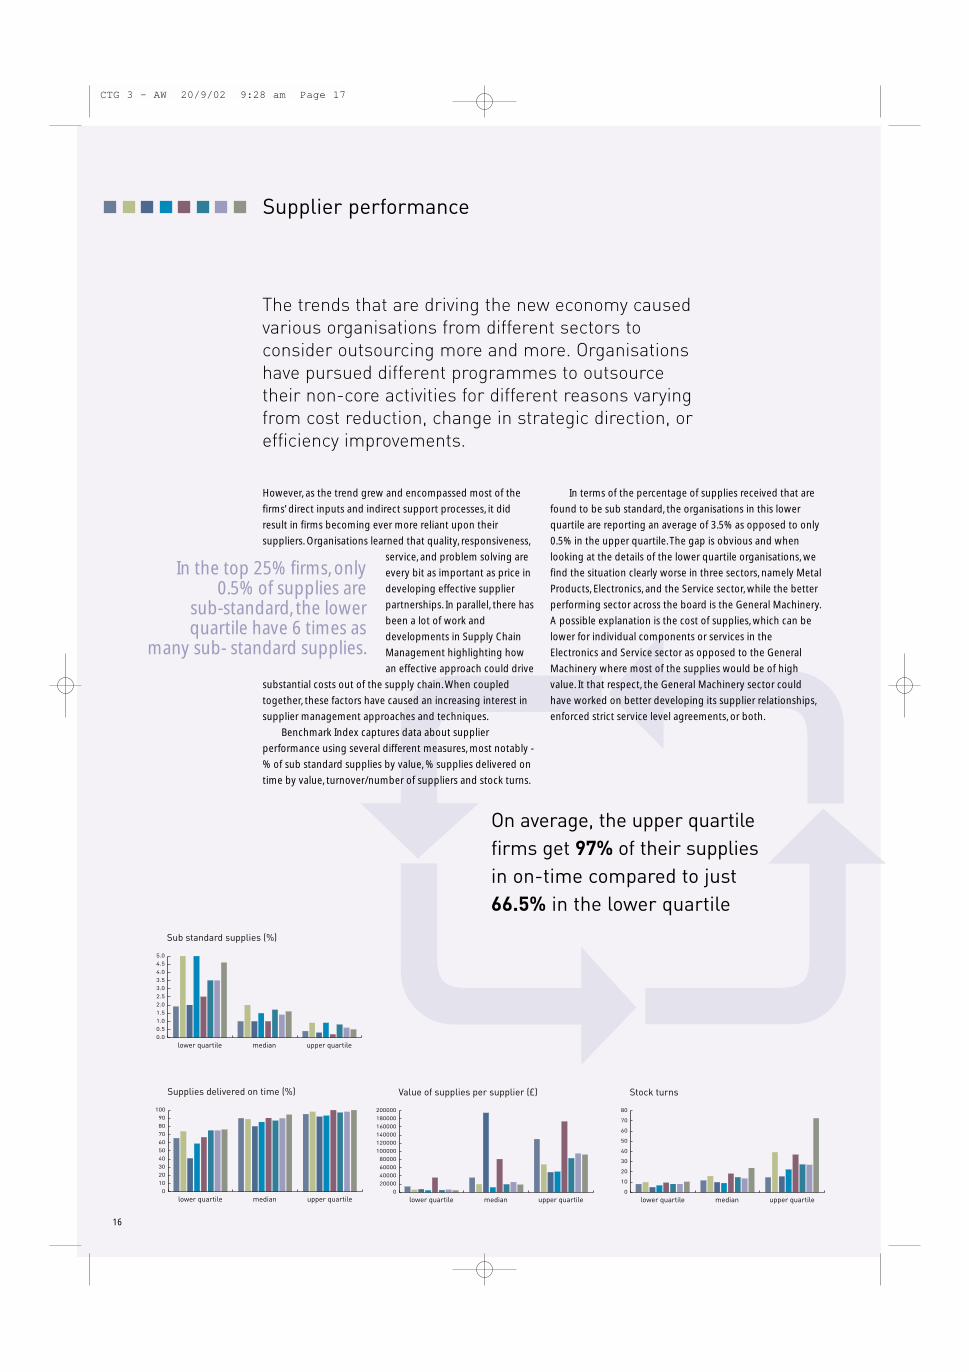
Benchmark Index captures data about supplier
performance using several different measures, most notably -
% of sub standard supplies by value, % supplies delivered on
time by value, turnover/number of suppliers and stock turns.
In terms of the percentage of supplies received that are
found to be sub standard, the organisations in this lower
quartile are reporting an average of 3.5% as opposed to only
0.5% in the upper quartile. The gap is obvious and when
looking at the details of the lower quartile organisations, we
find the situation clearly worse in three sectors, namely Metal
Products, Electronics, and the Service sector, while the better
performing sector across the board is the General Machinery.
A possible explanation is the cost of supplies, which can be
lower for individual components or services in the
Electronics and Service sector as opposed to the General
Machinery where most of the supplies would be of high
value. It that respect, the General Machinery sector could
have worked on better developing its supplier relationships,
enforced strict service level agreements, or both.
The trends that are driving the new economy causedvarious organisations from different sectors toconsider outsourcing more and more. Organisationshave pursued different programmes to outsourcetheir non-core activities for different reasons varyingfrom cost reduction, change in strategic direction, orefficiency improvements.
On average, the upper quartilefirms get 97% of their suppliesin on-time compared to just66.5% in the lower quartile
In the top 25% firms, only0.5% of supplies are
sub-standard, the lowerquartile have 6 times as
many sub- standard supplies.
16
0.0
0.5
1.0
1.5
2.0
2.5
3.0
3.5
4.0
4.5
5.0
Sub standard supplies (%)
lower quartile median upper quartile
CTG 3 - AW 20/9/02 9:28 am Page 17

As for the other angle of supplier performance, namely on
time delivery, the top 25% organisations seem to be getting
an average of 97% of their supplies on time. However, the
picture with the lower quartile organisations is not
encouraging and reveals a huge gap as they only receive an
average of 66.5% of their supplies on time. The worst
performers here are the General Machinery sector potentially
due to the size of orders and complexity, but this goes against
the argument driven earlier on their supplier management
capability as they seem to be getting the best quality of
products, but mostly late! There is a lot of improvement
potential for all organisations in all sectors in this regard and
there is a lot to learn about supplier management in the
overall framework of supply chain performance.
There are various reasons why supplier management is not
ideal, and the following points highlight two potential reasons:
1. Too many suppliers to deal with. The value of supplies per
supplier provides an indication of how many suppliers a
company requires to support its operations. The gap in this
case between the top 25% and bottom 25% firms in the
sample is massive (£10,358 to £92,592 respectively). This
suggests that upper quartile performers use one ninth (or
less) of the number of suppliers that lower quartile
performers use. Using less suppliers translates into the
organisation requiring less overhead and focusing resources
on building relationships with a limited number of suppliers.
A close look at the sectors in the sample reveals that sector
with highest value of supplies per supplier (least number of
suppliers) is the Food, Drink and Tobacco sector followed by
the Chemical sector.
2. Stock turns (a reflection of internal operations
management). Another measure that demonstrates the large
gap between upper and lower quartile organisations. The
bottom 25% firms reported an average of 8 stock turns per
year. The gap is obvious when this is compared top the 32
stock turns per year that the top 25% firms in the sample
achieve. The highest stock turns achieved by far is reported
by the Service sector most probably due to the nature of the
industry. However, when we compare the performance of
manufacturing sectors, it is noted that Metal products and
Food, Drink and Tobacco sectors are leading. In the case of
the latter, again the high stock turns is dictated by the nature
of the product lifecycle. As for the Metal products, the lead
might be a reflection of best practice being implemented
within internal operations management, one that can prove
a learning opportunity for many. In this regard, even the high
performers have a scope for learning, as by applying best
practice like collaborative planning and Enterprise Resource
Systems, world-class organisations are achieving stockless
production and Just in Time delivery levels.
17
One of the biggestproblems facinglower quartilecompanies is thatthey simply havetoo many suppliers- up to nine timesmore than those inthe upper quartile
CTG 3 - AW 20/9/02 9:28 am Page 18

0
1
2
3
4
5
6
7
8
9
10
Capital investment/turnover (%)
lower quartile median upper quartile0
1
2
3
4
5
6
7
8
9
R&D expenditure/turnover (%)
lower quartile median upper quartile0.0
0.1
0.2
0.3
0.4
0.5
0.6
0.7
0.8
0.9
1.0
Training expenditure/turnover (%)
lower quartile median upper quartile
0
50
100
150
200
250
300
350
400
450
500
Training expenditure per employee (£)
lower quartile median upper quartile0
5
10
15
20
25
30
35
40
Graduates/employees (%)
lower quartile median upper quartile0.0
0.5
1.0
1.5
2.0
2.5
3.0
3.5
Marketing expenditure/turnover (%)
lower quartile median upper quartile
Building for the future
Organisations need to look to the future, prepare for it, plan
how to influence it, and invest to ensure they are part of it.
Sustainability is all about the long term and requires present
planning and investment in new products, processes and
ways of working to be made continually. The cliche that
‘change is the only constant’ is more true than ever and the
future will be for those who invest now, based on a clear
vision and well articulated,
measurable, strategy to build their
capabilities and strengthen their
competitive advantage.
Benchmark Index data set contains
significant information about the
investments made by manufacturing
firms in the EU countries in the
sample, using the measures – capital
investment, R&D expenditure,
training expenditure, training days/employees, training
expenditure/employees, ratio of graduates to employees and
marketing expenditure.
Within the whole sample of UK organisations, upper
quartile organisations are investing, on average, 6 times as
much of their turnover on capital investment as lower
quartile firms do. A huge gap in preparing for the future, one
that might be reflected in the numbers of those
organisations who will actually still be there in the future. The
biggest investments seem to be taking place in the Chemical
and Transport sectors. Moreover, and on average, the
Manufacturing sector seems to be spending slightly more of
its turnover than the Service sector on capital investment.
In terms of R&D spending, the gap between the upper and
lower quartile organisations is still considerable. The biggest
spenders on R&D are the Electronics sector and the Services
sector. In the Electronics sector this is probably dictated by
the nature of the industry where the life cycles of their
products are shortening by the day. A similar picture can be
drawn for the Service sector where the intense competition
is forcing everyone to compete on new innovations in
service to provide a differential offering. Having said that,
other sectors are not immune against change and
shortening life cycles and the low investment levels in R&D
are indeed worrying (the overall UK sample average spend
on R&D as a percentage of turnover is no more than 1.3%).
From R&D, we turn to find even more worrying figures
for investment in developing the organisation’s intellectual
capital, namely employee training. On average, the UK
organisations sampled spend 0.3% of their turnover training
their employees (arguably their most important asset). Even
with this small percentage spend, there is still a gap between
the top 25% and the bottom 25% (who are averaging no
more than 0.1% of their turnover on training). This in a time
where most SMEs are reporting frequently they are facing a
skills shortage and can not attract qualified people to work
the top 25% and the bottom 25% (who are averaging no
So far, we have looked at financial performance,satisfying customers and employees. While these areexcellent indicators, they are also lagging ones, i.e.they are reporting history. If an organisation decidesto manage its performance by relying only on thelagging indicators, it would be like driving a car usingonly the rear view mirror.
18
the cliche that‘change is the only
constant’ is more truethan ever and thefuture will be for
those who invest NOW
CTG 3 - AW 20/9/02 9:28 am Page 19

more than 0.1% of their turnover on training). This in a time
where most SMEs are reporting frequently they are facing a
skills shortage and can not attract qualified people to work
for them. They do forget that investing in training has various
benefits spanning from developing their intellectual capital
which, if done well, translates into operational efficiency and
improvements, to acting as an attractor for qualified people
who view personal development as a key part of any job.
A similar picture is presented when studying the
numbers for actual training expenditure per employee. The
average UK organisation is spending around £140 per
employee per annum on training. The upper quartile
organisations are averaging around £350 while the lower
quartile organisations are averaging less than £100. Given
that an average course in the UK market costs anywhere
between £450 and £1000, the data seems to be telling us
that an average employee in a UK organisation is getting
around one day of poor quality training per annum.
Of course this caricature picture is not the case as some
employees will be going to high quality (and expensive)
courses, but some employees will have to be attending none
to achieve these averages. These numbers are very worrying
and either reflect that organisations do not realise the
importance of knowledge, continuous improvements, and
building for the future, or that they are under a lot of
pressure from shareholders to produce short terms financial
results (that they opt to cut training and other ‘costs’), or
indeed a combination of both.
It could be that firms employ highly trained people
rather than build their skills once they have joined the firm.
If this was the strategy for all the organisations in Benchmark
Index database, then it would be reasonable to expect that
they would employ a high number of graduates. In fact, even
in upper quartile firms, fewer than one employee in 5 has a
degree at best (in the Service and Electronics sectors) while
in lower quartile firms, it is reported that the average is less
than one in every hundred employees. This clear lack of
investment in training and hiring graduate employees has
serious implications for the future sustainability and
competitiveness of UK firms. We are now living in ‘the
knowledge economy’ and it is forecasted that the future will
fall to those that develop, manage and exploit knowledge to
its full potential. Whatever the reasons for this lack of
investments, UK firms, on average, still do not seem to realise
that training is an ‘investment’ not a ‘cost’, and to that end, a
critical investment for long term success.
On average firms in the sample spend 0.7% of their
turnover on marketing. This is less than what they spend on
R&D and Training, and while this reflects a healthy balance
between focusing on the present and building for the future,
it still reflects low investment levels overall. Marketing is
becoming more important these days as competition
intensifies both from within the UK and abroad. It as noted
that these days, everything is of much better quality, but at
the same time becoming extremely similar. In this context,
marketing and brand management could provide a powerful
edge. The gap here is also huge; on average upper quartile
firms spend at least four times as much on marketing than
do lower quartile firms. The service sector spend more than
the manufacturing sector average, but less than the
Electronics sector who seem to be the leader in marketing
spend (this coupled with them being the leaders in R&D
spend in symptomatic of there fast moving environment and
qualifies them as a main sources of best practice to learn
from on managing in a fast moving world).
19
We are now living in the‘knowledgeeconomy’ and it is forecasted that thefuture will fall to those that develop,manage and exploit knowledge to itsfull potential
CTG 3 - AW 20/9/02 9:28 am Page 20

Competition as a whole has long left the ‘traditional’arena and it is now common practice for organisations(even whole countries) to try to lure customers away with‘special’ offers. The markets have also changed and distance
has been redefined. Geography is no longer a barrier to
entry, and agreements such as the World Trade Organisation
are redefining regulatory constraints. The bottom line is:
globalisation is not the future, it is the present. Organisations
must have strategies for growth that span opening new
markets, offering new products/services, and reaching new
customers. The data provided from Benchmark Index for the
UK industry provides mixed messages in this regard, but
clearly shows a movement in the directions discussed. On the
whole, while firms seem to be reasonably successful in
generating new income, there is a big gap between the top
25% and bottom 25% firms, and there are also major
differences between industry sectors.
On average, around 10% of the UK sample’s turnover has
come from new income. The upper quartile organisations
reported an average of over 25% while the lower quartile
ones reported less than 5%. A huge and worrying gap that
needs to be addressed if one subscribes to the ideas
discussed above. The sectors that seem to be outperforming
the others, and thus the ones to benchmark and learn from
are the Electronics and Service sectors respectively.
Firms are generating just
over 3% of the new income from
new geographies. However, this
number is heavily influenced by
the General Machinery sector
who are generating, on average,
over 10%.Whether this is due to
implementation of best practices
in promotion, quality of
products, or taking advantage of
trade shows and agreements, it
is clearly a place to start learning
from.The upper quartile
organisations in the Service
sector reported 16% of new
income from new geographies,
probably aided by the internet
and e-commerce (which is a good indication of the take up
and use of new technology if that was the actual case).
Moreover, the gap is quite substantial between the top 25%
and bottom 25% of firms as the upper quartile organisations
seem to be generating at least 8 times more of their income
from new geographies than lower quartile ones. So there is a
clear opportunity to go down the path of exploring and
exploiting new geographies, but the message, and indeed the
practices, do not seem to have infiltrated every organisation.
A similar picture is revealed when studying the data on
income from new segments. The General Machinery and
Service sectors lead the pack, and the gap between upper
and lower quartile firms is huge. It is interesting to note
that on average, firms seem to be generating more new
income by going into different segments than by going into
different geographies.
Another measure is the new income from new products.
Here, firms are reporting, on average, around 6 -7%. This is an
impressive and surprising percentage given the low levels of
investment reported earlier on investment on R&D. However,
the sectors that lead the pack in R&D expenditure
(Electronics and Services) did report the highest percentage
in income from new products (in their upper quartile firms,
overtaking other sectors by at least 5%). A clear indication
that investment does pay off.
Finally, the measure that assesses how many new
customers the firms have gained (the percentage of new
customers to total customers). The whole sample average
is just over 16%, which clearly reflects the intense
competition out there (for these firms to recruit these new
customers, someone down the road must have lost them!).
The Service sector is leading, especially the upper quartile
firms who are reporting more than 40% new customers.
The other leading sectors are the General Machinery (who
seem to have a well planned and executed market
penetration strategy) and the Electronics sector (where it
is well known that it faces tough competition, from all over
the world). This message about new customers is a coin with
two faces. Are firms recruiting these customers because
demand for their products is growing (growth mode), or
is it because they keep losing their existing customers
(survival mode)?
0
5
10
15
20
25
30
35
40
45
50
Total new income/turnover (%)
lower quartile median upper quartile
0
2
4
6
8
10
12
14
16
Income from new geographies (%)
lower quartile median upper quartile
0
5
10
15
20
25
Income from new segments (%)
lower quartile median upper quartile0
5
10
15
20
25
Income from new products (%)
lower quartile median upper quartile
Market growth & penetration
Customer loyalty can no longer be taken for granted.Even the most loyal customers will leave for a bettervalue proposition.
20
0
5
10
15
20
25
30
35
40
45
New customers/customers (%)
lower quartile median upper quartile
CTG 3 - AW 20/9/02 9:28 am Page 21

Case Study
LindenFoods
It is true of many small firms that the only evidence they have
to tell them whether they are performing above or below
average is anecdotal or hearsay. Most never find the time to
measure their strengths and weaknesses.
For Paul Johnston, Financial Director of Linden Foods, the
problem was a familiar one: "Even though we had a good idea
of what was happening around us, it was still hard to establish
exactly what we were doing well or where we were falling
below the mark".
Based at two sites in Northern Ireland Linden Foods is a 350-
strong beef producing company formed in June 1998 from
the merger of Granville Meats and Milltown Livestock & Meat
Company. On average, it processes more than 80,000 cattle
and 100,000 sheep a year for export to customers that
include ASDA, Marks & Spencer, Somerfield, Safeway, Tesco,
McDonalds and Burger King.
Even though its customer base is strong, the company is
nevertheless under pressure to compete in an industry
struggling with overcapacity. Its senior management, Paul
Johnston included, were well aware of the need to improve
the company's financial performance.
Paul was sceptical
about how beneficial
benchmarking could
be for Linden Foods.
bHis mind was
changed by a call from
Business Adviser
Andrew Horne [of the
IDB, now the INI].
"Andrew rang out of
the blue. He did a good
job of explaining that
our problems were far
from unique. But he
still had to convince us
that Benchmark Index
could be of real value
to our company. It took
two attempts".
Paul describes the Benchmark Index process as time
consuming, but thought-provoking. Comprehensive
assessment questionnaires were handed out to all of the
directors, supervisors and managers of the company - once
the staff involved had been assured that their confidentiality
would be protected.
The results were compiled into a detailed Benchmark Index
report. "We weren’t just left us to decipher the figures for
ourselves. An external consultant went as far as to help us
focus on an action plan that included specific areas where it
was essential we started to do better". Says Paul.
Against the comparison group chosen, the company
registered in the upper quartile for most operational areas
and was particularly strong when it came to its customer
focus. But it was a lower quartile performer in Human
Resources, scoring below average for staff turnover and
absenteeism.
Staff also said that communication inside the company was
poor. Information wasn't being shared in the way the
company would have liked, and there was a lack of
understanding of one another's roles. This was identified as
the root cause behind poor performance in other areas.
Now that Linden Foods has had the chance to pinpoint were
changes were necessary, the benefits of benchmarking are
beginning to be felt across the company.
Investment is being directed into a range of improvement
projects - in Sales Planning, Production Planning and
Production Systems Operations - that are already starting to
bring real, tangible benefits to the business. Using a system of
scorecards is helping to give staff measurable objectives
against which they can see the progress being made. The
structure of the company has also been reorganised to clarify
individual responsibilities.
Early estimates suggest that overall operating costs have
already been cut by a remarkable 20% and absenteeism rates
have dropped from 12% to less than 6%. The potential
savings for the company in unnecessary overtime costs could
add up to in excess of £50,000 a year.
What the company had considered to be a staff recruitment
problem has now been more accurately defined as a staff
retention issue. In consequence, staff turnover rates among
longer-serving employees fell by 11%, with further
improvements anticipated. Much remains to be done, though,
on the retention rates for those who move on within months
of being recruited.
Even more impressive is the £250,000 a year that could be
saved as productivity continues to improve and the new
'make it right first time' approach starts to eliminate costly
returns.
Linden Foods is also confident of making early and
substantial gains on its current turnover of just under £70
million.
Paul is planning a follow-up benchmark within 6-9 months as
part of the plan to continuously drive the business forward.
"There's no question it has been a very valuable first step
towards starting to evaluate our performance as a company.
We think that repeating the process will give us a fresh insight
into our strengths and weaknesses and help remind us how
far we've come".
Every indication is that Linden Foods will adopt
benchmarking as part of its organisational culture adds Paul:
"Had we not done it, I can only imagine we would still have
been debating old problems for hours on end, without ever
really getting to grips with the important issues. Now, instead
of living with the status quo, our plans for growth are far
more ambitious".
There's no question it hasbeen a very valuable first steptowards starting to evaluateour performance as acompany. We think thatrepeating the process will giveus a fresh insight into ourstrengths and weaknessesand help remind us how far we've come.Paul Johnston, Financial Director, Linden Foods
“
”
21
CTG 3 - AW 20/9/02 9:28 am Page 22

Closing the Gap
Sales & profit performance
This is reflective of the tough times the manufacturing sector
in the UK is going through and the recent downturn in the
economy is showing its clear effects on this sector.The decline
could be related also the fact that implementation of best
practice and recommendations from initiatives such as
Benchmark Index has not spread and was not taken to heart.
The data from the service sector offers a more positive picture.
While the sales turnover per employee has declined in the past
two years, as one would expect given the overall economic
downturn, service organisations seem to have managed to
increase the pre tax profit per employee and pre tax/turnover
percentage. One reason for this could be the implementation
of best practice in cost base management.There is clearly a
learning opportunity from this sector.
The data on the sales and profit performance isconcerning in the Manufacturing sector. All threequartiles in the sector have seen declining performancesince 1999 (and some had the downward trend startedin 1996) to date in their sales turnover per employee,pre-tax profit per employee, and pre-tax profit/turnover.
This section provides a look at the changes that took place over the period 1996– 2002 in UK industry performance using Benchmark Index data. BenchmarkIndex has compiled data for the same set of measures in the UK industry overthree distinct periods:■ 1996-1998■ 1999-2000■ 2000-201The following analysis overviews this data and discusses whether there areasimproving areas, areas showing negative trends, and whether we are actuallyclosing the gap between the upper and lower quartile organisations. The data ispresented separately for both the manufacturing and service sectors.
22
Period CodingManufacturing Service
■ 1996 - 1998 ■ 1996 - 1998■ 1999 - 2000 ■ 1999 - 2000■ 2000 - 2001 ■ 2000 - 2001
0
10000
20000
30000
40000
50000
60000
70000
80000
90000
100000
Sales turnover per employee (£)
lower quartile median upper quartile0
2000
4000
6000
8000
10000
12000
14000
Pre-tax profit per employee (£)
lower quartile median upper quartile0
2
4
6
8
10
12
14
16
18
Pre-tax profit/turnover (%)
lower quartile median upper quartile
CTG 3 - AW 20/9/02 9:28 am Page 23
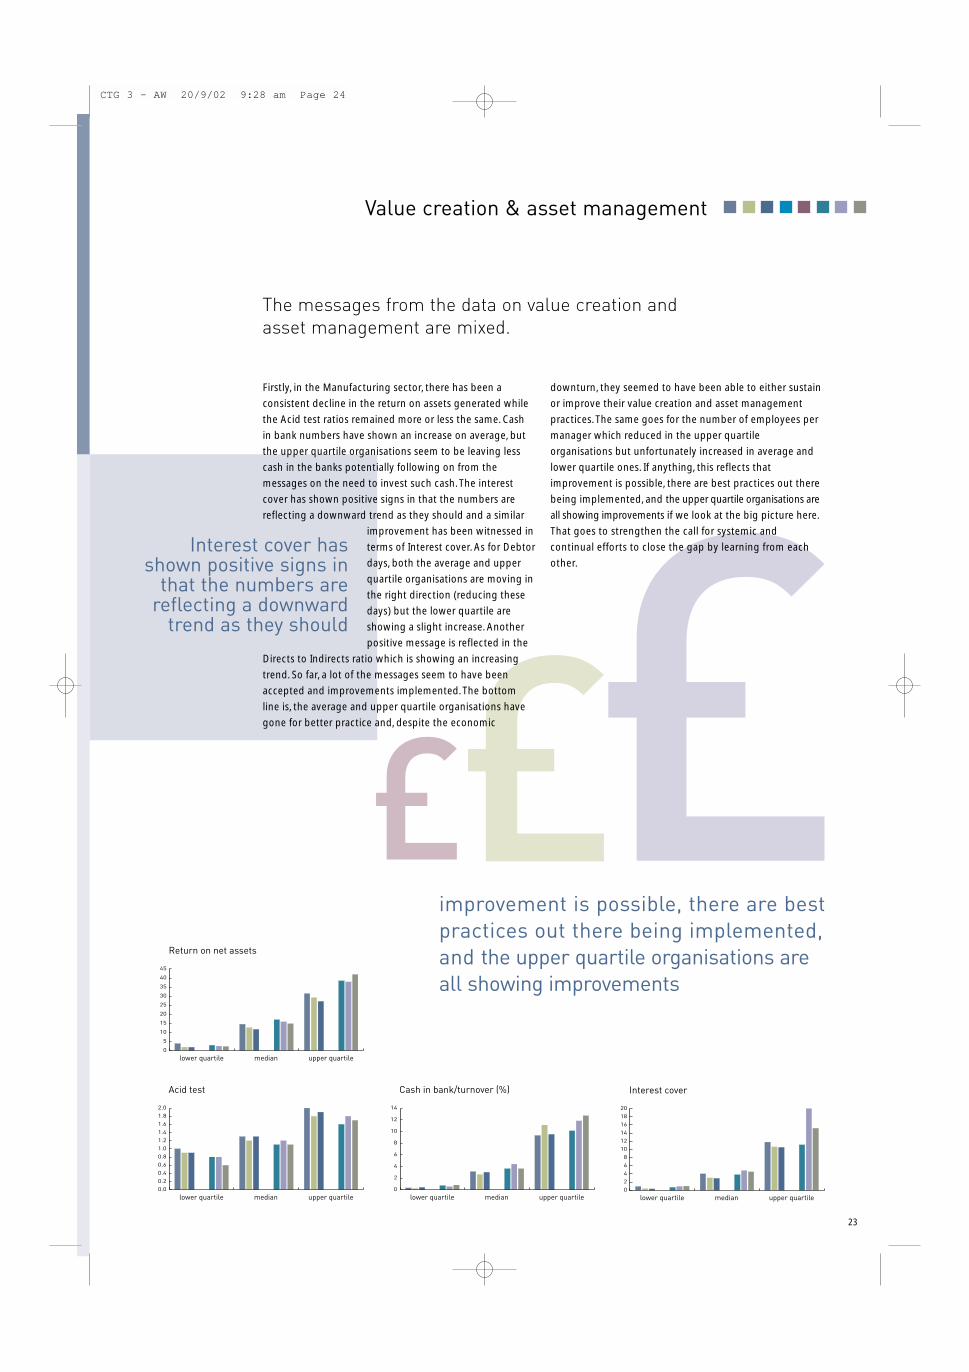
£££0
5
10
15
20
25
30
35
40
45
Return on net assets
lower quartile median upper quartile
0.0
0.2
0.4
0.6
0.8
1.0
1.2
1.4
1.6
1.8
2.0
Acid test
lower quartile median upper quartile0
2
4
6
8
10
12
14
Cash in bank/turnover (%)
lower quartile median upper quartile0
2
4
6
8
10
12
14
16
18
20
Interest cover
lower quartile median upper quartile
Value creation & asset management
Firstly, in the Manufacturing sector, there has been a
consistent decline in the return on assets generated while
the Acid test ratios remained more or less the same. Cash
in bank numbers have shown an increase on average, but
the upper quartile organisations seem to be leaving less
cash in the banks potentially following on from the
messages on the need to invest such cash. The interest
cover has shown positive signs in that the numbers are
reflecting a downward trend as they should and a similar
improvement has been witnessed in
terms of Interest cover. As for Debtor
days, both the average and upper
quartile organisations are moving in
the right direction (reducing these
days) but the lower quartile are
showing a slight increase. Another
positive message is reflected in the
Directs to Indirects ratio which is showing an increasing
trend. So far, a lot of the messages seem to have been
accepted and improvements implemented. The bottom
line is, the average and upper quartile organisations have
gone for better practice and, despite the economic
downturn, they seemed to have been able to either sustain
or improve their value creation and asset management
practices. The same goes for the number of employees per
manager which reduced in the upper quartile
organisations but unfortunately increased in average and
lower quartile ones. If anything, this reflects that
improvement is possible, there are best practices out there
being implemented, and the upper quartile organisations are
all showing improvements if we look at the big picture here.
That goes to strengthen the call for systemic and
continual efforts to close the gap by learning from each
other.
The messages from the data on value creation andasset management are mixed.
Interest cover hasshown positive signs in
that the numbers arereflecting a downward
trend as they should
23
improvement is possible, there are bestpractices out there being implemented,and the upper quartile organisations areall showing improvements
CTG 3 - AW 20/9/02 9:28 am Page 24

acid test
Value creation & asset management (continued)
As for the Service sector, the overall picture is again of
mixed messages regarding the value creation and asset
management capabilities and practices. While the return
on capital increased between 1996 and 1999, it decreased
in the last two years potentially due to the economic
conditions. Nevertheless, there has been an increase in the
upper quartile organisations’ return on net assets (while
the average decreased slightly). The Acid test ratios did
not show any considerable changes while the cash in the
bank has gone through an upward trend (service firms
seem to be investing less and holding on to more cash –
potentially because of the turbulent investment climate).
Positive signs came from the debt management issues
where the interest cover and the debtor days have both
decreased consistently. However, overhead does seem
to be a problem as the number of directs to in directs
have shown a downward trend noting that more indirect
(support) employees are involved. This, coupled with
the fact that the number of employees per manager
is also reducing send a strong signal for the service
organisations to re-think their employee empowerment
and involvement initiatives as opposed to adding more on
the management layer.
The acid test compares the value of liquid assets to thevalue of current liabilities. If the ratio is less than one itmeans that the organisation does not have enoughliquid assets to cover its current liabilities. Well over25% of the companies benchmarked are in this position
would your company pass the ?0
10
20
30
40
50
60
70
80
90
100
Debtor days
lower quartile median upper quartile0
1
2
3
4
5
6
7
Direct to indirects
lower quartile median upper quartile0
2
4
6
8
10
12
Number of employees per manager
lower quartile median upper quartile
24
CTG 3 - AW 20/9/02 9:28 am Page 25

Customer perspective
In the Manufacturing sector, the following is noted:
1. On average, the complaints per customer have shown an
increasing trend. Whether that is due to increasing customer
demands and thus higher expectations leading to more
complaints or whether organisations have become better at
capturing these complaints, it is not clear. However, while the
upper quartile organisations maintained their low levels of
customer complaints, the lower quartile have shown an
improvement in the past two years.
2. The numbers on the complaints per order (%) draw a very
academic picture of new theory application. Organisations
started by reporting low levels of complaints at all levels, the
next phase (1999-2000) reported increasing complaints,
potentially due to the learning that took place and thus their
improved ability to capture the customer complaint data, and
the third phase saw a decrease in customer complaints, with
the assumption that organisations identified the issues that
needed improvement and commenced working on them.
3. The positive impact is also clear in the order value of
complaints and orders not delivered on time. Both measures
seem to be moving in the right direction.
4. The percentage of orders rejected during warranty has also
decreased, more so in the lower quartile firms which again
lends further support that we are closing the gap.
In the Service sector all the customer related measures are
moving in the right direction, i.e it seems that the message is
getting through and improvements being implemented.
Moreover, the pace of improvements is faster (larger
improvements) in the lower quartile organisations who seem
to be working hard on the issues that need attention.
For example, in lower quartile organisations, the order value
of complaints/turnover dropped from around 3% in 1996-
1998 to around 1.5% in 2001-2002; that is a 50%
improvement. Similarly, The percentage of orders rejected
during warranty in lower quartile organisations dropped over
the same period by more than 50% (from 2.5% to 1%).
The data on customer service highlights that, overall,there has been improvements over the past six years,especially in the lower quartile organisations. It seemsthat we are closing the gap, albeit slowly.
in lower quartile organisations,the order value of complaints asa % of turnover dropped fromaround 3% in 1996-1998 toaround 1.5% in 2001-2002
25
0.0
0.2
0.4
0.6
0.8
1.0
1.2
Complaints per customer (%)
lower quartile median upper quartile0.0
0.5
1.0
1.5
2.0
2.5
3.0
3.5
4.0
4.5
5.0
Complaints per order (%)
lower quartile median upper quartile
0.0
0.5
1.0
1.5
2.0
2.5
3.0
Order value of complaints/turnover (%)
lower quartile median upper quartile0
2
4
6
8
10
12
14
16
18
Order not delivered on time (%)
lower quartile median upper quartile0.0
0.5
1.0
1.5
2.0
2.5
3.0
Order rejected during warranty (%)
lower quartile median upper quartile
3% 1.5%
CTG 3 - AW 20/9/02 9:28 am Page 26
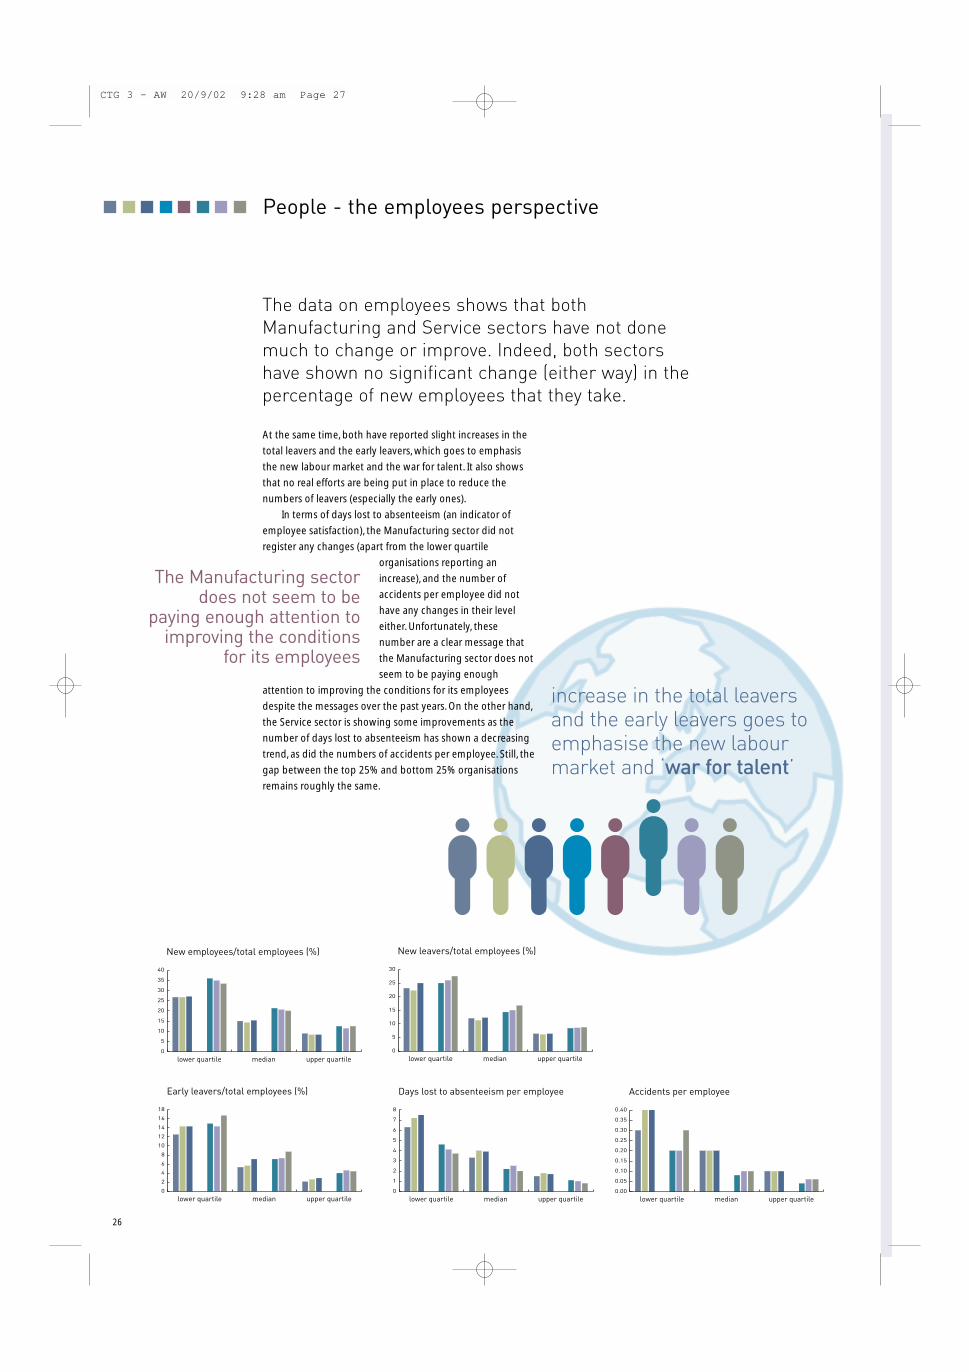
0
5
10
15
20
25
30
35
40
New employees/total employees (%)
lower quartile median upper quartile0
5
10
15
20
25
30
New leavers/total employees (%)
lower quartile median upper quartile
0
2
4
6
8
10
12
14
16
18
Early leavers/total employees (%)
lower quartile median upper quartile0
1
2
3
4
5
6
7
8
Days lost to absenteeism per employee
lower quartile median upper quartile0.00
0.05
0.10
0.15
0.20
0.25
0.30
0.35
0.40
Accidents per employee
lower quartile median upper quartile
People - the employees perspective
At the same time, both have reported slight increases in the
total leavers and the early leavers, which goes to emphasis
the new labour market and the war for talent. It also shows
that no real efforts are being put in place to reduce the
numbers of leavers (especially the early ones).
In terms of days lost to absenteeism (an indicator of
employee satisfaction), the Manufacturing sector did not
register any changes (apart from the lower quartile
organisations reporting an
increase), and the number of
accidents per employee did not
have any changes in their level
either. Unfortunately, these
number are a clear message that
the Manufacturing sector does not
seem to be paying enough
attention to improving the conditions for its employees
despite the messages over the past years. On the other hand,
the Service sector is showing some improvements as the
number of days lost to absenteeism has shown a decreasing
trend, as did the numbers of accidents per employee. Still, the
gap between the top 25% and bottom 25% organisations
remains roughly the same.
The data on employees shows that bothManufacturing and Service sectors have not donemuch to change or improve. Indeed, both sectorshave shown no significant change (either way) in thepercentage of new employees that they take.
The Manufacturing sectordoes not seem to be
paying enough attention toimproving the conditions
for its employees
increase in the total leaversand the early leavers goes toemphasise the new labourmarket and ‘war for talent’
26
CTG 3 - AW 20/9/02 9:28 am Page 27

0.0
0.5
1.0
1.5
2.0
2.5
3.0
3.5
4.0
4.5
5.0
Sub standard supplies (%)
lower quartile median upper quartile
0
10
20
30
40
50
60
70
80
90
100
Supplies delivered on time (%)
lower quartile median upper quartile0
20000
40000
60000
80000
100000
120000
140000
Value of supplies per supplier (£)
lower quartile median upper quartile0
10
20
30
40
50
60
70
80
Stock turns
lower quartile median upper quartile
Supplier management
Overall, the message seems to be clear and actions put in
place as improvements have occurred including reductions
in sub standard supplies in both sectors, improvement of on
time delivery records (by more than 30% in the lower
quartile firms in both sectors), and an increase in stock turns.
The only negative trends was in the values of supplies per
supplier as organisations seem to have reduced those values,
on average, in both sectors. While everyone has been talking
about supplier partnerships and supply chain management
in the past few years, the dawn of the internet
(e-procurement, internet bidding, reverse internet bidding,
etc.) has potentially caused organisations to go back to
focusing on price at the expense of having more suppliers.
The full consequences of such actions will become more
apparent in the future and will strongly be related to the
e-procurement rules and regulations on a global basis.
The gap between the top 25% and bottom 25% firms
does seem to be reducing, albeit with small percentages and
not in any major way that one would expect with the all the
support on offer to lower quartile organisations.
Both the Manufacturing and Service sectors reportedpositive improvement trends in all the measuresrelated to suppliers (apart from the value of suppliesper supplier in the Manufacturing sector).
30%on-time delivery ofsupplies hasimproved by
in lower quartilefirms in both sectors
27
CTG 3 - AW 20/9/02 9:28 am Page 28

!0
1
2
3
4
5
6
7
8
Capital investment/turnover (%)
lower quartile median upper quartile0.0
0.5
1.0
1.5
2.0
2.5
3.0
3.5
4.0
4.5
5.0
R&D expenditure/turnover (%)
lower quartile median upper quartile0.0
0.1
0.2
0.3
0.4
0.5
0.6
0.7
0.8
0.9
1.0
Training expenditure/turnover (%)
lower quartile median upper quartile
0
5
10
15
20
25
30
35
40
45
50
Graduates/employees (%)
lower quartile median upper quartile0
1
2
3
4
5
6
7
8
Capital investment/turnover (%)
lower quartile median upper quartile0
50
100
150
200
250
300
350
400
450
500
Training expenditure per employee (£)
lower quartile median upper quartile
Building for the future
The numbers reveal that over the period 1996-2002,
manufacturing firms in the UK are:
• Spending less on the capital investment as a
percentage of turnover
• Spending less on R&D expenditure as a percentage
of turnover
• Not increasing their spending on training as a
percentage of turnover and spending less on
training per employee.
• Investing less on hiring graduates.
• Spending less on their marketing activates as
a percentage of turnover.
These are extremely alarming messages and while the short
term pressures and the economic unrest are understandable,
firms potentially need some help in being able to balance
their approaches to address the short term with acceptable
success levels, and still build for the future to make sure they
are part of it.
As for the Service organisations, a close picture is drawn.
They do not seem to be spending less on building for the
future, but none of the investment measures captured by
Benchmark Index is increasing. They are at best maintaining
the same levels.
Moreover, the gap between the upper and lower quartile
organisations remains the same and has not changed in any
significant way which shows that the learning in this
perspective has not taken place.
From the trends revealed by the data, it seems likebuilding for the future has given way to focusing onthe shorter term for organisations in themanufacturing sector.
28
alarming messages are emerging fromthe benchmark data with mostcompanies concentrating too much onthe short term at the expense of longerterm planning and investment
CTG 3 - AW 20/9/02 9:28 am Page 29

0
5
10
15
20
25
30
35
40
Total new income/turnover (%)
lower quartile median upper quartile0
2
4
6
8
10
12
14
16
Income from new geographies (%)
lower quartile median upper quartile
0
2
4
6
8
10
12
14
16
18
20
Income from new segments (%)
lower quartile median upper quartile0
5
10
15
20
25
30
35
40
45
New customers/customers (%)
lower quartile median upper quartile0
5
10
15
20
25
Income from new products (%)
lower quartile median upper quartile
Market growth & penetration
Unfortunately, for both measures, the UK average is
reducing. A similar picture is drawn by the income from
new segments, while the income from new products is
on a downward trend (unsurprisingly after we saw the
trends in the investment in R&D). Still, the overall ratio of
new customer/total customers in on the increase.
Overall, the leading upper quartile organisations seem
to be improving their performance while the lower
quartile are moving in the opposite trend and thus
widening the gap.
In the service sector, the picture is much more
positive as all the growth measures are showing a
positive trend and while the gap remains the same, at
least everyone is moving in the positive direction. A lot of
learning and knowledge exchange still remains to be
done to reduce the gap.
The growth perspective is one with some positivemessages. The upper quartile organisations in themanufacturing sector are showing a slow, butsteady increase in the total new income/turnoverand a percentage point increase in the income fromnew geographies.
29
the overall ratio of newcustomers/customersis on the increase
CTG 3 - AW 20/9/02 9:28 am Page 30

Benchmarking Impact
Are organisations following the advice they get fromBenchmark Index? Are they improving as a result?In this section we explore the impact that Benchmark Index hashad on organisations in the UK - specifically those that havebeen benchmarked twice. The data provide presents theresults for one set of companies who have taken part in twobenchmarks with a minimum gap of six months between them.
▲ Improving performance ▼ weakening performance ■ no significant change
Variable 1st Benchmark 2nd Benchmark
Sales turnover per employee (£) 63054 687661 ▲
Pre-tax profit per employee (£) 408071 233489 ▼
Pre-tax profit/turnover (%) 10.6 12.5 ▲
Return on capital employed 25.2 33.7 ▲
Return on net assets 18.5 22.5 ▲
Acid Test 1.6 1.7 ▲
Cash in bank/turnover (%) 9.2 6.9 ▲
Interest cover 13.3 10.9 ▲
Debtor days 65 67 ▼
Direct to indirects 3.7 3.1 ▼
No. of employees per manager 7.9 8.0 ■
Complaints per customer (%) 1.2 0.8 ▲
Complaints per order (%) 3.1 2.9 ▲
Order value of complaints/turnover (%) 1.1 0.9 ▲
Order not delivered on time (%) 16.8 13.4 ▲
Order rejected during warranty (%) 3.1 3.4 ▼
New employees/total employees (%) 23.4 22.6 ▼
Total leavers/total employees (%) 23.8 24.3 ▼
Early leavers/total employees (%) 18.3 21.7 ▼
Days lost to absenteeism per employee 6.1 4.5 ▲
Accidents per employee 0.4 0.3 ■
Sub standard supplies (%) 3.3 3.2 ▲
Supplies delivered on time (%) 81.3 82.4 ▲
Value of supplies per supplier (Euro) 3250118 1905502 ▼
Stock turns 35.9 40 ▲
Capital investment/turnover (%) 5.9 6.3 ▲
R&D expenditure/turnover (%) 1.0 1.1 ▲
Training expenditure/turnover (%) 0.4 0.6 ▲
Training expenditure per employee (Euro) 20027 18943 ▼
Graduates/employees (%) 12.7 14.9 ▲
Marketing expenditure/turnover (%) 1.7 1.4 ▼
Total new income/turnover (%) 25.5 27.5 ▲
Income from new geographies (%) 5.9 5.4 ▼
Income from new segments (%) 8.7 11.2 ▲
Income from new products (%) 15.6 14.6 ▼
New customers/customers (%) 29.4 28.7 ■
30
CTG 3 - AW 20/9/02 9:28 am Page 31

31
Benchmarking impact
Various areas like sales & profit performance, asset, customer
and supplier management have all shown general
improvements. It can be concluded that organisations are
benefiting from the insights and recommendations provided
by Benchmark Index. However, there are some areas where
performance has declined; these are the ‘trouble’ areas like
cost base management, people management, and investing in
building for the future.The following is a brief description of
the impact of benchmarking as reflected by the above data.
Sales and profit performance
The picture here is mixed as organisations seem to have been
able to improve their sales turnover per employee as well as
their pre-tax profit as a percentage of turnover, but their cost
base management has been poor.The actual pre-tax profit per
employee has almost halved which means organisations are
either using double the employees to achieve the increase in
sales turnover, or they are not handling their internal cost
management issues well, probably giving them less priority
while focusing externally on generating sales.Whatever the
reasons, there is a need to re-focus efforts on achieving a
balanced focus on external and internal activities.
Value creation and asset management
Again, there are significant improvements in value creation
as the ROCE improved from 25.2% to 33.7% and the RENA
has jumped by almost 4% while at the same time improving
the Acid Test ratio and reducing the cash in the bank as a
percentage of turnover (the assumption is that they followed
the advice on the need to invest this cash as opposed to
them running out of cash!). Moreover, organisations also
improved other areas of asset management like reducing the
interest cover. However, they are getting worse at collecting
their money as the debtor days increased slightly.
Things have not improved in overhead management as
the ratio of directs to indirects has reduced, and there was no
significant increase in the no. of employees per manager. This
reconfirms the message that the cost base management
(including human capital management) is not improving.
Customer perspective
Very positive impact is seen in the customer measures as all
but one have improved. Organisations managed to reduce
the complaints and their total value and improved their on
time delivery. However, there has been a slight increase in the
orders rejected during warranty, probably with more
implications on product and service design as opposed to
customer management processes.
People – the employee perspective
Again, the people management area is the one where the
worst performance has been recorded. All the measures have
seen declining performance (apart from the days lost to
absenteeism which was reduced). Organisations seem to be
losing more employees, many of them early leavers (in the first
six months of joining). However, days lost to absenteeism were
reduced along with the average no. of accidents per employee,
which suggests that some things are being done right . It is
probable that the increased staff turnover is not solely to
blame on the organisations own process but is also affected
by the global war for talent which means that good
employees are being headhunted.This implies that
organisations need to work harder to maintain their
employees and need to provide even better incentives and
environments to get the maximum value of their employees.
Supplier performance
Improvements recorded in this category demonstrate that
organisations participating in Benchmark Index sample are
improving their supplier management practices. They have
simultaneously improved the quality of their supplies, their
arrival on time, and their own internal operations (reflected
by stock turns). What has had a negative trend is the value of
supplies per supplier (an indicator of the no. of suppliers).
This growth of supplier base will pose problems in that
organisations need to be managing more suppliers and goes
against the advise of building supplier relationships and
trying to work closely with fewer suppliers. However, it might
well be the way the corporate world is heading with the
increased competition in the age of e-purchasing and
globalisation as discussed in an earlier section of the report.
Building for the future
This is an area of concern as even with the insights they get
from Benchmark Index, organisations seem to be only
marginally increasing their investments to build for the future,
or, in some cases, even decreasing them .While their overall
capital investment as percentage of turnover increased
slightly, the money they spend on R&D,Training and Marketing
has either stayed the same or reduced.This could have serious
implications that will only be revealed in the future when it
might be too late to act (or too expensive to fix).
Market growth and penetration
Overall, Benchmark Index seems to have succeeded in
helping organisations focus on growth and generate new
income. However, the main sources for this income seem to
be limited to new segments and new customers while income
from new geographies and new products has reduced.
From the data presented in the table, the overalleffect of using Benchmark Index on participatingorganisations has been a positive one.
CTG 3 - AW 20/9/02 9:28 am Page 32

Accidents per employee (#) - this measures the number ofaccidents per employee. It demonstrates the level ofcommitment to safety that the organisation displays andimportance that is attached to providing a safe workingenvironment.Calculated as: (no. of accidents or incidents / no. of employees)
Acid test (short term assets / current liabilities) - this ratiomeasures the company’s liquidity, and it’s ability to pay alltheir short-term liabilities instantly.Calculated as: (debtors + stocks + cash in bank) / (creditors + short
term loans + other current liabilities)
Capital investment / turnover (%) - this is an indication ofhow much the company continues to invest in itself.Calculated as: (capital Investment / turnover) x 100%
Cash in bank / turnover (%) - small companies find the nonavailability of cash their largest problem. This ratio gives anindicator as to the accessibility of cash. Companies whichhold too much cash may however not be investing theirfunds to the best advantages of their business.Calculated as: (cash in bank / turnover) x 100%
Complaints per customer (%) - this is a method of assessingthe average number of complaints per customerindependent of number of orders and customers. The trendfor this measure can be useful to indicate improvement inperformance.Calculated as: (no. of recorded customer complaints / no. of
customers) x 100%
Complaints per order (%) - this is a method of assessingcustomers satisfaction with the product and servicessupplied. It is sometimes desirable to seek complaints fromcustomers as it is better to know that they are not happywith the product or service in order to put it right. However, itis important to look at the nature of complaints to ensurethat repeat ones are rectified as soon as possible. The trendfor this measure can be useful to indicate improvements inperformance, and is also a key indicator for lost business.Calculated as: (no. of recorded customer complaints / no. of orders
received) x 100%
Days lost to absenteeism per employee (#) - this measuresthe amount of time that people spend away from work dueto sickness, unexplained absence and other reasons whypeople do not attend work on a ‘voluntary’ basis.Calculated as: (absenteeism rate / no. of employees)
Debtor days (days) - this is the debtor value divided byturnover and represents the average collection period thatcustomers take to pay their bills. It is an indicator ofprofitability and customer relationships.Calculated as: (debtors / turnover) x 365
Directs to indirects (#) - this measures the number ofemployees directly involved in output-related activitiescompared with supporting activitiesCalculated as: (no. of employees directly involved in the provision of
service or product / (no. of employees - no. of employees directly
involved in the provision of service or product))
Early leavers / total employees (%) - this indicates the extentto which the organisation has been successful in recruitingand selecting people who are right for the position and rightfor the organisation. A large ratio of early leavers toemployees indicates a mismatch of expectations betweenthe individuals recruited and the organisation or job thatthey were recruited to perform.Calculated as: (no. of people who leave within six months of joining /
no. of employees) x 100%
Graduates / employees (%) - this looks at the ratio ofgraduates to all employees. It is one way of assessing thelevel of education that is incorporated within theorganisation.Calculated as: (no. of graduates / no. of employees) x 100%
Income from new geographies (%) - this identifies howsuccessful a company is being at developing newgeographical territories.Calculated as: (turnover from new geographical markets / turnover) x 100%
Income from new products (%) - this measures a company’ssuccess rate at developing and introducing new products.Calculated as: (turnover from new products/services / turnover) x 100%
Income from new segments (%) - this identifies the ability ofa company to generate sales from new market segments.Calculated as: (turnover from new market segments/turnover) x 100%
Interest cover - this ratio indicates the proportion of profit takenup by interest payments.The larger the ratio the less vulnerablea company is to a fall in profits or a rise in interest rates.Calculated as: pre-tax profit / interest paid
Marketing expenditure/turnover (%) - this is an indication ofthe company’s investment in its marketing activity.Calculated as: (marketing expenditure / turnover) x 100%
New customers/customers (%) - this figure, expressed as apercentage, identifies the growth in customer numbersregardless of new business generated.Calculated as: (No of new customers / No of customers) x 100 %
New employees/total employees (%) - this is a measure ofthe relative experience level of a workforce. A higher figuresignifies a low experienced workforce or it may reflect a highgrowth rate.Calculated as: (no. of new employees / no. of employees) x 100%
Appendix 1. Benchmarking Glossary
The data provided to Benchmark Index is used toanalyse company performance across acomprehensive range of measures. The glossarybelow explains how each of the measurement criteriais calculated.
32
CTG 3 - AW 20/9/02 9:28 am Page 33

Number of employees per manager (#) - this measuresthe number of employees to each manager / supervisor.It enables organisations to see the appropriateness oftheir level of management and supervision.Calculated as: (no. of employees / no. of managers)
Orders not delivered on time (%) - this shows how well abusiness is meeting its commitment for delivery promises.A lower figure indicates better performance.Calculated as: (no. of orders which were not delivered when
promised / no. of orders received) x 100%
Orders rejected during warranty (%) - this shows howsatisfied customers are with the quality of the productssupplied. The lower the percentage, in general, the better,as it means that more orders are supplied with whichcustomers are satisfied.Calculated as: (no. of orders rejected during the specified warranty
period / no. of orders received) x 100%
Order value of complaints / turnover (%) - this figureexpressed as a percentage measures the totaldissatisfaction of customers independent of the numberof orders and customers.Calculated as: (order value of recorded complaints received /
turnover) x 100%
Pre tax profit per employees (Eur) - this is pre-tax profitdivided by the number of employees. It is an indicator ofprofitability.Calculated as: pre-tax profit / no. of employees
Pre tax profit / turnover (profit margin, %) - this is theprofit before tax expressed as a percentage of turnover.It is an indicator of profitability and growth and providesa useful comparison for how well the costs have beencontrolled.Calculated as: (pre-tax profit / turnover) x 100%
R&D expenditure / turnover (%) - this is an indication ofthe company’s investment in the future, of its capacity tobe innovative.Calculated as: (R&D expenditure / turnover) x 100%
Return on capital employed (ROCE, %) - this is the profitbefore tax expressed as a percentage of the capitalemployed, where capital employed is taken to be theaggregate of shareholders' funds, long term loans, andlong term liabilities. It is an indicator of both profitabilityand growth as it measures how effectively the business isusing its funds in growing the size of the business itself.Calculated as: pre-tax profit / (shareholder’s funds + long term loans
+ other long term liabilities) x 100%
Return on net assets (RONA, %) - this is the profit beforetaxes expressed as a percentage of net assets (fixed,intangible and intermediate assets plus current assets lesscreditors and other current liabilities). It is an indicator ofboth profitability and growth regardless of method offinancing.Calculated as: pre-tax profit / (total assets - other current liabilities -
creditors) x 100%
Sales turnover per employee - this is the ratio of salesdivided by the number of employees. It is an indicator ofprofitability.Calculated as: turnover / no. of employees
Stock turns (#) - this is the turnover divided by stocks,giving the number of times stocks are turned over duringa year, or how quickly stocks are moved through thebusiness. It is an indicator of profitability.Calculated as: (turnover / stocks)
Sub standard supplies (%) - this figure highlights thequality of suppliers expressed on a percentage of totalpurchases.Calculated as: (value of supplies which are sub standard ondelivery / value of bought in materials) x 100%
Supplies delivered on time (%) - this percentagemeasures the ability of a company’s suppliers to deliver ontime. A higher figure demonstrates use of reliable suppliers.Calculated as: (value of supplies delivered on time / value of bought
in materials) x 100%
Total leavers / total employees (%) - this measures therate at which the staff of an organisation turnover peryear. It can give an indication as to how happy staffs arewith their workplace, it can also demonstrate theeffectiveness of the selection procedures in terms ofgetting the right people in the right positions.Calculated as: (no. of people who leave the organisation / no. of
employees) x 100%
Total new income / turnover (%) - this identifies theability of a company to generate additional turnover fromnew customers.Calculated as: (turnover from new geographical markets + turnover
from new market segments + turnover from new products and
services / turnover) x 100%
Training expenditure / turnover (%) - this is an indicatorof the company’s investment in its employees.Calculated as: (training expenditure / turnover) x 100%
Training expenditure per employees (Eur) - thismeasures the company’s financial investment in itsemployees, expressed as an average training spend peremployee.Calculated as: (training expenditure / no. of employees)
Value of supplies per supplier (Eur) - this ratio measuresthe average value of business for each supplier. A higherfigure demonstrates a minimising of supplier relationships.Calculated as: (value of bought in materials / no. of suppliers used for
delivery of core products and services)
33
CTG 3 - AW 20/9/02 9:28 am Page 34

Appendix 2 Public Policy Implications
To build on these findings and support performance
improvement in participating organisations, the following
notes provide some high level proposals for action. It is
prudent to note at this point that due to the complexity of
organisation and indeed their current and future operating
environments, any sustainable improvement effort must
involve a joint effort between the employees, management,
investors, regulators, and policy makers. It is hoped that this
report will provide some common ground. In that context,
the following points are believed to be the main Public Policy
Implications from the analysis undertaken.
• Institutionalise ‘learning’ to close the gap - There is a
substantial gap between the top 25% and bottom 25%
organisations in the UK industry. A gap that most
probably exists due to better management and
business practices in the top 25% firms. More
importantly, a gap that can be reduced (with a goal of
eliminating it) by learning from each and spreading
these best practices and advanced techniques. The key
issue is embedding the ‘learning’ culture and thinking
mode in all organisations. Once these firms accept the
need to learn, and have a genuine will and
commitment, there seems to be no shortage of best
practice in UK organisations for them to learn from.
• Learning can take many forms, and one proven
approach is benchmarking and best practice transfer
(best practice reports, benchmarking visits, knowledge
transfer teams, employee exchange, etc.). From the
areas highlighted in the report, the main areas that all
UK sectors could benefit from improving include: cost
base management and optimisation, people
(employee) management, and investment (building for
the future) aspects.
• The study revealed a low focus on organisational
people (employees). UK organisations do not seem to
be focusing on, or taking care of, their employees. In
today’s markets, advanced economies are all working
on becoming ‘knowledge’ based acknowledging that
this will form the future competitive edge (and most
are already suffering from skills shortages). From a UK
organisational perspective, this translates to managing
their intellectual capital and recruiting, developing,
and retaining the best talent. This simply does not
seem to be happening. Organisations must change the
way they deal with their people to achieve maximum
benefit. The war for talent will only intensify in the near
future and people management practices will be one
of the one determinants of who wins in the
competitive market. National efforts to support people
development and intellectual capital management
would go a long way in generating the required
awareness.
• Overall, and by comparing the performance indicators
over a period of six years, it seems that there are some
positive changes in improving performance mainly on
areas like customer management, market growth, and
supplier management. However, some areas that did
not improve (or even worsened) like finances and asset
management and people management. This
strengthens the argument that while conducting the
benchmarking exercise is useful, the real benefit will
only be achieved if clear action plans and follow up
result from that exercise. Organisations that participate
in such benchmarking exercises could benefit from
further support on what to do next, how to do it, and
by when! It is not enough to know what your malaise is
if you are not prescribed the right medicine, and
indeed you have the commitment to take it.
The report has covered a wide cross section of the UKindustry and investigated various aspects of theirperformance. The analysis has highlighted numerousissues that require attention among several areas ofstrength that can be built upon for the further success.
34
CTG 3 - AW 20/9/02 9:28 am Page 35

• Among all UK organisations in the sample, there is a
concerning lack of investment in building for the
future (mainly research and development and
training). While we do live in turbulent times, one
might argue that investment in R&D, employee
development, and marketing are what will help some
winners to emerge from this environment. R& D can be
encouraged as part of a national policy via providing
tax benefits to such activities, providing research
forums, facilitating organisational cooperation with
dedicated research centres and educational
establishments. As for employee development, steps
have been taken to spread and subsidise learning for
employees, but what might be missing is educating
the firms themselves on why this is necessary and
leave it to individuals to determine if they should use it
or not. A view of ‘every organisation is a learning
organisation’ can be the goal, one that is very far from
the current reality.
• There seem to be several cross-sector learning
opportunities were upper quartile organisations in
some sectors seem to be leading. The following is an
example of some sectors that seem to be able to offer
good/best practice in certain areas:
• There are also some sector specific learning that needs
to take place, i.e. some sectors seem to be under
performing in certain when compared to all UK
industry sectors. These could benefit from sector
specific learning targeted and tailored to them and
their environment. The following is an example of
some sectors specific areas that need targeting:
35
area sector offering good/best practice(based on performance numbers provided by Benchmark Index data
cost base service • general machinery • electronics
asset management service • general machinery • electronics
overhead management(employee empowerment & management control) service • food, drink & tobacco
on-time delivery food, drink & tobacco
absenteeism(work environment & employee motivation) service
supplier management(no.of suppliers, stock turns) food, drink & tobacco • chemical
investing & building for the future chemical • electronics • services
market growth electronics
sector learning area
general machinery customer management • delivery on-time
food, drink & tobacco people management(employee retention;staff turnover; absenteeism)
chemical safety (employee accidents)
transport investing & building for the future
metal products investing & building for the future
CTG 3 - AW 20/9/02 9:28 am Page 36

Appendix 3. Benchmark Index data sources
The report relied on data collected via Benchmark Index fromorganisations in the UK. The sample composition is describedin the following table;
Industry %
Farming, forestry & fishing 6.9
Mining & ore extraction 0.3
Food, drink & tobacco 3.5
Textiles & clothing 1.6
Wood & paper 4.8
Chemicals, plastics & ceramics 4.3
Metal products 14.3
General machinery 4.0
Electrical & electronics 4.4
Transport 20.0
Utilities, telecommunications & post 0.4
Retail & wholesale goods 6.0
Tourism 2.2
Transport services 2.0
Financial/property services 1.5
Social/governmental service 1.4
Other services 9.8
Construction/contracting 6.9
Other manufacturing 5.2
Education 0.5
Total 100%
Turnover %
Less than £1m 35.9
£1 - £4.9m 36.3
£5 - £9.9m 12.2
£10 – £29.9m 9.9
£30m + 5.7
Total 100%
Number of employees %
10 or less 22.5
11 – 20 16.8
21 – 50 25.0
51 – 100 16.1
101 – 250 15.0
251 – 500 3.8
More than 500 0.8
Total 100%
36
CTG 3 - AW 20/9/02 9:28 am Page 37

Appendix 4. Benchmark Index Analysts
Professor Andy Neely BEng MA PhD
Director, Centre for Business Performance
Professor Andy Neely is Director of the Centre for Business
Performance at Cranfield School of Management and
Professor of Operations Strategy and Performance. Prior to
joining Cranfield University he held a lecturing position at
Cambridge University, where he was a Fellow of Churchill
College. Andy has been researching and teaching in the field
of business performance measurement since the late 1980s.
He chaired the first and second international academic
conferences on performance measurement, in July 1998 and
July 2000 respectively and co-ordinates the Performance
Measurement Association, an international network for those
interested in the subject. He has completed numerous
research and consulting projects and authored over 100
books and articles, including "Measuring Business
Performance", which was published by the Economist. He has
consulted to and worked with a wide variety of organisations
including 3M, Accenture, Aventis, British Aerospace, British
Airways, British Telecom, DHL, Diageo, Hogg Robinson, KPMG,
NatWest, Pilkington, Posten, Reckitt and Colman, Rolls Royce
Aerospace and Schering.
Dr. Marek Szwejczewski BA MSc MSc DipM PhD
Senior Research Fellow in Operations Management
Marek is responsible for the administration and is involved in
the judging of the Management Today/Cranfield School of
Management Best Factory Awards scheme. His first degree is
in Economics and he completed his Master of Science in
Computer Integrated Manufacturing at Cranfield University
in 1991. Prior to joining Cranfield he worked for eight years in
marketing management. He has worked in various industry
sectors, ranging from retailing to telecommunications and,
prior to coming to Cranfield was Marketing Manager with
Motorola. After completing his MSc, Marek joined the
Operations Management Group at the School of
Management, to work on the Best Factory project. His current
research interests are manufacturing strategy, performance
measurement and world class manufacturing. He is the
author and co-author of a number of articles and reports on
manufacturing performance and strategy and supply chain
management.
Dr. Yasar F. Jarrar BSc MSc PhD
Yasar joined the Centre for Business Performance in January
2001 as a Research Fellow, and is currently involved in
applied research for sponsoring organisations (DHL, Bank of
Scotland, Arla Foods, BTCellnet, Greggs of Yorkshire and
Accenture). Currently, major research areas include
Performance Measurement and Management, Customer
Relationship Management and Six Sigma. Yasar is also
involved in research projects for NGO’s like the Productivity
and Standards Board (Singapore) and The Government of
Dubai (e-government initiative). Yasar is currently an
Honorary Visiting Fellow in Total Quality Management at the
European Center for Total Quality Management, University of
Bradford, UK, and has been an invited speaker in numerous
national and international events. Yasar also previously
worked as a Quality Management Consultant and Industrial
Engineer in the Middle East.
Data analysis in this publication has been carried outby the Centre for Business Performance at theCranfield School of Management, Cranfield University.The analysis has been headed by the Centre’sDirector, Professor Andy Neely with support fromDr. Marek Szwejczewski and Dr. Yasar F. Jarrar
37
CTG 3 - AW 20/9/02 9:28 am Page 38

Case Study
AquaCure
NOT CONTENT TO SIT ON THEIR LAURELS
With over a hundred years experience in business, one may
think there is not much for Aqua Cure to learn. But rather
than getting complacent, the firm have taken the opportunity
to stand back and look at their performance in order to
continue their success.
Founded in 1859 Aqua Cure is one of the United Kingdom’s
largest suppliers of water filtration, purification and treatment
systems. With just 70 employees it has remained small but
successful in its field. The company occupy two sites in
Merseyside where they manufacture and supply products
from as small as water filters for the kitchen sink to large
engineered treatment plants capable of dealing with
thousands of gallons per day.
Aqua Cure caters for approximately 20,000 customers, across
the public and private sectors, the largest clients being local
councils, NHS trusts and the prison service. Although most of
their business is national they export some products overseas
and hope to expand this market at an international exhibition
in Amsterdam later this year.
The firm’s reputation has been built on customer satisfaction
with its products, installation and maintenance facilities and
after-sales service. Current turnover stands at £4 million and
has been growing at 20 per cent per annum for the last three
years.
Nevertheless, managing director Minoo Karani is keen not to
let things slide. “There may be companies who are growing
at 50 per cent. We wanted to do the Benchmark Index to see
if we were doing well compared to others in the industry.”
After hearing about the Benchmark Index through a Business
Link presentation, the company took part in the process for
themselves in April this year. Five managers were involved in
benchmarking over a two and a half month period. But this
was time well spent according to Karani, who says
benchmarking has been wholly worthwhile.
When Aqua Cure received the results six weeks later there
were no real surprises. Profitability was good in comparison
to the rest of the industry and the Benchmark Index also
affirmed that the company’s approach to sales and customer
satisfaction was good, through effective marketing methods.
However, the report invited Aqua Cure to look more closely at
its expenditure in order to be more cost-efficient in relation
to production. The main weakness highlighted by the index
was in terms of communication. It seemed that
communication down the line was not always working well
and Aqua Cure needed to examine this at all levels of the firm.
The company have now taken steps to improve this by
introducing fortnightly meetings for all staff to make
everyone aware of changes in the business, even if they do
not affect all employees directly. A committee of
representatives from different areas of the company was also
formed to pool information and improve communication
across teams.
Karani believes benchmarking has helped in all areas of
operation, the main benefits being in relation to cost-saving
and better communication. “Small companies can get used to
wearing 20 different hats and lose sight of what their goals
are,” says Karani,“The Benchmark Index is a new set of eyes
for businesses - the constructive criticism can be very useful.”
Two advisors facilitated Aqua Cure in working through the
Benchmark Index. Karani explains that they could not have
completed it without the advisors as some of the questions
are more general and need tailoring to the specific company.
He hopes Aqua Cure will be able to continue expansion and
development at a steady rate over the next four years, and
possibly join forces with other businesses in the market.
Benchmarking helped clarify Aqua Cure’s strengths but also
revealed some areas for improvement showing that
profitability is not the sole indicator of a healthy business.
And would Aqua Cure recommend benchmarking? Karani
explains that any company that thinks it is doing well should
do the Benchmark Index because there are always areas that
can be improved. “Simple improvements can make huge
changes in business,” he says.
Small companies can get used to wearing 20different hats and losesight of what their goalsare, The BenchmarkIndex is a new set ofeyes for businesses - the constructive criticismcan be very useful.Minoo Karani , Managing Director, Aqua Cure
“
”
2138
CTG 3 - AW 20/9/02 9:28 am Page 39

CTG 3 - AW 20/9/02 9:28 am Page 40