benchmark innovation fora - oecd.org · benchmarking innovation policy and innovation framework...
TRANSCRIPT

Benchmarking Innovation Policy and Innovation Framework Conditions
January 2004
Foreword In the report “The New Economy: Beyond the Hype – The OECD Growth Project (2001)”, the OECD identified 4 areas that are likely to be the princi-pal factors in driving economic growth in the future: innovation, entrepre-neurship, ICT and human resources. In the future innovation and technology diffusion will be even more critical to the economic and social progress of advanced industrialized countries. In order to pursue an effective innovation policy it is therefore necessary to build a comprehensive methodology for strengthening knowledge-transfer across the OECD. Based on the “Roadmap for Benchmarking Business Policies” (OECD, 2002), this publication investigates innovation performance and innovation framework conditions across 27 OECD countries using a variety of quanti-tative and qualitative data and analysis. The report is made in cooperation with the Norwegian Ministry for Trade and Industry and Inside Consulting.
Ministry of Economic and Business Affairs Centre for Economic and Business Research

2/41
Summary This report benchmarks innovation and innovation policy across 27 OECD countries. In the future innovation and innovation diffusion will be even more critical to the economic and social progress of advanced industrialized countries, highlighting the need for building comprehensive methodologies in measur-ing innovation and innovation performance across the OECD. The analysis presented in this report is based on two assumptions: 1) that government initiatives have a significant impact on innovation activity and 2) that methodology can be applied to compare micro-policies in selected countries and provide policy-direction at the individual country level. The report identifies a group of 7 countries as leaders in innovation per-formance: Sweden, Switzerland, Japan, Finland, the US, Germany and the Netherlands. The analyses show that:
• There is a strong link between innovation performance and innova-tion framework conditions.
• A high innovation performance is directly related to an active inno-
vation policy, i.e. policy has a key role to play in ensuring that new innovations are developed and technology properly diffused throughout the economy.
• Policy measures need to be applied in a manner that suits the na-
tional context in which countries operate if any attempt to learn from top-performing countries is to be made
Based on a mix of qualitative and quantitative information in assessing in-novation performance and innovation framework conditions, the report con-siders the effectiveness of policies in the specific economic and institutional context in which they operate. A number of country case studies have been prepared to compare micro-policies to provide policy-direction at the individual country level. A country's innovation performance will depend not only on how it per-forms in each individual element of the national innovation system (NIS), but how these separate elements interact. Different configurations can result in a successful overall innovation performance.

3/41
It also follows that policy measures need to be altered to suit the national context, including institutional factors, industry specialization and size. As a result, policy instruments that may be effective in improving innovative per-formance in one country may be less effective or even inappropriate in an-other. A simple “cut-and-paste” approach, where policy areas are randomly copied and applied by low-performing countries could easily be detrimental to in-novation performance. However, we are confident that the analysis put for-ward will serve as an inspiration in designing policies that help improve overall innovation performance. It is important to bear in mind that individual elements or particular combi-nations of the NIS may only have an effect on innovation performance with a significant lag. Thus an assessment made today of performance may imply changes both for better or for worse in the future. Chapter I of the report defines and measures innovation performance and technology diffusion across 27 OECD. Chapter II explores and quantifies innovation framework conditions across a range of policy areas. Chapter III is devoted to exploring the link between innovation performance and inno-vation framework conditions. The accompanying paper titled “Benchmarking Innovation Policy and In-novation Framework Conditions – Country Case Studies” examines the re-lationship between innovation performance and innovation framework con-ditions in selected countries and illustrates how these countries can learn from top performing countries in designing effective policies to boost inno-vation performance.

4/41
1. Defining and measuring performance in fostering innovation and technology diffusion Countries that fail to nurture innovation activities will find themselves in di-rect competition with newly industrialized countries as the latter increas-ingly apply existing technologies and business methods. The development and exploitation of new products, processes, services and systems and the constant upgrading of those which a country already possesses is the only way in which advanced industrialized countries can maintain and increase their levels of economic and social prosperity. Thus the impact of innovation on productivity and growth creation is not limited to the initial introduction of new products, processes, services and systems, but also to the subsequent diffusion of new technology throughout the economy.1 Benchmarking innovation and innovation framework conditions is by no means an easy task. For policy making purposes it is not sufficient to meas-ure the output of a country’s innovation performance, it is also necessary to ascertain how that performance was achieved. Assessing national innovation performance is determined by 1) innovation activity, i.e. the number of products, processes, services and concepts devel-oped and 2) technology diffusion, i.e. the diffusion of those innovations throughout the economy. For all but the largest OECD countries, the vast majority of novel innovations will come from abroad. However all OECD countries must be effective at exploiting new science and technology appro-priate to their needs from wherever it is to be found in the world. When comparing and ranking countries in the areas of innovation, competi-tiveness, and globalisation, composite indicators are valued for their ability to integrate large amounts of information into easily understood formats. The proliferation of composite indicators will raise questions regarding their accuracy and reliability. Due to the sensitivity of the results to different weighting and aggregation techniques as well as the problems of missing data, composite indicators can result in distorted findings on country per-formance. However composite indicators will continue to be developed due to their usefulness as a communication tool and for analytical purposes.2
1 See also “A Strategic View of Innovation Policy: A Proposed Methodology for Assessing Innovation Policy and Performance”, John Barber, OECD DSTI/STP/TIP(2003)4 2 See also “Composite Indicators of Country Performance: A Critical Assessment”, Michael Freudenberg, OECD DSTI/IND(2003)5
5/41
Measuring innovation activity Data on innovation activity is based on surveys carried out by the EU Commission, the World Economic Forum (WEF), and the International In-stitute for Management Development (IMD). In addition to the survey data the number of patents in ‘triadic’ families has been added to the innovation index. The latter measures innovation activity in businesses and technolo-gies that typically patent new products. The following indicators have been applied in sizing overall innovation ac-tivity:
• Number of companies having introduced new or significantly im-proved products/processes
• “Business’ assessment of innovation activity” is based on 3 individ-ual indicators and measures 1) the extent to which companies de-velop new products and processes, 2) to which extent companies de-velop new designs and 3) an assessment of the extent to which inno-vation influences on corporate revenues.
• The number of patents in ‘triadic’ patent families measures the number of patented innovations introduced across the US, EU, and Japan.
To measure the quality of survey data a number of test have been conducted leaving us to conclude that the data used is indeed valid.3 The three indicators have been combined into one composite index for all 27 countries (please refer to appendix 5). Switzerland, Germany and Japan are identified as leaders in innovation activity with Sweden and the US rounding up the top-5. Measuring technology diffusion Measuring innovation diffusion across companies is by no means a straight-forward exercise. Diffusion is facilitated by job rotation, networking, for-malized collaboration, and by intra-company purchase of products and tech-nologies. Available data from the OECD allows for comparisons of formal diffusion, while data on informal diffusion (personal networks, job rotation) is cur-rently unavailable. The following indicators have been applied in sizing innovation diffusion:
3 Please refer to Appendix 4 for an in-depth discussion on the use of survey data in benchmarking innovation
6/41
• Import of technology, patents, franchising, and purchase of research and technical consulting. The indicator measures to which extent companies are able to use innovations developed in other countries.
• “Business’ assessment of the application of new technology” meas-ures the ability of companies in introducing and using new technol-ogy.
• Share of firms collaborating with other firms on innovation and technology measures the ability of companies in applying knowl-edge, know-how and ideas developed by other companies.
The first two indicators illustrate the speed at which new technology is ap-plied, while the third indicator measures the application of knowledge, know-how and ideas developed by other companies. The 3 indicators have been combined into a composite index (please refer to appendix 5). The index identifies Sweden, Ireland and Finland as top per-formers in terms of technology diffusion. Japan and Switzerland, ranked 5 and 6, perform well and were also ranked in the top-3 on innovation activ-ity.
7/41
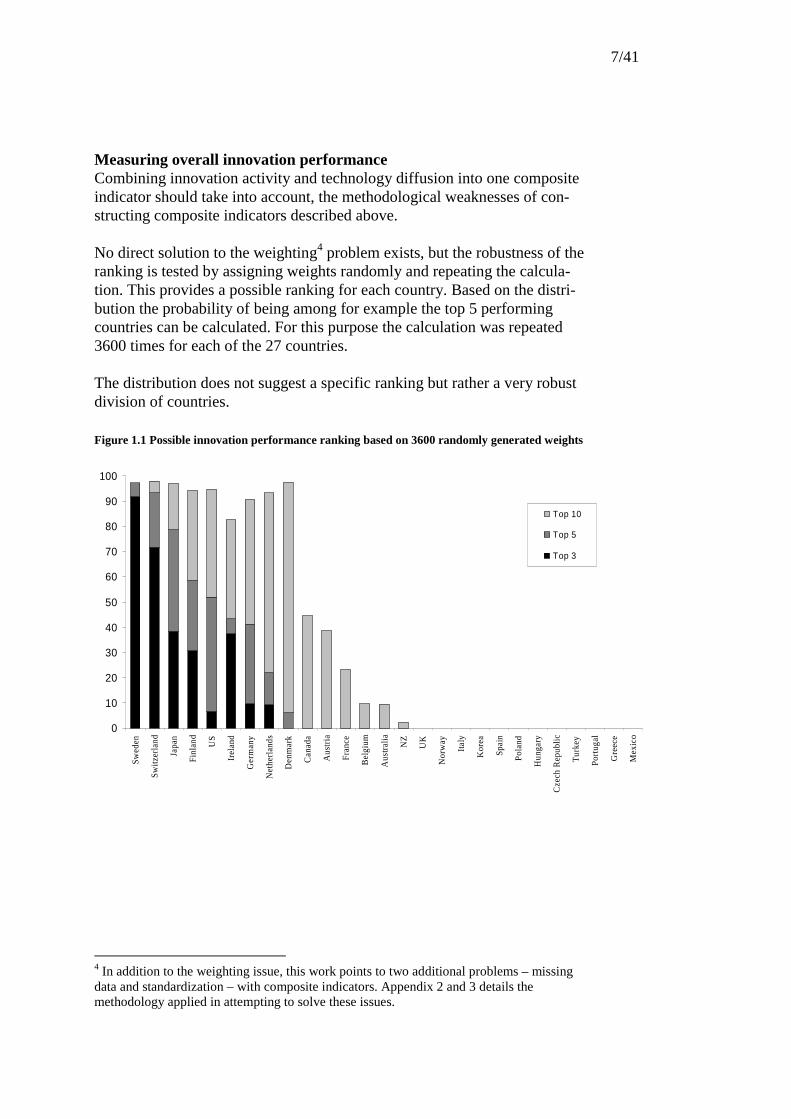
Measuring overall innovation performance Combining innovation activity and technology diffusion into one composite indicator should take into account, the methodological weaknesses of con-structing composite indicators described above. No direct solution to the weighting4 problem exists, but the robustness of the ranking is tested by assigning weights randomly and repeating the calcula-tion. This provides a possible ranking for each country. Based on the distri-bution the probability of being among for example the top 5 performing countries can be calculated. For this purpose the calculation was repeated 3600 times for each of the 27 countries. The distribution does not suggest a specific ranking but rather a very robust division of countries.
Figure 1.1 Possible innovation performance ranking based on 3600 randomly generated weights
4 In addition to the weighting issue, this work points to two additional problems – missing data and standardization – with composite indicators. Appendix 2 and 3 details the methodology applied in attempting to solve these issues.
0
10
20
30
40
50
60
70
80
90
100
Swed
en
Swit
zerl
and
Japa
n
Finl
and
US
Irel
and
Ger
man
y
Net
herl
ands
Den
mar
k
Can
ada
Aus
tria
Fra
nce
Bel
gium
Aus
tral
ia
NZ
UK
Nor
way
Ital
y
Kor
ea
Spai
n
Pol
and
Hun
gary
Cze
ch R
epub
lic
Tur
key
Port
ugal
Gre
ece
Mex
ico
Top 10
Top 5
Top 3
8/41
The analysis shows that Sweden, Switzerland and Japan are ranked in the top 5 in 80% of the outcomes. The 3 top performers are followed by a group of 5 countries (Finland, the US, Ireland, Germany, and the Netherlands) which all rank among the top 5 in more than 20% of the outcomes. The US, Germany and The Netherlands scores well on all indicators and are in the top 3 on 1-2 indicators. The high Irish ranking should be treated with caution, as the country is not ranked in the top 10 in 20% of the outcomes. The selected indicators show that Ireland is ranked first on “import of foreign technology”, but only has one other top-ranking and ranks in the lower one-third on two other indica-tors.5 In conclusion, 7 countries are identified as being top performers in overall innovation performance. This group is referred to as the “top-7” throughout the report:
• Sweden • Switzerland • Japan • Finland • USA • Germany • The Netherlands
5 For further analyses of the Irish ranking please refer to Chapter 3
9/41
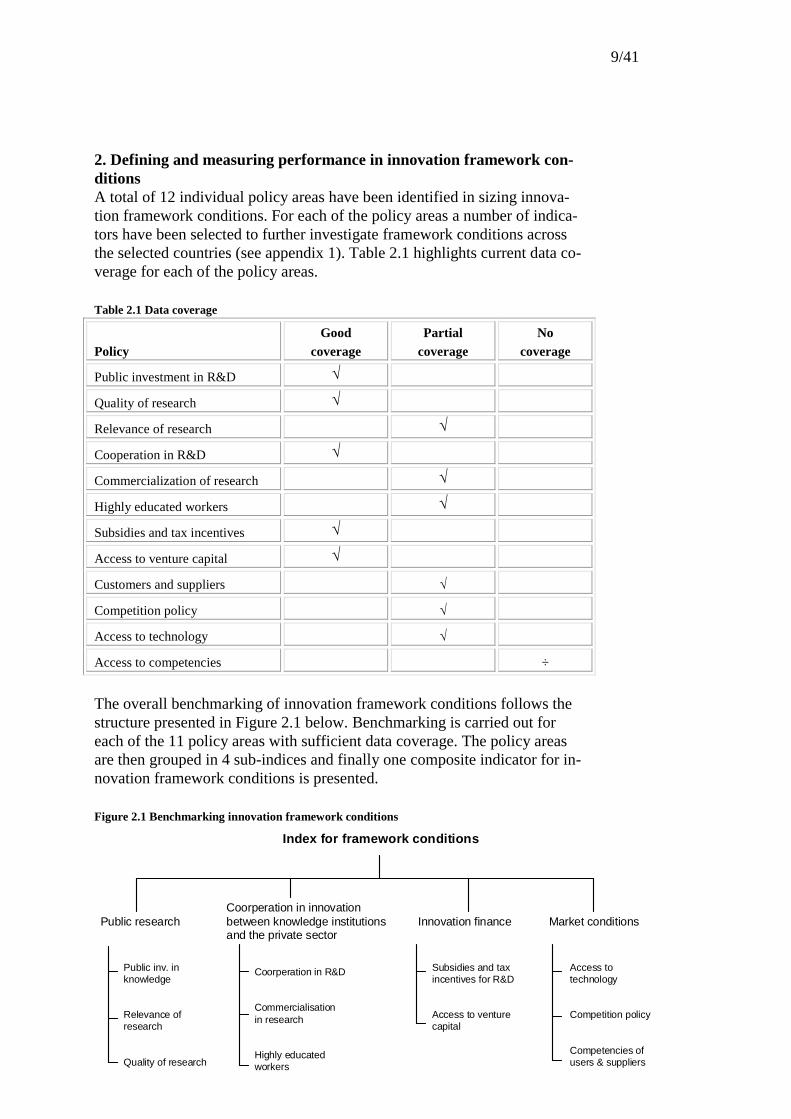
2. Defining and measuring performance in innovation framework con-ditions A total of 12 individual policy areas have been identified in sizing innova-tion framework conditions. For each of the policy areas a number of indica-tors have been selected to further investigate framework conditions across the selected countries (see appendix 1). Table 2.1 highlights current data co-verage for each of the policy areas. Table 2.1 Data coverage
Policy
Good coverage
Partial coverage
No coverage
Public investment in R&D √
Quality of research √
Relevance of research √
Cooperation in R&D √
Commercialization of research √
Highly educated workers √
Subsidies and tax incentives √
Access to venture capital √
Customers and suppliers √
Competition policy √
Access to technology √
Access to competencies ÷
The overall benchmarking of innovation framework conditions follows the structure presented in Figure 2.1 below. Benchmarking is carried out for each of the 11 policy areas with sufficient data coverage. The policy areas are then grouped in 4 sub-indices and finally one composite indicator for in-novation framework conditions is presented. Figure 2.1 Benchmarking innovation framework conditions
Public researchCoorperation in innovation between knowledge institutions and the private sector
Innovation finance Market conditions
Index for framework conditions
Public inv. in knowledge
Relevance ofresearch
Quality of research
Coorperation in R&D
Commercialisationin research
Highly educatedworkers
Subsidies and taxincentives for R&D
Access to venture capital
Access to technology
Competition policy
Competencies ofusers & suppliers
10/41
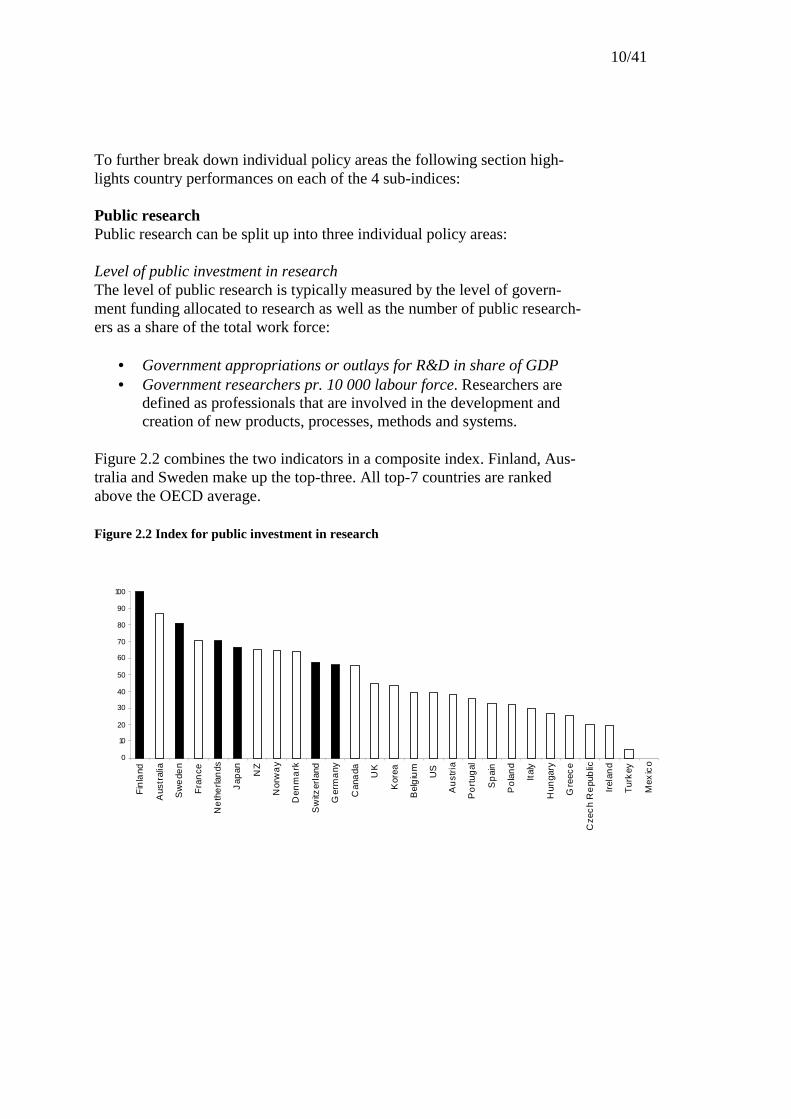
To further break down individual policy areas the following section high-lights country performances on each of the 4 sub-indices: Public research Public research can be split up into three individual policy areas: Level of public investment in research The level of public research is typically measured by the level of govern-ment funding allocated to research as well as the number of public research-ers as a share of the total work force:
• Government appropriations or outlays for R&D in share of GDP • Government researchers pr. 10 000 labour force. Researchers are
defined as professionals that are involved in the development and creation of new products, processes, methods and systems.
Figure 2.2 combines the two indicators in a composite index. Finland, Aus-tralia and Sweden make up the top-three. All top-7 countries are ranked above the OECD average. Figure 2.2 Index for public investment in research
0
10
20
30
40
50
60
70
80
90
100
Fin
land
Aus
tral
ia
Sw
ede
n
Fra
nce
Ne
the
rlan
ds
Jap
an NZ
Nor
wa
y
Den
ma
rk
Sw
itzer
land
Ger
ma
ny
Can
ada UK
Kor
ea
Bel
giu
m
US
Au
stri
a
Po
rtug
al
Sp
ain
Po
lan
d
Ital
y
Hun
gary
Gre
ece
Cze
ch
Re
pub
lic
Irel
and
Tur
key
Mex
ico
11/41
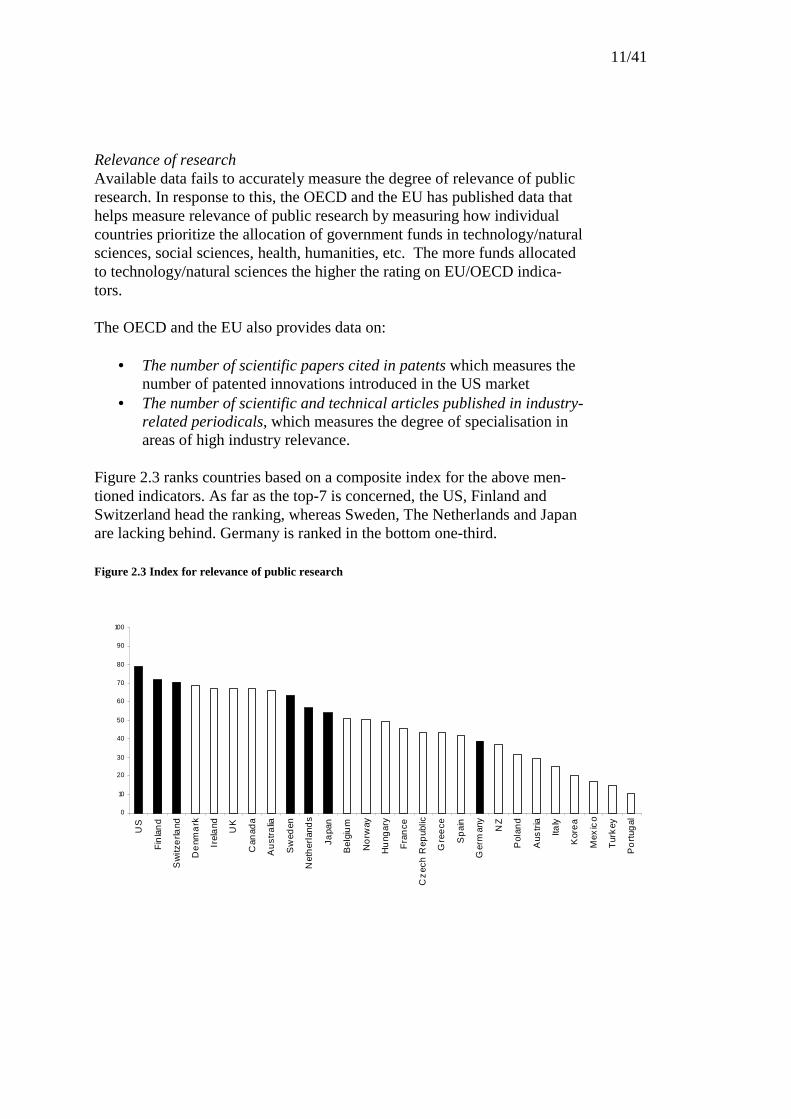
Relevance of research Available data fails to accurately measure the degree of relevance of public research. In response to this, the OECD and the EU has published data that helps measure relevance of public research by measuring how individual countries prioritize the allocation of government funds in technology/natural sciences, social sciences, health, humanities, etc. The more funds allocated to technology/natural sciences the higher the rating on EU/OECD indica-tors. The OECD and the EU also provides data on:
• The number of scientific papers cited in patents which measures the number of patented innovations introduced in the US market
• The number of scientific and technical articles published in industry-related periodicals, which measures the degree of specialisation in areas of high industry relevance.
Figure 2.3 ranks countries based on a composite index for the above men-tioned indicators. As far as the top-7 is concerned, the US, Finland and Switzerland head the ranking, whereas Sweden, The Netherlands and Japan are lacking behind. Germany is ranked in the bottom one-third. Figure 2.3 Index for relevance of public research
0
10
20
30
40
50
60
70
80
90
100
US
Fin
lan
d
Sw
itze
rland
De
nma
rk
Irel
and UK
Can
ada
Au
stra
lia
Sw
eden
Net
her
land
s
Japa
n
Bel
giu
m
No
rway
Hu
ngar
y
Fra
nce
Cz
ech
Rep
ublic
Gre
ece
Sp
ain
Ger
man
y
NZ
Pol
and
Aus
tria
Italy
Kor
ea
Mex
ico
Tur
key
Po
rtug
al
12/41
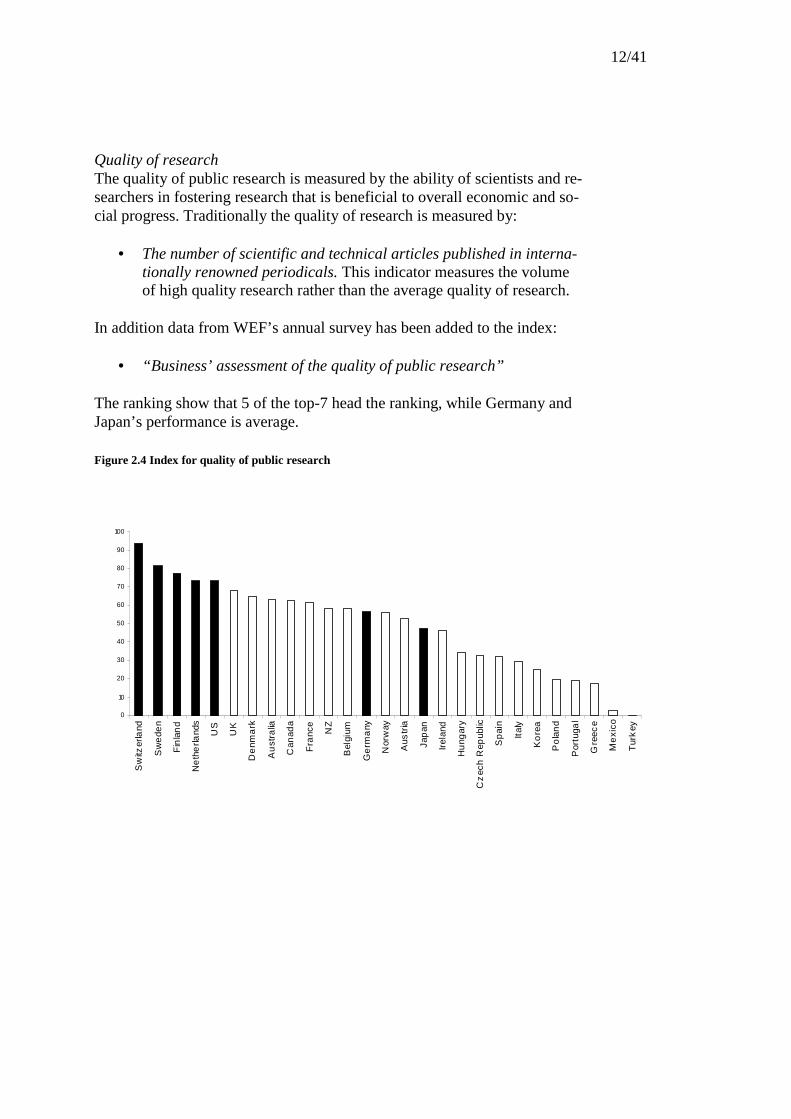
Quality of research The quality of public research is measured by the ability of scientists and re-searchers in fostering research that is beneficial to overall economic and so-cial progress. Traditionally the quality of research is measured by:
• The number of scientific and technical articles published in interna-tionally renowned periodicals. This indicator measures the volume of high quality research rather than the average quality of research.
In addition data from WEF’s annual survey has been added to the index:
• “Business’ assessment of the quality of public research” The ranking show that 5 of the top-7 head the ranking, while Germany and Japan’s performance is average. Figure 2.4 Index for quality of public research
0
10
20
30
40
50
60
70
80
90
100
Sw
itzer
land
Sw
ede
n
Fin
lan
d
Ne
the
rland
s
US
UK
De
nma
rk
Au
stra
lia
Can
ada
Fra
nce
NZ
Bel
gium
Ge
rma
ny
Nor
way
Aus
tria
Jap
an
Irel
and
Hu
ngar
y
Cz
ech
Rep
ublic
Sp
ain
Ital
y
Ko
rea
Po
lan
d
Por
tuga
l
Gre
ece
Me
xico
Tur
key
13/41
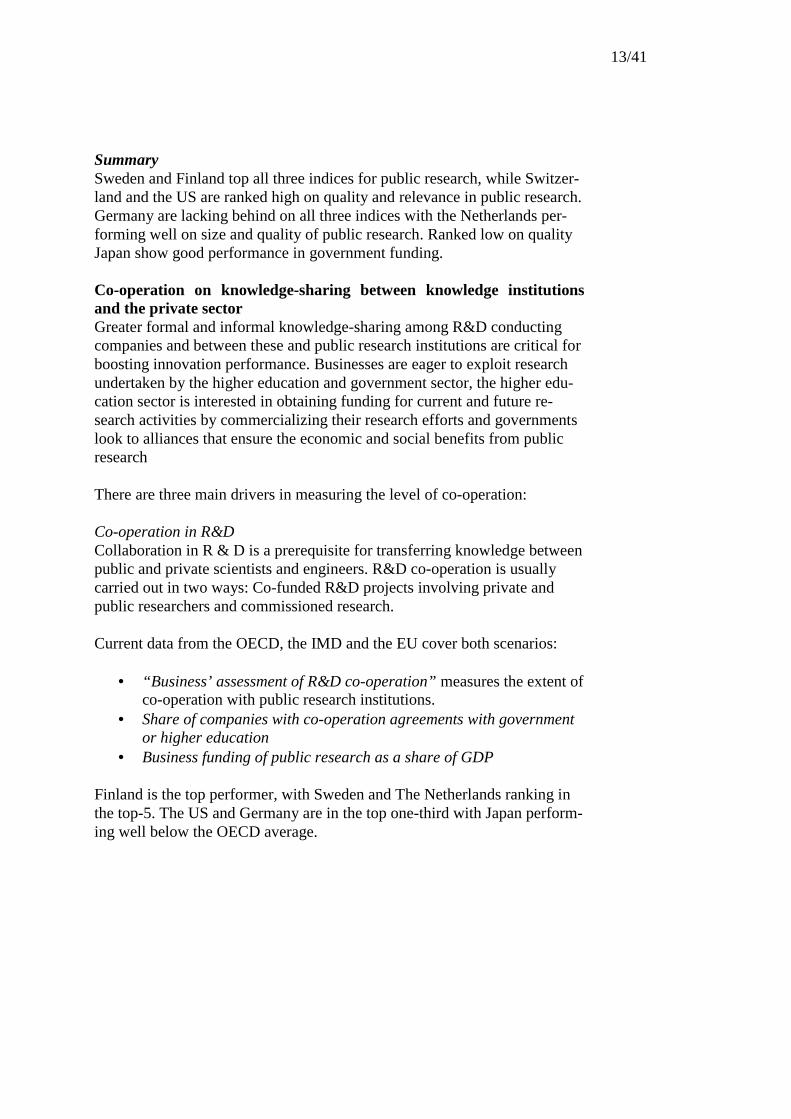
Summary Sweden and Finland top all three indices for public research, while Switzer-land and the US are ranked high on quality and relevance in public research. Germany are lacking behind on all three indices with the Netherlands per-forming well on size and quality of public research. Ranked low on quality Japan show good performance in government funding. Co-operation on knowledge-sharing between knowledge institutions and the private sector Greater formal and informal knowledge-sharing among R&D conducting companies and between these and public research institutions are critical for boosting innovation performance. Businesses are eager to exploit research undertaken by the higher education and government sector, the higher edu-cation sector is interested in obtaining funding for current and future re-search activities by commercializing their research efforts and governments look to alliances that ensure the economic and social benefits from public research There are three main drivers in measuring the level of co-operation: Co-operation in R&D Collaboration in R & D is a prerequisite for transferring knowledge between public and private scientists and engineers. R&D co-operation is usually carried out in two ways: Co-funded R&D projects involving private and public researchers and commissioned research. Current data from the OECD, the IMD and the EU cover both scenarios:
• “Business’ assessment of R&D co-operation” measures the extent of
co-operation with public research institutions. • Share of companies with co-operation agreements with government
or higher education • Business funding of public research as a share of GDP
Finland is the top performer, with Sweden and The Netherlands ranking in the top-5. The US and Germany are in the top one-third with Japan perform-ing well below the OECD average.
14/41
Figure 2.5 Index for co-operation in R&D
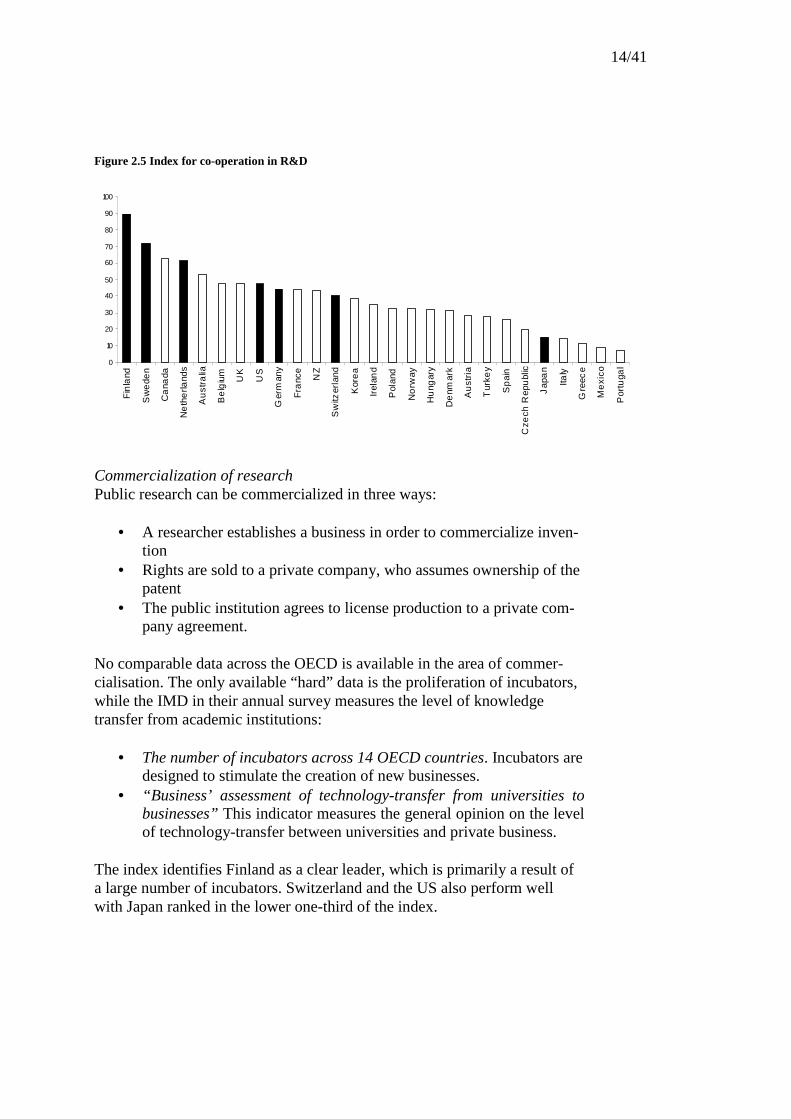
Commercialization of research Public research can be commercialized in three ways:
• A researcher establishes a business in order to commercialize inven-tion
• Rights are sold to a private company, who assumes ownership of the patent
• The public institution agrees to license production to a private com-pany agreement.
No comparable data across the OECD is available in the area of commer-cialisation. The only available “hard” data is the proliferation of incubators, while the IMD in their annual survey measures the level of knowledge transfer from academic institutions:
• The number of incubators across 14 OECD countries. Incubators are designed to stimulate the creation of new businesses.
• “Business’ assessment of technology-transfer from universities to businesses” This indicator measures the general opinion on the level of technology-transfer between universities and private business.
The index identifies Finland as a clear leader, which is primarily a result of a large number of incubators. Switzerland and the US also perform well with Japan ranked in the lower one-third of the index.
0
10
20
30
40
50
60
70
80
90
100
Fin
land
Sw
ede
n
Ca
nada
Ne
the
rland
s
Au
stra
lia
Be
lgiu
m
UK
US
Ger
man
y
Fra
nce
NZ
Sw
itzer
land
Kor
ea
Irel
and
Pol
and
No
rway
Hu
ngar
y
De
nmar
k
Au
stri
a
Tur
key
Sp
ain
Cze
ch R
epu
blic
Jap
an
Italy
Gre
ece
Me
xico
Por
tuga
l
15/41
Figure 2.6 Index for commercialisation of research
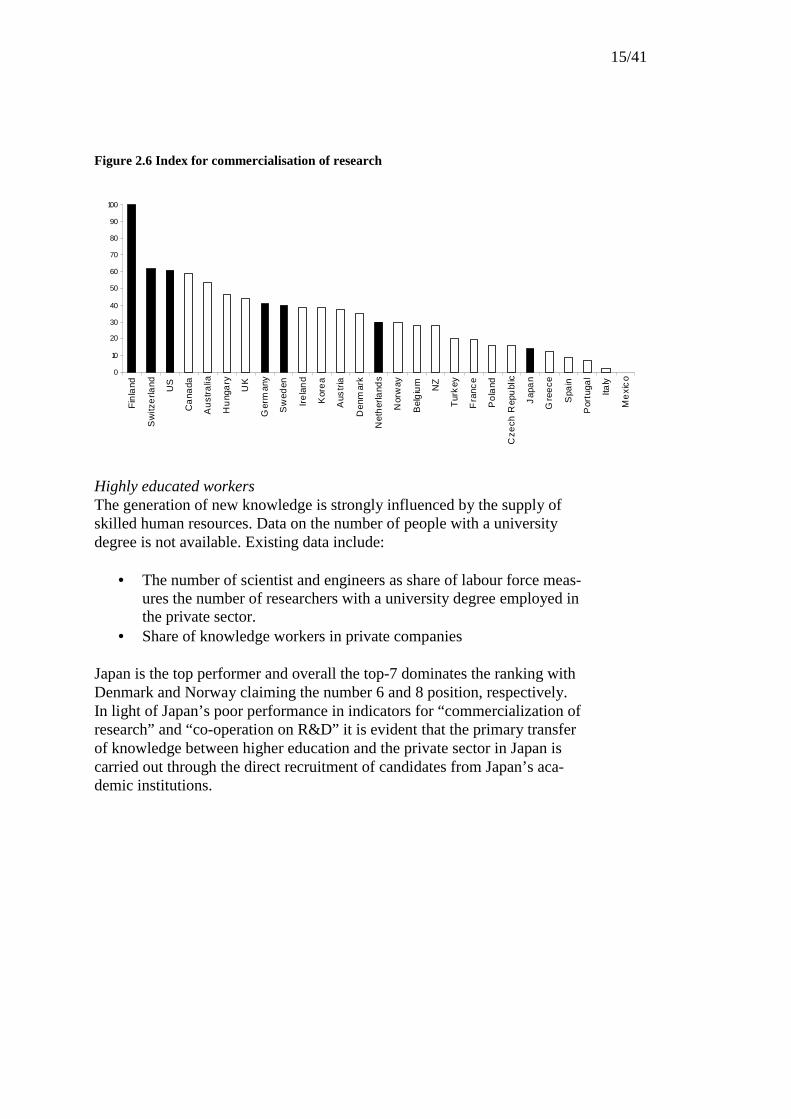
Highly educated workers The generation of new knowledge is strongly influenced by the supply of skilled human resources. Data on the number of people with a university degree is not available. Existing data include:
• The number of scientist and engineers as share of labour force meas-ures the number of researchers with a university degree employed in the private sector.
• Share of knowledge workers in private companies Japan is the top performer and overall the top-7 dominates the ranking with Denmark and Norway claiming the number 6 and 8 position, respectively. In light of Japan’s poor performance in indicators for “commercialization of research” and “co-operation on R&D” it is evident that the primary transfer of knowledge between higher education and the private sector in Japan is carried out through the direct recruitment of candidates from Japan’s aca-demic institutions.
0
10
20
30
40
50
60
70
80
90
100
Fin
land
Sw
itze
rland US
Ca
nada
Au
stra
lia
Hu
nga
ry
UK
Ger
man
y
Sw
eden
Ire
lan
d
Kor
ea
Aus
tria
Den
mar
k
Net
her
land
s
Nor
way
Bel
giu
m NZ
Tur
key
Fra
nce
Po
land
Cze
ch R
epu
blic
Jap
an
Gre
ece
Spa
in
Por
tuga
l
Italy
Me
xic
o
16/41
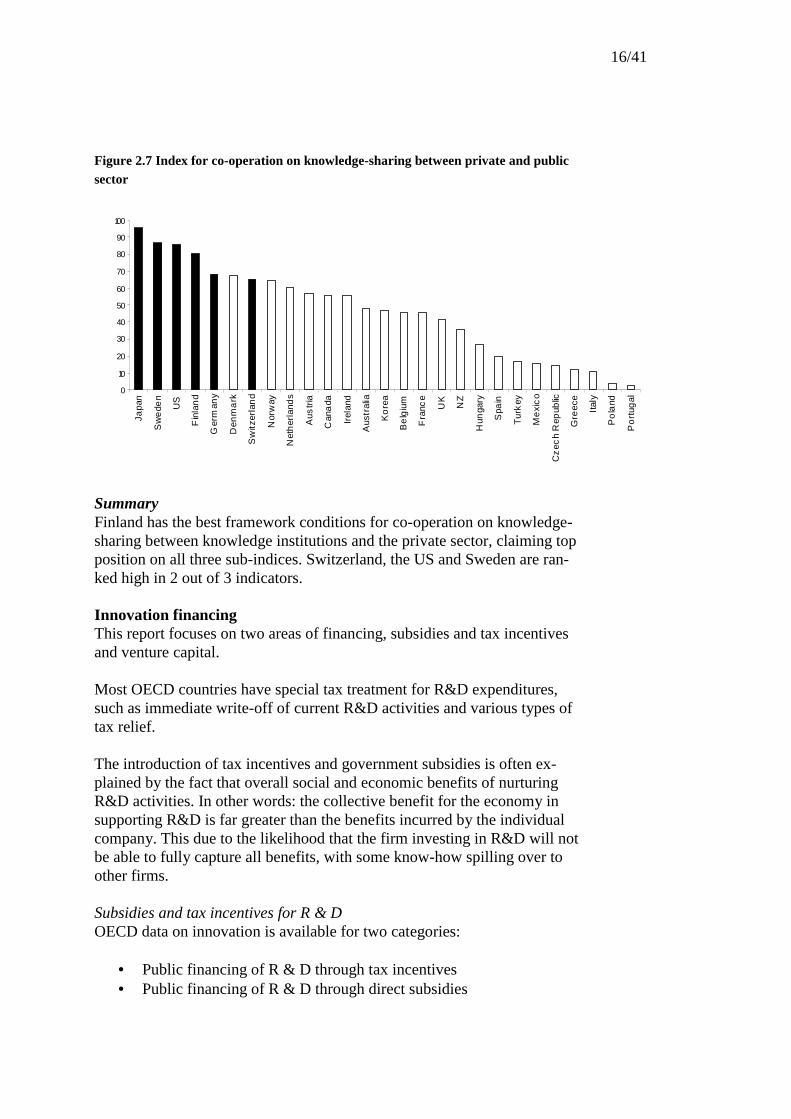
Figure 2.7 Index for co-operation on knowledge-sharing between private and public sector
Summary Finland has the best framework conditions for co-operation on knowledge-sharing between knowledge institutions and the private sector, claiming top position on all three sub-indices. Switzerland, the US and Sweden are ran-ked high in 2 out of 3 indicators. Innovation financing This report focuses on two areas of financing, subsidies and tax incentives and venture capital. Most OECD countries have special tax treatment for R&D expenditures, such as immediate write-off of current R&D activities and various types of tax relief. The introduction of tax incentives and government subsidies is often ex-plained by the fact that overall social and economic benefits of nurturing R&D activities. In other words: the collective benefit for the economy in supporting R&D is far greater than the benefits incurred by the individual company. This due to the likelihood that the firm investing in R&D will not be able to fully capture all benefits, with some know-how spilling over to other firms. Subsidies and tax incentives for R & D OECD data on innovation is available for two categories:
• Public financing of R & D through tax incentives • Public financing of R & D through direct subsidies
0
10
20
30
40
50
60
70
80
90
100
Japa
n
Sw
ede
n
US
Fin
lan
d
Ger
man
y
Den
ma
rk
Sw
itzer
lan
d
Nor
way
Net
her
land
s
Aus
tria
Can
ada
Irel
and
Aus
tral
ia
Ko
rea
Be
lgiu
m
Fra
nce
UK
NZ
Hun
gary
Spa
in
Tur
key
Me
xic
o
Cz
ech
Rep
ublic
Gre
ece
Ital
y
Po
land
Po
rtug
al
17/41
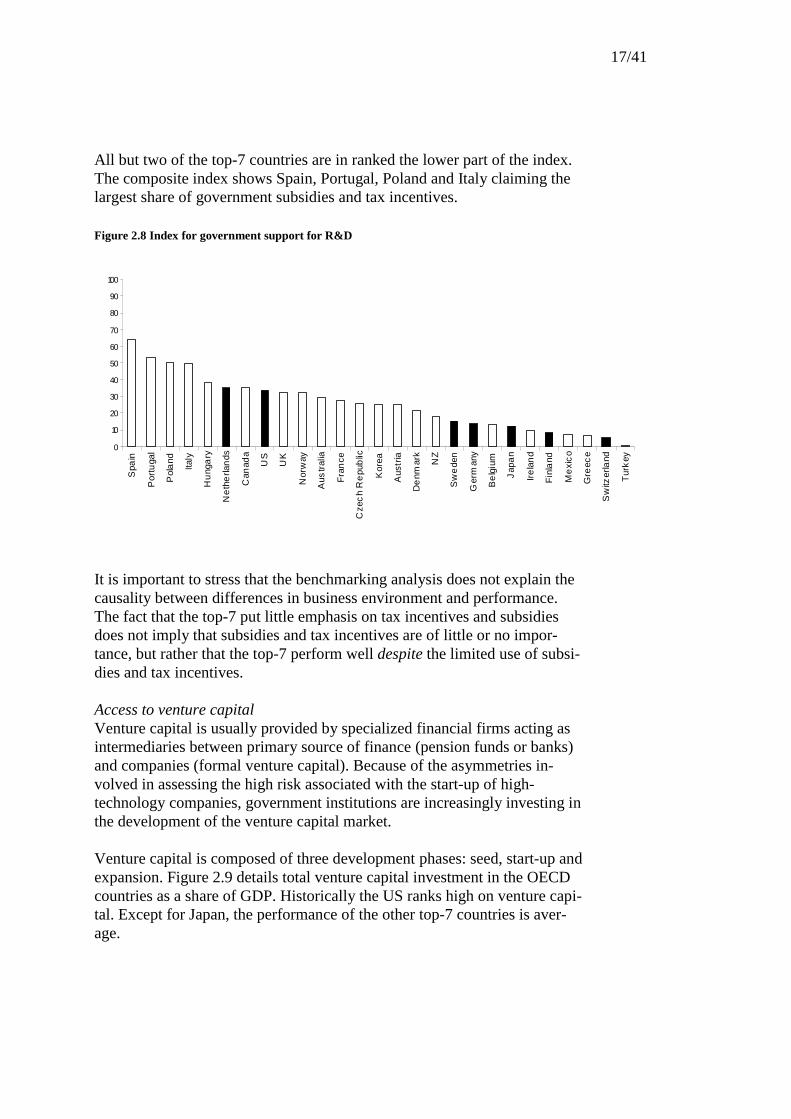
All but two of the top-7 countries are in ranked the lower part of the index. The composite index shows Spain, Portugal, Poland and Italy claiming the largest share of government subsidies and tax incentives. Figure 2.8 Index for government support for R&D
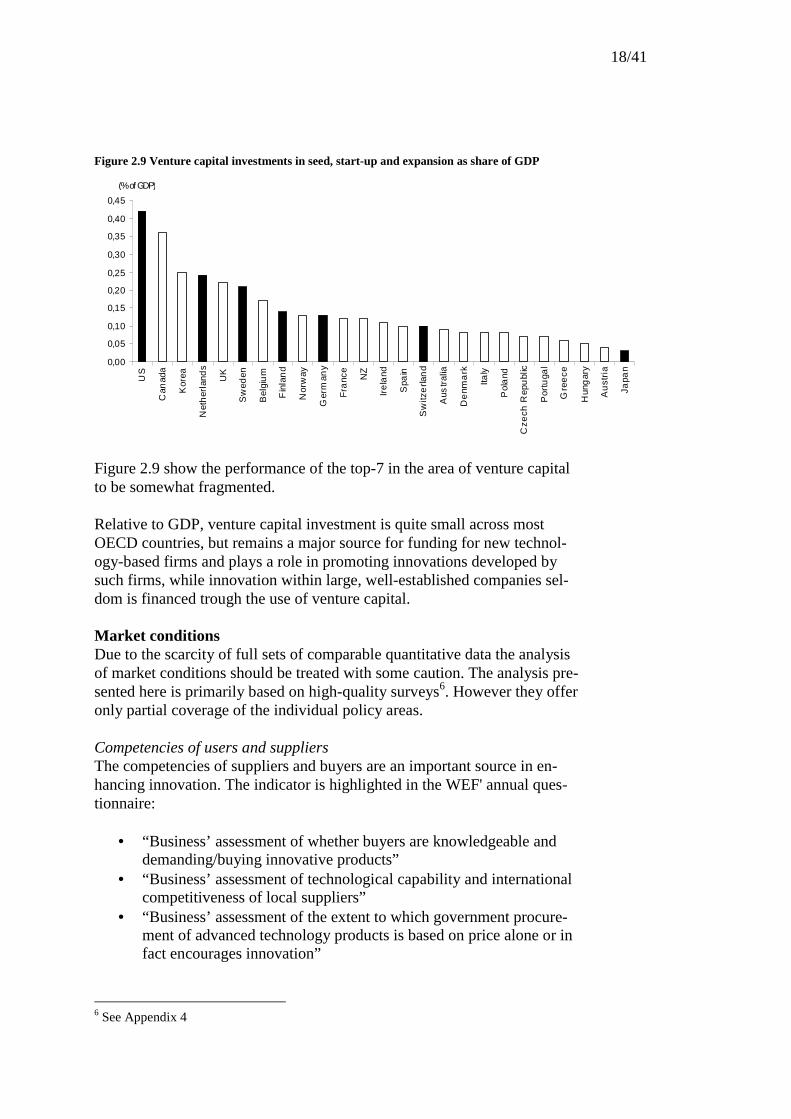
It is important to stress that the benchmarking analysis does not explain the causality between differences in business environment and performance. The fact that the top-7 put little emphasis on tax incentives and subsidies does not imply that subsidies and tax incentives are of little or no impor-tance, but rather that the top-7 perform well despite the limited use of subsi-dies and tax incentives. Access to venture capital Venture capital is usually provided by specialized financial firms acting as intermediaries between primary source of finance (pension funds or banks) and companies (formal venture capital). Because of the asymmetries in-volved in assessing the high risk associated with the start-up of high-technology companies, government institutions are increasingly investing in the development of the venture capital market. Venture capital is composed of three development phases: seed, start-up and expansion. Figure 2.9 details total venture capital investment in the OECD countries as a share of GDP. Historically the US ranks high on venture capi-tal. Except for Japan, the performance of the other top-7 countries is aver-age.
0
10
20
30
40
50
60
70
80
90
100
Spa
in
Por
tuga
l
Pol
and
Italy
Hu
nga
ry
Ne
the
rlan
ds
Can
ada
US
UK
Nor
way
Aus
tral
ia
Fra
nce
Cze
ch
Re
pub
lic
Kor
ea
Aus
tria
De
nmar
k
NZ
Sw
ede
n
Ger
man
y
Be
lgiu
m
Jap
an
Ire
lan
d
Fin
land
Me
xic
o
Gre
ece
Sw
itzer
land
Tur
key
18/41
Figure 2.9 Venture capital investments in seed, start-up and expansion as share of GDP
Figure 2.9 show the performance of the top-7 in the area of venture capital to be somewhat fragmented. Relative to GDP, venture capital investment is quite small across most OECD countries, but remains a major source for funding for new technol-ogy-based firms and plays a role in promoting innovations developed by such firms, while innovation within large, well-established companies sel-dom is financed trough the use of venture capital. Market conditions Due to the scarcity of full sets of comparable quantitative data the analysis of market conditions should be treated with some caution. The analysis pre-sented here is primarily based on high-quality surveys6. However they offer only partial coverage of the individual policy areas. Competencies of users and suppliers The competencies of suppliers and buyers are an important source in en-hancing innovation. The indicator is highlighted in the WEF' annual ques-tionnaire:
• “Business’ assessment of whether buyers are knowledgeable and demanding/buying innovative products”
• “Business’ assessment of technological capability and international competitiveness of local suppliers”
• “Business’ assessment of the extent to which government procure-ment of advanced technology products is based on price alone or in fact encourages innovation”
6 See Appendix 4
0,00
0,05
0,10
0,15
0,20
0,25
0,30
0,35
0,40
0,45
US
Can
ada
Kor
ea
Net
her
land
s
UK
Sw
eden
Bel
giu
m
Fin
lan
d
Nor
way
Ger
man
y
Fra
nce
NZ
Ire
land
Spa
in
Sw
itze
rlan
d
Aus
tral
ia
De
nma
rk
Italy
Pol
and
Cze
ch R
epu
blic
Por
tuga
l
Gre
ece
Hun
gar
y
Au
stri
a
Japa
n
(% of GDP)
19/41
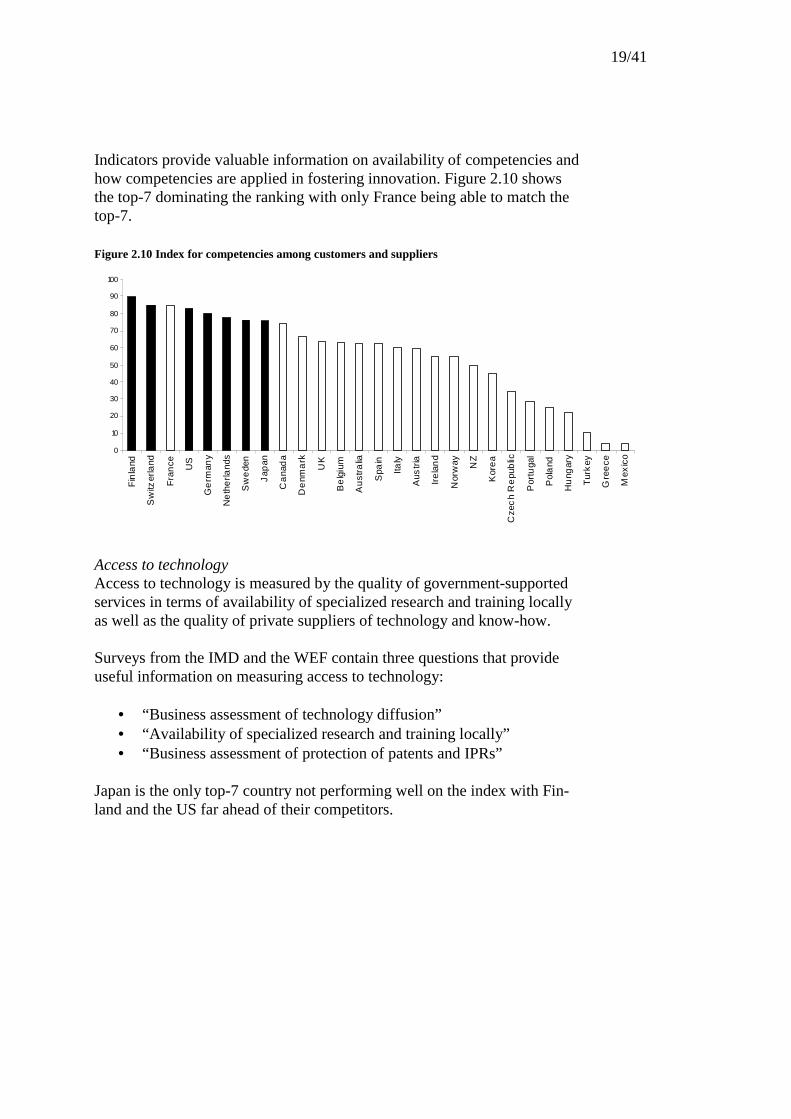
Indicators provide valuable information on availability of competencies and how competencies are applied in fostering innovation. Figure 2.10 shows the top-7 dominating the ranking with only France being able to match the top-7. Figure 2.10 Index for competencies among customers and suppliers
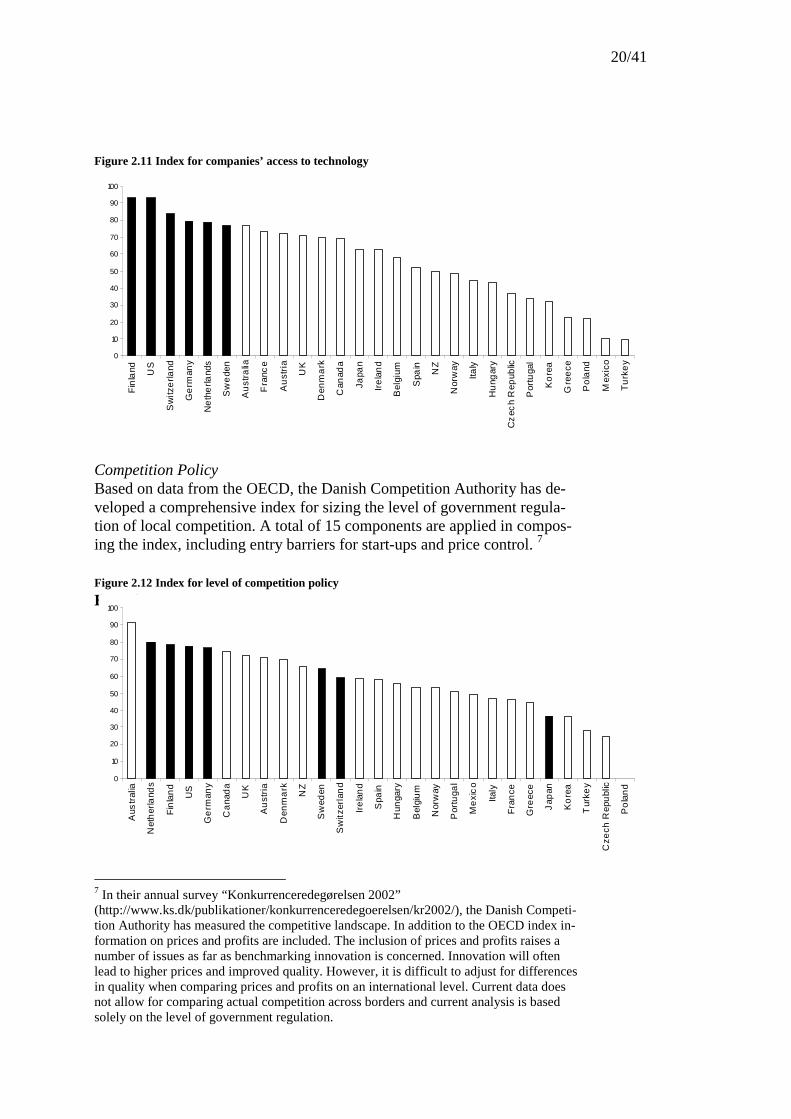
Access to technology Access to technology is measured by the quality of government-supported services in terms of availability of specialized research and training locally as well as the quality of private suppliers of technology and know-how. Surveys from the IMD and the WEF contain three questions that provide useful information on measuring access to technology:
• “Business assessment of technology diffusion” • “Availability of specialized research and training locally” • “Business assessment of protection of patents and IPRs”
Japan is the only top-7 country not performing well on the index with Fin-land and the US far ahead of their competitors.
0
10
20
30
40
50
60
70
80
90
100
Fin
land
Sw
itzer
land
Fra
nce US
Ge
rman
y
Ne
the
rland
s
Sw
ede
n
Jap
an
Ca
nad
a
De
nma
rk
UK
Be
lgiu
m
Au
stra
lia
Spa
in
Italy
Aus
tria
Ire
lan
d
Nor
way NZ
Kor
ea
Cze
ch
Re
pub
lic
Por
tuga
l
Pol
and
Hu
ngar
y
Tur
key
Gre
ece
Mex
ico
20/41
Figure 2.11 Index for companies’ access to technology
Competition Policy Based on data from the OECD, the Danish Competition Authority has de-veloped a comprehensive index for sizing the level of government regula-tion of local competition. A total of 15 components are applied in compos-ing the index, including entry barriers for start-ups and price control. 7 Figure 2.12 Index for level of competition policy
Error!
7 In their annual survey “Konkurrenceredegørelsen 2002” (http://www.ks.dk/publikationer/konkurrenceredegoerelsen/kr2002/), the Danish Competi-tion Authority has measured the competitive landscape. In addition to the OECD index in-formation on prices and profits are included. The inclusion of prices and profits raises a number of issues as far as benchmarking innovation is concerned. Innovation will often lead to higher prices and improved quality. However, it is difficult to adjust for differences in quality when comparing prices and profits on an international level. Current data does not allow for comparing actual competition across borders and current analysis is based solely on the level of government regulation.
0
10
20
30
40
50
60
70
80
90
100
Fin
land US
Sw
itze
rland
Ge
rman
y
Ne
the
rland
s
Sw
ede
n
Au
stra
lia
Fra
nce
Au
stri
a
UK
Den
ma
rk
Can
ada
Japa
n
Ire
lan
d
Bel
gium
Spa
in
NZ
Nor
way
Italy
Hu
ngar
y
Cz
ech
Rep
ublic
Por
tuga
l
Ko
rea
Gre
ece
Po
land
Mex
ico
Tu
rke
y
0
10
20
30
40
50
60
70
80
90
100
Aus
tral
ia
Net
her
land
s
Fin
lan
d
US
Ge
rman
y
Ca
nad
a
UK
Au
stri
a
Den
ma
rk
NZ
Sw
eden
Sw
itzer
lan
d
Ire
lan
d
Spa
in
Hun
gary
Bel
giu
m
Nor
way
Por
tuga
l
Me
xic
o
Italy
Fra
nce
Gre
ece
Jap
an
Ko
rea
Tur
key
Cze
ch R
epu
blic
Po
lan
d
21/41
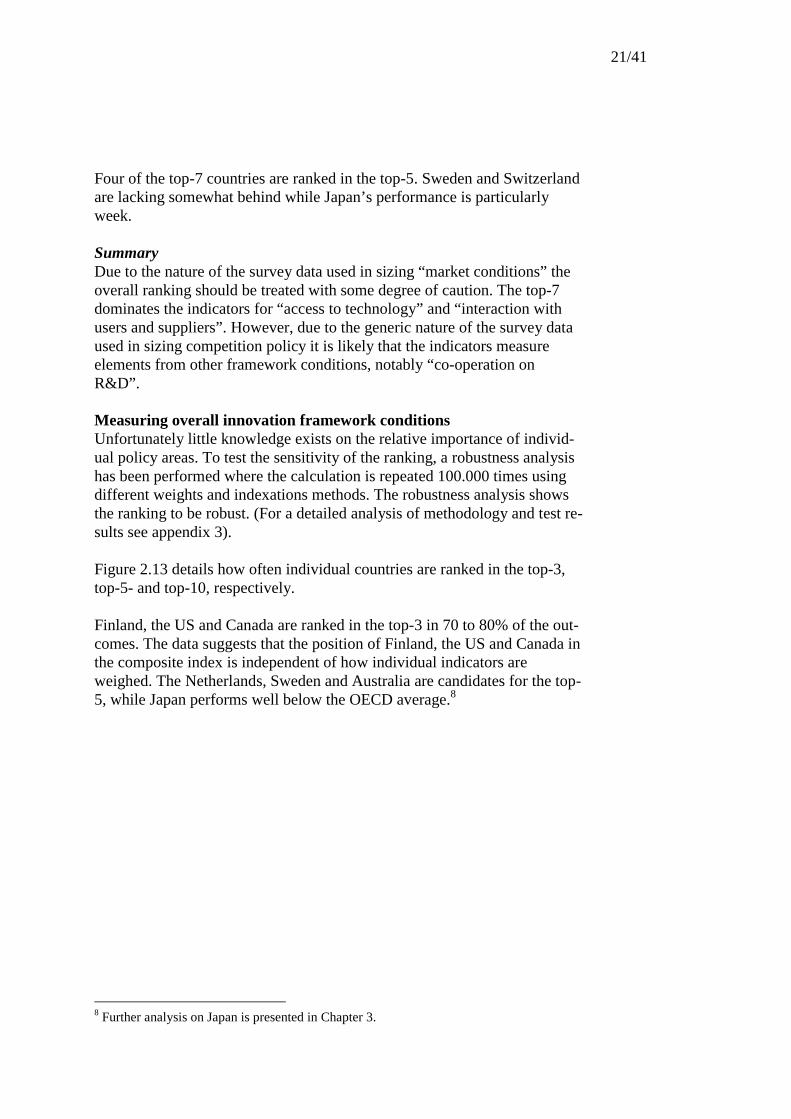
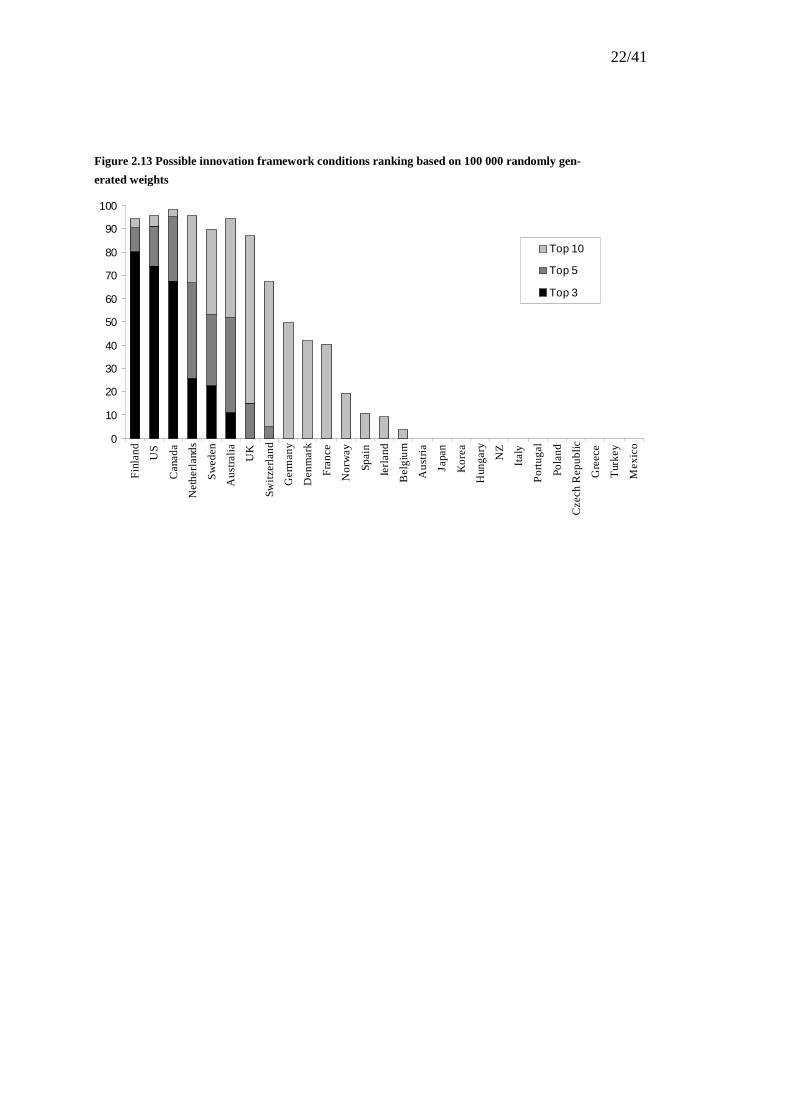
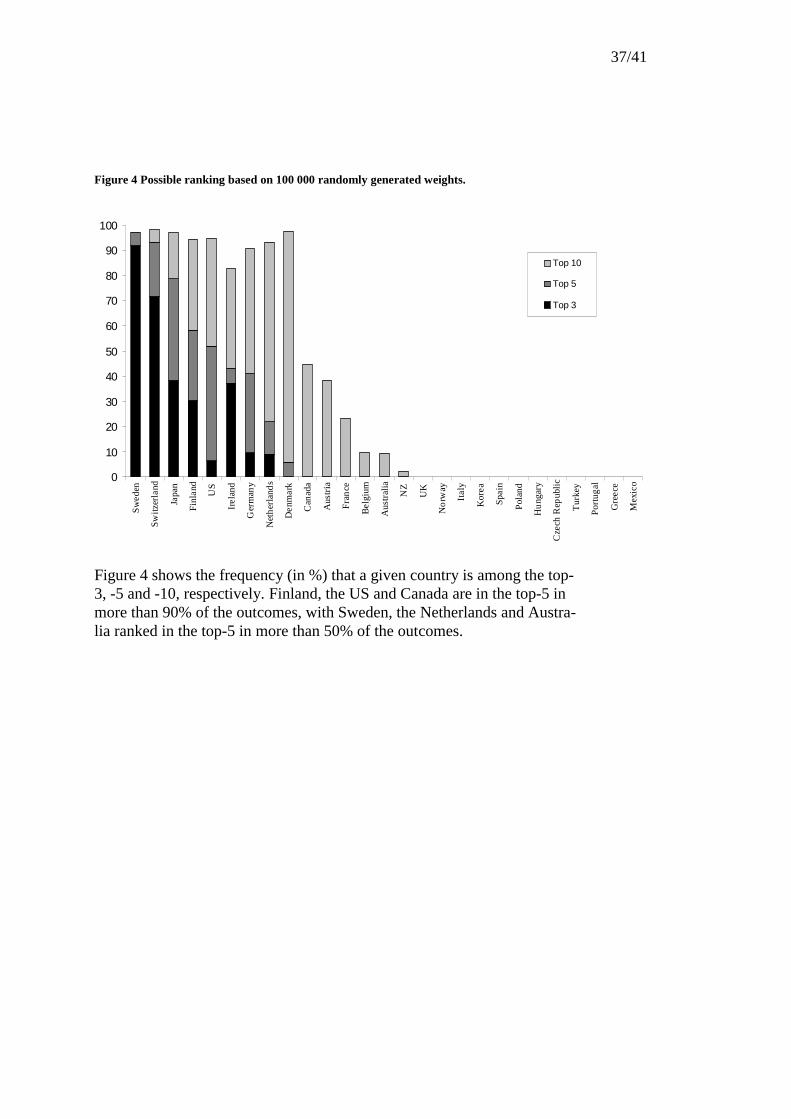
Four of the top-7 countries are ranked in the top-5. Sweden and Switzerland are lacking somewhat behind while Japan’s performance is particularly week. Summary Due to the nature of the survey data used in sizing “market conditions” the overall ranking should be treated with some degree of caution. The top-7 dominates the indicators for “access to technology” and “interaction with users and suppliers”. However, due to the generic nature of the survey data used in sizing competition policy it is likely that the indicators measure elements from other framework conditions, notably “co-operation on R&D”. Measuring overall innovation framework conditions Unfortunately little knowledge exists on the relative importance of individ-ual policy areas. To test the sensitivity of the ranking, a robustness analysis has been performed where the calculation is repeated 100.000 times using different weights and indexations methods. The robustness analysis shows the ranking to be robust. (For a detailed analysis of methodology and test re-sults see appendix 3). Figure 2.13 details how often individual countries are ranked in the top-3, top-5- and top-10, respectively. Finland, the US and Canada are ranked in the top-3 in 70 to 80% of the out-comes. The data suggests that the position of Finland, the US and Canada in the composite index is independent of how individual indicators are weighed. The Netherlands, Sweden and Australia are candidates for the top-5, while Japan performs well below the OECD average.8
8 Further analysis on Japan is presented in Chapter 3.
22/41
Figure 2.13 Possible innovation framework conditions ranking based on 100 000 randomly gen-
erated weights
0
10
20
30
40
50
60
70
80
90
100
Fin
land US
Can
ada
Net
herl
ands
Sw
eden
Aus
tral
ia
UK
Swit
zerl
and
Ger
man
y
Den
mar
k
Fra
nce
Nor
way
Spai
n
Ierl
and
Bel
gium
Aus
tria
Japa
n
Kor
ea
Hun
gary
NZ
Ital
y
Por
tuga
l
Pola
nd
Cze
ch R
epub
lic
Gre
ece
Tur
key
Mex
ico
Top 10
Top 5
Top 3
23/41
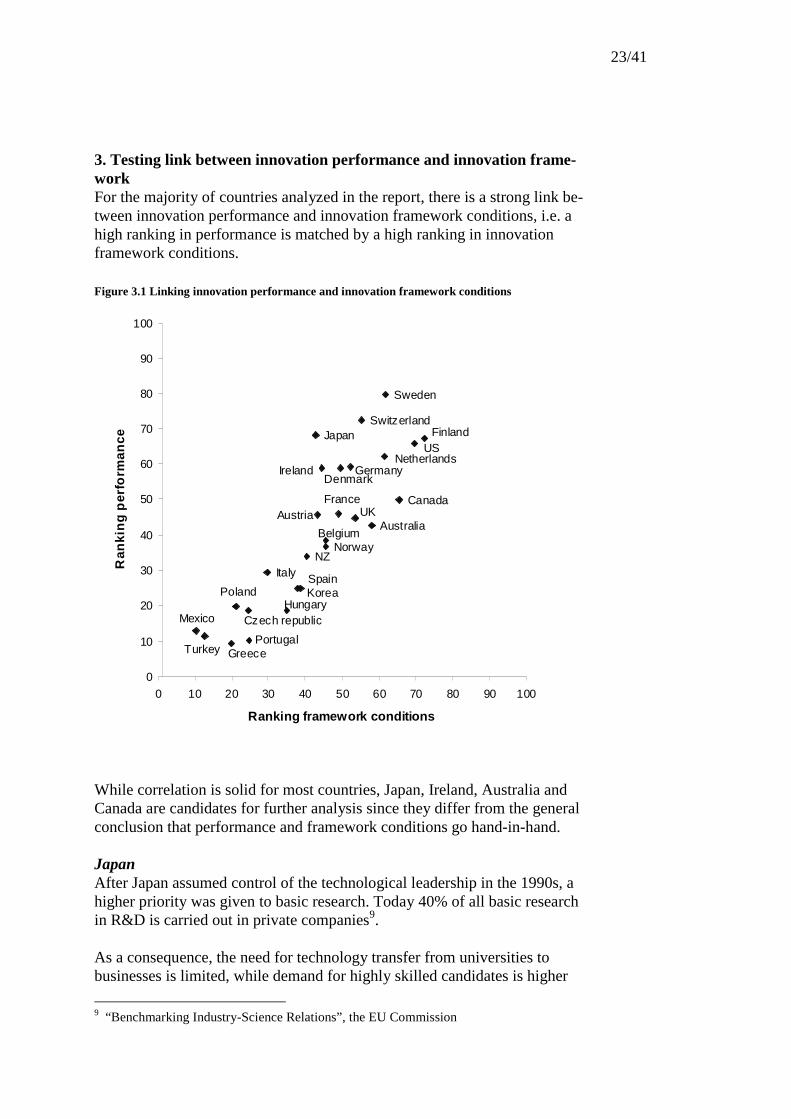
3. Testing link between innovation performance and innovation frame-work For the majority of countries analyzed in the report, there is a strong link be-tween innovation performance and innovation framework conditions, i.e. a high ranking in performance is matched by a high ranking in innovation framework conditions. Figure 3.1 Linking innovation performance and innovation framework conditions
While correlation is solid for most countries, Japan, Ireland, Australia and Canada are candidates for further analysis since they differ from the general conclusion that performance and framework conditions go hand-in-hand. Japan After Japan assumed control of the technological leadership in the 1990s, a higher priority was given to basic research. Today 40% of all basic research in R&D is carried out in private companies9. As a consequence, the need for technology transfer from universities to businesses is limited, while demand for highly skilled candidates is higher
9 “Benchmarking Industry-Science Relations”, the EU Commission
Sweden
SwitzerlandFinlandJapan
Netherlands
Canada
Australia
NZNorway
Italy
Hungary
PortugalTurkey
Belgium
Greece
Mexico
PolandSpainKorea
UKFrance
Austria
US
Ireland GermanyDenmark
Czech republic
0
10
20
30
40
50
60
70
80
90
100
0 10 20 30 40 50 60 70 80 90 100
Ranking framework conditions
Ran
kin
g p
erfo
rman
ce
24/41
compared to other industrialized countries. On the other hand co-operation between companies on innovation and technology development is signifi-cant. Overall Japan scores well on indicators related to the advancement of hu-man resources. Data shows that Japan is ranked first in “highly educated workers” and performs well on total investments in knowledge. Correspond-ingly Japan is ranked below the OECD average on indicators related to more “traditional” measures such as “quality of research” and “co-operation on R&D.” Ireland As discussed earlier the position of Ireland on innovation performance should be treated with some caution. An impressive “catch-up” process over the past decade has elevated Ire-land’s ranking on innovation performance, while the country’s ranking on innovation framework conditions has been close to average. Further analysis points to a number of factors that explain this apparent dis-crepancy. The high penetration of multinational companies has boosted Ire-land’s ranking in the areas of “import of technology from abroad” and “co-operation on technology and innovation”; while Ireland is ranked much lower on all other performance innovation indicators. Given these uncertain-ties the country has not been included in the group of top performers (“top-7”). Australia Australia is ranked 5th on the index for framework conditions and 15th in in-novation performance. A further analysis of Australia’s innovation policy shows that investments in framework conditions have yet to materialize in overall innovation performance. In early 2001, the Australian government launched “Backing Australia’s Ability”, a comprehensive 4-year innovation program designed to improve framework conditions in the areas of research capacity, commercialization of research, and innovation culture. It may well be the case that Australia’s overall performance ranking will correlate with the high ranking on frame-work conditions once the government initiative is fully implemented. Canada Ranked third on innovation framework conditions, Canada showing on in-novation performance is only slightly above average (10th). In 1994 the Ca-nadian government engaged in a thorough evaluation of the Canadian inno-vation system. The evaluation resulted in a number of initiatives, the pri-mary being a much stronger role for the federal government in promoting

25/41
strategic partnerships between individual states, higher education and pri-vate businesses. Much of the funding for the initiatives will be allocated over an extensive period (until 2010), which would explain the apparent “lag” in innovation performance vis-à-vis improved innovation framework conditions. Summary In an overall evaluation of the model presented above a number of general issues may serve to explain discrepancies in innovation performance and in-novation framework conditions:
1. A high innovation performance may be achieved with a more nar-rowly focused innovation policy thereby undermining the correlation between performance and framework conditions.
2. Framework conditions that are important to a country may be diffi-
cult to identify due to a lack of reliable data
3. Improved framework conditions may not have an immediate effect on a country’s innovation performance (i.e. “performance lag”)
However the solid correlation between performance and framework condi-tions leads to a straight-forward conclusion: Countries with lower-than-average performance can learn from specific policy areas in top-performing countries. However, a simple “cut-and-paste” approach, where policy areas are randomly copied and applied by low-performing countries could easily be detrimental to innovation performance. In conclusion the model presented above provides a “top-down” approach in identifying which policy areas could be strengthened in improving overall innovation performance. In the accompanying paper “Benchmarking Innovation Policy and Innova-tion Framework Conditions – Country Case Studies” the “top-down” ap-proach is combined with a “bottom-up” analysis of specific initiatives in se-lected best-practice countries, providing policy direction at an individual country level.
26/41
Appendix 1 – Data description A wide range of information sources have been drawn upon in assessing in-novation performance and innovation framework conditions. As well as a wide range of numerical indictors produced and collated primarily by the OECD, the report draws on surveys from other international bodies, includ-ing the WEF, the IMD and the EU Below is a complete list of the 29 indica-tors used for this publication. 1) Benchmarking of Innovation
a) Innovation
i) Number of patents in ‘triadic’ patent families in the US, Ja-pan and Europe. OECD, STI (2001).
ii) Number of companies having introduced new or significantly improved products or processes (1994-1996). Community In-novation Survey (CIS-II), the EU. Data from CIS-II, covering the period from 1998 to 2000, were not available for inclusion in the report.
iii) Business’ assessment of innovation activity. Indicator is based on three individual indicators from the WEF survey (2001):
(a) Extent to which new product designs are developed lo-cally
(b) The effect of innovation in generating revenue (c) Extent to which new products and processes are devel-
oped.
b) Innovation Diffusion
i) Import of foreign technology. OECD, STI (2001). Measures import of licenses, patents, know-how, research and technical consulting.
ii) Business assessment of application of new technology. WEF (2001).
iii) Number of companies with co-operation arrangements on innovation activities with other enterprises or institutions (1994-1996). CIS-II, the EU.
2) Benchmarking of Innovation Framework Conditions Innovation framework conditions are split into 4 main categories:
• Public knowledge creation • Co-operation on innovation between knowledge institutions and the
private sector • Innovation financing • Market conditions
27/41
a) Public Knowledge Creation
i) Size of Public Research
(1) Government R&D expenditures as a percentage of GDP. OECD, STI (2001).
(2) Government researchers per 10 000 labour force. OECD,
STI Scoreboard (2001). Researchers are defined as profes-sionals engaged in the conception and creation of new know-ledge, products, processes, methods and systems.
ii) Quality of public research
(1) Scientific and technical articles per million population. OECD, STI (2001).
(2) Business’ assessment of the quality of research. WEF
(2001).
iii) Relevance of public research
(1) Number of scientific and technical articles cited in pat-ents issued in the United States. Based on data from the US.
(2) Number of scientific and technical articles in 19 industry-
relevant disciplines per million populations. OECD, STI (2001).
(3) Scientists and engineers employment as a share of the la-
bour force. OECD, STI (2001).
(4) Business’ assessment of the relevance of research. WEF (2001). Indicator measures assessment of availability of sci-entist and engineers in natural sciences.
b) Co-operation on innovation between knowledge institutions and the
private sector
i) Co-operation on R & D
(1) Share of firms with co-operation agreements with gov-ernment or higher education (1994-1996). CIS-II survey, the EU.
28/41
(2) Business’ assessment of collaboration with universities in R&D activities. WEF (2001). Measures extent of co-operation with public research institutions on R&D.
(3) Business funding of public research as a share of GDP.
OECD, STI (2001).
ii) Commercialization of research
(1) Incubators per million populations. Cordis database for in-cubators (2002)
(2) Business assessment of knowledge transfer between uni-
versities and companies. IMD (2001).
iii) Highly Educated Workers
(1) Business researchers per 10 000 labour force. OECD, STI (2001).
(2) Share of “knowledge-intensive workers”. OECD, DSTI
(2002) “Measures of Skills from Labour Force Survey – An Assessment”.
c) Innovation Financing
i) Subsidies and tax incentives
(1) Public financing of private R&D. OECD, STI (2001). (2) Business assessment of public support to private R&D.
WEF (2001). (3) Rate of tax subsidies for 1 US dollar of R&D, SMEs.
OECD, STI (2001). The amount of tax subsidies to R&D is calculated as 1 minus the B-index, where A = the net present discounted value of depreciation allowances, tax credits and special allowances on R&D assets, and τ = the statutory cor-porate income tax (CITR). In a country with full write-off of current R&D expenditure and no R&D tax incentive scheme, A = τ, and consequently B = 1. The more favourable a coun-try’s tax treatment of R&D, the lower its B-index.
(4) Rate of tax subsidies for 1 US dollar of R&D, large com-
panies. OECD, STI (2001).
29/41
(5) Business’ assessment of government tax credits for firms conducting R&D. WEF (2001).
ii) Venture capital
(1) Venture capital investment in start-up as share of GDP.
Data National Venture Association (the US), Canadian VCA, European VCA and the Asian VC Journal. Annual average investment 1998-2001.
(2) Venture capital investment in expansion as share of GDP.
As above.
d) Market conditions
(1) Business assessment of development and application of technology being supported by the legal environment. IMD (2001).
(2) Business assessment of intellectual property protection.
WEF (2001).
(3) Business assessment of availability of specialized research and training services. WEF (2001).
ii) Competitive environment
(1) Index for government regulation. Danish Competition Au-thority.
(2) Business’ assessment of competition legislation in pre-
venting unfair competition. IMD (2001).
iii) Quality of customer and suppliers
(1) Business’ assessment of whether buyers are knowledge-able and demanding/buying innovative products. WEF (2001).
(2) Business’ assessment of technological capability and in-
ternational competitiveness of local suppliers. WEF (2001).
(3) Business assessment of the extent to which government
procurement of advanced technology products is based on price alone or encourages innovation. WEF (2001).

30/41
Appendix 2 – Missing values Like most statistical series, composite indicators are plagued by the prob-lems of missing values. In many cases, data are only available for a limited number of countries10 or only for certain data components. The following methods have been applied throughout the report in dealing with the problem of missing values: 1) Calculating missing values using auxiliary variable (Z) 2) Missing values is determined by the average of other values used in cal-culating a sub index To illustrate the methodology, missing values for 12 countries on the indica-tor “Share of companies introducing new or technologically improved prod-ucts” are calculated. Assume that a country is missing a value of variable X. To determine the value the auxiliary variable (z) is used. The size of the missing value of variable X is determined by 3 intervals on the variable z. The following in-tervals are used:
j is the country with missing values for indicator X. n is the total number of countries and σ the standard deviation of the auxiliary variable z. I1, I2 and I3 are the 3 intervals. To calculate the missing value for country j it must be determined in which of the 3 intervals that country j corresponds to Z. If country j is high on Z we assume the same to be true for variable x. It fol-lows that if country j is low on variable Z, then the country will also be low on variable X.
10 As an example information from Eurostat only cover member countries of the European Union
31/41
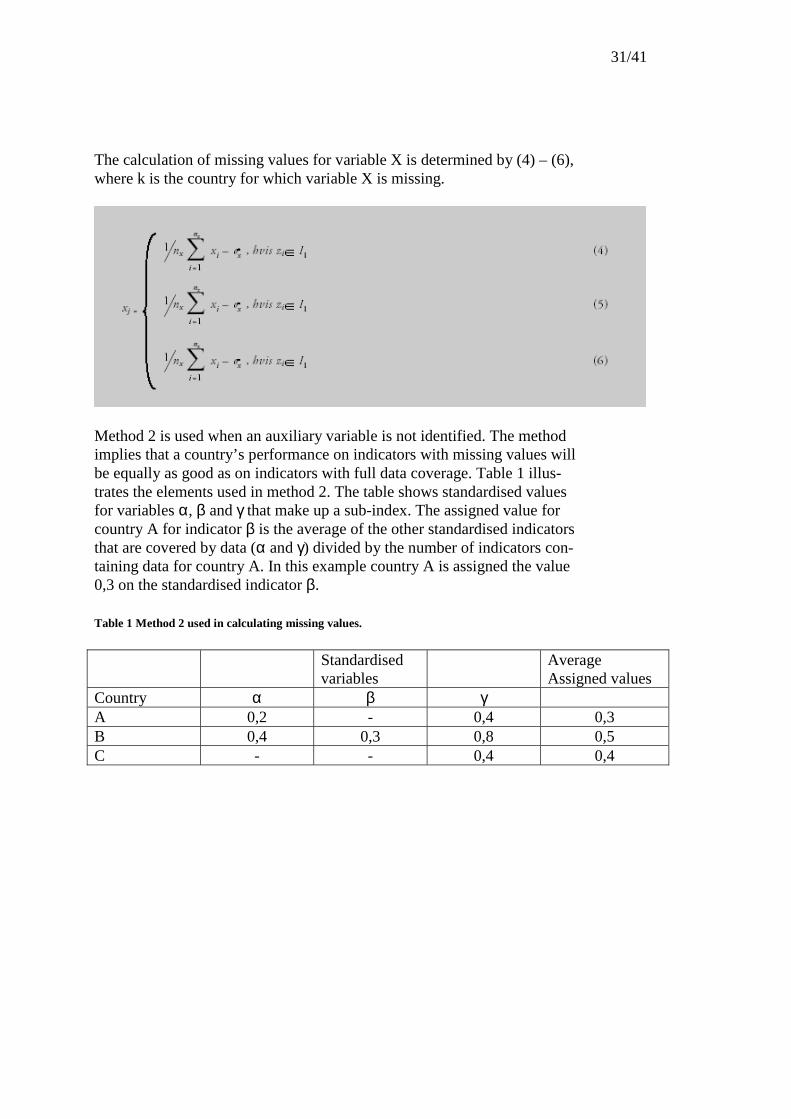
The calculation of missing values for variable X is determined by (4) – (6), where k is the country for which variable X is missing.
Method 2 is used when an auxiliary variable is not identified. The method implies that a country’s performance on indicators with missing values will be equally as good as on indicators with full data coverage. Table 1 illus-trates the elements used in method 2. The table shows standardised values for variables α, β and γ that make up a sub-index. The assigned value for country A for indicator β is the average of the other standardised indicators that are covered by data (α and γ) divided by the number of indicators con-taining data for country A. In this example country A is assigned the value 0,3 on the standardised indicator β. Table 1 Method 2 used in calculating missing values.
Standardised variables
Average Assigned values
Country α β γ A 0,2 - 0,4 0,3 B 0,4 0,3 0,8 0,5 C - - 0,4 0,4

32/41
Appendix 3 - Use of composite Indices and robustness analysis The appendix describes how composite indices for innovation performance and innovation framework conditions are calculated and explains how the robustness analysis is designed and performed. Composite Indices Composite indices are increasingly used in comparing and ranking countries in different areas such as industrial competitiveness, globalization and inno-vation. The proliferation of composite indices raises questions regarding their accuracy and reliability. Hence when constructing composite indices a number of issues have to be dealt with:
• Standardizing variables to allow comparisons
• Weighting variables and groups of variables and
• Conducting robustness analysis of aggregated variables Standardizing variables Variables are often expressed in various units and have to be normalized to render them comparable. Several techniques can be used to standardize in-dividual indicators. Commonly used methods include the following:
• Standard deviation from the mean, which imposes a standard normal distribution (i.e. a mean of 0 and a standard deviation of 1).
• Distance from the mean, where the mean value is given 100 and countries receive scores depending on their distance from the mean.
• Distance from the group leader, which assigns 100 to the leading country and other countries are ranked as percentage points away from the leader
• Distance from best and worst performer, where positioning is in re-lation to the global maximum and minimum and the index takes val-ues between 0 (laggard) and 100 (leader)
In the simple ranking of innovation performance and innovation framework conditions the “minimum-maximum method” has been selected.

33/41
Weighting variables In ranking countries all variables are given common weights. When constructing a composite index (CI) for country i, using indicators X1…. Xn, X is the given indicator and n the number of indicators used for calculating the composite index. To add up indicators in the CI, data must be standardized by applying one of the four methods presented above. The standardised variables are now shown as x1…..xn. The composite index for country i, variable j is calculated as the sum of the standardised values xji, weighted with the coefficient wj (A1).
For wj weights in CI equals 1
Testing for robustness A variety of difficulties can arise with regards to selecting, weighting, stan-dardizing and aggregating variables into a composite indicator. Outcomes and country rankings may depend largely on the approach selected. For this reason, sensitivity test should be conducted to analyze the impact of includ-ing and excluding various variables, changing weights, using different stan-dardization techniques on the results of the composite indicator. To test the sensitivity of composite indices a robustness analysis of weights and standardizations methods has been performed. First a number of combinations of weights and standardisation methods are constructed. The result of the simulation is expressed in actual index values (CI1, CI2… CIn) CIi = f (Xin) Simulation [CI1, CI2, CI3 ……CIn] Ranking The results of the analysis are shown in Figure 2 among others, which shows the possible spread for each individual country, and in Figure 4,
34/41
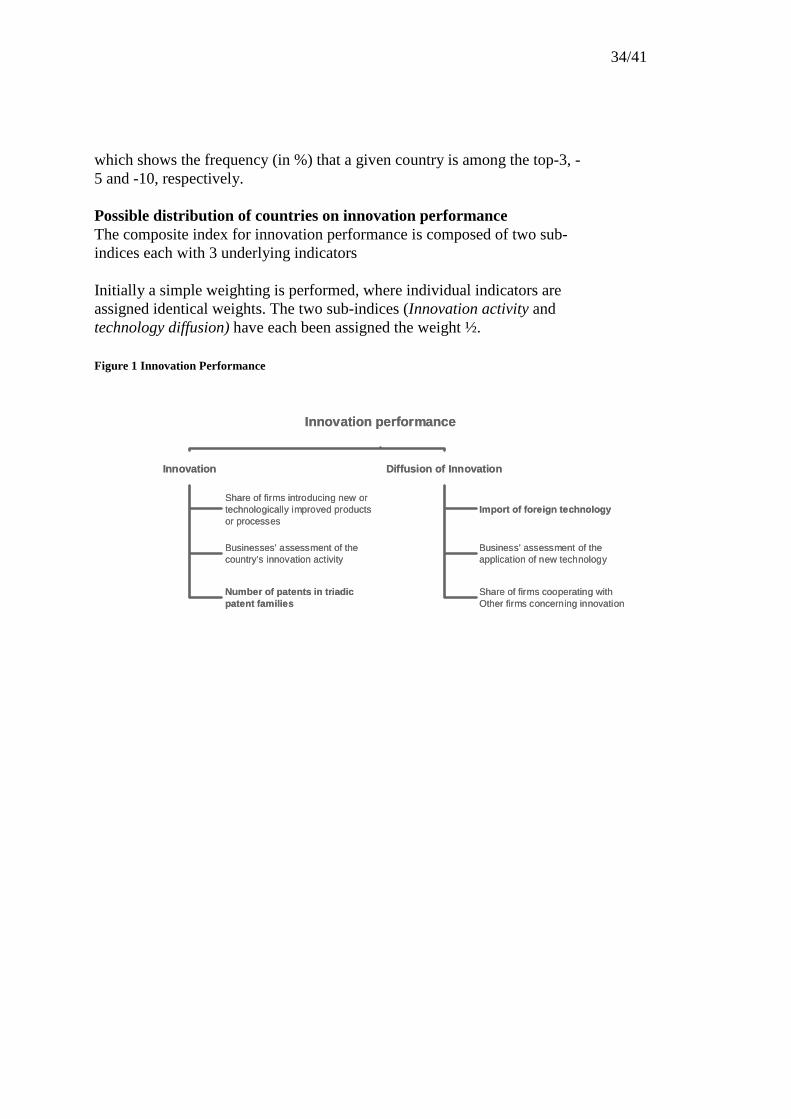
which shows the frequency (in %) that a given country is among the top-3, -5 and -10, respectively. Possible distribution of countries on innovation performance The composite index for innovation performance is composed of two sub-indices each with 3 underlying indicators Initially a simple weighting is performed, where individual indicators are assigned identical weights. The two sub-indices (Innovation activity and technology diffusion) have each been assigned the weight ½. Figure 1 Innovation Performance
Innovation performance
Innovation Diffusion of Innovation
Share of firms introducing new ortechnologically improved productsor processes
Businesses’ assessment of the country’s innovation activity
Number of patents in triadicpatent families
Import of foreign technology
Business’ assessment of the application of new technology
Share of firms cooperating withOther firms concerning innovation
35/41
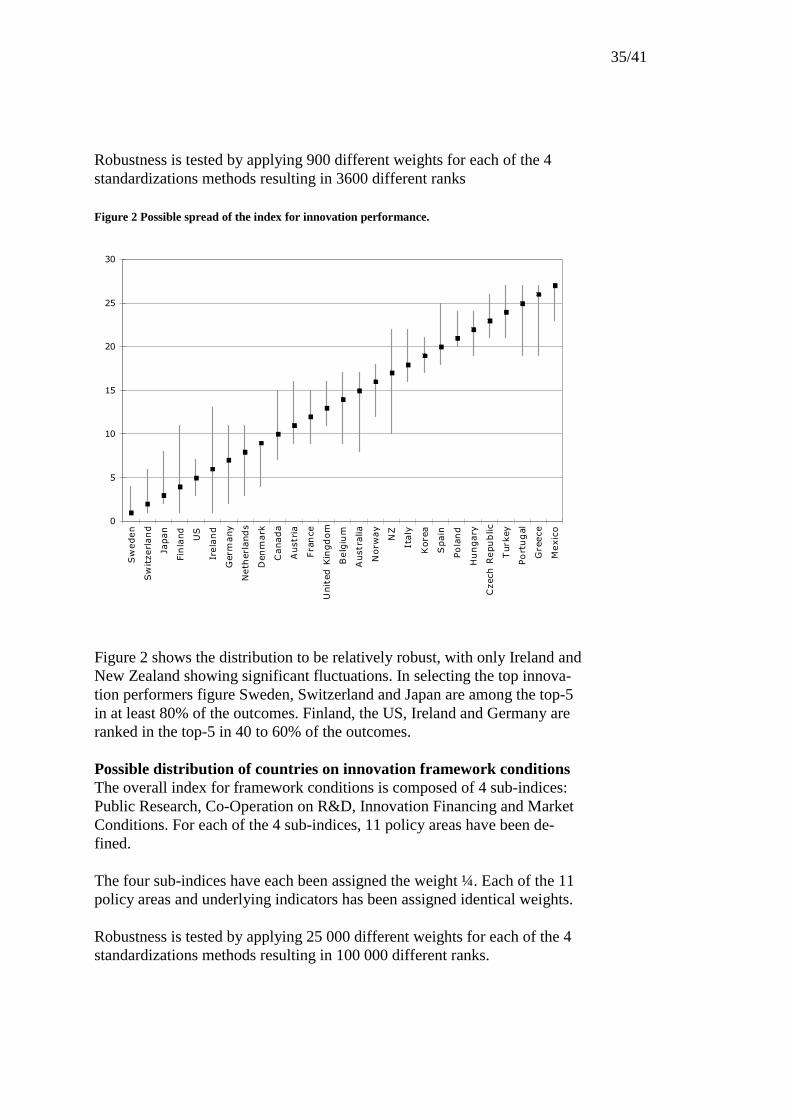
Robustness is tested by applying 900 different weights for each of the 4 standardizations methods resulting in 3600 different ranks Figure 2 Possible spread of the index for innovation performance.
Figure 2 shows the distribution to be relatively robust, with only Ireland and New Zealand showing significant fluctuations. In selecting the top innova-tion performers figure Sweden, Switzerland and Japan are among the top-5 in at least 80% of the outcomes. Finland, the US, Ireland and Germany are ranked in the top-5 in 40 to 60% of the outcomes. Possible distribution of countries on innovation framework conditions The overall index for framework conditions is composed of 4 sub-indices: Public Research, Co-Operation on R&D, Innovation Financing and Market Conditions. For each of the 4 sub-indices, 11 policy areas have been de-fined. The four sub-indices have each been assigned the weight ¼. Each of the 11 policy areas and underlying indicators has been assigned identical weights. Robustness is tested by applying 25 000 different weights for each of the 4 standardizations methods resulting in 100 000 different ranks.
0
5
10
15
20
25
30
Sw
eden
Sw
itze
rlan
d
Japan
Fin
land
US
Irela
nd
Ger
many
Neth
erla
nd
s
Den
mark
Canada
Aust
ria
Fra
nce
Unit
ed K
ingd
om
Belg
ium
Aust
ralia
Norw
ay
NZ
Italy
Kore
a
Spain
Pola
nd
Hu
ngary
Cze
ch R
epu
blic
Turk
ey
Po
rtu
gal
Gre
ece
Mexic
o
36/41
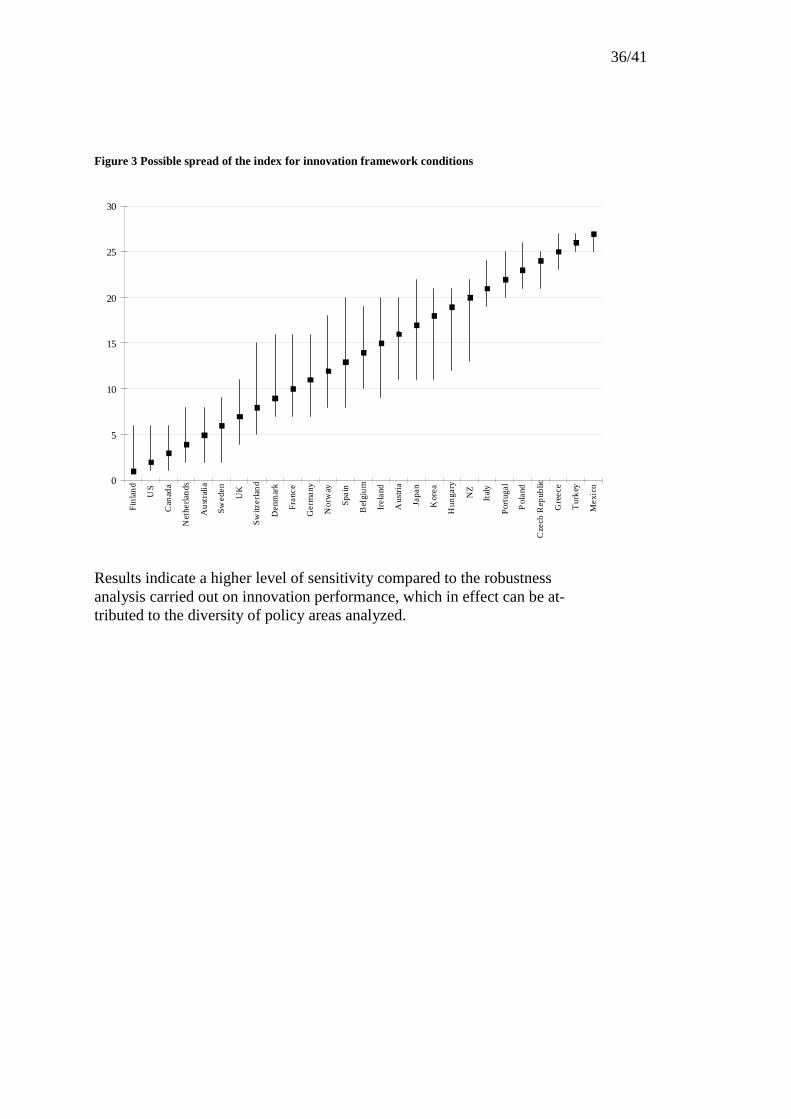
Figure 3 Possible spread of the index for innovation framework conditions
Results indicate a higher level of sensitivity compared to the robustness analysis carried out on innovation performance, which in effect can be at-tributed to the diversity of policy areas analyzed.
0
5
10
15
20
25
30
Fin
lan
d
US
Can
ada
Net
herl
ands
Au
stra
lia
Sw
eden
UK
Sw
itzer
lan
d
Den
mar
k
Fra
nce
Ger
man
y
Nor
way
Spa
in
Bel
giu
m
Irel
and
Aus
tria
Japa
n
Kor
ea
Hun
gary
NZ
Ital
y
Por
tuga
l
Pol
and
Cze
ch R
epub
lic
Gre
ece
Tur
key
Mex
ico
37/41
Figure 4 Possible ranking based on 100 000 randomly generated weights.
Figure 4 shows the frequency (in %) that a given country is among the top-3, -5 and -10, respectively. Finland, the US and Canada are in the top-5 in more than 90% of the outcomes, with Sweden, the Netherlands and Austra-lia ranked in the top-5 in more than 50% of the outcomes.
0
10
20
30
40
50
60
70
80
90
100
Sw
eden
Sw
itze
rlan
d
Japa
n
Fin
land
US
Irel
and
Ger
man
y
Net
her
land
s
Den
mar
k
Can
ada
Aus
tria
Fra
nce
Bel
gium
Aus
tral
ia
NZ
UK
No
rway
Ital
y
Kor
ea
Spa
in
Pol
and
Hu
ngar
y
Cze
ch R
epub
lic
Tur
key
Por
tug
al
Gre
ece
Mex
ico
Top 10
Top 5
Top 3
38/41
Appendix 4 – Use of survey data in benchmarking innovation Because there is no single definite set of indicators for any given purpose, the selection of data to incorporate in a composite can be quite subjective. Due to a scarcity of full sets of comparable quantitative data, qualitative da-ta from surveys are often used in composite indicators. Survey data can serve as an indicator of the validity of “hard” data and may also be used for deriving missing values in quantitative data (see Appendix 2). The EU Commission Every 4 years the EU commission publishes the Community Innovation Survey (CIS) based on interviews with companies across all member coun-tries. The purpose of the CIS is to provide analysis of the level of innovation activity within the EU. The latest survey, CIS3, covers the period from 1998 to 2000 but results we-re not available for this report. Instead three questions from CIS2 (1997-1999) were used. World Economic Forum - WEF WEF’s Global Competitiveness Report sizes growth potential based on two indices:
• A growth index • A micro-economic competitor index
A total of 174 indicators are applied in constructing the two indices, of which 80% are indicators from WEF’s annual survey. The survey covers 80 countries and respondents are chosen by WEF’s national partners, i.e. aca-demic institutions. 14 questions from the WEF survey are used in the benchmarking report International Institute of Management Development - IMD Every year the IMD publishes the World Competitiveness yearbook that highlights the competitive situation across 49 countries. A total of 314 indi-cators are used, of which 40% originate from IMD’s annual survey, which measures management’s assessment of various growth factors. Respondents are CEO’s with MBA from IMD. 3 questions from IMD sur-vey are used throughout the report
39/41
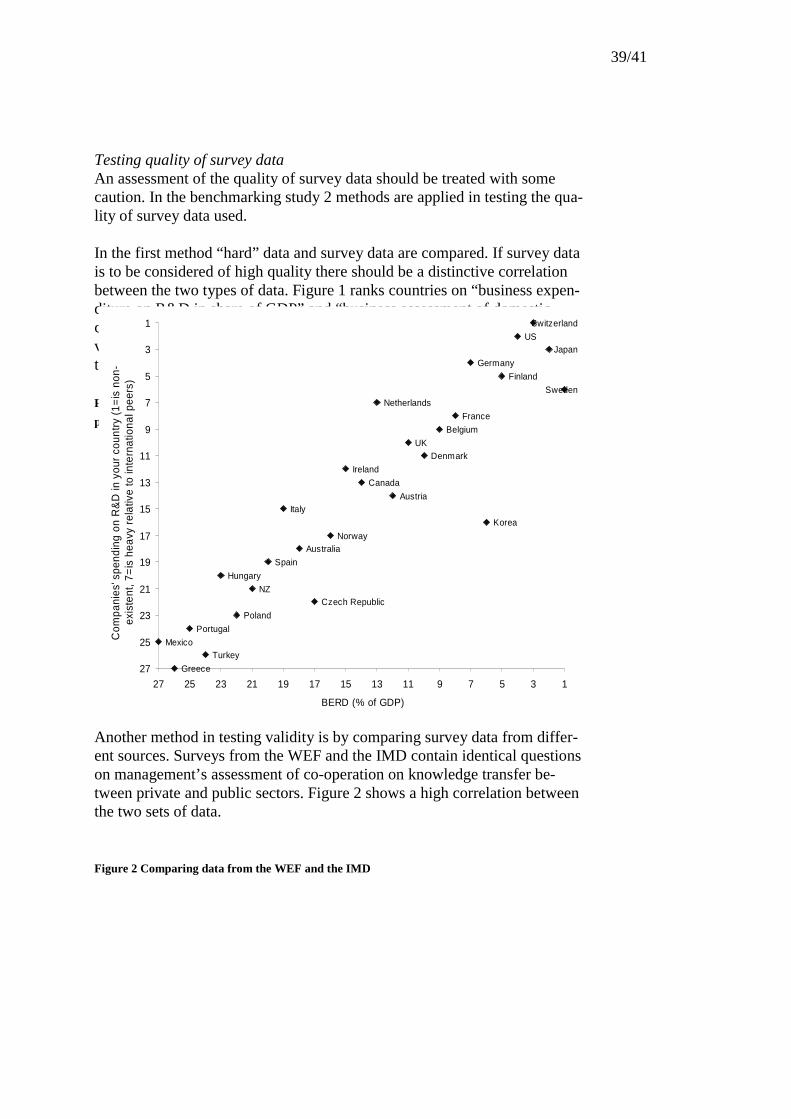
Testing quality of survey data An assessment of the quality of survey data should be treated with some caution. In the benchmarking study 2 methods are applied in testing the qua-lity of survey data used. In the first method “hard” data and survey data are compared. If survey data is to be considered of high quality there should be a distinctive correlation between the two types of data. Figure 1 ranks countries on “business expen-diture on R&D in share of GDP” and “business assessment of domestic companies R&D compared to other countries”. The figure shows a high le-vel of correlation between the two types of data and supports the validity of the WEF survey data. Figure 1 Companies’ spending on R&D correlated with business’ assessment of domestic com-
panies’ R&D.
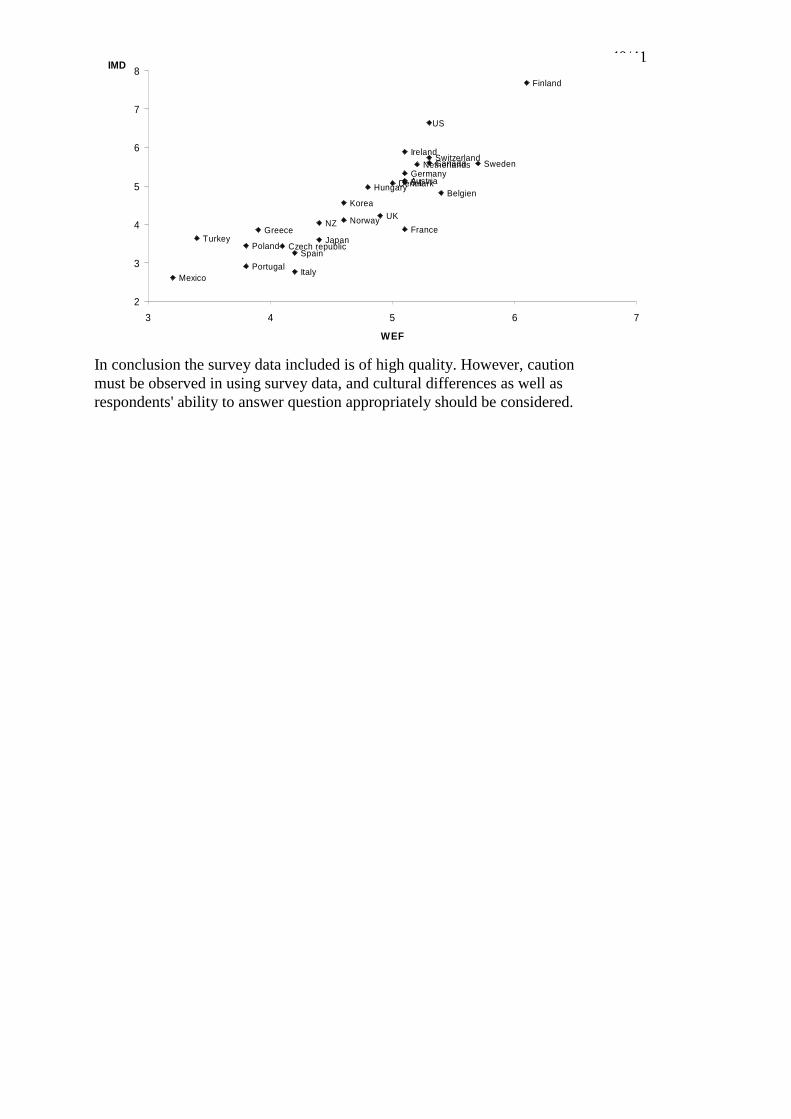
Another method in testing validity is by comparing survey data from differ-ent sources. Surveys from the WEF and the IMD contain identical questions on management’s assessment of co-operation on knowledge transfer be-tween private and public sectors. Figure 2 shows a high correlation between the two sets of data. Figure 2 Comparing data from the WEF and the IMD
Japan
Finland
Korea
Canada
NZ
Switzerland
US
Germany
SwedenNetherlands
France
Belgium
UKDenmark
Ireland
AustriaItaly
NorwayAustralia
Spain
Hungary
Czech Republic
Poland
Portugal
MexicoTurkey
Greece
1
3
5
7
9
11
13
15
17
19
21
23
25
27
13579111315171921232527
BERD (% of GDP)
Com
pani
es' s
pend
ing
on R
&D
in y
our
coun
try
(1=
is n
on-
exis
tent
, 7=
is h
eavy
rel
ativ
e to
inte
rnat
iona
l pee
rs)
40/41
In conclusion the survey data included is of high quality. However, caution must be observed in using survey data, and cultural differences as well as respondents' ability to answer question appropriately should be considered.
5,1Belgien
US
Sweden
Finland
Ireland
UK
FranceNorway
Korea
Hungary
NZ
Japan
ItalyPortugal
Mexico
TurkeyPoland
Greece
Czech republicSpain
SwitzerlandNetherlandsCanada
GermanyAustriaDenmark
2
3
4
5
6
7
8
3 4 5 6 7
WEF
IMD
41/41
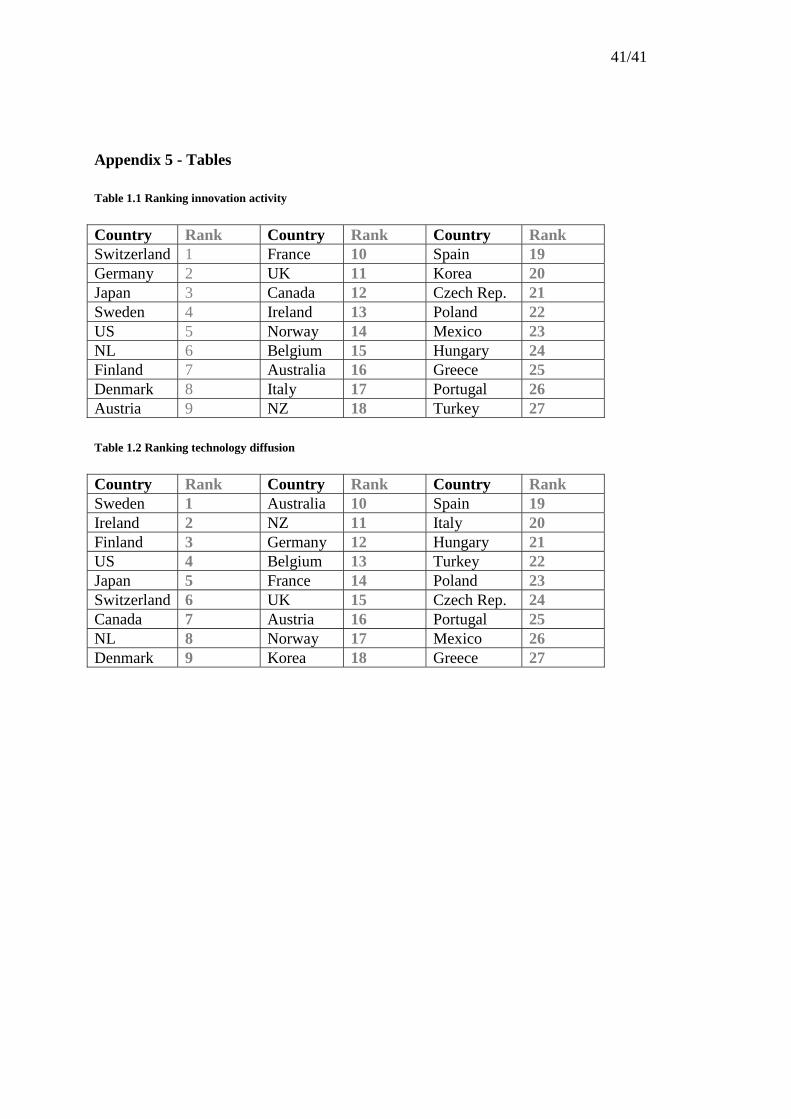
Appendix 5 - Tables Table 1.1 Ranking innovation activity
Country Rank Country Rank Country Rank Switzerland 1 France 10 Spain 19 Germany 2 UK 11 Korea 20 Japan 3 Canada 12 Czech Rep. 21 Sweden 4 Ireland 13 Poland 22 US 5 Norway 14 Mexico 23 NL 6 Belgium 15 Hungary 24 Finland 7 Australia 16 Greece 25 Denmark 8 Italy 17 Portugal 26 Austria 9 NZ 18 Turkey 27 Table 1.2 Ranking technology diffusion
Country Rank Country Rank Country Rank Sweden 1 Australia 10 Spain 19 Ireland 2 NZ 11 Italy 20 Finland 3 Germany 12 Hungary 21 US 4 Belgium 13 Turkey 22 Japan 5 France 14 Poland 23 Switzerland 6 UK 15 Czech Rep. 24 Canada 7 Austria 16 Portugal 25 NL 8 Norway 17 Mexico 26 Denmark 9 Korea 18 Greece 27