disclaimer benchmarkin… · ¾ in cement mill section ball mill in closed circuit is operating...
TRANSCRIPT


Confederation of Indian IndustryCII-Sohrabji Godrej Green Business Centre
Disclaimer
© 2014, Confederation of Indian Industry
All rights reserved.
While every care has been taken in compiling this manual CII- Godrej GBC does not accept any claim for compensation, if any entry is wrong, abbreviated, omitted or inserted incorrectly either as to the wording space or position in the Manual. The Manual is intended to be a store of information that will serve as a ready to use reference for the plant personnel involved in production, operations and energy conservation. The source bank for this manual is based on questionnaire submitted by the participating cement plants, data from CII’s energy award questionnaire, case studies shared by suppliers in various CII’s conferences and CII’s experience from various detailed and preliminary energy audits. This manual is an attempt to bring out all the best practices adopted and best energy levels achieved by the cement Industry. While utmost care has been taken to bring out the best operating data, how ever there might have been sections and plants operating better than the results indicated, that may have missed our notice.
No part of this publication may be reproduced, stored in retrieval system, or transmitted, in any form or by any means electronic, mechanical, photocopying, recording or otherwise, without the prior written permission from CII- Sohrabji Godrej Green Business Centre, Hyderabad.
Published by Confederation of Indian IndustryCII - Sohrabji Godrej Green Business CentreSurvey # 64, Kothaguda Post,R R District, Hyderabad - 500 084, India.

Energy Benchmarking for Cement Industry
MESSAGE
CII-Sohrabji Godrej Green Business Centre, as part of its ‘World Class Energy Efficiency initiative’, has been releasing various publications/manuals/ case study booklets, pocket guides, etc. on a regular basis to equip Indian industry with the latest trends & technologies and in the process enable them gain the much needed competitive edge.
The strategy adopted by CII is to learn from peers on their new & innova-tive strategies and after extensive ground work compile the learnings into a publication, which can be shared with all the stakeholders.
As part of this initiative, we have compiled this important publication- ‘Energy Benchmarking for cement industry’.
This publication includes section- wise best specific energy consump-tion levels achieved by various Indian cement plants and the strategies adopted thereof in bringing down the consumption levels.
We are sure, this manual will provide immense opportunities in unearth-ing new energy saving opportunities and also enable in exploring new growth opportunities.
We warmly invite you to please share your feedback to us at [email protected]. We look forward to your continued support in further greening In-dian Cement sector.
(G. Jayaraman) Chairman, Green Cementech 2014, CII- Godrej GBC &Executive President, Birla Corporation Ltd.


Energy Benchmarking for Cement Industry
MESSAGE
Indian cement industry is playing a very important role in the overall de-velopment of the Nation. The Sector is also in the forefront in adopting the latest and emerging technologies, which is not only bringing down the energy consumption levels but is also making good business sense. This, indeed, is a step in the right direction and augurs well for both economy and ecology.
I am pleased to record that Cement Manufacturers’ Association (CMA) established in 1961, being the apex body of large cement manufacturers in India, has been acting as an effective bridge between Indian Cement Industry and the Government.
Over the years, Cement Manufacturers Association (CMA) association with CII has grown steadily and has been adding great value to the stake-holders. CMA in partnership with CII has been organising conferences on varied subjects and bringing out various technical publications/man-uals.
A major step towards this direction is publishing –‘Energy benchmark-ing for cement industry’. This Manual includes some of the best perfor-mance energy consumption data for various sections of cement plant and best practices adopted. We are sure, this Manual will enable the cement plants in achieving excellence in energy management and provide strate-gies for ensuring long-term competitiveness.
As we march together, we are sure, our partnership will facilitate in con-solidating India as one of the global green leaders in Cement Sector.
(N.A. Viswanathan)Secretary GeneralCement Manufacturers’ Association


Energy Benchmarking for Cement Industry
TABLE OF CONTENTS
Chapter No Chapter Name Page
NoAcknowledgementExecutive Summary 1
1 Introduction 31.0 Indian Cement Industry - Present scenario 31.1 Major players in Indian Cement Industry 41.2 Energy efficiency in Indian Cement Industry 41.3 Factors favoring energy efficiency in Indian Cement Industry 51.4 CII- Sohrabji Godrej Green Business Centre Initiatives 62 Benchmarking in cement industry 7
2.0 Objective of benchmarking 72.1 Approach adopted in benchmarking study 73 Benchmarking in various sections 9
3.1 Single stage crushers 93.2 Two stage crushers 113.3 Raw mill- VRM 123.4 Raw mill - Ball mill/HPRG grinding 143.5 Coal Mill 173.6 Comparison of Five stage preheaters 183.7 Comparison of Six stage preheaters 223.8 Comparison of SEC and production 263.9 Comparison of SEC (up to clinkerisation) 31
3.10 Cement Mill - Ball Mill (close circuit) 363.11 Cement Mill - Ball Mill with pregrinder/HPRG 393.12 Cement Mill-VRM 413.13 Packing Plant 433.14 Utilities 443.15 Captive Power Plant 46
4 Extract & Outcome of the study 495 Energy Indicators in Cement Industry 716 Best Practices in Cement Industry 757 Monitoring Parameters for Achieving Energy Efficiency 87


Energy Benchmarking for Cement Industry
ACKNOWLEDGMENTCII-Sohrabji Godrej Green Business Centre would like to express its sincere and special gratitude to the entire Indian cement industry for their continuous support in this initiative, providing the required data for completing this study, which makes this manual more useful to all stake holders.
CII-Godrej GBC acknowledges with thanks the co-operation and the support extended by all the suppliers for sharing their technology advancements and case studies implemented in the cement industry.
We would like to place our vote of thanks for the entire national and international cement technical experts and associations for sparing their valuable time in offering inputs and suggestions in bringing out this manual.
The interactions and deliberations with the industry, suppliers and sector experts and the whole exercise was thoroughly a rewarding experience for CII.


1Energy Benchmarking for Cement Industry
EXECUTIVE SUMMARY
The Indian cement industry is one of the most efficient in the world and continuously adopting the latest technologies for energy conservation. Energy efficiency in the Indian cement industry is already high but still there is a scope for improvement in this area, providing the continued use of energy efficient technologies in new plants and old plants.
In an objective to further increase the transfer of knowledge among the industry CII –Godrej GBC has prepared the benchmarking manual for the Indian cement Industry. The main intention of the benchmarking study is to continue the knowledge sharing and allow all cement industries to compare their performance with the peers in India and identify their performance aspects. CII –Godrej GBC has prepared a detailed questionnaire involving all sectional parameters starting from crusher to packing plant. The questionnaire has been sent to more than 140 cement factories to fill-in the data. The majority of plants from all over India have participated in this benchmarking study and different parameters are recorded in various sections from the data provided by the plants.
The Collected data is classified in different sections and each individual section is compared with respect to section wise specific energy consumption and other parameters.The best operating values and the outcomes of the study is as follows
¾ In raw material grinding vertical roller mil is consuming 13.3 kW/MT raw material compared to ball mill consumption 16.5 kW/MT raw material.
¾ In Pyro section with five stage preheater the best operating sEC up to clinkerisation is 16.28 kW/MT clinker where as in six stage preheaters the value is close to 23.7 kW/MT clinker.
¾ In cement mill section ball mill in closed circuit is operating with 27.16 kW/MT cement where as ball mill with pregrinder is operating at 23.75 kW/MT cement and vrm is operating with 21 kW/MT cement
¾ In over all electric sEC the best plants are standing near 67.2 kW/MT cement and in thermal sEC 6 stage preheaters are operating at 690 kcal/kg clinker whereas 5 stage preheaters are operating near 709 kcal/kg clinker.
The other important outcomes of this study are 300 best practices implemented in national and international cement plants and more than 50 performance indicators in cement industry, all recorded at one place for the benefit of the industry. Monitoring techniques with the parameter to be monitored and frequency of monitoring is also provided in each section to further aid the stake holders in achieving energy efficiency.
Finally the benchmarking reveals the best values at which the industry is operating each section and the best practices and technologies to be adopted to become as leader in energy efficiency.


3Energy Benchmarking for Cement Industry
CHAPTER-1INTRODUCTION
1.0 Indian Cement Industry Present ScenarioIndia’s cement industry plays a vital role in the growth and development of the nation. The cement industry has been expanding with increasing infrastructure activities and demand from residential buildings over the past many years. India’s cement sector has achieved a 5.6 1.per cent growth in 2012–13. The Indian Cement Industry has 146 integrated cement plants and 55 grinding plants accounting to a total capacity of 365.52 million tons. The Indian cement sector is expected to witness positive growth in coming years, with demand set to increase at compound annual growth rate (CAGR) of more than 8 per cent during 2013–14 to 2015–16, according to report titled, ‘Indian Cement Industry Outlook 2016’. In addition, cement production in India is expected to touch 407 million tonnes (MT) by 2020.
Actual and Expected Production of Indian cement Industry (million tones)
Source: Department of Industrial Policy and Promotion, Working group for 12th Five Year Plan, Aranca Research Notes: E - Estimate, CAGR - Compound Annual Growth Rate
1 Indian Brand Equity Foundation (IBEF) updated report on March 2014 http://www.ibef.org/download/Cement-March-2014.pdf
2 Global Cement Directory 2013

4 Confederation of Indian IndustryCII-Sohrabji Godrej Green Business Centre
1.1 Major Players in Indian Cement Industry
Although the Indian cement industry has some international cement giants Holcim and Lafarge, the Indian cement industry is broadly home developed. Ultratech Cement the country’s largest firm in terms of cement capacity, holds around 22% of the domestic market, with ACC Limited and Ambuja Cements Limited having 15% and 13% shares respectively. The others Indian key players (in order of market share) include Jaiprakash Associates (10%), The India Cements Ltd (7%), shree Cements (6%), Century Textiles and Industries (5%), Madras Cements (5%), Lafarge (5%), Birla Cement (4%) and Binani Cement (4%)3.
1.2 Energy Efficiency in Indian Cement Industry
The Indian cement industry is one of the most efficient in the world and is continuously adopting the latest technologies for energy conservation. Energy efficiency in the Indian cement industry is already high but still there is a scope for improvement in this area, provided there is a continued use of energy efficient technologies in new plants and old plants. The Indian cement industry should deploy existing state-of-the-art technologies in new cement plants and retrofit existing plants with energy efficient equipment when commercially viable. The present graph shows the current and future specific energy consumption trends in the cement industry.
Comparison of Global and Indian Electrical sEC4
A number of plants installed before the 1990s have been modernized to a limited extent by retrofitting with new technologies. However, they need to aim at bringing specific energy consumption levels closer to the best achieved levels in the Indian industry by further modernization and adoption of best available processes and technologies.
3 Global Cement Directory 2013 PRo Publications International Ltd., Epsom, UK, November 2012
4 Technology road map -Low carbon technology for the Indian cement industry

5Energy Benchmarking for Cement Industry
Comparison of Global and Indian Thermal sEC Source: Low carbon technology for the Indian cement industry
1.3 Factors favoring Energy Efficiency in Indian cement Industry
Knowledge Transfer: Cement Industry is known for its technology sharing and openness in the industry. This is benefiting the Industry in replicating the best practices in their organizations without any hesitations.
Technology Upgradation: The Indian cement industry has been growing at a rapid pace during the late 20th and early 21st centuries; about 50% of Indian cement industry’s capacity today is less than ten years old. While building these new cement plants, manufacturers have installed the latest, energy efficient technologies by design. As a result, recent cement plants achieve high levels of energy efficiency performance.
Increase in Energy cost: The other important aspect electricity tariffs and fuel price for industry in India being among the highest in the world, implementing such energy efficiency measures at the design stage provides significant advantage to the cement manufacturers by lowering energy and production costs. Increasing energy costs also prompted owners of older manufacturing facilities to adopt gradually the latest energy efficient technologies and improve their energy performance.
Government Initiatives: Another factor which is enabling energy efficiency movement in India is The Ministry of Power’s Bureau of Energy Efficiency (BEE)-Perform achieve and trade. The key goal of the scheme is to mandate reduction in specific energy consumption for the most energy-intensive industries, and incentivize them to achieve better energy efficiency improvements that are superior to their specified specific energy consumption improvement targets. The star rating program for the equipment is also bringing revolutionary changes in the energy consumption levels.

6 Confederation of Indian IndustryCII-Sohrabji Godrej Green Business Centre
Technology Suppliers: The most efficient global technologies have been adopted in the major Indian cement plants due to the continuous efforts in bringing the innovation and advancement in the technology. There is good interest shown by international suppliers to enter into Indian market to supply the energy efficient technologies.
Associations: Industry Associations like CII, CMA and key organisations like NCBM are continuously working for the benefit of cement industry. These associations are closely working with government in promoting the growth of the industry.
1.4 CII- Sohrabji Godrej Green Business Centre Initiatives for Cement Industry
In the efforts to promote sustainable development of cement sector and demonstrate that green makes good business sense, CII - sohrabji Godrej Green Business Centre (CII –Godrej GBC) with the support of all the stakeholders is playing a catalytic role in promoting World Class Energy Efficiency initiative in cement industry.
some of the initiatives from CII-Godrej GBC in Indian cement Industry include the following:
1. Development of world class energy efficient cement plants: CII-Godrej GBC have been working with all the major cement plants in the energy efficiency and sustainable front and significant benefits have been achieved and reported by these units
2. CII-Godrej GBC is also organizing national and international missions to facilitate the industry to achieve excellence in energy and environment.
3. CII –Godrej GBC is organizing an annual international conference Green Cementech to provide the latest information and technology update for the benefit of cement industry.
4. Development of a technology road map to make the Indian cement industry pursue a low carbon growth path by 2050, Three units are identified for the feasibility of implementation of these technologies and few more expressed their interest in participating in this initiative.
5. Facilitating cement plants in pursuing the PAT (Perform Achieve and Trade program of BEE) targets in a cost effective manner.
6. CII in association with Cement Manufacturers Association (CMA) is working on an initiative to facilitate development of enabling policies and framework by state and Central Pollution Control Boards, to facilitate use of urban & industrial waste as Alternate Fuel & Raw Materials (AFR) in Indian cement industry. The main objective of the project is to accelerate AFR usage in Indian Cement industry.

7Energy Benchmarking for Cement Industry
CHAPTER-2BENCHMARKING IN CEMENT INDUSTRY
2.0 Objective of Benchmarking:
With the openness and knowledge sharing across the plants Indian cement industry has emerged as a leader in energy efficiency. With an objective to further increase the transfer of knowledge among the industry CII–Godrej GBC has prepared the benchmark for the Indian cement Industry. The main intention of the benchmarking study is to continue the knowledge sharing and allow all cement industries to compare their performance with the peers in India, identifying the aspects of their performance as good, bad and indifferent. This will add momentum in the Indian cement industry to perform more in energy efficient front.
Benchmarking comprises the analysis and reporting of key energy performance Indicators to foster continual energy performance improvements in industry through comparison with internal and external norms and standards. An energy benchmarking analysis generates two important perspectives; it provides an overview of how well a particular industry sector or sub-sector is doing in managing energy performance. second, it enables company participants to perform a benchmarking exercise to compare the performance of their own plant(s) with the overall industry indicators.
2.1 Approach adopted in benchmarking study
CII –Godrej GBC has prepared a detailed questionnaire involving all sectional parameters starting from crusher to packing plant. The questionnaire has been sent to more than 140 cement factories to fill-in the data. The majority of plants from all over India have participated in this benchmarking study and different parameters are recorded in various sections from the data provided by the plants.
This study describes work with the Indian cement industry to provide a plant-level indicator of energy efficiency and equipment efficiency for plants that produce a variety of products, including ordinary Portland cement (OPC), Portland pozzolana cement (PPC), Portland slag cement (PsC) and other speciality cement products.
Benchmarking provides a more detailed comparison of a particular aspects of operations i.e., energy efficiency, equipment productivity and environmental performance.
The following specific indicators are compared in the benchmarking study. ¾ specific thermal energy ¾ specific electrical energy in each section ¾ Equipment efficiency ¾ Equipment productivity
8 Confederation of Indian IndustryCII-Sohrabji Godrej Green Business Centre
¾ Equipment reliability ¾ Auxiliary power consumption in captive power plant
The cement industries who wish to have an annual or periodic comparison of key performance indicators across the range of cement industry will find this benchmarking study extremely helpful. The idea of benchmarking study is not only to identify the opportunities to improve energy efficiency but also to understand the underlying factors that impede the implementation of the energy conservation opportunities.
To address these challenges, CII-Godrej GBC has started a comprehensive benchmarking study. This benchmarking exercise will answer all typical questions which revolve in the minds of plant team:
¾ What is my plant’s energy performance? ¾ How can I compare to others in the domestic industry? ¾ What are the reasons for the differences? ¾ What opportunities for improvement are available? ¾ What are the parameters to be monitored? ¾ What is the potential economic advantage that might be realized?
Finally this report describes the basic concept of benchmarking and the statistical approach employed, more recent experience gained in developing performance-based energy indicators for the Indian cement industry.

9Energy Benchmarking for Cement Industry
CH
APT
ER-3
BEN
CH
MA
RK
ING
IN V
AR
IOU
S SE
CTI
ON
S
3.1
SIN
GlE
STA
GE
CRU
SHER
S
Para
met
erun
itPl
ant 1
Plan
t 2Pl
ant 3
Plan
t 4Pl
ant 5
Plan
t 6Pl
ant 7
Plan
t 8Pl
ant 9
Plan
t 10
No.
of s
tage
s-
sing
lesi
ngle
sing
lesi
ngle
sing
lesi
ngle
sing
lesi
ngle
sing
lesi
ngle
Mat
eria
l ha
rdne
ss-
soft
med
ium
hard
hard
med
ium
/ha
rdha
rdha
rdm
ediu
m/
hard
med
ium
hard
Prod
uct s
ize
%+5
0 m
m
: 47.
9<1
50 m
m80
<55
% o
n 50
MM
100%
pa
ssin
g 50
m
m<5
-10
080
Ope
ratin
g ou
tput
TPH
500
430
909
643
1245
900
1550
1800
1296
187
Mat
eria
l m
oist
ure
%8
10-1
21
< 1
0.5-
1.0
4-6
< 4
0.5-
1.0
2-3
<1
spec
ific
pow
er co
n-su
mpt
ion
kW /
MT
Lim
esto
ne0.
700.
750.
840.
921.
021.
201.
321.
331.
441.
83
Cru
sher
MD
0.50
0.38
0.45
0.44
0.53
0.67
0.46
0.49
0.36
0.59
Bag
filte
r Fa
n-
--
0.1
--
--
--

10 Confederation of Indian IndustryCII-Sohrabji Godrej Green Business Centre
Para
met
erun
itPl
ant 1
Plan
t 2Pl
ant 3
Plan
t 4Pl
ant 5
Plan
t 6Pl
ant 7
Plan
t 8Pl
ant 9
Plan
t 10
0.49
0.53
0.85
0.47
1.08
0.12
--
--
--
Com
pres
sor
--
0-
0.05
--
--
-0.
07To
tal
(Cru
sher
al
one)
--
0.38
-0.
921.
021.
20-
1.33
1.44
1.83
Pre
Blen
d-in
g-
-0.
35-
--
--
--
-
Ove
rall
-0.
700.
730.
840.
921.
021.
201.
321.
331.
441.
83

11Energy Benchmarking for Cement Industry
3.2
Tw
O S
TAG
E C
RUSH
ERS
Para
met
erun
itPl
ant 1
Plan
t 2Pl
ant 3
Plan
t 4Pl
ant 5
Plan
t 6N
o. o
f sta
ges
-tw
otw
otw
otw
otw
otw
oM
ater
ial h
ardn
ess
-so
ftm
ediu
mha
rdso
ftha
rdm
ediu
m
Prod
uct s
ize
%15
%6.
5 %
reta
ined
on
75
mm
sc
reen
<90m
mN
il<2
5mm
nil
Ope
ratin
g ou
tput
TPH
950
750
716
475
295
182
Mat
eria
l moi
stur
e%
1311
to 1
31
< 2.
01
1
spec
ific p
ower
cons
umpt
ion
kW /
MT
Lim
e-st
one
0.65
0.91
0.94
1.23
1.59
2.35
Cru
sher
MD
-0.
450.
650.
600.
871.
201.
70Ba
g fil
ter F
an -
--
-0.
047
-0.
200
Com
pres
sor
--
--
0.03
7-
0.15
0To
tal (
Cru
sher
alo
ne)
--
0.26
-1.
196
--
Pre
Blen
ding
-
0.20
-0.
034
--
Ove
rall
-0.
650.
910.
941.
231.
592.
35

12 Confederation of Indian IndustryCII-Sohrabji Godrej Green Business Centre
3.3
RAw
MIl
l-V
RM
Para
met
erU
nit
Plan
t 1Pl
ant 2
Plan
t 3Pl
ant 4
Plan
t 5Pl
ant 6
Plan
t 7Pl
ant 8
Plan
t 9Pl
ant 1
0M
ater
ial
hard
ness
-m
ediu
mha
rdso
ftha
rdha
rdm
ediu
mm
ediu
mm
ediu
m /
hard
Prod
uct s
ize
%20
16-1
711
-12
1811
-12
13.5
021
20-2
218
18.5
-19.
5O
pera
ting
outp
utTP
H32
022
5-23
029
040
033
019
040
327
6.5
292
285
Feed
Mat
e-ria
l moi
stur
e%
1-3
213
22
11
2-3
0.5-
1.0
Mill
DP
mm
wc
740
900-
930
750
600
480
680
750
480-
530
500
-550
400
Mill
mod
el
L38/
44LM
30
.3+3
LM 4
6.4
ATO
X
42.5
Atox
42.
5LM
32.4
0U
M 5
0.4
ATO
X-4
5
ATO
X
45, 4
.5Ф
an
d 3
Nos
Ro
llers
AM
- R–
50
(TD
: 5m
RD
: 3m
-3
Rolle
rs)
Mill
fan
flow
km3 /h
r64
734
0-35
048
080
076
539
574
5.9
600
620
to 6
4075
7C
yclo
ne
pres
sure
dr
opm
mw
c10
015
0-17
050
900
5050
120
8090
-110
60-7
0
False
air
in
the
circ
uit
%20
-25
2025
2028
1715
15-1
815
-18
sep
load
ing
Kg/
m3
0.49
0.50
0.54
0.55
0.45
0.38
sEC

13Energy Benchmarking for Cement Industry
Para
met
erU
nit
Plan
t 1Pl
ant 2
Plan
t 3Pl
ant 4
Plan
t 5Pl
ant 6
Plan
t 7Pl
ant 8
Plan
t 9Pl
ant 1
0M
ill d
rive
6.
03.
5-4.
06.
15.
56.
36.
59.
29.
59.
111
.8M
ill fa
n
6.4
6.2-
6.5
6.05
7.7
7.7
7.0
5.6
6.0
7.2
7.3
Aux
0.
93.
0-3.
51.
671.
81.
932.
51.
11.
661.
711.
92O
vera
ll
13.3
13-1
413
.815
.015
.916
.016
.017
.118
.021
.2

14 Confederation of Indian IndustryCII-Sohrabji Godrej Green Business Centre
3.4
RAw
MIl
l - B
All
MIl
l/H
PRG
GR
IND
ING
Para
met
erun
itPl
ant 1
Plan
t 2Pl
ant 3
Plan
t 4Pl
ant 5
Plan
t 6Pl
ant 7
Plan
t 8Pl
ant 9
Mat
eria
l ha
rdne
ss-
hard
11-1
5so
ftm
ediu
mm
ediu
m11
-15
13.4
hard
11-1
5
Prod
uct s
ize
%10
.017
-18
13.0
– 1
5.0
18.0
20-2
231
-33
12.0
40.0
22-2
4O
pera
ting
outp
utTP
H16
029
0-30
018
0-18
524
012
924
5-25
570
8016
5-17
5
Feed
M
ater
ial
moi
stur
e%
21-
5<
1.5
3-5
11-
51
6.8
1-5
Velo
city
in
side
mill
m/s
ec1.
1 –
1.2
-8.
6-
1.5
1.9
1.8
1.5
2.5-
3.1
Mill
spec
Dia
x
leng
th3.
00 x
10.
00N
o ba
ll m
ill4.
20 x
14
.07
KPP
85
0/17
-15
00-1
730
x150
0-s-
C
TUM
2.4
+
8.75
x
50, I
D 4
.6
met
res,
OD
5.
06 m
5.0
x 9.
75 2
.40
(dry
ing
cham
ber)
R1&
2:
3.4x
12 &
R3
: 3.
4x7.
6
3.8
x 9.
5 FK
CP
(Clo
sed
Cir-
cuit)
4.6x
11.2
5
0.3
( dry
ing
cham
ber)
sep
fan
flow
m3 /h
r-
5850
00-
4500
00-
1250
00-
-17
4000
Cyc
lone
pr
essu
re
drop
mm
wc
120
7065
-75
90-1
1035
--
350
sep
inle
t to
Cyc
lone
ou
tlet:3
00

15Energy Benchmarking for Cement Industry
Para
met
erun
itPl
ant 1
Plan
t 2Pl
ant 3
Plan
t 4Pl
ant 5
Plan
t 6Pl
ant 7
Plan
t 8Pl
ant 9
Grin
ding
m
edia
pie
ce
wt
gm-
-45
0-
310
-13
2580
0-
Grin
ding
m
edia
sur-
face
are
am
2 / MT
--
20.3
1-
--
20.6
26.2
7-
sep
load
ing
Kg/
m3
--
1.04
NA
3.5-
4N
A1.
12-
2.2
Circ
ulat
ing
load
-19
8%5.
251.
926
32.
5
212
MIC
-1
05.8
1 90
MIC
-123
.91
45M
IC-
164.
04.
250
% se
p ve
nt
volu
me
-
--
--
--
1090
72-
sEC
Mill
driv
e
6.2
-12
.7-
18.5
13.5
17.9
18.9
19.3
RP
7.5
8.5
-10
-3.
8-
-2.
1M
ill s
ep fa
n
-5.
51.
4-
1.5
0.7
-2.
84.
1M
ill v
ent
fan
0.
2-
1.8
-0.
6-
--
-

16 Confederation of Indian IndustryCII-Sohrabji Godrej Green Business Centre
Para
met
erun
itPl
ant 1
Plan
t 2Pl
ant 3
Plan
t 4Pl
ant 5
Plan
t 6Pl
ant 7
Plan
t 8Pl
ant 9
sept
ven
t fa
n
3.1
--
--
1.9
--
-
sep
fan
for
RP
--
4-
--
--
Ove
rall
16
.516
.8 -
17.
517
.918
.020
.620
.9 -
21.2
23.1
25.1
25.5
- 2
6.3

17Energy Benchmarking for Cement Industry
3.5
CO
Al
MIl
l
Para
met
erU
nit
Plan
t-1
Plan
t-2
Plan
t-3
Plan
t-4
Plan
t-5
Plan
t-6
Plan
t-7
Plan
t-8
Mill
Typ
e
VRM
VRM
VRM
VRM
VRM
VRM
VRM
VRM
Coa
l Com
-po
sitio
n%
Impo
rted
C
oal 1
00 %
Impo
rted
C
oal 3
0 %
In
dian
Coa
l 70
%
Impo
rted
C
oal 1
00 %
Petc
oke
40
%, I
ndia
n C
oal 3
0 %
, Im
port
ed
coal
30
%
Impo
rted
+
indi
anPe
tcok
e 10
0 %
Pet c
oke
Petc
oke
100
%
Mill
Out
put
TPH
33.7
530
3381
3525
2514
sEC
kW/M
TM
ill D
rive
14
.58.
810
.714
.513
.313
.112
.415
.1M
ill fa
n
5.9
8.8
12.7
11.9
10.9
11.5
19.2
18.4
Aux
3.
59.
33.
82.
95.
95.
76.
07.
4To
tal s
EC
23.9
26.9
27.2
29.3
30.2
30.3
37.6
40.9

18 Confederation of Indian IndustryCII-Sohrabji Godrej Green Business Centre
3.6
CO
MPA
RIS
ON
OF
FIV
E ST
AG
E PR
EHEA
TER
S
Para
met
erU
nit
Plan
t 1Pl
ant 2
Plan
t 3Pl
ant-
4Pl
ant 5
Plan
t 6Pl
ant 7
Plan
t 8Pl
ant 9
Plan
t 10
KIL
N o
ut-
put r
ated
TP
D45
0040
0040
0032
0038
5038
0012
0028
0031
5028
00
Kiln
out
put
oper
atin
gTP
D46
7046
0048
0035
0044
0043
0013
0028
0032
5026
50
PH ty
peIL
C /
sLC
IL
CIL
CIL
CIL
CIL
CIL
CIL
CsL
CIL
CIL
CN
o of
PH
st
rings
si
ngle
sing
lesi
ngle
sing
lesi
ngle
sing
lesi
ngle
sing
lesi
ngle
sing
le
Cal
cine
r ex
it O
2 /
CO
%1.
8 /0
.01
2.5
1.5/
0.00
0.9
O2
1 O
21.
99/ 0
.84
4.5/
NIL
2.1
PH e
xit
tem
pD
eg C
260
335
305
333
338
315
318
320
310
320-
330
PH e
xit fl
owN
m3 /k
g cl
inke
r1.
391.
461.
531.
581.
501.
431.
781.
611.
651.
48-1
.51
PH e
xit
pres
sure
mm
wc
380
-500
520
420
-540
520
-76
0-7
6064
0
Pres
sure
at
PH fa
n in
let
mm
wc
395
-585
580
430
-560
590
570
780
-820
650
False
air
acro
ss P
H%
4-
52
613
139
410
19Energy Benchmarking for Cement Industry
Para
met
erU
nit
Plan
t 1Pl
ant 2
Plan
t 3Pl
ant-
4Pl
ant 5
Plan
t 6Pl
ant 7
Plan
t 8Pl
ant 9
Plan
t 10
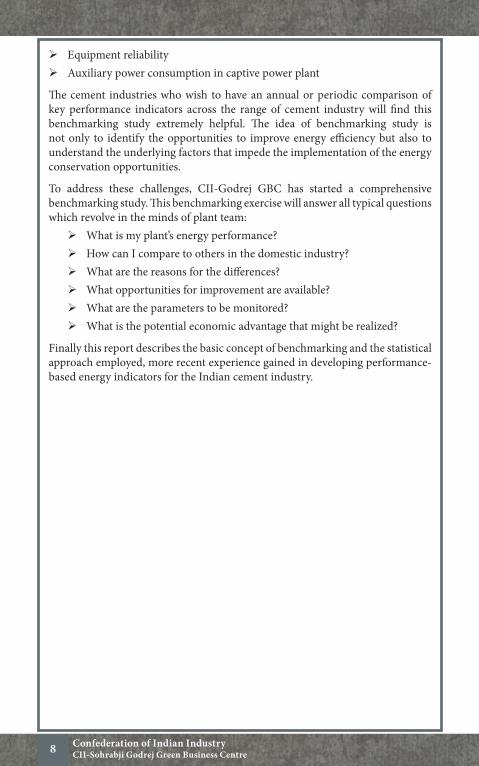
spee
d co
ntro
l for
PH
fan
V
FDG
RRG
RR/
sPRs
VFD
VFD
GRR
GRR
GRR
sPRs
GRR
spee
d co
n-tr
ol fo
r Kiln
Ba
g ho
use
fan
M
V V
FDV
FDG
RR/
sPRs
VFD
VFD
GRR
VFD
VFD
DC
Driv
eD
ampe
r co
ntro
l
Kiln
Bag
ho
use
fan
flow
Nm
3 /kg
clin
ker
2.2
2.0
1.2
2.0
2.5
2.4
3.3
1.8
2.4
2.2
Kiln
Bag
ho
use
DP
mm
wc
100
90-1
2010
0-11
011
590
-120
125
120
125-
135
2840
-55
Kiln
Bag
ho
use
inle
t pr
essu
rem
mw
c30
-60
5050
-60
5560
30-3
5-1
02-
Kiln
Bag
ho
use
type
RA
BHRA
BHRA
BHRA
BHRA
BHRA
BHRA
BHRA
BHEs
PEs
P
Kiln
size
Dia
xl
engt
h4.
35 x
67
3.95
x 6
54.
15 x
64
3.95
x 6
23.
95 x
62
3.95
x 6
13.
2 x
483.
8 x
60.7
53.
75 x
57
3.8
x 56
Volu
met
ric
load
ing
TPD
/ m3
5.6
5.8
7.0
5.0
5.7
7.0
4.3
4.5
6.5
5.2
Ther
mal
lo
adin
gM
kcal
/ hr
/m
24.
24.
04.
93.
35.
85.
02.
62.
24.
63.
1

20 Confederation of Indian IndustryCII-Sohrabji Godrej Green Business Centre
Para
met
erU
nit
Plan
t 1Pl
ant 2
Plan
t 3Pl
ant-
4Pl
ant 5
Plan
t 6Pl
ant 7
Plan
t 8Pl
ant 9
Plan
t 10
Phas
e de
n-sit
y –
PC
firin
g
kg co
al /
kg a
ir2.
42.
04.
22.
73.
15.
52.
53.
31.
42.
9
Phas
e de
n-sit
y –
Kiln
fir
ing
kg co
al /
kg a
ir1.
21.
01.
12.
62.
31.
21.
41.
92.
01.
4
Type
of
cool
er
3rd
gene
ratio
n (s
F C
ross
Ba
r Coo
ler
4 *5
)
3rd
gen-
erat
ion
sF C
ROss
BA
R C
OO
LER
/ WIT
H
sTAT
IC
/ 3RD
G
ENER
A-TI
ON
CIs
/CFG
G
RATE
C
OO
LER
3rd
gen-
erat
ion
(3x5
)sF-
Cro
ss B
ar
Coo
ler
Gra
te
Coo
ler
Gra
te-
With
CIs
-M
FR
FLsC
ross
Ba
r C
oole
r (1
0x48
)
REC
IP-
ROC
AT-
ING
G
RATE
(K
HD
)
57.4
5 m
2
Coo
ling
air
flow
Nm
3 /kg
clin
ker
1.7
1.7
1.7
2.2
1.9
1.8
2.2
2.1
1.9
2.2
Clin
ker
tem
pD
eg C
125
165
140
120
173
180
170
120-
150
120-
130
135-
145
Coo
ler w
a-te
r spr
aym
3 /hr
1.2
5.5
-4.
56.
014
.03.
75.
0-
5-6
Loss
in P
H
gas
kcal
/ kg
cl
inke
r12
617
816
118
418
214
018
517
619
516
0-16
5

21Energy Benchmarking for Cement Industry
Para
met
erU
nit
Plan
t 1Pl
ant 2
Plan
t 3Pl
ant-
4Pl
ant 5
Plan
t 6Pl
ant 7
Plan
t 8Pl
ant 9
Plan
t 10
Loss
in
Coo
ler v
ent
kcal
/ kg
cl
inke
r99
7285
105
7310
911
987
6711
0-11
5
Loss
in
clin
ker
kcal
/ kg
cl
inke
r25
3139
2732
3533
3330
28-3
0
Loss
in
cool
er w
ater
sp
ray
kcal
/ kg
cl
inke
r5.
016
.0-
-21
.02.
21.
723
.2-
5.5
Ther
mal
sE
Ckc
al /
kg
clin
ker
707
709
715
732
729
710
780
772-
775
737
725-
735
sEC
PH
fan
3.
66.
36.
86.
88.
27.
38.
511
.610
.99.
8RA
BH fa
n
1.6
23.
03.
73.
53.
93.
32.
22.
9-
Coo
ler f
ans
5.
45.
84.
84.
95.
05.
03.
76.
35.
94.
8C
oole
r ven
t fa
n
-0.
120.
15-
0.20
1.10
1.35
0.40
0.24
1.02
Kiln
driv
e
1.39
1.40
1.68
1.43
1.69
3.95
5.08
1.25
1.50
1.49
Kiln
feed
1.68
2.65
1.40
-2.
970.
650.
571.
291.
000.
72Au
x
0.39
-3.
805.
14-
0.83
1.82
3.01
6.09
9.00
Clin
keris
a-tio
n
16.2
818
.30
21.8
022
.08
23.0
023
.40
24.3
826
.10
28.6
331
-32
Upt
o cl
ink-
erisa
tion
49
.94
46.0
053
.37
55.9
957
.20
58.4
069
.55
64.5
459
.63
74-7
5

22 Confederation of Indian IndustryCII-Sohrabji Godrej Green Business Centre
3.7
CO
MPA
RIS
ON
OF
SIX
STA
GE
PREH
EAT
ER
Para
met
erun
itPl
ant 1
Plan
t 2Pl
ant 3
Plan
t 4Pl
ant 5
Plan
t 6Pl
ant7
KIL
N o
utpu
t ra
ted
TPD
3800
3300
3800
5500
6500
4200
8000
Kiln
out
put
oper
atin
gTP
D50
0037
0050
0057
50-6
000
7810
4350
9558
PH ty
peIL
C /
sLC
IL
CIL
CIL
CIL
CsL
CIL
CPy
rocl
one,
KH
DN
o of
PH
strin
gs
sing
lesi
ngle
sing
leD
oubl
eD
oubl
esi
ngle
Dou
ble
Cal
cine
r exi
t O2
/ CO
%2.
0-2.
12.
82.
0-2.
11.
5-2.
5/ 0
to
0.02
1.5-
2.0
2.0
1.5-
2.0
PH e
xit t
emp
o C24
529
024
527
0-28
029
0-31
028
5-29
525
5-26
0
PH e
xit fl
owN
m3 /k
g cl
inke
r1.
671.
501.
671.
601.
45-1
.48
1.43
-1.4
71.
45
PH e
xit p
ress
ure
mm
wc
560
510
560
480-
550
600
450
840
Pres
sure
at P
H
fan
inle
tm
mw
c-5
055
5-5
060
067
046
595
0
False
air
acro
ss
PH%
210
215
88
8
spee
d co
ntro
l for
PH
fan
sP
RsG
RRsP
RsV
FDsP
RsV
FDsP
Rs

23Energy Benchmarking for Cement Industry
Para
met
erun
itPl
ant 1
Plan
t 2Pl
ant 3
Plan
t 4Pl
ant 5
Plan
t 6Pl
ant7
spee
d co
ntro
l for
K
iln B
ag h
ouse
fa
n
sPRs
sPRs
sPRs
VFD
sPRs
VFD
sPRs
Kiln
Bag
hou
se
fan
flow
N
m3 /k
g cl
inke
r45
0000
-45
5000
2.1
4500
00-
4550
002.
1-2.
22.
0-2.
52.
21.
7-2.
0
Kiln
Bag
hou
se
DP
mm
wc
110-
120
-120
120-
140
90-1
3010
0-12
012
0-15
010
0-12
0
Kiln
Bag
hou
se
inle
t pre
ssur
em
mw
c-6
0 to
-70
-25
-60
to -7
090
-110
45-8
045
Kiln
Bag
hou
se
type
RA
BHRA
BHRA
BHPU
LsE
JET
RABH
RABH
RABH
Kiln
size
4.
55 x
56L
4.15
x 6
4L4.
55 x
56L
4.75
x 7
4L4.
75 x
75L
4.15
x 6
4L5.
8 x
85L
Volu
met
ric
load
ing
TPD
/ m3
7.0
5.2
7.0
5.3-
5.6
7.0-
7.2
5.5
5.0
Ther
mal
load
ing
Mkc
al /
hr /m
24.
333.
944.
334.
1-4.
33.
5-4.
04.
23.
0Ph
ase
dens
ity –
PC
firin
gkg
coal
/ kg
air
--
-2.
8-4.
03.
05.
672.
5
Phas
e de
nsity
–
Kiln
firin
gkg
coal
/ kg
air
--
-1.
8-2.
22.
02.
81.
5
24 Confederation of Indian IndustryCII-Sohrabji Godrej Green Business Centre
Para
met
erun
itPl
ant 1
Plan
t 2Pl
ant 3
Plan
t 4Pl
ant 5
Plan
t 6Pl
ant7
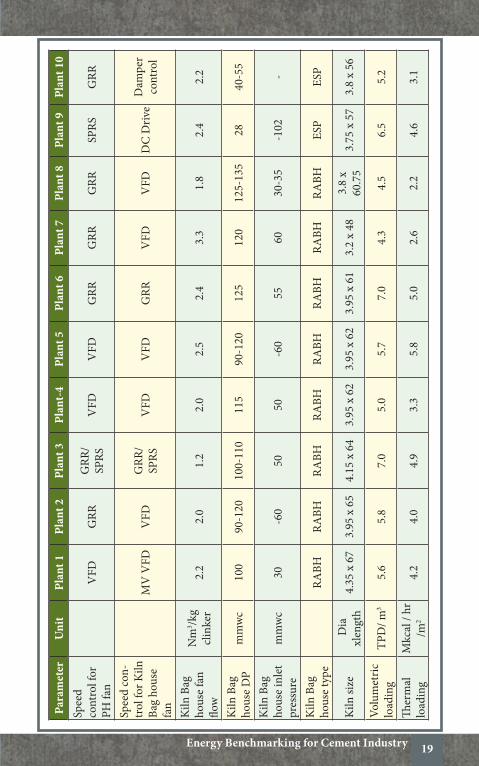
Type
of c
oole
r
sF C
ross
Bar
Gra
te w
ith
stat
icsF
Cro
ss B
ar3r
d G
ener
a-tio
nG
rate
Cro
ss- B
ar
Coo
ler
3rd
Gen
-er
atio
n (P
yrofl
oor
Coo
ler)
Coo
ling
air fl
owN
m3 /k
g cl
inke
r1.
68-1
.80
2.19
1.68
-1.8
01.
50 -1
.70
1.72
1.95
1.75
Clin
ker t
emp
o C16
5-19
012
016
5 - 1
9012
0-13
013
0-15
012
0-14
513
0-15
0C
oole
r wat
er
spra
ym
3 /hr
-12
-2.
5-3.
06-
76-
715
-20
Loss
in P
H g
askc
al /
kg
clin
ker
135
-138
155
135
-138
140-
150
130-
140
145-
155
125-
130
Loss
in C
oole
r ve
ntkc
al /
kg
clin
ker
94 -
9810
394
– 9
895
-100
105-
110
100-
108
110-
115
Loss
in cl
inke
rkc
al /
kg
clin
ker
24 -2
523
24 -2
522
-25
20-2
525
-28
20-2
5
Loss
in co
oler
w
ater
spra
ykc
al /
kg
clin
ker
-13
-6-
8-
5.0-
6.5
-
Ther
mal
sEC
kcal
/ kg
cl
inke
r70
570
570
571
668
670
0-71
069
5
sEC
PH
fan
7.
799.
007.
013.
503.
715.
404.
26

25Energy Benchmarking for Cement Industry
Para
met
erun
itPl
ant 1
Plan
t 2Pl
ant 3
Plan
t 4Pl
ant 5
Plan
t 6Pl
ant7
Cal
cine
r Fan
-
-1.
21 (B
oost
er
fan)
3.5
5.95
4.27
RABH
fan
2.
742.
103.
443.
92.
741.
652.
65C
oole
r fan
s
13.1
76.
1613
.35
3.50
5.85
5.00
9.83
Coo
ler v
ent f
an
-1.
00-
1.20
1.08
0.50
0.70
Kiln
driv
e
-1.
32-
1.90
2.49
1.65
2.00
Kiln
feed
--
-0.
603.
970.
923.
02Au
x
-5.
19-
7.41
--
-C
linke
risat
ion
23
.724
.725
.025
.525
.826
-27
27.5
Upt
o cl
inke
risa-
tion
-
61.3
-66
.270
.754
-55
74.2

26 Confederation of Indian IndustryCII-Sohrabji Godrej Green Business Centre
3.8
CO
MPA
RIS
ON
OF
SEC
AN
D P
RO
DU
CT
ION
Para
met
erU
nit
Plan
t 1Pl
ant 2
Plan
t 3Pl
ant 4
Plan
t 5Pl
ant 6
Plan
t 7Pl
ant 8
Plan
t 9Pl
ant 1
0K
ILN
out
-pu
t rat
ed
TPD
8000
5500
6500
6000
5500
4000
4000
3300
3200
2800
Kiln
out
put
oper
atin
gTP
D95
5880
1078
1067
0057
50-6
000
4800
4600
3700
3500
2800
PH ty
peIL
C /
sLC
Pyro
clon
e, K
HD
sLC
sLC
ILC
ILC
ILC
ILC
ILC
ILC
sLC
No
of P
H
strin
gs
Dou
ble
Dou
ble
Dou
ble
Dou
ble
Dou
ble
sing
lesi
ngle
sing
lesi
ngle
sing
le
No
of st
ages
si
xFi
vesi
xFi
vesi
xFi
veFi
vesi
xFi
veFi
ve
Cal
cine
r ex
it O
2 / C
O%
1.5-
2.0
Kiln
: 3-
3.5
/
0.08
max
, C
alci
ner :
1.
5- 1
.8 /
0.05
max
,
1.5-
2.0
2.50
/ 0.
001
1.5-
2.5
/ 0.0
0 to
0.
022.
5-
2.8
1.5/
0.00
1.99
/0.8
4
PH e
xit
tem
po C
255-
260
350
290-
310
295
270-
280
305
335
290
333
320
PH e
xit
flow
Nm
3 /kg
clin
ker
1.45
1.52
1.45
-1.4
81.
551.
601.
531.
461.
501.
581.
61

27Energy Benchmarking for Cement Industry
Para
met
erU
nit
Plan
t 1Pl
ant 2
Plan
t 3Pl
ant 4
Plan
t 5Pl
ant 6
Plan
t 7Pl
ant 8
Plan
t 9Pl
ant 1
0
PH e
xit
pres
sure
mm
wc
840
860/
960
( ki
ln/C
al-
cine
r)60
0-3
7548
0-55
052
0-5
0051
042
076
0
Pres
sure
at
PH fa
n in
let
mm
wc
950
960/
1100
( k
iln/C
al-
cine
r)67
0-4
4060
058
0-5
8555
543
078
0
False
air
acro
ss P
H%
8.0
6-8
/ 5-6
(k
iln/C
al-
cine
r)8.
05.
015
.05.
0-
10.5
2.0
8.9
spee
d co
ntro
l for
PH
fan
sP
Rs-
sPRs
GRR
VFD
GRR
/sP
RsG
RRG
RRV
FDG
RR
spee
d co
n-tr
ol fo
r Kiln
Ba
g ho
use
fan
sP
Rs-
sPRs
VFD
VFD
GRR
/sP
RsV
FDsP
RsV
FDV
FD
Kiln
Bag
ho
use
fan
flow
Nm
3 /kg
clin
ker
1.7-
2.0
-2.
0-2.
51.
62.
1-2.
21.
22.
02.
02.
01.
8
Kiln
Bag
ho
use
DP
mm
wc
100-
120
-10
0-12
011
090
-130
100-
110
90-1
20-1
2011
512
5-13
5

28 Confederation of Indian IndustryCII-Sohrabji Godrej Green Business Centre
Para
met
erU
nit
Plan
t 1Pl
ant 2
Plan
t 3Pl
ant 4
Plan
t 5Pl
ant 6
Plan
t 7Pl
ant 8
Plan
t 9Pl
ant 1
0K
iln B
ag
hous
e in
let
pres
sure
mm
wc
45-
45-6
090
-110
50-6
0-2
550
30-3
5
Kiln
Bag
ho
use
type
RA
BH-
RABH
RABH
Pulse
jet
RABH
RABH
RABH
RABH
RABH
Kiln
size
Dia
xl
engt
h5.
8x85
L4.
75 x
75
4.75
x 7
5L4.
75 x
74
4.75
x 7
4L4.
15 x
64
3.95
x 6
54.
15 x
64L
3.95
x 6
23.
8 x
60.7
5Vo
lum
etric
lo
adin
gTP
D/ m
35.
07.
57.
0-7.
26.
05.
3-5.
67.
05.
85.
25.
04.
5
Ther
mal
lo
adin
gM
kcal
/ hr
/m
23.
05.
23.
5-4.
05.
74.
1-4.
34.
84.
03.
93.
32.
2
Phas
e de
n-sit
y –
PC
firin
g
kg co
al /
kg a
ir2.
53.
53.
03.
42.
8-4.
04.
22.
0-
2.7
3.3
Phas
e de
n-sit
y –
Kiln
fir
ing
kg co
al /
kg a
ir1.
53.
02.
02.
21.
8-2.
21.
21.
0-
2.6
1.9

29Energy Benchmarking for Cement Industry
Para
met
erU
nit
Plan
t 1Pl
ant 2
Plan
t 3Pl
ant 4
Plan
t 5Pl
ant 6
Plan
t 7Pl
ant 8
Plan
t 9Pl
ant 1
0
Type
of
cool
er
3rd
Gen
-er
atio
n (P
yrofl
oor
Coo
ler)
Gra
te
cool
er
– Fo
lax
– ( 4
nos
G
rate
s)
Gra
te
3rd
Gen
era-
tion
– sF
cr
ossb
ar
cool
er
3rd
Gen
-er
atio
n
sf C
ross
Ba
r Coo
ler
/ with
st
atic
/ 3r
d G
ener
a-tio
n
3rd
gen-
erat
ion
Gra
te w
ith
stat
ic
CIs
/CFG
G
rate
C
oole
r
Gra
te-
with
CIs
-M
FR
Coo
ling
air
flow
Nm
3 /kg
clin
ker
1.75
1.90
1.72
1.90
1.5
-1.7
1.75
1.72
2.19
2.20
2.19
Clin
ker
tem
po C
130-
150
180-
200
130-
150
145
120-
130
140
165
120
120
120-
150
Coo
ler w
a-te
r spr
aym
3 /hr
15-2
010
.06-
7-
2.5-
3.0
-5.
512
.04.
55.
0
Loss
in P
H
gas
kcal
/ kg
cl
inke
r12
5-13
017
5-18
013
0-14
012
814
0-15
016
1.57
178
155
184
176.
25
Loss
in
Coo
ler v
ent
kcal
/ kg
cl
inke
r11
0-11
512
010
5-11
022
95-1
0085
7210
310
587
.10
Loss
in
clin
ker
kcal
/ kg
cl
inke
r20
-25
3820
-25
2722
-25
3931
2327
33
Loss
in
cool
er w
ater
sp
ray
kcal
/ kg
cl
inke
r-
--
-6-
8-
1613
-23

30 Confederation of Indian IndustryCII-Sohrabji Godrej Green Business Centre
Para
met
erU
nit
Plan
t 1Pl
ant 2
Plan
t 3Pl
ant 4
Plan
t 5Pl
ant 6
Plan
t 7Pl
ant 8
Plan
t 9Pl
ant 1
0Th
erm
al
sEC
kcal
/ kg
cl
inke
r69
572
968
672
571
671
570
970
573
277
2-77
5
sEC
PH
fan
4.
263.
383.
715.
903.
506.
886.
309.
006.
8611
.61
Cal
cine
r Fa
n
4.27
7.04
5.95
-3.
50-
--
--
RABH
fan
2.
652.
812.
741.
503.
903.
052.
002.
103.
722.
24C
oole
r fan
s
9.83
6.28
5.85
5.80
3.50
4.85
5.80
6.16
4.93
6.30
Coo
ler v
ent
fan
0.
700.
541.
080.
201.
200.
150.
121.
00-
0.40
Kiln
driv
e
2.00
1.88
2.49
2.21
1.90
1.68
1.40
1.32
1.43
1.25
Kiln
feed
3.02
1.40
3.97
0.45
0.60
1.40
2.65
--
1.29
Aux
-
3.48
-3.
607.
413.
80-
5.19
5.14
3.01
Clin
keris
a-tio
n
27.5
026
.81
25.8
019
.60
25.5
121
.80
18.3
024
.70
22.0
826
.10
Upt
o cl
ink-
erisa
tion
74
.29
65.4
070
.78
55.0
066
.24
53.3
746
.00
61.3
055
.99
64.5
4

31Energy Benchmarking for Cement Industry
3.9
CO
MPA
RIS
ON
OF
SEC
(UP
TO
ClI
NK
ERIS
AT
ION
)
Para
met
erU
nit
Plan
t 1Pl
ant 2
Plan
t 3Pl
ant 4
Plan
t 5Pl
ant 6
Plan
t7Pl
ant 8
Plan
t-9
Plan
t 10
KIL
N o
ut-
put r
ated
TP
D40
0045
0040
0042
0040
0031
5055
0012
0080
0028
00
Kiln
out
put
oper
atin
gTP
D46
0046
7048
0043
5044
0032
5080
1013
0095
5826
50
PH ty
peIL
C /
sLC
IL
CIL
CIL
CIL
CIL
CIL
CsL
CIL
CPy
ro-
clon
e, K
HD
ILC
No
of P
H
strin
gs
sing
lesi
ngle
sing
lesi
ngle
sing
lesi
ngle
Dou
ble
sing
leD
oubl
esi
ngle
No
of st
ages
Fi
veFi
veFi
vesi
xFi
veFi
veFi
veFi
vesi
xFi
ve
Cal
cine
r exi
t O
2 / C
O%
1.8
/0.0
12.
52.
01.
5/0.
004.
5/N
IL
Kiln
: 3-
3.5
/ -
0.0
8 m
ax,
Cal
cine
r :
1.5-
1.8
/ 0.
05 m
ax,
1.0
1.5-
2.0
2.1
PH e
xit
tem
po C
335
260
305
285-
295
333
310
350
318
255-
260
320-
330
PH e
xit fl
owN
m3 /k
g cl
inke
r1.
461.
391.
531.
43-1
.47
1.58
1.65
1.52
1.78
1.45
1.48
-1.5
1

32 Confederation of Indian IndustryCII-Sohrabji Godrej Green Business Centre
Para
met
erU
nit
Plan
t 1Pl
ant 2
Plan
t 3Pl
ant 4
Plan
t 5Pl
ant 6
Plan
t7Pl
ant 8
Plan
t-9
Plan
t 10
PH e
xit
pres
sure
mm
wc
-500
380
520
450
420
-760
860/
960
-84
064
0
Pres
sure
at
PH fa
n in
let
mm
wc
-585
395
580
465
450
-820
960/
1100
57
095
065
0
False
air
acro
ss P
H%
-4
58
24
6-8
/ 5-6
138
10
spee
d co
ntro
l for
PH
fan
G
RRV
FDG
RR/
sPRs
VFD
GRR
sPRs
-G
RRsP
RsG
RR
spee
d co
n-tr
ol fo
r Kiln
Ba
g ho
use
fan
V
FDM
V V
FDG
RR/
sPRs
VFD
VFD
DC
Mot
or-
VFD
sPRs
Dam
per
cont
rol
Kiln
Bag
ho
use
fan
flow
Nm
3 /kg
clin
ker
2.0
2.2
1.3
2.3
1.9
2.4
-3.
31.
7-2.
02.
2
Kiln
Bag
ho
use
DP
mm
wc
90-1
2010
010
0-11
012
0-15
010
828
-12
010
0-12
040
-55
Kiln
Bag
ho
use
inle
t pr
essu
rem
mw
c-6
030
50-8
050
-102
-60
45-
Kiln
Bag
ho
use
type
RA
BHRA
BHRA
BHRA
BHRA
BHEs
P-
RABH
RABH
EsP

33Energy Benchmarking for Cement Industry
Para
met
erU
nit
Plan
t 1Pl
ant 2
Plan
t 3Pl
ant 4
Plan
t 5Pl
ant 6
Plan
t7Pl
ant 8
Plan
t-9
Plan
t 10
Kiln
size
Dia
xl
engt
h3.
95 x
65
4.35
x 6
74.
15 x
64
4.15
x 6
44.
15 x
64
3.75
x 5
74.
75 x
75
3.2
x 48
5.8x
85
3.8
x 56
Volu
met
ric
load
ing
TPD
/ m3
5.80
5.69
7.00
5.50
6.22
6.57
7.50
4.30
5.00
5.21
Ther
mal
lo
adin
gM
kcal
/ hr
/m
24.
004.
284.
884.
203.
804.
605.
202.
653.
003.
13
Phas
e de
nsity
– P
C
firin
g
kg co
al /
kg a
ir2.
002.
484.
275.
672.
731.
473.
502.
502.
502.
97
Phas
e de
n-sit
y –
Kiln
fir
ing
kg co
al /
kg a
ir1.
001.
201.
192.
812.
652.
083.
001.
401.
501.
42
Type
of
Coo
ler
3r
d G
en-
erat
ion
3rd
Gen
-er
atio
n (s
f C
ross
Bar
C
oole
r 4
*5)
sF C
ross
Ba
r C
oole
r /
with
sta
tic
/3rd
Gen
-er
atio
n
Cro
ss- B
ar
Coo
ler
(FLs
) 10
4.5
M2
sF C
ross
Ba
r C
oole
r
Flsc
ross
Ba
r C
oole
r (1
0X48
)
Gra
te
Coo
ler –
Fo
lax
– ( 4
N
os G
rate
s)
Gra
te
Coo
ler
3rd
Gen
-er
atio
n (P
yro-
floor
C
oole
r)
Reci
p-ro
catin
g G
rate
(K
HD
)
57.4
5 M
2
Coo
ling
air
flow
Nm
3 /kg
clin
ker
1.72
1.77
1.75
1.95
2.20
1.90
1.90
2.20
1.75
2.25
Clin
ker
tem
po C
165
125
140
120-
145
120
120-
130
180-
200
170
130-
150
135-
145

34 Confederation of Indian IndustryCII-Sohrabji Godrej Green Business Centre
Para
met
erU
nit
Plan
t 1Pl
ant 2
Plan
t 3Pl
ant 4
Plan
t 5Pl
ant 6
Plan
t7Pl
ant 8
Plan
t-9
Plan
t 10
Coo
ler w
a-te
r spr
aym
3 /hr
51
-6-
75
-10
415
-20
5-6
Loss
in P
H
gas
kcal
/ kg
cl
inke
r17
812
616
114
5-15
517
719
517
5-18
018
512
5-13
016
0-16
5
Loss
in
Coo
ler v
ent
kcal
/ kg
cl
inke
r72
9985
100-
108
9567
120
119
110-
115
110-
115
Loss
in
clin
ker
kcal
/ kg
cl
inke
r31
2539
25-2
825
3038
3320
-25
28-3
0
Loss
in
cool
er w
ater
sp
ray
kcal
/ kg
cl
inke
r16
.05.
0-
5.0-
6.5
--
-1.
7-
5.5
Ther
mal
sE
Ckc
al /
kg
clin
ker
709
707
715
700-
710
728
737
729
780
695
725-
735
sEC
PH
fan
6.
303.
646.
885.
407.
1510
.95
3.38
8.51
4.26
9.81
Cal
cine
r Fa
n
--
--
--
7.04
-4.
27-
RABH
fan
2.
001.
683.
051.
652.
052.
932.
813.
302.
65-
Coo
ler f
ans
5.
805.
434.
855.
007.
135.
926.
283.
759.
834.
85C
oole
r ven
t fa
n
0.12
-0.
150.
50-
0.24
0.54
1.35
0.70
1.02

35Energy Benchmarking for Cement Industry
Para
met
erU
nit
Plan
t 1Pl
ant 2
Plan
t 3Pl
ant 4
Plan
t 5Pl
ant 6
Plan
t7Pl
ant 8
Plan
t-9
Plan
t 10
Kiln
driv
e
1.40
1.39
1.68
1.65
1.62
1.50
1.88
5.08
2.00
1.49
Kiln
feed
2.65
1.68
1.40
0.92
-1.
001.
400.
573.
020.
72Au
x
-0.
393.
80-
5.04
6.09
3.48
1.82
-9.
00C
linke
risa-
tion
18
.30
16.2
821
.826
-27
22.9
928
.63
26.8
124
.38
27.5
031
-32
Upt
o cl
ink-
erisa
tion
46
.00
49.9
453
.37
54-5
556
.04
59.6
365
.40
69.5
574
.29
74-7
5

36 Confederation of Indian IndustryCII-Sohrabji Godrej Green Business Centre
3.10
CEM
ENT
MIl
l –
BAll
MIl
l C
lOSE
CIR
CU
IT
Para
met
erun
itPl
ant 1
Plan
t 2Pl
ant 3
Plan
t 4Pl
ant 5
Plan
t 6Pl
ant 7
Plan
t 8Pl
ant 9
Plan
t 10
Circ
uit
Ba
ll m
ill
(Clo
sed
circ
uit)
Ball
mill
(C
lose
d ci
rcui
t)
Ball
mill
(C
lose
d ci
rcui
t)
Ball
mill
(C
lose
d ci
rcui
t)
Ball
mill
(C
lose
d ci
rcui
t)
Ball
mill
(C
lose
d ci
rcui
t)
Ball
mill
(C
lose
d ci
rcui
t)
Ball
mill
(C
lose
d ci
rcui
t)
Ball
mill
(C
lose
d ci
rcui
t)
Ball
mill
(C
lose
d ci
rcui
t)N
o of
sep
in th
e ci
ruci
t
One
One
- O
neO
ne-
One
One
One
One
Rate
d ca
paci
tyTP
H13
320
010
510
520
011
580
/ 90
125
4027
Ope
ratin
g ca
paci
tyTP
H14
3 / 1
8622
511
6/12
211
6 /1
2020
010
511
0 13
050
/ 60
30
Ball
mill
di
men
sion
4.
4 x
13.5
5
x 15
4 x
11.5
4.2
x 13
.54.
81 x
15
3 x
103.
8 x
14.6
54.
4 x
16.5
03.
5 x
10.9
03.
05 x
14
.63
Prod
uct
Varie
ty
O
PC/P
PCPP
CO
PC/P
PCO
PC/P
PCO
PCO
PC /
PPC
PPC
OPC
/ PP
CO
PC /
PPC
PsC
Mill
ve
ntila
tion
velo
city
m/s
ec1.
01.
0 to
1.2
-1.
2-1.
41.
01.
10 –
1.2
00.
46-
6.2
1.0
to 1
.21.
15
Prod
uct
Blai
ne
OPC
/ PP
C
cm2 /g
m28
00 +
100
/ 3
800
+ 10
032
0030
00 /
3300
3000
/ 33
0027
0030
041
0029
00 -
3000
/330
0 -3
500
2800
/ 32
0034
00

37Energy Benchmarking for Cement Industry
Para
met
erun
itPl
ant 1
Plan
t 2Pl
ant 3
Plan
t 4Pl
ant 5
Plan
t 6Pl
ant 7
Plan
t 8Pl
ant 9
Plan
t 10
Prod
uct
resid
ue%
O
PC :
24
PPC
: 22
19 -
20<2
5.0
<20.
0+4
5 m
icro
n:
14.5
%15
.6+4
5 m
i-cr
on: 9
.7%
20-2
5%19
- 20
21 fo
r C
lose
ckt
& 2
4 fo
r O
pen
ckt
Mill
di
scha
rge
resid
ue%
OPC
: 55
PP
C:
4545
- 50
<35-
40<3
5-40
+45
mi-
cron
: 40%
60.5
+45
mi-
cron
; 44.
3%38
-42%
45 -
5046
%
Mill
di
scha
rge
Blai
ne
OPC
/ PP
C
cm2 / g
m24
0 / 3
0520
00
1800
to
2200
/ 18
00 to
24
00
1800
to
2200
/ 18
00 to
24
00
2040
130
1990
250-
270
1850
/ 20
0018
00
Circ
ulat
-in
g lo
ad%
1.5
- 1.8
1.0
– 1.
51.
2-1.
51.
2-1.
51.
6 -
2.8
26-2
91.
5 –
2.0
2.8
Cyc
lone
pr
essu
re
drop
mm
wc
150
170
200
200
90-
130
65-7
5-
70
% fl
y as
h /
% sl
ag%
3030
2828
-26
.00
/ Nil
3028
-30
OPC
: 5;
PP
C :
3052
sep
fan
flow
km3 /h
r16
027
5-
145-
160
248
210
140
-67
116

38 Confederation of Indian IndustryCII-Sohrabji Godrej Green Business Centre
Para
met
erun
itPl
ant 1
Plan
t 2Pl
ant 3
Plan
t 4Pl
ant 5
Plan
t 6Pl
ant 7
Plan
t 8Pl
ant 9
Plan
t 10
sep
reje
ct
resid
ue%
85-8
875
- 80
--
15 -
6527
-40
55-6
0 /
60-6
565
sEC
M
ill d
rive
21
.61
22.6
324
.50
25.0
025
.10
9.00
25.4
024
.0-2
6.0
27.1
141
.41
HRG
s
--
--
-10
.5-
--
-se
p fa
n
2.20
2.24
1.50
1.50
2.40
4.80
2.20
0.07
- 0.
092.
891.
25M
ill v
ent
fan
-
0.17
0.35
0.35
0.11
0.30
0.02
0.03
0 -
0.03
5-
0.60
sep
vent
fa
n
2.65
0.23
- -
0.40
-0.
433.
0-3.
5-
0.9
Dry
fly
ash
unlo
adin
g
1.00
0.07
1.95
1.95
0.50
- 0.
420.
70-0
.80
0.15
2.27
Ove
rall
27
.16
27.5
928
.49
28.8
030
.50
31.8
029
.00
32.0
033
.96
45.2
3

39Energy Benchmarking for Cement Industry
3.11
CEM
ENT
MIl
l - B
All
MIl
l w
ITH
PR
EGR
IND
ER/H
PRG
Para
met
erun
itPl
ant 1
Plan
t 2Pl
ant 3
Plan
t 4Pl
ant 5
Plan
t 6Pl
ant 7
Plan
t 8Pl
ant 9
Circ
uit
Ba
ll m
ill
with
H
RGs
Ball
mill
w
ith
Rolle
r Pr
ess
Ball
Mill
w
ith R
PBa
ll m
ill
with
HRG
sBa
ll m
ill
with
HRG
s
Ball
mill
w
ith
HRG
s
Ball
mill
w
ith
HPR
Gs
Ball
mill
w
ith
Preg
rinde
r
Ball
mill
w
ith
Preg
rinde
r
No
of se
p in
th
e ci
ruci
t
Two
Two
-Tw
oTw
oTw
oO
neO
neTw
o
Rate
d ca
paci
tyTP
H22
516
117
022
522
522
527
022
016
5O
pera
ting
capa
city
TPH
250
201
185
/210
25
025
025
026
5 / 3
00
200-
220
165-
175
Ball
mill
di
men
sion
4.
6 x
14.5
4.2x
11
3.8
x 11
.64.
6 x
14.5
4.6
x14.
54.
4 x
164.
6 x
15.
0 4.
2x13
.83.
8x11
.5
Prod
uct
Varie
ty
O
PC /
PPC
OPC
/PPC
OPC
/PPC
OPC
/ PP
CO
PC /
PPC
OPC
/ PP
CO
PC/P
PCO
PC/P
PCO
PC/P
PC
Mill
ven
tila-
tion
velo
city
m/s
ec-
8-10
0.9
--
-3.
51.
20.
6
Prod
uct
Blai
ne O
PC/
PPC
cm2 /g
m26
0 / 2
90 /
350
2850
280
/380
260
/ 290
/ 35
026
0 / 2
90 /
350
260
/ 290
/ 35
030
00 /
3400
-27
50-2
850
/ 31
50-3
300
Prod
uct
resid
ue%
2-
3/0
45-5
018
.2 /
16.7
2-3/
02-
3/0
2-3/
0 90
/212
9.5
7-8
7-8
Mill
disc
harg
e re
sidue
%-
15-2
047
/ 29
--
-47
.533
-35
21-2
4

40 Confederation of Indian IndustryCII-Sohrabji Godrej Green Business Centre
Para
met
erun
itPl
ant 1
Plan
t 2Pl
ant 3
Plan
t 4Pl
ant 5
Plan
t 6Pl
ant 7
Plan
t 8Pl
ant 9
Mill
disc
harg
e Bl
aine
cm2 / g
m21
0 -2
4035
00-3
600
1682
/
1921
21
0-24
021
0-24
021
0 -2
4017
0016
00-1
700
2400
-250
0
Circ
ulat
ing
load
%2.
2- 2
.52
1.5-
2.0
300
2.2-
2.5
22.
2- 2
.52
2.2-
2.5
22.
512
5-13
510
5-11
5
Cyc
lone
pre
s-su
re d
rop
mm
wc
-60
-70
12-
--
-90
180
% fl
y as
h / %
sla
g%
3231
2832
3232
3132
32
sep
fan
flow
km3 /h
r-
2511
0516
5565
--
-46
4400
3541
9010
8831
/ 24
4022
sep
reje
ct
resid
ue%
-30
-40
22-
--
3541
.661
.3 /
17.6
sEC
M
ill d
rive
11
.21
11.1
58.
2910
.66
10.9
912
.21
16.2
014
.50
12.5
0H
RGs
1.
534.
928.
951.
582.
191.
477.
006.
307.
50se
p fa
n
1.68
2.84
1.45
1.80
1.88
1.61
3.50
3.20
2.60
Mill
ven
t fan
4.
185.
820.
095.
316.
15 5
.29
0.14
0.35
0.26
sep
vent
fan
-
-0.
7-
--
-0.
40.
4D
ry fl
y as
h un
load
ing
-
-0.
51-
--
0.15
--
Ove
rall
23
.75
24.7
325
.27
25.2
825
.44
26.3
127
.00
29.3
030
.00

41Energy Benchmarking for Cement Industry
3.12
CEM
ENT
MIl
l-V
RM
Para
met
erun
itPl
ant 1
Plan
t 2Pl
ant 3
Plan
t 4Pl
ant 5
Plan
t 6Pl
ant 7
Plan
t 8Pl
ant 9
Mill
m
odel
LM
56.3
+3LM
56
.3+3
MP5
600
BCLM
53.
3.3
OK
-36-
4O
K 3
6.40
LOEs
CH
E 56
.3+3
LM 5
6.3+
3LM
46.
2+2
Prod
uct
Varie
ty
OPC
/PPC
PPC
OPC
/PPC
OPC
/ PPC
/ Ps
CO
PC/ P
PC
/ PsC
OPC
/PP
C/P
sCO
PC/P
PCO
PC/s
LAG
OPC
/sLA
G
Rate
d ou
tput
TPH
250
in
PPC
With
40
00
Blai
ne
250
300
@
3600
bl
aine
170
/ 13
5 /
215
185
/ 190
/ 15
017
027
0 / 3
05
178
at 4
000
Blai
ne a
nd 1
77
tph
at 4
000
Blai
ne in
sla
g
102
tph
at 4
000
Blai
ne a
nd 1
01
tph
at 4
000
Blai
ne in
sla
g
Ope
ratin
g ou
tput
TPH
320
TPH
in
PPC
w
ith 4
100
Blai
ne
260
305
@
3550
bl
aine
215
/ 179
/ 17
717
8 / 1
83 /
126
160
245
/ 310
190-
195
tph
(OPC
) at 3
500
Blai
ne a
nd
180-
185
(sla
g)
at 4
000
Blai
ne
104-
106
(OPC
) at
350
0 Bl
aine
an
d 10
0-10
2 (s
lag)
at 4
000
Blai
ne
Mill
DP
mm
wc
750
500
150
- 160
/ 20
0 - 2
2030
027
0-29
055
058
042
0-45
0 (O
PC) a
nd
360-
400
(sla
g)32
0-35
0
Mill
fan
flow
km3 /h
r68
061
790
063
0150
570-
580
487
763
720-
750
in
OPC
/ 62
0-65
0 in
slag
340-
350
Bag
filte
r D
Pm
mw
c13
0-15
080
150
to 2
0010
0-12
011
0-14
015
0-16
010
010
0-12
010
0-12
0

42 Confederation of Indian IndustryCII-Sohrabji Godrej Green Business Centre
Para
met
erun
itPl
ant 1
Plan
t 2Pl
ant 3
Plan
t 4Pl
ant 5
Plan
t 6Pl
ant 7
Plan
t 8Pl
ant 9
Mill
fan
head
mm
wc
1000
700
600
810
650-
670
800
780
-650
to -7
00-5
00 to
-550
% F
ly a
sh
/ %
slag
%30
-33
3532
31/4
228
% fl
y as
h an
d 40
%
slag
26.0
0 /
45.0
031
100%
slag
100%
slag
sEC
M
ill d
rive
13
.013
.916
.316
.016
.016
.516
.521
-222
-2M
ill fa
n
7.0
8.7
6.8
6.3
8.0
8.5
8.6
11-1
28-
9Au
x
1.0
2.4
2.8
5.7
5.0
4.2
4.6
6-7
10-1
2To
tal
21
.025
.025
.928
.029
.029
.229
.839
-440
-42

43Energy Benchmarking for Cement Industry
3.13
PA
CK
ING
PlA
NT
Para
met
erun
itPl
ant 1
Plan
t 2Pl
ant 3
Plan
t 4Pl
ant 5
Plan
t 6Pl
ant 7
Plan
t 8Pl
ant 9
Plan
t 10
Rate
d ou
tput
18
024
080
903x
180
320
2x12
026
522
0 / 1
80 /
120
/ 90
/ 22
0 / 1
802x
240
Ope
ratin
g ou
tput
-
140
8089
200
200
250
200
/140
/ 11
0 / 6
0 /
200
/ 140
No
of
spou
ts
1216
66
128
1226
16 /
12 /
8 / 6
/ 16
/12
12
Bag
filte
r fa
n vo
lum
e (m
3/hr
)
1810
0 44
,000
1671
719
500
3459
2, /
3465
4 /
3360
312
000
-38
400
--
sEC
0.
651.
15
1.19
1.20
1.27
1.40
1.72
1.90
1.97
3.87
BF fa
n kW
/ sp
out
-
4.69
1.
703.
003.
67-
2.40
1.50
Incl
uded
in s
EC4.
00
Com
pres
sor
pres
sure
bar
-6.
06.
76.
06.
75.
05.
5-6
5.0
Incl
uded
in s
EC5.
5-6

44 Confederation of Indian IndustryCII-Sohrabji Godrej Green Business Centre
3.14
UT
IlIT
IES
Para
met
erun
itPl
ant 1
Plan
t 2Pl
ant 3
Plan
t 4Pl
ant 5
Plan
t 6Pl
ant 7
Plan
t 8Pl
ant 9
Plan
t 10
Kiln
cap
ac-
ityTP
D40
0095
5878
1038
0012
0032
5028
0028
0036
0011
250
Grin
ding
ca
paci
tyTP
H27
056
540
220
040
185
/ 210
--
510
Upt
o cl
ink-
erisa
tion
0.
400.
991.
241.
301.
311.
942.
052.
152.
192.
70
Cem
ent
grin
ding
&
pacK
ing
0.
47-
-1.
001.
130.
691.
40-
0.78
1.04
Avg
op
pres
sure
for
HP
com
prBa
r 6
66
6.7
6.7
6-
-6.
75.
5-6.
5
Com
p pr
fo
r fly
ash
unlo
adin
g B
ar2
2.5
Root
bl
ower
is
used
Root
bl
ower
is
used
3.5
--
32-
3
Fly
ash
unlo
adin
g sE
C
--
-0.
070.
150.
51-
--
3.5-
4.0

45Energy Benchmarking for Cement Industry
Para
met
erun
itPl
ant 1
Plan
t 2Pl
ant 3
Plan
t 4Pl
ant 5
Plan
t 6Pl
ant 7
Plan
t 8Pl
ant 9
Plan
t 10
Coo
ling
wat
er fl
ow
pyro
sec-
tion
40
060
070
018
060
Air
Coo
led
--
--
Coo
ling
wat
er fl
ow
cem
ent s
ec-
tion
-
-60
030
19A
ir C
oole
d-
--
-
Aux
BF
– py
ro
sect
ion
Nos
511
927
1110
64
6-
Aux
BF
– ce
men
t se
ctio
nN
os14
3222
165
1210
109
-
Aux
BF
– py
ro
sect
ion
kW /
MT
0.38
--
1.52
2.22
0.51
0.75
0.17
0.33
-
Aux
BF
– ce
men
t se
ctio
n
0.74
--
1.02
1.64
1.2
1.23
0.55
0.6
-

46 Confederation of Indian IndustryCII-Sohrabji Godrej Green Business Centre
3.15
CA
PTIV
E PO
wER
PlA
NT
Para
met
erun
itPl
ant 1
Plan
t 2Pl
ant 3
Plan
t 4Pl
ant 5
Plan
t 6Pl
ant 7
Plan
t 8Pl
ant 9
Plan
t 10
Inst
alle
d ca
paci
tyM
W15
309
17.5
12.5
1517
.517
.525
3x25
Type
A
FBC
AFB
CA
FBC
AFB
CA
FBC
AFB
CA
FBC
AFB
CA
FBC
CFB
CPL
F%
82.3
68.5
88.5
8488
6477
.885
67.2
185
Hea
t rat
eKc
al /k
Wh
3250
.36
3327
3040
3018
3490
3495
3035
3074
3426
3007
Coa
l CV
Kcal
/ kg
5268
.83
5503
3204
3213
494
049
8131
7532
0535
3830
96LO
I – B
ed
ash
%20
.119
.4<1
<10.
4-0.
514
.2<1
<17.
52.
3
Inst
hea
der
pres
sure
Bar
5.5
5.5
66
65.
56
66.
86.
5
Fly
ash
tpt
pres
sure
Bar
4.5
4.0
55
4.5
4.0
55
3.2
4.5
APC
%7.
978.
538.
969.
309.
509.
569.
569.
6912
.59
13.5
1

47Energy Benchmarking for Cement Industry
ElEC
TR
ICA
l SE
C U
P T
O C
lIN
KER
ISA
TIO
N
Para
met
erU
nit
Plan
t 1Pl
ant 2
Plan
t 3Pl
ant 4
Plan
t 5Pl
ant 6
Plan
t7Pl
ant 8
Plan
t-9
Plan
t 10
Plan
t Cap
acity
MTP
A1.
93.
05.
53.
11.
01.
41.
31.
77.
23.
1U
pto
clin
keri-
satio
n k
W/M
T C
linke
r46
.00
49.9
453
.37
54-5
556
.04
59.6
365
.40
69.5
574
.29
74-7
5
OV
ERA
ll E
lEC
TR
ICA
l SE
C
Para
met
erU
nit
Plan
t 1Pl
ant 2
Plan
t 3Pl
ant 4
Plan
t 5Pl
ant 6
Plan
t7Pl
ant 8
Plan
t-9
Plan
t 10
Plan
t Cap
acity
MTP
A1.
53.
33.
01.
45.
51.
91.
73.
11.
07.
2
Ove
r all
sEC
kW
/MT
Clin
ker
65.5
568
.00
68.2
470
.95
73.4
473
.56
78.6
778
.90
85.0
087
.82
FIV
E ST
AG
E PR
EHEA
TER
S H
EAT
BAlA
NC
E
Para
met
erU
nit
Plan
t 1Pl
ant 2
Plan
t 3Pl
ant 4
Plan
t 5Pl
ant 6
Plan
t 7Pl
ant 8
Plan
t-9
Plan
t 10
Plan
t Cap
ac-
ityM
TPA
3.1
3.0
1.7
8.6
5.5
2.1
1.3
1.0
4.6
1.0
Ther
mal
sec
k
cal/k
g cl
inke
r70
570
771
071
171
572
572
973
276
177
2
SIX
STA
GE
PREH
EAT
ERS
HEA
T BA
lAN
CE
Para
met
erU
nit
Plan
t 1Pl
ant 2
Plan
t 3Pl
ant 4
Plan
t 5Pl
ant 6
Plan
t7Pl
ant 8
Plan
t Cap
acity
MTP
A7.
23.
17.
23.
33.
073.
44.
23.
4Th
erm
al s
ec k
cal/k
g cl
inke
r68
669
069
569
770
571
672
072
2


49Energy Benchmarking for Cement Industry
CHAPTER-4EXTRACT & OUTCOME OF THE STUDY
The ultimate objective of the study is to identify the best specific energy consumption levels where the best plants are operating and the same was compared in the earlier sessions. The outcomes of the study are recorded in the tabular column
S. No Section kw/MT Material1 single stage crusher 0.702 Double stage crusher 0.653 Raw Mill-VRM 13.304 Raw Mill-Ball Mill 16.505 Coal Mill 23.906 Five stage Preheater up to clinkerisation 16.287 six stage Preheater up to clinkerisation 23.78 Cement Mill –Ball Mill Close circuit 27.169 Cement Mill-Ball mill with HPRG 23.7510 Cement Mill-VRM 21.0011 Packing 0.6512 Total Plant 65.55
These are the best figures which are operating in different sections in different plants .If any of the single plant is operating with all these best figures by adopting all possible latest technology in all sections then the typical energy levels will be at par compared to the peers in the industry.
The estimated energy levels with best sec in each sections are tabulated as below:
If all the best numbers are put together for operationSection 5 stage 6 stage
Best numbers
kW/Ton of material
Best numbers kW/Ton of
materialCrusher 0.7 0.8 0.7 0.8Raw mill-VRM 13.3 19.9 13.3 19.9Coal mill-VRM 23.9 3.1 23.9 3.1Pyro 16.2 16.2 23.7 23.7

50 Confederation of Indian IndustryCII-Sohrabji Godrej Green Business Centre
Up to clinkerisation (kW/MT of Clinker)
40.1 47.5
Cement - VRM 21 21 21 21Up to clinker 40.1 29.3 47.5 34.7Up to cement (kW/MT of cement)
50.3 55.7
Assumptions for the above calculations: Clinker Capacity-4500 TPD, Raw meal to clinker factor-1.5
Comparative analysis between top 3 plants and the remaining plants:
Electrical SEC Analysis up to clinkerisation
Plant composition Average SEC kw/MT ClinkerTop 3 best plants 49.77Top 10 plants 59.27Identified gap 9.50
0
10
20
30
40
50
60
Top 3 best plants
Top 10 plants Identified gap
49.77
59.27
9.5
Average SEC kW/MT Clinker

51Energy Benchmarking for Cement Industry
Overall Electrical SEC Analysis
Plant composition Average SEC kw/MT CementTop 3 best plants 67.2Top 10 plants 75.0Identified gap 7.7Country’s best (source: Low carbon technology road map)
80
01020304050607080
Top 3 best plants
Top 10 plants Identified gap
67.275
7.7
Average Electrical SEC kW/MT Cement
Thermal SEC analysis for 5 Stage preheater
Plant composition Average SEC kCal/kg ClinkerTop 3 best plants 709Top 10 plants 731Identified gap 12
670680690700710720730740750760770780
Plant 1 Plant 2 Plant 3 Plant 4 Plant 5 Plant 6 Plant7 Plant 8 Plant-9 Plant 10
707 710 711 715 725 729 732 746761 772
Thermal SEC for 5 stage preheater (kCal/kg clinker)

52 Confederation of Indian IndustryCII-Sohrabji Godrej Green Business Centre
Thermal SEC analysis for 6 Stage preheater
Plant composition Average SEC kCal/kg ClinkerTop 3 best plants 690Top 8 plants 704Identified gap 14Country’s best (source: Low carbon technology road map)
725
660670680690700710720730
Plant 1Plant 2
Plant 3Plant 4
Plant 5Plant 6
Plant7Plant 8
686 690 695 697 705 716 720 722
Thermal SEC for 6 stage (kCal/kg clinker)
The Identified Best Top Ten Technologies for Achieving Best Specific Energy Consumption levels:
With reference to the best sec achieved in different sections the implementation of following technologies will operate the typical cement plant at the best operating sec
1. MV VFD: Large slip ring induction motors are used for driving major fans (Pre-heater fan, cooler vent fan, Mill fans etc) in cement industry where they have the advantage of controlled starting characteristics and adjustable speed capability. By changing rotor resistance with the rheostat (Grid Rotor Resistance, GRR), the motor speed can be changed. The speed control of slip ring induction motor by varying the resistance in the rotor circuit results in power loss across the rotor circuit. The loss due to GRR can be avoided by Installing VFD.
Savings potential 100 kWAnnual Savings 36.00 Rs. Lakhs/annumInvestment 96.00 Rs. LakhsPayback period 32 Months
2. Roller Press: Material grinding is the largest electrical energy consumer in cement manufacture. By design ball mills are efficient in fine grinding than coarse grinding. Installation of Roller press in the upstream of ball mill can

53Energy Benchmarking for Cement Industry
avoid the inefficient coarse grinding from ball mill, reduce and maintain the feed size to mill hence the system more efficient. Roller press can produce the product with size less a micron. Reduced feed size of the material to the ball mill results in reduced power consumption for grinding needs.
Savings potential 7 kW/MT cementAnnual Savings 630.00 Rs. Lakhs/annumInvestment 30.00 Rs. CroresPayback period 57 Months
3. Cooler: The Indian cement industry, over the last several years, has increasingly adopted reciprocating grate coolers with great success. The reciprocating cooler has under gone significant design development and the latest generation cooler has better clinker properties with significantly lower exit gas and clinker temperatures. The total heat loss of latest generation clinker coolers is less than 100kCal/kg of clinker and has a recuperation efficiency of 75-80%.
Savings potential 20 kcal/kg clkAnnual Savings 300.00 Rs. Lakhs/annumInvestment 20.00 Rs. CroresPayback period 80 Months
4. Automation: An effective advanced automation and control system can bring substantial improvements in overall performance of the kiln, increased material throughput, better heat recovery and reliable control of free lime content in clinker. Furthering the scope of automation in process control, quality is also maintained by continuous monitoring of the raw mix composition with the help of x-ray analyzer and automatic proportioning of raw mix components. The analyzer quickly analyzes the entire flow online providing real time results. Automation and control systems can significantly improve the performance of grinding systems by reducing the Variations, maintaining precise particle size distribution and increasing throughput.
Savings potential 1 kWh/MT cementAnnual Savings 90.00 Rs. Lakhs/annumInvestment 100.00 Rs. LakhsPayback period 13 Months
5. Fly ash Drier: Increase in manufacture of blended cement and quantity of addition of fly ash in cement results in reduced energy consumption and lowers carbon emission intensity. This increase has resulted in a short fall of availability of dry fly ash in some of the cement manufacturing clusters. The fly ash can be dried either by taking the hot gases from the cooler exit (or

54 Confederation of Indian IndustryCII-Sohrabji Godrej Green Business Centre
from the pre-heater exit) installing fly ash drier.
Savings potential 0.5 kWh/MT cementAnnual Savings 45.00 Rs. Lakhs/annumInvestment 200.00 Rs. LakhsPayback period 53 Months
6. High Efficiency Separator: separators are used in material grinding for the purpose of separating the fine particles from the coarse material coming out from the ball mill thus increasing its grinding efficiency. An efficient separator improves the mill performance by avoiding the over grinding of the material and thereby reduces the grinding power consumption. This result in reduction of the specific energy demand compared to grinding circuits with standard separators. High efficiency separators contribute to the energy demand for grinding with about 5 to 8%.
Savings potential 1.5 kWh/MT cementAnnual Savings 135.00 Rs. Lakhs/annumInvestment 200.00 Rs. LakhsPayback period 18 Months
7. wHR:. The technologies available for waste heat recovery include Rankine Cycle, Organic Rankine Cycle and Kalina Cycle. Based on the chosen process and kiln technology, 8–10 kWh/t clinker can be produced from cooler exhaust air and 9–12 kWh/t clinker from the preheater gas if the moisture content in the raw material is low and only little hot gas/air for drying. In total up to 22 kWh/t clinker or about 20% of the power consumption of a cement plant can be met by using currently available waste heat recovery technologies without significant changes in kiln operation.
Savings potential 30 kWh/MT clinkerAnnual Savings 1575 Rs. Lakhs/annumInvestment 60.00 Rs. CroresPayback period 46 Months
8. Cross belt analyzer: sampling of crushed limestone or raw meal (input to the kiln) is essential to maintain stockpile quality and control chemistry of raw mix, thereby maintaining homogeneous clinker composition to meet quality requirements. Cross belt analyzers analyze the chemical properties of the materials instantaneously and direct corrective actions much quicker compared to conventional sampling and quality control methods. Cross Belt Analyzers (CBA) can be installed either in upstream of the stock pile or before the raw mill.

55Energy Benchmarking for Cement Industry
Savings potential 5 kcal/kg clkAnnual Savings 75 Rs. Lakhs/annumInvestment 200.00 Rs. LakhsPayback period 32 Months
9. AFR: Alternative fuel use in the Indian cement industry is at very low levels; the country’s average stands at less than 1% of Thermal substitution Rate (TsR). With extensive national and global expertise available, the Indian cement industry today is technically ready for adopting higher TsR rates. The increase in substitution rate will help in saving conventional energy by utilizing the waste and alternative fuels available near to the plant.
10. Energy Efficient Blowers – Normal PD blowers are operating at lower efficiency the latest trend to install energy efficient blowers which are saving more than 30% energy compared to normal standard blowers
Savings potential 0.5 kWh/MT cementAnnual Savings 45 Rs. Lakhs/annumInvestment 100.00 Rs. LakhsPayback period 27 Months
Assumptions For the analysis:Clinker Capacity - 4500 TPDClinker to Cement Factor - 0.73Cement Capacity - 2 MTPAPower Cost - Rs. 4.5/kwhCoal Cost - Rs. 1000 /Million Kcal Operating days - 330

56 Confederation of Indian IndustryCII-Sohrabji Godrej Green Business Centre
36
630
90 45 135
1575
29775 45
2928
0
500
1000
1500
2000
2500
3000
3500
Savi
ng (
Lakh
s)
96
3000
100 200 200
6000
2000200 100
11896
0
2000
4000
6000
8000
10000
12000
14000
Inve
stm
ent
(Lak
hs)

57Energy Benchmarking for Cement Industry
ANAlYSIS OF CAPTIVE POwER PlANTS
S.No Area/Equipment CFBC(kw/Mw) AFBC(kw/Mw)
1 Boiler Feed Pump (BFP) 22.60 20.00
2 secondary Air (sA) Fan/Forced Draft fan(AFBC) 6.07 10.50
3 Compressors 4.26 4.004 ACC fans 3.05 2.905 Induced draft (ID) Fan 10.50 2.506 Primary Air (PA) Fan 10.20 2.007 Water Treatment Plant (WTP ) 0.74 0.708 Coal Handling Plant (CHP) 0.61 0.70
9 Auxiliary Cooling Water Pump (ACWP) 1.56 3.10
10 Condensate Extraction Pump (CEP) 1.59 1.50
11 EsP 1.55 1.2012 Lighting 0.58 0.5013 AC & Vent 0.58 0.5014 Boiler Aux. 1.51 3.50
15 Over all Auxiliary Consumption (%) 6.53 5.36
0
5
10
15
20
25
kW/M
W
CFBC(kW/MW)AFBC(kW/MW)

58 Confederation of Indian IndustryCII-Sohrabji Godrej Green Business Centre
CASE STUDIES
Optimization of RABH Fan power consumption.
RABH fan capacity is affected by1. False air across circuit (% of false air directly indicates % of higher sEC)2. Moisture content in the Raw Material (Higher the moisture content higher
is the water vapour formation and higher the fan volume)3. Water spray in mills for bed formation (High water spray implies higher
water vapour formation and higher fan volume)4. Presence of GCT (Applicable to older plants – High water spray indicating
higher water vapour formation higher fan volume)
RABH fan head is affected by5. RABH pressure drop (Directly effects the fan power consumption)6. Fan inlet pressure (Higher the pressure drop in circuit higher is the fan
power consumption)
Other factors
7. Fan efficiency itself (To be always aimed at over 80 % especially for compound mode conditions where operating hours are higher)
The comparison among three plants are given below as an indication of the effect of each of these parameters on the RABH fan power:

59Energy Benchmarking for Cement Industry
Para
met
erPl
ant 1
52
00 T
PDPl
ant 2
93
00 T
PDPl
ant 3
46
00 T
PDBa
g ho
use
fan
pow
er d
urin
g co
mpo
und
mod
e op
erat
ion
197
KW
(Ope
ratin
g w
ith V
FD)
670
KW
(With
VFD
)33
0 K
W (W
ith G
RR)
Clin
ker p
rodu
ctio
n19
5 TP
H38
5.5
TPH
190
BH fa
n sp
ecifi
c pow
er d
ur-
ing
com
poun
d m
ode
1.01
KW
/MT
of C
linke
r1.
74 K
W/M
T of
Clin
ker
1.74
KW
/MT
of cl
inke
r
Gas
tem
pera
ture
100
Deg
C (D
ue to
dilu
tion
air
at b
ag h
ouse
inle
t)15
0 D
eg C
106
Deg
C (D
ue to
dilu
tion
air a
t bag
hou
se
inle
t)BH
fan
spec
ific fl
ow ra
te1.
96 N
m3/
Kg
clin
ker
1.73
Nm
3/kg
clin
ker
2.12
Nm
3/kg
of c
linke
rBH
fan
inle
t pre
ssur
e-1
12 m
m W
C-2
19 m
m W
C-1
02 (
at d
ampe
r inl
et) *
-175
mm
WC
at
fan
inle
t but
this
valu
e of
nee
d to
be
used
fo
r ben
chm
arki
ng a
s thi
s onl
y in
dica
tes t
he
fan
para
met
ers
BH fa
n ou
tlet p
ress
ure
-20
mm
WC
- 13
mm
WC
-15
mm
WC
False
air
acro
ss R
M7.
2 %
11
%29
.8 %
BH fa
n effi
cien
cy74
%94
%80
%PH
exi
t spe
cific
vol
ume
1.37
Nm
3/kg
clin
ker a
t 265
D
eg C
1.37
Nm
3/kg
clin
ker a
t 279
D
eg C
1.66
Nm
3/kg
clin
ker

60 Confederation of Indian IndustryCII-Sohrabji Godrej Green Business Centre
Para
met
erPl
ant 1
52
00 T
PDPl
ant 2
93
00 T
PDPl
ant 3
46
00 T
PDRe
ason
s for
hig
her p
ower
Refe
renc
e
RM F
alse
air
less
then
10
%
whi
ch is
goo
d op
erat
ing
num
-be
r Una
void
able
Fan
effici
ency
com
pare
d to
ot
her p
lant
s is l
ower
if in
-cr
ease
d to
80
%: 0
.07
KW
/MT
Avoi
dabl
e w
ith ch
ange
in n
ew
fan
Fres
h ai
r int
ake
whi
ch is
una
-vo
idab
le to
mai
ntai
n ba
g fa
bric
re
quire
men
t (C
onsid
erin
g 5
%
of to
tal v
olum
e: 0
.05
KW
/MT)
Avoi
dabl
e w
ith ch
ange
in n
ew
type
of b
ags
so e
quiv
alen
t sEC
all
thes
e ch
ange
s wou
ld b
e: 0
.89
KW
/M
T of
clin
ker
Hig
h BH
fan
inle
t pre
ssur
e (a
lmos
t hig
her b
y 10
0 m
m W
C
com
pare
d to
refe
renc
e pl
ant
lead
ing
to h
ighe
r pow
er co
n-su
mpt
ion)
Incr
ease
in p
ower
due
to h
ighe
r fa
n in
let p
ress
ure
= (2
19-1
20) =
99
mm
WC
= 4
8 %
of f
an p
ower
so e
quiv
alen
t sEC
with
120
m
m W
C b
ag h
ouse
fan
inle
t su
ctio
n w
ould
be:
0.9
0 K
W/M
T of
clin
ker
Hig
h m
oist
ure
in ra
w m
ater
ial l
eadi
ng to
in
crea
sed
air q
uant
ity (8
% M
oist
ure
: 26
TPH
wat
er. 2
6*12
40 =
332
40 N
m3
of w
ater
va
pour
acc
ount
ing
to 8
% o
f vol
ume
: 0.1
34
KW
/MT)
Una
void
able
Hig
h fa
lse a
ir ac
ross
raw
mill
(Con
sider
ing
10 %
of t
he fa
lse a
ir re
duct
ion:
0.1
74 K
W/
MT)
Avoi
dabl
e
Fres
h ai
r int
ake
whi
ch is
una
void
able
to
mai
ntai
n ba
g fa
bric
requ
irem
ent (
Con
sid-
erin
g 5
% o
f tot
al v
olum
e: 0
.085
KW
/MT)
Avoi
dabl
e w
ith ch
ange
in n
ew ty
pe o
f bag
s
Dam
per o
pera
tion
incr
easin
g fa
n po
wer
(0
.14
KW
/MT
loss
)
Avoi
dabl
e w
ith in
stal
latio
n of
new
driv
es
so e
quiv
alen
t pow
er w
ith a
ll th
ese
redu
c-tio
n w
ould
be:
1.7
4-0.
134-
0.17
4-0.
85-0
.14
= 1.
2 K
W/M
T

61Energy Benchmarking for Cement Industry
Optimization of the Preheater fan power consumption:
PH fan capacity is affected by
1. Raw material composition itself but almost same composition is used in Indian Plants. * cannot be altered much
2. False air across preheater (% of false air directly indicates % of higher SEC)
3. Fine coal moisture content (High moisture content means higher water vapour formation and higher fan volume) * not a very major criteria
4. Raw meal moisture content (High moisture content means higher water vapour formation and higher fan volume) * not a very major criteria
5. Excess air maintained in case of AFR firing in calciner (Applicable only to plants using higher thermal substitution rates) * not a very major criteria
PH fan head is affected by
1. Number of stages
2. Type of cyclones (LP or HP)
3. Some plants have very high Preheater height for achieving higher thermal efficiency, here the savings achieved through thermal efficiency is much higher then the loss associated with the pressure drop
4. Downcomer duct velocity (Higher velocity leads to higher pressure drop thereby higher fan head) * Some plants have very high PH height for achieving higher thermal efficiency can simultaneously effect back in higher pressure drop
PH Exit returns dust quantity
1. Lower top cyclone efficiency can lead to higher return dust which affects the exit gas density. Higher the return dust higher is the gas density resulting in- higher power consumption of PH fan to handle the gas. It additionally causes higher pressure drop across downcomer duct.
2. Higher top cyclone efficiency gives more benefits in case of thermal energy consumption.
3. Fan efficiency itself (To be always aimed at over 80 %)
The comparison among three plants are given below as an indication of the effect of each of these parameters on the PH fan power:

62 Confederation of Indian IndustryCII-Sohrabji Godrej Green Business Centre
Para
met
erPl
ant 1
52
00 T
PDPl
ant 2
93
00 T
PDPl
ant 3
45
00 T
PDPH
fan
pow
er d
urin
g co
mpo
und
mod
e op
erat
ion
1040
KW
(Ope
ratin
g w
ith V
FD)
2189
KW
(With
VFD
)11
95 K
W
Clin
ker p
rodu
ctio
n19
5 TP
H38
5.5
TPH
188.
7PH
spec
ific p
ower
4.77
KW
/MT
of C
linke
r5.
67 K
W/M
T of
Clin
ker
6.33
KW
/MT
of cl
inke
rN
umbe
r of S
tage
s6
stag
e IL
C
6 st
age
SLC
5 St
age
ILC
(5 S
tage
due
to h
igh
limes
tone
m
oist
ure
dryi
ng re
quire
men
t in
raw
mill
)G
as te
mpe
ratu
re26
5 D
eg C
27
9 D
eg C
339
Deg
C
PH sp
ecifi
c flow
rate
1.36
Nm
3/K
g cl
inke
r1.
37 N
m3/
kg cl
inke
r1.
46 N
m3/
kg o
f clin
ker
PH F
an in
let p
ress
ure
-506
mm
WC
- 580
mm
WC
-535
( at
dam
per i
nlet
)*-
585
mm
WC
at fa
n in
let b
ut
this
valu
e of
nee
d to
be
used
for
benc
hmar
king
as t
his o
nly
indi
-ca
tes t
he fa
n pa
ram
eter
sPH
fan
outle
t pre
ssur
e-1
8 m
m W
C- 3
0 m
m W
C-4
0 m
m W
CFa
lse a
ir ac
ross
PH
2.58
%Ex
act n
umbe
r not
avai
labl
eEx
act n
umbe
r not
avai
labl
ePH
fan
effici
ency
85
.4 %
87.7
%90
%

63Energy Benchmarking for Cement Industry
Para
met
erPl
ant 1
52
00 T
PDPl
ant 2
93
00 T
PDPl
ant 3
45
00 T
PDRe
ason
s for
hig
her p
ower
Refe
renc
ePH
hei
ght i
n ex
cess
of 1
50 m
be
st k
now
n nu
mbe
r for
med
ium
ca
paci
ty k
iln
Dow
ncom
er d
uct v
eloc
ity: 1
7.5
m/s
Hig
h PH
fan
inle
t pre
ssur
e (a
l-m
ost h
ighe
r by
74 m
m W
C co
m-
pare
d to
refe
renc
e pl
ant l
eadi
ng
to h
ighe
r pow
er co
nsum
ptio
n)In
crea
se in
pow
er d
ue to
hig
her
fan
inle
t pre
ssur
e=
(580
-506
) = 7
4 m
m W
C=
13 %
of f
an p
ower
= 0.
74 K
W/M
TSo
equ
ival
ent S
EC w
ith lo
wer
pr
essu
re d
rop
acro
ss p
rehe
ater
w
ould
be:
5.6
7 –
0.74
= 4.
93 K
W/
MT
of cl
inke
r
Dow
ncom
er d
uct v
eloc
ity: 1
8.8
m/s
Hig
h fa
lse a
ir ac
ross
raw
mill
pre
-he
ater
resu
lting
in h
ighe
r spe
cific
ex
it ga
s vol
ume
If co
mpa
red
with
1.3
7 N
m3/
kg
clin
ker t
he e
xces
s gas
vol
ume
ac-
coun
ts to
(1.4
6-1.
37)=
0.0
9 N
m3/
kg cl
inke
r fa
lse a
ir/ex
cess
air
anyo
neSE
C e
ffect
: 0.3
9 K
W/M
TAv
oida
ble
Dam
per l
oss i
s 50
mm
WC
.D
ampe
r ope
ratio
n in
crea
sing
fan
pow
er (0
.51
KW
/MT
loss
)Av
oida
ble
with
inst
alla
tion
of n
ew
driv
esSo
equ
ival
ent p
ower
with
all
thes
e re
duct
ion
wou
ld b
e: 6
.33-
0.39
-0.
51 =
5.4
3 K
W/M
T of
clin
ker

64 Confederation of Indian IndustryCII-Sohrabji Godrej Green Business Centre
RAW
MIL
L SE
C AN
ALYS
IS
Plan
t Nam
e
Plan
t -1
Plan
t -2
Plan
t -3
Plan
t -4
Plan
t -5
Plan
t -6
Plan
t -7
Plan
t -8
Plan
t -9
Mill
Typ
e
LM 4
6.4
LM 3
0.3
Ato
x 45
LM 3
6.4
Poly
sius
Poly
sius
Ato
x 47
.5C
hine
se
mak
eA
tox
55
Mill
out
put
TPH
304
205
285
230
330
225
325
155
410
Lim
esto
ne
moi
stur
e%
1111
1
110
11
1
Mill
fan
SEC
7.
159.
675.
265.
659.
1410
.64
8.44
8.22
9.94
Mill
Driv
e SE
C
4.62
3.4
9.3
9.15
7.55
6.49
9.36
10.3
410
.78
Aux
(Boo
ster
fa
n +
clas
sifier
)
0.43
0.26
0.12
0.08
0.35
0.53
0.21
0.21
0.20
Tota
l SEC
12
.20
13.3
314
.68
14.8
817
.04
17.6
618
.01
18.7
720
.92
Fan
inle
t flow
m3/
hr73
4276
3916
9961
5933
4051
2983
6725
6446
5685
4245
4169
2611
0690
4Fa
n in
let fl
owN
m3/
hr50
3300
2666
2443
4565
2786
1451
6441
4150
7956
4933
2731
7277
3081
False
air
(mill
in
let t
o fa
n in
let)
%21
.427
24.4
39.2
15.4
5223
.523
.4
Sepa
rato
r lo
adin
ggm
s mtr
l/m
3 ai
r41
452
346
356
839
434
938
037
237
0
Noz
zle
ring
ve
loci
tym
/s54
.549
.635
.26
3068
26.5
51.4
643
.551
.01

65Energy Benchmarking for Cement Industry
Plan
t Nam
e
Plan
t -1
Plan
t -2
Plan
t -3
Plan
t -4
Plan
t -5
Plan
t -6
Plan
t -7
Plan
t -8
Plan
t -9
Mill
DP
mm
Wc
740
900
540
670
730
800
600
450
740
Pres
sure
dro
p fr
om m
ill
outle
t to
fan
inle
t
mm
Wc
155
(140
m
mW
c ac
ross
cy
clon
e)
220
(140
m
mW
c ac
ross
cy
clon
e)
133
(80
mm
Wc
acro
ss
cycl
one)
190
(140
m
mW
c ac
ross
the
cycl
one)
220
(170
m
mW
c ac
ross
cy
clon
e)
150
(ESP
in
the
circ
uit
in p
lace
of
cycl
ones
)
280
(250
m
mW
c ac
ross
cy
clon
e)
125
220
(143
m
mW
c ac
ross
cy
clon
e &
60
mm
Wc
acro
ss
Vent
uri)
Raw
mill
Fan
effi
cien
cy%
89.8
76.7
9395
84.5
89.1
9370
.96
81.8
Spee
d co
ntro
l in
fan
V
FDSP
RSLR
C
GRR
GRR
GRR
GRR
SPRS
VFD
Dam
per l
oss
acro
ss fa
n%
Nil
4.6
102
nil
27
5.5
nil

66 Confederation of Indian IndustryCII-Sohrabji Godrej Green Business Centre
The major power consumption in VRM is Mill main drive & Mill fan. As can be seen in the above case studies of different plants, Raw mill (VRM) power consumption depends on the following parameters
1) Limestone hardness: As seen in above data, the plants with soft limestone has lower specific power consumption of mill main drive, the range varies from 3.4 kWh/MT to 6.5 kWh/MT where as the plants which has hard limestone the sEC of mill drive is in the range of 7.5 to 10.5 kWh/MT
2) Power consumption of mill fan depends on the following parameters:
a) Volume handled by the fanb) Nozzle ring velocityc) separator loadingd) Pressure drop across the mill and cyclonese) False air in the circuitf) speed control type in the fan
3) Volume handled by the fan: The air volume in the mill circuit depends on
a) Nozzle ring velocityb) Drying requirementc) separator loading
4) The optimum nozzle ring velocity to be maintained in the mill is 45-55 m/s. Maintaining low velocity will affect the separation in the mill and increase the rejects at mill bottom. On the other hand maintaining high velocity will increase the DP which in turn increase the fan power. Pressure drop across the mill increases with the increase in the nozzle ring velocity which is also indicated in the above table. As seen in the above table two plants are maintaining the nozzle ring velocity in the range of 30-35 m/s and so the mill fan sEC is in the range of 5.3 to 5.7 kWh/MT clinker where as the mill drive sEC is high in the range of 9.15-9.3 kWh/MT due to increase in the rejects.
5) separator performance will also affect the sEC of mill fan. The high efficiency separator will operate with separator loading of >500 gms/m3. As seen in the above table the plants which is having separtor loading in the range of 460-560 gms/m3 is operating with low sEC in mill fan. One of the plant is having separator loading of 523 gms/m3 but the fan sEC is on the higher side due to high pressure drop from mill outlet to fan inlet.
6) The plants which have high moisture in the limestone has to maintain the required volume at mill inlet to remove the moisture in the feed. Limestone with high moisture needs more heat at the mill inlet. Though the volume of gas will remain the same for mills with more and less moisture the gas composition will be only PH gas for high moisture and more recirculation and less PH gas for mills with less moisture.

67Energy Benchmarking for Cement Industry
7) False air in the circuit will affect the separator only if the false air is after mill outlet. Reducing false air will not change mill fan power as the volume is controlled by 3 factors mentioned earlier and the total volume remains constant however mill output can get affected. False air in raw mill circuit will increase the Kiln/Bag house fan power. If the drying requirement is the main criteria then false air in the circuit should be as low as possible. As seen in the above table one of the plant is maintaining the lowest false air of only 15% across the circuit. The false air % as indicated in the above table does not include the fresh air at mill inlet.
8) The pressure drop in the mill circuit will also affect the fan sEC. The pressure drop in the circuit will depends on the cyclone pressure and duct pressure. The pressure drop across the cyclone should be in the range of 80-90 mmWc. As seen in the above table one of the plant is having pressure drop of only 80 mmWc across cyclone. CFD study could be useful to optimize the pressure drop in the ducts, cyclone and separator. Use of low pressure drop cyclone and efficient separator can optimize the mill fan power.
9) sEC depends on the fan performance: Parameters to be observed seen are the fan efficiency (>85%), damper loss, fan inlet velocity and type of speed control installed in the fan. In majority of the cases the fan efficiency is in the range of 80% and above. Damper loss in the fan operating with Louvre type damper should not be more than 10-15 mmWc. Although raw mill fan generally operates with full volume but in some cases the type of speed control installed in the fan will also affect the fan sEC. Fan operating with GRR speed control could be replaced with VFD control

68 Confederation of Indian IndustryCII-Sohrabji Godrej Green Business Centre
CEM
ENT
MIl
l -B
All
MIl
l SE
PAR
AT
OR
FA
N A
NA
lYSI
S
Para
met
er
Plan
t-1Pl
ant-2
Plan
t-3
Plan
t-4
Plan
t-5
Plan
t-6
Plan
t-7Pl
ant-
8Pl
ant-
9Pl
ant-1
0O
pera
ting
capa
city
TP
H10
575
8090
8014
015
216
495
260
Sepa
rato
r fan
flow
m3/
hr21
1016
1447
1713
4091
1415
9813
8206
2350
9822
1511
2608
1411
1371
4962
25
Spec
ific l
oadi
ngK
g m
ater
ial/
m3
0.50
0.52
0.60
0.64
0.58
0.60
0.68
0.62
0.85
30.
524
Ope
ratin
g Fa
n po
wer
kW38
227
222
3.16
224.
2025
2.00
326.
8917
9.00
301.
0013
494
3Sp
.Ene
rgy
cons
umpt
ionS
epar
ator
fa
nK
W/M
T3.
643.
632.
792.
493.
002.
331.
21.
81.
43.
6
Fan
inle
t pre
ssur
em
mw
g-5
24.0
0-5
55.0
0-4
84.0
0-4
62.0
0-4
58.0
0-3
40.0
0-2
48.0
0-3
42.0
0-4
25-6
70Fa
n Effi
cien
cy%
76.6
684
.01
78.9
987
.28
72.0
065
.00
84.2
583
.41
9593
Fan
spee
d co
ntro
l
Dam
per
Dam
per
GR
RG
RR
GR
R
GR
RG
RR
GR
RG
RR
Velc
oity
in fa
n in
let
duct
m/s
13.0
013
.00
1818
2015
1417
2020
Loss
acr
oss d
ampe
r on
fan
head
%34
32-
--
--
-4
3
Per
cent
age
of S
epar
ator
re
ject
pas
sing
on
45
mic
ron
%38
2037
3334
3021
4020
15
Cir
cula
tion
load
3.
41.
22.
72.
52.
32.
13
2.7
1.5
1.4

69Energy Benchmarking for Cement Industry
Reasons for higher power consumption in fan
1. Type of speed control for fan
2. Velocity of gas in the fan inlet duct
3. Higher fan inlet suction(Due to system resistance)
4. Operating efficiency of the fan
5. Low specific loading (Specific loading should in the range of 0.6 kg material/m3)
6. False air after classifier
Mill performance affected by
1. Velocity inside mill( Std 1.2 m/s) - Maintaining the correct velocity will lead to Reduction in <3 microns fraction in mill out put,increase mill output rate and improve overall mill performance
2. Sp surface area of grindng media in second chamber (40 m2/Ton)
3. % filling of GM - 28-30% is the ideal mill filling level
Performance of classifier
1. Separtor performance residue on -45 Mic
2. Circulation load (separator feed/separator product)
3. Lesser specific loading (kg of material/m3) 0.6 kg material/m3 is the standard for specific loading
4. False air after mill

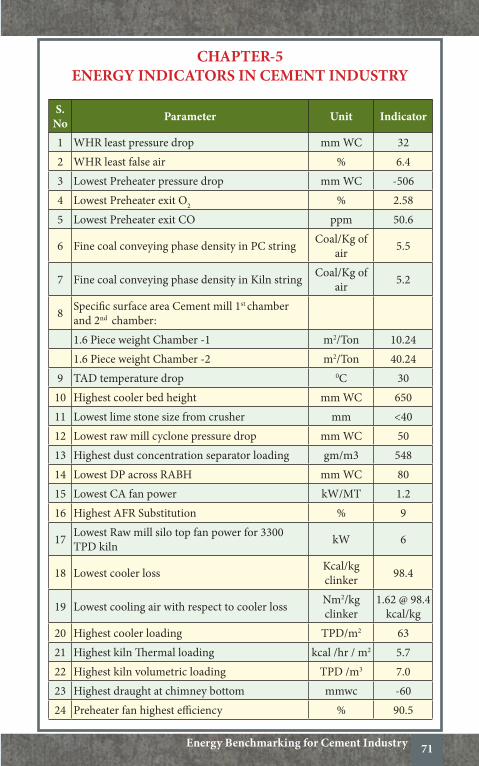
71Energy Benchmarking for Cement Industry
CHAPTER-5ENERGY INDICATORS IN CEMENT INDUSTRY
S. No Parameter Unit Indicator
1 WHR least pressure drop mm WC 322 WHR least false air % 6.43 Lowest Preheater pressure drop mm WC -5064 Lowest Preheater exit O2 % 2.585 Lowest Preheater exit CO ppm 50.6
6 Fine coal conveying phase density in PC string Coal/Kg of air 5.5
7 Fine coal conveying phase density in Kiln string Coal/Kg of air 5.2
8 specific surface area Cement mill 1st chamber and 2nd chamber:1.6 Piece weight Chamber -1 m2/Ton 10.241.6 Piece weight Chamber -2 m2/Ton 40.24
9 TAD temperature drop 0C 3010 Highest cooler bed height mm WC 65011 Lowest lime stone size from crusher mm <4012 Lowest raw mill cyclone pressure drop mm WC 5013 Highest dust concentration separator loading gm/m3 54814 Lowest DP across RABH mm WC 8015 Lowest CA fan power kW/MT 1.216 Highest AFR substitution % 9
17 Lowest Raw mill silo top fan power for 3300 TPD kiln kW 6
18 Lowest cooler loss Kcal/kg clinker 98.4
19 Lowest cooling air with respect to cooler loss Nm2/kg clinker
1.62 @ 98.4 kcal/kg
20 Highest cooler loading TPD/m2 6321 Highest kiln Thermal loading kcal /hr / m2 5.722 Highest kiln volumetric loading TPD /m3 7.023 Highest draught at chimney bottom mmwc -6024 Preheater fan highest efficiency % 90.5

72 Confederation of Indian IndustryCII-Sohrabji Godrej Green Business Centre
S. No Parameter Unit Indicator
25 Raw Mill fan highest efficiency % 87.426 Cement Mill fan highest efficiency % 88.027 Highest Fly Ash addition % 3328 Highest slag addition % 5529 Best top cyclone efficiency % 97.0530 Lowest VRM false air
subtracting feed moisture evaporation, water spray evaporation, seal air fan % 7.21
Raw Mill VRM % 13.04Cement Mill VRM % 13.20
31 Lowest Preheater fan specific power kW/MT Clinker 3.64
32 Lowest electric distribution losses % 3.233 Lowest Capacitor power loss w/KVAR 334 Optimum voltage for lamps V 210
35 Lowest frequency maintained for CPP operating in island mode Hz 48.8
36 Best efficiency of motors in LT & HT % 97.137 Lowest VFD loss and sPRs loss % 3/4
38 Lowest lighting load (kW) or sEC Kw/MT cement 0.5
39 Lowest harmonic distortion in Cooler fans (V/I) % 2/8
40 Highest capacity of Renewable energy in onsite installation MW 5.75
41 Highest power factor in CPP in Island mode - 0.9742 Lowest compressor air generation pressure bar 5.5
43 Lowest pressure drop in compressed air distribution system bar 0.1
44 Lowest pressure drop across dryer bar 0.145 Lowest CPP auxiliary power consumption
AFBC % 5.36CFBC % 6.53
46 Lowest Cooling water flow in Pyro, cement mill and compressors
m3/MT of clinker 1.5

73Energy Benchmarking for Cement Industry
S. No Parameter Unit Indicator
47 Lowest fly ash unloading power both reciprocating and screw kW/MT 0.7
48 Lowest Conveying pressure from Esp hopper to bunker in cpp bar 3
49 Lowest sEC for blower @1 bar kW/MT coal 1.1
50 Lowest compressor air load Cement mill, CPP and Pyro for 4200 TPD plant CFM 2450
51 Lowest excess air in CPPIndian Coal % 2.5Pet Coke % 2.8
52 Lowest heat rate in CPP < 30 MW kcal/Mwh 300753 Lowest primary air
Indian Coal % 19.74Pet Coke % 12.94
54 Lowest pressure drop between BFP and drum pressure Bar 10
55 Lowest pressure drop in flue gas path mm WC 6456 Lowest Cooling water circulation sEC m3/MW 23957 Lowest auxiliary cooling water circulation m3/MW 10.5


75Energy Benchmarking for Cement Industry
CHAPTER-6BEST PRACTICES IN CEMENT INDUSTRY
MINES 1. Using CAP for reducing the fly rock and improving Powder factor2. Using automation for improving the truck performance3. Using software to enhance mines life4. Using mines land for RE installation5. Using mines land for Energy Plantation6. By changing blasting technology from top initiation system to bottom
initiation system through Nonel shock tubes, crusher input size reduced and output increased from 7ton to 10ton per kg of blasting.
7. By the compaction of the floor of the benches diesel consumption of the transport equipment had been reduced from 22ltr/hr to 18ltr/hr.
8. surface Mining by use of surface Miner for soft and medium hard materials 9. Use of Mega Rock Breaker10. Reducing Moisture content of materials by trench cutting and de watering
CRUSHER & PRE BlENDING 11. Utilizing beneficiation plant for processing low grade limestone12. Using wobbler for to by pass under size through the crusher13. Using VFD for crusher bag filter fan14. Installing VFD for crusher compressor15. Installating Cross Belt Analyzer for optimizing the mines life16. Interlocking Crusher fan speed with crusher feed belt RPM17. Crusher output size reduction to get benefit in VRM & Crusher18. Interlocking crusher feeder rpm with crusher load to optimize loading19. Installation of Material starvation switch in belt conveyors to avoid idle
running20. Installation of Light pipe for stacker21. Installation of Cross Belt analyzer for Coal 22. Power saved by pile changeover in online (without stopping the crusher).
Due to this avoided idle run hours during stop seq.+ idle run hours of stacker during pile change over + idle run hours of stacker & transport during start up.
23. Power saved by stacker hydraulic pump through logic modification.24. P&V motor switching off after the end of “B” shift due to no “C “shift
operation at Crusher-1 & 2.25. Providing heating system and hydraulic scrapper at wobblers to increase
crusher productivity. 26. To operate Limestone crusher from Central control room to facilitate people

76 Confederation of Indian IndustryCII-Sohrabji Godrej Green Business Centre
development-Earlier there was local control for crusher operation and one operator per shift was required for the same. High levels of noise was common in the area. To carry out proposed improvements/changes a team was formed, which carried out all the concerned activities in house without the support of any consultant. First an optical fiber cable from Ls crusher to CCR was laid and HMI of Control system and the weighbridge was given to CCR. IP cameras were installed at all the three locations to monitor Apron feeder, Dump hopper and weighbridge from CCR. BENEFITS:a. The Ls crusher operator’s who were operating the crusher in high sound
area were shifted to CCR and now they have learnt other operations of the main plant and improved their knowledge.
b. The Ls crusher operators are now able to operate Cement mills and Raw mills independently.
c. Operation of complete plant from a single location. d. Availability of the data at a single location.
27. Automation of Mines weighbridge by installation of RF ID card reader system.
28. Installation of Radar level monitoring system in Crusher Dump Hopper29. Installation of VFD to reclaimer.30. All additives belts are covered with GI sheets to feed moisture free material
in rainy season.31. Crusher Productivity has been improved by maintaining the constant bed
level, an interlock is provided to stop the crusher apron feeder based on the apron feeder current
32. Ensuring sufficient amount of material availability before starting the crusher for continuous operation
33. Use of Compound Impactor (Two stage Crushing) to achieve lowest power consumption with best size reduction ratio suitable for Vertical Roller Mill for Raw grinding.
34. Use of sizer type Crushers for soft and medium Hard materials
RAw MIll-BAll MIll 35. Installation of Tertiary crusher for increasing the mill output36. Installation of Cross Belt Analyzer for on line quality control37. Installation of Boltless Classifying liner38. Mill level control system based on vibrations instead of acoustic control39. shorter length of drying chamber to increase output40. Mono chamber for mills with HPRG41. HPRG in finishing mode42. High separator loading 43. Bucket type belt conveyor in place of metallic conveyor

77Energy Benchmarking for Cement Industry
44. VFD for Raw meal silo top bag filter fan45. Adaptive predictive control system for mill operation46. VFD for separator fan, mill vent fan, sept vent fan47. Air slide fans with pressure less than 250 mmwg for fine material air slide
and 350 mmwg for separator reject air slide48. Low pressure drop cyclones49. Rotary Air Lock for mill feed to reduce false air50. Reject sample analysis on 90 micron daily basis to optimize sep performance51. The plant stopped Nib trap blower and air is taken from air slide blower and
thus we saved 2 kW power per hour in raw mill.52. Optimized the silo dust collector by introducing VFD for bag filter fan 53. Use of filter bags with moisture and Oil repellent finish
RAw MIll - VRM54. Mill Louvre velocity in the optimum range 45 -55 m/sec55. Maximum sep Loading gm / m3 of air56. Low pressure drop cyclones57. Rotary Air Valve for mill feed to reduce false air58. Blocking the louvre below the rollers and optimizing the flow59. Vera bar for flow measurement in place of orifice and venturi60. VFD for raw mill fan61. Cross belt analyzer at mill feed belt for online quality control62. Low false air across mill circuit63. Reducing feed size in line with crusher for total power reduction64. Adaptive Predictive control system for mill65. Minimum continuous recirculation in Mill rejects (10 – 30%)66. Vortex rectifier for reducing the pressure drop across the classifier67. Carrying out CFD for optimum pressure drop in the ducts68. Interlock has been made seal air fan sTOP with 1 hr delay after mill stop
of Raw mill69. Air slide blowers 12 No optimized in phase II raw meal transport system.70. Process optimization done by reducing raw mill dam ring height & mill feed
size.71. In belt discharge chutes provided self cleaning spring loaded plates provided
to avoid coating/jamming72. Reduction in false air by 3% by replacing of rubber dampers in VRM circuit.73. Installation of air blasters, ss chute, polymer liners in limestone hopper and
reclaimer discharge chute to avoid jamming74. Usage of Feldspar in raw mix grinding to mitigate the effect of sulfur from
pet coke75. Installation of sinter cast liners for Table & Roller to increase the life and to

78 Confederation of Indian IndustryCII-Sohrabji Godrej Green Business Centre
reduce the Downtime hours.76. Mill Reject system running based on Reject Chute Level & Timer switch
instead of continuous operation.77. Expert Optimizer had been installed to reduce the standard deviation in the
product results and for consistency in output.78. Low pressure off line Pulse jet cleaning – especially suitable for Glass fibre
bags( bag specific weight 750gms/m2) to get lower pres-sure drop & longer life without loss in performance
79. Fully welded cast steel table liner and roller tyres for low wear rate and longer mill availability
COAl MIll 80. Installation of additional crusher for reducing the size81. Vibration based control system for mill filling82. Optimum drying chamber for reducing the output83. VFD for Mill fan and booster fan84. Rotary Air Lock for mill feed to reduce the pressure drop85. Optimum phase density in fine coal conveying86. Energy efficient blower instead of PD blower87. Reject sample analysis on 90 micron daily basis to optimize sep performance88. Vera bar in place of venturi and orifice89. High residue for calciner firing compared with kiln firing90. GRR introduced for Coal Mill-drive to control speed to grind Pet coke91. High efficiency dynamic classifier in place of static Vane Grit separator (for
ball mill circuit)
PYRO PROCESSING92. Optimum excess air at preheater outlet93. Reduce false air across pre heater circuit94. VFD for preheater fan, Cooler vent fan and cooler fans95. Low pressure drop cyclones96. Low pressure drop across down comer duct97. High efficiency cyclone in the top stage98. Low thermal conductivity bricks in the kiln inlet and calcining zone99. High momentum burner with AFR usage100. Low suction loss in cooler fans101. Optimum clinker bed height for improved cooler efficiency102. Optimum charge ratio for EsP for better emission control103. Chimney draught for reducing the cooler vent fan power consumption104. Adaptive Predictive control system to improve efficiency105. Installation of WHR for utilizing waste heat
79Energy Benchmarking for Cement Industry
106. Installation of VFD for shell cooling fan and auto control with shell temperature
107. Installation of Graphite sealing system for kiln inlet and outlet seal108. Installation of slide gate instead of multi Louvre damper in pre heater fans
with sPRs / GRR109. CFD analysis of cyclones to improve heat transfer, cyclone efficiency110. Optimum feeder box height for better heat transfer in riser ducts111. Low temperature drop in Tertiary Air Duct112. Better sealing arrangement for camera, pyrometer in kiln hood113. Timer based operation for screw conveyors below Cooler EsP, RABH114. Increasing chimney height to reduce power consumption115. Optimizing RA fan with VFD for reducing RABH fan power consumption116. Use of Effluent water for cooler spray117. Low capacity pump for GCT and cooler to avoid recirculation118. Low pressure drop and false air across WHR boiler119. Low pressure drop across cooler fans silencer120. Installed VFD for kiln feed aeration blower to operate in required pressure
& speed.121. Coal conveying pipe size reduced to getting required velocity122. 5th Cyclone inlet area reduced (at bottom entrance) for both strings to
increase inlet velocity and to avoid material surges from this cyclone.123. To reduce the pressure drop across PH down comer, installed baffle plates
at PH top of DC duct.124. substitution of Industrial waste as Alternate fuel. (Highest consumption in
TsR basis in India)125. Provided C3 clearance Bearings in F.K Pump for avoiding abnormal sound
and vibration126. Grease distributer is provided for uniform grease spray throughout the
width of the gear/pinion and proximity is provided at distributor plunger to sense its operation. If there is no flow proximity will sense thereby avoid girth gear running without grease
127. Cooler Mid hot air connected to raw mill to dry limestone.128. Addition of Horicon (cyclone) in top stage to reduce pressure drop and
minimize dust loss.129. Kiln feed LsF standard deviation has been achieved up to 1.4 through
optimization of blending silo extraction cycle 130. Used the un burnt fly ash as fuel 131. silo extraction standard deviation of Cao is <0.15. 132. Installed with a Knock out chamber in TAD take off to reduce the Clinker
fine dust re entrainment into the Preheater133. Belt Bucket Elevator with steel chord134. PH down comer duct sizing : Duct inside gas velocity can be kept at <10
m/sec to minimize the pressure drop and to save PH fan power(applicable

80 Confederation of Indian IndustryCII-Sohrabji Godrej Green Business Centre
where the power cost is > 10 Us Cents per kwh135. Use of Natural Pozzolana like Riyolite, Pumice and Basaltic scoria as silica
substitute in Raw mix for Clinkerisation to reduce the energy consumption and increase production
CEMENT MIll136. HPRG for pre grinding137. separator for HPRG for overall performance138. Diverting HPRG sep reject for another mill to optimize overall circuit139. VFD For separator , mill vent and sep vent fans140. Dry fly ash bin at 20 m near mill for optimizing power and use of energy
efficient blower for fly ash unloading141. Fly ash feeding at mill outlet142. Air seal / felt seal in separator to reduce fines in reject143. sep vent in the range of 10 -15 % of separator fan flow144. Low pressure drop across separator circuit (cyclone, separator, duct)145. CFD for ducts and cyclones for optimizing pressure drop146. Adaptive predictive control system147. Lower size grinding media in second chamber148. Mill fill control system using vibration measurement149. Residue control instead of Blaine control150. Hydraulic pressure of roller press reduced from L1-130 to 90 & L2-140-
100bar to avoiding initial trippings151. Interlock has been made RP motor cooling fans stop 1hr time delay after
RP stop.152. Interlock has been made Bag house heaters automatically stop 1hr delay
after the mill stops.153. Cement VRM support to run without hot gas by replacement of hydro-
pneumatic spring type HsLM in place of conventional hydraulic type HsLM. Thermal Energy saving achieved.
154. Mill de-dusting discharge material directly goes with mill fresh feed in CM3.It has been observed that mill running with unstable and tripping 2-3 times in a day. Redirected de-dusting discharge material to classifier. Benefits,(i) Mill tripping avoided (ii) Initial startup & Aux power saving.
155. Provided auto skewing adjustment arrangement for Roller Press.156. Cement Mill slide shoe bearing interlock modification. If any LP Pump trip,
automatically HP Pump should run to avoid tripping of Mill.157. Use of problem solving tools (six sigma, RCM etc) for elimination of chronic
problems. 158. Elevator installed in place of pneumatic conveying system for fly ash
unloading.159. Every 45 days roller profiling is done for both rollers of Roller press in CM-1
& 2 circuits.

81Energy Benchmarking for Cement Industry
160. Grinding media makeup charge as per requirement (Blaine /residue graphs).161. Auto reversal of mill feed rotary air lock to avoid stoppage due to rotary air
lock stalling162. No Preheating before start up of mill (No Hot gas generator used)163. Online monitoring of Nitrogen pressure in accumulators164. separate grinding and Blending of additive materials
PACKING HOUSE165. Air slide fans for silo extraction instead of compressed air / blower166. Blower for packing machine feed bin (surge hopper) extraction instead of
compressed air167. Packer fan volume 2000m3/ hr / spout consuming 1.9 kW/ spout /hr168. Low false air across packer bag filter169. VFD for packer fan and interlock with machine operation170. Material starvation switch in belt conveyors to avoid idle running171. Open wagon loading172. All 10 no. packers are upgraded with EEL packers to reduce the weight
variation.173. Truck loading de-dusting system interlock is provided whenever truck
loading is stop.174. Auto flushing system provided for bag printing machine.175. Zero velocity chute provided in Packing Plant vibrating screen to increase
the life.176. Cleaning compressor, 18.5 kW stopped in packing plant & 2.2 kW blower
arranged for cleaning purposes and saved Rs. 8.39 Lakhs annually.177. Online branding system to reduce man power.178. Installation of VFD for compressors & an interlock is provided with no. of
packers running for reduction of specific power consumption179. All discharge chutes are lined with ceramic pad to reduce the bag burstage180. Conversion of truck loader inclined belt from rough top to fish bone type
belt to reduce bag burstage181. Regular cleaning of spouts in every shift.182. Installation of electronic bag counting mechanism before truck loading
machine.183. Use of small capacity compressor for single plant operation.184. Floor sweeper for spillage Cement collection185. Vacuum Cleaning system for spillage Recovery
COMPRESSOR186. Generation pressure at 5.5 bar irrespective of the section 187. VFD for compressor

82 Confederation of Indian IndustryCII-Sohrabji Godrej Green Business Centre
188. LP compressor for fly ash unloading189. Dedicated compressor operating at 4.0 bar for Pulse jet kiln bag house190. Red tag system for minimizing and reducing leakages191. Level based drain valve instead of timer192. Demand side / supply side controller to optimize power193. Centrifugal compressor for base load in multiple kiln in single location194. HOC dryer instead of refrigerant dryer195. Energy efficient blower at 0.8 bar for fly ash unloading196. Optimized the ideal running of ELGI compressor’s dryer through interlock
and saved 3kW per hour.197. Reduced the pressure drop across filter and optimized the pressure setting of
compressors and saved 25 kW per hour.198. screw Compressor in place of Reciprocating compressor for sustained
volumetric efficiency and energy saving199. Decentralized Compressed air generation according to consumer capacity
PUMPS 200. Level based auto control instead of manual control201. Booster pump for high head low volume users like separator Gear box202. sand filter recirculation based on online turbidity measurement203. High Energy efficient pumps204. Online water flow meter 205. submersible pumps for mines dewatering206. Optimized the operation of cooling tower during winter and stoppages of
cement mill and saved 2 kW power per hour.207. Installed smaller water pump (18 kW) for usage during plant shutdown
instead of 60 kW water pump (during kiln running) 208. Gas conditioning in Cooler & Raw mill is being done with the Treated sTP
water.209. Water treatment plant’s rejects, Boiler Blow down & cooling tower blow
down water is being used for Gas conditioning in Cooler, Raw mill & Dust suppression
210. Reducing the specific water consumption from the level of 0.22 m3 per ton of cement to 0.18 m3 per ton of cement
ElECTRICAl DISTRIBUTION 211. Installation of lighting transformer and maintaining optimum lighting
voltage 212. Install Auto power factor controller and maintain unity power factor213. Optimize the frequency of turbo generator (In island mode only)214. Install LED lamps with solar PV for colony and remote street lighting215. Replace the old rewound motors with Energy Efficient IE3 motors

83Energy Benchmarking for Cement Industry
216. Install Intelligent MCC Controls217. speed control through GRR with 20 – 100% speed variation where VFD is
not available218. Interlock the GRR cooling fans operation with GRR panel temperature219. Replace the T12 or T8 lamps with T5 lamps220. Install Magnetic induction lamps for high bay areas in place of HPMV lamps221. Replace the Mercury vapor lamps with Metal halide/sodium vapor lamps/
CFL/Magnetic Induction Lamps222. Convert Delta to permanent star connection for lightly loaded motors
(<35%)
223. Install auto star delta converter for lightly loaded motors (variable loads)
224. Minimize unbalance in Voltage by equally loading the transformer
225. Using soft starters to avoid higher initial currents to larger size motors
226. Replace Cooler vent fan and Kiln main drive motors with AC drives227. Install Harmonic filters 228. Installation of Energy Monitoring system229. Installation of Light pipe in place of high discharge lamps for day lighting230. Replace 85W incandescent lampsd with 45W CFL lamp.231. Replace 70 W sodium vapor lamps replaced with 45W CFL 232. Interlock the transformer cooling with temperature of the winding 233. Optimize EsP heaters operation from 110 to 80 degC.234. Commissioning of Energy monitoring system to control the power
consumption235. In-house overhauling of all HT motors rating from 250kw to 5300kw.236. Plant lights ON&OFF optimization through PLC timer
237. Use Astronomical switches/ LDR’s for lighting controls238. Install maximum demand controller to avoid demand charges 239. Conducting Thermography survey on electrical system to avoid breakdowns240. Power distribution at 11KV for to minimize distribution losses241. selected white metal bearing motors with forced lubrication to minimize
breakdowns on bearings failures242. Upgrading of old sPsR with IGBT based sPRs to increase availability of
sPRs243. Upgrading old sPRs controllers (Bin card system) with New controller to
increase availability of sPRs.244. Replacement of reciprocating chiller with high efficiency screw chiller for
air condition245. scheduling of mill operation to reduce TOD consumption resulting in cost
saving246. Use of Passive infrared sensors for lighting system

84 Confederation of Indian IndustryCII-Sohrabji Godrej Green Business Centre
247. Intelligent relay for reducing the LT motor failures248. Optimization of distribution Transformer losses by loading the transformer
between (40 %-60 %) 249. Isolate the primary of transformer also to avoid no load losses250. Increase the radiators size of Power transformers to improve cooling251. Reduce the tap setting of Power/Distribution transformer to optimize the
system voltage252. Install energy efficient amorphous transformer for new installations253. Optimize the Charge Ratio of EsP Transformer254. Install Medium Voltage VFD in place of GRR/LRR255. Install magna drive for variable speed applications256. Replace the Panel incandescent indication lamps with LED lamps257. Replace halogen lamps with metal halide lamps258. Optimize the operation of lighting in MCC rooms with door interlock/
entrance switch/movement sensors259. Install neutral Compensator in lighting circuit to compensate neutral
current260. Provide more transparent sheet instead of asbestos sheets to use natural light261. Replace the turbine hall exhaust fans with turbo ventilators262. Providing of Insulated Wall Panels for the MCC Rooms to reduce Air
conditioning load
CAPTIVE POwER PlANT263. VFD for Pumps (BFP, CEP, CWP,ACWP) and fans264. Optimum pressure drop across condenser and HE265. Optimum frequency and power factor266. IGBT control system for furnace control267. Optimum excess air268. Optimum false air in flue gas circuit269. Desulphurization & Gypsum production for reducing flue gas loss270. Low pressure compressed air for fly ash and bed ash transport271. VFD for instrument and fly ash compressor272. Low pressure drop in FD fan273. Multi stage drag reduction valve in place of ARC274. Turbo ventilator for turbine hall275. Low pressure drop in flue gas circuit276. VFD for cooling tower fans277. Vacuum pump in place of ejector278. Adaptive Predictive control system for operation279. Low compressed air leakage280. sep lubrication oil pump for generator cooling and governor

85Energy Benchmarking for Cement Industry
281. Optimum charge ratio for better EsP performance282. Changing Evaporator coils once in every two years to achieve maximum
performance283. Monitoring tube thickness in every shutdown284. Introduction primary screen in coal belt to avoid fines285. Predictive and Preventive Maintenance Practice
a. Tripping Analysis.b. Thickness checking of Acid tanks & Chimneys.c. Committee for steam leakage detection.d. Ultrasonic leak detection for vacuum.e. Wear Debris Analysis for TG oil.f. Checking of thermal insulation.g. Condition monitoring of all equipment.h. Maintenance is being done through EAM system.i. Coal sieve analysis.j. Chemicals are being used on first come, first out basis.k. Half yearly checking of compressed air vessels.l. Yearly checking of slings, chain blocks, D-shackles & EOT Cranem. Replacement of Boiler Bed coils, once in Two years.n. Chemical followed by bullet shot Cleaning of condenser tubes once in two
years. o. Monitoring the condition of major equipments as per check list. p. Over-hauling of TG sets – once in 5 years
286. Dual speed for Cooling Tower fan.287. Installed Energy efficient Air Conditioners in plant.288. TPP ACC-1 chamber lighting circuit modified with ON/OFF switch.289. TPP EsP top lighting circuit modified with ON/OFF switch290. Installation of steam heaters to maintain Lube oil temperature of DG,
thereby stop use of electric heater and save energy.291. Utilization of waste hot gases from TPP to reduce moisture content in lignite.292. Modification of fluidizing & pushing air line in air slide to opti-mize &
control high bed temperature to increase Boiler efficiency.293. Modification in ACC condensate drain line resulting in improved vacuum,
reduced heat rate & auxiliary consumption of 0.48%.294. Avoiding steam dumping295. Mist/sprinkler cooling for Air Cooled Condenser Operation.296. Optimization of Ash conveying time and eliminate empty line purging.297. Installation of mechanical transport system in place of pneumatic transport
for flyash handling
GENERAl

86 Confederation of Indian IndustryCII-Sohrabji Godrej Green Business Centre
298. Compressed air purging based on DP across bag filter299. VFD for bag filter fans and interlocking speed with suction300. Cooling tower fans speed reduction in stead of on /OFF control301. Optimum delta T across heat exchangers302. Installation of Evaporative condenser for improving AC plant performance303. Installation of Vapor Absorption Refrigeration system304. Installation of Building Management system for reducing AC load305. Construction / Retro fit to Green Building to reduce power consumption306. Installation of Hybrid (solar / Wind) power generation systems307. Installation of solar thermal systems for steam generation for canteen 308. Daily monitoring and analysis of key parameters309. Daily power consumption report sent all management cadre employees for
their information and control action310. Celebration of National Energy conservation week celebrations to educate
all persons311. Rain water harvesting done for every individual bore well to recharge
ground water table.312. Installation of Transparent sheet at workshop to avoid lighting during day
time.313. Replacement of tube type heat exchanger with plate type heat exchanger to
improve efficiency.314. LOTO for all energy isolation.315. Carrying out energy audits at regular intervals and adopting necessary
energy conservation activities through Zero / Low / high cost investments316. Robo Lab 317. Torn out switch introduced for Belt Conveyors to identify the belt cut318. Performing Root Cause Analysis of any failures / breakdowns to avoid
recurrence.319. Formation of energy circle team.320. selection of equipments for saving on energy.321. Implementation of IsO 50001 for effective energy conservation and
management322. scheduling and Operation of production plants having spare capacities to
reduce the peak load requirement.

87Energy Benchmarking for Cement Industry
CHAPTER-7MONITORING PARAMETERS FOR ACHIEVING
ENERGY EFFICIENCY
Monitoring system is an integral part of any cement plant; Energy Monitoring is the process of establishing the existing pattern of energy consumption and explaining deviations from the expected values, if any.
The following parameters can be used by Energy Manger and the Process engineer for optimizing the output and power consumption in each section:
CRUSHER:
S. No Parameter Purpose
Preferred monitoring frequency
1 Crusher output size To ensure crusher and raw mill output Weekly
2Crusher feeder speed(rpm) and running hours
To ensure optimum crusher output and loading Online Daily
3 Crusher output , TPH, BDP and actual BDP and actual Daily
4 sEC, BDP and actual Deviation and improvement Daily
5 Main Bag filter DP Optimum venting and power Online continuous
6 BF venting specific air flow, m3 / TPH Identify excess air flow Monthly
7 Moisture content of material
Too high wet material adds up to energy consumption. Monitoring and controlling moisture at Crusher product shall be more effective to control energy conservation in mining, transportation & raw grinding sections. To control by mine dewatering program/plan the mine block operation/surface drying
Daily average sample or Online continuous

88 Confederation of Indian IndustryCII-Sohrabji Godrej Green Business Centre
RAw MIll -VRM
S. No Parameter Purpose
Preferred monitoring frequency
1 False air from mill inlet to mill fan outlet
Optimizing fresh air in RABH / Kiln bag house fan and its power
Monthly
2 Mill fan Inlet pressure Pressure drop across circuit Online continuous
3Mill outlet dust loading
gm /m3
Optimize flow accordance with output Monthly
4 Cyclone pressure drop Achieve lowest sEC Online continuous
5 Pressure drop across Mill fan inlet damper Damper condition Monthly
6 Louvre velocity Optimize Mill DP Monthly
7 Mill reject % To optimize Mill fan sEC Online continuous
8 Mill load (avg kW) to allowable kW Optimize output Monthly
sEC
9 Mill drive Monitor and maintain sECOnline
continuous , Daily
10 Mill fan Monitor and maintain sECOnline
continuous, Daily
11 Mill fan Efficiency To achieve best tech possible, monitor and maintain Monthly
12 Mill feed size Optimize output Weekly
13 Mill product residue Target and actual
Optimize mill and kiln operation Hourly
14 Feed moisture For Mill Efficiency monitoring Daily average
15 Mill Internal Water spray rate For Mill Efficiency monitoring Daily average

89Energy Benchmarking for Cement Industry
RAw MIll- BAll MIll
S. No Parameter Purpose
Preferred monitoring frequency
1 False air from mill inlet to mill fan outlet
Optimizing fresh air RABH / Kiln bag house fan Monthly
2 Mill fan Inlet pressure Pressure drop across circuit Online continuous
3sep dust loading
gm /m3
Optimize flow accordance with output
Monthly / Online
4 Cyclone pressure drop Achieve lowest sEC Online continuous
5 Pressure drop across Mill fan inlet damper Damper condition Monthly
6 Mill Grinding media filling level
To achieve optimum grindability in mill
Online continuous
7 Circulation load Ensure better separator efficiency
Online Continuous
8 Mill Reject < 90 micron sieve
Monitor separator performance shift wise
sEC
9 Mill drive Monitor and maintain sECOnline
continuous, Daily
10 Mill fan Monitor and maintain sECOnline
continuous, Daily
11 Mill fan EfficiencyTo achieve best tech possible, monitor and maintain
Monthly
12 Mill feed size Optimize output Weekly
13 Mill product residue Target and actual
Optimize mill and kiln operation Hourly
14 Mill load (avg kW) to allowable kW
Optimize output and decide on grinding media make up charge
Daily
15 Piece weight in first chamber
To achieve optimum grindability in mill Monthly

90 Confederation of Indian IndustryCII-Sohrabji Godrej Green Business Centre
S. No Parameter Purpose
Preferred monitoring frequency
16 Grinding media surface area in second chamber
To achieve optimum grindability in mill Monthly
17size of slot Opening in the partition wall grates / cleanliness
To achieve optimum material and gas/air flow through mill
Fortnightly
18 Pressure drop across mill
To monitor the material and air/gas flow and identify the blockages if any in the grates (partition and discharge diaphragm)
On line continuous
PYRO SECTION
S. No Parameter Purpose
Preferred monitoring frequency
1 Kiln feed LsF sDKiln stability, optimum heat of reaction, clinker grindability
Daily
2 Preheater outlet oxygen To maintain optimum excess air Online Continuous
3 Preheater outlet CO To maintain optimum excess air Online Continuous
4 Preheater outlet pressure and temperature
Maintain and monitor preheater thermal loss Online Continuous
5 Preheater fan inlet damper pressure drop Damper condition Monthly
6False air across preheater (from kiln inlet to preheater fan outlet)
Optimize electrical and thermal sec Monthly
7 Kiln inlet Nox level Burning Zone excess air level Online Continuous
8 Each cyclone ∆ P and ∆ T (BDP and actual)
Optimize electrical and thermal sec Monthly
9Dust concentration in down comer duct (BDP and actual)
Optimize electrical and thermal sec Yearly

91Energy Benchmarking for Cement Industry
S. No Parameter Purpose
Preferred monitoring frequency
10 RABH DP Optimize bag life and fan power Online Continuous
Fan efficiency
11 Preheater fan To achieve best tech possible, monitor and maintain
Monthly
12 RABH FanTo achieve best tech possible, monitor and maintain
Monthly
13 Cooler vent fanTo achieve best tech possible, monitor and maintain
Monthly
14 Cooler fansTo achieve best tech possible, monitor and maintain
Monthly
15 Temp drop across TAD Reduce radiation loss and false air entry Monthly
16 Cooler fans suction pressure Optimize fan power Monthly
17 Pressure drop across silencer in cooler fans Ensure optimum power Monthly
18Damper pressure drop
(if any)Monthly
19 Preheater fan Damper condition Monthly
20 Cooler vent fan Damper condition Monthly
22 sEC
Preheater fan Monitor and maintain sEC
Online continuous and daily
Cooler fans Monitor and maintain sEC
Online continuous and daily
Cooler vent fan Monitor and maintain sEC
Online continuous and daily
RABH fan Monitor and maintain sEC
Online continuous and daily
Coal conveying blower Monitor and maintain sEC
Online continuous and daily

92 Confederation of Indian IndustryCII-Sohrabji Godrej Green Business Centre
S. No Parameter Purpose
Preferred monitoring frequency
23 specific air flow
Cooling air Monitor and maintain thermal & Electrical sEC Monthly
Cooler vent air Monitor and maintain thermal & Electrical sEC Monthly
Preheater fan flow Monitor and maintain thermal & Electrical sEC Monthly
RABH fan flow Monitor and maintain thermal & Electrical sEC Monthly
Tertiary air flow Monitor and maintain thermal & Electrical sEC Monthly
24 Coal phase density
Kiln Optimise blower power and sp heat consumption Monthly
PC Optimise blower power and sp heat consumption Monthly
25 Primary air % Monthly
26 Cooler bed height To achieve cooler recuperation efficiency Online Continuous
27 Temperatures BDP and actual
Cooler vent Monitor and maintain specific heat consumption Online Continuous
Clinker Monitor and maintain specific heat consumption Online Continuous
Preheater outlet Monitor and maintain specific heat consumption Online Continuous
Tertiary Air Monitor and maintain specific heat consumption Online Continuous
secondary air Monitor and maintain specific heat consumption Online Continuous
Kiln Exit gas
Monitor and maintain specific heat consumption/Volatile circulation phenomena
Online Continuous
28 Water spray quantity

93Energy Benchmarking for Cement Industry
S. No Parameter Purpose
Preferred monitoring frequency
CoolerWater, energy conservation, specific heat consumption
Online Continuous
Down comer / Top cyclone
Water, energy conservation, specific heat consumption
Online Continuous
29 Free silica (Quartz) in kiln feed %
Kiln stability, optimum heat of reaction, clinker grindability
Hourly
30 Free lime in clinker %Kiln stability, optimum heat of reaction, clinker grindability
Hourly
31Kiln Feed Fineness – Residue on 212 micron sieve
Control of Free Lime and optimize energy consumption
Hourly
CEMENT MIll -BAll MIll
S. No Parameter Purpose
Preferred monitoring frequency
1 Circulation Load Optimize separator performance Online continuous
2 separator loading(gm/m3) Optimize fan powerOnline continuous/ monthly / variety wise
3 Velocity inside mill Avoid over grinding Mill vent volume can be alternative
4 specific grinding media weight for first chamber Optimize grindability Monthly / regarding
half yearly
5 specific GM surface area for second chamber Optimize grindability Monthly / regarding
half yearly6 % filling level Optimum output Online continuous
7 Residue on 45 micron in the reject
Monitor separator performance shift wise
8 Roller press BDP KW and actual loading Optimum grinding Online continuous

94 Confederation of Indian IndustryCII-Sohrabji Godrej Green Business Centre
S. No Parameter Purpose
Preferred monitoring frequency
9 Product residue or Blaine Target and actual
Optimum output and power Hourly
10 separator vent flow as % of circulating air flow
Control false air in the circuit, cooling of cement and optimize power
Monthly
11 Pressure drop across cyclone Optimize fan power Online continuous
sEC
12 Mill , HPRG Drives Monitor and maintain sEC
Online continuous, Daily
13 CA fan Monitor and maintain sEC
Online continuous, Daily
14 Mill vent Monitor and maintain sEC
Online continuous, Daily
15 sept Vent Monitor and maintain sEC
Online continuous, Daily
16 Bag filter DP
sept vent Optimize bag life and fan power Online Continuous
sept fan inlet Optimize bag life and fan power Online Continuous
Mill vent Optimize bag life and fan power Online Continuous
17 Fan Efficiency
CA fanTo achieve best tech possible, monitor and maintain
Monthly
Mill ventTo achieve best tech possible, monitor and maintain
Monthly
sept VentTo achieve best tech possible, monitor and maintain
Monthly
18 Feed Composition/RecipeTo monitor consumption of additives and extenders
Online / Continuous

95Energy Benchmarking for Cement Industry
S. No Parameter Purpose
Preferred monitoring frequency
19 Feed moisture To monitor sEC Daily20 Pressure Drop across Mill To monitor sEC Online / Continuous
21size of slot Opening in the partition/end wall grates / cleanliness
To achieve optimum material and gas/air flow through mill
Fortnightly
UTIlITIES
S. No Parameter Purpose
Preferred monitoring frequency
1 Compressor (HP) sEC Monitor and maintain power Daily
2 Up to clinkerisation3 Cement grinding
4 Compressed air generation pressure
Optimize power and indication of leakage and pressure drop
Online continuous
5 Compressor loading % Ensure optimum utilization Monthly
6 Compressed air leakages % Unproductive power During every
shutdown
7 Compressor sEC Condition of compressor
Monthly where stand by is available other wise during stoppages
Compressor discharge air temperature
Monitor and maintain efficiency of compressor / Cooling system/ FAD Capacity
Daily
screw Compressor – Oil Pressure
Monitor and optimize no load power Periodical
8 Cooling water circulating flow
Pyro section Water consumption and power saving Monthly

96 Confederation of Indian IndustryCII-Sohrabji Godrej Green Business Centre
S. No Parameter Purpose
Preferred monitoring frequency
Cement mill Water consumption and power saving Monthly
9 Cooling water inlet and return temp
Effectiveness of heat exchangers ,process heat load and cooling tower effectiveness
Online continuous
10 COC Water consumption Monthly11 Pump efficiency Optimum power Monthly
12 Pump discharge pressureLine condition, requirement and valve throttling
Online continuous in case of common header or monthly
13 Fly ash unloading pressure
Optimize compressor power daily
14 Air Conditioning sEC (kW/TR)
Optimize air cooler performance Daily
CAPTIVE POwER PlANT
S. No Parameter Purpose
Preferred monitoring frequency
1 Boiler exit oxygen Monitor and maintain excess air
Online continuous
2 Id fan inlet oxygen Monitor and maintain false air Monthly
3 DP across BFP Flow control valve BFP power Online
continuous4 Efficiency
BFP To achieve best tech possible, monitor and maintain Monthly
CEP To achieve best tech possible, monitor and maintain Monthly
CWP To achieve best tech possible, monitor and maintain Monthly
ACW To achieve best tech possible, monitor and maintain Monthly

97Energy Benchmarking for Cement Industry
S. No Parameter Purpose
Preferred monitoring frequency
5 Compressor sEC Monitor and maintain power Daily
6 Inst compressor pressureOptimize power and indication of leakage and pressure drop
Online continuous
7 Ash conveying pressureOptimize power and indication of leakage and pressure drop
Online continuous
8 Compressor loading Ensure optimum utilization Monthly
9 Cooling tower inlet and outlet temp
Effectiveness of heat exchangers ,process heat load and cooling tower effectiveness
Online continuous
Approach to Wet bulb temperature
Monitor the efficiency of Cooling tower Monthly
10 Temp in ARC line (after valve)
Optimize BFP power, identify ARC valve life
Online continuous
11 Id fan inlet pressure Optimize fan power Online continuous
12 FD fan suction pressure Optimize fan power Online continuous
13 Fan efficiency
FD fan To achieve best tech possible, monitor and maintain Monthly
Id fan To achieve best tech possible, monitor and maintain Monthly
14 sEC kW / MW (BDP and actual)
Pumps Monitor and maintain sECOnline continuous, Daily
Fans Monitor and maintain sECOnline continuous, Daily
compressor Monitor and maintain sECOnline continuous, Daily

98 Confederation of Indian IndustryCII-Sohrabji Godrej Green Business Centre
S. No Parameter Purpose
Preferred monitoring frequency
15 Coal - Moisture Monitor and Control Parasite consumption Daily
16 Heat Rate Monitor the boiler efficiency Daily
17 Coal – Proximate analysis Monitor the boiler efficiency Periodical/shipmentwise
18 Gas Turbine inlet air temperature
Monitor the Turbine efficiency Hourly
ElECTRICAl
S. No Parameter Purpose
Preferred monitoring frequency
1 Transformer Losses To calculate efficiency Monthly
2 Transformer winding temperatures
To eliminate or interlock with winding temperature
Online continuous, Daily
3 Transformer Incoming voltage
TO minimize the operation of OLTC by manual/auto mode
Online continuous, Daily
4 Transformer Tap position To optimize distribution voltage Monthly
5 Motor Loading To Improve the efficiency Monthly
6 Motor VoltageTo reduce the voltage loss and for maintain optimum voltage
Online continuous, Daily
7 Power factorTo reduce the distribution losses and increase the capcity(KVA)
Online continuous, Daily
8 Capacitor Power To reduce the loss Monthly
9Captive Power plant –Frequency in Island Mode
To minimize the frequency and saving power in centrifugal loads
Online continuous, Daily
10Captive Power plant –Power factor in Island Mode
To improve turbo generator efficiency
Online continuous, Daily
11 Lighting Voltage (210 V) To save power and increase lamp life
Online continuous, Daily

99Energy Benchmarking for Cement Industry
S. No Parameter Purpose
Preferred monitoring frequency
12 Distribution Losses To reduce cable losses Online continuous, Daily
13 Maximum demand To avoid any penalties Online continuous, Daily
14 Temperature of major feeders
To avoid any shut downs (using thermograph) Monthly
15 Voltage drop To minimize distribution losses Monthly

100 Confederation of Indian IndustryCII-Sohrabji Godrej Green Business Centre
ABBREVIATIONS:
AC - Alternating CurrentACC - Air Cooled CondensorACWP - Auxiliary Cooling Water PumpAFBC - Atmospheric Fluidized Bed CombustionAFR - Alternate fuel & Raw MaterialBDP - Best Demonstrated PracticeBEE - Bureau of Energy EfficiencyBF - Bag FilterBFP - Boiler Feed water PumpBH - Bag HouseCA - Circulating AirCAGR - Compound Annual Growth RateCAP - CapacityCCR - Central Control RoomCEP - Condensate Extraction pumpCFC - ChlorofluorocarbonCFD - Computational Fluid DynamicsCkt - CircuitCMA - Cement Manufacturers’ AssociationCO - Carbon monoxideCOC - Cycle Of concentrationCWP - Cooling Water PumpDP - Differential PressureEOT - Electric Overhead TravellingEsP - Electostatic PrecipitatorFA - False AirFD - Forced DraftGCT - Gas Conditioning TiwerGI - Galvanized ironGRR - Grid Rotor ResistanceHMI - Human Machine InterfaceHP - High PressureHPMV - High Pressure Mercury Vapor LampHPRG - High Pressure Roller GrindingIGBT - Insulated Gate Bypolar TransistorILC - In Line CalcinerLDR - Light Dependent Resistor

101Energy Benchmarking for Cement Industry
LED - Light Emitting DiodeLOI - Loss on IgnitionLOTO - Lock Out Tag OutLRR - Liquid Rotor ResistanceLs - Lime stone or Linear stackerLsF - Lime saturation FactorMCC - Motor Control CenterMTPA - Million Tons per AnnumMV VFD - Medium Voltage Variable Frequency DriveNCBM - National Council for Cement and Building Materials NCV - Net Calorific ValueOPC - Ordinary Portland cementP&V - Pressureisation & VentilationPAT - Perform Achieve and TradePH - Pre HeaterPLC - Programmable Logic ControllerPLF - Plant load factorPPC - Portland Pozzolona CementPPM - Parts Per MillionPsC - Portland slag CementRABH - Reverse Air Bag HouseRE - Renewable EnergyRP - Roller PressRPM - Revolutions per MinutesEC - specific Energy ConsumptionsLC - separate Line CalcinersPRs - slip Power Recovery systemsTP - sewage Treatment PlantTAD - Tertiary Air DuctTG - Turbo GeneratorTOD - Time of DayTPH - Tonnes per HourTsR - Thermal substitution RateVFD - Variable Frequency DriveVRM - Vertical Roller MillWC - Water ColumnWHR - Waste Heat Recovery
102 Confederation of Indian IndustryCII-Sohrabji Godrej Green Business Centre
Publications by CII-GBC as part of world Class Energy Efficiency in Cement Plants
Manual on Best Practices in Cement Industry
The publication details the best practices followed by the Indian plants in the areas of energy efficiency, quality and productivity improvement.
Manual on Waste Heat Recovery in Indian Cement Indus-try
The manual focuses on description of technologies avail-able for Waste Heat Recovery Potential and installations in the Indian Cement Plants. This also discusses the ad-vantages and also the barriers towards the deployment of WHR Technologies.
Manual on Best Practices in Indian & International Ce-ment Plants
The publication was brought out as part of world class energy efficiency which covers the energy conservation measures carried out in the six cement plants as part of the mission and the experience and learning on Waste Heat Recovery from international mission carried out in Germany, Belgium, UK, switzerland and Japan cement plants.
Cement Formulae Handbook
The formula book is a compilation of useful formulas, norms available at various sources, intended as a store of information which acts as a quick reference for the plant personnel. This was very well accepted by the Indian ce-ment plants and subsequently the second edition was re-leased during the annual conference in 2010.
low Carbon Roadmap for Indian Cement Industry
The report is an effort to create a road map for Indian Ce-ment Industry to achieve the reduction in its Green House gas emission intensity. This is meant for due contempla-tion, reflection and necessary action from the Indian cement industry in its road map towards a low carbon growth.

103Energy Benchmarking for Cement Industry
Case study Manual on Alternative Fuels & Raw Materi-als Utilization in Indian Cement Industry
The purpose of this manual is to act as catalyst for pro-moting increased use of alternate fuel & raw materials in Indian Cement Industry through co processing of wastes and reducing cost of clinker production, thereby improv-ing performance competitiveness of individual cement plants. The objective also is to promote a much needed ecologically sustaining solution to the waste management problem in the country through co processing in cement kiln.
Energy Efficiency Guidebook for Electrical Engineers
The guidebook is a quick reference for electrical engi-neers that covers the fundamental theory of basic elec-trical equipments and provides the latest information on electrical systems such as motors and its control, trans-formers, lighting systems etc. It also throws light on the possible energy saving opportunities and newest trends in electrical and lighting systems.
low Carbon Technology Roadmap for the Indian Ce-ment Industry
The report is a set of technical papers focusing on tech-nologies, policy factors and financing needs for carbon emissions reduction and resource efficiency enhancement in Indian cement Industry. The technology papers are developed by Confederation of Indian Industry (CII) & NCCBM in partnership with International Energy Agen-cy (IEA) and WBCsD’s Cement sustainability Initiative (CsI).
Manual on Thermal Energy Efficiency in Cement In-dustry
The Government of India in consultation with Bureau of Energy Efficiency (BEE) has released the PAT targets for the period from 2012-13 to 2014-15 in relation to their current level of energy consumption. Cement industry needs to focus more on Thermal Energy Efficiency in its endeavour to achieve the PAT targets. This manual serves as a ready reckoner on thermal energy efficiency includ-ing latest norms and best practices to reduce thermal spe-cific Energy Consumption.

104 Confederation of Indian IndustryCII-Sohrabji Godrej Green Business Centre
Notes :

105Energy Benchmarking for Cement Industry
Notes :

106 Confederation of Indian IndustryCII-Sohrabji Godrej Green Business Centre
Notes :