benchmarking for a new era of leaders with self … · leaders with self-service dashboards...
TRANSCRIPT

Benchmarking for a New Era of Leaders With Self-service
Dashboards
Presenter: Meghal ParikhUniversity of Central Florida

• founded in sunny Orlando, FL in 1968
• over 64,000 students
• one of the top public university awarding more Bachelor’s
degrees than most public universities in the nation
• plan of new UCF campus at Creative Village to bring 7,700
students to downtown Orlando
• plans for new 100-bed teaching hospital with a public-private
partnership with Hospital Corporation of America
• top 30 nationwide for National Merits
Who are we?

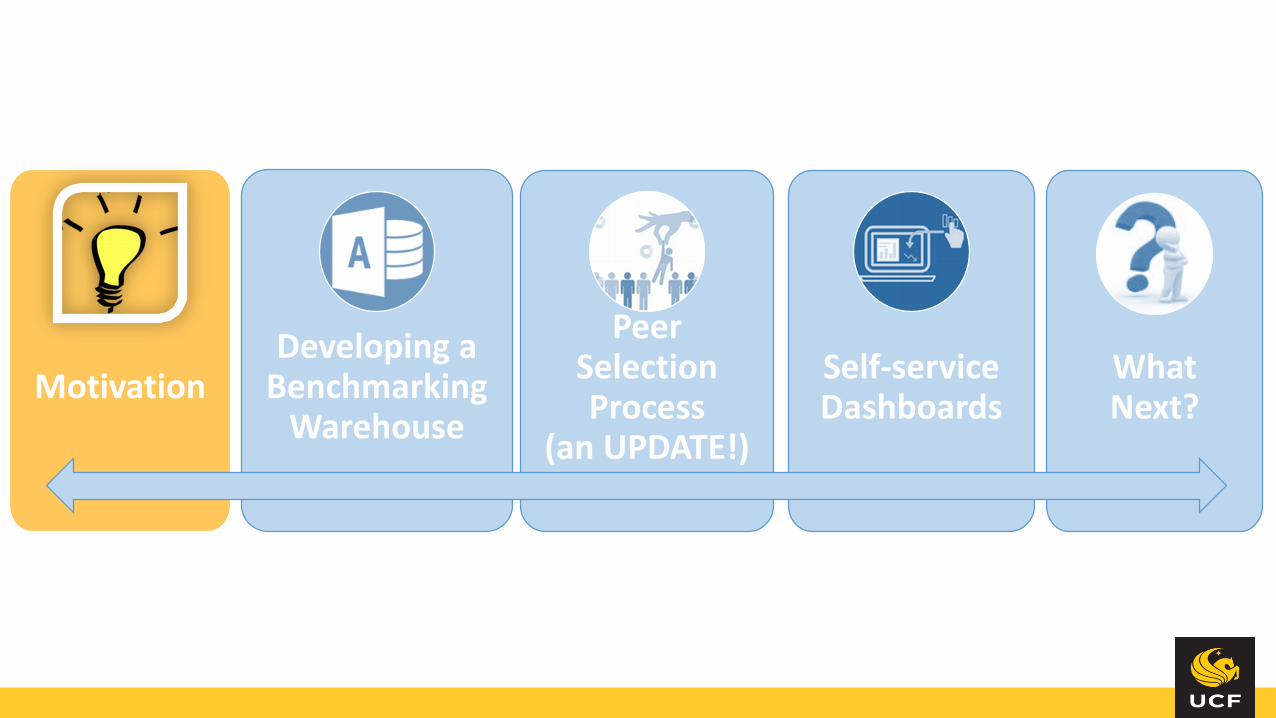
AGENDA
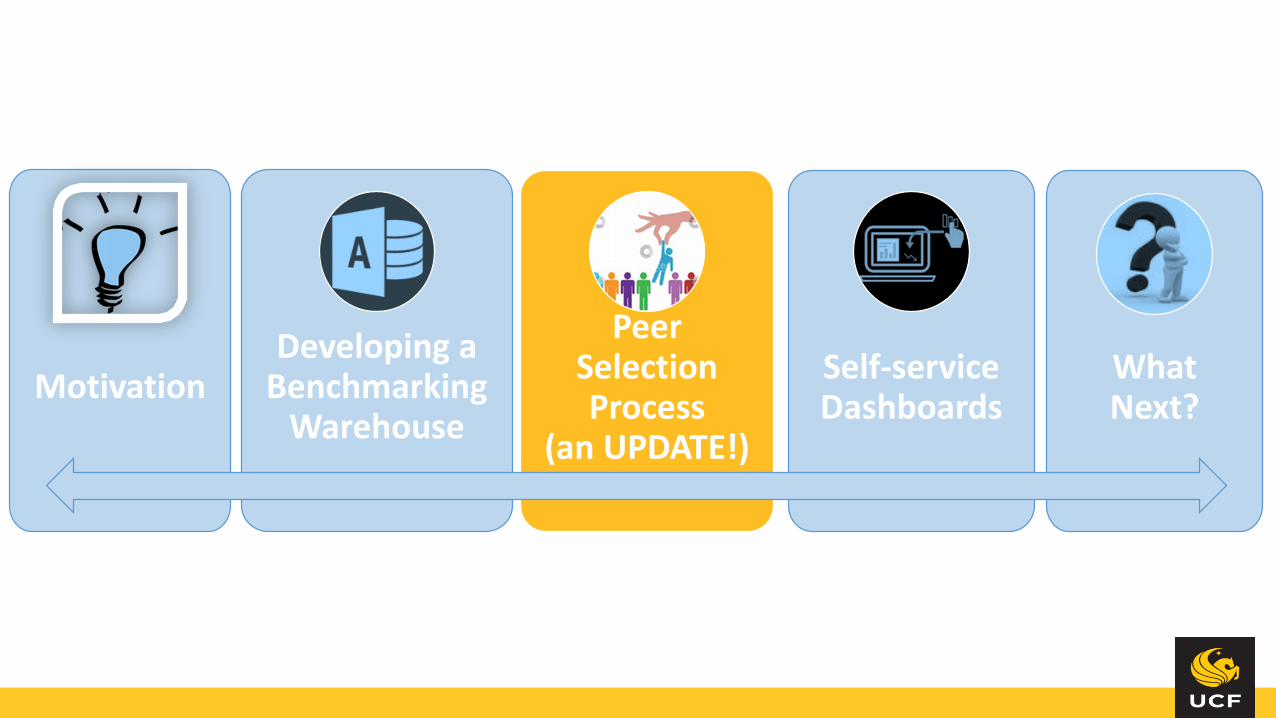
Developing a Benchmarking
Warehouse
Peer Selection Process
(an UPDATE!)
MotivationSelf-service Dashboards
What Next?

Self-service Dashboards• tool used: Tableau Public
• data source: IPEDS, NSF, NCAA etc.

1. UCF Benchmarking Dashboard• https://public.tableau.com/views/BenchmarkingDashboard/Benc
hmarkingDashboard?:embed=y&:display_count=yes

2. University Ranking based on number of degrees awarded in each CIP code
• https://public.tableau.com/views/UniversityRankingbasedonnumberofdegreesawardedineachCIP/DegreesAwardedbyCIPRanked?:embed=y&:display_count=yes

What is Benchmarking?
“Benchmarking is the process of comparing one's business processes and performance
metrics to industry bests and/or best practices from other industries.”
• Importance of BenchmarkingAnalyze present status
Find the imperfections
Take improvement measures
Justify decisions

Benchmarking in Higher Education• history and background of benchmarking
• industry into higher education
• pioneers: University of Central Florida, Babson College and Penn State
• has been successfully and extensively used in ranking universities
• most comprehensive data availability
• IPEDS, NSF, NCAA, College Scorecard
Developing a Benchmarking
Warehouse
Peer Selection Process
(an UPDATE!)
MotivationSelf-service Dashboards
What Next?
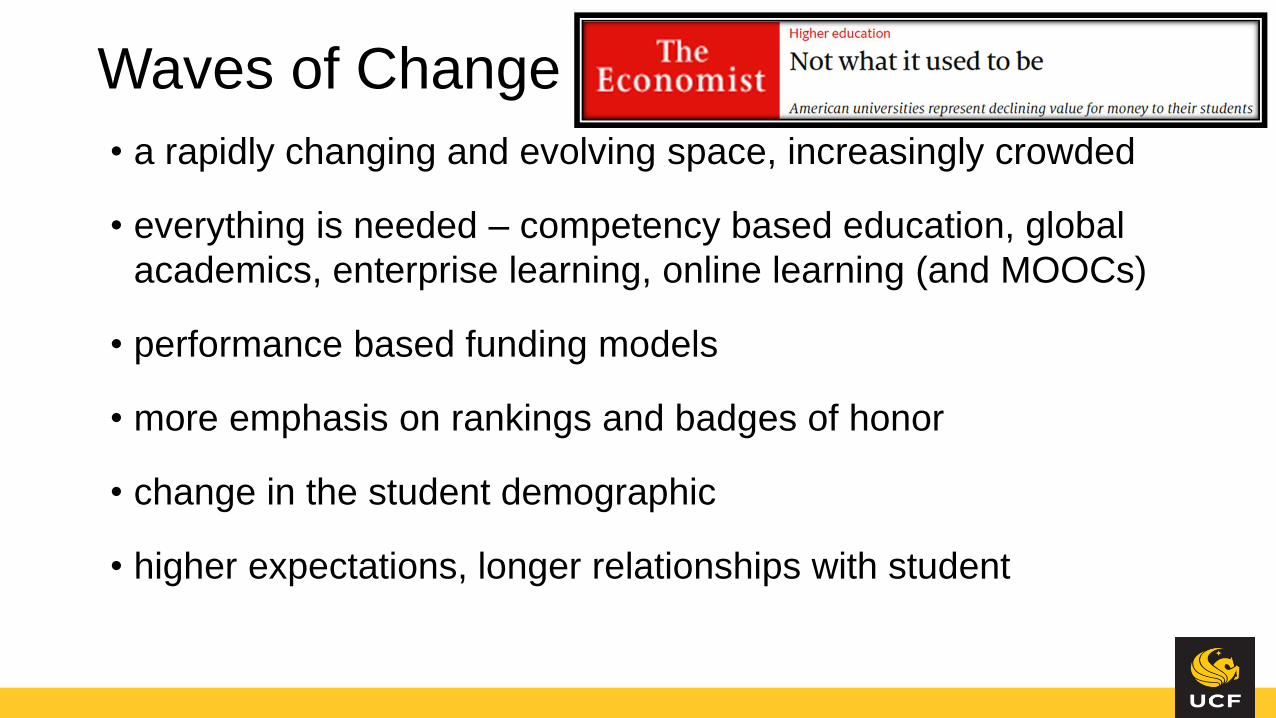
• a rapidly changing and evolving space, increasingly crowded
• everything is needed – competency based education, global
academics, enterprise learning, online learning (and MOOCs)
• performance based funding models
• more emphasis on rankings and badges of honor
• change in the student demographic
• higher expectations, longer relationships with student
Waves of Change

IR Office Challenges in Benchmarking• increase in frequency of ad-hoc requests
• more topic-specific benchmarking studies like salary studies,
athletic studies, student debt, research expenditure, higher
education productivity etc.
• challenge of using a singular definition for every request
• data collection + visual analysis + QA is very time consuming
• the “add just one more thing” problem
Solution: Benchmarking Data Warehouse|| Preemptive || Systematic || Singular || Efficient ||

Developing a Benchmarking
Warehouse
Peer Selection Process
(an UPDATE!)
MotivationSelf-service Dashboards
What Next?

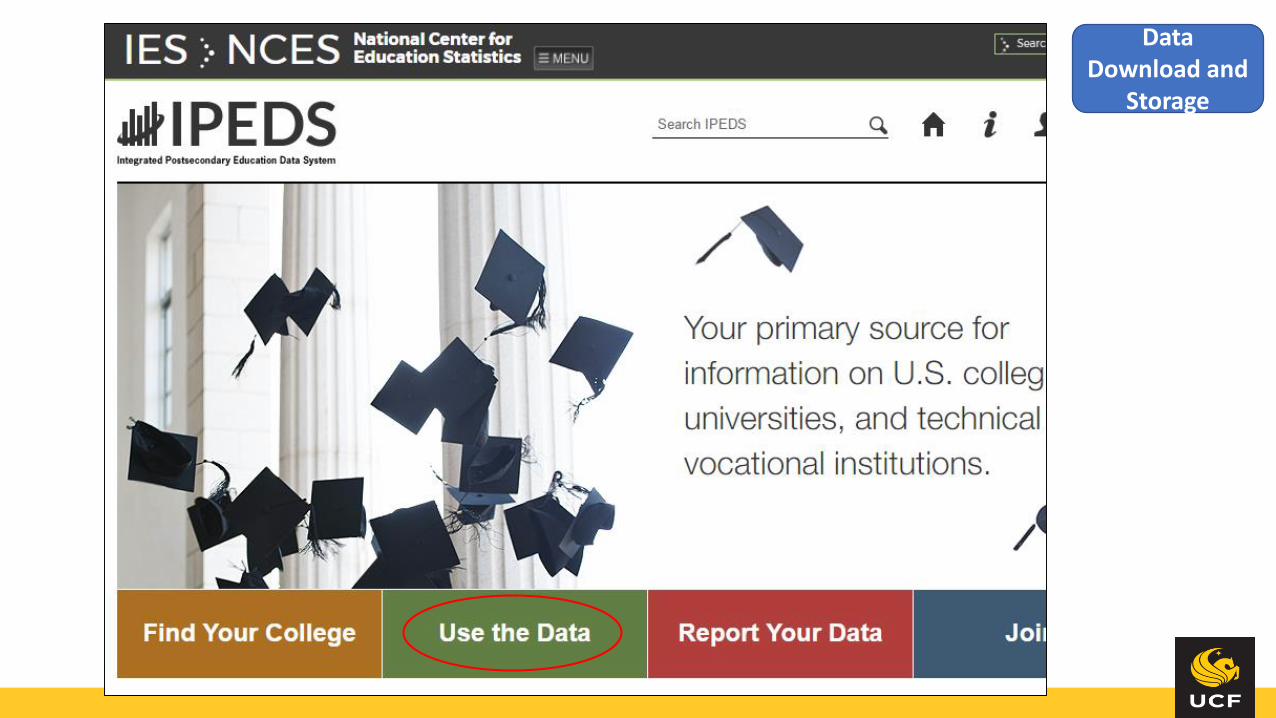
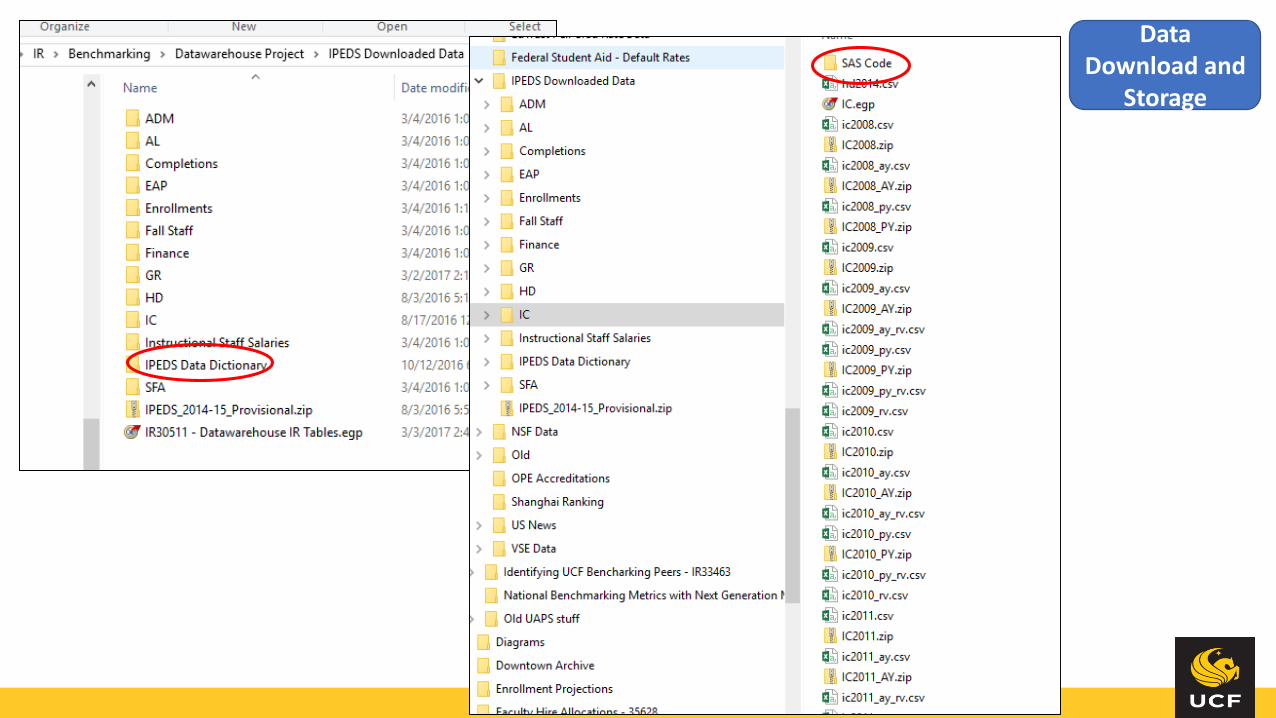
Data Download and
Storage• IPEDS, NSF, Equity in• Athletics Data, Academic
Insights, CMUP etc.• Mostly everything that
comes with a UNITID or FICE• Arrange datasets in proper
folders
Importing into Data Prep software
• Eg. SAS Enterprise Guide
Appending multiple years
of data
Formatting data values with appropriate descriptions
Prepare Data Dictionary
Prepare Aggregated Data
Normalizing data
• Easy said than done, beware of the Race changes
• Add years, data source, merge multiple files if needed, transpose where needed
• rotating tables
Creating custom tables and next gen metrics
• Eg. Endowment per age-year
o…p…t…i…o…n…a…l
Data Download and
Storage

New
Data Download and
Storage

Data Download and
Storage
Data Download and
Storage

Appending multiple years
of data
• SAS code provided by IPEDS gives labels to column names and formats to codes making your dataset more friendly
Importing into Data Prep software
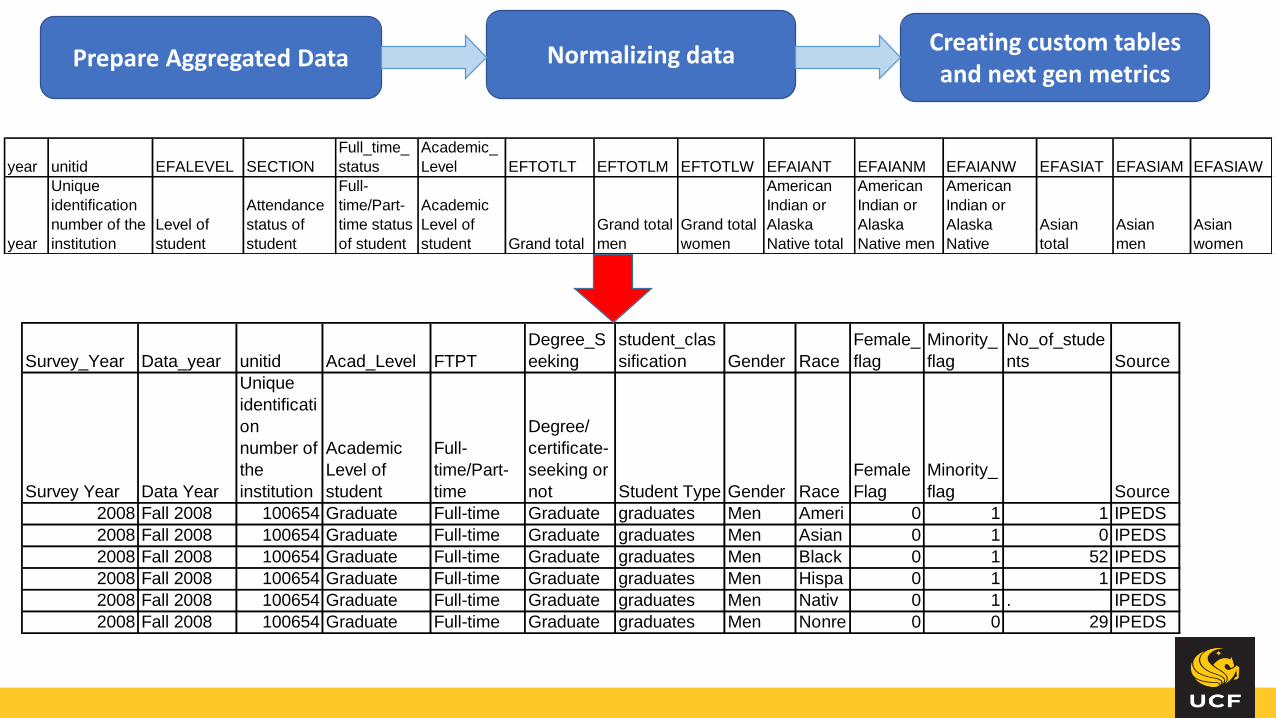
Prepare Aggregated Data Normalizing data Creating custom tables and next gen metrics
year unitid EFALEVEL SECTION
Full_time_
status
Academic_
Level EFTOTLT EFTOTLM EFTOTLW EFAIANT EFAIANM EFAIANW EFASIAT EFASIAM EFASIAW
year
Unique
identification
number of the
institution
Level of
student
Attendance
status of
student
Full-
time/Part-
time status
of student
Academic
Level of
student Grand total
Grand total
men
Grand total
women
American
Indian or
Alaska
Native total
American
Indian or
Alaska
Native men
American
Indian or
Alaska
Native
Asian
total
Asian
men
Asian
women
Survey_Year Data_year unitid Acad_Level FTPT
Degree_S
eeking
student_clas
sification Gender Race
Female_
flag
Minority_
flag
No_of_stude
nts Source
Survey Year Data Year
Unique
identificati
on
number of
the
institution
Academic
Level of
student
Full-
time/Part-
time
Degree/
certificate-
seeking or
not Student Type Gender Race
Female
Flag
Minority_
flag Source
2008 Fall 2008 100654 Graduate Full-time Graduate graduates Men Ameri 0 1 1 IPEDS
2008 Fall 2008 100654 Graduate Full-time Graduate graduates Men Asian 0 1 0 IPEDS
2008 Fall 2008 100654 Graduate Full-time Graduate graduates Men Black 0 1 52 IPEDS
2008 Fall 2008 100654 Graduate Full-time Graduate graduates Men Hispa 0 1 1 IPEDS
2008 Fall 2008 100654 Graduate Full-time Graduate graduates Men Nativ 0 1 . IPEDS
2008 Fall 2008 100654 Graduate Full-time Graduate graduates Men Nonre 0 0 29 IPEDS

Prepare Aggregated Data Normalizing data Creating custom tables and next gen metrics
Core Revenues (Total) per FTERevenues from tuition and fees per FTERevenues from state appropriations per FTEInstruction expenses per FTEResearch expenses per FTECore Expenditures per FTEInstructional Expense per Credit-hourEndownment per FTEInstruction spending per FTE (ACTA)Administrative spending per FTE (ACTA)
Men Admit RateWomen Admit RateOverall Admit RateMen Admission Yield RateWomen Admission Yield RateFull-time Admission Yield Rate
Full-time Men Admission Yield Rate
Full-time Women Admission Yield Rate
Overall Admission Yield Rate
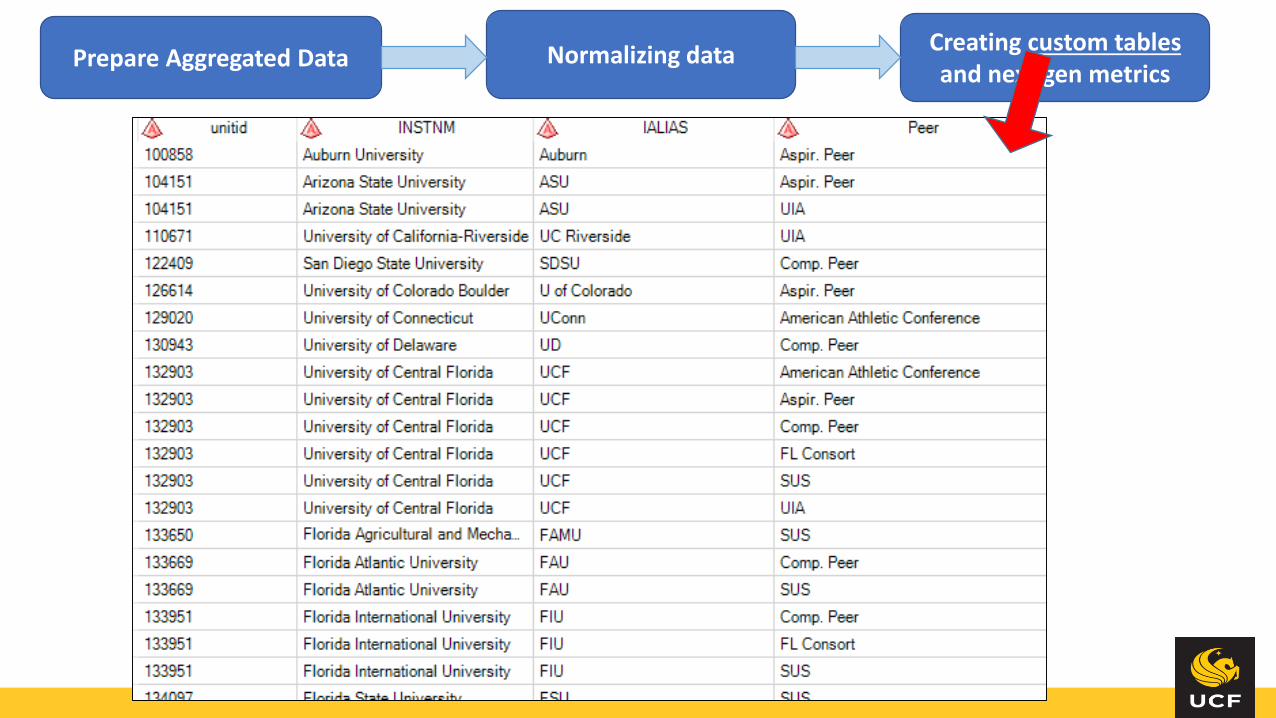
Prepare Aggregated Data Normalizing data Creating custom tablesand next gen metrics
Developing a Benchmarking
Warehouse
Peer Selection Process
(an UPDATE!)
MotivationSelf-service Dashboards
What Next?

Performance Benchmarking at UCF
performance measurement
peers(selected institutions)
measures(selected metrics)
• internally – benchmark key metrics to set goals and develop strategic plan
• externally – how we present ourselves to the world
• goal: develop two lists based on similarity to UCF and targeted improvement metrics

A Hybrid Approach to Select Peers• “The role of the institutional researcher is to bring analytical rigor to
an otherwise politically charged context” (Ingram, 1995)
• statistics and judgment
• IR office uses CLUSTER ANALYSIS to classify universities into groups
• statistical procedure output:
• our closest neighbors (comparison peers)
• next set of closest neighbors (potentially aspirational)
• judgment needed to determine which potentially aspirational institutions provide good targets for UCF
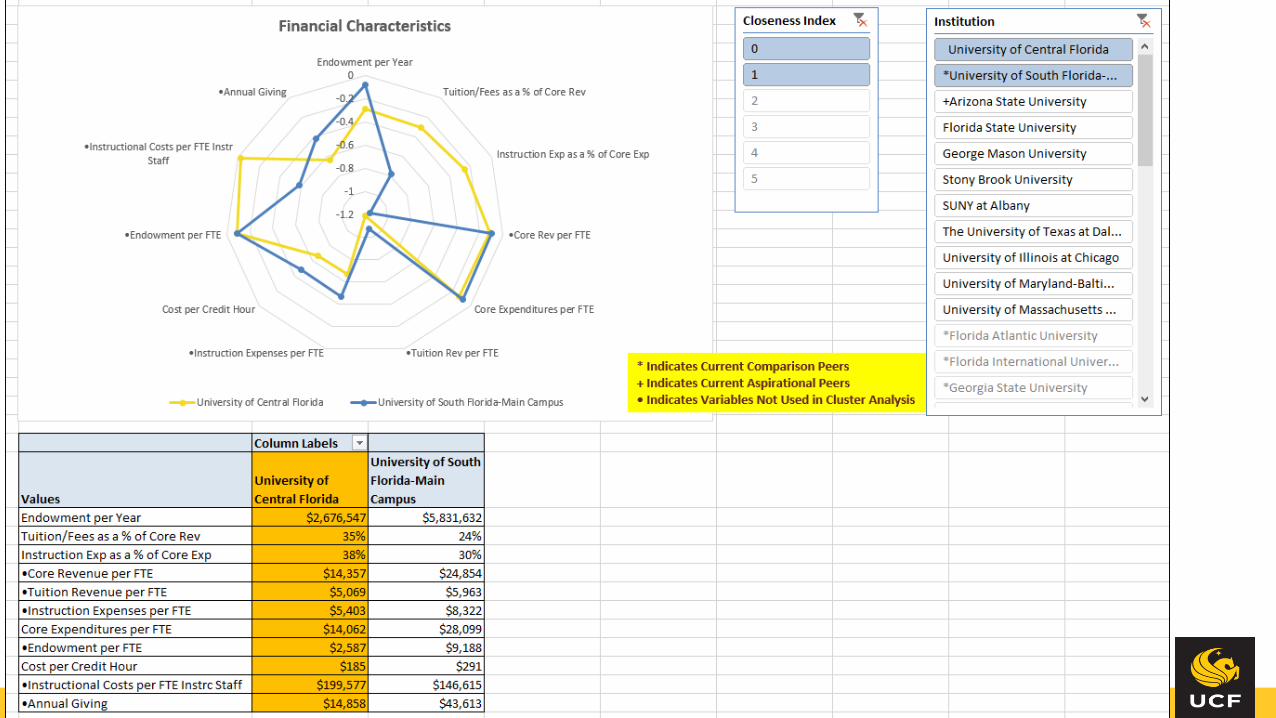
• data visualizations very helpful

Peer Selection Process (2015)• 7 steps were conducted to come up with a list of 36 important
variables for performing cluster analysis and shortlisting 41 schools to compare with UCF
• Step 1: Only considered 297 institutions with Carnegie Basic Classification 2010 = "Doctoral/Research" OR "High Research Activity" OR "Very High Research Activity"
• Step 2 Variable Selection: 36 variables were shortlisted from 128 variables (ratios) collected based on statistical significance in areas of Institutional Characteristics, Faculty Characteristics, Financial Characteristics, Student Enrollment Characteristics and Student Degrees and Graduation Rate Characteristics
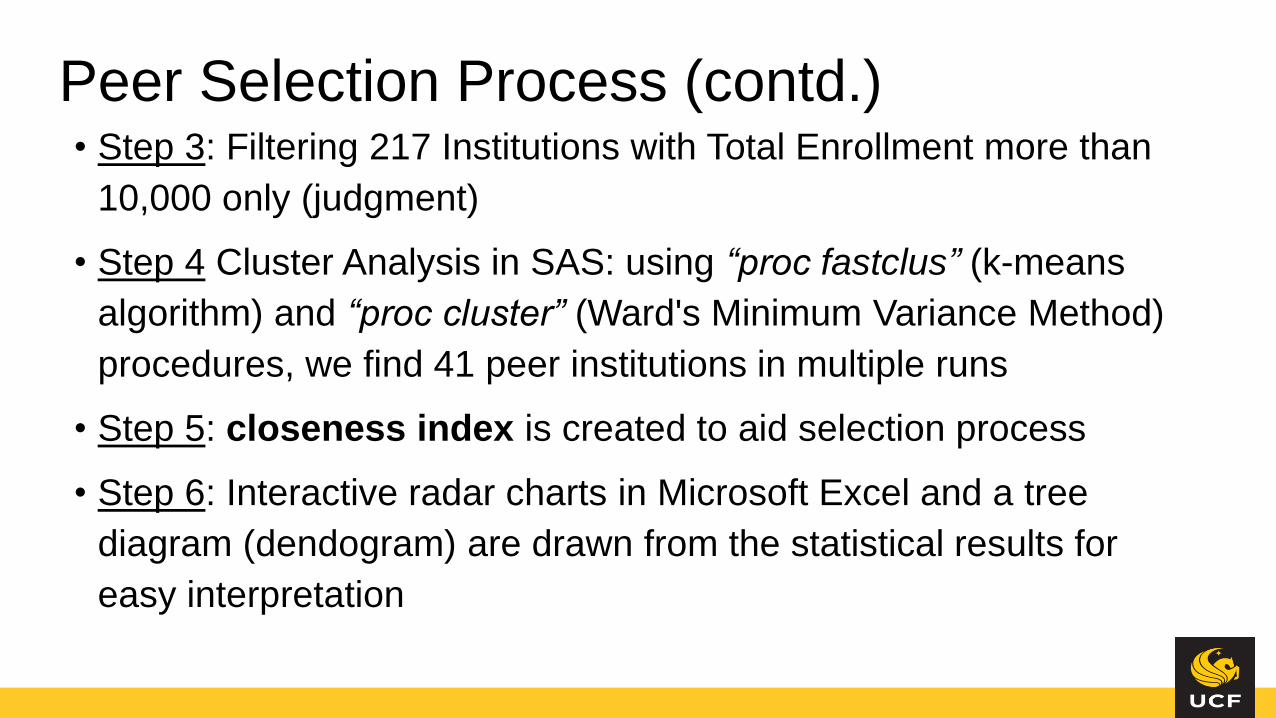
Peer Selection Process (contd.)• Step 3: Filtering 217 Institutions with Total Enrollment more than
10,000 only (judgment)
• Step 4 Cluster Analysis in SAS: using “proc fastclus” (k-means
algorithm) and “proc cluster” (Ward's Minimum Variance Method)
procedures, we find 41 peer institutions in multiple runs
• Step 5: closeness index is created to aid selection process
• Step 6: Interactive radar charts in Microsoft Excel and a tree
diagram (dendogram) are drawn from the statistical results for
easy interpretation


Developing a Benchmarking
Warehouse
Peer Selection Process
(an UPDATE!)
MotivationSelf-service Dashboards
What Next?
Benefits
• highly efficient and intuitive way of providing decision-making support
• gives IR team a break from reporting on things
• provides a single version of truth
• prevents mistakes due to fatigue
• ease of sharing
• leaves time for deep-dive analysis (example)
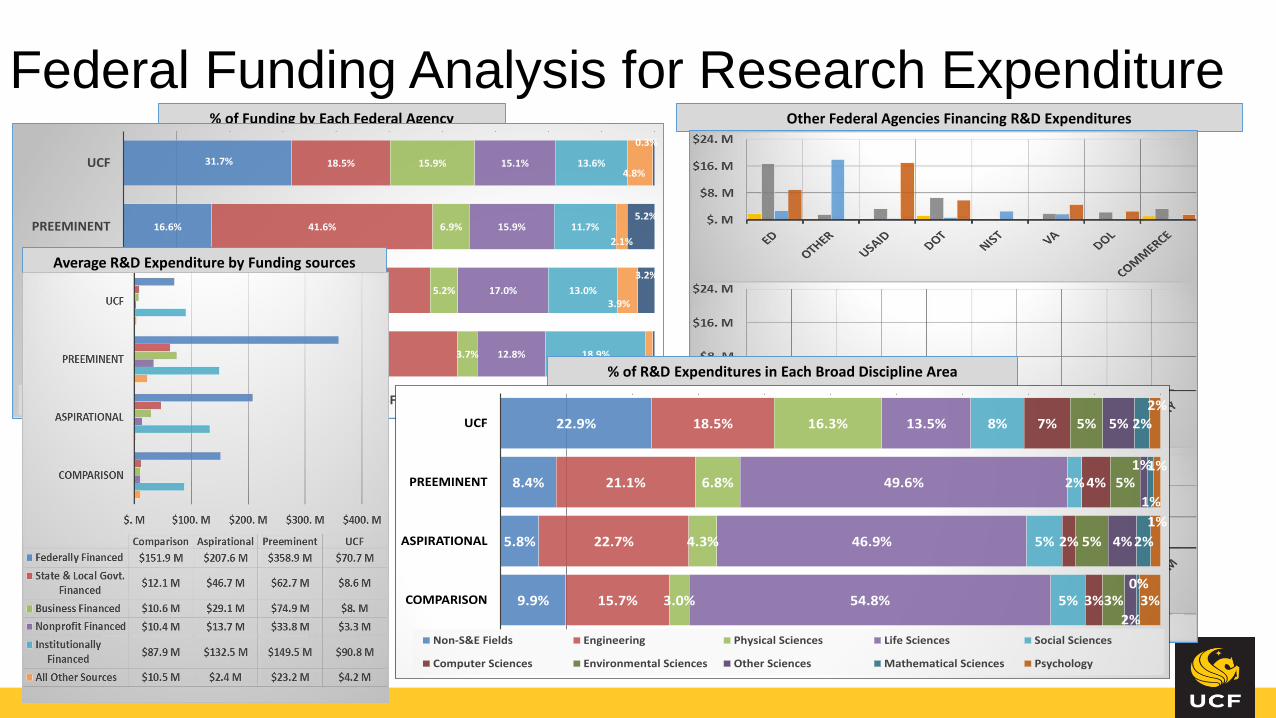
Federal Funding Analysis for Research Expenditure% of Funding by Each Federal Agency
31.7%
16.6%
9.4%
8.7%
18.5%
41.6%
48.3%
54.1%
15.9%
6.9%
5.2%
3.7%
15.1%
15.9%
17.0%
12.8%
13.6%
11.7%
13.0%
18.9%
4.8%
2.1%
3.9%
1.3%
0.3%
5.2%
3.2%
0.3%
UCF
PREEMINENT
ASPIRATIONAL
COMPARISON
DoD DHHS (Including NIH) DoE NSF Other NASA USDA
Other Federal Agencies Financing R&D Expenditures
% of R&D Expenditures in Each Broad Discipline Area
22.9%
8.4%
5.8%
9.9%
18.5%
21.1%
22.7%
15.7%
16.3%
6.8%
4.3%
3.0%
13.5%
49.6%
46.9%
54.8%
8%
2%
5%
5%
7%
4%
2%
3%
5%
5%
5%
3%
5%
1%
4%
2%
2%
1%
2%
0%
2%
1%
1%
3%
UCF
PREEMINENT
ASPIRATIONAL
COMPARISON
Non-S&E Fields Engineering Physical Sciences Life Sciences Social Sciences
Computer Sciences Environmental Sciences Other Sciences Mathematical Sciences Psychology
Average R&D Expenditure by Funding sources

AGENDA
Developing a Benchmarking
Warehouse
Peer Selection Process
(an UPDATE!)
MotivationSelf-service Dashboards
What Next?

The Future is Here…
• implementing a benchmarking data warehouse has stimulated the
creation of multiple interactive dashboards which serve as a self-
service stop for leadership to conduct comparative analyses
• more topic-specific benchmarking studies; ranking investigations
• more dashboards like a one-to-one institution comparison dashboard
• providing more efficiency, quicker turn-around times and easy edits
• additional elements to the business process
• additional data sources to the data warehouse

Thank You!!!Questions?

https://public.tableau.com/views/UniversityRankingbasedonnumberofdegreesawardedineachCIP_0/DegreesAwardedbyCIPRanked?:embed=y&:display_count=yes

Please remember to submit your evaluation for this session
through the MyForum app