benchmarking the south african shopping centre industry international ... · sacsc research report...
TRANSCRIPT

1
SACSC Research Report Benchmark March 2013
Benchmarking the South African Shopping
Centre Industry International and Local Trends
DR DIRK A PRINSLOO
March 2013
During an interview on 12 June 2012, by CNBC Africa with Mr Willem Plaizier, partner at AT Kearney, the 2012 Global Retail Development Index (GRDI) and the attractive African retail markets were discussed. This Global Retail Development Index is conducted annually to indicate the top 30 developing countries with the highest potential for retail development and the following comments were made by Plaizier regarding South Africa: “South Africa is not on the list of the 30 developing countries any more. South Africa is not on the list for very positive reasons because it is already a very developed retail market.” The countries on Global Retail Development Index for 2012 with the highest opportunities are Brazil, Chile, China, Uruguay, India and Georgia. The Global Retail Development Index window of opportunity has closed for South Africa, mainly because of a very well established retail market reaching saturation according to the authors of this report. The window of opportunity has closed because consumers are now more used to modern retail in general. There is high discretionary spending available. Competition is fierce both from the local and foreign retailers, retail real estate is expensive and not readily available. See Diagram 1.

2
DIAGRAM 1 GLOBAL RETAIL EXPANSION
Source: AT Kearney; Global Retail Expansion: Keeps on moving, http://www.atkearney.com, (adjusted by author). On Bloomberg TV on 15 June 2012, Mike Moriarty partner at AT Kearney also mentioned the fact that South Africa did not make it on the list of the Top 30 developing countries of the 2012 Global Retail Development Index. He is also of the opinion that this is positive. Diagram 2 also focusses on the Global Retail Development Index indicating the position of the 30 developing countries in 2012. South Africa only featured for two years on this particular list. This indicated that South Africa should never have been part of this list at all.

3
DIAGRAM 2
TOP 30 DEVELOPING COUNTRIES ON GLOBAL RETAIL DEVELOPMENT INDEX
Source: AT Kearney; Global Retail Expansion: Keeps on moving. http://www.atkearney.com (adjusted by author) Both these TV commentators highlighted that the fact that South Africa is not on the list, must be regarded as very positive. Strong emphasis was made that South Africa should be regarded as the stepping stone for other retailers and developers into the rest of Africa.

4
According to Graph 1 there is a clear indication of the emphasis on organised retail in developed countries like the US, UK and Europe, compared to traditional retailing in India, China, Indonesia and Africa. During 2010 South Africa was at the stage where the ratio between traditional and organised/planned retailing was at a level of 50/50. This clearly indicates that the South African retail market is strongly developed although a large proportion of traditional retail still exists. This trend is changing with a strong increase in planned and organised retail facilities. GRAPH 1
ORGANISED RETAIL IN DEVELOPED COUNTRIES VERSUS TRADITIONAL RETAILING IN DEVELOPING COUNTRIES
Source: Adjusted by author, 2010
The main question to be answered is how the South African shopping centre market compares to selected countries in the developing and developed world.
3
10
20
35
40
50
55
81
85
97
90
80
65
60
50
45
19
15
0 20 40 60 80 100 120
India
Africa
China
Europe
Thailand
South Africa
Malaysia
Taiwan
US
%
TRADITIONAL VS ORGANISED RETAILING
Traditional Organised

5
The International Council of Shopping Centres compiles country fact sheets since 2007 (www.ICSC.org). Included is information regarding the number of shopping centres per country, shopping centre by different size categories, sales information, employment figures, demographic information, the five largest shopping centres per country as well as the five largest retailers and shopping centre owners. A selection of countries was used to compare the South African shopping centre situation. The benchmark countries are as follows: TABLE 1
BENCHMARK COUNTRIES USED TO COMPARE THE SOUTH AFRICAN SHOPPING CENTRE INDUSTRY
Developing Countries o Brazil o South Africa o Argentina o Mexico o Turkey
Developed Countries o Australia o Portugal o New Zealand o Sweden o Germany
South Africa has 1 785 shopping centres larger than 2 000 m². The closest country on the list is Australia with 1 452 shopping centres larger than 2 000 m². GRAPH 2
0
200
400
600
800
1000
1200
1400
1600
1800
NUMBER OF SHOPPING CENTRES PER COUNTRY 2011
Developing Countries Developed Countries

6
In the size category, 2 000m² - 20 000m², South Africa has 901 centres compared to Australia at 783. The closest countries in this regard are Sweden with 173 and Mexico with 116 centres. South Africa has 144 shopping centres between 20 000m² - 40 000m², while Australia is much stronger in this category with 289 centres. GRAPH 3
GRAPH 4
0
200
400
600
800
1000
1200
NUMBER OF CENTRES ACCORDING TO SIZE (2 000m² to 40 000m²)
40 000m²-20 000m² 2 000m² to 20 000m²
0
10
20
30
40
50
60
70
80
90
NUMBER OF CENTRES ACCORDING TO SIZE (40 000m² TO 80 000m²)
80 000m² + 40 000m²-80 000m²

7
South Africa started building shopping centres during the mid 1960s. At that stage the example of the American Shopping Centre Development model focussing on decentralised shopping centres was followed. The total retail market currently consists of almost 21 million m² and is in line with the retail shopping centre floor area in Australia. All other countries indicated on this list have less retail space. There are many reasons for a slower start or a different retail approach especially in the European cities. GRAPH 5
The largest shopping centres in Australia, Turkey and Mexico are all above 160 000 m² while the largest in South Africa is 154 840 m². Some of the large superregional centres in South Africa compare very favourably with centres in the countries used as a comparison. Sandton City in Johannesburg is catering for tourists all over Africa, Europe, USA, South America and Australia. TABLE 2
ORIGIN OF TOURIST SHOPPERS TO SANDTON CITY
Country %
Southern Africa 23 Europe 19
Eastern Africa 17 Central Africa 11
Australia 8
North America 7 United Kingdom 6
South America 5 Middle East 4
0
5,000,000
10,000,000
15,000,000
20,000,000
25,000,000
TOTAL SHOPPING CENTRE GLA m²

8
GRAPH 6
New Zealand
Sweden
Argentina
Portugal
Brazil
Germany
South Africa
Mexico
Turkey
Australia
m²
SIZE OF LARGEST CENTRE IN EACH COUNTRY

9
The total shopping centre floor area per 100 inhabitants is a good indicator of the level of supply in relation to the total population. This is also an indirect indication of disposable income per capita per country. (See Table 3) South Africa has 40 m² per 100 people which is higher than Portugal, Argentina, Germany, Mexico and Turkey. It is however lower than Australia, Sweden and New Zealand. Australia at the moment is at 92 m² per 100 of the population. GRAPH 7
TABLE 3
PER CAPITA GDP AT CURRENT PRICES (US$)
Country 2011
Australia 67,039
Sweden 57,134 Germany 43,865
Portugal 22,226 Brazil 12,594
Argentina 10,994 Turkey 10,524
Mexico 10,063
South Africa 8,090 Source: United National Fact sheets per Country, 2011
The South African Shopping Centre market is not on the Global Retail Development Index for Developing Countries because of its maturity, size and level of sophistication. The local industry is regarded as a stepping stone into the rest of Africa. In a direct comparison between developed and developing countries South Africa is highly rated and in most cases compares better than most other developing and developed countries, used in a benchmark comparison.
0
20
40
60
80
100
m²/
10
0 in
hab
itan
ts
Countries
TOTAL SHOPPING CENTRE FLOORSPACE PER 100 INHABITANTS

10
The next main question is:
What is the benchmark performance of superregional, regional and community centres in South Africa in terms of:
o average time shoppers spend in a centre o average drive time o frequency of visits and o pedestrian volumes per centre
This information is based on tracking information included in primary market research conducted by Urban Studies since 1998 at more than 240 shopping centres throughout South Africa. Frequency of Visits The weekly support for all different types of shopping centres varies from as high as 86% weekly visitors supporting neighbourhood centres down to 46% support of superregional centres once a week. These two types of centres represent the extreme ends of different weekly trips mainly due to the role and function played by each of these different centres in the hierarchy of shopping centres. The weekly support for community, small regional and regional centres has been very consistent moving in the same band for at least the last 10 years. These three categories of centres are more or less supported by 60% - 64% of their customers on a weekly or more frequent basis. The weekly support levels, since 1998, have remained very consistent. See Graph 8. GRAPH 8
1998
1999
2000
2001
2002
2003
2004
2005
2006
2007
2008
2009
2010
2011
2012
Neighbourhood 86 77 73 75 73 80 75 81 88 78 75 76 83 78 78
Community 76 74 72 60 69 66 63 66 64 74 62 63 71 66 59
Small Regional 74 71 65 53 67 52 63 64 68 64 58 60 62 57 62
Regional 68 64 68 64 69 65 60 63 60 67 65 64 59 63 57
Superregional 53 47 54 53 41 49 49 49 50 48 53 46
30
40
50
60
70
80
90
100
%
% OF SHOPPERS VISITING DIFFERENT SIZE CENTRES ON A WEEKLY OR MORE FREQUENT BASIS

11
The graph below shows the average percentage of weekly visits for different types of centres during 1998 – 2012. This confirms the abovementioned annual averages. Value centres were analysed separately and compared to the figures of superregional centres. GRAPH 9
The 2012 figures indicate slightly fewer visits per month compared to the average for the last 14 years. The reason for this could be poorer economic conditions, the higher level of competition, and the fact that most metropolitan shoppers support at least two regional centres, while up to 5 different convenient centres and supermarkets are supported. GRAPH 10
78
67 63 64
49 54
0
10
20
30
40
50
60
70
80
90
Neighbourhood Community Small Regional Regional Superregional Value Centres
%
AVERAGE WEEKLY SUPPORT FOR DIFFERENT TYPE CENTRES: 1998-2012 (%)
Neighbourhood Community Small Regional Regional Superregional
Ave 1998-2012 7.6 6.9 6.5 6.4 5.2
2012 7.6 6.1 6.3 5.5 4.6
0.0
1.0
2.0
3.0
4.0
5.0
6.0
7.0
8.0
9.0
Visits
VISITS PER MONTH PER SHOPPING CENTRE TYPE

12
The average dwell time in a superregional centre is 150 minutes, compared to 30 - 40 minutes in a neighbourhood centre. The time spent in regional shopping centres is the most consistent at ± two hours per visit. GRAPH 11
GRAPH 12
1998 1999 2000 2001 2002 2003 2004 2005 2006 2007 2008 2009 2010 2011 2012
Neighbourhood 31 42 43 56 43 43 42 41 54 37 44 31 31 35 36
Community 52 53 89 65 76 88 82 74 78 80 80 64 58 78 84
Small Regional 92 70 113 84 105 113 102 100 94 99 81 101 76 112 97
Regional 111 117 122 108 114 130 115 117 108 117 125 108 109 116 118
Superregional 154 163 172 165 150 150 138 128 128 135 130 149
Value Centres 62 74 70 74 68 61 40 65 40 55 60 75
0
20
40
60
80
100
120
140
160
180
200
Minutes
AVERAGE DWELL TIME PER TRIP FOR DIFFERENT TYPES OF
CENTRES
41
73
96
116
150
63
0
20
40
60
80
100
120
140
160
Neighbourhood Community Small Regional Regional Superregional Value Centres
AVERAGE DWELL TIME PER TRIP FOR DIFFERENT TYPES OF
CENTRES: 1998-2012
13
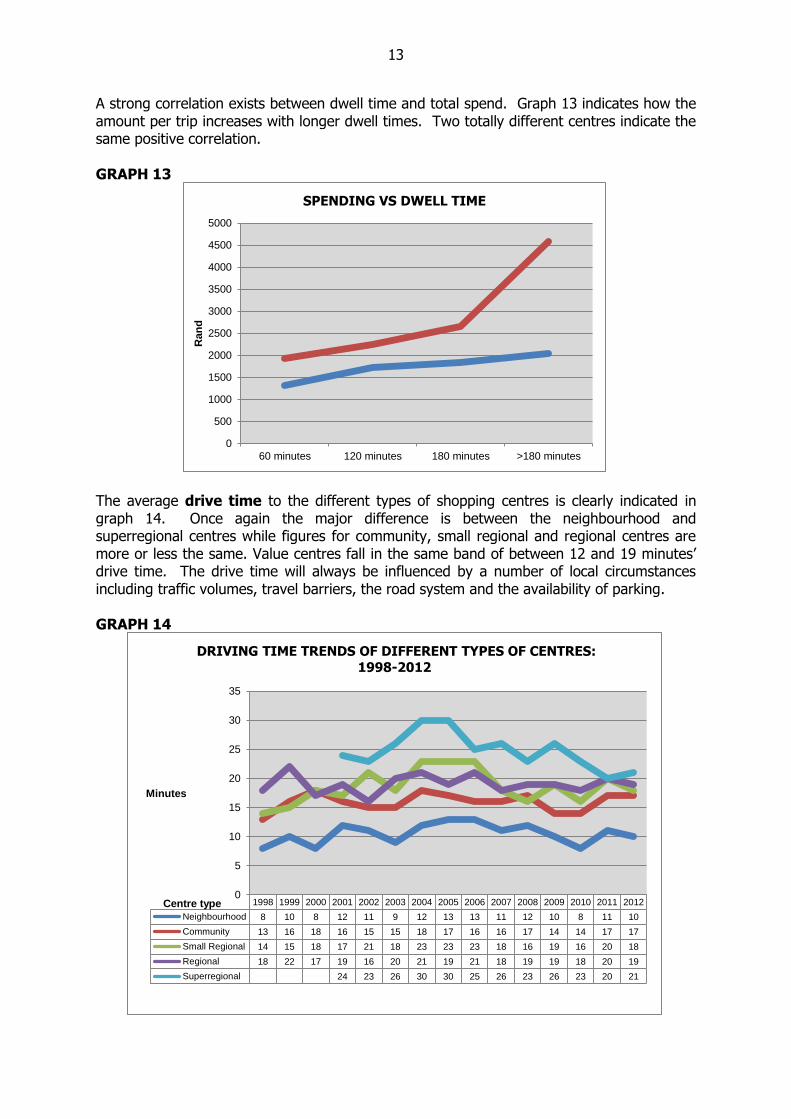
A strong correlation exists between dwell time and total spend. Graph 13 indicates how the amount per trip increases with longer dwell times. Two totally different centres indicate the same positive correlation. GRAPH 13
The average drive time to the different types of shopping centres is clearly indicated in graph 14. Once again the major difference is between the neighbourhood and superregional centres while figures for community, small regional and regional centres are more or less the same. Value centres fall in the same band of between 12 and 19 minutes’ drive time. The drive time will always be influenced by a number of local circumstances including traffic volumes, travel barriers, the road system and the availability of parking. GRAPH 14
0
500
1000
1500
2000
2500
3000
3500
4000
4500
5000
60 minutes 120 minutes 180 minutes >180 minutes
Ran
d
SPENDING VS DWELL TIME
1998 1999 2000 2001 2002 2003 2004 2005 2006 2007 2008 2009 2010 2011 2012
Neighbourhood 8 10 8 12 11 9 12 13 13 11 12 10 8 11 10
Community 13 16 18 16 15 15 18 17 16 16 17 14 14 17 17
Small Regional 14 15 18 17 21 18 23 23 23 18 16 19 16 20 18
Regional 18 22 17 19 16 20 21 19 21 18 19 19 18 20 19
Superregional 24 23 26 30 30 25 26 23 26 23 20 21
0
5
10
15
20
25
30
35
Minutes
Centre type
DRIVING TIME TRENDS OF DIFFERENT TYPES OF CENTRES:
1998-2012

14
The benchmark figure for the number of people per household is currently at 3.5 people and for the number of earners per household on average at 1.9 people per household. These figures are very consistent and were confirmed by Census 2011. GRAPH 15
The most important benchmark indicators are the number of people per m² per month per centre. Table 4 gives an indication of the average number of people per square meter per month entering a particular centre. The average number of people/m²/month for neighbourhood and community centres varies between 17 and 18 people per square meter per month respectively. These figures are a function of the micro location of these centres and their focus on convenience products. Many of the smaller regional and larger community centres built over the last 5 to 8 years fall in the category of 10 people/m²/month and less. This clearly indicates that these centres were built too early or in many instances these centres were built too big. Most of the centres in this same category doing more than 20 people/m²/per month are linked to taxi ranks or are located in township areas. This clearly reflects very high pedestrian volumes. These centres are mostly very good performers. There are also complaints from shoppers in these centres that they are too busy and overcrowded. Some of the regional centres built during the last 10 years are also reflecting ±10 people/m²/month. This is much lower than the average of 14 people/m²/month. Many of the older regional centres are performing well above average. This also indicates that it does take time for a shopping centre to establish itself and for the market to expand to offer the critical mass required. Many of the older regional centres also experience higher levels of residential densification compared to centres located in Greenfields developments where the residential market has been very slow in providing new housing facilities. These older centres should be upgraded offering the latest retailer trends.
0
0.5
1
1.5
2
2.5
3
3.5
4
2006 2007 2008 2009 2010 2011 2012
Num
ber
AVERAGE HOUSEHOLD SIZE AND NUMBER OF EARNERS
Household size Number of earners

15
The range for superregional centres varies between 11 and 14 people/m²/month. This also portrays a very narrow band indicating that most superregional centres attract more or less the same pedestrian volumes. TABLE 4
PEDESTRIAN VOLUMES PER CENTRE TYPE PER M² PER MONTH
Type of centre People/m²/month Average number of people/m²/month
Neighbourhood centres Community centres Large community/small regional centres Regional centres Superregional centres
6.3-30.0 6.0-54.0 6.5-34.0 7.8-28.0 11.3-14.0
17.1 18.3 15.5 14.0 12.7
In conclusion, the following is very clear regarding the South African Shopping Centre industry:
South African compares very favourably with some of the developed countries and a selected group of developing countries.
Local benchmark figures clearly highlight consistency of trends as far as most benchmarking criteria are concerned.
The people/m²/month is a very important indicator with a good correlation with regard to the performance of different centres.
The retail sector is the third largest contributor to the South African economy. Retail sales during 2012 reached a total spend of R633 billion. The current level of urbanisation in South Africa is ±60% and will further increase to ± 70% by 2030/2040 (National Development Plan, 2011, p.7). This will hopefully increase the level of disposable income as well as the retail space per 100 inhabitants to 0.5 per m² per capita. This will further increase the demand for shopping centre retail space by a further 4-7 million m² by 2025/2030.

16
REFERENCES
AT Kearney. Global Retail Expansion: Keeps on moving. http://www.atkearney.
International Council of Shopping Centres, Country Fact Sheets since 2007, www.ICSC.org.
Moriarty, Mike (partner at AT Kearney). 15 June 2012. Interviewed by Bloomberg TV: The 2012
Global Retail Development Index.
National Planning Commission, November 2011: National Development Plan, Vision for 2030.
Plaizier, William: (partner at AT Kearney). 12 June 2012. Interviewed by CNBC Africa, the 2012 Global Retail Development Index.
Prinsloo, Dirk. A. 2012: Where are we coming from and where are we going? South African Council of Shopping Centres: Shopping Centre Directory, 2012.
South African Council of Shopping Centres: Shopping Centre Directory, 2012. Johannesburg.
United Nations Fact Sheets per Country, 2011.
Urban Studies, 1998 – 2012, Shopping Centre Tracking based on 240 primary market surveys.