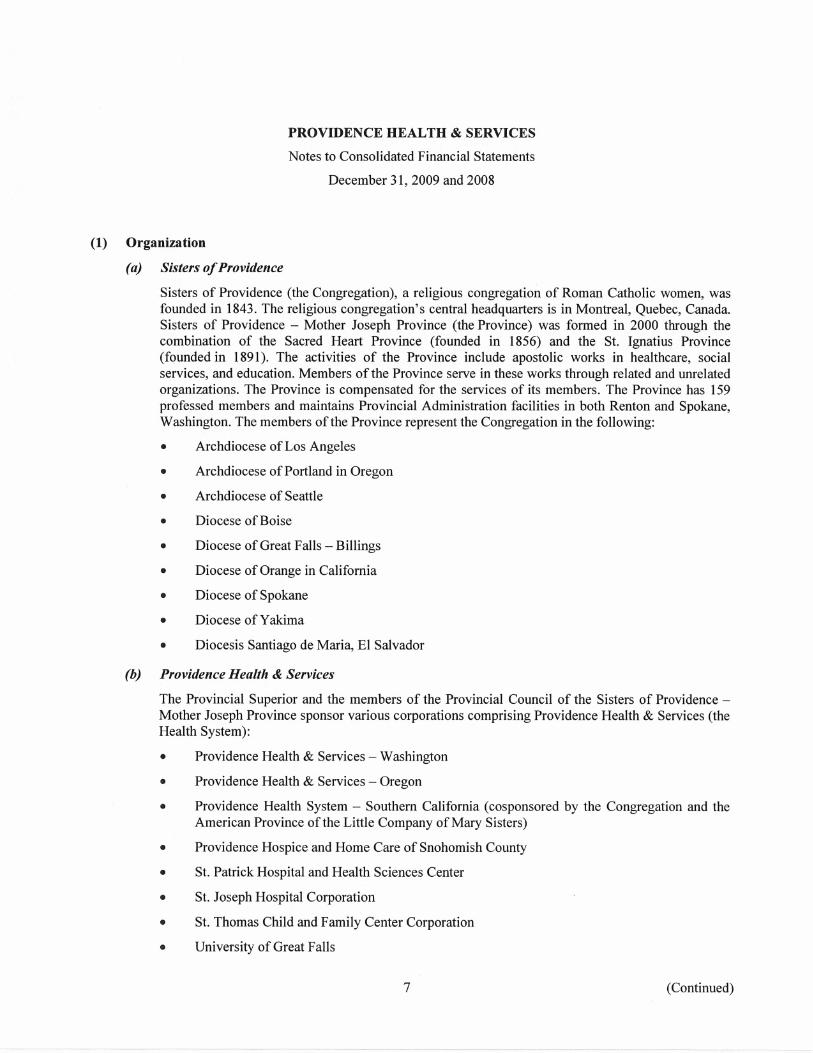
benefiting our communities providing for the poor and
TRANSCRIPT

To learn more about the Providence Mission, please visit www.providence.org.
Providence Health & Services provides compassionate, high-quality care; while remaining good stewards of resources. Our commitment to financial sustainability, coupled with the spirit and drive of the people of Providence, allows our ministry to continue to deliver the highest quality care, provide a larger community benefit and offer an increased amount of free and discounted care to those who otherwise could not afford health care. Benefiting Our Communities As a not-for-profit Catholic health care ministry, Providence embraces its responsibility to provide for the needs of the communities it serves – especially the poor and vulnerable. Despite a difficult economy and the swelling ranks of uninsured and underinsured people, all Providence regions increased contributions to community benefit programs in 2009, for a total of more than $581 million. This is a Providence-wide increase of 14 percent over 2008 community benefit spending. Providing for the Poor and Vulnerable The downturn of the economy has had tremendous effects on access to health care. Now, more than ever, the charity care Providence provides is necessary to ensure all people, regardless of their economic situation, can access quality health care. In 2009, Providence offered $200 million in charity care. This is nearly an 18 percent increase from the amount of free and discounted care offered in 2008. Consistent with other Catholic health care organizations, Providence does not include the unpaid cost of Medicare, Medicaid or bad debt in its cost of charity care numbers. Sustaining Our Mission The economic downturn meant Providence needed to take immediate precautions to prepare for the increased cost of charity care and decreased patient volumes for voluntary procedures; while remaining financially healthy. Starting in 2008, Providence began a system-wide stewardship initiative to reduce expenses and identify areas for operational improvement. The goal was to make sure Providence ministries didn’t just weather the economic downturn, but were able to remain financially healthy for the long-term. In 2009, Providence net operating income was $323 million; exceeding budget by $44 million. This was largely due to a $95 million reduction in expenses and improved efficiencies. While these have been difficult and unpredictable economic times, the Providence Mission is firmly rooted in the work started more than 154 years ago by the Sisters of Providence. This heritage is an inspiration and guides Providence & Health Services to be a constant and supportive presence in the communities it serves.
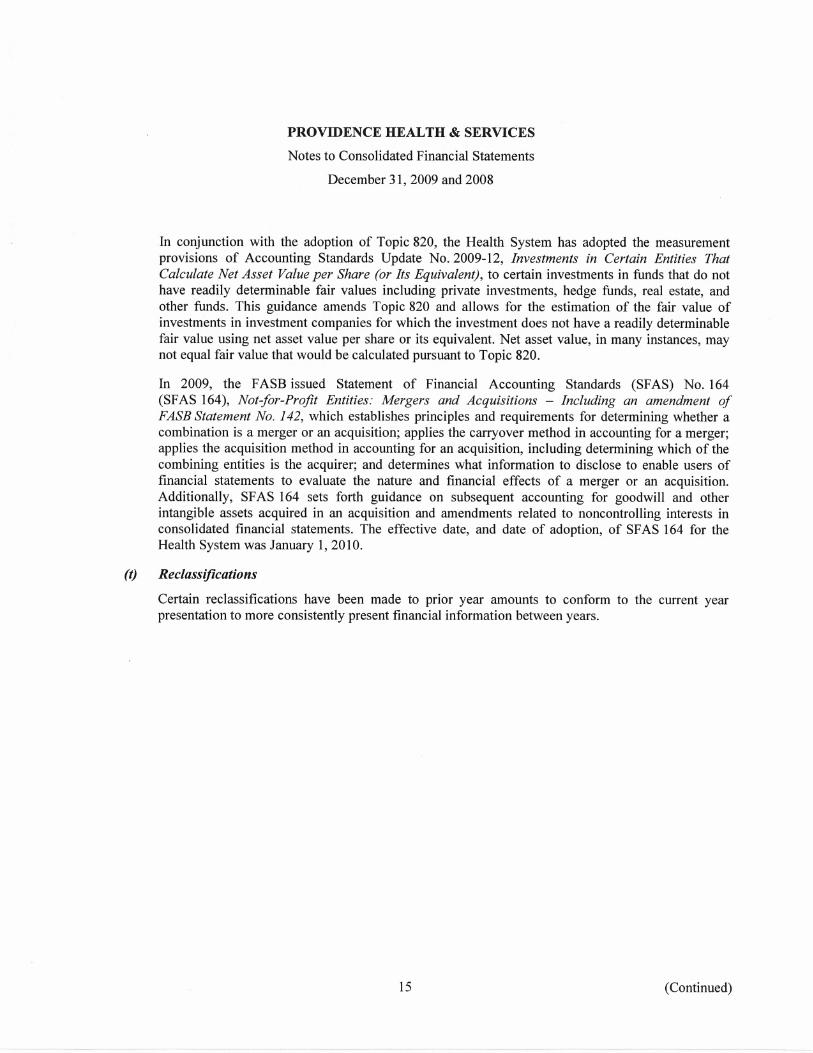
1
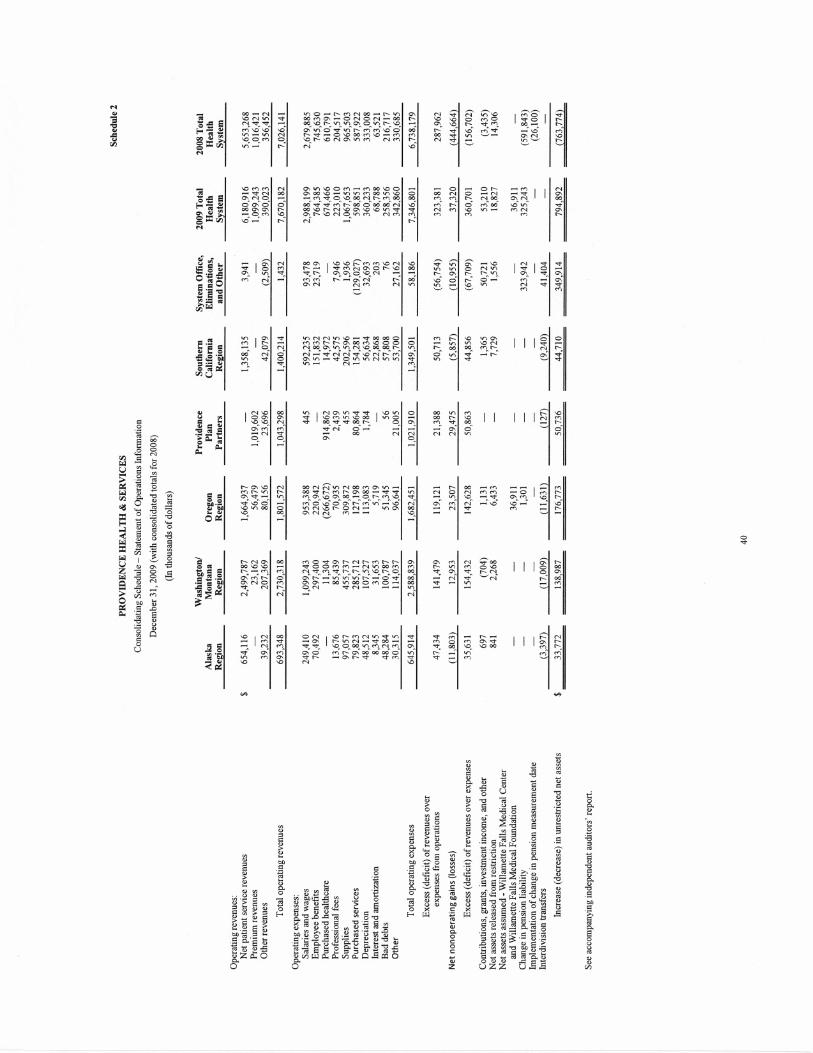
Fiscal Year End December 31, 2009 – Financial Performance Report Net operating income of $323.4 million exceeded budget by $44.5 million while running $35.4 million better than prior year-to-date. In summary, the positive budget variance was primarily driven by expense management. Year-to-date net income of $360.7 million exceeded budget by $14.8 million while running $517.4 million better than prior year-to-date. The following table presents consolidated key financial indicators:
Key Financial Indicators
---- YTD December 2009 ----
Actual Budget 2008 Net Operating Income % Net Operating Income Return
$323.4m 4.2%
$278.9m 3.6%
$288.0m 4.1%
Net Income (loss) $360.7m $345.9m ($156.7m) Charity Care Services % Net Patient Revenue 5.7% 4.3% 5.2% Inpatient Activity – Inpatient Admissions 261,439 274,641 253,023 Outpatient Activity – Outpatient Revenue $5,673m $5,420m $4,846m Long-term Care Activity – Resident Days 446,883 449,786 443,907 Rate - Net Service Revenue/CMAA $10,945 $11,069 $10,584 Labor Productivity – FTEs/AOB 8.12 7.99 7.98 Supplies % Net Operating Revenue 13.8% 13.8% 13.7% Expense per CMAA $10,409 $10,607 $10,081 Accounts Receivable Days 49 50 51 Days of Cash on Hand 158 137 145
Inpatient admissions ran 4.8% below budget year-to-date but 3.3% greater than prior year-to-date. On an annualized basis, the 4.8% budget shortfall represents 36 admissions per calendar day or approximately 1 visit per calendar day per hospital. The most significant driver of the overall negative budget variance was driven by shorter than normal flu season, fewer than budgeted elective surgeries, growing specialty physician competition and continued conversion of inpatient services into outpatient settings. Long-term care activity ran 0.6% below budget but 0.7% greater than prior year. The 0.6% budget shortfall represents 8 fewer patients served per calendar day. The below budget performance occurred in all regions. The most significant negative of the overall negative budget variance has been driven by shorter lengths of stay and reduced admissions related to the previously mentioned inpatient hospital admissions shortfall. Net service revenue per CMAA (case mix adjusted admission) ran 1.1% below budget and 3.4% greater than prior year. The majority of the overall negative budget variance across the System is the result of the weak economy. It is anticipated negative budget variances will continue to grow as unemployment increases, state budget cuts are implemented and COBRA benefits expire putting further pressure on the System’s cost structure and operational improvement plans. Labor
2
productivity ran 1.7% below budget and 1.8% below prior year. The below budget performance occurred in all regions. The strength of the Alaska region’s performance has been expense management which is currently running 2.9% better than budget. The primary challenges for the Alaska region have been the 6.0% shortfall in inpatient admissions and a 2.7% shortfall in supply expense as a percentage of net operating revenue. The year-to-date strengths included positive budget performances of regional services, Kodiak, Providence Alaska Medical Center, mental health and primary care services.
The strength of the Washington/Montana region’s performance has been primarily 3.6% greater than budgeted operating expense efficiency. The primary challenges for the Washington/Montana region have been the 3.8% shortfall in inpatient admissions, 2.8% shortfall in net service revenue per CMAA and a 1.7% overage in average annual wage. The most significant year-to-date negative budget variance occurred in home care, hospice and primary care. The year-to-date strengths include the positive budget performances of nursing home services, acute care facilities, and PAML.
The strength of the Oregon region’s performance has been primarily 0.3% greater than budgeted operating expense efficiency. The primary challenge of the Oregon region is inpatient admissions running 7.6% below budget and 6.3% less than budgeted health plan enrollment driven by 11% unemployment in Portland and the economic impact on the small employer market. The most significant year-to-date negative budget variances occurred in Portland, Seaside, Newberg, home care, regional services, and ambulatory services. The year-to-date strengths included the positive budget performances of Medford, Milwaukie, and the Providence Medical Group.
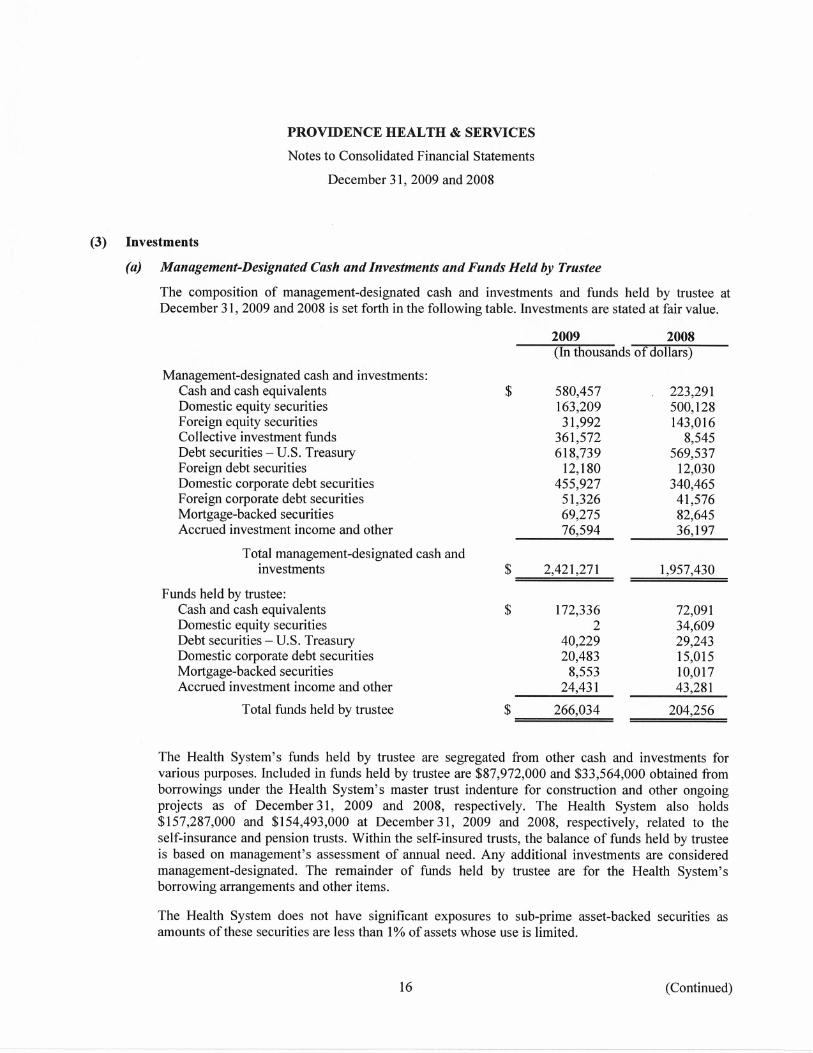
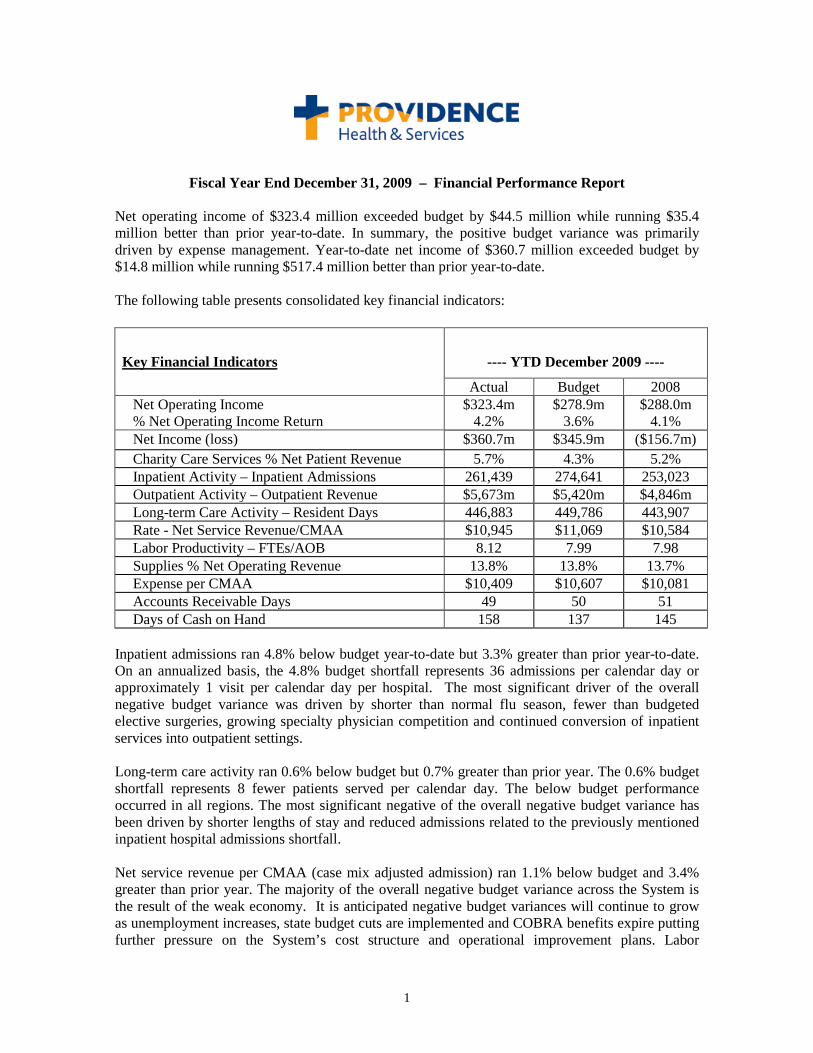
The strength of the California region’s performance has been 1.4% greater than budgeted operating expense efficiency. The primary challenge of the California region has been the previously mentioned acute admissions running 3.3% below budget. The most significant year-to-date negative budget variances occurred in Burbank and the Providence Medical Institute. The year-to-date strengths included the positive budget performances of Mission Hills, Torrance, San Pedro and Tarzana. The following table presents key balance sheet indicators’ performances versus rating agency ratio goals:
Balance Sheet Indicators
---- December 2009 ----
Tracking Goal
Current
FYE Goal
Days of Cash on Hand Yes 158 150 Long-term Debt to Total Capitalization Yes 31% 35% Cash-to-Debt Yes 118% 110%
It should be noted from the table above, the 158 days of cash on hand includes $64.3 million of unspent debt; excluding the unspent debt, cash on hand is at 155 days.
3
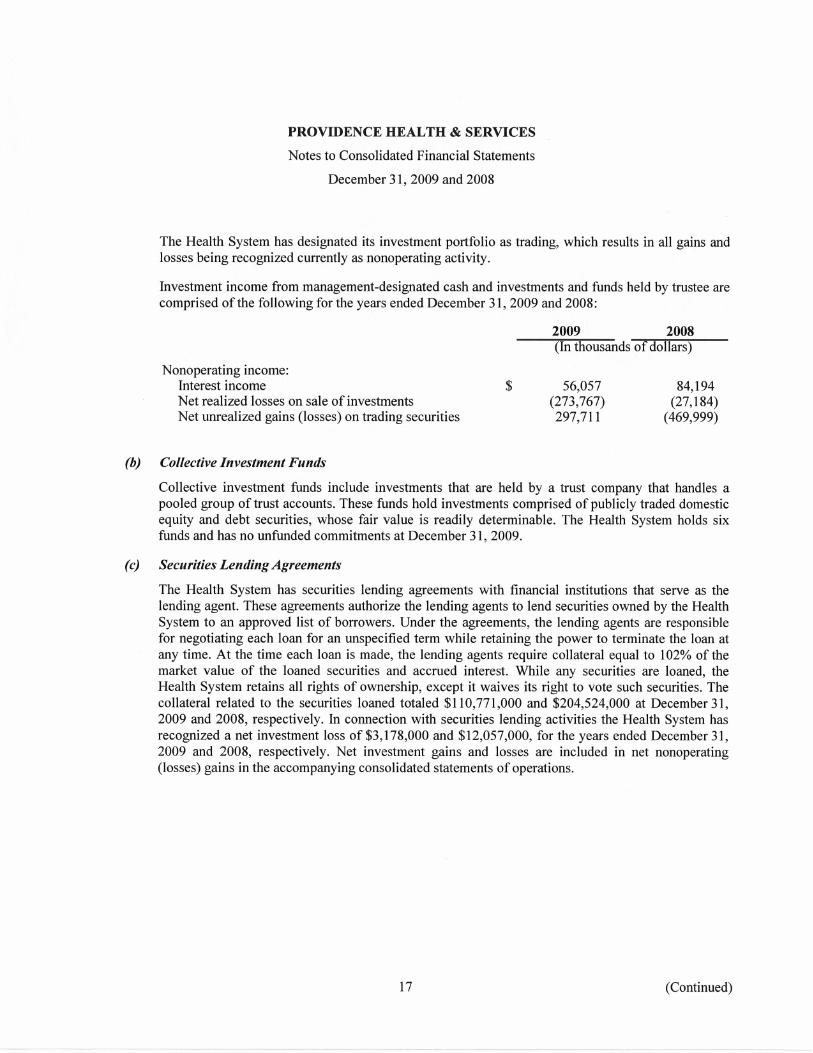
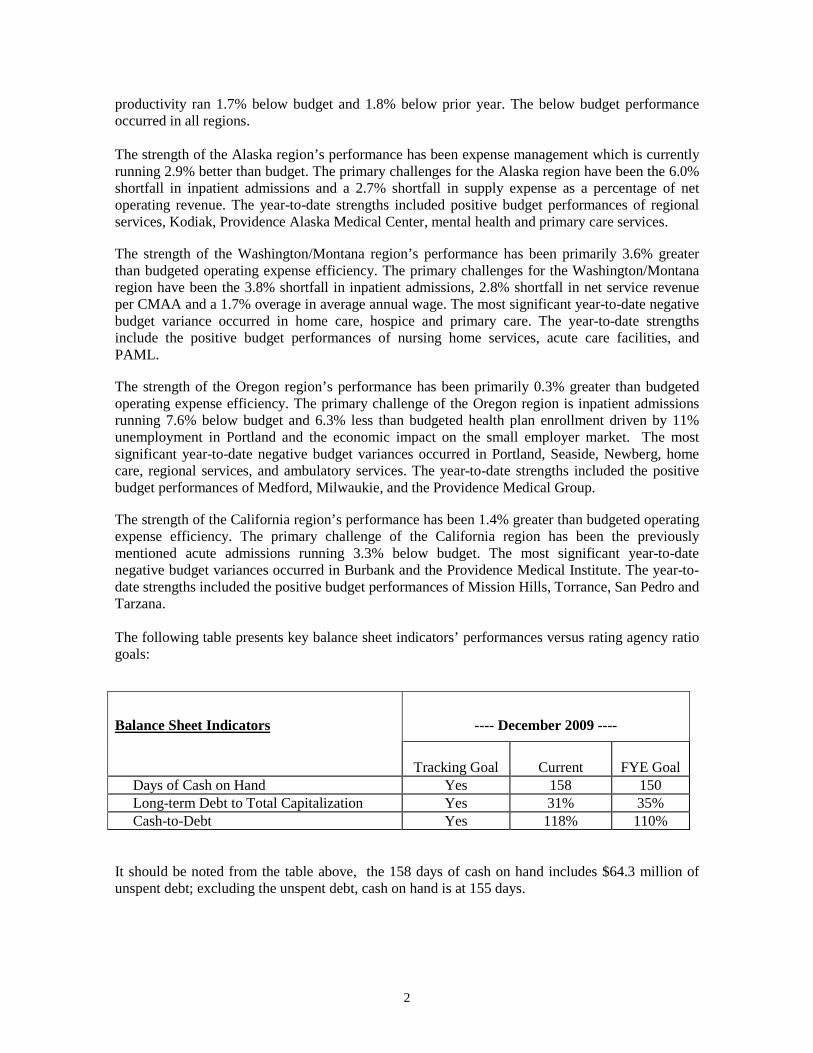
Debt Supported by Self-Liquidity In February 2008, Providence Health & Services (PH&S) held $720.5 million in auction rate debt, in 14 different series of bonds. During the year, PH&S moved quickly to restructure its auction debt and as result currently has approximately $411.5 million in variable-rate vehicles supported by self liquidity. The System reports monthly on its cash and investment balances available to retire maturing short-term debt in the event bonds cannot be remarketed. The table below summarizes the information provided to the rating agencies at the end of the fourth quarter describing cash and investments that could be available for liquidation.
December Metrics In November 2008, the System issued $289,195,000 through the California Health Facilities Authority to refinance a portion of outstanding indebtedness incurred to benefit the System’s California hospitals. During the sale, investors requested additional performance data to assist in ongoing analysis. On the following page is a list of the requested performance metrics. Mike Butler, CFO
Liquidity Assessment Provider Name:Portfolio As of Date:
Cash & Cash Equivalents * 348.66$ -$ (4.56)$ 344.10$ 1.00 344.10$ S&P rated money market funds (> Am) 336.36$ 21.56$ 323.86$ 681.78$ 1.00 681.78$ Highly rated (A-1 or A-1+) dedicated bank line -$ -$ -$ -$ 1.00 -$ Highly rated (A-1 or A-1+) money market instruments (< 1yr) 1.87$ -$ -$ 1.87$ 0.91 1.70$ U.S. Treasury Debt Obligations (> 1 year) 110.59$ 87.83$ -$ 198.42$ 0.91 180.38$ U.S. TIPs 4.31$ 5.91$ -$ 10.22$ 0.87 8.89$ U.S. Agencies (> 1 year) 59.85$ 54.46$ 1.98$ 116.29$ 0.83 96.91$ Investment Grade Debt (that is not included above) 194.47$ -$ 207.55$ 402.02$ 0.67 268.01$ Equities** -$ -$ 41.79$ 41.79$ 0.50 20.90$ Non-Investment Grade Debt 58.14$ -$ 51.18$ 109.32$ 0.40 43.73$
Total 1,114.25$ 169.76$ 621.80$ 1,905.81$ 1,646.40$ Discounted Total 993.78$ 151.93$ 500.69$ Discounted Total
Same Day Notice Next Day Notice > Next Day Notice
$50.00 $61.53 $300.00
Remaining Discounted Assets $943.78 $1,034.18 $1,234.87 411.53$ 1,234.87$ Same Day +/- Next Day +/- > Next Day +/-
Sufficient Sufficient Sufficient
Standard & Poor's Liquidity Assessment Coverage Calculation Spreadsheet (Last Revised February 2009)
INSTRUCTIONS: Fill in Shaded Cells to Compute Coverage Ratios
Asset Allocation (Security Type)
Assets ($ millions) with same day liquidity (T+0)
Assets ($ millions) with next day liquidity (T+1)
Assets ($ millions) with >
same day liquidity (T+2, T+3,…T+n)
$ in MillionsDiscount Factor Discounted Assets
Providence Health & Services
December 31, 2009
Enter amount of Self Liquidity Backed Debt with:
* Cash & Cash Equivalents: Using a discount factor of 1.00 covers only cash/bank deposits with A-1 or A-1+ rated entities and US Government securities maturing in under one year. Additionally, a discount factor of 1.00 can be used for cash/bank deposits with entities rated less than A-1 that are less than $250,000.
TOTAL DEBT SUPPORTED BY SELF LIQUIDITY
TOTAL REMAINING DISCOUNTED
ASSETS
4
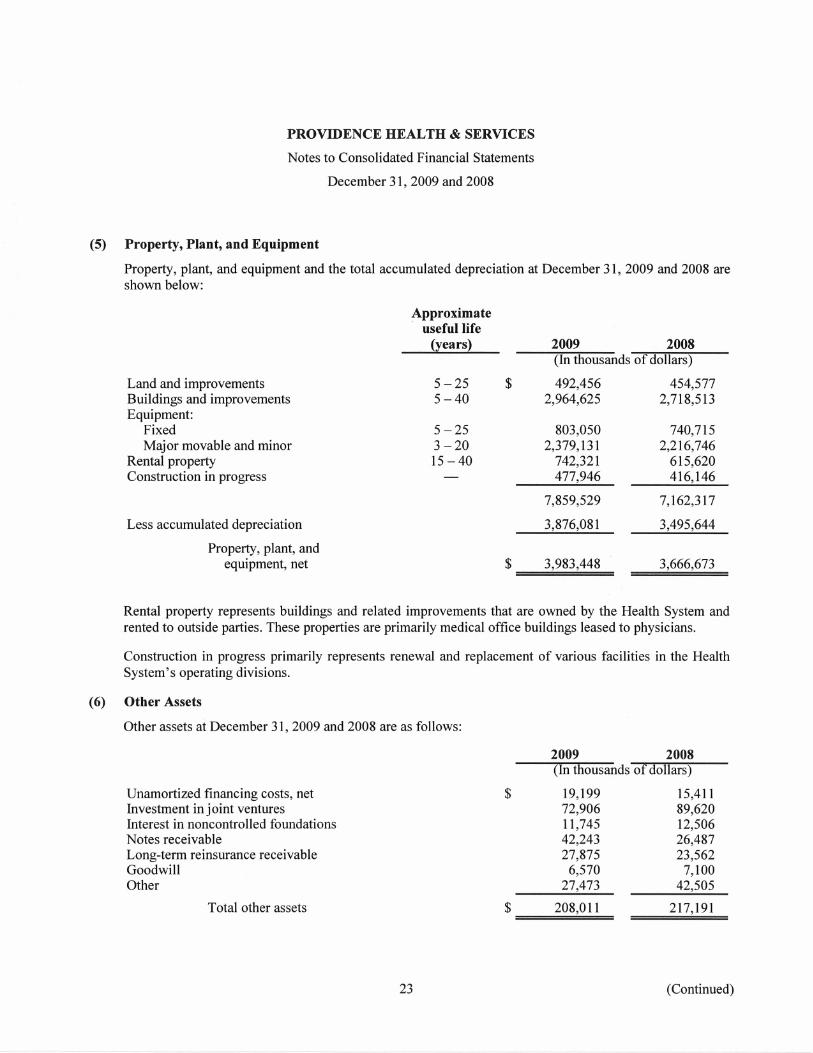
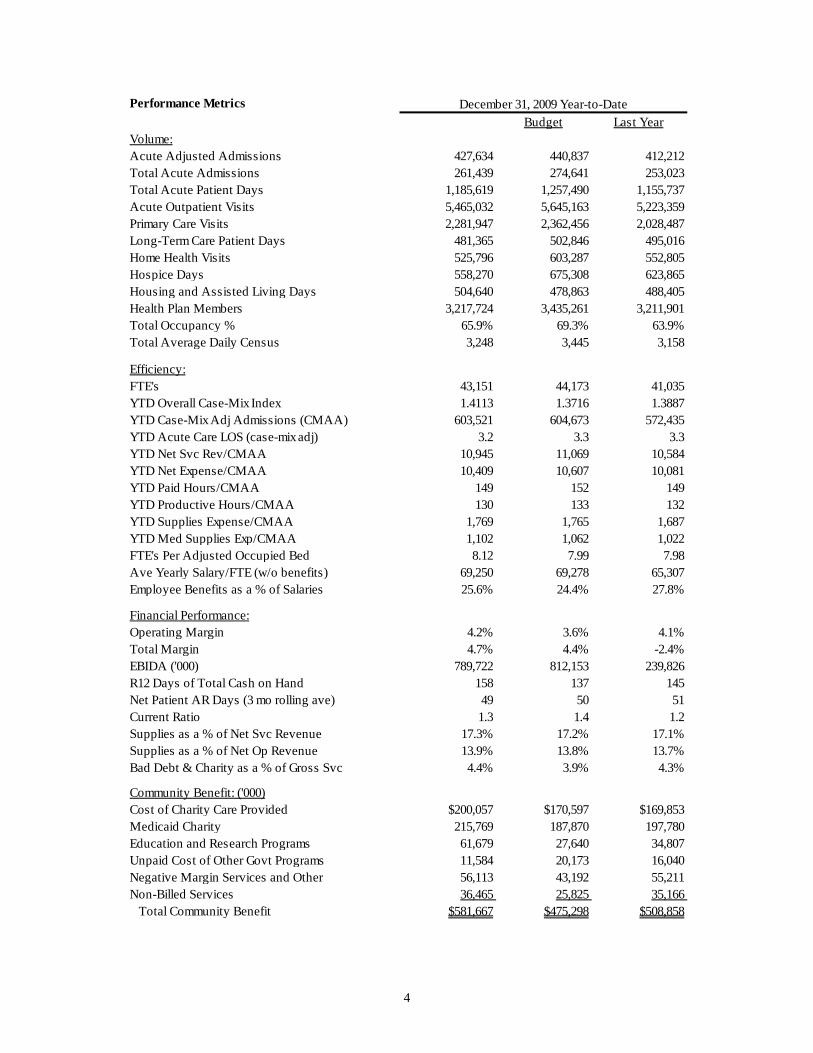
Performance MetricsBudget Last Year
Volume:Acute Adjusted Admissions 427,634 440,837 412,212 Total Acute Admissions 261,439 274,641 253,023 Total Acute Patient Days 1,185,619 1,257,490 1,155,737 Acute Outpatient Visits 5,465,032 5,645,163 5,223,359 Primary Care Visits 2,281,947 2,362,456 2,028,487 Long-Term Care Patient Days 481,365 502,846 495,016 Home Health Visits 525,796 603,287 552,805 Hospice Days 558,270 675,308 623,865 Housing and Assisted Living Days 504,640 478,863 488,405 Health Plan Members 3,217,724 3,435,261 3,211,901 Total Occupancy % 65.9% 69.3% 63.9%Total Average Daily Census 3,248 3,445 3,158
Efficiency:FTE's 43,151 44,173 41,035 YTD Overall Case-Mix Index 1.4113 1.3716 1.3887YTD Case-Mix Adj Admissions (CMAA) 603,521 604,673 572,435 YTD Acute Care LOS (case-mix adj) 3.2 3.3 3.3YTD Net Svc Rev/CMAA 10,945 11,069 10,584 YTD Net Expense/CMAA 10,409 10,607 10,081 YTD Paid Hours/CMAA 149 152 149 YTD Productive Hours/CMAA 130 133 132 YTD Supplies Expense/CMAA 1,769 1,765 1,687 YTD Med Supplies Exp/CMAA 1,102 1,062 1,022 FTE's Per Adjusted Occupied Bed 8.12 7.99 7.98Ave Yearly Salary/FTE (w/o benefits) 69,250 69,278 65,307 Employee Benefits as a % of Salaries 25.6% 24.4% 27.8%
Financial Performance:Operating Margin 4.2% 3.6% 4.1%Total Margin 4.7% 4.4% -2.4%EBIDA ('000) 789,722 812,153 239,826 R12 Days of Total Cash on Hand 158 137 145 Net Patient AR Days (3 mo rolling ave) 49 50 51 Current Ratio 1.3 1.4 1.2Supplies as a % of Net Svc Revenue 17.3% 17.2% 17.1%Supplies as a % of Net Op Revenue 13.9% 13.8% 13.7%Bad Debt & Charity as a % of Gross Svc 4.4% 3.9% 4.3%
Community Benefit: ('000)Cost of Charity Care Provided $200,057 $170,597 $169,853 Medicaid Charity 215,769 187,870 197,780 Education and Research Programs 61,679 27,640 34,807 Unpaid Cost of Other Govt Programs 11,584 20,173 16,040 Negative Margin Services and Other 56,113 43,192 55,211 Non-Billed Services 36,465 25,825 35,166 Total Community Benefit $581,667 $475,298 $508,858
December 31, 2009 Year-to-Date