benelux statistics october 2016 - computer profile · pdf filebenelux statistics october 2016...
TRANSCRIPT

Benelux Statistics October 2016
1. Number of sites - Activity vs. class of site employees ............................................................. 2
2. Number of sites - Activity vs. class of screen quantity ............................................................. 4
3. Number of sites – Activity vs. class of employees in the company ........................................... 6
4. Number of contacts - Jobtitle vs. class of site employees ........................................................ 8
4.1 Available emailaddresses Benelux............................................................................................................. 11
5. CPU – Mainframe, Midrange, Server ..................................................................................... 12
5.1 Number of mini-/mainframe sites .............................................................................................................. 12
5.2 Number of server sites ............................................................................................................................... 12
6. MCO – Desktop, Laptop ........................................................................................................ 13
6.1 Number of desktop sites ............................................................................................................................ 13
6.2 Number of laptop sites ............................................................................................................................... 13
7. PRT – Printer ........................................................................................................................ 14
8. AUX – Storage ...................................................................................................................... 15
9. OPR – (Network) Operating Systems, DBMS, Development tools ........................................... 16
9.1 OPR – Number of operating systems ......................................................................................................... 16
9.2 Number of APPL/DEV and DBMS sites ....................................................................................................... 18
9.3 Virtual Server Software .............................................................................................................................. 18
10. PRG – Critical Applications ................................................................................................... 19
10.1 Applications (ERP/Finance/HR) ................................................................................................................ 19
10.2 Number of BI, CRM and Groupware sites ................................................................................................ 20
10.3 Security, Firewall, Authentication and Encryption ................................................................................... 21
10.3.1 Domain specified .............................................................................................................................. 21
10.3.2 Manufacturer specified .................................................................................................................... 21
10.4 Anti Virus .................................................................................................................................................. 21
10.5 SaaS Solutions........................................................................................................................................... 21
11. LAN/WAN – Local/Wide Area Network ................................................................................. 22
11.1 Network .................................................................................................................................................... 22
11.2 Network Components .............................................................................................................................. 23
12. TEL – Telephony ................................................................................................................... 24
12.1 PBX and Install Date ................................................................................................................................. 24
12.2 VOIP .......................................................................................................................................................... 25
12.3 UC and Video Conferencing...................................................................................................................... 26
12.4 Mobile and Voice Provider ....................................................................................................................... 27
13. MOB - Mobility .................................................................................................................... 28
1
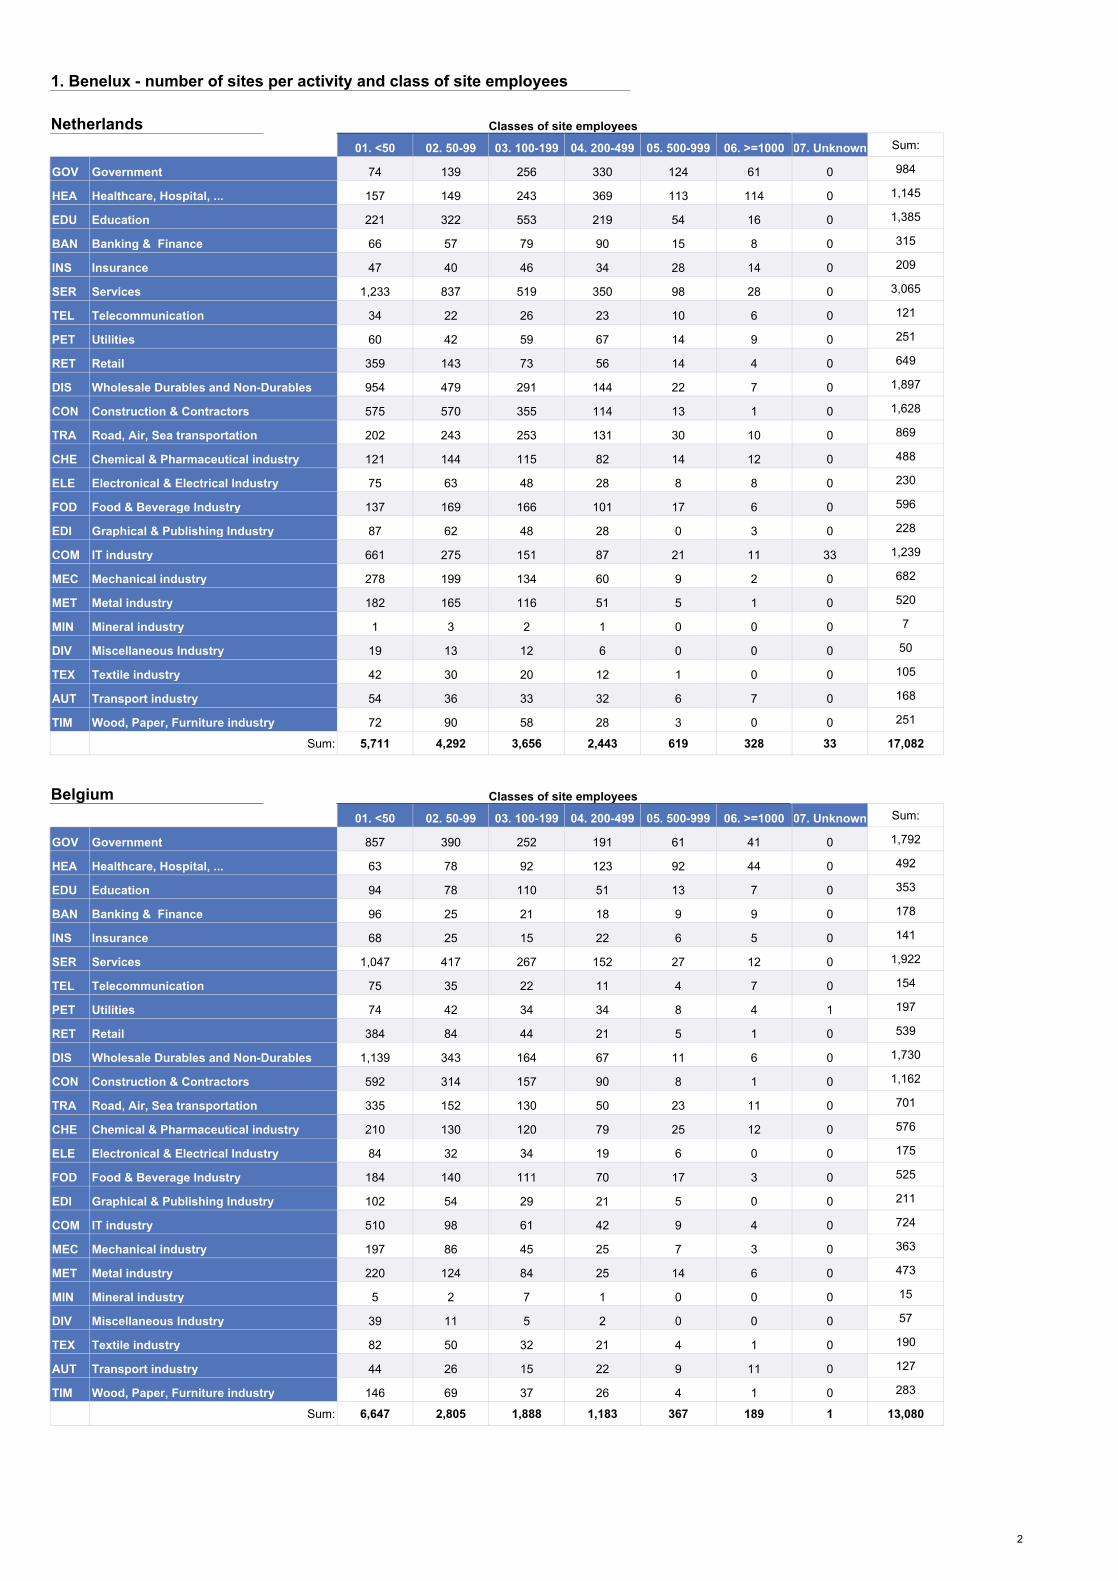
1. Benelux - number of sites per activity and class of site employees
Netherlands01. <50 02. 50-99 03. 100-199 04. 200-499 05. 500-999 06. >=1000 07. Unknown Sum:
GOV Government 74 139 256 330 124 61 0 984
HEA Healthcare, Hospital, ... 157 149 243 369 113 114 0 1,145
EDU Education 221 322 553 219 54 16 0 1,385
BAN Banking & Finance 66 57 79 90 15 8 0 315
INS Insurance 47 40 46 34 28 14 0 209
SER Services 1,233 837 519 350 98 28 0 3,065
TEL Telecommunication 34 22 26 23 10 6 0 121
PET Utilities 60 42 59 67 14 9 0 251
RET Retail 359 143 73 56 14 4 0 649
DIS Wholesale Durables and Non-Durables 954 479 291 144 22 7 0 1,897
CON Construction & Contractors 575 570 355 114 13 1 0 1,628
TRA Road, Air, Sea transportation 202 243 253 131 30 10 0 869
CHE Chemical & Pharmaceutical industry 121 144 115 82 14 12 0 488
ELE Electronical & Electrical Industry 75 63 48 28 8 8 0 230
FOD Food & Beverage Industry 137 169 166 101 17 6 0 596
EDI Graphical & Publishing Industry 87 62 48 28 0 3 0 228
COM IT industry 661 275 151 87 21 11 33 1,239
MEC Mechanical industry 278 199 134 60 9 2 0 682
MET Metal industry 182 165 116 51 5 1 0 520
MIN Mineral industry 1 3 2 1 0 0 0 7
DIV Miscellaneous Industry 19 13 12 6 0 0 0 50
TEX Textile industry 42 30 20 12 1 0 0 105
AUT Transport industry 54 36 33 32 6 7 0 168
TIM Wood, Paper, Furniture industry 72 90 58 28 3 0 0 251
Sum: 5,711 4,292 3,656 2,443 619 328 33 17,082
Classes of site employees
Belgium01. <50 02. 50-99 03. 100-199 04. 200-499 05. 500-999 06. >=1000 07. Unknown Sum:
GOV Government 857 390 252 191 61 41 0 1,792
HEA Healthcare, Hospital, ... 63 78 92 123 92 44 0 492
EDU Education 94 78 110 51 13 7 0 353
BAN Banking & Finance 96 25 21 18 9 9 0 178
INS Insurance 68 25 15 22 6 5 0 141
SER Services 1,047 417 267 152 27 12 0 1,922
TEL Telecommunication 75 35 22 11 4 7 0 154
PET Utilities 74 42 34 34 8 4 1 197
RET Retail 384 84 44 21 5 1 0 539
DIS Wholesale Durables and Non-Durables 1,139 343 164 67 11 6 0 1,730
CON Construction & Contractors 592 314 157 90 8 1 0 1,162
TRA Road, Air, Sea transportation 335 152 130 50 23 11 0 701
CHE Chemical & Pharmaceutical industry 210 130 120 79 25 12 0 576
ELE Electronical & Electrical Industry 84 32 34 19 6 0 0 175
FOD Food & Beverage Industry 184 140 111 70 17 3 0 525
EDI Graphical & Publishing Industry 102 54 29 21 5 0 0 211
COM IT industry 510 98 61 42 9 4 0 724
MEC Mechanical industry 197 86 45 25 7 3 0 363
MET Metal industry 220 124 84 25 14 6 0 473
MIN Mineral industry 5 2 7 1 0 0 0 15
DIV Miscellaneous Industry 39 11 5 2 0 0 0 57
TEX Textile industry 82 50 32 21 4 1 0 190
AUT Transport industry 44 26 15 22 9 11 0 127
TIM Wood, Paper, Furniture industry 146 69 37 26 4 1 0 283
Sum: 6,647 2,805 1,888 1,183 367 189 1 13,080
Classes of site employees
2

1. Benelux - number of sites per activity and class of site employees
Luxembourg01. <50 02. 50-99 03. 100-199 04. 200-499 05. 500-999 06. >=1000 Sum:
GOV Government 107 16 12 11 6 4 156
HEA Healthcare, Hospital, ... 1 3 6 4 3 3 20
EDU Education 4 3 10 5 1 0 23
BAN Banking & Finance 65 26 28 26 9 6 160
INS Insurance 20 4 8 3 1 0 36
SER Services 110 43 31 18 7 4 213
TEL Telecommunication 18 10 5 3 2 0 38
PET Utilities 11 6 1 3 1 0 22
RET Retail 16 4 8 4 3 1 36
DIS Wholesale Durables and Non-Durables 32 17 16 2 2 0 69
CON Construction & Contractors 28 30 19 21 2 0 100
TRA Road, Air, Sea transportation 16 12 9 8 3 1 49
CHE Chemical & Pharmaceutical industry 12 5 4 5 0 1 27
ELE Electronical & Electrical Industry 8 1 4 2 0 0 15
FOD Food & Beverage Industry 5 5 1 4 1 0 16
EDI Graphical & Publishing Industry 5 3 3 0 1 0 12
COM IT industry 48 25 17 5 1 0 96
MEC Mechanical industry 5 8 4 1 1 0 19
MET Metal industry 9 7 7 5 2 1 31
MIN Mineral industry 2 0 0 0 0 0 2
DIV Miscellaneous Industry 2 2 2 0 1 0 7
TEX Textile industry 0 1 1 0 0 0 2
AUT Transport industry 2 2 3 1 5 0 13
TIM Wood, Paper, Furniture industry 5 1 0 2 0 0 8
Sum: 531 234 199 133 52 21 1,170
Classes of site employees
01. <50 02. 50-99 03. 100-199 04. 200-499 05. 500-999 06. >=1000 07. Unknown Sum:
GOV Government 1,038 545 520 532 191 106 0 2,932
HEA Healthcare, Hospital, ... 221 230 341 496 208 161 0 1,657
EDU Education 319 403 673 275 68 23 0 1,761
BAN Banking & Finance 227 108 128 134 33 23 0 653
INS Insurance 135 69 69 59 35 19 0 386
SER Services 2,390 1,297 817 520 132 44 0 5,200
TEL Telecommunication 127 67 53 37 16 13 0 313
PET Utilities 145 90 94 104 23 13 1 470
RET Retail 759 231 125 81 22 6 0 1,224
DIS Wholesale Durables and Non-Durables 2,125 839 471 213 35 13 0 3,696
CON Construction & Contractors 1,195 914 531 225 23 2 0 2,890
TRA Road, Air, Sea transportation 553 407 392 189 56 22 0 1,619
CHE Chemical & Pharmaceutical industry 343 279 239 166 39 25 0 1,091
ELE Electronical & Electrical Industry 167 96 86 49 14 8 0 420
FOD Food & Beverage Industry 326 314 278 175 35 9 0 1,137
EDI Graphical & Publishing Industry 194 119 80 49 6 3 0 451
COM IT industry 1,219 398 229 134 31 15 33 2,059
MEC Mechanical industry 480 293 183 86 17 5 0 1,064
MET Metal industry 411 296 207 81 21 8 0 1,024
MIN Mineral industry 8 5 9 2 0 0 0 24
DIV Miscellaneous Industry 60 26 19 8 1 0 0 114
TEX Textile industry 124 81 53 33 5 1 0 297
AUT Transport industry 100 64 51 55 20 18 0 308
TIM Wood, Paper, Furniture industry 223 160 95 56 7 1 0 542
Sum: 12,889 7,331 5,743 3,759 1,038 538 34 31,332
Benelux Classes of site employees
3

2. Benelux - number of sites per activity and class of screen quantity
Netherlands01. <50 02. 50-99 03. 100-199 04. 200-499 05. 500-999 06. >=1000 07. Unknown Sum:
GOV Government 84 131 241 328 126 62 12 984
HEA Healthcare, Hospital, ... 335 256 233 177 69 70 5 1,145
EDU Education 165 130 291 520 207 67 5 1,385
BAN Banking & Finance 65 60 86 70 18 8 8 315
INS Insurance 42 42 46 34 28 16 1 209
SER Services 1,605 701 420 238 51 16 34 3,065
TEL Telecommunication 35 22 27 22 8 6 1 121
PET Utilities 78 49 40 53 16 12 3 251
RET Retail 446 110 47 34 5 1 6 649
DIS Wholesale Durables and Non-Durables 1,150 393 215 108 18 5 8 1,897
CON Construction & Contractors 1,002 367 176 61 9 2 11 1,628
TRA Road, Air, Sea transportation 532 157 103 49 9 9 10 869
CHE Chemical & Pharmaceutical industry 209 127 71 55 15 8 3 488
ELE Electronical & Electrical Industry 108 56 37 17 6 5 1 230
FOD Food & Beverage Industry 321 128 79 49 9 5 5 596
EDI Graphical & Publishing Industry 120 52 31 18 2 3 2 228
COM IT industry 614 281 154 94 19 11 66 1,239
MEC Mechanical industry 396 134 87 42 9 3 11 682
MET Metal industry 349 98 46 19 5 1 2 520
MIN Mineral industry 3 2 1 1 0 0 0 7
DIV Miscellaneous Industry 26 12 9 3 0 0 0 50
TEX Textile industry 63 23 13 3 3 0 0 105
AUT Transport industry 86 31 21 19 6 3 2 168
TIM Wood, Paper, Furniture industry 158 49 31 9 2 0 2 251
Sum: 7,992 3,411 2,505 2,023 640 313 198 17,082
Classes of screen quantity
Belgium01. <50 02. 50-99 03. 100-199 04. 200-499 05. 500-999 06. >=1000 07. Unknown Sum:
GOV Government 824 378 212 178 55 34 111 1,792
HEA Healthcare, Hospital, ... 160 62 66 71 41 22 70 492
EDU Education 81 43 59 79 29 9 53 353
BAN Banking & Finance 85 21 20 22 5 6 19 178
INS Insurance 55 26 19 16 6 6 13 141
SER Services 1,153 337 177 86 18 7 144 1,922
TEL Telecommunication 68 33 16 13 3 4 17 154
PET Utilities 96 23 27 22 14 2 13 197
RET Retail 416 55 21 12 2 1 32 539
DIS Wholesale Durables and Non-Durables 1,233 223 127 46 13 2 86 1,730
CON Construction & Contractors 927 108 60 16 3 0 48 1,162
TRA Road, Air, Sea transportation 466 88 58 29 14 3 43 701
CHE Chemical & Pharmaceutical industry 270 103 79 54 12 6 52 576
ELE Electronical & Electrical Industry 96 24 27 17 3 0 8 175
FOD Food & Beverage Industry 317 76 60 32 4 0 36 525
EDI Graphical & Publishing Industry 116 38 21 9 3 1 23 211
COM IT industry 467 96 58 37 9 3 54 724
MEC Mechanical industry 246 47 32 14 4 2 18 363
MET Metal industry 326 56 31 17 8 1 34 473
MIN Mineral industry 6 5 2 0 0 0 2 15
DIV Miscellaneous Industry 47 4 4 0 0 0 2 57
TEX Textile industry 124 28 17 8 0 0 13 190
AUT Transport industry 64 14 16 5 7 4 17 127
TIM Wood, Paper, Furniture industry 201 47 15 7 1 0 12 283
Sum: 7,844 1,935 1,224 790 254 113 920 13,080
Classes of screen quantity
4

2. Benelux - number of sites per activity and class of screen quantity
Luxembourg01. <50 02. 50-99 03. 100-199 04. 200-499 05. 500-999 06. >=1000 07. Unknown Sum:
GOV Government 82 15 8 8 4 3 36 156
HEA Healthcare, Hospital, ... 4 3 2 2 4 1 4 20
EDU Education 4 3 0 3 2 1 10 23
BAN Banking & Finance 51 21 16 17 8 4 43 160
INS Insurance 18 3 3 4 2 0 6 36
SER Services 110 34 20 7 1 2 39 213
TEL Telecommunication 15 8 3 2 0 0 10 38
PET Utilities 14 2 0 1 0 0 5 22
RET Retail 14 6 3 2 0 0 11 36
DIS Wholesale Durables and Non-Durables 29 17 5 1 0 0 17 69
CON Construction & Contractors 69 12 5 0 0 0 14 100
TRA Road, Air, Sea transportation 26 3 7 2 1 0 10 49
CHE Chemical & Pharmaceutical industry 12 2 7 1 0 0 5 27
ELE Electronical & Electrical Industry 8 2 1 0 0 0 4 15
FOD Food & Beverage Industry 9 1 4 1 0 0 1 16
EDI Graphical & Publishing Industry 6 2 2 1 0 0 1 12
COM IT industry 46 19 15 2 0 0 14 96
MEC Mechanical industry 7 4 1 0 1 0 6 19
MET Metal industry 17 2 2 4 2 1 3 31
MIN Mineral industry 2 0 0 0 0 0 0 2
DIV Miscellaneous Industry 4 1 0 0 0 0 2 7
TEX Textile industry 1 0 0 0 0 0 1 2
AUT Transport industry 5 0 2 1 1 1 3 13
TIM Wood, Paper, Furniture industry 4 1 1 1 0 0 1 8
Sum: 557 161 107 60 26 13 246 1,170
Classes of screen quantity
01. <50 02. 50-99 03. 100-199 04. 200-499 05. 500-999 06. >=1000 07. Unknown Sum:
GOV Government 990 524 461 514 185 99 159 2,932
HEA Healthcare, Hospital, ... 499 321 301 250 114 93 79 1,657
EDU Education 250 176 350 602 238 77 68 1,761
BAN Banking & Finance 201 102 122 109 31 18 70 653
INS Insurance 115 71 68 54 36 22 20 386
SER Services 2,868 1,072 617 331 70 25 217 5,200
TEL Telecommunication 118 63 46 37 11 10 28 313
PET Utilities 188 74 67 76 30 14 21 470
RET Retail 876 171 71 48 7 2 49 1,224
DIS Wholesale Durables and Non-Durables 2,412 633 347 155 31 7 111 3,696
CON Construction & Contractors 1,998 487 241 77 12 2 73 2,890
TRA Road, Air, Sea transportation 1,024 248 168 80 24 12 63 1,619
CHE Chemical & Pharmaceutical industry 491 232 157 110 27 14 60 1,091
ELE Electronical & Electrical Industry 212 82 65 34 9 5 13 420
FOD Food & Beverage Industry 647 205 143 82 13 5 42 1,137
EDI Graphical & Publishing Industry 242 92 54 28 5 4 26 451
COM IT industry 1,127 396 227 133 28 14 134 2,059
MEC Mechanical industry 649 185 120 56 14 5 35 1,064
MET Metal industry 692 156 79 40 15 3 39 1,024
MIN Mineral industry 11 7 3 1 0 0 2 24
DIV Miscellaneous Industry 77 17 13 3 0 0 4 114
TEX Textile industry 188 51 30 11 3 0 14 297
AUT Transport industry 155 45 39 25 14 8 22 308
TIM Wood, Paper, Furniture industry 363 97 47 17 3 0 15 542
Sum: 16,393 5,507 3,836 2,873 920 439 1,364 31,332
Benelux Classes of screen quantity
5
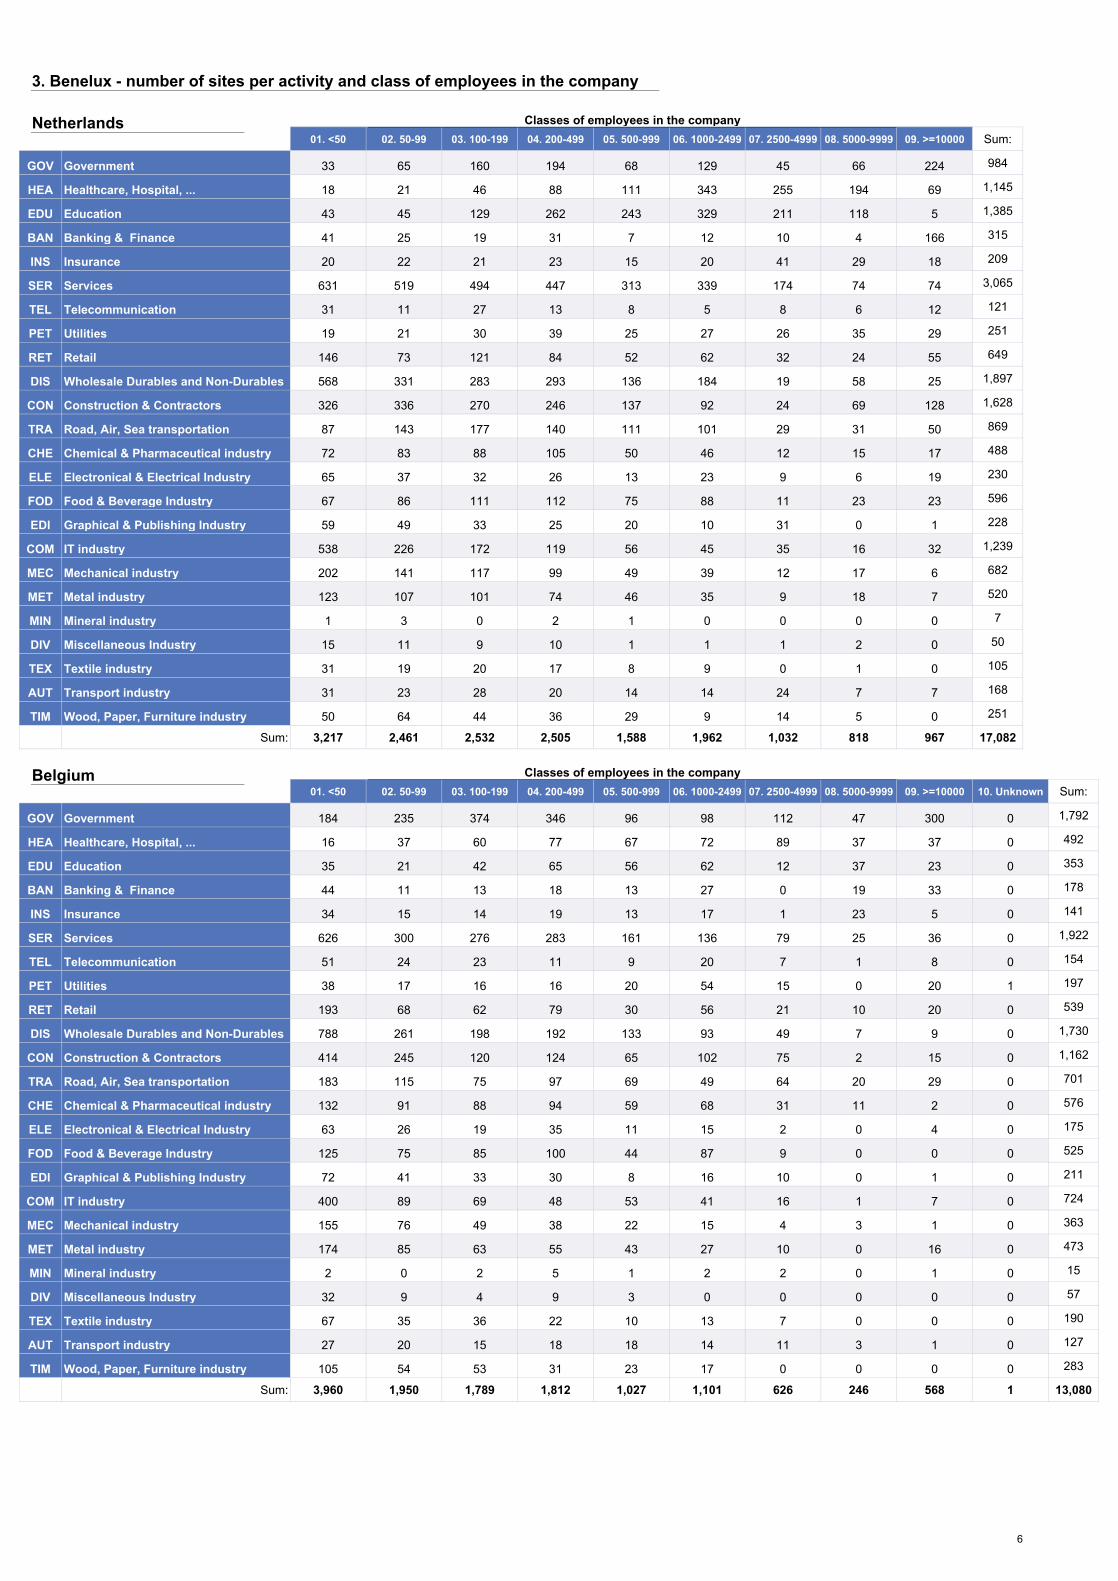
3. Benelux - number of sites per activity and class of employees in the company
Netherlands01. <50 02. 50-99 03. 100-199 04. 200-499 05. 500-999 06. 1000-2499 07. 2500-4999 08. 5000-9999 09. >=10000 Sum:
GOV Government 33 65 160 194 68 129 45 66 224 984
HEA Healthcare, Hospital, ... 18 21 46 88 111 343 255 194 69 1,145
EDU Education 43 45 129 262 243 329 211 118 5 1,385
BAN Banking & Finance 41 25 19 31 7 12 10 4 166 315
INS Insurance 20 22 21 23 15 20 41 29 18 209
SER Services 631 519 494 447 313 339 174 74 74 3,065
TEL Telecommunication 31 11 27 13 8 5 8 6 12 121
PET Utilities 19 21 30 39 25 27 26 35 29 251
RET Retail 146 73 121 84 52 62 32 24 55 649
DIS Wholesale Durables and Non-Durables 568 331 283 293 136 184 19 58 25 1,897
CON Construction & Contractors 326 336 270 246 137 92 24 69 128 1,628
TRA Road, Air, Sea transportation 87 143 177 140 111 101 29 31 50 869
CHE Chemical & Pharmaceutical industry 72 83 88 105 50 46 12 15 17 488
ELE Electronical & Electrical Industry 65 37 32 26 13 23 9 6 19 230
FOD Food & Beverage Industry 67 86 111 112 75 88 11 23 23 596
EDI Graphical & Publishing Industry 59 49 33 25 20 10 31 0 1 228
COM IT industry 538 226 172 119 56 45 35 16 32 1,239
MEC Mechanical industry 202 141 117 99 49 39 12 17 6 682
MET Metal industry 123 107 101 74 46 35 9 18 7 520
MIN Mineral industry 1 3 0 2 1 0 0 0 0 7
DIV Miscellaneous Industry 15 11 9 10 1 1 1 2 0 50
TEX Textile industry 31 19 20 17 8 9 0 1 0 105
AUT Transport industry 31 23 28 20 14 14 24 7 7 168
TIM Wood, Paper, Furniture industry 50 64 44 36 29 9 14 5 0 251
Sum: 3,217 2,461 2,532 2,505 1,588 1,962 1,032 818 967 17,082
Classes of employees in the company
Belgium01. <50 02. 50-99 03. 100-199 04. 200-499 05. 500-999 06. 1000-2499 07. 2500-4999 08. 5000-9999 09. >=10000 10. Unknown Sum:
GOV Government 184 235 374 346 96 98 112 47 300 0 1,792
HEA Healthcare, Hospital, ... 16 37 60 77 67 72 89 37 37 0 492
EDU Education 35 21 42 65 56 62 12 37 23 0 353
BAN Banking & Finance 44 11 13 18 13 27 0 19 33 0 178
INS Insurance 34 15 14 19 13 17 1 23 5 0 141
SER Services 626 300 276 283 161 136 79 25 36 0 1,922
TEL Telecommunication 51 24 23 11 9 20 7 1 8 0 154
PET Utilities 38 17 16 16 20 54 15 0 20 1 197
RET Retail 193 68 62 79 30 56 21 10 20 0 539
DIS Wholesale Durables and Non-Durables 788 261 198 192 133 93 49 7 9 0 1,730
CON Construction & Contractors 414 245 120 124 65 102 75 2 15 0 1,162
TRA Road, Air, Sea transportation 183 115 75 97 69 49 64 20 29 0 701
CHE Chemical & Pharmaceutical industry 132 91 88 94 59 68 31 11 2 0 576
ELE Electronical & Electrical Industry 63 26 19 35 11 15 2 0 4 0 175
FOD Food & Beverage Industry 125 75 85 100 44 87 9 0 0 0 525
EDI Graphical & Publishing Industry 72 41 33 30 8 16 10 0 1 0 211
COM IT industry 400 89 69 48 53 41 16 1 7 0 724
MEC Mechanical industry 155 76 49 38 22 15 4 3 1 0 363
MET Metal industry 174 85 63 55 43 27 10 0 16 0 473
MIN Mineral industry 2 0 2 5 1 2 2 0 1 0 15
DIV Miscellaneous Industry 32 9 4 9 3 0 0 0 0 0 57
TEX Textile industry 67 35 36 22 10 13 7 0 0 0 190
AUT Transport industry 27 20 15 18 18 14 11 3 1 0 127
TIM Wood, Paper, Furniture industry 105 54 53 31 23 17 0 0 0 0 283
Sum: 3,960 1,950 1,789 1,812 1,027 1,101 626 246 568 1 13,080
Classes of employees in the company
6
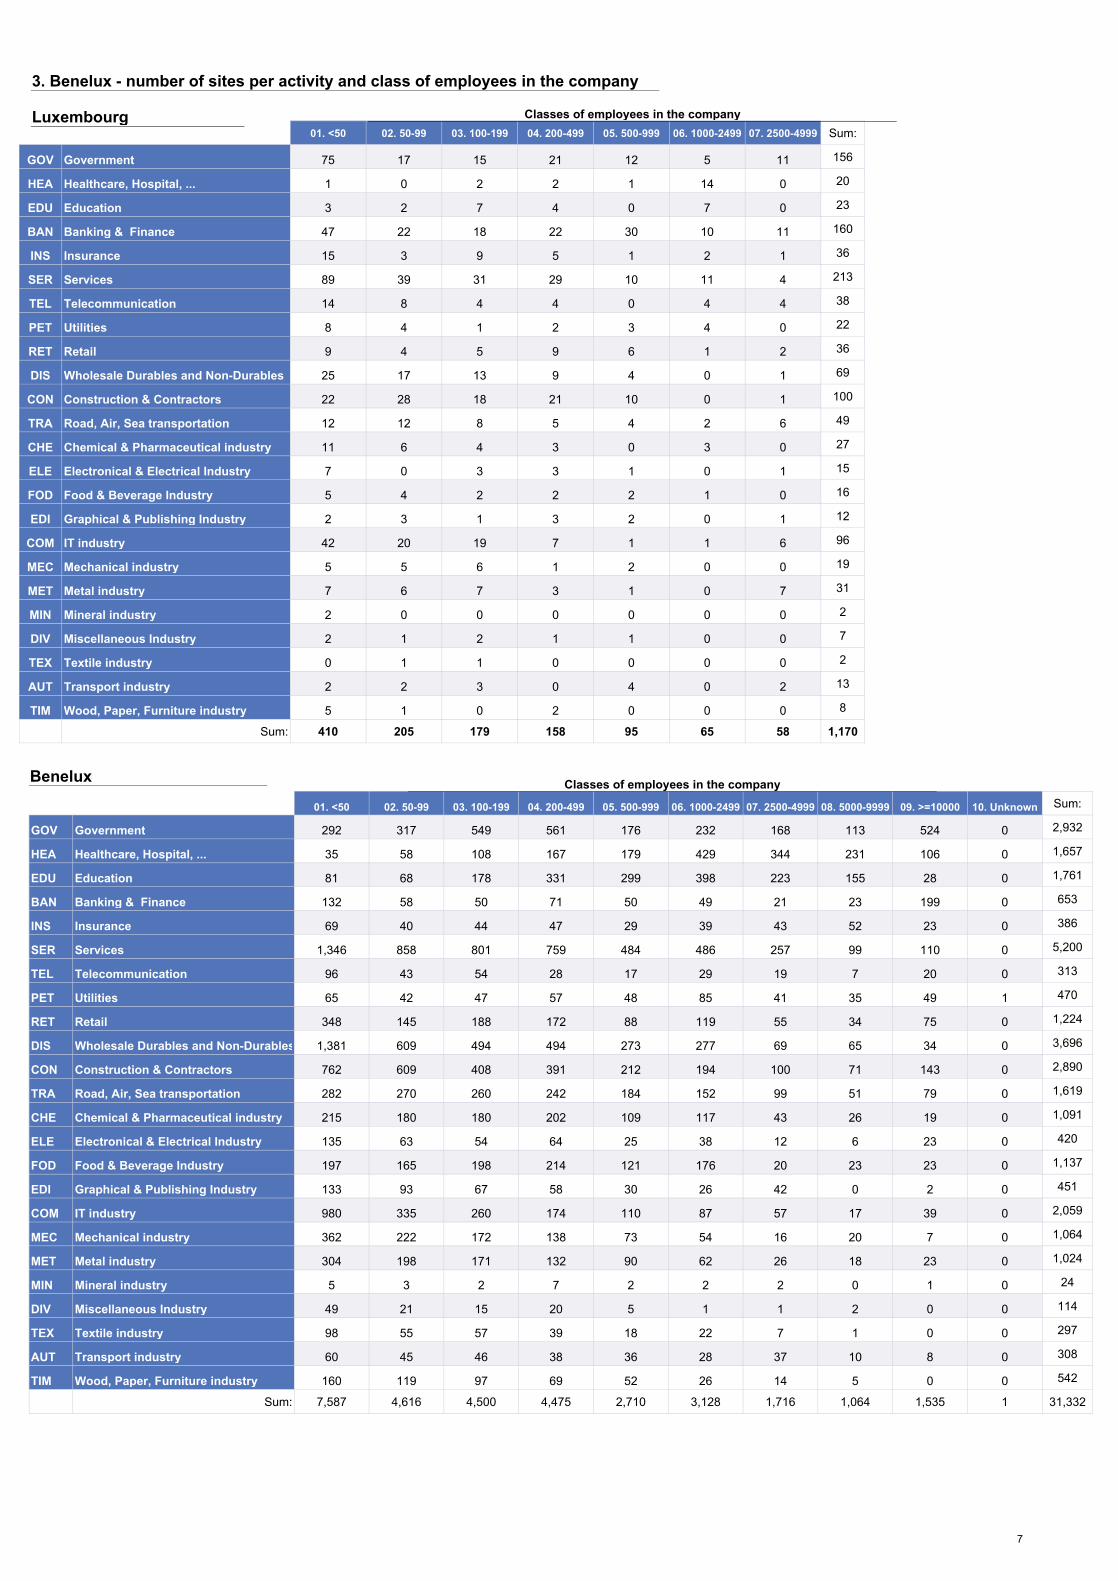
3. Benelux - number of sites per activity and class of employees in the company
Luxembourg01. <50 02. 50-99 03. 100-199 04. 200-499 05. 500-999 06. 1000-2499 07. 2500-4999 Sum:
GOV Government 75 17 15 21 12 5 11 156
HEA Healthcare, Hospital, ... 1 0 2 2 1 14 0 20
EDU Education 3 2 7 4 0 7 0 23
BAN Banking & Finance 47 22 18 22 30 10 11 160
INS Insurance 15 3 9 5 1 2 1 36
SER Services 89 39 31 29 10 11 4 213
TEL Telecommunication 14 8 4 4 0 4 4 38
PET Utilities 8 4 1 2 3 4 0 22
RET Retail 9 4 5 9 6 1 2 36
DIS Wholesale Durables and Non-Durables 25 17 13 9 4 0 1 69
CON Construction & Contractors 22 28 18 21 10 0 1 100
TRA Road, Air, Sea transportation 12 12 8 5 4 2 6 49
CHE Chemical & Pharmaceutical industry 11 6 4 3 0 3 0 27
ELE Electronical & Electrical Industry 7 0 3 3 1 0 1 15
FOD Food & Beverage Industry 5 4 2 2 2 1 0 16
EDI Graphical & Publishing Industry 2 3 1 3 2 0 1 12
COM IT industry 42 20 19 7 1 1 6 96
MEC Mechanical industry 5 5 6 1 2 0 0 19
MET Metal industry 7 6 7 3 1 0 7 31
MIN Mineral industry 2 0 0 0 0 0 0 2
DIV Miscellaneous Industry 2 1 2 1 1 0 0 7
TEX Textile industry 0 1 1 0 0 0 0 2
AUT Transport industry 2 2 3 0 4 0 2 13
TIM Wood, Paper, Furniture industry 5 1 0 2 0 0 0 8
Sum: 410 205 179 158 95 65 58 1,170
Classes of employees in the company
Benelux
01. <50 02. 50-99 03. 100-199 04. 200-499 05. 500-999 06. 1000-2499 07. 2500-4999 08. 5000-9999 09. >=10000 10. Unknown Sum:
GOV Government 292 317 549 561 176 232 168 113 524 0 2,932
HEA Healthcare, Hospital, ... 35 58 108 167 179 429 344 231 106 0 1,657
EDU Education 81 68 178 331 299 398 223 155 28 0 1,761
BAN Banking & Finance 132 58 50 71 50 49 21 23 199 0 653
INS Insurance 69 40 44 47 29 39 43 52 23 0 386
SER Services 1,346 858 801 759 484 486 257 99 110 0 5,200
TEL Telecommunication 96 43 54 28 17 29 19 7 20 0 313
PET Utilities 65 42 47 57 48 85 41 35 49 1 470
RET Retail 348 145 188 172 88 119 55 34 75 0 1,224
DIS Wholesale Durables and Non-Durables 1,381 609 494 494 273 277 69 65 34 0 3,696
CON Construction & Contractors 762 609 408 391 212 194 100 71 143 0 2,890
TRA Road, Air, Sea transportation 282 270 260 242 184 152 99 51 79 0 1,619
CHE Chemical & Pharmaceutical industry 215 180 180 202 109 117 43 26 19 0 1,091
ELE Electronical & Electrical Industry 135 63 54 64 25 38 12 6 23 0 420
FOD Food & Beverage Industry 197 165 198 214 121 176 20 23 23 0 1,137
EDI Graphical & Publishing Industry 133 93 67 58 30 26 42 0 2 0 451
COM IT industry 980 335 260 174 110 87 57 17 39 0 2,059
MEC Mechanical industry 362 222 172 138 73 54 16 20 7 0 1,064
MET Metal industry 304 198 171 132 90 62 26 18 23 0 1,024
MIN Mineral industry 5 3 2 7 2 2 2 0 1 0 24
DIV Miscellaneous Industry 49 21 15 20 5 1 1 2 0 0 114
TEX Textile industry 98 55 57 39 18 22 7 1 0 0 297
AUT Transport industry 60 45 46 38 36 28 37 10 8 0 308
TIM Wood, Paper, Furniture industry 160 119 97 69 52 26 14 5 0 0 542
Sum: 7,587 4,616 4,500 4,475 2,710 3,128 1,716 1,064 1,535 1 31,332
Classes of employees in the company
7
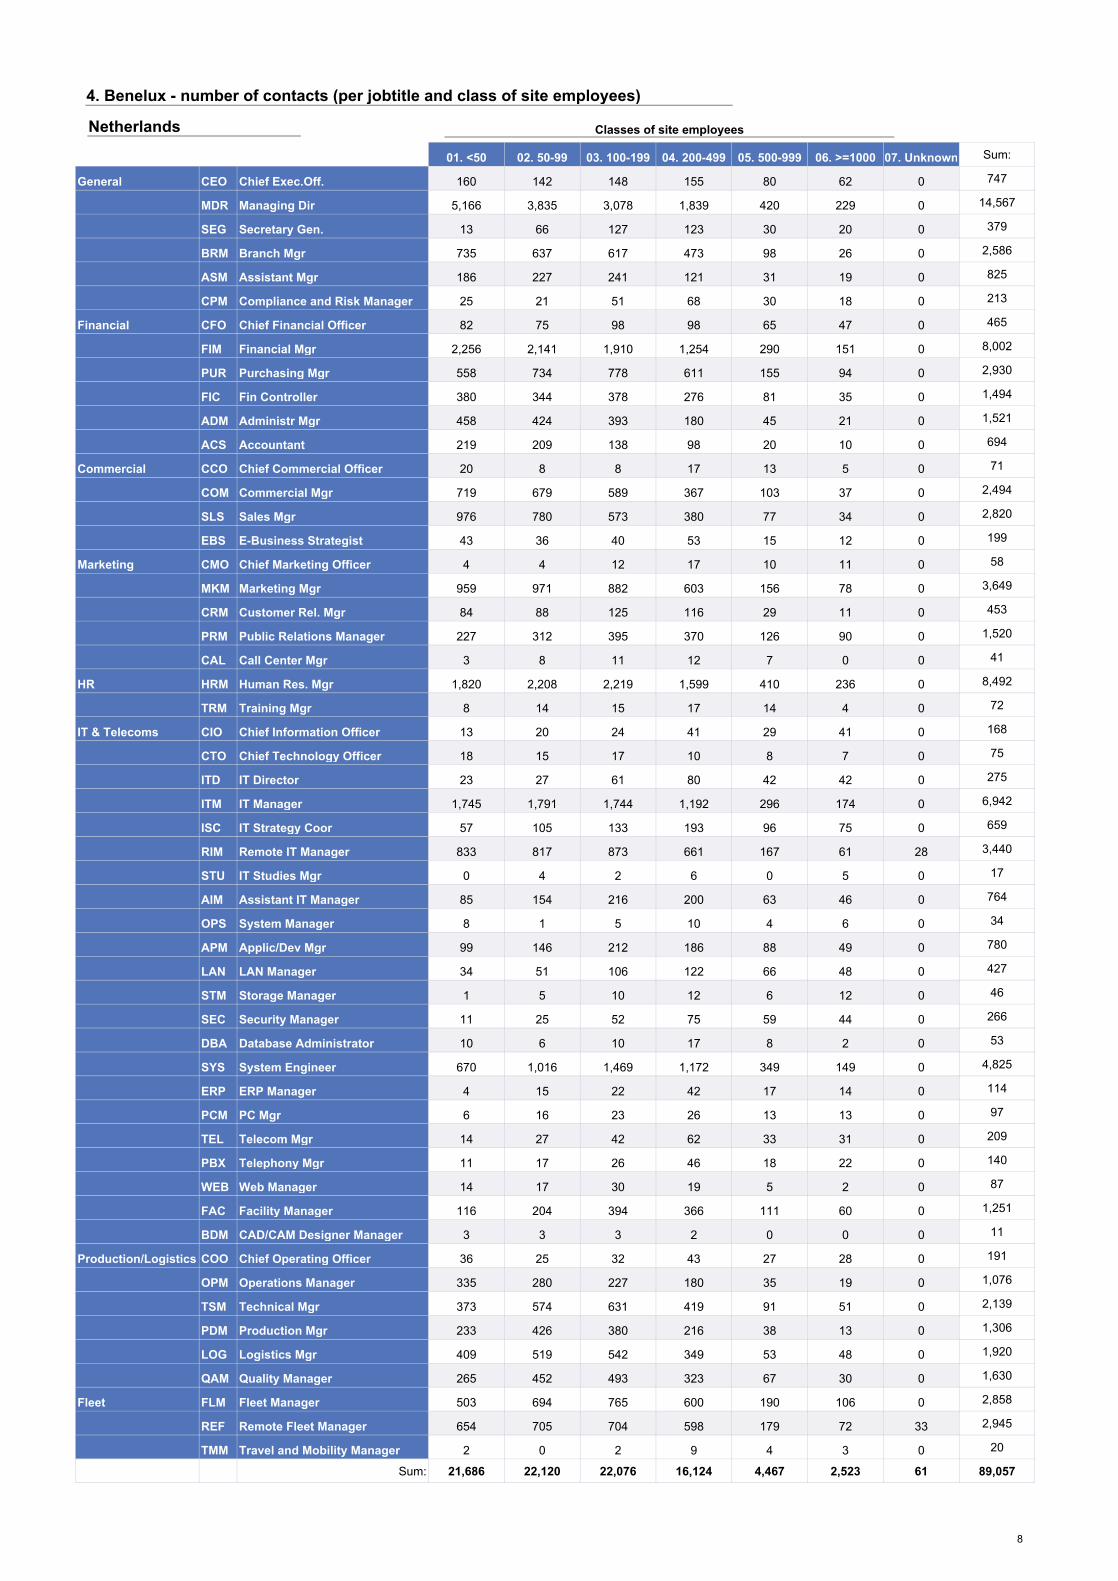
4. Benelux - number of contacts (per jobtitle and class of site employees)
Netherlands
01. <50 02. 50-99 03. 100-199 04. 200-499 05. 500-999 06. >=1000 07. Unknown Sum:
General CEO Chief Exec.Off. 160 142 148 155 80 62 0 747
MDR Managing Dir 5,166 3,835 3,078 1,839 420 229 0 14,567
SEG Secretary Gen. 13 66 127 123 30 20 0 379
BRM Branch Mgr 735 637 617 473 98 26 0 2,586
ASM Assistant Mgr 186 227 241 121 31 19 0 825
CPM Compliance and Risk Manager 25 21 51 68 30 18 0 213
Financial CFO Chief Financial Officer 82 75 98 98 65 47 0 465
FIM Financial Mgr 2,256 2,141 1,910 1,254 290 151 0 8,002
PUR Purchasing Mgr 558 734 778 611 155 94 0 2,930
FIC Fin Controller 380 344 378 276 81 35 0 1,494
ADM Administr Mgr 458 424 393 180 45 21 0 1,521
ACS Accountant 219 209 138 98 20 10 0 694
Commercial CCO Chief Commercial Officer 20 8 8 17 13 5 0 71
COM Commercial Mgr 719 679 589 367 103 37 0 2,494
SLS Sales Mgr 976 780 573 380 77 34 0 2,820
EBS E-Business Strategist 43 36 40 53 15 12 0 199
Marketing CMO Chief Marketing Officer 4 4 12 17 10 11 0 58
MKM Marketing Mgr 959 971 882 603 156 78 0 3,649
CRM Customer Rel. Mgr 84 88 125 116 29 11 0 453
PRM Public Relations Manager 227 312 395 370 126 90 0 1,520
CAL Call Center Mgr 3 8 11 12 7 0 0 41
HR HRM Human Res. Mgr 1,820 2,208 2,219 1,599 410 236 0 8,492
TRM Training Mgr 8 14 15 17 14 4 0 72
IT & Telecoms CIO Chief Information Officer 13 20 24 41 29 41 0 168
CTO Chief Technology Officer 18 15 17 10 8 7 0 75
ITD IT Director 23 27 61 80 42 42 0 275
ITM IT Manager 1,745 1,791 1,744 1,192 296 174 0 6,942
ISC IT Strategy Coor 57 105 133 193 96 75 0 659
RIM Remote IT Manager 833 817 873 661 167 61 28 3,440
STU IT Studies Mgr 0 4 2 6 0 5 0 17
AIM Assistant IT Manager 85 154 216 200 63 46 0 764
OPS System Manager 8 1 5 10 4 6 0 34
APM Applic/Dev Mgr 99 146 212 186 88 49 0 780
LAN LAN Manager 34 51 106 122 66 48 0 427
STM Storage Manager 1 5 10 12 6 12 0 46
SEC Security Manager 11 25 52 75 59 44 0 266
DBA Database Administrator 10 6 10 17 8 2 0 53
SYS System Engineer 670 1,016 1,469 1,172 349 149 0 4,825
ERP ERP Manager 4 15 22 42 17 14 0 114
PCM PC Mgr 6 16 23 26 13 13 0 97
TEL Telecom Mgr 14 27 42 62 33 31 0 209
PBX Telephony Mgr 11 17 26 46 18 22 0 140
WEB Web Manager 14 17 30 19 5 2 0 87
FAC Facility Manager 116 204 394 366 111 60 0 1,251
BDM CAD/CAM Designer Manager 3 3 3 2 0 0 0 11
Production/Logistics COO Chief Operating Officer 36 25 32 43 27 28 0 191
OPM Operations Manager 335 280 227 180 35 19 0 1,076
TSM Technical Mgr 373 574 631 419 91 51 0 2,139
PDM Production Mgr 233 426 380 216 38 13 0 1,306
LOG Logistics Mgr 409 519 542 349 53 48 0 1,920
QAM Quality Manager 265 452 493 323 67 30 0 1,630
Fleet FLM Fleet Manager 503 694 765 600 190 106 0 2,858
REF Remote Fleet Manager 654 705 704 598 179 72 33 2,945
TMM Travel and Mobility Manager 2 0 2 9 4 3 0 20
Sum: 21,686 22,120 22,076 16,124 4,467 2,523 61 89,057
Classes of site employees
8

4. Benelux - number of contacts (per jobtitle and class of site employees)
Belgium
01. <50 02. 50-99 03. 100-199 04. 200-499 05. 500-999 06. >=1000 07. Unknown Sum:
General CEO Chief Exec.Off. 375 257 222 184 62 41 0 1,141
MDR Managing Dir 6,734 2,616 1,535 891 261 135 0 12,172
SEG Secretary Gen. 446 209 117 63 22 17 0 874
BRM Branch Mgr 514 255 208 158 50 18 0 1,203
ASM Assistant Mgr 419 233 209 173 57 39 0 1,130
CPM Compliance and Risk Manager 25 20 28 31 15 7 0 126
Financial CFO Chief Financial Officer 88 80 68 56 34 20 0 346
FIM Financial Mgr 1,995 1,127 898 643 192 111 0 4,966
PUR Purchasing Mgr 991 693 666 519 184 120 0 3,173
FIC Fin Controller 490 237 133 90 26 21 0 997
ADM Administr Mgr 927 338 205 133 45 25 0 1,673
ACS Accountant 2,098 1,030 599 363 88 56 0 4,234
Commercial CCO Chief Commercial Officer 3 2 7 6 0 2 0 20
COM Commercial Mgr 838 505 412 282 49 22 0 2,108
SLS Sales Mgr 897 451 316 154 26 18 0 1,862
EBS E-Business Strategist 1 0 3 6 0 0 0 10
Marketing CMO Chief Marketing Officer 0 1 0 4 1 1 0 7
MKM Marketing Mgr 667 491 354 279 73 31 0 1,895
CRM Customer Rel. Mgr 412 192 134 83 22 12 0 855
PRM Public Relations Manager 348 279 197 233 103 93 0 1,253
CAL Call Center Mgr 3 3 3 11 4 2 0 26
HR HRM Human Res. Mgr 2,303 1,732 1,464 1,006 323 167 0 6,995
TRM Training Mgr 18 16 22 28 11 10 0 105
IT & Telecoms CIO Chief Information Officer 7 12 13 28 20 24 0 104
CTO Chief Technology Officer 20 8 10 8 8 4 0 58
ITD IT Director 39 50 63 84 55 39 0 330
ITM IT Manager 2,010 1,314 983 677 196 108 0 5,288
ISC IT Strategy Coor 22 33 37 43 11 15 0 161
RIM Remote IT Manager 968 428 322 225 61 18 0 2,022
STU IT Studies Mgr 1 2 1 8 5 9 0 26
AIM Assistant IT Manager 192 266 265 205 66 55 0 1,049
OPS System Manager 28 22 23 36 12 20 0 141
APM Applic/Dev Mgr 67 89 140 191 112 69 0 668
LAN LAN Manager 55 69 120 182 92 65 0 583
STM Storage Manager 4 3 6 6 9 9 0 37
SEC Security Manager 3 10 21 49 29 28 0 140
DBA Database Administrator 8 4 15 21 10 13 0 71
SYS System Engineer 287 351 401 464 164 98 0 1,765
ERP ERP Manager 6 9 18 19 18 10 0 80
PCM PC Mgr 12 19 34 42 18 23 0 148
TEL Telecom Mgr 19 26 34 73 49 38 0 239
PBX Telephony Mgr 6 11 20 21 13 7 0 78
WEB Web Manager 39 19 16 25 13 9 0 121
FAC Facility Manager 26 35 48 45 34 17 0 205
Production/Logistics COO Chief Operating Officer 87 28 34 23 9 6 0 187
OPM Operations Manager 127 74 62 31 14 12 0 320
TSM Technical Mgr 1,007 691 596 485 184 82 0 3,045
PDM Production Mgr 442 387 394 263 64 31 0 1,581
LOG Logistics Mgr 518 501 495 381 107 57 0 2,059
QAM Quality Manager 326 382 426 333 97 46 0 1,610
Fleet FLM Fleet Manager 552 393 347 307 106 75 0 1,780
REF Remote Fleet Manager 959 517 438 281 121 41 0 2,357
TMM Travel and Mobility Manager 2 3 5 3 2 2 0 17
Sum: 28,431 16,523 13,187 9,955 3,347 1,998 73,441
Classes of site employees
9

4. Benelux - number of contacts (per jobtitle and class of site employees)Luxembourg
01. <50 02. 50-99 03. 100-199 04. 200-499 05. 500-999 06. >=1000 Sum:
General CEO Chief Exec.Off. 29 21 29 17 9 6 111
MDR Managing Dir 514 239 181 117 46 16 1,113
SEG Secretary Gen. 85 5 4 4 2 3 103
BRM Branch Mgr 36 11 13 7 3 1 71
ASM Assistant Mgr 55 38 36 24 13 6 172
CPM Compliance and Risk Manager 19 15 10 14 7 6 71
Financial CFO Chief Financial Officer 7 5 5 8 4 1 30
FIM Financial Mgr 94 75 85 68 35 13 370
PUR Purchasing Mgr 52 57 56 53 24 12 254
FIC Fin Controller 80 11 4 2 2 3 102
ADM Administr Mgr 52 25 16 21 2 6 122
ACS Accountant 105 70 58 27 7 4 271
Commercial CCO Chief Commercial Officer 0 0 0 1 0 1 2
COM Commercial Mgr 78 53 41 26 19 5 222
SLS Sales Mgr 22 14 15 9 4 1 65
Marketing MKM Marketing Mgr 26 39 49 33 22 3 172
CRM Customer Rel. Mgr 63 12 3 5 8 1 92
PRM Public Relations Manager 19 8 7 11 12 3 60
HR HRM Human Res. Mgr 122 120 112 111 40 19 524
TRM Training Mgr 3 0 0 1 3 5 12
IT & Telecoms CIO Chief Information Officer 4 2 2 6 4 2 20
CTO Chief Technology Officer 0 3 2 3 0 2 10
ITD IT Director 7 7 8 12 10 8 52
ITM IT Manager 200 135 132 94 35 13 609
ISC IT Strategy Coor 2 0 0 1 1 1 5
RIM Remote IT Manager 48 19 19 14 6 1 107
STU IT Studies Mgr 0 0 0 4 1 0 5
AIM Assistant IT Manager 41 20 23 28 7 6 125
OPS System Manager 1 1 2 4 2 2 12
APM Applic/Dev Mgr 10 12 13 21 11 12 79
LAN LAN Manager 11 20 22 17 11 16 97
STM Storage Manager 1 1 0 0 1 0 3
SEC Security Manager 2 3 7 10 3 7 32
DBA Database Administrator 1 0 2 4 4 4 15
SYS System Engineer 18 18 18 32 14 15 115
ERP ERP Manager 1 0 1 6 1 2 11
PCM PC Mgr 2 3 9 9 3 3 29
TEL Telecom Mgr 2 3 4 6 7 3 25
WEB Web Manager 5 2 1 0 2 0 10
FAC Facility Manager 3 2 5 3 3 3 19
Production/Logistics COO Chief Operating Officer 1 6 4 4 3 1 19
OPM Operations Manager 8 5 1 3 2 1 20
TSM Technical Mgr 121 41 29 43 11 6 251
PDM Production Mgr 25 19 15 18 3 0 80
LOG Logistics Mgr 17 36 29 31 15 1 129
QAM Quality Manager 17 23 21 27 11 0 99
Fleet FLM Fleet Manager 82 46 45 33 15 9 230
REF Remote Fleet Manager 32 23 12 16 7 1 91
Sum: 2,123 1,268 1,150 1,008 455 234 6,238
Classes of site employees
10

4.1 Available email addresses BeneluxNetherlands Belgium Luxembourg Sum:
General CEO Chief Exec.Off. 279 829 81 1,189
MDR Managing Dir 8,130 8,428 737 17,295
SEG Secretary Gen. 282 739 78 1,099
BRM Branch Mgr 1,719 993 53 2,765
ASM Assistant Mgr 613 888 119 1,620
CPM Compliance and Risk Manager 129 99 57 285
Financial CFO Chief Financial Officer 197 266 25 488
FIM Financial Mgr 5,054 3,705 282 9,041
PUR Purchasing Mgr 2,028 2,500 184 4,712
FIC Fin Controller 939 802 82 1,823
ADM Administr Mgr 1,031 1,290 84 2,405
ACS Accountant 506 3,284 187 3,977
Commercial CCO Chief Commercial Officer 33 16 2 51
COM Commercial Mgr 1,640 1,727 176 3,543
SLS Sales Mgr 1,942 1,560 49 3,551
EBS E-Business Strategist 118 10 0 128
Marketing CMO Chief Marketing Officer 26 6 0 32
MKM Marketing Mgr 2,406 1,551 136 4,093
CRM Customer Rel. Mgr 303 702 80 1,085
PRM Public Relations Manager 1,034 1,038 43 2,115
CAL Call Center Mgr 29 22 0 51
HR HRM Human Res. Mgr 5,609 5,440 396 11,445
TRM Training Mgr 50 90 9 149
IT & Telecoms CIO Chief Information Officer 52 82 16 150
CTO Chief Technology Officer 25 49 7 81
ITD IT Director 88 266 46 400
ITM IT Manager 4,097 3,889 458 8,444
ISC IT Strategy Coor 371 132 4 507
RIM Remote IT Manager 1,546 1,393 54 2,993
STU IT Studies Mgr 9 21 5 35
AIM Assistant IT Manager 485 760 82 1,327
OPS System Manager 24 110 11 145
APM Applic/Dev Mgr 475 554 62 1,091
LAN LAN Manager 289 488 81 858
STM Storage Manager 32 29 1 62
SEC Security Manager 140 114 29 283
DBA Database Administrator 26 62 10 98
SYS System Engineer 3,024 1,390 85 4,499
ERP ERP Manager 74 60 10 144
PCM PC Mgr 68 124 21 213
TEL Telecom Mgr 143 191 22 356
PBX Telephony Mgr 107 53 0 160
WEB Web Manager 63 85 9 157
FAC Facility Manager 827 156 14 997
BDM CAD/CAM Designer Manager 6 0 0 6
Production/Logistics COO Chief Operating Officer 90 147 11 248
OPM Operations Manager 631 250 17 898
TSM Technical Mgr 1,502 2,381 186 4,069
PDM Production Mgr 1,025 1,365 66 2,456
LOG Logistics Mgr 1,472 1,647 108 3,227
QAM Quality Manager 1,224 1,396 80 2,700
Fleet FLM Fleet Manager 1,662 1,274 153 3,089
REF Remote Fleet Manager 1,723 1,758 69 3,550
TMM Travel and Mobility Manager 11 13 0 24
Sum: 55,408 56,224 4,577 116,209
11

5.1 Number of mini-/mainframe sites
Belgium Luxembourg Netherlands Sum:
IBM ISERIES 613 38 607 1,258
IBM MAINFRAME 92 20 198 310
IBM PSERIES 119 24 78 221
IBM MIDRANGE 0 1 2 3
IBM WORKSTAT 2 0 1 3
HP HP-9000 31 3 17 51
HP MIDRANGE 6 0 13 19
HP WORKSTAT 6 0 7 13
HP ALPHASERVE 2 1 1 4
UNISYS MAINFRAME 32 0 2 34
BULL MIDRANGE 16 2 2 20
BULL MAINFRAME 2 0 11 13
Sum: 921 89 939 1,949
Belgium Luxembourg Netherlands Sum:
HP 2,974 177 3,476 6,627
DELL 1,188 43 1,298 2,529
UNSPECIFIED 598 46 701 1,345
IBM 357 39 339 735
FUJITSU SIEMENS 398 10 60 468
FUJITSU 212 6 40 258
CLONE 136 9 95 240
CISCO 36 7 70 113
APPLE 51 6 41 98
SUPERMICRO 50 3 32 85
SUN-MICRO 34 5 33 72
OTHER 14 0 51 65
INTEL 19 2 20 41
COMPAQ 1 0 32 33
ACER 8 0 22 30
Sum: 6,076 353 6,310 12,739
5.2 Number of server sites
12

6.1 Number of desktop sites
Belgium Luxembourg Netherlands Sum:
HP 4,006 261 5,174 9,441
DELL 2,341 109 2,770 5,220
LENOVO 646 36 538 1,220
UNSPECIFIED 460 42 612 1,114
CLONE 562 46 306 914
FUJITSU SIEMENS 615 34 165 814
APPLE 253 16 261 530
FUJITSU 273 9 88 370
ACER 174 6 165 345
PRIMINFO 283 1 0 284
Sum: 9,613 560 10,079 20,252
Belgium Luxembourg Netherlands Sum:
HP 4,257 227 5,094 9,578
DELL 2,573 104 2,792 5,469
LENOVO 948 69 833 1,850
UNSPECIFIED 397 42 674 1,113
CLONE 40 4 18 62
FUJITSU SIEMENS 388 35 139 562
APPLE 299 28 377 704
FUJITSU 227 8 61 296
ACER 362 22 327 711
IBM 65 10 69 144
Sum: 9,556 549 10,384 20,489
6.2 Number of laptop sites
13

7. Number of printer sites (High Speed or Multi Functionals)
Belgium Luxembourg Netherlands Sum:
RICOH 1,260 54 1,630 2,944
CANON 945 39 1,682 2,666
XEROX 519 32 1,083 1,634
HP 371 30 865 1,266
KONICA MINOLTA 489 21 555 1,065
KYOCERA 244 17 453 714
OCE 66 2 240 308
SHARP 110 1 190 301
TOSHIBA 45 4 172 221
LEXMARK 73 11 110 194
BROTHER 102 8 57 167
SAMSUNG 64 2 74 140
UNSPECIFIED 28 4 80 112
KONICA 43 8 54 105
DELL 41 2 28 71
Sum: 4,400 235 7,273 11,908
14

8. Number of Storage sites
BACKUP
Belgium Luxembourg Netherlands Sum:
VEEAM 787 39 880 1,706
COMMVAULT 98 3 369 470
ARCSERVE 174 8 235 417
NETAPP 43 0 173 216
ACRONIS 99 3 46 148
Sum: 1,201 53 1,703 2,957
DIRECT ATTACH
Belgium Luxembourg Netherlands Sum:
HP 55 0 35 90
DELL 23 0 17 40
IBM 4 1 10 15
WESTERN DIGITAL 3 0 6 9
FUJITSU 8 0 0 8
Sum: 93 1 68 162
NAS
Belgium Luxembourg Netherlands Sum:
SYNOLOGY 319 10 276 605
HP 278 7 199 484
QNAP 178 4 261 443
DELL 95 2 81 178
NETAPP 92 5 80 177
Sum: 962 28 897 1,887
SAN
Belgium Luxembourg Netherlands Sum:
HP 473 18 613 1,104
DELL 161 2 326 489
NETAPP 118 12 192 322
EMC 102 10 183 295
IBM 96 15 112 223
Sum: 950 57 1,426 2,433
TAPE
Belgium Luxembourg Netherlands Sum:
HP 694 17 552 1,263
DELL 170 1 190 361
IBM 111 4 82 197
FUJITSU SIEMENS 44 0 2 46
FUJITSU 35 4 4 43
Sum: 1,054 26 830 1,910
15

9.1 OPR - number of operating systems
OS
Belgium Luxembourg Netherlands Sum:
UNSPECIFIED OS 312 7 319 638
OTHER OS 0 0 15 15
IBM OS/400 337 29 276 642
APPLE MAC-OS 71 7 201 279
APPLE IOS 180 41 53 274
APPLE MAC OS X SERVER 46 6 40 92
NOVELL NETWARE 2 0 14 16
Sum: 948 90 918 1,956
UNIX
Belgium Luxembourg Netherlands Sum:
RED HAT LINUX 501 19 255 775
LINUX LINUX 284 21 336 641
UBUNTU LINUX 157 13 117 287
CENTOS LINUX 155 10 90 255
DEBIAN LINUX 152 8 40 200
SUSE LINUX 78 7 91 176
FEDORA LINUX 7 1 6 14
ORACLE LINUX 3 1 6 10
APACHE LINUX 1 0 4 5
NOVELL LINUX 0 0 2 2
ORACLE SOLARIS 43 8 22 73
IBM AIX6000 21 4 18 43
BULL AIX6000 8 2 0 10
IBM AIX 15 6 23 44
HP HP-UX 23 1 19 43
UNSPECIFIED UNIX MICRO 2 1 6 9
Sum: 1,450 102 1,035 2,587
XWINDOWS
Belgium Luxembourg Netherlands Sum:
MICROSOFT TERMINAL SERVER 681 7 2,718 3,406
CITRIX EMULATION 29 0 352 381
UNSPECIFIED EMULATION 0 0 38 38
OTHER EMULATION 0 0 11 11
CITRIX METAFRAME 76 5 268 349
CITRIX PRESENT SERVER 3 0 43 46
CITRIX WINFRAME 2 0 1 3
Sum: 791 12 3,431 4,234
WINDOWS
Belgium Luxembourg Netherlands Sum:
MICROSOFT WIN/7 5,830 314 8,626 14,770
MICROSOFT WIN/2008-SERVER 3,111 163 3,587 6,861
MICROSOFT WIN/2012-SERVER 2,061 112 2,352 4,525
MICROSOFT WIN/8 1,418 51 2,724 4,193
MICROSOFT WIN/10 971 32 1,061 2,064
MICROSOFT WIN/2003-SERVER 908 50 1,034 1,992
MICROSOFT WIN/XP 679 44 856 1,579
MICROSOFT WINDOWS-SERVER 469 35 424 928
MICROSOFT WIN/VISTA 156 0 101 257
MICROSOFT WINDOWS 82 6 59 147
Sum: 15,685 807 20,824 37,316
16
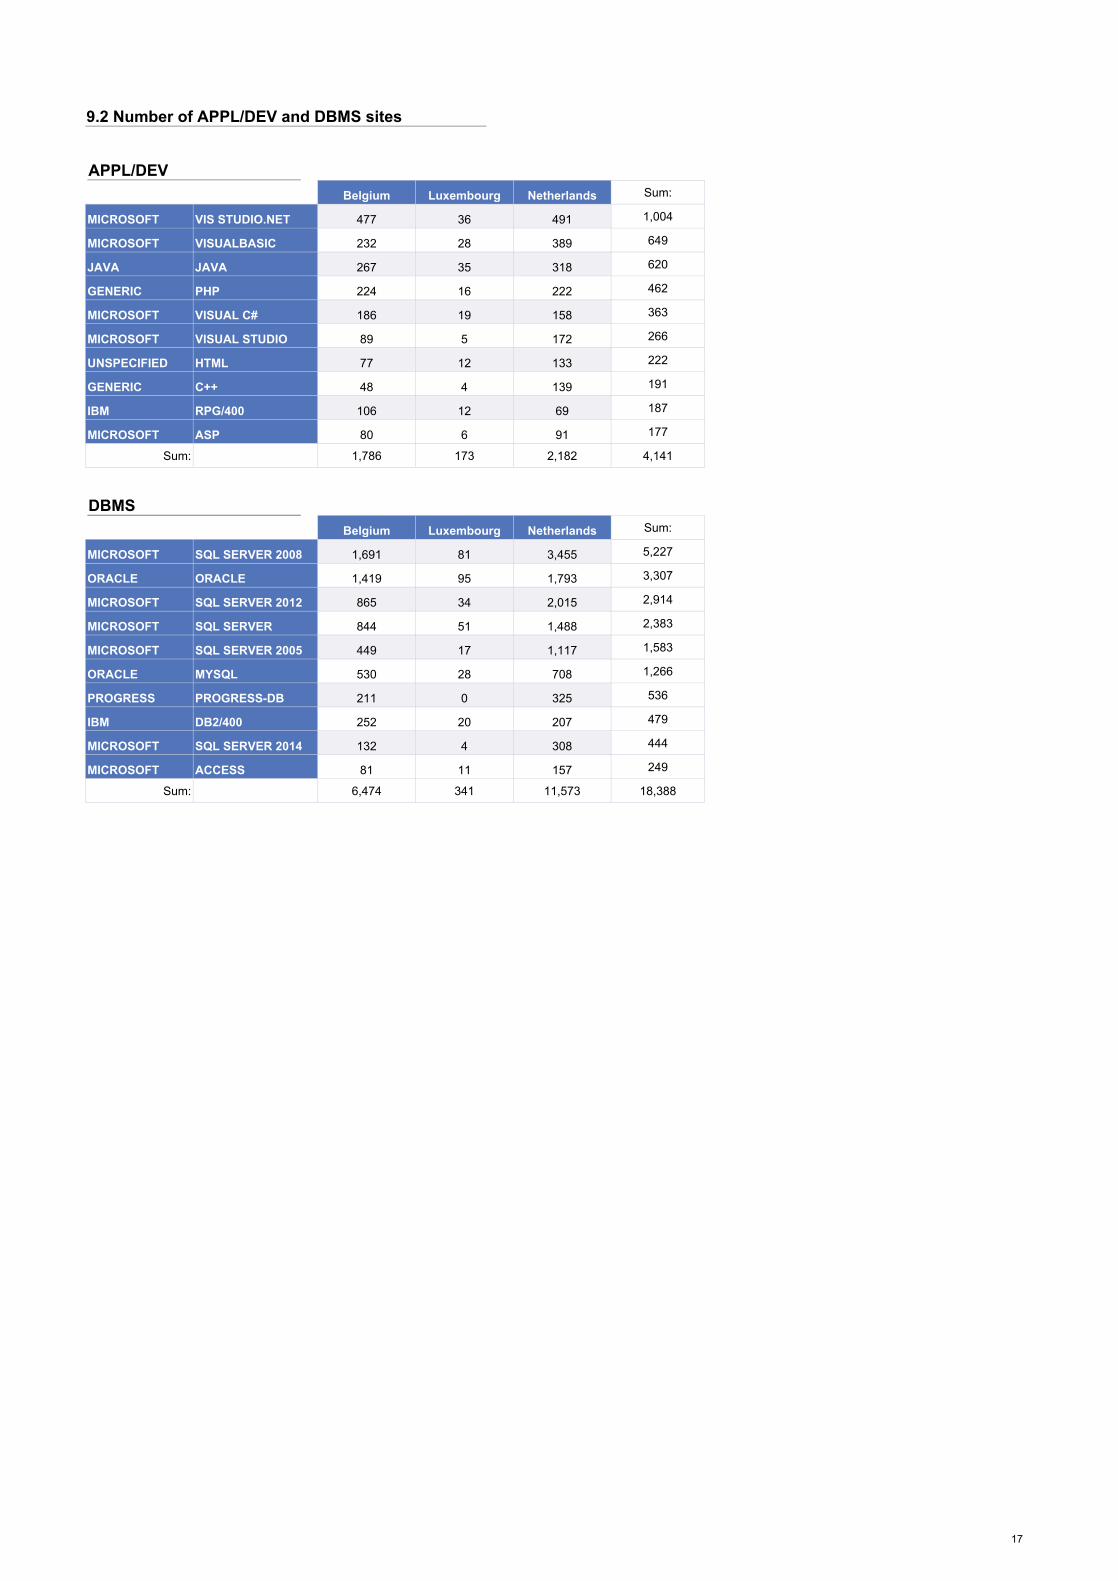
9.2 Number of APPL/DEV and DBMS sites
APPL/DEVBelgium Luxembourg Netherlands Sum:
MICROSOFT VIS STUDIO.NET 477 36 491 1,004
MICROSOFT VISUALBASIC 232 28 389 649
JAVA JAVA 267 35 318 620
GENERIC PHP 224 16 222 462
MICROSOFT VISUAL C# 186 19 158 363
MICROSOFT VISUAL STUDIO 89 5 172 266
UNSPECIFIED HTML 77 12 133 222
GENERIC C++ 48 4 139 191
IBM RPG/400 106 12 69 187
MICROSOFT ASP 80 6 91 177
Sum: 1,786 173 2,182 4,141
DBMSBelgium Luxembourg Netherlands Sum:
MICROSOFT SQL SERVER 2008 1,691 81 3,455 5,227
ORACLE ORACLE 1,419 95 1,793 3,307
MICROSOFT SQL SERVER 2012 865 34 2,015 2,914
MICROSOFT SQL SERVER 844 51 1,488 2,383
MICROSOFT SQL SERVER 2005 449 17 1,117 1,583
ORACLE MYSQL 530 28 708 1,266
PROGRESS PROGRESS-DB 211 0 325 536
IBM DB2/400 252 20 207 479
MICROSOFT SQL SERVER 2014 132 4 308 444
MICROSOFT ACCESS 81 11 157 249
Sum: 6,474 341 11,573 18,388
17

9.3 Virtual Server Software
VIRT. SERVBelgium Luxembourg Netherlands Sum:
VMWARE 3,736 212 5,760 9,708
MICROSOFT 789 28 1,342 2,159
CITRIX 180 5 609 794
UNSPECIFIED 143 7 236 386
LINUX 17 1 39 57
ORACLE 19 0 8 27
OTHER 7 3 17 27
RED HAT 0 0 10 10
Sum: 4,891 256 8,021 13,168
18
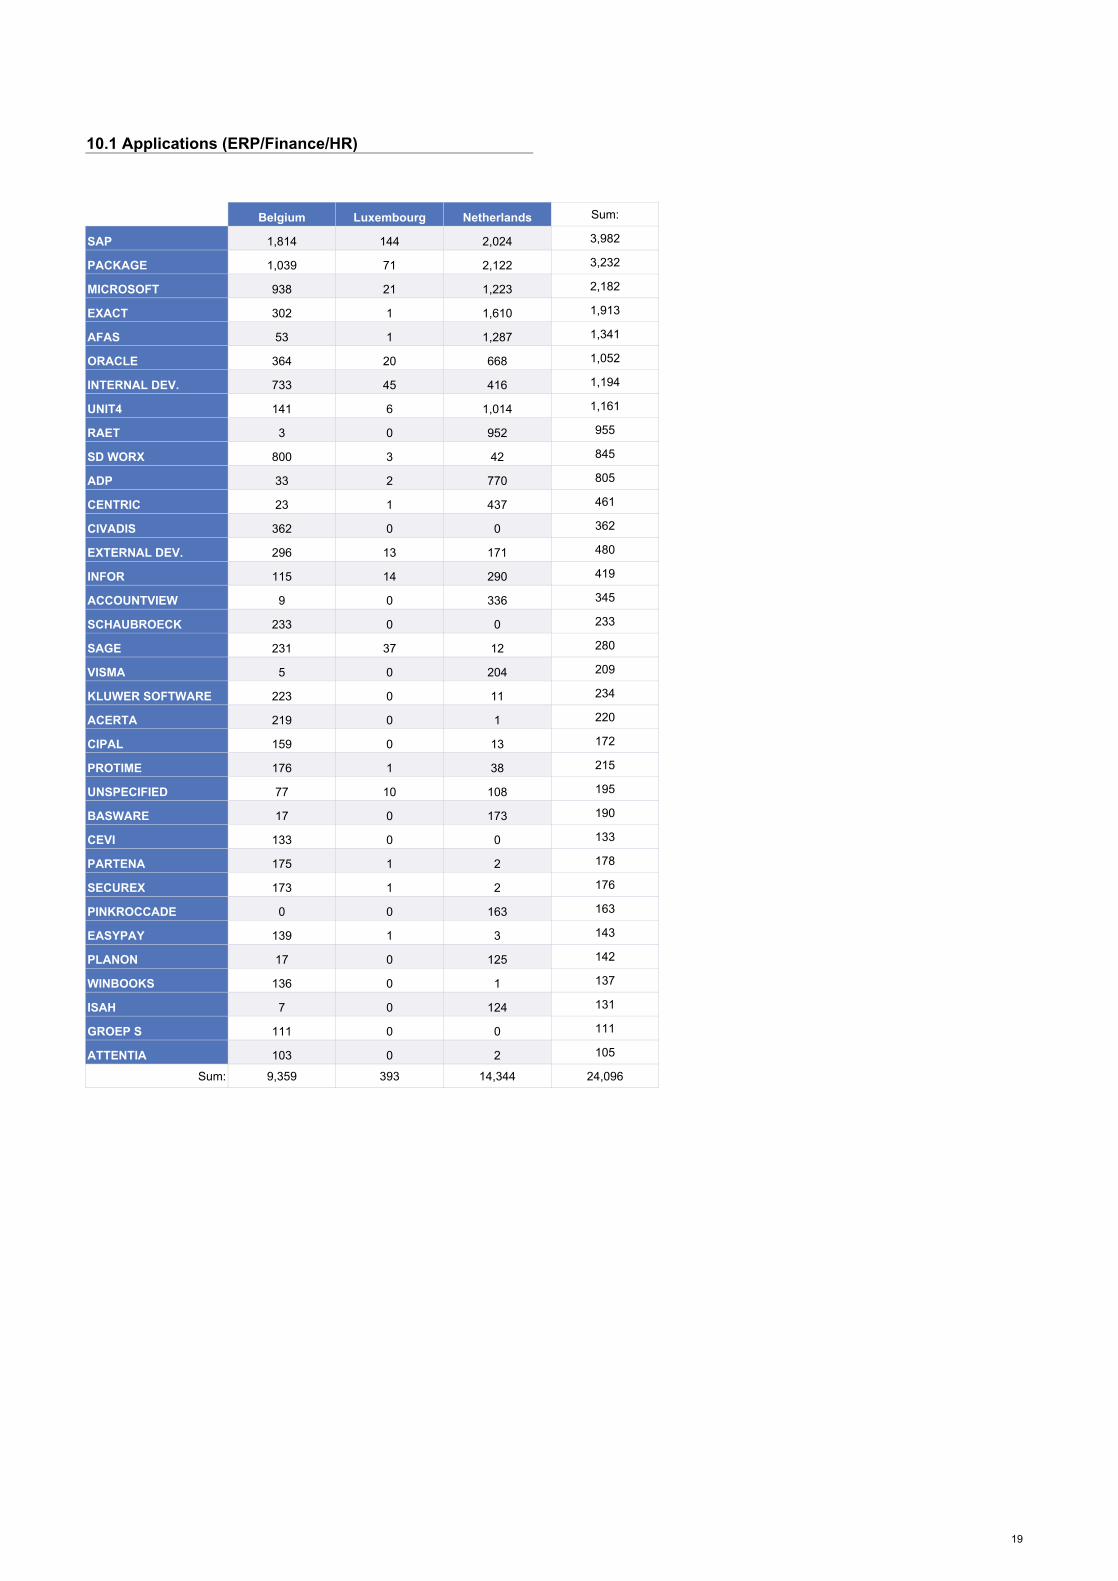
Belgium Luxembourg Netherlands Sum:
SAP 1,814 144 2,024 3,982
PACKAGE 1,039 71 2,122 3,232
MICROSOFT 938 21 1,223 2,182
EXACT 302 1 1,610 1,913
AFAS 53 1 1,287 1,341
ORACLE 364 20 668 1,052
INTERNAL DEV. 733 45 416 1,194
UNIT4 141 6 1,014 1,161
RAET 3 0 952 955
SD WORX 800 3 42 845
ADP 33 2 770 805
CENTRIC 23 1 437 461
CIVADIS 362 0 0 362
EXTERNAL DEV. 296 13 171 480
INFOR 115 14 290 419
ACCOUNTVIEW 9 0 336 345
SCHAUBROECK 233 0 0 233
SAGE 231 37 12 280
VISMA 5 0 204 209
KLUWER SOFTWARE 223 0 11 234
ACERTA 219 0 1 220
CIPAL 159 0 13 172
PROTIME 176 1 38 215
UNSPECIFIED 77 10 108 195
BASWARE 17 0 173 190
CEVI 133 0 0 133
PARTENA 175 1 2 178
SECUREX 173 1 2 176
PINKROCCADE 0 0 163 163
EASYPAY 139 1 3 143
PLANON 17 0 125 142
WINBOOKS 136 0 1 137
ISAH 7 0 124 131
GROEP S 111 0 0 111
ATTENTIA 103 0 2 105
Sum: 9,359 393 14,344 24,096
10.1 Applications (ERP/Finance/HR)
19

10.2 Number BI, CRM and Groupware sites
BI
Belgium Luxembourg Netherlands Sum:
SAP 1,175 71 2,130 3,376
IBM 268 9 839 1,116
QLIKTECH 237 10 545 792
PACKAGE 74 5 676 755
ORACLE 126 2 403 531
MICROSOFT 68 0 180 248
SAS 103 2 72 177
INTERNAL DEV. 55 6 63 124
UNSPECIFIED 30 1 34 65
MICROSTRATEGY 7 0 31 38
Sum: 2,143 106 4,973 7,222
CRM/SFA
Belgium Luxembourg Netherlands Sum:
SAP 738 22 865 1,625
MICROSOFT 409 18 715 1,142
SALESFORCE.COM 290 18 364 672
PACKAGE 118 7 472 597
INTERNAL DEV. 195 12 188 395
ORACLE 89 6 288 383
EXACT 13 0 288 301
SUPEROFFICE 17 0 90 107
EXTERNAL DEV. 45 0 56 101
UPDATE 6 1 79 86
Sum: 1,920 84 3,405 5,409
GROUPWARE
Belgium Luxembourg Netherlands Sum:
MICROSOFT 6,133 279 13,853 20,265
IBM 735 54 829 1,618
MOZILLA 100 4 38 142
NOVELL 12 0 120 132
ZARAFA 50 0 36 86
PACKAGE 48 2 31 81
KERIO 41 1 34 76
ZIMBRA 47 3 21 71
ALT-N TECH 26 0 17 43
LINUX 26 1 13 40
Sum: 7,218 344 14,992 22,554
20

10.3.1. Security Firewall, Authentification and Encryption
Belgium Luxembourg Netherlands Sum:
HW FIREWALL 2,287 142 3,071 5,500
ENDPOINT 866 33 841 1,740
SECURITY 262 3 628 893
SW FIREWALL 210 14 494 718
FOREFRONT 92 4 469 565
CONTENT SEC 37 2 139 178
ISA SERVER 27 2 109 138
ESSENTIALS 17 0 108 125
DETECTION 27 0 96 123
MAILESSENTIALS 50 1 41 92
AUTHENTICATION 3 0 79 82
WORRY-FREE 78 0 2 80
MAILMARSHAL 18 0 39 57
ENCRYPTION 15 1 40 56
REDFOX CRYPTO 0 0 37 37
WEBMARSHAL 12 0 18 30
IRONPORT 16 0 4 20
SMART SECURITY 1 0 14 15
SPAM KILLER 1 0 9 10
EPOLICY ORCHEST 0 0 4 4
SPAMASSASSIN 1 1 1 3
TIPPINGPOINT 0 0 3 3
SIEM 1 0 1 2
GWAVA 0 0 1 1
Sum: 4,021 203 6,248 10,472
Belgium Luxembourg Netherlands Sum:
CISCO 332 28 1,088 1,448
SYMANTEC 711 19 598 1,328
MICROSOFT 251 9 907 1,167
FORTINET 361 23 311 695
MCAFEE 226 16 392 634
JUNIPER 264 13 328 605
CHECK POINT 222 21 202 445
WATCHGUARD 292 13 133 438
UNSPECIFIED 172 15 220 407
SONICWALL 111 5 240 356
Sum: 2,942 162 4,419 7,523
10.3.2. Security Firewall, Authentification and Encryption
21

10.5 SaaS Solutions
Belgium Luxembourg Netherlands Sum:
HR 1,954 8 2,475 4,437
OFFICE 1,526 29 2,445 4,000
E-COMMERCE 2,168 5 555 2,728
VERTICAL 259 9 1,371 1,639
CRM/SFA 379 22 604 1,005
DMS/ECM 158 5 736 899
GROUPWARE 194 4 500 698
FINANCE 119 8 454 581
ERP 116 2 411 529
BI 28 1 102 131
CALLCENTER 7 0 121 128
SECURITY 24 3 49 76
ANTI-VIRUS 19 0 34 53
CMS 4 1 29 34
DIP 6 0 18 24
PROVIDER 0 0 1 1
Sum: 6,961 97 9,905 16,963
10.4 Antivirus
Belgium Luxembourg Netherlands Sum:
MCAFEE 1,039 51 1,528 2,618
TREND MICRO 658 54 808 1,520
SYMANTEC 338 17 661 1,016
SOPHOS 176 16 747 939
ESET 271 17 498 786
KASPERSKY 366 9 376 751
F-SECURE 130 9 104 243
AVG TECH 58 3 151 212
UNSPECIFIED 35 2 167 204
NORMAN 10 1 140 151
MICROSOFT 55 6 74 135
AVIRA 29 1 67 97
PANDA 67 28 95
AVAST SOFTWARE 44 44 88
PACKAGE 9 68 77
G DATA 21 1 54 76
BITDEFENDER 28 33 61
THREATTRACK 12 28 40
FORTINET 7 1 23 31
WEBROOT 4 21 25
CA 5 9 14
MESSAGELABS 9 3 12
BULLGUARD 4 4
SOURCEFIRE 1 3 4
CYREN 1 1 2
MICROWORLD 2 2
COMODO 1 1
Sum: 3,376 189 5,639 9,204
22

11.1 Network
VPN
Belgium Luxembourg Netherlands Sum:
VPN 700 42 2,111 2,853
MPLS IP-VPN 997 77 1,243 2,317
IPSEC VPN 779 92 538 1,409
EXPLORE 1,187 4 5 1,196
EPACITY 2 0 499 501
EVPN 0 0 170 170
ONE 2 1 51 54
SSL VPN 5 0 17 22
VPLS IP-VPN 9 0 0 9
BILAN 2 0 1 3
Sum: 3,683 216 4,635 8,534
WAN-LINK
Belgium Luxembourg Netherlands Sum:
OPTICAL FIBER 761 27 1,549 2,337
LEASED-LINE 301 41 289 631
ADSL 32 6 139 177
WIRELESS 127 0 14 141
WAN-LINK 18 2 91 111
SDSL 22 2 37 61
ISDN 3 0 41 44
DSL 1 0 18 19
OTHER WAN-LINK 9 0 9 18
FRAME RELAY 5 0 2 7
Sum: 1,279 78 2,189 3,546
23

11.2 Network Components
ROUTER
Belgium Luxembourg Netherlands Sum:
CISCO 2,387 157 4,803 7,347
HP 157 7 569 733
BELGACOM 361 0 0 361
UNSPECIFIED 165 15 112 292
JUNIPER 66 1 149 216
OTHER 114 2 87 203
TELENET 134 0 0 134
ZYXEL 10 4 60 74
PROXIMUS 71 0 0 71
3COM 8 0 54 62
Sum: 3,473 186 5,834 9,493
ROUTER/SWITCH
Belgium Netherlands Sum:
CISCO 2 122 124
HP 1 69 70
DELL 0 9 9
JUNIPER 0 6 6
3COM 0 5 5
HUAWEI 0 5 5
NETGEAR 0 4 4
OTHER 0 3 3
UNSPECIFIED 0 2 2
ALCATEL 0 1 1
AVAYA 0 1 1
D-LINK 0 1 1
Sum: 3 228 231
SWITCH
Belgium Luxembourg Netherlands Sum:
CISCO 2,137 162 3,975 6,274
HP 1,268 45 2,203 3,516
3COM 142 8 278 428
DELL 123 3 193 319
UNSPECIFIED 142 12 82 236
JUNIPER 89 2 97 188
AVAYA 122 1 64 187
D-LINK 143 6 9 158
ALCATEL 122 8 23 153
NETGEAR 59 3 68 130
Sum: 4,347 250 6,992 11,589
24
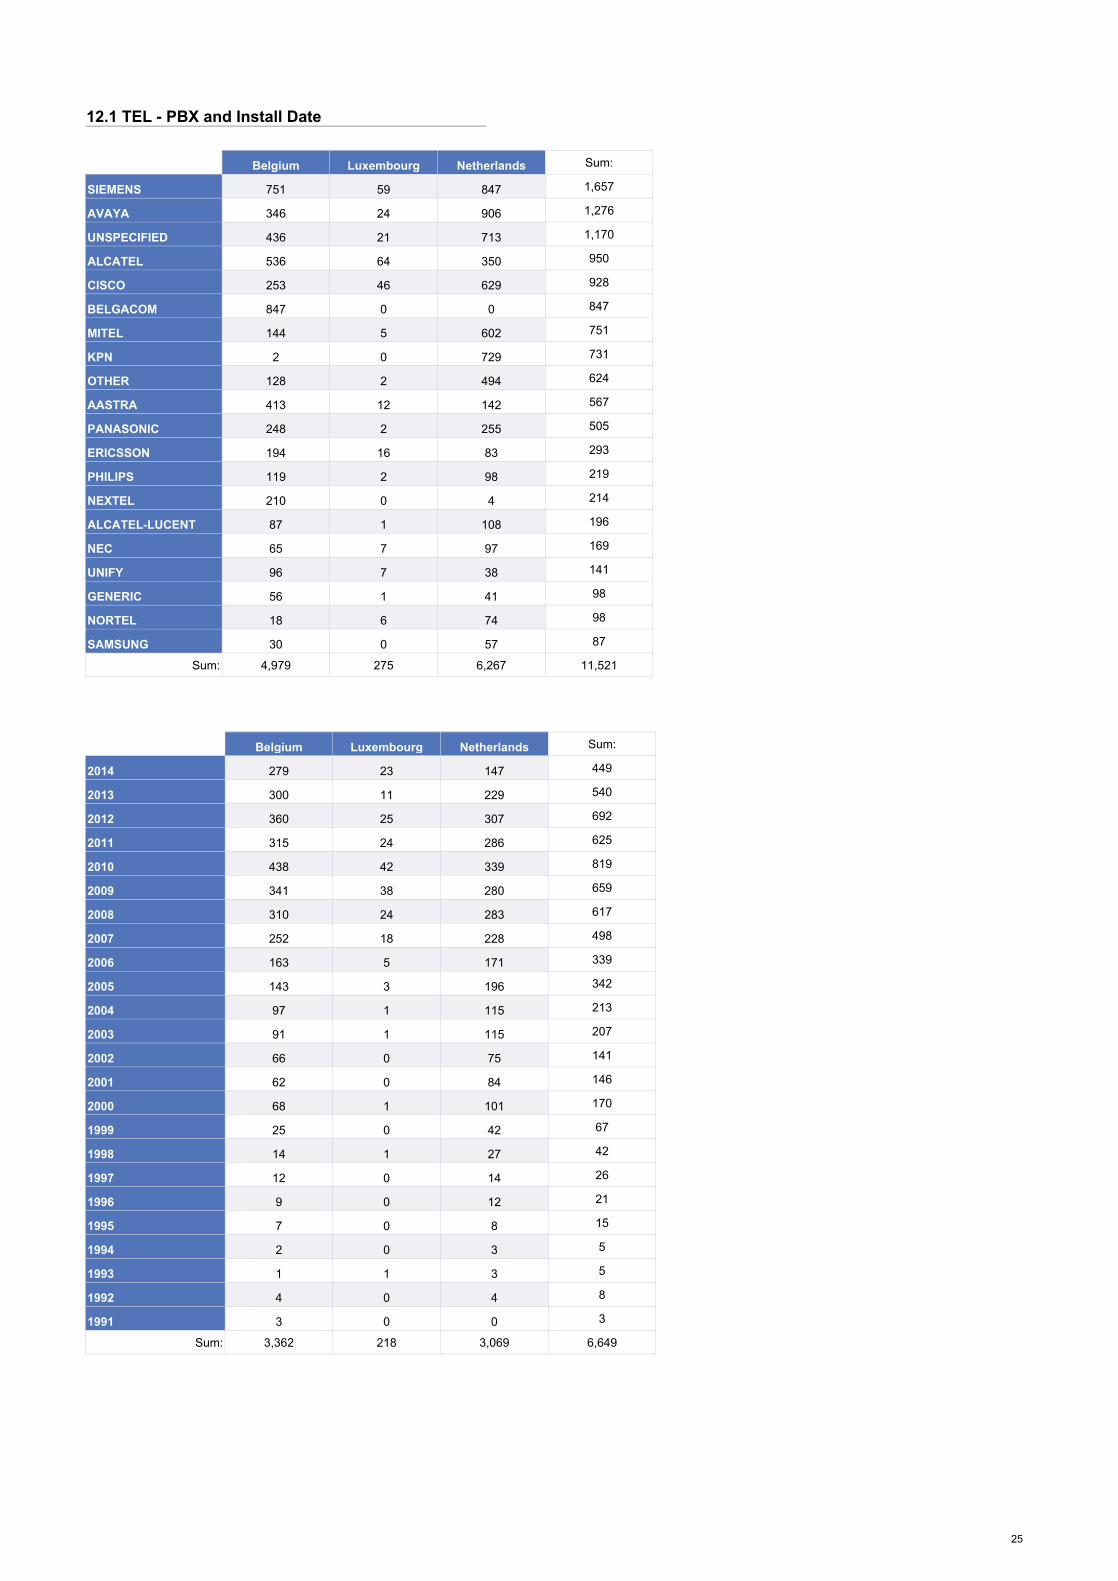
12.1 TEL - PBX and Install Date
Belgium Luxembourg Netherlands Sum:
SIEMENS 751 59 847 1,657
AVAYA 346 24 906 1,276
UNSPECIFIED 436 21 713 1,170
ALCATEL 536 64 350 950
CISCO 253 46 629 928
BELGACOM 847 0 0 847
MITEL 144 5 602 751
KPN 2 0 729 731
OTHER 128 2 494 624
AASTRA 413 12 142 567
PANASONIC 248 2 255 505
ERICSSON 194 16 83 293
PHILIPS 119 2 98 219
NEXTEL 210 0 4 214
ALCATEL-LUCENT 87 1 108 196
NEC 65 7 97 169
UNIFY 96 7 38 141
GENERIC 56 1 41 98
NORTEL 18 6 74 98
SAMSUNG 30 0 57 87
Sum: 4,979 275 6,267 11,521
Belgium Luxembourg Netherlands Sum:
2014 279 23 147 449
2013 300 11 229 540
2012 360 25 307 692
2011 315 24 286 625
2010 438 42 339 819
2009 341 38 280 659
2008 310 24 283 617
2007 252 18 228 498
2006 163 5 171 339
2005 143 3 196 342
2004 97 1 115 213
2003 91 1 115 207
2002 66 0 75 141
2001 62 0 84 146
2000 68 1 101 170
1999 25 0 42 67
1998 14 1 27 42
1997 12 0 14 26
1996 9 0 12 21
1995 7 0 8 15
1994 2 0 3 5
1993 1 1 3 5
1992 4 0 4 8
1991 3 0 0 3
Sum: 3,362 218 3,069 6,649
25
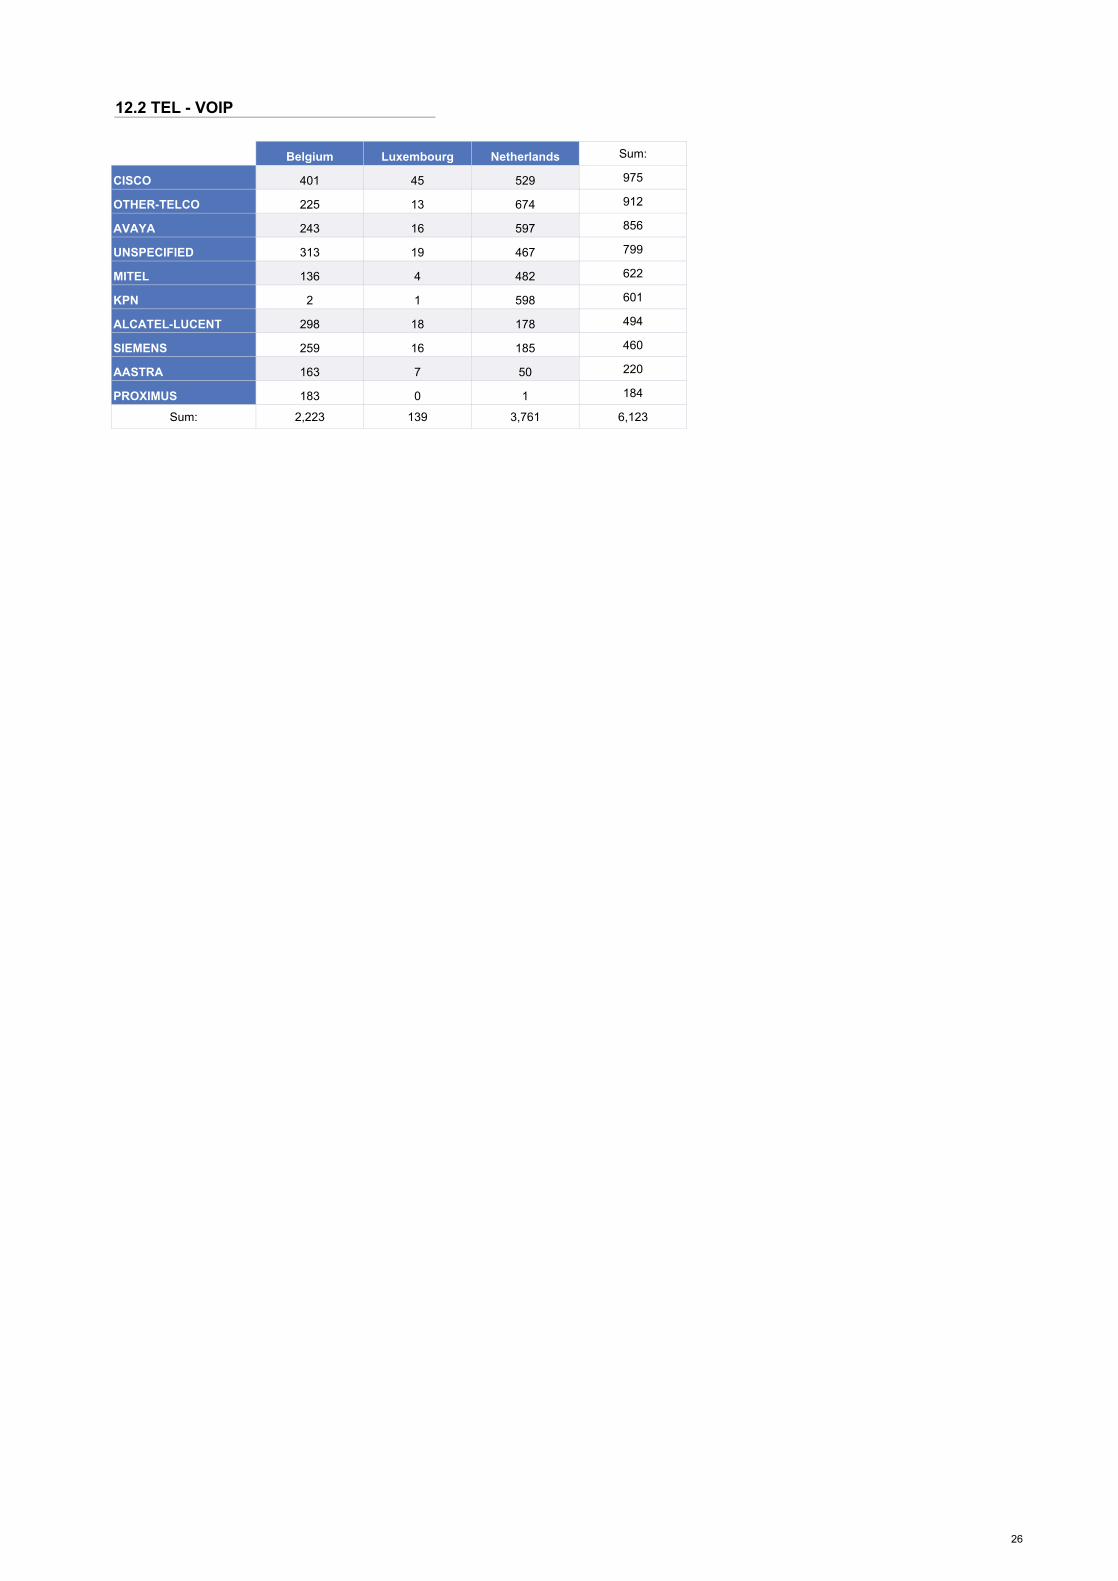
Belgium Luxembourg Netherlands Sum:
CISCO 401 45 529 975
OTHER-TELCO 225 13 674 912
AVAYA 243 16 597 856
UNSPECIFIED 313 19 467 799
MITEL 136 4 482 622
KPN 2 1 598 601
ALCATEL-LUCENT 298 18 178 494
SIEMENS 259 16 185 460
AASTRA 163 7 50 220
PROXIMUS 183 0 1 184
Sum: 2,223 139 3,761 6,123
12.2 TEL - VOIP
26

12.3 TEL - Unified Communications (UC) / Video Conferencing
UC
Belgium Luxembourg Netherlands Sum:
CISCO 98 14 93 205
AVAYA 15 1 181 197
OTHER-TELCO 42 3 83 128
UNIFY 75 0 24 99
MITEL 39 0 38 77
UNSPECIFIED 10 1 37 48
SIEMENS 33 0 11 44
KPN 0 0 41 41
MICROSOFT 19 1 21 41
ALCATEL-LUCENT 18 0 3 21
AASTRA 15 0 4 19
PANASONIC 7 0 11 18
POLYCOM 1 0 17 18
PROXIMUS 17 0 0 17
ESCAUX 12 0 0 12
BROADSOFT 0 0 10 10
IBM 1 0 4 5
INTEROUTE 0 0 5 5
SHORETEL 2 0 1 3
NORTEL 1 0 1 2
Sum: 405 20 585 1,010
VIDEOCONFERENCE
Belgium Luxembourg Netherlands Sum:
POLYCOM 329 28 362 719
TANDBERG 165 11 238 414
CISCO 133 21 204 358
LIFESIZE 82 4 109 195
OTHER-TELCO 52 3 129 184
UNSPECIFIED 64 14 82 160
MICROSOFT 9 0 26 35
AVAYA 10 2 18 30
SIEMENS 14 0 15 29
PROXIMUS 20 1 0 21
SONY 5 4 10 19
KPN 1 0 17 18
MITEL 3 0 5 8
ALCATEL-LUCENT 7 0 0 7
IBM 0 0 7 7
INTEROUTE 2 0 5 7
GLOVICOM 0 0 5 5
AASTRA 2 0 0 2
BROADSOFT 0 0 2 2
TELE2 0 0 2 2
COLT 0 0 1 1
PANASONIC 1 0 0 1
VERIZON 1 0 0 1
Sum: 900 88 1,237 2,225
27
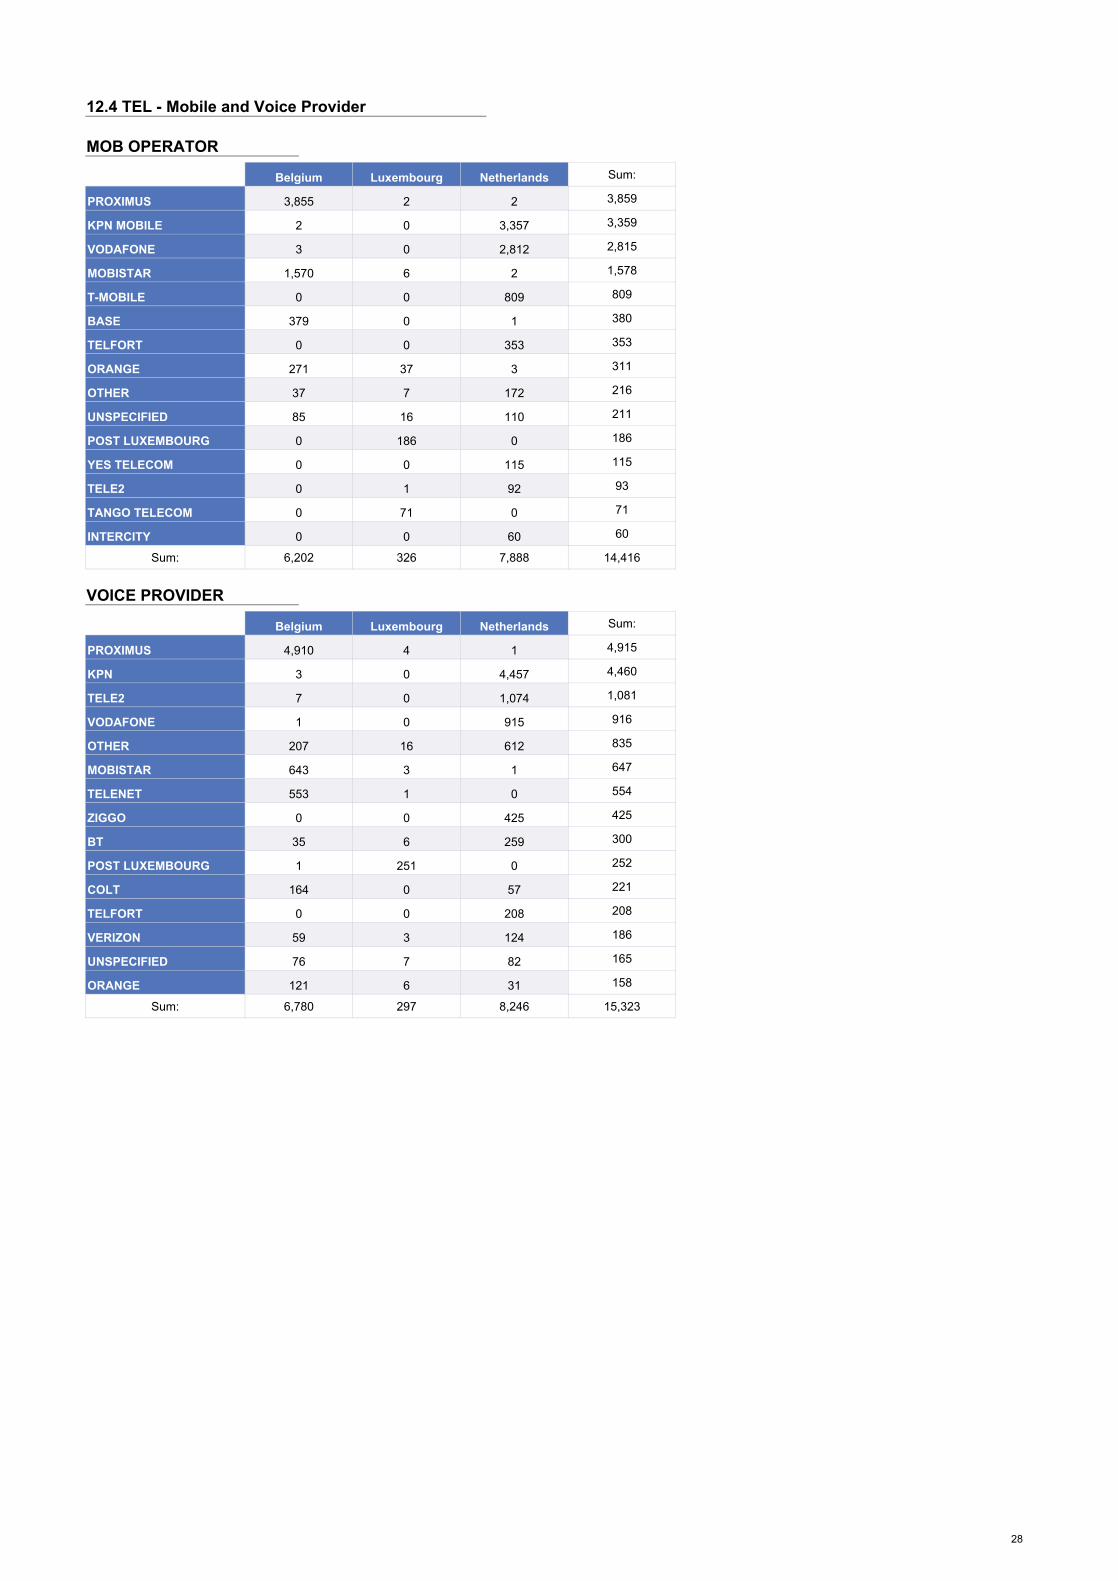
12.4 TEL - Mobile and Voice Provider
MOB OPERATOR
Belgium Luxembourg Netherlands Sum:
PROXIMUS 3,855 2 2 3,859
KPN MOBILE 2 0 3,357 3,359
VODAFONE 3 0 2,812 2,815
MOBISTAR 1,570 6 2 1,578
T-MOBILE 0 0 809 809
BASE 379 0 1 380
TELFORT 0 0 353 353
ORANGE 271 37 3 311
OTHER 37 7 172 216
UNSPECIFIED 85 16 110 211
POST LUXEMBOURG 0 186 0 186
YES TELECOM 0 0 115 115
TELE2 0 1 92 93
TANGO TELECOM 0 71 0 71
INTERCITY 0 0 60 60
Sum: 6,202 326 7,888 14,416
VOICE PROVIDER
Belgium Luxembourg Netherlands Sum:
PROXIMUS 4,910 4 1 4,915
KPN 3 0 4,457 4,460
TELE2 7 0 1,074 1,081
VODAFONE 1 0 915 916
OTHER 207 16 612 835
MOBISTAR 643 3 1 647
TELENET 553 1 0 554
ZIGGO 0 0 425 425
BT 35 6 259 300
POST LUXEMBOURG 1 251 0 252
COLT 164 0 57 221
TELFORT 0 0 208 208
VERIZON 59 3 124 186
UNSPECIFIED 76 7 82 165
ORANGE 121 6 31 158
Sum: 6,780 297 8,246 15,323
28

13. MOB - Smartphones, Tablets and Mobile Operating System (MOS)
TABLET PC
Belgium Luxembourg Netherlands Sum:
APPLE IPAD 1,707 95 2,875 4,677
SAMSUNG GALAXY TAB 26 0 77 103
Sum: 1,733 95 2,952 4,780
SMARTPHONE
Belgium Luxembourg Netherlands Sum:
APPLE IPHONE 2,735 165 4,559 7,459
SAMSUNG SMARTPHONE 1,880 73 2,720 4,673
NOKIA SMARTPHONE 679 19 965 1,663
UNSPECIFIED SMARTPHONE 331 22 598 951
HTC SMARTPHONE 332 16 530 878
HTC 1010 0 0 6 6
BLACKBERRY SMARTPHONE 414 42 407 863
HUAWEI SMARTPHONE 152 1 99 252
MICROSOFT SMARTPHONE 55 1 114 170
MOTOROLA SMARTPHONE 55 1 64 120
MOTOROLA ACCOMPLI A6188 0 0 1 1
SONY ERICSSON SMARTPHONE 58 3 53 114
LG ELECTRONICS SMARTPHONE 30 0 54 84
OTHER SMARTPHONE 24 0 36 60
ACER SMARTPHONE 19 0 6 25
SONY SMARTPHONE 6 3 13 22
T-MOBILE MDA 0 0 7 7
T-MOBILE SMARTPHONE 0 0 7 7
Sum: 6,770 346 10,239 17,355
MOS
Belgium Luxembourg Netherlands Sum:
APPLE IOS 2,715 162 4,540 7,417
GOOGLE ANDROID 2,181 83 3,105 5,369
MICROSOFT WIN/PHONE 8 564 8 788 1,360
MICROSOFT WIN/PHONE 7 66 2 147 215
MICROSOFT WIN/PHONE 10 34 2 53 89
MICROSOFT WIN/MOBILE 6 19 3 64 86
MICROSOFT WIN/MOBILE 5 2 0 13 15
BLACKBERRY BLACKBERRY OS 413 42 403 858
BLACKBERRY BLACKBERRY 10 5 0 5 10
SYMBIAN SYMBIAN OS 68 3 54 125
Sum: 6,067 305 9,172 15,544
29