benjamin k. mwanzia - e25-0134-04
DESCRIPTION
bTRANSCRIPT

JOMO KENYATTA UNIVERSITY
OF
AGRICULTURE AND TECHNOLOGY
DEPARTMENT OF CIVIL, CONSTRUCTION AND ENVIRONMENTAL
ENGINEERING
ECE 2505
FINAL YEAR PROJECT
TITLE
EVALUATION OF RAINFALL – RUNOFF RESPONSE CHARACTERI STICS
OF NZOIA BASIN
BENJAMIN KIVUITU MWANZIA
E25-0134/04
SUPERVISOR
DR. NYADAWA

i
DECLARATION
I declare and affirm to the best of my knowledge that this research is my original work and has not been
presented for a degree or any other award in this or any other university.
Signed: ……………………................. (Author); date…………………………………
BENJAMIN KIVUITU MWANZIA - E25-0134/04
I confirm that the work reported in this research was carried out by the candidate under my supervision
Signed: ……………………................. (Supervisor); date………………………………
DR. NYADAWA

ii
ABSTRACT
Study of the land use changes and their effects on runoff for a river basin is essential in water
resource planning and management. This study provides an approach to identify the effects of land-
use changes on rainfall-runoff relations in Nzoia river basin. The study objectives were to correlate
catchment runoff response with published land use and land cover changes in the basin between the
years of 1986 and 2000. In this study, time series curve with trend curve have been used to examine
the effect of land use changes on rainfall-runoff relationships. Trend analysis of rainfall shows that,
in general, the annual rainfall has decreased between 1986 and 2000. Although this is not statistically
significant considering that only four rainfall stations were used in the study. Analysis of change of
land use / land cover between 1986 and 2000 on river flow revealed that change in land use / land
cover resulted in increased runoff factor in the short rain season which increases the chance of
flooding.

iii
DEDICATION
To almighty God for the life and strength He has granted me. To my parents, brothers and sisters,
thank you for your love, emotional and financial support.

iv
ACKNOWLEDGEMENT
I wish to sincerely acknowledge the contributions of all those who assisted me either directly or otherwise
towards the undertaking of this project.
Special thanks to Dr. Nyadawa, my supervisor, for rigorously guiding me through the research process
Civil engineering department for technical and material support and through out the entire project.
To all my classmates especially Steve K. Wanyiri thanks for your creative criticism and ideas and also for
your friendship and assistance.
To all my friends, who have in one way or another contributed to the completion of this project, I am entirely
grateful for all your support.

v
TABLE OF CONTENTS
TITLE ................................................................................................................................................................... i
DECLARATION .................................................................................................................................................. i
ABSTRACT ......................................................................................................................................................... ii
DEDICATION .................................................................................................................................................... iii
ACKNOWLEDGEMENT .................................................................................................................................. iv
TABLE OF CONTENTS ..................................................................................................................................... v
LIST OF ABBREVIATIONS ........................................................................................................................... viii
LIST OF TABLES .............................................................................................................................................. ix
LIST OF FIGURES ............................................................................................................................................. x
CHAPTER ONE ........................................................................................................................................ 1
1.0. INTRODUCTION ....................................................................................... Error! Bookmark not defined.
1.1. Background ............................................................................................................................................... 1
1.2: Problem statement ..................................................................................................................................... 3
1.3: Research Objectives .................................................................................................................................. 4
1.4: Scope of Study .......................................................................................................................................... 4
CHAPTER TWO ....................................................................................................................................... 5
2.0: LITERATURE REVIEW ............................................................................................................................. 5
2.1: Introduction ............................................................................................................................................... 5
2.2: Rainfall...................................................................................................................................................... 5
2.2.1: Rainfall Seasonality in Kenya ............................................................................................................ 5
2.2.2: Rainfall Seasonality in Nzoia ............................................................................................................. 6
2.2.3: Rainfall Abstraction ........................................................................................................................... 7
2.3: Runoff Characteristics .............................................................................................................................. 7
2.3.1: The runoff process ............................................................................................................................. 8
2.3.2: Factors affecting runoff ...................................................................................................................... 9

vi
2.3.3: Runoff factor .................................................................................................................................... 11
2.4: Land-use and land-cover change (LULCC) ............................................................................................ 12
2.4.1: Introduction ...................................................................................................................................... 12
2.4.2: Causes and Consequences................................................................................................................ 13
2.4.3: Methods of land-change science ...................................................................................................... 15
2.4.4: Driving forces .................................................................................................................................. 16
2.4.5: Sustainable land management .......................................................................................................... 16
2.5: Flooding in the Nzoia basin .................................................................................................................... 18
2.5.1: Introduction ...................................................................................................................................... 18
2.5.2: Factors Contributing to Increasing Flood Disasters ......................................................................... 18
2.5.3: Impact of Floods in the River Basin ................................................................................................ 18
2.5.4: Flood Control and Management in river basins ............................................................................... 19
2.5.5: Current Floodplain Management in the basin .................................................................................. 20
CHAPTER THREE ................................................................................................................................ 21
3.0: RESEARCH METHODOLOGY............................................................................................................... 21
3.1: Research Approach ................................................................................................................................. 21
3.1.1: Determination of Seasonal patterns ................................................................................................ 21
3.1.2: Determination of Runoff factor........................................................................................................ 21
3.1.3: Determination of Seasonal runoff factor .......................................................................................... 22
3.1.4: Evaluation of Seasonal runoff factor trends ..................................................................................... 22
3.1.5: Correlating catchment runoff with published images. ..................................................................... 22
3.2: Data Collection ....................................................................................................................................... 23
3.2.1: Rainfall and runoff data ................................................................................................................... 23
3.2.2: Land use/Land cover data ................................................................................................................ 24
CHAPTER FOUR ................................................................................................................................... 26
4.0: RESULTS AND DISCUSSION ................................................................................................................. 26

vii
4.1: RESULTS ............................................................................................................................................... 26
4.2: DISCUSSION ......................................................................................................................................... 35
4.2.1: Mean monthly rainfall...................................................................................................................... 35
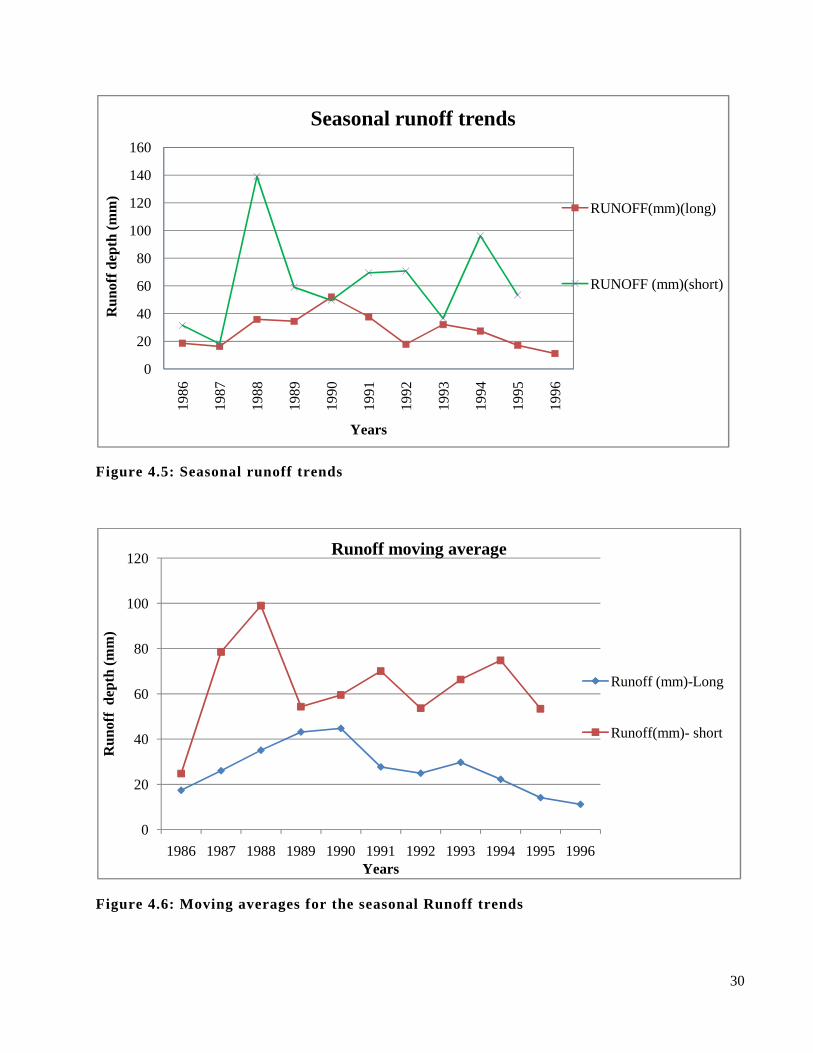
4.2.2: Seasonal rainfall and runoff trends. ................................................................................................. 35
4.2.3: Seasonal runoff factor trends ........................................................................................................... 36
4.2.4: Published land cover/ land use changes ........................................................................................... 36
4.2.5: Correlating catchment runoff response with the land use and land cover changes in the basin ...... 36
CHAPTER FIVE ..................................................................................................................................... 37
5.0: CONCLUSIONS AND RECOMMENDATIONS .................................................................................... 37
5.1: Conclusions ............................................................................................................................................. 37
5.2: Recommendations ................................................................................................................................... 37
REFERENCES .................................................................................................................................................. 38
APPENDIX ........................................................................................................................................................ 40
Appendix A: Figures ...................................................................................................................................... 40
Appendix B: Tables ....................................................................................................................................... 41

viii
LIST OF ABBREVIATIONS
1. APFM - Associated Programme on Flood Management.
2. FAO- Food and Agriculture Organization.
3. GIS - Geographical Information Systems
4. GLP - Global Land Project
5. ITCZ - Inter-Tropical Convergence Zone
6. KMD -Kenya Meteorological Department
7. LiDAR – Light Detection and Ranging
8. LULC - Land Use and Land Cover
9. LULCC - Land Use and Land- Cover Change
10. MODIS – Moderate Resolution Imaging
11. MWRMD – Ministry of Water Resources Management and Development
12. NRI – National Resource institute
13. RADAR – Radio Detection And Ranging
14. SPOT - Systeme Polyvalent pour Observation de la Terre
15. TM - Thematic Mapper
16. USGS-United States Geological Survey
17. WKCDD&FM - Western Kenya Community Driven Development & Flood Management.
18. WMO - World Meteorological Organization
19. WRMA –Water Resources Management Authority.

ix
LIST OF TABLES
Table 3.1: Rainfall and stream flow stations used in this study ......................................................................... 23
Table 4.1: Monthly rainfall and runoff data ....................................................................................................... 26
Table 4.2: Long rain season rainfall and runoff yearly totals ............................................................................ 28
Table 4.3: Short rain season rainfall and runoff yearly totals ........................................................................... 28
Table 4.4 Results of image classification ......................................................................................................... 32
Table 4.5: Land cover evolution (in %) ............................................................................................................. 33
Appendix
Table 1: Annual rainfall, runoff and runoff factor ............................................................................................. 41
Table 2: Moving averages for the seasonal rainfall ........................................................................................... 41
Table 3: Moving averages for the seasonal runoff ............................................................................................. 42
Table 4: Seasonal standard deviation and coefficient of variation .................................................................... 42

x
LIST OF FIGURES
Figure 1.1: Flooding in the lower reaches of Nzoia Basin, 2003 ......................................................................... 3
Figure 2.1: Schematic diagram illustrating relationship between rainfall, infiltration and runoff ...................... 8
Figure 2.2: Infiltration capacity curves for different soil types runoff ................................................................ 9
Figure 2.3: Runoff efficiency as a function of catchment size .......................................................................... 11
Figure 2.4: Major land use/cover classes in Nzoia Basin-1986 ......................................................................... 13
Figure 3.1: Distribution of rainfall and discharge stations used in this study ................................................... 24
Figure 3.2: Classified images of Land sat (a) 1986 and (b) 2000 ...................................................................... 25
Figure 4.1: Mean monthly rainfall and runoff patterns ...................................................................................... 27
Figure 4.2: Mean monthly runoff trends ............................................................................................................ 27
Figure 4.3: Seasonal rainfall patterns over the years ......................................................................................... 29
Figure 4.4: Moving averages for the seasonal rainfall ....................................................................................... 29
Figure 4.5: Seasonal runoff trends ..................................................................................................................... 30
Figure 4.6: Moving averages for the seasonal Runoff trends ............................................................................ 30
Figure 4.7 (a): Rainfall and runoff correlation for long season ......................................................................... 31
Figure 4.7(b): Rainfall and runoff correlation for short season ......................................................................... 31
Figure 4.8: Seasonal runoff factor trends ........................................................................................................... 32
Figure 4.9(a): Land cover evolution (in %) for 1986 based on Table 4.5 .......................................................... 33
Figure 4.9(b): Land cover evolution (in %) for 2000based on Table 4.5 .......................................................... 34
Appendix
Figure 1: Rainfall monthly variation between two periods ................................................................................ 40
Figure 2: Annual rainfall and annual runoff patterns ......................................................................................... 40

1
CHAPTER ONE
1.0 INTRODUCTION
1.1 Background
The challenge to manage our water resources in a sustainable and appropriate manner is growing. Water
related disasters are not accepted anymore and societies expect more and more that water is always available
at the right moment and at the desired quantity and quality. Current water management practices are still
focused on reacting to events occurred in the past: the re-active approach. At many international high level
ministerial and scientific meetings a call for more strategic oriented water management, the pro-active
approach has been advocated. Despite these calls such a pro-active approach is hardly adopted by water
managers and policy makers. (Van loon. and Droogers, 2006)
The evaluation of Rainfall-Runoff response characteristics is important element or prerequisite for the design
of soil and water conservation and other hydraulic structures. It also forms significant components of
catchment studies aimed at determining the hydrological response and water resource availability as
influenced by changes in land use. The rainfall -runoff response characteristics for a catchment can be
computed by recorded data derived from simple recorders. River basins ecosystems support and nature many
human communities all over the world. River basins therefore need a lot of planning to protect and manage
them for them to continue supporting their ecosystems. Gaining and consolidating access and control over the
basins’ natural resources is essential for socially and economically deprived and vulnerable communities who
depend directly on these resources for their livelihoods. (Onyando and Sharma, 1995)
Nzoia river basin is one of major river basin in Kenya and is currently facing some challenge in supporting its
ecosystem. Stakeholders in the Nzoia River Basin are increasingly noticing declining water quantity and
quality due to environmental degradation. The way in which water is managed is a critical factor in achieving
poverty alleviation, improving local people’s health, food security, economic development, protecting a range
of natural resources and the industrial base in western Kenya, and generally ensures a sustainable development
in this basin. Nzoia River Basin lies between latitude 1° 30’N and 0°05’S and longitude 34°E and 35° 45’E.
The Nzoia River originates from Cherangani Hills at a mean elevation of 2300 m above sea level and drains
into Lake Victoria at an altitude of 1000 m. It runs approximately southwest and measures about 12,900 Km2,
with a mean annual discharge of 1777 x 106 cubic meters/year. The population within the Basin is more than 3
million people. The climate of the Basin is mainly tropical humid characterized by day temperatures varying
between 16º C in the highland areas of cherengani and Mount Elgon to 28º C in the lower semi-arid areas on
2
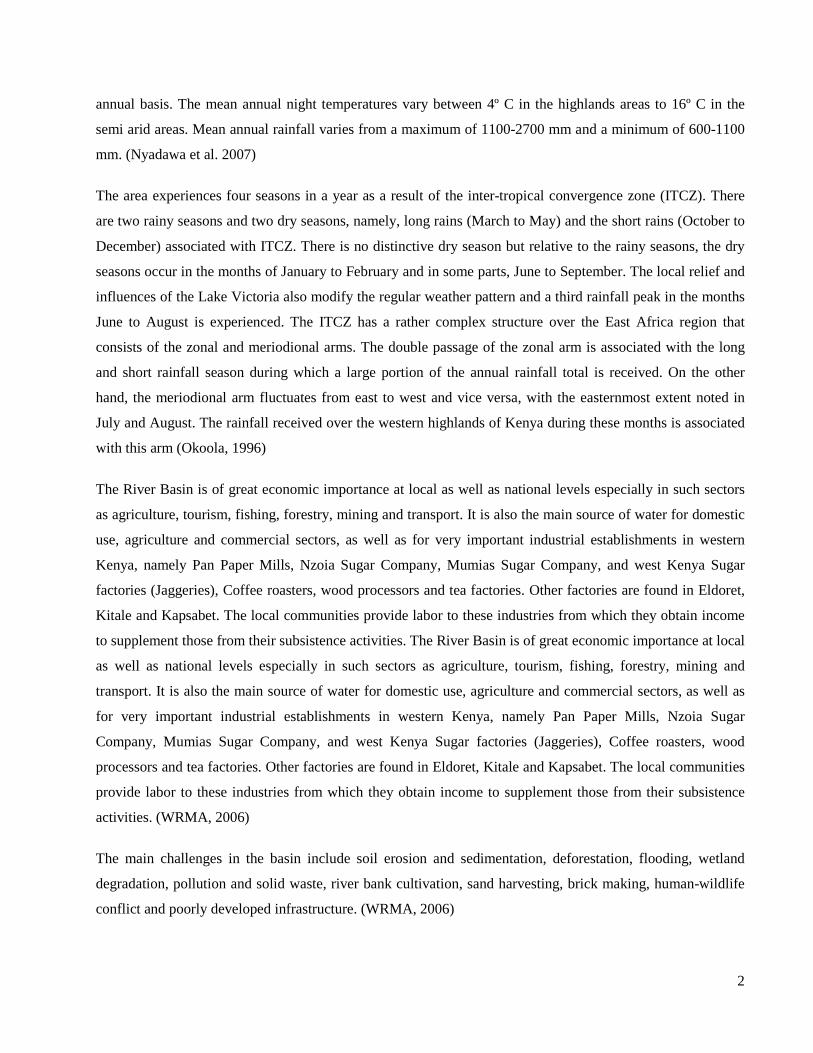
annual basis. The mean annual night temperatures vary between 4º C in the highlands areas to 16º C in the
semi arid areas. Mean annual rainfall varies from a maximum of 1100-2700 mm and a minimum of 600-1100
mm. (Nyadawa et al. 2007)
The area experiences four seasons in a year as a result of the inter-tropical convergence zone (ITCZ). There
are two rainy seasons and two dry seasons, namely, long rains (March to May) and the short rains (October to
December) associated with ITCZ. There is no distinctive dry season but relative to the rainy seasons, the dry
seasons occur in the months of January to February and in some parts, June to September. The local relief and
influences of the Lake Victoria also modify the regular weather pattern and a third rainfall peak in the months
June to August is experienced. The ITCZ has a rather complex structure over the East Africa region that
consists of the zonal and meriodional arms. The double passage of the zonal arm is associated with the long
and short rainfall season during which a large portion of the annual rainfall total is received. On the other
hand, the meriodional arm fluctuates from east to west and vice versa, with the easternmost extent noted in
July and August. The rainfall received over the western highlands of Kenya during these months is associated
with this arm (Okoola, 1996)
The River Basin is of great economic importance at local as well as national levels especially in such sectors
as agriculture, tourism, fishing, forestry, mining and transport. It is also the main source of water for domestic
use, agriculture and commercial sectors, as well as for very important industrial establishments in western
Kenya, namely Pan Paper Mills, Nzoia Sugar Company, Mumias Sugar Company, and west Kenya Sugar
factories (Jaggeries), Coffee roasters, wood processors and tea factories. Other factories are found in Eldoret,
Kitale and Kapsabet. The local communities provide labor to these industries from which they obtain income
to supplement those from their subsistence activities. The River Basin is of great economic importance at local
as well as national levels especially in such sectors as agriculture, tourism, fishing, forestry, mining and
transport. It is also the main source of water for domestic use, agriculture and commercial sectors, as well as
for very important industrial establishments in western Kenya, namely Pan Paper Mills, Nzoia Sugar
Company, Mumias Sugar Company, and west Kenya Sugar factories (Jaggeries), Coffee roasters, wood
processors and tea factories. Other factories are found in Eldoret, Kitale and Kapsabet. The local communities
provide labor to these industries from which they obtain income to supplement those from their subsistence
activities. (WRMA, 2006)
The main challenges in the basin include soil erosion and sedimentation, deforestation, flooding, wetland
degradation, pollution and solid waste, river bank cultivation, sand harvesting, brick making, human-wildlife
conflict and poorly developed infrastructure. (WRMA, 2006)

3
Source: MWRMD, 2004
Figure 1.1: Flooding in the lower reaches of Nzoia Basin, 2003
1.2 Problem statement
The lower flood plain areas within Nzoia River Basin, experience serious flooding and destruction each year
due to degraded upper catchment, high levels of sedimentation, land use and lack of flood control structures to
manage the damaging effects of the Nzoia waters. Communities who live in the area continue to experience
annual flood disasters due to failure of structural flood mitigation systems like Earth dykes in controlling high
flows. In western Kenya, marginally productive land has been over-cropped and other unsustainable farming
practices have been in use. This makes the farmers very vulnerable to natural variations such as lack of rain.
The situation is aggravated by a number of other problems such as overpopulation. Inappropriate farming
methods have created large tracts of degraded land where erosion has stripped away fertile land. As such, the
small-scale farmers can no longer grow successfully certain crops and are forced to change their farming
methods but lack the knowledge and resources to do so. As a result, they continue to grow the wrong crops in
the wrong places causing even more damage and land degradation. This kind of farming leads to more and
more poverty because the growing of crops on degraded land means that the yields are poor. This way the
farmers make no money, which they could use to invest on their land for better yields. All these needs make
the basin vulnerable to any hydrologic impacts of land use and climate changes. Destruction of natural forest

4
cover in the middle and upper zones of Nzoia continue unabated. The linkage between environmental
degradation and increased incidence of flood disaster is poorly understood amongst communities occupying
the highlands and lowlands. Community based flood disaster mitigation measures is yet to take off and is
being hampered by lack of research based data on the linkage between land use change and catchment runoff
response in the basin. Thus the study presented evaluates the rainfall - runoff response characteristics caused
by change in land use / land cover in the Nzoia basin.
1.3 Research Objectives
1.3.1 General objective
The general objective of the study evaluates the rainfall-runoff response characteristics in Nzoia basin.
1.3.2 Specific objectives
1. To derive seasonal trends of runoff factor in the basin as indicator of catchment runoff response.
2. To correlate catchment runoff response with published changes in land use and land cover in the
basin.
1.4 Scope of Study
The study only dealt with rainfall and runoff data from 1986-2000. The period of study was majorly
influenced by the available published land use/land cover change images. Desk study was used as the
preliminary step carried out for better understanding of the study process.

5
CHAPTER TWO
2.0 LITERATURE REVIEW
2.1 Introduction
A drainage basin or river basin is an extent of land where water from rain or snow melt drains downhill
into a body of water, such as a river, lake, reservoir, estuary, wetland, sea or ocean. The drainage basin
includes both the streams and rivers that convey the water as well as the land surfaces from which water drains
into those channels, and is separated from adjacent basins by a drainage divide. The drainage basin acts like a
funnel, collecting all the water within the area covered by the basin and channeling it into a waterway. Each
drainage basin is separated topographically from adjacent basins by a geographical barrier such as a ridge, hill
or mountain, which is known as a water divide.
2.2 Rainfall
Rainfall is known as the main contributor to the generation of surface runoff. Therefore there is a significant
and unique relationship between rainfall and surface runoff. By basic principle of hydrologic cycle, when rain
falls, the first drops of water are intercepted by the leaves and stems of the vegetation. This is usually referred
to as interception storage. Once they reach the ground surface, the water will infiltrate through the soil until it
reaches a stage where the rate of rainfall intensity exceeds the infiltration capacity of the soil. The infiltration
capacity of soil may vary depending on the soil texture and structure. For instant, soil composed of a high
percentage of sand allows water to infiltrate through it quite rapidly because it has large, well connected pore
spaces. Soils dominated by clay have low infiltration rates due to their smaller sized pore spaces. However,
there is actually less total pore space in a unit volume of coarse, sandy soil than that of soil composed mostly
of clay. As a result, sandy soils fill rapidly and commonly generate runoff sooner than clay soils. (Ritter,
2006)
2.2.1 Rainfall Seasonality in Kenya
Kenya is generally a dry country; over75% of its area is classed as arid of semi-arid with only around 20%
being viable for agriculture. Inland, rainfall and temperatures are closely related to altitude changes, with
variations induced by local topography. Generally the climate is warm and humid at the coast, cool and humid
in the central highlands, and hot and dry in the north and east. (NRI, 1996)

6
Across most of the country, rainfall is strongly seasonal, although its pattern, timing and extent vary greatly
from place to place and from year to year. The relatively wet coastal belt along the Indian Ocean receives
1,000 mm or more rain per year. Most rain falls from April to July as a result of the southeasterly monsoon.
Another moist belt occurs in the Lake Victoria basin and its surrounding scarps and uplands, mainly due to
moist westerly winds originating over the Atlantic Ocean and Congo Basin. Except immediately adjacent to
the Lake, rainfall occurs reliably from March to November. The upland plateau adjacent to this area is less
influenced by the lake, and rain falls mainly in March-May and July-September. In much of the central
highlands, there is also a bimodal rainfall pattern, with rainy seasons in March-May and October-December.
The remaining 70% or so of the land area falls into the 'arid lowlands' zone with rainfall averaging less than
500 mm and varying greatly from year to year. Rainfall peaks in most areas are in November and April. Some
30% of this zone can be classed as semi-desert, with rainfall averaging less than 300 mm per year and
evaporation often greater that 3,000 mm. (NRI, 1996)
Except for the coast and Lake Victoria region, altitude is the main determinant of precipitation. The high-
attitude areas in the central Kenya highlands usually have substantial rainfall, reaching over 2,000 mm per
year in parts of the Mau Escarpment. However, topography also has a major influence, with strong rain-
shadow effects east of Mt. Kenya and the Aberdare mountains. Here, even areas higher than 1,800 m may be
relatively dry. In the arid lowlands the peaks of isolated mountains attract cloud and mist, and may support
very different vegetation to that of the surrounding plains. (NRI, 1996)
2.2.2 Rainfall Seasonality in Nzoia
Mean annual rainfall in Nzoia basin varies from a maximum of 1100-2700 mm and a minimum of 600-1100
mm. The area experiences four seasons in a year as a result of the inter-tropical convergence zone. There are
two rainy seasons and two dry seasons, namely, short rains (October-December) and the long rains (March-
May). The dry seasons occur in the months of January to February and June to September. However the local
relief and influences of the Lake Victoria modify the regular weather pattern. Trend analysis of rainfall in the
area from previous studies shows that, in general, the annual rainfall has increased by about 2.3 mm/year
between 1962 and 2004. Although this is not statistically significant, analysis of monthly rainfall has shown
that out of a total of 14 stations, four have shown significant trends at 5% significance level. An important
observation is that out of 10 rainfall stations that show an increasing trend, eight are found in the highland
areas. The lower catchment receives much less rainfall and some stations exhibit decreasing rainfall trends.
The variation of trends on a monthly basis, show that the months May to September and December have
shown decreasing amounts although not statistically significant. (Nyadawa et al. 2007)
7
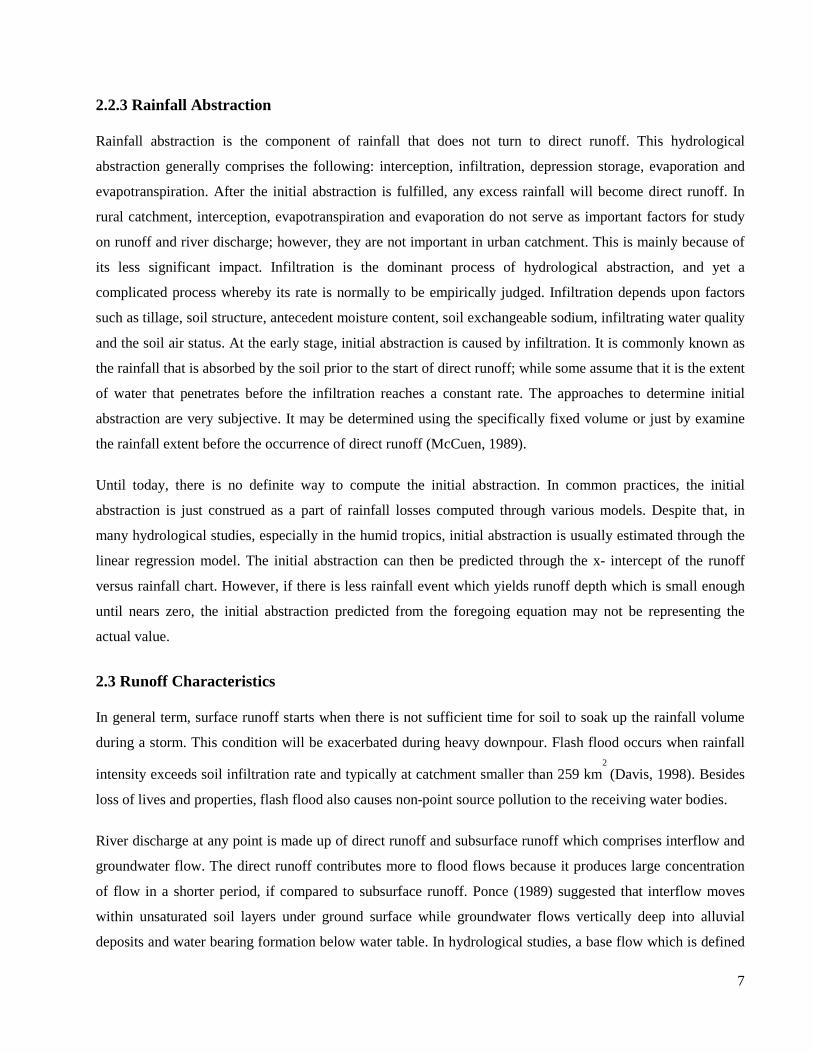
2.2.3 Rainfall Abstraction
Rainfall abstraction is the component of rainfall that does not turn to direct runoff. This hydrological
abstraction generally comprises the following: interception, infiltration, depression storage, evaporation and
evapotranspiration. After the initial abstraction is fulfilled, any excess rainfall will become direct runoff. In
rural catchment, interception, evapotranspiration and evaporation do not serve as important factors for study
on runoff and river discharge; however, they are not important in urban catchment. This is mainly because of
its less significant impact. Infiltration is the dominant process of hydrological abstraction, and yet a
complicated process whereby its rate is normally to be empirically judged. Infiltration depends upon factors
such as tillage, soil structure, antecedent moisture content, soil exchangeable sodium, infiltrating water quality
and the soil air status. At the early stage, initial abstraction is caused by infiltration. It is commonly known as
the rainfall that is absorbed by the soil prior to the start of direct runoff; while some assume that it is the extent
of water that penetrates before the infiltration reaches a constant rate. The approaches to determine initial
abstraction are very subjective. It may be determined using the specifically fixed volume or just by examine
the rainfall extent before the occurrence of direct runoff (McCuen, 1989).
Until today, there is no definite way to compute the initial abstraction. In common practices, the initial
abstraction is just construed as a part of rainfall losses computed through various models. Despite that, in
many hydrological studies, especially in the humid tropics, initial abstraction is usually estimated through the
linear regression model. The initial abstraction can then be predicted through the x- intercept of the runoff
versus rainfall chart. However, if there is less rainfall event which yields runoff depth which is small enough
until nears zero, the initial abstraction predicted from the foregoing equation may not be representing the
actual value.
2.3 Runoff Characteristics
In general term, surface runoff starts when there is not sufficient time for soil to soak up the rainfall volume
during a storm. This condition will be exacerbated during heavy downpour. Flash flood occurs when rainfall
intensity exceeds soil infiltration rate and typically at catchment smaller than 259 km2
(Davis, 1998). Besides
loss of lives and properties, flash flood also causes non-point source pollution to the receiving water bodies.
River discharge at any point is made up of direct runoff and subsurface runoff which comprises interflow and
groundwater flow. The direct runoff contributes more to flood flows because it produces large concentration
of flow in a shorter period, if compared to subsurface runoff. Ponce (1989) suggested that interflow moves
within unsaturated soil layers under ground surface while groundwater flows vertically deep into alluvial
deposits and water bearing formation below water table. In hydrological studies, a base flow which is defined

8
as the water discharged from groundwater storage is an important indicator to separate between direct runoff
and indirect runoff (McCuen, 1989). In the humid tropics, when there is no rainfall, a river base flow will only
constitute of groundwater flow (Ponce, 1989). This is because perennial type of river is common in that
region. It will be advantageous to use remotely-sensed data and GIS for runoff estimation when the catchment
is large and in-situ data are not available.
2.3.1 The runoff process
When rain falls, the first drops of water are intercepted by the leaves and stems of the vegetation. This is
usually referred to as interception storage.
Source: Linsley et al. 1958
Figure 2.1: Schematic diagram illustrating relationship between rainfall, infiltration and
runoff
As the rain continues, water reaching the ground surface infiltrates into the soil until it reaches a stage where
the rate of rainfall (intensity) exceeds the infiltration capacity of the soil. Thereafter, surface puddles, ditches,
and other depressions are filled (depression storage), after which runoff is generated. The infiltration capacity
of the soil depends on its texture and structure, as well as on the antecedent soil moisture content (previous

9
rainfall or dry season). The initial capacity (of a dry soil) is high but, as the storm continues, it decreases until
it reaches a steady value termed as final infiltration rate (see Figure2.1). The process of runoff generation
continues as long as the rainfall intensity exceeds the actual infiltration capacity of the soil but it stops as soon
as the rate of rainfall drops below the actual rate of infiltration. For a better understanding of the difficulties of
accurately predicting the amount of runoff resulting from a rainfall event, the major factors which influence
the rainfall-runoff process are described below.
2.3.2 Factors affecting runoff
Apart from rainfall characteristics such as intensity, duration and distribution, there are a number of site (or
catchment) specific factors which have a direct bearing on the occurrence and volume of runoff.
a) Soil type
The infiltration capacity is among others dependent on the porosity of a soil which determines the water
storage capacity and affects the resistance of water to flow into deeper layers. Porosity differs from one soil
type to the other. The highest infiltration capacities are observed in loose, sandy soils while heavy clay or
loamy soils have considerable smaller infiltration capacities. Figure 2.2 illustrates the difference in infiltration
capacities measured in different soil types. The infiltration capacity depends furthermore on the moisture
content prevailing in a soil at the onset of a rainstorm. The initial high capacity decreases with time (provided
the rain does not stop) until it reaches a constant value as the soil profile becomes saturated (Fig. 2.1 and 2.2).
Source: Linsley et al. 1958
Figure 2.2: Infiltration capacity curves for different soil types runoff

10
This however, is only valid when the soil surface remains undisturbed. It is well known that the average size
of raindrops increases with the intensity of a rainstorm. In a high intensity storm the kinetic energy of
raindrops is considerable when hitting the soil surface. This causes a breakdown of the soil aggregate as well
as soil dispersion with the consequence of driving fine soil particles into the upper soil pores. This results in
clogging of the pores, formation of a thin but dense and compacted layer at the surface which highly reduces
the infiltration capacity. This effect, often referred to as capping, crusting or sealing, explains why in arid and
semi-arid areas where rainstorms with high intensities are frequent, considerable quantities of surface runoff
are observed even when the rainfall duration is short and the rainfall depth is comparatively small. Soils with a
high clay or loam content (e.g. Loess soils with about 20% clay) are the most sensitive for forming a cap with
subsequently lower infiltration capacities. On coarse, sandy soils the capping effect is comparatively small.
b) Vegetation
The amount of rain lost to interception storage on the foliage depends on the kind of vegetation and its growth
stage. Values of interception are between 1 and 4 mm. A cereal crop, for example, has a smaller storage
capacity than a dense grass cover. More significant is the effect the vegetation has on the infiltration capacity
of the soil. A dense vegetation cover shields the soil from the raindrop impact and reduces the crusting effect
as described earlier. In addition, the root system as well as organic matter in the soil increases the soil porosity
thus allowing more water to infiltrate. Vegetation also retards the surface flow particularly on gentle slopes,
giving the water more time to infiltrate and to evaporate. In conclusion, an area densely covered with
vegetation, yields less runoff than bare ground.
c) Slope and catchment size
Investigations on experimental runoff plots (Sharma et al. 1986) have shown that steep slope plots yield more
runoff than those with gentle slopes. In addition, it was observed that the quantity of runoff decreased with
increasing slope length. This is mainly due to lower flow velocities and subsequently a longer time of
concentration (defined as the time needed for a drop of water to reach the outlet of a catchment from the most
remote location in the catchment). This means that the water is exposed for a longer duration to infiltration
and evaporation before it reaches the measuring point. The same applies when catchment areas of different
sizes are compared. The runoff efficiency (volume of runoff per unit of area) increases with the decreasing
size of the catchment i.e. the larger the size of the catchment the larger the time of concentration and the
smaller the runoff efficiency. Figure 2.3 clearly illustrates this relationship.

11
Source: Ben Asher, 1988
Figure 2.3: Runoff efficiency as a function of catchment size
It should however be noted that the diagram in Figure 2.3 has been derived from investigations in the Negev
desert and not be considered as generally applicable to others regions. The purpose of this diagram is to
demonstrate the general trend between runoff and catchment size.
2.3.3 Runoff factor
Apart from the above-mentioned site-specific factors which strongly influence the rainfall-runoff
process, it should also be considered that the physical conditions of a catchment area are not
homogenous. Even at the micro level there are a variety of different slopes, soil types, vegetation
covers etc. Each catchment has therefore its own runoff response and will respond differently to
different rainstorm events. The design of water harvesting schemes requires the knowledge of the
quantity of runoff to be produced by rainstorms in a given catchment area. It is commonly assumed
that the quantity (volume) of runoff is a proportion (percentage) of the rainfall depth. In rural
catchments where no or only small parts of the area are impervious, the factor, K, which describes
the percentage of runoff resulting from a rainstorm, is however not a constant factor. Instead its value
is highly variable and depends on the above described catchment-specific factors and on the
rainstorm characteristics. For example, in a specific catchment area with the same initial boundary

12
condition (e.g. antecedent soil moisture), a rainstorm of 40 minutes duration with an average
intensity of 30 mm/h would produce a smaller percentage of runoff than a rainstorm of only 20
minutes duration but with an average intensity of 60 mm/h although the total rainfall depth of both
events were equal. (FAO, 1991)
2.4 Land-use and land-cover change (LULCC)
2.4.1 Introduction
Land cover is the physical material at the surface of the earth or it refers to the physical and biological cover
over the surface of land, including water, vegetation, bare soil, and/or artificial structures etc. Land cover is
distinct from land use despite the two terms often being used interchangeably. Land use is a more complicated
term. It is a description of how people utilize the land and socio-economic activity - urban and agricultural
land uses are two of the most commonly recognized high-level classes of use. At any one point or place, there
may be multiple and alternate land uses, the specification of which may have a political dimension.
Land-use and land-cover change (LULCC ); also known as land change is a general term for the human
modification of Earth's terrestrial surface. Though humans have been modifying land to obtain food and other
essentials for thousands of years, current rates, extents and intensities of LULCC are far greater than ever in
history, driving unprecedented changes in ecosystems and environmental processes at local, regional and
global scales. These changes encompass the greatest environmental concerns of human populations today,
including climate change, biodiversity loss and the pollution of water, soils and air. Monitoring and mediating
the negative consequences of LULCC while sustaining the production of essential resources has therefore
become a major priority of researchers and policymakers around the world. (Meyer and Turner, 1994)

13
Source: Faith, 2009
Figure 2.4: Major land use/cover classes in Nzoia Basin-1986
2.4.2 Causes and Consequences
Changes in land use and land cover date to prehistory and are the direct and indirect consequence of human
actions to secure essential resources. This may first have occurred with the burning of areas to enhance the
availability of wild game and accelerated dramatically with the birth of agriculture, resulting in the extensive
clearing (deforestation) and management of Earth’s terrestrial surface that continues today. More recently,
industrialization has encouraged the concentration of human populations within urban areas (urbanization) and
the depopulation of rural areas, accompanied by the intensification of agriculture in the most productive lands
and the abandonment of marginal lands. All of these causes and their consequences are observable
simultaneously around the world today. (De Fries et al. 2004)
a) Biodiversity loss
Biodiversity is often reduced dramatically by LULCC. When land is transformed from a primary forest to a
farm, the loss of forest species within deforested areas is immediate and complete. Even when unaccompanied

14
by apparent changes in land cover, similar effects are observed whenever relatively undisturbed lands are
transformed to more intensive uses, including livestock grazing, selective tree harvest and even fire
prevention. The habitat suitability of forests and other ecosystems surrounding those under intensive use are
also impacted by the fragmenting of existing habitat into smaller pieces (habitat fragmentation), which
exposes forest edges to external influences and decreases core habitat area. Smaller habitat areas generally
support fewer species (island biogeography), and for species requiring undisturbed core habitat, fragmentation
can cause local and even general extinction. Research also demonstrates that species invasions by non-native
plants, animals and diseases may occur more readily in areas exposed by LULCC, especially in proximity to
human settlements. (Tumer et al. 1990)
b) Climate Change
LULCC plays a major role in climate change at global, regional and local scales. At global scale, LULCC is
responsible for releasing greenhouse gases to the atmosphere, thereby driving global warming. LULCC can
increase the release of carbon dioxide to the atmosphere by disturbance of terrestrial soils and vegetation, and
the major driver of this change is deforestation, especially when followed by agriculture, which causes the
further release of soil carbon in response to disturbance by tillage. Changes in land use and land cover are also
behind major changes in terrestrial emissions of other greenhouse gases, especially methane (altered surface
hydrology: wetland drainage and rice paddies; cattle grazing), and nitrous oxide (agriculture: input of
inorganic nitrogen fertilizers; irrigation; cultivation of nitrogen fixing plants; biomass combustion).
Though LULCC certainly plays a critical role in greenhouse gas emissions, the complexity and dynamic
interplay of land use processes favoring net accumulation versus net release of carbon dioxide and other
greenhouse gases makes it a poorly constrained component of our global budgets for these gases; an active
area of current research. A further source of uncertainty in estimating the climate changes caused by LULCC
is the release of sulfur dioxide and particulates by biomass combustion associated with agriculture, land
clearing and human settlements. These emissions are believed to cause regional and global cooling by the
reflection of sunlight from particulates and aerosols, and by their effects on cloud cover. (Ruddiman, 2003)
c) Pollution
Changes in land use and land cover are important drivers of water, soil and air pollution. Perhaps the oldest of
these is land clearing for agriculture and the harvest of trees and other biomass. Vegetation removal leaves
soils vulnerable to massive increases in soil erosion by wind and water, especially on steep terrain, and when
accompanied by fire, also releases pollutants to the atmosphere. This not only degrades soil fertility over time,
reducing the suitability of land for future agricultural use, but also releases huge quantities of phosphorus,

15
nitrogen, and sediments to streams and other aquatic ecosystems, causing a variety of negative impacts
(increased sedimentation, turbidity, eutrophication and coastal hypoxia). Mining can produce even greater
impacts, including pollution by toxic metals exposed in the process. Modern agricultural practices, which
include intensive inputs of nitrogen and phosphorus fertilizers and the concentration of livestock and their
manures within small areas, have substantially increased the pollution of surface water by runoff and erosion
and the pollution of groundwater by leaching of excess nitrogen (as nitrate). Other agricultural chemicals,
including herbicides and pesticides are also released to ground and surface waters by agriculture and in some
cases remain as contaminants in the soil. The burning of vegetation biomass to clear agricultural fields (crop
residues, weeds) remains a potent contributor to regional air pollution wherever it occurs, and has now been
banned in many areas. (Foley et al. 2005)
d) Other impacts
Other environmental impacts of LULCC include the destruction of stratospheric ozone by nitrous oxide
release from agricultural land and altered regional and local hydrology (dam construction, wetland drainage,
irrigation projects, increased impervious surfaces in urban areas). Perhaps the most important issue for most of
Earth’s human population is the long-term threat to future production of food and other essentials by the
transformation of productive land to nonproductive uses, such as the conversion of agricultural land to
residential use and the degradation of rangeland by overgrazing.
2.4.3: Methods of land-change science
The methods of land-change science include remote sensing and geospatial analysis and modeling, together
with the interdisciplinary assortment of natural and social scientific methods needed to investigate the causes
and consequences of LULCC across a range of spatial and temporal scales. (GLP, 2005)
a) Remote sensing
Remote sensing is an essential tool of land-change science because it facilitates observations across larger
extents of Earth’s surface than is possible by ground-based observations. This is accomplished by use of
cameras, multi-spectral scanners, RADAR and LiDAR sensors mounted on air- and space-borne platforms,
yielding aerial photographs, satellite imagery, RADAR and LiDAR datasets. Data available from remote
sensing vary from the very high-resolution datasets produced irregularly over extents no larger than a single
state or province (by aerial photography, imaging, LiDAR, and by high resolution satellite sensors such as
IKONOS and Quickbird), to regional datasets produced at regular intervals from satellites (e.g., Landsat,
SPOT), to the lower-resolution (> 250 m) datasets now produced across the entire Earth on a daily basis (e.g.,
MODIS). (GLP, 2005)

16
b) Geospatial analysis
Maps and measurements of land cover can be derived directly from remotely sensed data by a variety of
analytical procedures, including statistical methods and human interpretation. Maps of land use and land cover
(LULC) are produced from remotely sensed data by inferring land use from land cover (e.g., urban = barren,
agriculture = herbaceous vegetation). Conventional LULC maps are categorical, dividing land into categories
of land use and land cover (thematic mapping; land classification), while recent techniques allow the mapping
of LULC or other properties of land as continuous variables or as fractional cover of the land by different
LULC categories, such as tree canopy, herbaceous vegetation, and barren (continuous fields mapping). Both
types of LULC datasets may be compared between time periods using geographic information systems (GIS)
to map and measure LULCC at local, regional, and global scales. (GLP, 2005)
2.4.4 Driving forces
Assessing the driving forces behind LULCC is necessary if past patterns are to be explained and used in
forecasting future patterns. Driving forces on LULCC can include almost any factor that influences human
activity, including local culture (food preference, etc.), economics (demand for specific products, financial
incentives), environmental conditions (soil quality, terrain, moisture availability), land policy & development
programs (agricultural programs, road building, zoning), and feedbacks between these factors, including past
human activity on the land (land degradation, irrigation and roads). Investigation of these drivers of LULCC
requires a full range of methods from the natural and social sciences, including climatology, soil science,
ecology, environmental science, hydrology, geography, information systems, computer science, anthropology,
sociology and policy science. (Meyer et al. 1994)
2.4.5 Sustainable land management
Sustainable land management is a central challenge in the sustainable management of earth systems and
resources. On the one hand, land management must ensure a growing supply of food and other resources to
human populations, which are expected to grow for decades to come. On the other hand, management of land
to procure these resources is linked with potentially negative consequences in the form of climate change,
biodiversity loss and pollution. Moreover, local alteration of land use and land cover can have global
consequences, requiring local and regional solutions to global problems and the cooperation of the world’s
policymakers, land managers, and other stakeholders in land management at local, regional and global scales.
At the global scale, the Kyoto Protocol offers an example of international efforts to reduce climate change
caused by greenhouse gas emissions from land. It offers incentives, such as a trade in carbon credits, that
17
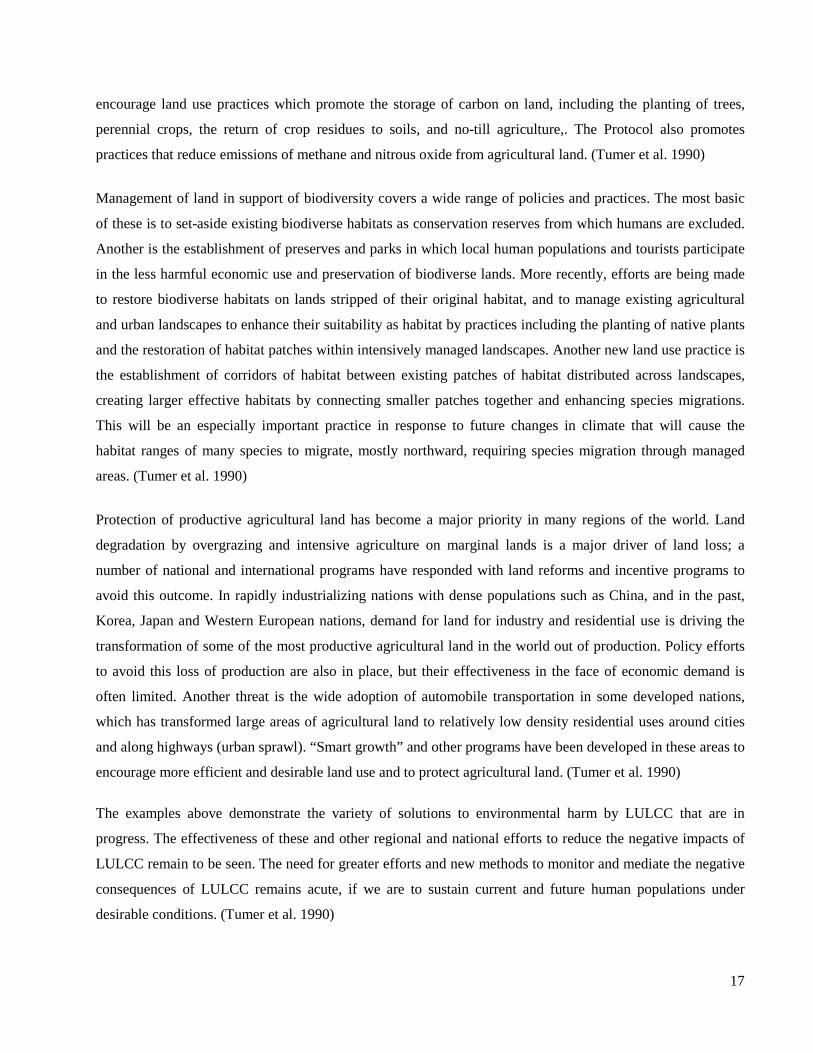
encourage land use practices which promote the storage of carbon on land, including the planting of trees,
perennial crops, the return of crop residues to soils, and no-till agriculture,. The Protocol also promotes
practices that reduce emissions of methane and nitrous oxide from agricultural land. (Tumer et al. 1990)
Management of land in support of biodiversity covers a wide range of policies and practices. The most basic
of these is to set-aside existing biodiverse habitats as conservation reserves from which humans are excluded.
Another is the establishment of preserves and parks in which local human populations and tourists participate
in the less harmful economic use and preservation of biodiverse lands. More recently, efforts are being made
to restore biodiverse habitats on lands stripped of their original habitat, and to manage existing agricultural
and urban landscapes to enhance their suitability as habitat by practices including the planting of native plants
and the restoration of habitat patches within intensively managed landscapes. Another new land use practice is
the establishment of corridors of habitat between existing patches of habitat distributed across landscapes,
creating larger effective habitats by connecting smaller patches together and enhancing species migrations.
This will be an especially important practice in response to future changes in climate that will cause the
habitat ranges of many species to migrate, mostly northward, requiring species migration through managed
areas. (Tumer et al. 1990)
Protection of productive agricultural land has become a major priority in many regions of the world. Land
degradation by overgrazing and intensive agriculture on marginal lands is a major driver of land loss; a
number of national and international programs have responded with land reforms and incentive programs to
avoid this outcome. In rapidly industrializing nations with dense populations such as China, and in the past,
Korea, Japan and Western European nations, demand for land for industry and residential use is driving the
transformation of some of the most productive agricultural land in the world out of production. Policy efforts
to avoid this loss of production are also in place, but their effectiveness in the face of economic demand is
often limited. Another threat is the wide adoption of automobile transportation in some developed nations,
which has transformed large areas of agricultural land to relatively low density residential uses around cities
and along highways (urban sprawl). “Smart growth” and other programs have been developed in these areas to
encourage more efficient and desirable land use and to protect agricultural land. (Tumer et al. 1990)
The examples above demonstrate the variety of solutions to environmental harm by LULCC that are in
progress. The effectiveness of these and other regional and national efforts to reduce the negative impacts of
LULCC remain to be seen. The need for greater efforts and new methods to monitor and mediate the negative
consequences of LULCC remains acute, if we are to sustain current and future human populations under
desirable conditions. (Tumer et al. 1990)

18
2.5 Flooding in the Nzoia basin
2.5.1 Introduction
A flood is an overflow or accumulation of an expanse of water that submerges land. Floods occur in rivers,
when the strength of the river is so high that it flows out of the river channel, particularly at bends or meanders
and causes damage to homes and businesses along such rivers. While flood damage can be virtually
eliminated by moving away from rivers and other bodies of water, since time out of mind, humans continue to
inhabit areas threatened by flood damage is evidence that the perceived value of living near the water exceeds
the cost of repeated periodic flooding. (Wikipedia, 2010a)
2.5.2 Factors Contributing to Increasing Flood Disasters
Increasing flood disasters in river Nzoia basin are a complex construct of the increasing vulnerability of the
population occupying the flood prone areas, and the increasing flooding instances. Floods in the river basin,
like in most cases worldwide are caused by heavy rainfall interacting with hill slopes. These hill slopes
without vegetative covers give the floods the characteristics of flash floods in the vicinity of foothills and
produce large amount of sediment. Other anthropogenic factors such as increased economic use of flood
plains combined with improved reporting of the impacts of floods have also given an impression of increased
flood disasters. (APFM, 2004) In the river Basin the factors contributing to increased flood disasters could be
summarized as follows:
1. Population pressure: Intensive economic use of the flood plains for agriculture and livestock farming.
2. Deteriorating infrastructure: Lack of systematic and routine maintenance of flood dykes, makes them
susceptible to breaches even during floods of lower magnitudes than the design flood.
3. Environmental degradation of watersheds caused by uncontrolled and unregulated human activity,
especially large-scale deforestation and cultivation practices, resulting in:
� Increase in flood peaks.
� Reduced flood carrying capacity of the rivers due to excessive siltation of their bed.
� Shifting of river courses causing erosion of dykes.
2.5.3 Impact of Floods in the River Basin
a) Loss of life
A unique feature of floods in the Nzoia river Basin is that most of the runoff is generated in the upper
catchments which receive much higher rainfall than the plains in down stream reaches. As a result, population
living in the plains is often taken unawares. This causes considerable loss of human lives and livestock.

19
b) Health and developmental impact
In many low lying areas around the mouths of the rivers and natural swamps the inundation lasts for weeks
leading to total loss of crops. The worst affected are the poor who inhabit the flood plains and riverine lands to
eke out a meager living from agriculture, livestock farming and fisheries. Because of poverty, lack of
education and poor rural infrastructure, they are the most vulnerable to floods and post-flood consequences.
The floods severely limit and hamper the developmental process, further increasing the vulnerability of the
rural society and thereby perpetuating and increasing the incidence of poverty. Stagnant floodwater also
causes vector borne diseases, which result in high incidence of morbidity with consequent loss of alternative
employment opportunities. People from the inundated areas move to makeshift relief camps where they cluster
together. Such makeshift homes soon become slums creating social problems and unhygienic conditions
which are conducive for the spread of contagious diseases and sexually transmitted diseases. Often women
and young girls are the worst sufferers. (APFM, 2004)
c) Environmental impact
Pollution of drinking water sources like wells and tube wells, bank erosion, silting of river beds and
consequent lateral shifting of river channels, displacement of wildlife and cutting down of trees for firewood
around relief camps are some of the adverse environmental impacts of floods in the Nzoia River Basin.
d) Financial impact
As per the assessment made after recent floods, in the last 20 Km reach of the Nzoia River the annual damage
is in the order of US$4 800,000. Every year around 1 million US$ is spent on relief and rehabilitation of about
12,000 displaced people. (APFM, 2004)
2.5.4 Flood Control and Management in river basins
In many countries, rivers prone to floods are often carefully managed. Rivers are often managed or controlled
to make them more useful, or less disruptive, to human activity. Some methods of flood control have been
practiced since ancient times. These methods include planting vegetation to retain extra water, terracing
hillsides to slow flow downhill, and the construction of flood ways (man-made channels to divert floodwater).
(Wikipedia, 2010b)
Defenses such as levees, bunds, reservoirs, and weirs or dams are also used to prevent rivers from bursting
their banks. When these defenses fail, emergency measures such as sandbags or portable inflatable tubes are
used. A dike is another method of flood protection. A dike lowers the risk of having floods compared to other
methods. It can help prevent damage; however it is better to combine dikes with other flood control methods
to reduce the risk of a collapsed dike. (Wikipedia, 2010a)

20
River management is a continuous activity as rivers tend to 'undo' the modifications made by people. Dredged
channels silt up, sluice mechanisms deteriorate with age, levees and dams may suffer seepage or catastrophic
failure. The benefits sought through managing rivers may often be offset by the social and economic costs of
mitigating the bad effects of such management. As an example, in parts of the developed world, rivers have
been confined within channels to free up flat flood-plain land for development. Floods can inundate such
development at high financial cost and often with loss of life. Rivers are increasingly managed for habitat
conservation, as they are critical for many aquatic and riparian plants, resident and migratory fishes,
waterfowl, birds of prey, migrating birds, and many mammals. (Wikipedia, 2010b)
2.5.5 Current Floodplain Management in the basin
Flood plain management in Budalangi is target at alleviating the social and economic costs of flooding in the
plain. Existing flood dykes (levees) in the floodplain which has provided flood protection have now exceeded
their design life and are failing with increasing frequency. Sedimentation in this reach of the river has reduced
the discharge capacity of the river channel between the levees, such that the risk of overtopping has increased.
Additionally, erosion of side slopes has reduced levee stability and has increased the risk of breaching and
failure. The length of the levied reach of the river is approximately 17km on each side, while the length of the
river channel between the levies is about 40km. (WKCDD&FM, 2009)
The current flood protection structures are the dykes which were constructed in early 1980s. The dykes have
since outlived their design period and are subjected to regular breaching during rain seasons. Increased
breaching of the dykes has meant that communities within the floodplain increasingly suffer the effects of
flooding, resulting in damage to dwellings, livestock and crops, and risk to human life. Over 70,000 people,
their villages, crops and livestock are potentially exposed to these risks. (WKCDD&FM, 2009)

21
CHAPTER THREE
3.0 RESEARCH METHODOLOGY
The research methodology has been split into two phases. The first phase is the methods used for analysis and
the other phase is the collection of data.
3.1 Research Approach
The study deals with point rainfall and runoff data, and therefore uses arithmetic mean method to obtain an
estimate of the mean areal rainfall in the area from the rainfall stations. Then the point data was summed up in
to monthly totals of the areal rainfall and runoff.
3.1.1 Determination of Seasonal patterns
From the literature review of the area, the local relief and influences of the Lake Victoria modify the regular
weather pattern (Nyadawa et al. 2007) and therefore the research determines the mean monthly rainfall over
the entire period of study to obtain the seasonal patterns of rainfall in the area of study. The monthly rainfall
and runoff data for the whole period of study i.e. 1986-2000 (15 years) was summed up and then divided by
the total number of years for the period of study to give the average monthly value e.g. January data for all
years was summed up and divided by 15 to give the average January data
3.1.2 Determination of Runoff factor
. The runoff data which was initially in m3/s was first converted to depth (mm) using the following formula;
Runoff depth � � �/�� …………………………………………………………….. (i)
Where; Q is runoff in m3/d and A is area in m2
It is commonly assumed that the quantity (volume) of runoff is a proportion (percentage) of the rainfall depth.
The runoff factor were determined by dividing the runoff with the corresponding rainfall both expressed as
depth over catchment area (mm) as show by be formula below:
K = R/P ………………………………………………………………………..… (ii)
where; K is runoff factor, R is runoff depth (mm) and P is rainfall (mm)

22
3.1.3 Determination of Seasonal runoff factor
Seasonal runoff factor is defined as the total runoff observed in a season divided by the total rainfall in the
same season. The seasonal runoff factor differs from the runoff factor derived from individual storms as it
takes into account also those rainfall events which did not produce any runoff.
The rainfall and runoff data were arranged into seasonal values i.e.
• Short rain season – August to October.
• Long rain season – March to May.
Then the seasonal runoff factor, K, was determined as shown below;
K = SR/SP ………………………………………………………………………... (iii)
Where; SR is seasonal runoff depth and SP is seasonal rainfall
3.1.4 Evaluation of Seasonal runoff factor trends
The seasonal runoff factor trends were obtained by comparing different runoff factors produced by almost
same amount of rainfall over the period of study. .
3.1.5 Correlating catchment runoff with published images.
The published land use and land cover changes used in the study were already classified and expressed in km2
(Nyadawa et al. 2007) and also as a percentage change (Faith, 2009) from their sources. The percentage
change of the runoff factor was compared with the change in land cover over the same period of study.

23
3.2 Data Collection
The study only dealt with secondary data of rainfall, runoff and land use/ land cover change.
3.2.1 Rainfall and runoff data
The rainfall and runoff data was obtained from the Kenya Meteorological Department and the Ministry of
Irrigation and Water Resources. The study uses four rainfall stations (Table 3.1) and one stream flow station-
1DD02 (Fig. 3.1) covering an area of 8417km2. The stream flow station was chosen in the basis that it
provided tangible data over the study period compared to the other stream flow stations in the area and
according to World Meteorological Organization (WMO) standard, it is not recommended to fill more than
10% of missing data. The rainfall stations were chosen on the basis of their distance from the stream flow
station.
Table 3.1: Rainfall and stream flow stations used in this study
Station No. Station ID Station name Long.
(deg.)
Lat.
(deg.)
1 8934016 Lugari 34.900 0.667
2 8934096 Kakamega 34.767 0.283
3 8934098 Kimilili 34.683 0.867
4 8934119 Webuye 34.767 0.617
5 1DD02 34.807 0.589

24
Source: WKCDD&FM, 2009
Figure 3.1: Distribution of rainfall and discharge stations used in this study
3.2.2 Land use/Land cover data
Land use/land cover data set is useful for the development of information on natural resources required for
uses in early warning, food security, agriculture, disaster prevention and management, forest and rangeland
monitoring, environmental planning, watershed catchments management, biodiversity studies, climate change
modeling, etc. The land cover published changes data were obtained from Faith (2009) and Nyadawa et al
(2007). Land use classification had been performed using land sat TM images (30 m resolution) for the years
1986 and 2000. The land use/land cover change was used in this study to provide information on the land use
and land cover change between 1986 and 2000 of Nzoia Basin.
1DD02

Source: Faith, 2009
Figure 3.2: Classified images of Land sat (a) 1986
(a)
: Classified images of Land sat (a) 1986 and (b) 2000
(b)
25

26
CHAPTER FOUR
4.0 RESULTS AND DISCUSSION
4.1 RESULTS
Table 4.1: Monthly rainfall and runoff data
Mean monthly rainfall and mean monthly runoff
Month Mean monthly rainfall (mm)
Mean monthly runoff (m3/s)
Mean monthly runoff depth (mm)
January 59.4 341.1 3.5
February 79.7 210.4 2.2
March 142.7 369.7 3.8
April 229.5 596.6 7.2
May 240.8 1368.4 14.0
June 142.5 1221.5 12.5
July 152.5 1532.5 15.7
August 206.2 2082.9 23.1
September 155.8 1760.2 18.1
October 164.8 1395.1 14.3
November 128.1 932.2 9.6
December 50.6 487.6 5.0

27
Figure 4.1: Mean monthly rainfall and runoff trends
Figure 4.2: Mean monthly runoff trends
0
50
100
150
200
250
300
Rai
nfal
l (m
m)
Months
Mean monthly rainfall and runoff patterns.
Mean monthly rainfall(mm)
Mean monthly runoff depth (mm)
0
5
10
15
20
25
runo
ff (m
m)
Months
Mean monthly runoff trends
Mean monthly runoff depth (mm)
2 per. Mov. Avg. (Mean monthly runoff depth (mm))

28
Table 4.2: Long rain season rainfall and runoff yearly totals
Year Rainfall (mm) Runoff (m3/s) Runoff depth(mm) Runoff factor (%)
1986 550.5 1804.3 18.5 3.4
1987 640.9 1580.9 16.2 2.5
1988 691.7* 3486.1 35.9 5.7
1989 627.7 3352.3 34.4 5.5
1990 601.8 5057.7 51.9 8.7
1991 607.4 3663.1 37.6 6.2
1992 423.3 1733.8 17.8 4.2
1993 495.1 3122.9 32.1 6.5
1994 674.7* 2672.0 27.4 4.1
1995 619.3 1659.7 17.0 2.8
1996 509.1 1085.0 11.1 2.2
1997 471.6
1998 508.3
1999 575.2
2000 416.3
* shows values indicating influence of high long rain season on the short rain season runoff
Table 4.3: Short rain season rainfall and runoff yearly totals
Year Rainfall (mm) Runoff (m3/s) Runoff depth(mm) Runoff factor (%)
1986 428.9 3058.1 31.4 7.3
1987 433.2 1759.3 18.1 4.2
1988 592.0 13538.2 139.0* 23.5
1989 584.0 5744.7 59.0 10.1
1990 331.5 4830.0 49.6 15.0
1991 441.0 7966.6 69.7 15.7
1992 423.9 9855.9 70.7 16.7
1993 363.6 3555.6 36.5 10.0
1994 431.6 9366.3 96.1* 22.3
1995 473.9 5198.1 53.4 11.3
1996 440.1
1997 248.8
1998 417.7
1999 331.5
2000 380.3 * shows values indicating influence of high long rain season on the short rain season runoff

Figure 4.3: Seasonal rainfall
Figure 4.4: Moving averages for the seasonal rainfall
0
100
200
300
400
500
600
700
800
Rai
nfal
l (m
m)
Seasonal rainfall patterns
0
100
200
300
400
500
600
700
Rai
nfal
l (m
m)
Rainfall moving average
trends over the years
: Moving averages for the seasonal rainfall
Years
Seasonal rainfall patterns
Years
Rainfall moving average
29
Long season
Short season
long rains (mm)
short rains (mm)
30
Figure 4.5: Seasonal runoff trends
Figure 4.6: Moving averages for the seasonal Runoff trends
0
20
40
60
80
100
120
140
160
1986
1987
1988
1989
1990
1991
1992
1993
1994
1995
1996
Run
off d
epth
(m
m)
Years
Seasonal runoff trends
RUNOFF(mm)(long)
RUNOFF (mm)(short)
0
20
40
60
80
100
120
1986 1987 1988 1989 1990 1991 1992 1993 1994 1995 1996
Run
off
dept
h (m
m)
Years
Runoff moving average
Runoff (mm)-Long
Runoff(mm)- short
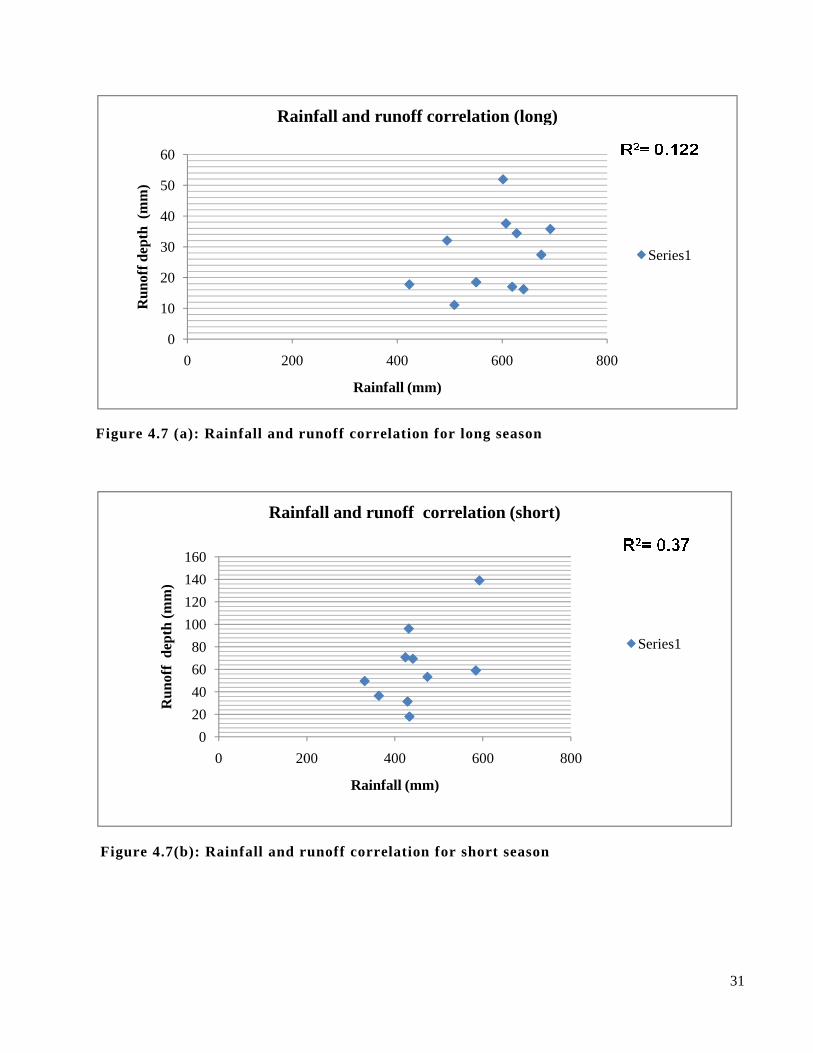
Figure 4.7 (a): Rainfall and runoff correlation
Figure 4.7(b): Rainfall and runoff
0
10
20
30
40
50
60
0 200
Run
off d
epth
(m
m)
Rainfall and runoff correlation (long)
0
20
40
60
80
100
120
140
160
0 200
Run
off
dept
h (m
m)
Rainfall and runoff correlation (short)
: Rainfall and runoff correlation for long season
: Rainfall and runoff correlation for short season
400 600 800
Rainfall (mm)
Rainfall and runoff correlation (long)
200 400 600 800
Rainfall (mm)
Rainfall and runoff correlation (short)
31
800
Series1
Series1

32
Figure 4.8: Seasonal runoff factor trends
Table 4.4 Results of image classification (Source: Nyadawa et al. 2007)
Value
Land cover type ( USGS description)
USGS Lu/lc - Code
Pixel count Area (km2) Change in area
(km2) 1986 2000 1986 2000
0 Unclassified 0 16341382 2213026 13273 17975 Ignore
1 Evergreen deciduous broadleaf forest
421 3713810 1779710 3016 1445 -1571
2 Water bodies 500 80399 146103 65 118 ponding
3 Shrub land 321 7332518 6661084 5956 5410 -546
4 Cropland/woodland mosaic 290 4597251 7137715 3734 5798 +2064
Note: Minus sign in change in area column means decrease from 1986 area and plus is vice versa.
0
5
10
15
20
25
30
35
1986
1987
1988
1989
1990
1991
1992
1993
1994
1995
1996
Run
off
fac
tor
(%)
Years
Seasonal runoff factor trends
runoff factor (%)-Short
Runoff factor(%)-long

33
Table 4.5: Land cover evolution (in %) (Source: Faith, 2009)
Land use 1986 2000
Agriculture 46.6 64.3
Closed herbaceous vegetation 15.6 0.1
Forest 9.2 7.0
Open trees and grassland 6.7 11.4
Shrub land 3.5 1.3
Trees interspersed with shrubs 18.3 13.9
Water <0.01 <0.01
Wetland vegetation 0.1 2.0
Figure 4.9(a): Land cover evolution (in %) for 1986 based on Table 4.5
Agriculture47%
Closed herbaceous vegetation
16%
Forest9%
Open trees and grassland
7%
Shrub land4%
Trees interspersed with shrubs
18%
Water0%
Wetland vegetation0%
1986
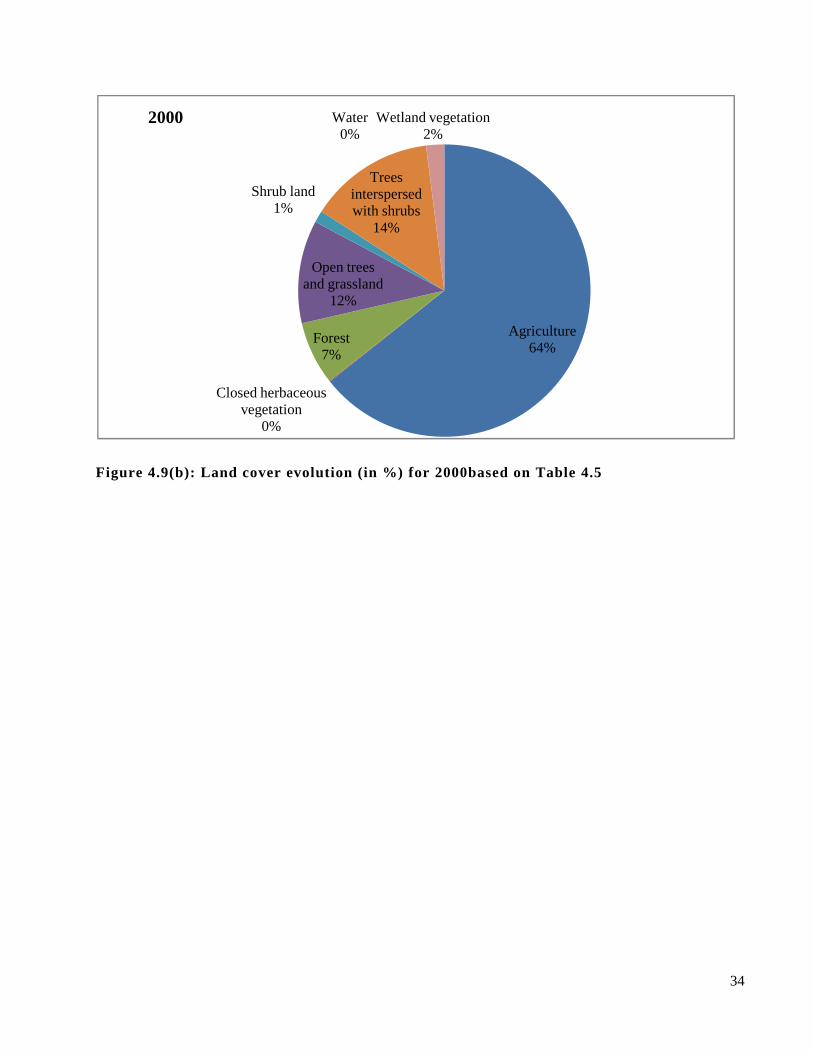
34
Figure 4.9(b): Land cover evolution (in %) for 2000based on Table 4.5
Agriculture64%
Closed herbaceous vegetation
0%
Forest7%
Open trees and grassland
12%
Shrub land1%
Trees interspersed with shrubs
14%
Water0%
Wetland vegetation2%
2000

35
4.2 DISCUSSION
4.2.1 Mean monthly rainfall.
The climate is characterized by a regime of two rainy seasons per year occurring generally in March to May
and in August to October (Fig.4.1).The months of April/May have the highest rainfall followed by August and
then October. There is no significant relationship between rainfall and runoff although the months of May and
August have the highest values of both rainfall and runoff. This may be consistent with the lack of a strong
relationship between rainfall and runoff for the months of May and October due to other factors such as
antecedent soil moisture conditions and the intensity of rainfall, which is not directly taken into account in the
study. Largely, rainfall in this region is dependent on the Inter Tropical Convergence Zone (ITCZ), which lags
behind the overhead sun. The structure of ITCZ over the East Africa region consists of the zonal and
meriodional arms. The double passage of the zonal arm is associated with two main rainfall seasons namely
the long and short rainfall season during which a large portion of the annual rainfall total is received. The
meriodional arm on the other hand fluctuates from east to west and vice versa, with the easternmost extent
noted in July and August. The rainfall received over the western highlands of Kenya is associated with this
arm (Okoola, 1996). The good relationship obtained between rainfall and runoff in the month of August (as
compared to April/May and October) can be attributed to the rainfall associated with the meridional arm of the
ITCZ, which may exhibit different characteristics of rainfall from those of the zonal arm, such as
spatial/temporal distribution and intensity.
4.2.2 Seasonal rainfall and runoff trends.
Results of season to season analysis, Figure 4.3 and Figure 4.4, show that years with high rainfall in the long
season, have a high runoff in the short season. For example, in the year 1988 and 1994 when there was a high
runoff factor in the short season, the area had experienced high rainfall in the long season (see values with
asterisk in Tables 4.2 and 4.3). Rainfall in both seasons (Fig 4.4) shows a general decline over the years while
runoff in the two seasons (Fig 4.6) shows a general increase of the runoff for the short rain season over the
years, but the one for long season is in a decreasing trend. The runoff trends can be attributed to maybe the
various land use and land cover changes e.g. planting and harvesting which occurs in the long and short rain
season respectively, occurring in the basin although it is not very clear. The standard deviation is for the
seasonal rainfall 91.8 mm and 90.4 mm for the long and short rain seasons respectively. The coefficient of
variation for the seasonal rainfall is 17.5% and 23.0% for the long and short rain season respectively which is
not high. Although the rainfall and runoff correlation of both seasons is below 0.5, there is a stronger
correlation between rainfall and runoff in the short rain season i.e. R2=0.307 (Fig 4.7 a) compared to that of
rainfall and runoff in the long rain season i.e. R2=0.122 (Fig 4.7 b). This can be attributed to the fact that there

36
is no distinct dry period between the two rain seasons i.e. months (June-July), hence there is still a lot of
moisture in the soil (antecedent moisture) leading to a high runoff in the short rainfall season.
4.2.3 Seasonal runoff factor trends
From Table 4.2, the rainfall value in 1987 was 640.9 mm and produced a runoff of 16.2 mm and hence runoff
factor of 2.5% while almost same amount of rainfall in 1994, 674.7 mm produced a runoff of 27.4 mm and a
runoff factor of 4.1% showing there has been a slight increase in the runoff factor over years for the long rain
season. For the short rainfall, Table 4.3, the rainfall for 1986 was 428.9 mm and translated to a runoff factor of
7.3% while in 1994 an almost same amount of rainfall i.e. 431.6 mm produced a runoff factor of 22.3%
clearly showing there has been a significant change of runoff factor over the years in the short rain season.
4.2.4 Published land cover/ land use changes
Though the classifications of images from the two sources are not exactly the same, they all agree that the
forest cover has decreased markedly e.g. from 9.2 to 7 % (Table 4.5) and from 3016 km2 to1445 km2. This
could be attributed to the cutting of trees in the forests for various uses such as firewood, timber and clearing
for agricultural purposes. In contrast, the agricultural area is seen to have increased over the years from 46.6%
in 1986 to 64.3% in 2000 (Table 4.5) or from 3734 km2 to 5798 km2. Over the entire period, forest and
agricultural lands have consistently shown a decrease and an increase in area, respectively. Generally, areas
covered with trees interspersed with shrubs; forest and herbaceous vegetation have been observed to decrease
while agriculture and areas with open trees and grasslands have increased.
4.2.5 Correlating catchment runoff response with the land use and land cover changes in the basin
The land cover results have shown that overall, between 1986 and 2000, the forest cover has decreased while
agricultural land has increased considerably and thus the increasing trend of the seasonal runoff factor can
thus be attributed to the replacement of forest cover with agricultural land. This could explain part of the claim
that land degradation has caused frequent flooding in the lower catchment as reduced forest cover and an
increase in agricultural lands have generally been known to generate high surface runoff.
37
CHAPTER FIVE
5.0 CONCLUSIONS AND RECOMMENDATIONS
5.1 Conclusions
The evaluation of Rainfall-Runoff response characteristics of Nzoia basin has revealed important results. The
objectives which were set for this study were generally achieved to average extent taking into account the
constraints of missing data sets. The following conclusions have been arrived at after the analysis of rainfall
and runoff data obtained:
• Land use / land cover results have revealed that the direction of change is from forest to agricultural
land. It is apparent that the forest cover has decreased markedly while in contrast, the agricultural
area is seen to have increased over the years. This could be attributed to the cutting of trees in the
forests for various uses such as firewood, timber and clearing for agricultural purposes.
• The change of land-use/ land cover has altered the rainfall-runoff relationships especially in the short
rain seasons where there is an increasing trend of the runoff factor.
5.2 Recommendations
• In order to reduce flooding more attention should be paid to land-use pattern and some control
measures should be built i.e. afforestation should be promoted in the basin as one long term measure
of managing floods in the basin.
• Although the stream flow shows an increasing tendency in the short rain season and decreasing
tendency in the long rain season, there is a need to study a longer period than that considered in this
study, for better indications of trend.
• In addition to rainfall depth, the corresponding rainstorm intensity, the rainstorm duration and
antecedent soil moisture should be measured to obtain a much better relationship.

38
REFERENCES
Acland, J.D. 1977. East African Crops. FAO, Longman Group Limited ISBN 0582603013
Associated Program on Flood Management (APFM) (2004a). Strategy for flood management for Lake
Victoria basin, Kenya. Ministry of Water Management and Development.
Ben Asher, J. (1988). A review of water harvesting in Israel.
Chow, ven Te, Maidment, David R. and May (1988). Applied Hydrology. New York. McGraw hill.
De Fries, R. S., G. P. Asner, and R. A. Houghton, editors. 2004. Ecosystems and Land Use Change. American Geophysical Union, Washington, DC.
Faith Wairimu Githui (2009). Assessing the impacts of environmental change on the hydrology of the Nzoia catchment, in the Lake Victoria Basin
FAO (1991): A manual for the Design and Construction of Water Harvesting Schemes for Plant Production. Conservation Agronomist Centre for Development Co-operation Services, Free University, Amsterdam.
Finkel, M. (1987). Water harvesting Manual, FAO, Rome.
Fischer G.W., M.M. Shah, A.H. Kassam and H.T. van Velthuizen. 1991. Crop Productivity Assessment: Results at District Level. Technical Annex 8. Agroecological Land Resources Assessment for Agricultural Development Planning. A Case Study of Kenya. World Soil Resources Report 71/8. FAO/IIASA, Rome.
Foley, J. A., R. DeFries, G. P. Asner, C. Barford, G. Bonan, S. R. Carpenter, F. S. Chapin, M. T. Coe, G. C. Daily, H. K. Gibbs, J. H. Helkowski, T. Holloway, E. A. Howard, C. J. Kucharik, C. Monfreda, J. A. Patz, I. C. Prentice, N. Ramankutty, and P. K. Snyder. 2005. Global consequences of land use. Science 309:570-574.
Global Land Project. 2005. Science Plan and Implementation Strategy. IGBP Report No. 53/IHDP Report No. 19, IGBP Secretariat, Stockholm.
Guleid Artan, Kwabena Asante, James Verdin and James L. Kiesler, Jr (2000). Use and Description of the Famine Early Warning System Flood Model. U.S Geological Survey
Gupta (1989). Merged rainfall fields for continuous simulation modeling.
Kassam A.H., van Velthuizen H.T., Mitchell A.J.B., Fischer G.W. and Shah M.M. 1991. Soil Erosion and Productivity. Technical Annex 2. Agro-ecological Land Resources Assessment for Agricultural Development Planning. A Case Study of Kenya. World Soil Resources Report 71/2. FAO/IIASA, Rome.
Linsley R.K., M.A. Kohler and J.L.H. Paulhus (1992). Hydrology for Engineers.
Linsley RK, Kohler MA, Paulhus JLH, Wallace JS, 1958. Hydrology for engineers. McGraw Hill, New York
McCuen H.R (1989). Hydrologic Analysis and Design, New Jersey:
39
Meyer, W. B., and B. L. Turner. 1994. Changes in Land Use and Land Cover: A Global Perspective. Cambridge University Press, Cambridge England; New York, NY, USA.
MWRMD. 2004. Ministry of Water Resources Management and Development. Strategy for Flood Management for Lake Victoria Basin, Kenya.
National Resource Institute. 2006. Kenya travel guide.Kenya weather
Nyadawa, M.O., Karanja, F. and Njoroge, T (2007): Application of GIS-based spatially distributed hydrologic model in Integrated Watershed Management: A case study of Nzoia basin, Kenya.
Okoola, R.E. 1996: “Space – Time characteristics of the ITCZ over equatorial East Africa during anomalous rainfall years”. PhD. Thesis. Department of Meteorology, University of Nairobi, Kenya.
Onyando J.O., T.C. Sharma (1995). Simulation of direct runoff volumes and peak rates for rural catchment in Kenya.
Pegram (1993). Spatial characteristics of thunderstorm rainfall fields and their relation to runoff.
Pegram and Zucchini. (1992). Group-based estimation of missing hydrological data.
Ponce (1989). Engineering Hydrology: Principles and Practices
Ritter (2006). Validation of soil moisture.
Ruddiman, W. F. 2003. The anthropogenic greenhouse era began thousands of years ago. Climatic Change 61:261-293.
Shanan, L. and Tadmor, N.H. (1979). Micro-catchment system for and zone development.
Sharma, K.D. Pareek, O.P. and Singh, H.P. (1986). Runoff behavior of water harvesting micro catchments.
Turner II, B. L., W. C. Clark, R. W. Kates, J. F. Richards, J. T. Mathews, and W. B. Meyer. 1990. The Earth as Transformed by Human Action: Global and Regional Changes in the Biosphere Over the Past 300 Years. Cambridge University Press with Clark University, Cambridge; New York.
Van loon.A, Droogers P. (2006). Water evaluation and planning system, Kitui-Kenya.
Western Kenya Community Driven Development & Flood Management. 2009. Flood Management Component (WKCDD&FM)
Wikipedia, a: http://www.wikipedia.org/wiki/floods (last accessed March 19, 2010)
Wikipedia, b: http://www.wikipedia.org/wiki/River (last accessed February 13, 2010)
WRMA (2006): Nzoia River Basin Management Initiative (NRBMI), 2006-2011, Civil Society, learning institutions and communities.

40
APPENDIX
Appendix A: Figures
Figure 1: Rainfall monthly variation patterns between two periods
Figure 2: Annual rainfall and annual runoff trends
0
50
100
150
200
250
Rai
nfal
l (m
m)
Months
Rainfall variation patterns
1986-1992
1993-2000
0
500
1000
1500
2000
Rai
nfal
l and
run
off d
epth
(mm
)
Years
Annual rainfall and annual runoff patterns
ANNUAL RAINFALL(mm)
ANNUAL RUNOFF (mm)
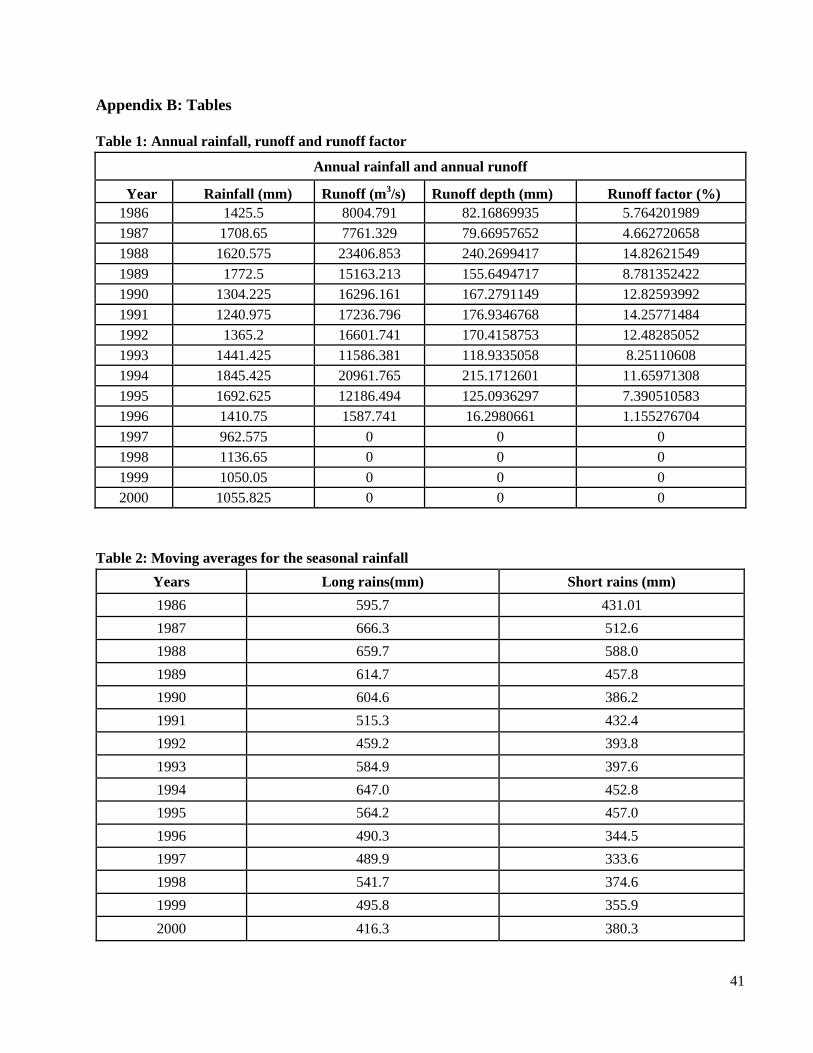
41
Appendix B: Tables
Table 1: Annual rainfall, runoff and runoff factor
Annual rainfall and annual runoff
Year Rainfall (mm) Runoff (m3/s) Runoff depth (mm) Runoff factor (%) 1986 1425.5 8004.791 82.16869935 5.764201989 1987 1708.65 7761.329 79.66957652 4.662720658 1988 1620.575 23406.853 240.2699417 14.82621549 1989 1772.5 15163.213 155.6494717 8.781352422 1990 1304.225 16296.161 167.2791149 12.82593992 1991 1240.975 17236.796 176.9346768 14.25771484 1992 1365.2 16601.741 170.4158753 12.48285052 1993 1441.425 11586.381 118.9335058 8.25110608 1994 1845.425 20961.765 215.1712601 11.65971308 1995 1692.625 12186.494 125.0936297 7.390510583 1996 1410.75 1587.741 16.2980661 1.155276704 1997 962.575 0 0 0 1998 1136.65 0 0 0 1999 1050.05 0 0 0 2000 1055.825 0 0 0
Table 2: Moving averages for the seasonal rainfall
Years Long rains(mm) Short rains (mm)
1986 595.7 431.01
1987 666.3 512.6
1988 659.7 588.0
1989 614.7 457.8
1990 604.6 386.2
1991 515.3 432.4
1992 459.2 393.8
1993 584.9 397.6
1994 647.0 452.8
1995 564.2 457.0
1996 490.3 344.5
1997 489.9 333.6
1998 541.7 374.6
1999 495.8 355.9
2000 416.3 380.3

42
Table 3: Moving averages for the seasonal runoff
Years Runoff depth (mm)- long season Runoff depth(mm)- short season 1986 17.4 24.7
1987 26.0 78.5
1988 35.1 99.0
1989 43.2 54.3
1990 44.8 59.5
1991 27.7 70.1
1992 24.9 53.6
1993 29.7 66.3
1994 22.2 74.8
1995 14.1 53.4
1996 11.1
Table 4: Seasonal standard deviation and coefficient of variation
Years Long season x'-x (x'-x)2 Short season x'-x (x'-x)2
1986 550.5 -26.3577778 694.732451 428.85 -35.9766667 1294.32055
1987 640.85 -116.707778 13620.7054 433.175 -40.3016667 1624.22434
1988 691.733333 -167.591111 28086.7805 592.025 -199.151667 39661.3863
1989 627.7 -103.557778 10724.2133 583.975 -191.101667 36519.847
1990 601.758333 -77.6161111 6024.2607 331.525 61.3483333 3763.618
1991 607.416667 -83.2744445 6934.63311 440.95 -48.0766667 2311.36588
1992 423.275 100.867222 10174.1965 423.875 -31.0016667 961.103338
1993 495.075 29.0672222 844.903406 363.625 29.2483333 855.465001
1994 674.675 -150.532778 22660.1172 431.625 -38.7516667 1501.69167
1995 619.25 -95.1077778 9045.4894 473.9 -81.0266667 6565.32072
1996 509.05 15.0922222 227.775171 440.125 -47.2516667 2232.72001
1997 471.566667 52.5755555 2764.18904 248.825 144.048333 20749.9223
1998 508.283333 15.8588889 251.504357 417.675 -24.8016667 615.122671
1999 575.166667 -51.0244445 2603.49394 331.475 61.3983333 3769.75533
2000 416.333333 107.808889 11622.7565 380.325 12.5483333 157.460669
mean x' 524.142222
392.8733333
Σ(x'-x)2 126279.751
122583.324
σ 91.753202
90.4003407
c.v 17.5
23.0

43
Where; σ is standard deviation, c.v is coefficient of variation, x’ is mean and N is the total number of years.
σ = ���� ���
C.V = � /��)100