benjamin sebastian blau - kit
TRANSCRIPT
The fundamental paradigm shift from traditional value chains to agile service va-lue networks (SVN) implies new economic and organizational challenges. In service value networks, a multitude of participants co-create complex services that create added value for customers by providing highly specialized service components and by leveraging lightweight paradigms such as RESTful architectures and mashup tech-nologies. Addressing the challenge of coordinating distributed activities in order to achieve a desired outcome, auctions have proven to perform quite well in situations where intangible and heterogeneous economic entities are traded.
Nevertheless, traditional approaches in the area of multidimensional combinatorial auctions are not quite suitable to enable the trade of composite services. A flawless service execution and therefore the requester’s valuation highly depends on the accu-rate sequence of the functional parts of the composition, meaning that in contrary to service bundles, composite services only generate value through a valid order of their components. From a technical perspective, service composition research traditionally assumes complete information about QoS characteristics and prices and does not account for self-interested service owners that intent to maximize their utility and therefore behave strategically.
Benj
amin
Seb
astia
n Bl
auC
oo
rdin
ati
on
in
Serv
ice V
alu
e N
etw
ork
s
13
Benjamin Sebastian Blau
Coordination in Service Value Networks A Mechanism Design Approach
Studies on eOrganisation and Market Engineering 13
ISBN 978-3-86644-724-0ISSN 1862-8893
9 783866 447240
ISBN 978-3-86644-724-0


Benjamin Sebastian Blau
Coordination in Service Value Networks
A Mechanism Design Approach

Studies on eOrganisation and Market Engineering 13
Karlsruher Institut für Technologie
Herausgeber:Prof. Dr. Christof WeinhardtProf. Dr. Thomas DreierProf. Dr. Rudi Studer

Coordination in Service Value Networks
A Mechanism Design Approach
by Benjamin Sebastian Blau

Dissertation, Karlsruher Institut für TechnologieFakultät für Wirtschaftswissenschaften, 2009Referenten: Prof. Dr. Christof Weinhardt, Prof. Dr. Rudi Studer
KIT Scientific Publishing 2011 Print on Demand
ISSN 1862-8893ISBN 978-3-86644-724-0
Impressum
Karlsruher Institut für Technologie (KIT)KIT Scientific PublishingStraße am Forum 2D-76131 Karlsruhewww.ksp.kit.edu
KIT – Universität des Landes Baden-Württemberg und nationalesForschungszentrum in der Helmholtz-Gemeinschaft
Diese Veröffentlichung ist im Internet unter folgender Creative Commons-Lizenz publiziert: http://creativecommons.org/licenses/by-nc-nd/3.0/de/


Coordination in Service Value
Networks
A Mechanism Design Approach
Zur Erlangung des akademischen Grades eines
Doktors der Wirtschaftswissenschaften
(Dr. rer. pol.)
von der Fakultät für
Wirtschaftswissenschaften
der Universität Karlsruhe (TH)
genehmigte
Dissertation
von
Dipl.-Inform.Wirt Benjamin Sebastian Blau
Tag der mündlichen Prüfung: 31.07.2009
Referent: Prof. Dr. Christof Weinhardt
Korreferent: Prof. Dr. Rudi Studer
Prüfer: Prof. Dr. Oliver Stein
2009 Karlsruhe


Abstract
The fundamental paradigm shift from traditional value chains to agile servicevalue networks (SVN) implies new economic and organizational challenges. Inservice value networks, a multitude of participants co-create complex servicesthat create added value for customers by providing highly specialized servicecomponents and by leveraging lightweight paradigms such as RESTful architec-tures and mashup technologies. Addressing the challenge of coordinating dis-tributed activities in order to achieve a desired outcome, auctions have proven toperform quite well in situations where intangible and heterogeneous economicentities are traded [Smi89, LR00].
Nevertheless, traditional approaches in the area of multidimensional combi-natorial auctions [BK05, Sch07] are not quite suitable to enable the trade of com-posite services. A flawless service execution and therefore the requester’s val-uation highly depends on the accurate sequence of the functional parts of thecomposition, meaning that in contrary to service bundles, composite servicesonly generate value through a valid order of their components. From a technicalperspective, service composition research [ZBD+03] traditionally assumes com-plete information about QoS characteristics and prices and does not account forself-interested service owners that intent to maximize their utility and thereforebehave strategically.
Addressing these challenges, in the work at hand, the complex service auction(CSA) is developed following a mechanism design approach. The auction mech-anism facilitates the allocation of multidimensional service offers within servicevalue networks, enables service level enforcement and determines prices for com-plex services. The mechanism and the bidding language support various typesof QoS characteristics and their individual aggregation by incorporating semanticinformation. Compliant with state of the art standards such as WS-Coordination,a possible implementation of the complex service auction in distributed environ-ments is presented and a computational tractable algorithm to solve the winnerdetermination problem is introduced.

ii
Leveraging analytical and numerical research methods, the mechanism’sproperties are evaluated comprehensively. It is analytically shown that the socialchoice implemented by the complex service auction is incentive compatible withrespect to all dimensions of the service offer (quality and price), i.e. althoughservice providers act strategic, it is a weakly dominant strategy to report theirmultidimensional type truthfully to the auctioneer. Counteracting the absence ofbudget balance, a payment scheme is presented which is robust to manipulationand at the same time incentivizes service providers to increase their services’ de-gree of interoperability which is shown by means of an agent-based simulation.To leverage synergies and to reduce costs, it is beneficial for service providers un-der certain circumstances to offer bundled services. Depending on how serviceproviders are situated within a service value network, bundling and unbundlingstrategies are analyzed following a simulation approach.

Acknowledgements
This work would not have been possible without the guidance and support ofmany people. I would like to thank my advisor Professor Dr. Christof Weinhardtfor giving me the great opportunity to do this work and for his constant supportand innovative ideas. He granted me the freedom and the help necessary andencouraged me during in times.
Additionally, I would like to thank my co-advisor Professor Dr. Rudi Studerfor his guidance and fruitful discussions that improved and enriched especiallythe technical elements of my work. Thanks also to the other members of the com-mittee, Professor Dr. Oliver Stein and Professor Dr. Stefan Tai who in particularsensitized me to additional technical aspects to round up this work.
I would like to thank the outstanding team of the research group on Informa-tion and Market Engineering at the Institute of Information Systems and Manage-ment (IISM) and the colleagues of the Karlsruhe Service Research Institute (KSRI).Their inspiration and valuable comments significantly improved my work andhelped me to solve initially “unsolvable” problems. I would also like to thankProfessor Dr. Dirk Neumann for his support in the early stage of this researchand his seminal ideas. In particular I am grateful to my friends Tobias Conteand Jochen Stößer for proof reading major parts of this work and especially forproviding me with critical and constructive questions and comments.
Above all, I am indebted to my parents, Thomas Blau and Heide Blau, to mysister Alexandra Blau, and to my fiancée Katharina Gofron. This work would nothave been possible without their constant support and their caring encourage-ment.
Benjamin Blau


Contents
I Foundations 1
1 Introduction 3
1.1 Motivation . . . . . . . . . . . . . . . . . . . . . . . . . . . . . . . . . 31.2 Research Outline . . . . . . . . . . . . . . . . . . . . . . . . . . . . . 61.3 Structure . . . . . . . . . . . . . . . . . . . . . . . . . . . . . . . . . . 101.4 Publications & Research Development . . . . . . . . . . . . . . . . . 12
2 Preliminaries & Related Work 15
2.1 Service Concepts, Definitions, and Technologies . . . . . . . . . . . 162.1.1 Tangibles, Intangibles, and Services . . . . . . . . . . . . . . 17
2.1.1.1 Tangible and Intangible Goods . . . . . . . . . . . . 182.1.1.2 Services . . . . . . . . . . . . . . . . . . . . . . . . . 192.1.1.3 E-Services . . . . . . . . . . . . . . . . . . . . . . . . 22
2.1.2 Service Decomposition Model . . . . . . . . . . . . . . . . . . 252.1.2.1 Utility Services . . . . . . . . . . . . . . . . . . . . . 252.1.2.2 Elementary Services . . . . . . . . . . . . . . . . . . 262.1.2.3 Complex Services . . . . . . . . . . . . . . . . . . . . 27
2.1.3 Service-Oriented Architectures . . . . . . . . . . . . . . . . . 322.1.3.1 Basic Concepts . . . . . . . . . . . . . . . . . . . . . 322.1.3.2 Web Services . . . . . . . . . . . . . . . . . . . . . . 372.1.3.3 Quality of Service (QoS) . . . . . . . . . . . . . . . . 462.1.3.4 Web Service Coordination . . . . . . . . . . . . . . . 48
2.1.4 Service Value Networks and Situational Applications . . . . 532.1.4.1 Networks as a Type of Governance Form . . . . . . 542.1.4.2 Service Value Networks . . . . . . . . . . . . . . . . 552.1.4.3 Situational Applications and Service Mashups . . . 62
2.2 Markets in a Service World . . . . . . . . . . . . . . . . . . . . . . . . 662.2.1 Why Auctions for Complex Services? . . . . . . . . . . . . . 672.2.2 Electronic Markets and Market Engineering . . . . . . . . . . 69
2.2.2.1 Environmental Analysis . . . . . . . . . . . . . . . . 712.2.2.2 Design and Implementation . . . . . . . . . . . . . 722.2.2.3 Testing and Evaluation . . . . . . . . . . . . . . . . 732.2.2.4 Introduction . . . . . . . . . . . . . . . . . . . . . . . 73
vi CONTENTS
2.2.3 Mechanism Design . . . . . . . . . . . . . . . . . . . . . . . . 732.2.3.1 Social Choice . . . . . . . . . . . . . . . . . . . . . . 742.2.3.2 Properties of Social Choice and Mechanism Imple-
mentations . . . . . . . . . . . . . . . . . . . . . . . 772.2.3.3 Possibility Results . . . . . . . . . . . . . . . . . . . 792.2.3.4 Impossibility Results . . . . . . . . . . . . . . . . . . 822.2.3.5 Algorithmic Mechanism Design . . . . . . . . . . . 83
2.2.4 Environmental Analysis and Related Work . . . . . . . . . . 832.2.4.1 Requirements . . . . . . . . . . . . . . . . . . . . . . 832.2.4.2 Related Work . . . . . . . . . . . . . . . . . . . . . . 86
2.3 Research Methods . . . . . . . . . . . . . . . . . . . . . . . . . . . . . 882.3.1 Theoretical Analysis . . . . . . . . . . . . . . . . . . . . . . . 892.3.2 Simulations . . . . . . . . . . . . . . . . . . . . . . . . . . . . 89
II Design & Implementation 91
3 Complex Service Auction (CSA) 93
3.1 Service Value Network Model . . . . . . . . . . . . . . . . . . . . . . 953.2 Bidding Language . . . . . . . . . . . . . . . . . . . . . . . . . . . . . 98
3.2.1 Scoring Function . . . . . . . . . . . . . . . . . . . . . . . . . 993.2.2 Service Requests . . . . . . . . . . . . . . . . . . . . . . . . . . 1033.2.3 Service Offers . . . . . . . . . . . . . . . . . . . . . . . . . . . 104
3.3 Mechanism Implementation . . . . . . . . . . . . . . . . . . . . . . . 1063.3.1 Allocation . . . . . . . . . . . . . . . . . . . . . . . . . . . . . 1073.3.2 Transfer . . . . . . . . . . . . . . . . . . . . . . . . . . . . . . . 1083.3.3 Summary . . . . . . . . . . . . . . . . . . . . . . . . . . . . . . 109
3.4 Related Work . . . . . . . . . . . . . . . . . . . . . . . . . . . . . . . . 1103.5 Auction Process Model & Architecture . . . . . . . . . . . . . . . . . 1123.6 Realization & Implementation . . . . . . . . . . . . . . . . . . . . . . 115
4 Applicability Extensions 123
4.1 Verification and Service Level Enforcement . . . . . . . . . . . . . . 1244.1.1 Related Work . . . . . . . . . . . . . . . . . . . . . . . . . . . 1244.1.2 Compensation . . . . . . . . . . . . . . . . . . . . . . . . . . . 125
4.2 Achieving Budget Balance . . . . . . . . . . . . . . . . . . . . . . . . 1284.2.1 Related Work . . . . . . . . . . . . . . . . . . . . . . . . . . . 1304.2.2 Interoperability Transfer . . . . . . . . . . . . . . . . . . . . . 1304.2.3 Finding the Optimal Threshold Parameter . . . . . . . . . . . 1334.2.4 Summary . . . . . . . . . . . . . . . . . . . . . . . . . . . . . . 134
4.3 Managing Service Quality . . . . . . . . . . . . . . . . . . . . . . . . 1344.3.1 Knowledge Representation Formalisms . . . . . . . . . . . . 1364.3.2 Semantic QoS Management . . . . . . . . . . . . . . . . . . . 136
CONTENTS vii
III Evaluation 141
5 Analytical Results 143
5.1 Incentive Compatibility & Individual Rationality . . . . . . . . . . . 1435.1.1 One-Dimensional Bids in the Basic CSA . . . . . . . . . . . . 1445.1.2 Multidimensional Bids in the Extended CSA . . . . . . . . . 1465.1.3 Results & Implications . . . . . . . . . . . . . . . . . . . . . . 149
5.2 Cooperation within the Value Chain . . . . . . . . . . . . . . . . . . 1505.2.1 Related Work . . . . . . . . . . . . . . . . . . . . . . . . . . . 1505.2.2 A Model of Cooperation . . . . . . . . . . . . . . . . . . . . . 150
6 Numerical Results 155
6.1 Manipulation Robustness of the ITF Extension . . . . . . . . . . . . 1556.1.1 Simulation Model . . . . . . . . . . . . . . . . . . . . . . . . . 1566.1.2 Results . . . . . . . . . . . . . . . . . . . . . . . . . . . . . . . 1586.1.3 Implications . . . . . . . . . . . . . . . . . . . . . . . . . . . . 165
6.2 Incentivizing Interoperability Endeavors . . . . . . . . . . . . . . . . 1676.2.1 Simulation Model . . . . . . . . . . . . . . . . . . . . . . . . . 1686.2.2 Results . . . . . . . . . . . . . . . . . . . . . . . . . . . . . . . 1716.2.3 Implications . . . . . . . . . . . . . . . . . . . . . . . . . . . . 175
6.3 Bundling Strategies of Service Providers . . . . . . . . . . . . . . . . 1766.3.1 Simulation Model . . . . . . . . . . . . . . . . . . . . . . . . . 1796.3.2 Simulation Settings . . . . . . . . . . . . . . . . . . . . . . . . 1826.3.3 Results & Implications . . . . . . . . . . . . . . . . . . . . . . 1836.3.4 Strategic Recommendations . . . . . . . . . . . . . . . . . . . 191
IV Finale 193
7 Conclusion & Outlook 195
7.1 Contribution . . . . . . . . . . . . . . . . . . . . . . . . . . . . . . . . 1957.2 Open Questions . . . . . . . . . . . . . . . . . . . . . . . . . . . . . . 2007.3 Complementary Research . . . . . . . . . . . . . . . . . . . . . . . . 2027.4 Final Remarks . . . . . . . . . . . . . . . . . . . . . . . . . . . . . . . 205
A Appendix 207
A.1 Formal Notation . . . . . . . . . . . . . . . . . . . . . . . . . . . . . . 207A.2 Incentive Compatibility . . . . . . . . . . . . . . . . . . . . . . . . . . 208A.3 Allocative Efficiency . . . . . . . . . . . . . . . . . . . . . . . . . . . 209A.4 Manipulation Robustness . . . . . . . . . . . . . . . . . . . . . . . . 210A.5 Bundling Strategies . . . . . . . . . . . . . . . . . . . . . . . . . . . . 218
References 218

List of Figures
1.1 Structure of this work. . . . . . . . . . . . . . . . . . . . . . . . . . . 11
2.1 Service lifecycle. . . . . . . . . . . . . . . . . . . . . . . . . . . . . . . 202.2 Service decomposition model. . . . . . . . . . . . . . . . . . . . . . . 262.3 Business scenario integrating a payment processing service. . . . . 282.4 Payment processing service (static view). . . . . . . . . . . . . . . . 292.5 Payment processing service (dynamic view). . . . . . . . . . . . . . 302.6 Business scenario “Service Request and Order Management”
(SROM). . . . . . . . . . . . . . . . . . . . . . . . . . . . . . . . . . . 312.7 Roles and primary operations in service-oriented architectures. . . 342.8 SOA layers. . . . . . . . . . . . . . . . . . . . . . . . . . . . . . . . . . 362.9 Web service technology stack. . . . . . . . . . . . . . . . . . . . . . . 402.10 Service orchestration versus service choreography. . . . . . . . . . . 432.11 WS-Coordination sequence diagram. . . . . . . . . . . . . . . . . . . 492.12 Mapping of a reverse auction to a coordination model. . . . . . . . . 532.13 Service value network model. . . . . . . . . . . . . . . . . . . . . . . 572.14 Example of a service value network realizing a CRM complex service. 612.15 Situational applications address the long tail of business. . . . . . . 632.16 Blueprint of a translation and tagging service mashup. . . . . . . . 652.17 Characteristics of products and services affect forms of organization. 702.18 Stages of the market engineering process. . . . . . . . . . . . . . . . 712.19 Triangle relation of mechanism implementation and social choice. . 76
3.1 Framework for the design of mechanisms. . . . . . . . . . . . . . . . 953.2 Statechart formalization. . . . . . . . . . . . . . . . . . . . . . . . . . 963.3 Context-dependent cost structures of service providers. . . . . . . . 973.4 Service value network model. . . . . . . . . . . . . . . . . . . . . . . 993.5 Service value network with service offers and corresponding con-
figurations. . . . . . . . . . . . . . . . . . . . . . . . . . . . . . . . . . 1023.6 Requester utility for different attribute types. . . . . . . . . . . . . . 1033.7 Service value network with service offers and internal costs. . . . . 1053.8 Critical value and individual contribution. . . . . . . . . . . . . . . . 1083.9 Triangle relation of the CSA mechanism implementation and social
choice. . . . . . . . . . . . . . . . . . . . . . . . . . . . . . . . . . . . 1103.10 Process model of the CSA. . . . . . . . . . . . . . . . . . . . . . . . . 1123.11 Architectural overview of the CSA. . . . . . . . . . . . . . . . . . . . 114
LIST OF FIGURES ix
3.12 Performance analysis of the ComputeAllocation algorithm. . . . . . 1193.13 Service value network with service offers exposing memory-
dependent attribute types. . . . . . . . . . . . . . . . . . . . . . . . . 120
4.1 Service value network with service offers characterized by errorrate quality attributes. . . . . . . . . . . . . . . . . . . . . . . . . . . 127
4.2 Non-budget-balanced outcome of the CSA. . . . . . . . . . . . . . . 1294.3 Service value network with semantic QoS characteristics. . . . . . . 1374.4 Security encryption ontology. . . . . . . . . . . . . . . . . . . . . . . 138
5.1 Cost dependency between service provider sy and sz. . . . . . . . . 1515.2 Cooperation within the value chain of a payment processing com-
plex service. . . . . . . . . . . . . . . . . . . . . . . . . . . . . . . . . 153
6.1 Simulation model for the evaluation of manipulation robustnessusing the ITF. . . . . . . . . . . . . . . . . . . . . . . . . . . . . . . . . 157
6.2 Decision tree of service providers. . . . . . . . . . . . . . . . . . . . . 1596.3 Utility for a single manipulating service provider in different com-
petition scenarios. . . . . . . . . . . . . . . . . . . . . . . . . . . . . . 1656.4 Simulation model for the evaluation of interoperability incentives
using the ITF. . . . . . . . . . . . . . . . . . . . . . . . . . . . . . . . . 1706.5 Interoperability degrees (ID) for 20 service offers in 4 candidate pools.1736.6 Beneficial bundling strategy (ex-ante case). . . . . . . . . . . . . . . 1776.7 Beneficial bundling strategy (ex-post case) . . . . . . . . . . . . . . . 1786.8 Simulation model for the evaluation of bundling and unbundling
strategies. . . . . . . . . . . . . . . . . . . . . . . . . . . . . . . . . . . 1816.9 Relative frequencies and expected payoffs of bundling and un-
bundling strategies. . . . . . . . . . . . . . . . . . . . . . . . . . . . . 1866.10 Strategy fitness in different cost reduction scenarios with 20 service
offers in 4 candidate pools. . . . . . . . . . . . . . . . . . . . . . . . . 1896.11 Strategy fitness in different cost reduction scenarios with 28 service
offers in 4 candidate pools. . . . . . . . . . . . . . . . . . . . . . . . . 190
7.1 Multi-layered market for complex services and resources. . . . . . . 203
A.1 Strategy fitness in different cost reduction scenarios with 32 serviceoffers in 4 candidate pools. . . . . . . . . . . . . . . . . . . . . . . . . 219

List of Tables
2.1 Differentiation criteria of tangibles, intangibles, services, and e-services. . . . . . . . . . . . . . . . . . . . . . . . . . . . . . . . . . . . 25
2.2 SaaS providers for CRM, SCM and FIN components of the businessscenario SROM. . . . . . . . . . . . . . . . . . . . . . . . . . . . . . . 31
2.3 Requirements satisfaction degree of related approaches. . . . . . . . 88
3.1 Aggregation operations for different attribute types. . . . . . . . . . 1003.2 Allocation computation stepwise procedure example. . . . . . . . . 121
5.1 Cooperation decision as a normal form game. . . . . . . . . . . . . . 152
6.1 Utility for a single manipulating service provider with 12 serviceoffers in 4 candidate pools (condensed). . . . . . . . . . . . . . . . . 160
6.2 Utility for a single manipulating service provider with 16 serviceoffers in 4 candidate pools (condensed). . . . . . . . . . . . . . . . . 161
6.2 Utility for a single manipulating service provider with 16 serviceoffers in 4 candidate pools (condensed). . . . . . . . . . . . . . . . . 162
6.3 Utility for a single manipulating service provider with 20 serviceoffers in 4 candidate pools (condensed). . . . . . . . . . . . . . . . . 162
6.3 Utility for a single manipulating service provider with 20 serviceoffers in 4 candidate pools (condensed). . . . . . . . . . . . . . . . . 163
6.4 Utility for a single manipulating service provider with 28 serviceoffers in 4 candidate pools (condensed). . . . . . . . . . . . . . . . . 163
6.4 Utility for a single manipulating service provider with 28 serviceoffers in 4 candidate pools (condensed). . . . . . . . . . . . . . . . . 164
6.5 Interoperability degrees (ID) for 20 service offers in 4 candidate pools.1716.5 Interoperability degrees (ID) for 20 service offers in 4 candidate pools.1726.6 Interoperability degrees (ID) for 32 service offers in 4 candidate pools.1746.7 Analyzed events for the evaluation of bundling and unbundling
strategies of service providers. . . . . . . . . . . . . . . . . . . . . . . 1826.8 Simulation settings for the evaluation of bundling and unbundling
strategies of service providers. . . . . . . . . . . . . . . . . . . . . . . 1836.9 Evaluation of bundling and unbundling strategies of service
providers with 20 service offers in 4 candidate pools and 0% costreduction. . . . . . . . . . . . . . . . . . . . . . . . . . . . . . . . . . . 184
LIST OF TABLES xi
6.10 Evaluation of bundling and unbundling strategies of serviceproviders with 20 service offers in 4 candidate pools and 50% costreduction. . . . . . . . . . . . . . . . . . . . . . . . . . . . . . . . . . . 185
6.11 Evaluation of bundling and unbundling strategies of serviceproviders with 28 service offers in 4 candidate pools and 0% costreduction. . . . . . . . . . . . . . . . . . . . . . . . . . . . . . . . . . . 187
6.12 Evaluation of bundling and unbundling strategies of serviceproviders with 28 service offers in 4 candidate pools and 50% costreduction. . . . . . . . . . . . . . . . . . . . . . . . . . . . . . . . . . . 188
A.1 Notation of abstract model and mechanism implementation. . . . . 207A.1 Notation of abstract model and mechanism implementation. . . . . 208A.2 Utility for a single manipulating service provider with 12 service
offers in 4 candidate pools. . . . . . . . . . . . . . . . . . . . . . . . . 210A.2 Utility for a single manipulating service provider with 12 service
offers in 4 candidate pools. . . . . . . . . . . . . . . . . . . . . . . . . 211A.2 Utility for a single manipulating service provider with 12 service
offers in 4 candidate pools. . . . . . . . . . . . . . . . . . . . . . . . . 212A.3 Utility for a single manipulating service provider with 16 service
offers in 4 candidate pools. . . . . . . . . . . . . . . . . . . . . . . . . 212A.3 Utility for a single manipulating service provider with 16 service
offers in 4 candidate pools. . . . . . . . . . . . . . . . . . . . . . . . . 213A.3 Utility for a single manipulating service provider with 16 service
offers in 4 candidate pools. . . . . . . . . . . . . . . . . . . . . . . . . 214A.4 Utility for a single manipulating service provider with 20 service
offers in 4 candidate pools. . . . . . . . . . . . . . . . . . . . . . . . . 214A.4 Utility for a single manipulating service provider with 20 service
offers in 4 candidate pools. . . . . . . . . . . . . . . . . . . . . . . . . 215A.4 Utility for a single manipulating service provider with 20 service
offers in 4 candidate pools. . . . . . . . . . . . . . . . . . . . . . . . . 216A.5 Utility for a single manipulating service provider with 28 service
offers in 4 candidate pools. . . . . . . . . . . . . . . . . . . . . . . . . 216A.5 Utility for a single manipulating service provider with 28 service
offers in 4 candidate pools. . . . . . . . . . . . . . . . . . . . . . . . . 217A.5 Utility for a single manipulating service provider with 28 service
offers in 4 candidate pools. . . . . . . . . . . . . . . . . . . . . . . . . 218


List of Abbreviations
ACID . . . . . . . . . . . Atomicity, Consistency, Isolation, DurabilityB2B . . . . . . . . . . . . . Business-to-BusinessBN . . . . . . . . . . . . . . Business NetworkBPEL . . . . . . . . . . . . Business Process Execution LanguageCRM . . . . . . . . . . . . Customer Relationship ManagementCTF . . . . . . . . . . . . . Compatibility Transfer FunctionFIN . . . . . . . . . . . . . FinanceFOL . . . . . . . . . . . . . First-Order LogicFTP . . . . . . . . . . . . . File Transfer ProtocolGXL . . . . . . . . . . . . . Graph eXchange LanguageHTML . . . . . . . . . . . Hypertext Markup LanguageHTTP . . . . . . . . . . . Hypertext Transfer ProtocolICT . . . . . . . . . . . . . . Information and Communication TechnologyIT . . . . . . . . . . . . . . . Information TechnologyJSON . . . . . . . . . . . . JavaScript Object NotationQoS . . . . . . . . . . . . . Quality of ServiceRDF . . . . . . . . . . . . . Resource Description FrameworkREST . . . . . . . . . . . . Representational State TransferRPC . . . . . . . . . . . . . Remote Procedure CallRSS . . . . . . . . . . . . . Rich Site SummarySaaS . . . . . . . . . . . . . Software-as-a-ServiceSBN . . . . . . . . . . . . . Smart Business NetworkSCM . . . . . . . . . . . . Supply Chain ManagementSemPIT . . . . . . . . . . Semantic and Policy-Based IT Management and ProvisioningSLA . . . . . . . . . . . . . Service Level AgreementSMTP . . . . . . . . . . . Simple Mail Transfer ProtocolSOA . . . . . . . . . . . . . Service-oriented ArchitectureSOAP . . . . . . . . . . . Simple Object Access ProtocolSROM . . . . . . . . . . . Service Request and Order ManagementSVN . . . . . . . . . . . . . Service Value NetworkSVNP . . . . . . . . . . . Service Value Network PlannerUDDI . . . . . . . . . . . Universal Description, Discovery, and IntegrationUML . . . . . . . . . . . . Unified Modeling LanguageURI . . . . . . . . . . . . . Uniform Resource Identifier

xiv LIST OF TABLES
VCG . . . . . . . . . . . . Vickrey-Clarke-GrovesVO . . . . . . . . . . . . . . Virtual OrganizationW3C . . . . . . . . . . . . World Wide Web ConsortiumWADL . . . . . . . . . . Web Application Description LanguageWSDL . . . . . . . . . . . Web Service Description LanguageXML . . . . . . . . . . . . eXtensible Markup Language

Part I
Foundations

Chapter 1
Introduction
The principle of utility neither requires nor admits of any other regulator than itself.
[Ben38]
T his chapter firstly motivates the work at hand in Section 1.1 and elaboratesarguments that support the necessity and relevance of the addressed re-
search questions. Section 1.2 describes the research outline and the research ques-tions underlying this work. Based on the construction of the research outline,Section 1.3 briefly introduces the main structure followed by an illustration of theresearch development with respect to publications and presentations of differentparts of this work.
1.1 Motivation
Businesses are undergoing a paradigm shift from developing and distributinggoods to providing services as their core business [VL04]. As the focus on servicecustomization increases in order to provide tailored-solutions to customers, com-panies gain competitive advantage through the provision of highly specializedservices [VL04, LVO07]. In recent years the service sector has become a rapidlygrowing sector in world economies. In Brazil, Russia, Japan, and Germany, ser-vices account for 50 percent of the labor force and 75 percent of the labor forcein the United Kingdom and the United States [OEC05]. The Bureau of EconomicAnalysis (BEA) reported that in the United States, the private service-producingsector continued to lead overall GDP growth in 2006, increasing by 4.2 percent,
4 CHAPTER 1. INTRODUCTION
whereas growth in the private goods-producing sector decreased down to 0.8percent [BEA08].
A renaissance of HTTP appreciation through e.g. the RESTful architecturalstyle [Fie00, RR07] drives simplicity of service descriptions and interfaces andenables service consumers to participate in the so called programmable Web. Aprimer example for this trend is Amazon’s Simple Storage Service (S3)1 that isfully accessible and manageable through basic HTTP methods following a REST-ful architectural style2. Programmatic access to services with lightweight APIscan be used by consumers without in-depth technical knowledge. In January2008, Amazon announced that the Amazon Web Services3 consume more band-width than the entire global network of Amazon.com retail sites [Ama08]. This re-flects the shift from the production and consumption of statically presented infor-mation to ”living“ information services. Knowledge and information is more andmore intensively shared by building situational services (e.g. service mashups, in-telligent document mashups, situational applications) instead of statically prede-fined information goods (e.g. blog posts, information on static Web sites). Drivenby simplicity and easy-of-use, this trend also implies a strong involvement of theservice consumer in the production process of services. The process of consumingand contributing to service artifacts is no longer separable which results in a newrole called the service prosumer who co-creates value proactively [TW06]. As theprovision and consumption of services blurs, the number of co-created servicesincreases rapidly.
Due to growing modularization and simplicity, services are composable in aplug-and-play fashion [VvHPP05, ZBD+03] in order to be rearranged into value-added complex services. The process of composing and rearranging existing andnewly created service components enables agile innovation processes [BC00]. Allthese trends foster a rapid growth of so called service value networks. Servicevalue networks are constituted by loosely-coupled formations of companies thatprovide modularized services while concentrating on their core competencies.These Web-enabled services expose standardized interfaces and foster an ad-hoccomposition in order to jointly generate added value for customers in an on-demand fashion.
Service composition enabled through modularization and simplicity lever-ages the power of business in the long tail [And06]. Flexible combining cus-
1http://aws.amazon.com/s3/2A detailed introduction to the Amazon S3 architecture and the programmatic management
can be found in [RR07]3http://aws.amazon.com/

1.1. MOTIVATION 5
tomized service components increases variety and individuality which leveragesthe power of mass-customization [DSBF01]. Traditionally, most of the individualdemand for specialized services could not be satisfied by off-the-shelf solutions.By enabling the opportunity to co-create solutions and building nearly unlim-ited versions through innovating and recomposing loosely-coupled services intovalue-added complex services, demand is nearly generated by customers them-selves.
Nevertheless, current leading service providers traditionally offer their ser-vices charging static prices (e.g. pay-per-use or flat fees). However, such staticpricing models do not reflect the agility and distributed nature of service valuenetworks and situational applications from an economic perspective. Multipledistributed self-interested providers that contribute to a value-added complexservice have different preferences for different outcomes which are private infor-mation. Static pricing schemes ignore such preferences and additional informa-tion that is inherent in the market. Although service providers like Amazon startto incorporate economies of scale in their pricing models [BBT09] these pricingschemes are still static and are not capable of balancing supply and demand. Aprimer example for dynamic pricing models in the context of electronic servicesis Google’s AdWords4 and Yahoo! Search Marketing5. Google for example pro-vides a generalized second price auction to allocate and price keywords and corre-sponding search rankings [EOS07, Var09]. In the first quarter of 2009, 67 percentof Google’s revenues are realized by the AdWords campaign and further 30 per-cent through the complementary AdSense program reflecting Google’s partnernetwork6. In total, Google’s revenue is predominantly generated (97 percent)through its advertisement programs that are based on an auction pricing model
[EOS07].
Auctions have proven to perform quite well in situations where intangibleand heterogenous entities are traded [Smi89]. Furthermore, valuations are hardto determine for single and especially value-added complex services as the valueof the service’s outcome highly depends on the customer’s preferences for whichcurrent pricing models do not account. Auctions are predestinated to aggregate
information from distributed parties which results in an aggregated valuation[PS00, Jac03]. Without prior knowledge about the valuations of each partici-pant, auctions can provide suitable incentives to make truth-revelation an equi-
4http://adwords.google.com/5http://searchmarketing.yahoo.com/6http://investor.google.com/releases/2009Q1_google_earnings.html
6 CHAPTER 1. INTRODUCTION
librium strategy and therefore automatically aggregate necessary information fromself-interested participants to determine adequate prices for complex services.
1.2 Research Outline
The overall question underlying this work is how an adequate auction mecha-nism can be designed which enables the trade of complex (composite) servicesin distributed environments such as service value networks. A suitable mech-anism must satisfy economic and applicability requirements and must at thesame time be theoretically sound. A well-known result from Market Engineer-ing states that there is no such thing as an omnipotent mechanism that is suitableand applicable in any domain and any setting [WHN03]. Thus, a mechanismdesign for the allocation and pricing of complex services depends on economicand technical characteristics of typical service offers in service value networks(e.g. utility and elementary services with different QoS characteristics), differ-ent requesters’ preferences for various QoS characteristics of complex services[ZBD+03] and the overall goals of the mechanism designer (e.g. revenue vs. wel-fare maximization) [Rot02, Neu04]. Addressing these challenges and satisfyingdetailed requirements derived from an environmental analysis, the work at handextends the body of research on mechanisms for trading combinatorial entitieswith special focus on sequential compositions of service components in servicevalue networks.
The first research question deals with the properties of service value networksand complex services which embody the final outcome that is provisioned to ser-vice requesters. As an initial step, this question lays the groundwork for thedesign of an adequate mechanism that enables the trade of service compositionsin service value networks. Hence, the first research question is stated as follows:
Research Question 1 ≺ENVIRONMENTAL ANALYSIS≻. What are
the characteristics of service value networks and complex services, and
what are resulting economic and applicability requirements upon a mech-
anism to coordinate value creation?
The question is addressed by (i) defining traditional services, e-service, software
services and Web services and analyzing their key characteristics, (ii) providing aclear understanding of service value networks by defining their characteristics, their
1.2. RESEARCH OUTLINE 7
structure, and their components and filling the lack of definitions in current re-lated literature (iii) analyzing the concept of a complex services as a final outcomecreated by a service value network through the realization of a sequence of modu-larized service offers. Finally, based on these results, economic and applicabilityrequirements upon an adequate mechanism for coordinating value creation inservice value networks are derived. In summary, the environmental analysis andresulting requirement analysis serve as a starting point for the further develop-ment of the work at hand.
Targeting the core contribution of this work, the second research question ad-dresses the challenge of how to design an adequate multidimensional and scal-able auction mechanism which enables the allocation and pricing of complex ser-vices in service value networks.
Research Question 2 ≺MECHANISM DESIGN≻. How can a scalable,
multidimensional auction mechanism for allocating and pricing of com-
plex services in service value networks be designed that limits strategic
behavior of service providers?
The question is addressed by (i) providing an abstract model of service value net-
works that captures the key characteristics and components in a comprehensivemanner, (ii) designing a bidding language that enables the specification of multidi-mensional service offers and service requests, (iii) specifying a scoring function tocapture the service requester’s preferences for different QoS characteristics andprices of complex services and (iv) designing an auction mechanism – the ComplexService Auction (CSA) – consisting of an allocation and transfer function thatimplements an allocative efficient, individual rational and incentive compatiblesocial choice with respect to all dimensions of the providers’ bids. Focusing ona computational tractable implementation of the auction mechanism, (v) an algo-
rithm is presented that solves the winner determination problem in polynomialtime regarding the number of service offers and feasible service compositions.
While traditional service composition approaches assume complete informa-tion about the service components and their providers [ZBD+03], service valuenetworks are characterized by self-interested service providers that try to max-imize their individual utility. Pursuing individual goals, service providers actstrategically and have private information about their preferences for differentoutcomes [NR01, Par01] (e.g. information about true valuations and QoS char-

8 CHAPTER 1. INTRODUCTION
acteristics of their services is private an cannot be assumed to be truthfully re-ported). Bridging this information gap, the approach of mechanism design tar-gets the implementation of incentives (e.g. by means of an auction mechanism)that make truth-revelation a dominant strategy equilibrium and consequently al-lows for computing a system-wide solution. Nevertheless, traditional combina-torial auctions [BK05, Sch07] and especially corresponding bidding languages arenot quite suitable to enable the trade of complex services. A flawless service exe-cution and the requester’s valuation for the outcome highly depends on the accu-rate sequence of the functional parts of the composition, meaning that in contraryto service bundles, complex services only generate value through a valid order oftheir components.
In order to enable the mechanism’s application to the domain of service valuenetworks and the coordination of distributed service activities, the following re-search question states the challenges regarding necessary applicability extensionsto be addressed by this work:
Research Question 3≺APPLICABILITY EXTENSIONS≻. How can an
auction mechanism be extended to support complex QoS characteristics
and service level enforcement? How can the pricing scheme be modified in
order to achieve budget balance and incentivize interoperability endeavors
of service providers?
Providing highly specialized services, providers shift from price to qualitycompetition [Pap08]. Addressing the long tail of business, service providers tendto offer various customized versions of their services at different QoS levels in or-der to satisfy varying idiosyncratic demands. Consequently, a mechanism mustaccount for complex QoS characteristics, that on the one hand are expressedby service providers and on the other hand are incorporated in the requester’spreferences. The challenge is to provide a common conceptualization of qual-ity attributes and enable their description, aggregation and enforcement froman economic and technical perspective. Addressing this question, the auctionmechanism is extended in order to support complex QoS characteristics by means ofrule-based semantic concepts and a toolbox of adequate aggregation operations.Furthermore, the mechanism is extended by a a compensation function which in-corporates ex-post information about each services’ performance in order to im-pose penalties if necessary. The compensation function is designed to implement

1.2. RESEARCH OUTLINE 9
a truth-telling equilibrium with respect to all dimensions of service providers’bids, i.e. truthful reporting of QoS attributes is a weakly dominant strategy for allservice providers.
It is well-known in mechanism design research that based on strong theoreticresults certain combinations of economic desiderata are impossible to achieveat the same time [GL78, Wal80, HW90, MS83]. There exist interdependenciesbetween the properties of a mechanism and implemented social choice. Thus,mechanism design goals often result in a trade-off between different properties.Budget balance is an important property for a mechanism in order to be sus-tainable in the long-run as continuous external subsidization is neither reason-able nor profitable for e.g. a platform provider. Addressing the second part ofResearch Question 3, an extended transfer function – the Interoperability Transfer
Function (ITF) – is developed which restores budget balance by sacrificing incentivecompatibility to a certain extent and at the same time incentivizes service providers
to increase their services’ degree of interoperability, i.e. to increase the capability oftheir offered services to communicate and function with other services within theservice value network.
The challenge of how a mechanism’s properties can be evaluated by means ofanalytical and numerical methodologies is stated in the following research ques-tion:
Research Question 4 ≺EVALUATION≻. How can an auction mech-
anism be analytically and numerically evaluated regarding its economic
properties as well as cooperation and bundling strategies of service
providers?
Research Question 4 is firstly addressed by an analytical evaluation of themechanism’s properties which shows that the complex service auction imple-ments a social choice that is allocative efficient and incentive compatible with respectto all dimensions of service providers’ bids, i.e. truth-revelation of private QoSattributes and valuations of offered services is an equilibrium in dominant strate-gies. Furthermore it is analytically shown that there exist ex-ante agreementsbetween service providers about a form of cooperation to reduce internal costs thatare mutually beneficial.
By means of simulation-based analysis, the extended budget-balanced trans-fer function is evaluated with respect to the robustness against bid manipulation,

10 CHAPTER 1. INTRODUCTION
i.e. to what degree it is beneficial for service providers to deviate from their truevaluation. Results show that even in settings with a low level of competitionstrategic behavior of service providers is tremendously limited as a deviation from atruth-telling strategy is not significantly beneficial even in small service valuenetworks. The incentive for service providers to increase their services’ degreeof interoperability is numerically evaluated by means of an agent-based simu-lation. Compared to an equal transfer function which distributes available sur-plus equally among allocated service providers, it is shown that the ITF extensionimplements incentives to foster a higher overall degree of interoperability in settingswith a low level of competition. Thus, the ITF extension supports service valuenetworks in an early stage of development as a high degree of interoperability in-creases the multitude of feasible complex service instances that can be offered tocustomers. An increase of variety and interoperability leverages network exter-nalities [SV99, FK07, LM94, KS85] and attracts customers which in turn attractsmore service providers to participate in the complex service auction.
Broadening the strategic scope of service providers that participate in the com-plex service auction, it might be beneficial from a provider perspective – depen-dent on how they are situated within the service value network– to offer theirservices as a bundle together with matching service providers. This question isaddressed by means of an agent-based simulation. It is evaluated if it is bene-ficial to offer bundled services which decreases flexibility but leverages synergyeffects and reduces costs or if it is beneficial to offer single highly specialized ser-vices that are more flexibly composable into various complex service instances. Insummary, there two main strategies analyzed: (i) Competing in quality throughdifferentiation and flexibility and (ii) competing in price through bundling syner-gies and cost reduction. Results show that in general service providers that ownservices within the service value network which are highly competitive, i.e. theyare likely to be allocated, act best by following an unbundling strategy. In con-trary, for service providers with less competitive service offers it is beneficial toform bundled service offers while leveraging synergy effects. Nevertheless, thisstrategic recommendation only holds in settings with a low level of competition.
1.3 Structure
The outline of this work is structured accordingly as depicted in Figure 1.1.
Chapter 2 introduces technologies, concepts and methods, which are funda-mental for the work at hand. First, the concepts and key characteristics of dif-

1.3. STRUCTURE 11
Part IV
Finale
Part III
Evaluation
Part II
Design &
Implementation
Part I
Foundations
Chapter 1
Introduction
Chapter 2
Preliminaries & Related Work
Chapter 5
Analytical Results
Chapter 6
Numerical Results
Chapter 3
Complex Service Auction (CSA)
Chapter 4
Applicability Extensions
Chapter 7
Conclusion & Outlook
Figure 1.1Structure of this work.
ferent kind of services are discussed and corresponding definitions are outlined.Then service enabler technologies and paradigms such as service-oriented archi-tectures, service value networks, and situational applications are introduced indetail. Bridging the gap between a more technical to an economic perspective,the idea of service markets is introduced and motivated in the context of com-plex services and service value networks. The discussion is followed by the de-scription of the discipline of market engineering, which provides a structuredapproach for designing, implementing, and evaluating market mechanisms indifferent domains such as the service sector. The approach of mechanism designunderlying the work at hand is introduced as well as important impossibility andpossibility results. Summarizing the preliminaries, economic and applicabilityrequirements upon a suitable mechanism for trading complex services in servicevalue networks are discussed The requirement analysis is followed by a detaileddescription of related approaches in that particular research area with respectto stated requirements and identified shortcomings. Chapter 2 concludes with

12 CHAPTER 1. INTRODUCTION
a brief description of research methods, which are used to analyze the researchquestions throughout this work.
Introducing the core model and mechanism implementation of the complexservice auction as well as corresponding applicability extensions, Chapters 3 and4 embody the central part of this work. Based on the design part, Chapters 5 and6 analyze properties of the complex service auction mechanism following ana-lytical and numerical research methods. For the convenience of the reader, eachchapter entails detailed related work regarding the specific research question ad-dressed additionally to the previously outlined approaches, which are closelyrelated to the work at hand.
Finally, Chapter 7 summarizes the key contributions of this work, outlinescomplementary research and points out further challenges to be addressed in thefuture.
1.4 Publications & Research Development
Excerpts of this thesis have been published in European and international aca-demic conferences and as journal articles. This section provides a brief overviewregarding what parts have been presented, discussed and refined in the contextof which research community. This section furthermore illustrates how the workat hand has been developed focusing on its steps of refinement and extension.
Laying the groundwork for this work at hand in Chapter 2, an analysis aboutcharacteristics of traditional and e-services as well as corresponding service def-initions have been published in the Proceedings of the 18th International WorldWide Web Conference (WWW 2009) [MB09]. The service decomposition modeland the conceptual framework for categorizing different service artifacts havebeen presented at the Multikonferenz Wirtschaftsinformatik [BS08] and a revisedversion at the Joint Conference of the INFORMS Section on Group Decision andNegotiation, the EURO Working Group on Decision and Negotiation Support,and the EURO Working Group on Decision Support Systems [BBS08].
Basic ideas and concepts about situational Web applications introduced in thepreliminaries have been published in the Proceedings of the 2nd Workshop onMashups, Enterprise Mashups and Lightweight Composition on the Web (MEM2009, WWW 2009 pre-conference workshop) [BLH09]. A first position paperabout service value networks, their differentiation from related concepts, charac-
1.4. PUBLICATIONS & RESEARCH DEVELOPMENT 13
teristics, components, and an abstract model has been presented at the 11th IEEEConference on Commerce and Enterprise Computing (CEC 2009) [BKCvD09].
With respect to Chapter 3, first versions of the auction mechanism and theidea of applying path auctions to composition problems have been publishedin the 10th IEEE Joint Conference on E-Commerce Technology (CEC 2008) andEnterprise Computing, E-Commerce and E-Services (EEE 2008) [BLNW08]. Afurther refined version of the model including first simulation-based evaluationshave been presented at the 16th European Conference on Information Systems(ECIS 2008) [BNWM08]. The next step of revision and extension of the complexservice auction has been published in the Proceedings of the 9th InternationalConference on Business Informatics [CvD09].
The comprehensive model of the complex service auction as introduced in thework at hand including a complete analytical analysis of the mechanism’s proper-ties with respect to allocation efficiency and incentive compatibility as outlined inChapter 5 has been presented at the the 17th European Conference on InformationSystems (ECIS 2009) [BCM09] and published in the Journal of Business and In-formation Systems Engineering, Special Issue Internet of Services (forthcoming)[BvDC+09].
A simulation-based evaluation of service providers’ bundling and un-bundling strategies participating in the complex service auction as introducedin Chapter 6 has been submitted to the Journal Electronic Commerce Researchand Applications, Special Issue on Emerging Economic, Strategic and TechnicalIssues in Online Auctions and Electronic Market Mechanisms [BvDCW09].
As outlined in Chapter 7, complementary and future research with respectto implementing mechanisms that – in contrary to traditional mechanism designgoals – provide innovative incentives to support service value networks in theirearly stage of growth have been presented at the 15th Americas Conference onInformation Systems (AMCIS 2009) [CBSvD09].


Chapter 2
Preliminaries & Related Work
In contrast to a good, a service is not an entity that can exist independently of its
producer or consumer and therefore should not be treated as if it were some special kind
of good, namely an ’immaterial’ one.
[Hil99]
T he goal of this chapter is to give a thorough introduction into technical andeconomic foundations, which are essential for the remainder of this thesis.
The work at hand focuses on the design and evaluation of an auction mechanismto coordinate value generation among distributed parties. The mechanism designprovides means for the feasible and efficient allocation and pricing of compositeservices in service value networks.
This chapter firstly discusses the differentiation between tangible and intan-gible goods and the central concept of a service. Based on these results, a service
decomposition model is presented that provides a conceptualization scheme for dif-ferent classes of services and highlights the concept of a complex service. Followingthese definitions and classifications, the paradigm of a service-oriented architecture
is introduced, which embodies the key principles leading to enabler technolo-gies for service-centric electronic networks. Technical foundations cover the con-cept of Web services, emerging technologies with a focus on lightweight protocols,puristic architectural styles and slim message formats as well as quality of service
aspects and their legal manifestation in service level agreements. As coordinationplays a central role in distributed environments with self-interested parties suchas the Web, frameworks and specifications in the Web service context are intro-duced that provide means for realizing coordination mechanisms from a technicalperspective.

16 CHAPTER 2. PRELIMINARIES & RELATED WORK
As the work at hand focuses on not only distributed but also networked ser-vice environments, the emergence of service value networks as a novel form ofinter-organizational interaction and value generation is described and a modelfor capturing essential characteristics is provided. Service value networks allowfor the realization of short-living complex services that fulfil customers’ needson a individual basis. Hence, such situational applications and service mashups arebriefly introduced.
Following this introduction of service concepts, definitions and technologies,the need for auction mechanisms in these environments is discussed. Since thiswork targets on providing a comprehensive design and evaluation of a suitableservice coordination mechanism from a technical and an economic perspective,this chapter introduces the idea of algorithmic mechanism design and the interdis-ciplinary approach inherent in this emerging discipline. In the context of coordi-nating distributed and self-interested participants, central economic and compu-tational desiderata, prominent mechanisms, and important impossibility resultsare outlined.
Finally, the research methods underlying this work are briefly introduced.This chapter introduces related work and state of the art that is broadly relatedto the research questions at hand. Adjacent literature, a clear differentiation anda detailed discussion is provided in the remainder of this thesis.
2.1 Service Concepts, Definitions, and Technologies
The whole concept of distributed (service-oriented) computing can be viewed as simply a
global network of cooperating business objects.
(Papazoglou 2000)
The goal of this section is to provide a thorough introduction to the service con-cept itself, conceptual classification models, related paradigms and technology,and emerging service-centric environments.
Section 2.1.1 describes the differences between tangible and intangible goodsand the concept of a service by elaborating specific properties that allow for amore or less strict differentiation. Based on this analysis, the service concept isdefined and its main characteristics are presented in detail. Concretizing the ser-vice concept by restricting its production and consumption channels to primarily
2.1. SERVICE CONCEPTS, DEFINITIONS, AND TECHNOLOGIES 17
electronic networks, the concept of an e-service is described and its implicationson the general characteristics of a service are argued.
These foundations lay the groundwork for a service decomposition model asillustrated in Section 2.1.2, which serves as a conceptual classification scheme fordifferent types of services with respect to their granularity and level of abstrac-tion. Besides utility and elementary services, complex services – as a special typeof service – are introduced in detail as they embody a central concept for the workat hand.
Section 2.1.3 is concerned with the paradigm of a service-oriented architectureand its key principles which can be seen as the foundation for enabler-technologysuch as Web services. Service-oriented architectures allow for the agile produc-tion and consumption of distributed services in electronic networks such as theWeb, that is, they enable value generation from a technical perspective. Value,created by a service is mainly dominated by intangible elements that are experi-enced during its performance, which therefore highly depends on the service’squality. Hence, the main quality aspects that together constitute quality of ser-vice (QoS) are argued and how a legal foundation is constituted by service levelagreements. Distributed service activities that foster value generation and pro-duce an overall quality that is provisioned to the consumer must be coordinatedby suitable mechanisms. By introducing a standardized framework that specifieshow coordination can be realized in the context of Web services, this challenge isinitially addressed from a technical perspective.
Designing suitable mechanisms to coordinate value generation through com-plex services requires a deep understanding of emerging forms of organizationof distributed service activities. Therefore, Section 2.1.4 presents the concept of aservice value network, its characteristics, the various roles involved and how theyare organized in order to jointly create value for potential service requesters. Theoverall objectives underlying this value generation process are individually spec-ified by the services requester and consequently change frequently. This leadsdirectly to the concept of situational applications and service mashups which iselaborated from a technical and an economic perspective in the remainder of Sec-tion 2.1.4.
2.1.1 Tangibles, Intangibles, and Services
The differentiation between the terms good, intangible good, tangible good andservice is ambiguous and not exhaustive in the literature. Nevertheless a funda-

18 CHAPTER 2. PRELIMINARIES & RELATED WORK
mental understanding of the concepts at hand is inevitable to derive requirementsand implications in the context of service value networks, value generation andtheir coordination.
2.1.1.1 Tangible and Intangible Goods
A good is an economic entity with a defined ownership. The ownership is de-fined by means of a legal right that allows the owner to use the good exclusivelyand to prevent others from doing so. According to [Hil99] there are two maincharacteristics of a good observable: (i) The existence of a good is independent ofthe existence of its owner, meaning that a good’s identity is retained over time. (ii)
Ownership rights can be transferred from one economic entity to another, whichimplies that goods are tradable. The owner of a good derives some economicbenefit from it (in contrary to a bad that decreases the utility of its owner). Amore rigorous differentiation between goods and services appears in the contextof production. The production process of goods involves inputs and outputs thatare entirely owned by the producer of the good. A good may be inventoried, soldor traded, consumed or disposed after production as separated activities. Thefact that production and use are distinct activities is important from an economicperspective as it allows for the transfer and exchange of goods even multipletimes.
Although most of the goods are material, economic entities exist that exposeall key characteristics of a good but are immaterial. According to [Hil99], “theseconsist of intangible entities originally produced as outputs of persons, enter-prises, engaged in creative or innovative activities of a literary, scientific, engi-neering, artistic or entertainment nature.” Although these information goods areimmaterial they are goods because ownership can be defined and transferredfrom one economic unit to another. The main value for the consumer is derivedfrom the information itself. They are also intangible because they expose no phys-ical dimensions (except from the medium the information is stored on, which isnot the economic entity at hand). The production process itself is mostly verycostly and time consuming, whereas the reproduction or copying of informationgoods is cheap. The value of information goods generally increases through shar-ing and use [SV99, BBL99]1.
1Note that this fact is not universally true. E.g. the value of private information about sharesof a company decreases through sharing.
2.1. SERVICE CONCEPTS, DEFINITIONS, AND TECHNOLOGIES 19
2.1.1.2 Services
Analogues to the fact that attributes, properties and characteristics of a serviceare rather fuzzy, the concept of a service itself is hardly definable especially ina consistent way across different application areas. Complementary to a shortdefinition, this section defines the service concept and differentiates it from adja-cent concepts such as goods and products through the identification of its maincharacteristics and their implications.
In general a service is some kind of activity or performance. The result of suchan activity is the change of condition of some person or good. This change of stateis based on an agreement of the economic unit owning the good and the oneproviding the service [Hil77, Gad92].
Definition 2.1 [SERVICE]. A service is an activity which an economic unit A (ser-
vice provider) performs for another economic unit B (service consumer) that results in a
change of state or condition of an economic unit C whereas The output of that activity
cannot circulate in the economy independently of economic unit C.2
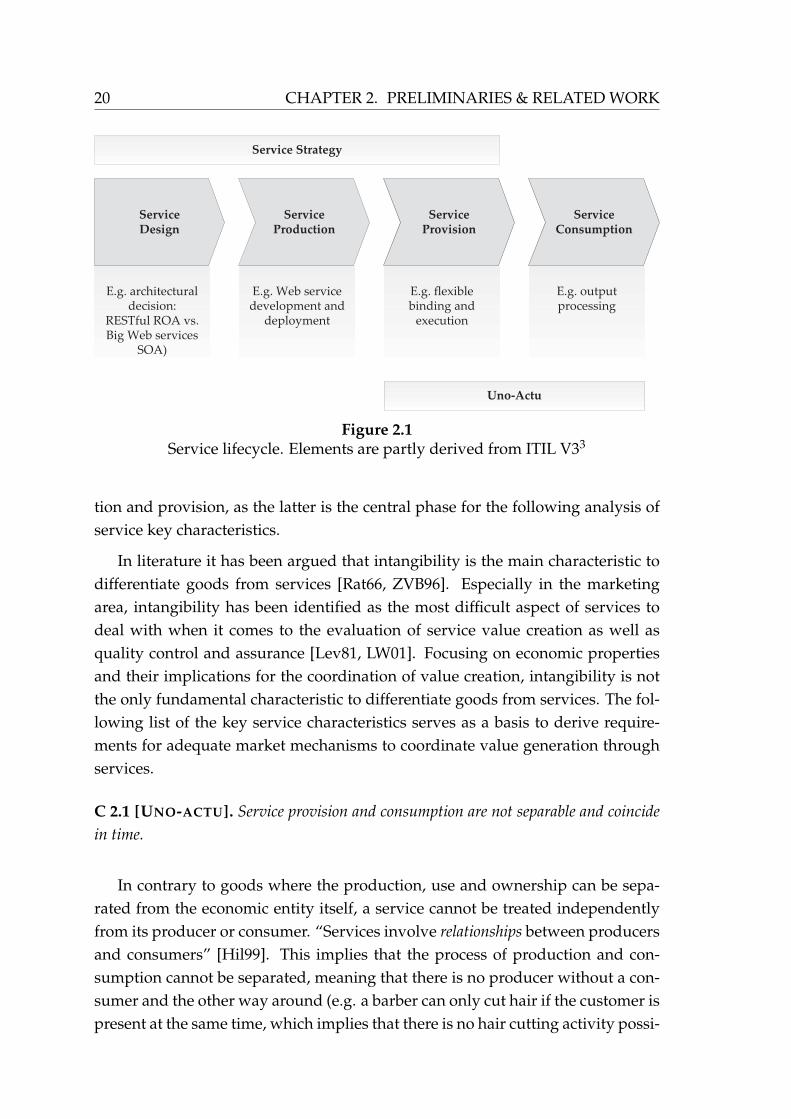
Services expose a set of unique characteristics that have strong implicationsfrom an economic perspective and allow a more or less consistent differentiationfrom traditional goods or products. In order to analyze key characteristics ofservices, it is important to differentiate the relevant phases of a service’s lifecycleas depicted in Figure 2.1.
The overall lifecycle is determined and evaluated based on a global strategy,i.e. the service strategy, that defines requirements and goals of the service portfo-lio. Based on initial requirements, the service design phase lays the groundworkwhile dealing with conceptual decisions regarding a service’s design (e.g. is theroom service available all the time? Which architectural design to choose forimplementing a Web service?). Based on the initial design, the service itself is de-veloped in the service production phase and all necessary resources for the serviceprovisioning are prepared (e.g. a Web service is implemented using the Ruby pro-gramming language, a hotel room is cleaned and the mini bar is refilled). Accord-ing to the central service characteristic, the uno-actu principle, which is explainedin detail in the remainder of this section, service provision and service consumption
occur simultaneously, i.e. they coincide in time under the presence of a producerand consumer. It is important to strictly differentiate between service produc-
2This definition is based on [Hil77, Gad00]3http://www.itil-officialsite.com/
20 CHAPTER 2. PRELIMINARIES & RELATED WORK
ServiceDesign
ServiceProduction
ServiceProvision
ServiceConsumption
E.g. architectural decision:
RESTful ROA vs. Big Web services
SOA)
E.g. Web service development and
deployment
E.g. flexible binding and
execution
E.g. output processing
Service Strategy
Uno-Actu
Figure 2.1Service lifecycle. Elements are partly derived from ITIL V33
tion and provision, as the latter is the central phase for the following analysis ofservice key characteristics.
In literature it has been argued that intangibility is the main characteristic todifferentiate goods from services [Rat66, ZVB96]. Especially in the marketingarea, intangibility has been identified as the most difficult aspect of services todeal with when it comes to the evaluation of service value creation as well asquality control and assurance [Lev81, LW01]. Focusing on economic propertiesand their implications for the coordination of value creation, intangibility is notthe only fundamental characteristic to differentiate goods from services. The fol-lowing list of the key service characteristics serves as a basis to derive require-ments for adequate market mechanisms to coordinate value generation throughservices.
C 2.1 [UNO-ACTU]. Service provision and consumption are not separable and coincide
in time.
In contrary to goods where the production, use and ownership can be sepa-rated from the economic entity itself, a service cannot be treated independentlyfrom its producer or consumer. “Services involve relationships between producersand consumers” [Hil99]. This implies that the process of production and con-sumption cannot be separated, meaning that there is no producer without a con-sumer and the other way around (e.g. a barber can only cut hair if the customer ispresent at the same time, which implies that there is no hair cutting activity possi-

2.1. SERVICE CONCEPTS, DEFINITIONS, AND TECHNOLOGIES 21
ble without the barber or the customer being present). This principle is also calleduno-actu and states that production coincides with consumption. Uno-actu is the
central and most important key characteristic of services. Hence, it is fundamental todistinguish services from goods and it causally implicates most of the followingservice characteristics.
C 2.2 [NOT STORABLE]. Services cannot be inventoried or produced on stock.
The main value generated by the consumption of services comes from an ac-tion or performance. Service are ephemeral – transitory and perishable – which im-plies that they cannot be stored or produced on stock. It is not possible to produceservices in advance in order to meet fluctuating demand. It is of great impor-tance to distinguish between the actual performance that leads to an immediatechange in state and its effect on reality. The activity itself on the one hand can-not be produced on stock as it is intangible and perishable. The person or goodthat is affected by this activity on the other hand can mostly be preserved overtime [Gad00] (e.g. the actual deed of cutting hair cannot be produced on stock,whereas the change of condition – the physical cut hair – can be inventoried andexists over time). It has been argued by [Sta79] that the possibility to store andtransport an economic entity is the main distinguishing element of services. Con-sidering energy as an economic entity, this argumentation does not hold or mustat least be relaxed, which questions its suitability for a strict differentiation.
C 2.3 [CO-CREATION]. Services are generally co-created by their consumers.
According to Definition 2.1, services are deeds or actions that change the con-dition of another economic unit. This economic unit – often referred to as externalfactor – is mostly brought in by the consumer. The consumer proactively influ-ences the service activity and might therefore influence its result and quality. Thedegree of customer participation and co-production in the context of differentservice categories is analyzed in [BFHZ97]. Depending on the type of service (i)
customer presence might be required during service delivery, (ii) customer in-puts might be required for the actual service creation or (iii) customer inputs arecompletely mandatory. Co-production is argued to be the main characteristic todifferentiate services from goods [Fuc68]. However, recent production strategiesof traditional goods heavily integrate customers in the production process – of-ten referred to as mass customization [PMS04] – which shows that co-production
22 CHAPTER 2. PRELIMINARIES & RELATED WORK
does not appear to be a suitable service characteristic in order to strictly distin-guish services from goods.
C 2.4 [INTANGIBLE VALUE CREATION]. Value creation through services is character-
ized by intangible elements.
Some services include physical elements in the process of value creation(i.e. spare parts during a repair process). However, the most value is createdin the form of intangible, immaterial elements. The consumer of a service expe-
riences the performance or activity, which embodies the main portion of createdvalue [LW01]. Services create value when service consumers benefit from expe-riencing a service without a transfer of ownership (e.g. booking a hotel room).Due to this fact, the assessment of quality and its assurance is a critical issue inthe context of services as an experience or an intangible result is hard to measureand strongly depends on the economic unit to which it is provided. A contin-uous spectrum from tangible-dominant to intangible-dominant to differentiatebetween goods and services is suggested in [Sho85].
C 2.5 [FUZZY INPUTS AND OUTPUTS]. Service inputs and outputs are fuzzy and tend
to vary more widely.
Implied by the previous characteristic, it is hardly possible to control qualityaspects of a service in a way that outcomes are predictable and constant over time[GW97]. Services are produced and consumed coincidentally and the value thatis created during this process varies widely due to the lack of control instrumentsand various facets of service experience. This issue is even more intensified byanother phenomenon that is specific to services. The quality of a service mightdepend on the ”quality” or effort of the service consumer (e.g. in teaching orconsulting) [Gri92]. Due to the fact that the quality or effort of a service consumeris not under the control of the provider and tends to vary from individual toindividual, the final outcome of a service activity is fuzzy and varies more widely.
2.1.1.3 E-Services
With the rise of information and communication technology and the rapidgrowth of the Web, the environment for service development, production, pro-vision and consumption has changed completely. In this context the concept ofe-services emerged. The term e-service stands for a special form of “service that

2.1. SERVICE CONCEPTS, DEFINITIONS, AND TECHNOLOGIES 23
is provided over electronic networks” [RK02]. The e-service paradigm [RK03] isbased on a broader view than the concepts of software services or IT services4.
Definition 2.2 [E-SERVICE]. An e-service or electronic service is a service provided
over electronic networks.5
Based on the implications of these novel environments that foster the e-serviceparadigm it is necessary to recall the service characteristics introduced in Section2.1.1.2. As an e-service is a specific type of service, its characteristics are quite sim-ilar the characteristics of a general service. Nevertheless they have to be revisedand adapted according to the conditions of the changed surroundings.
C 2.1 (UNO-ACTU) In the context of e-services, the roles “service producer” and“service consumer” are not strictly definable according to a traditional per-spective. In most cases, the consumer of such a service is also an e-service oranother automated electronic entity (e.g. search agents, spiders and robots).The role of the service producer is analogously hard to specify as e-servicesare developed and ready for execution via electronic networks, meaningthat – under the assumption that there are no capacity constraints imposedby e.g. the network’s bandwidth – these services can be performed any-time in a distributed manner to multiple consumers. Hence, dependentof how the provision and the actual consumption is defined in the contextof e-services, this fact blurs the definition of the uno-actu principle whichstates that service producer and service consumer are contemporaneouslyinvolved in the performance of a service. Although the principle still holdsin the e-service context, its relevance and implications on service provisionand consumption have to be relaxed dependent of how provision and con-sumption are definable and separable.
C 2.2 (NOT STORABLE) E-services can be developed and stored to be ready forexecution. Although the physical storage of the program code that deter-mines the behavior of the service is possible, the actual execution, which isthe value generating element of the service, can obviously not be performedon stock. This also implies a fluctuating supply as capacity constraints in theform of bandwidth or computing power limit the ability to satisfy peaks in
4“A Service provided to one or more Customers by an IT Service Provider. An IT Service isbased on the use of Information Technology and supports the Customer’s Business Processes. AnIT Service is made up from a combination of people, Processes and technology and should bedefined in a Service Level Agreement.” [RH07]
5Based on the definition in [RK02]
24 CHAPTER 2. PRELIMINARIES & RELATED WORK
demand. Resource-focused capacity constraints can partly be overcome bythe use of computer grids or cloud computing environments that allow forthe flexible scaling of computing power and storage.
C 2.3 (CO-CREATION) In order to perform a service, the consumer mostly has toprovide additional information that is either transformed by the service orused to scope and customize the service execution according to the needs ofthe consumer. Although the service consumer does not bring in a physicaleconomic entity that is a central part of the service activity, the consumerstill influences and co-produces the final outcome of an e-service by provid-ing necessary additional information or data. Thus, co-production is stilla central element of service provision and consumption in the context ofe-services.
C 2.4 (INTANGIBLE VALUE CREATION) Value that is created through the execu-tion of an e-service is idiosyncratic and highly depends on the preferences ofthe service consumer. Although, the experience of a service performance inan electronic environment also depends on expectations, needs and prefer-ences of the service consumer, e-services partly allow for an objective mea-surement of service quality, which highly correlates with the value gener-ated. The proportion of value-determining aspects of a service outcome thatcan objectively be measured increases in the context of e-services, whichleads to an increase of uncertainty about the value generated through a ser-vice activity.
C 2.5 (FUZZY INPUTS AND OUTPUTS) A great advantage of e-services is the pos-sibility to describe their main functionality and capabilities in a standard-ized manner, which simplifies their usage and management. Inputs andoutputs of e-services can be specified using standardized description lan-guages that are common knowledge to service producers and service con-sumers. Thus, standardization and common sense about specifications re-duce uncertainty about inputs and outputs in the context of e-services. Nev-ertheless, also in the context of electronic networks service, inputs and out-puts highly depend on the state of the environment they ’live’ in. E.g. ca-pacity constraints, network failures and unreliable transportation influencethe service outcome and its quality which increases uncertainty and unpre-dictability. Another factor that has an impact on the output generated bythe service is the consumer’s information that is either transformed or usedto scope the service execution. Fuzzyness of service inputs and outputs can

2.1. SERVICE CONCEPTS, DEFINITIONS, AND TECHNOLOGIES 25
be reduced by means of standardized service description but is still an issuein the context of e-services.
Summarizing described key characteristics, Table 2.1 shows an overview overdifferentiation criteria of tangibles, intangibles, services, and e-services that havebeen discussed in this section.
Table 2.1: Differentiation criteria of tangibles, intangibles, ser-vices, and e-services. ( = fully satisfied, G# = partly satisfied,#= not satisfied, NA = not applicable)
Criterion Tang
ible
s
Inta
ngib
les
Serv
ices
E-S
ervi
ces
Ownership rights definable and transferable # #
Immaterial #
Costly initial production
Costly reproduction # # #
Sharing increases value # G# NA NA
Uno-actu # #
Not storable # # G#
Co-creation G# G# G#
Intangible value creation #
Fuzzy inputs and outputs NA NA G# #
2.1.2 Service Decomposition Model
This section gives a thorough classification of groups of services that share com-mon characteristics from a technical and economic perspective as depicted in Fig-ure 2.2. The Service Decomposition Model is based on the classification in [BS08] andthe extension in [BBS08]. The model distinguishes three different service layersgrouping Utility Services, Elementary Services and Complex Services.
2.1.2.1 Utility Services
Utility services reflect a vision where services can be accessed dynamically inanalogy to electricity and water: “Utility computing is the on-demand delivery

26 CHAPTER 2. PRELIMINARIES & RELATED WORK
Complex Services
ElementaryServices
UtilityServices
Enterprise Service(Procurement Scenario)
IT Service(Content Management
Sytem)
Economic Service(Market Service)
Energy(Electricity, Cooling)
Computation(CPU)
Memory(HDD, RAM)
Intermediation Service(Data Transformation)
Database Service(Data Storage)
Information Service(Information Retreval)
Virtualization
Encapsulation
Figure 2.2Service decomposition model [BBS08].
of infrastructure, applications, and business processes in a security-rich, shared,scalable, and standards-based computer environment over the Internet for a fee.Customers will tap into IT resources – and pay for them – as easily as they nowget their electricity or water.” [Rap04]. Utilities are characterized by necessity,reliability, ease of use, fluctuating utilization patterns, and economies of scale. In[Rap04], base pricing in utility computing on metering usage (also coined “pay-what-you-use” or “pay-as-you-go”) is suggested, as is the case with classic util-ities such as water, telephone and Internet access. With the fast rise of energyprices, the meaning of utility services is even extended back to the roots where thename originally came from: Basic computing services in hosting centers need tobe managed explicitly taking into account energy consumption as a relevant op-timization criterion [CAT+01]. “Heterogeneous server clusters can be made moreefficient by conserving power and energy while exploiting information from theservice level, such as request priorities established by service level agreements”[BR04]. Even temperature aware computing solutions for data centers are pro-posed [MSS+08].
2.1.2.2 Elementary Services
Elementary services virtualize the utility services layer and encapsulate under-lying functionality. They provide rather basic functionality such as data formatconverting services, storage services, or pure information services that retrieve in-

2.1. SERVICE CONCEPTS, DEFINITIONS, AND TECHNOLOGIES 27
formation from designated sources. Although the type and behavior of these ser-vices are mostly standardized, they have multiple attributes with varying char-acteristics. For instance, storage services may differ according to their capacity,access time and data throughput. These varying characteristics of the same typeof service, as well as the service itself can be described by means of standardizeddescription languages. The input and output semantics of these so-called elemen-tary services are well-accepted and interpretable. Examples might be databaseservices and data format transformation services. Services in this layer are re-quired for several different higher-level applications and, as a consequence, areutilized by a multitude of different users. Similar to utility services, the providedquality of service for the same type of service may vary. For instance, a set ofdata format transformation services may vary from their offered response time;however, it is assumed that these characteristics can also be described in a stan-dardized form.
2.1.2.3 Complex Services
While elementary services provide simple functions such as credit checking andauthorization, inventory status checking, or weather reporting, complex servicesmay appropriately unify disparate business functionality to provide a wholerange of automated processes such as insurance brokering, travel planning, in-surance liability services or package tracking [PD04]. A complex service is com-posed of multiple service components (which are either elementary or complexthemselves), often requiring an interaction or conversation between the user andservices, so that the user can make decisions [MSZ01]. According to [Pap08], acomplex service can be defined as follows:
Definition 2.3 [COMPLEX SERVICE]. Complex (or composite) services typically in-
volve the assembly and invocation of many pre-existing services possibly found in diverse
enterprises to complete a multi-step business interaction.
Complex services combine the functionality and capabilities of modularizedservice components (which themselves can be utility, elementary or complex ser-vices) by sequential composition in order to generate added value. To illustratethe idea of complex services this section provides exemplary business cases fromthe enterprise sector which are based on current market information.
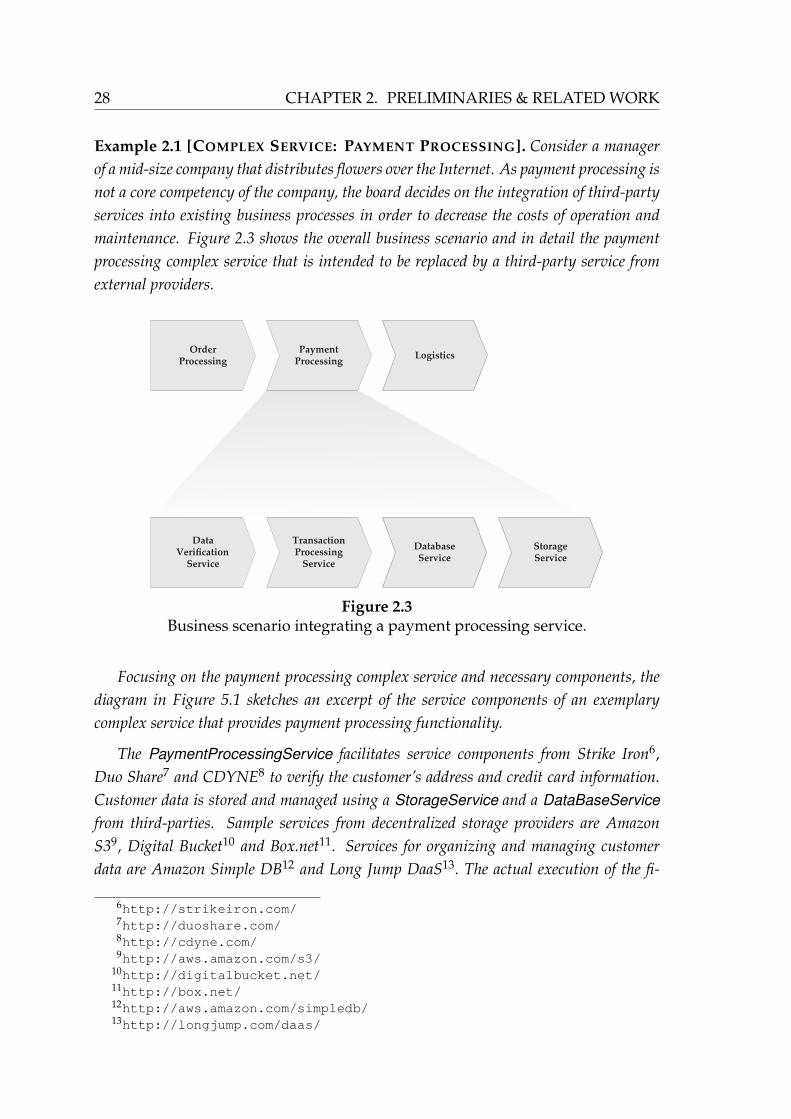
28 CHAPTER 2. PRELIMINARIES & RELATED WORK
Example 2.1 [COMPLEX SERVICE: PAYMENT PROCESSING]. Consider a manager
of a mid-size company that distributes flowers over the Internet. As payment processing is
not a core competency of the company, the board decides on the integration of third-party
services into existing business processes in order to decrease the costs of operation and
maintenance. Figure 2.3 shows the overall business scenario and in detail the payment
processing complex service that is intended to be replaced by a third-party service from
external providers.
DataVerification
Service
TransactionProcessing
Service
DatabaseService
StorageService
OrderProcessing
LogisticsPayment
Processing
Figure 2.3Business scenario integrating a payment processing service.
Focusing on the payment processing complex service and necessary components, the
diagram in Figure 5.1 sketches an excerpt of the service components of an exemplary
complex service that provides payment processing functionality.
The PaymentProcessingService facilitates service components from Strike Iron6,
Duo Share7 and CDYNE8 to verify the customer’s address and credit card information.
Customer data is stored and managed using a StorageService and a DataBaseService
from third-parties. Sample services from decentralized storage providers are Amazon
S39, Digital Bucket10 and Box.net11. Services for organizing and managing customer
data are Amazon Simple DB12 and Long Jump DaaS13. The actual execution of the fi-
6http://strikeiron.com/7http://duoshare.com/8http://cdyne.com/9http://aws.amazon.com/s3/
10http://digitalbucket.net/11http://box.net/12http://aws.amazon.com/simpledb/13http://longjump.com/daas/

2.1. SERVICE CONCEPTS, DEFINITIONS, AND TECHNOLOGIES 29
PaymentProcessingService
DataVerificationService DatabaseService StorageService TransactionProcessingService
AddressVer CreditCardVer
DuoShareAddressQualityIntegrator
CDYNEPostalAddressVerification
StrikeIronGlobalAddressLocator
JETTISTransactionProcessing
NetBillingCreditCardProcessingAmazonSimpleDB
LongJumpDaaS AmazonS3
Box.net
DigitalBucket
Figure 2.4Payment processing service (static view).
nancial transaction through the TransactionProcessingService is provided by JETTIS
Transaction Processing14 and Net Billing Credit Card Processing15.
The process behavior of the payment processing complex service is depicted in Figure
2.5. Customer data is validated in the first step. After validation the actual transaction
takes place and the customer’s credit card account is charged by a transaction processing
service. The change in state must be updated in the internal database of the company. A
database service updates corresponding customer data that is stored using a decentralized
storage service.
For each step of the complex service there is a potential pool of suitable candidates
to fulfill required business transaction. The result of each transaction is passed to the
successor service. In order to successfully instantiate the complex service the overall
transaction requires a service candidate from each pool.
14http://jettis.com/15http://netbilling.com/

30 CHAPTER 2. PRELIMINARIES & RELATED WORK
DataVerification
Service
TransactionProcessing
Service
DatabaseService
StorageService
StrikeIron
Duo Share
CDYNE
JETTIS
NetBilling
LongJump
Amazon
Amazon
DigitalBucket
Box.net
Figure 2.5Payment processing service (dynamic view).
Example 2.1 shows that core service competencies can be leveraged by procur-ing complex services from third party providers to close competency gaps in busi-ness processes. The granularity of complex services ranges from services that areparts of a business process to services that cover whole business scenarios as il-lustrated in the following example.
Example 2.2. To further illustrate the idea of a complex service a business scenario which
is actually delivered to customers as part of SAP’s BusinessByDesign16 is introduced ex-
emplarily. The scenario consists of modular service components that can be provided
by decentralized service providers. The integration scenario “Service Request and Or-
der Management” (cp. Figure 2.6) describes operational processes in a customer service
based on service requests, service orders and service confirmations. From an end-to-end
perspective the scenario includes the integration into related applications such as logistics
planning and execution, invoicing and payment, as well as financial accounting.
The complex service is formed by decentralized service providers that contribute to
the achievement of an overall goal. In the presented scenario this goal is the flawless ex-
16http://www.sap.com/solutions/sme/businessbydesign/

2.1. SERVICE CONCEPTS, DEFINITIONS, AND TECHNOLOGIES 31
ServiceRequest
Processing
ServiceOrder
Processing
ServiceConfirmation
Processing
CustomerRequirementProcessing
LogisticsExecution
Control
Supply andDemandMatching
CustomerInvoice
Processing
Due ItemProcessing
PaymentProcessing
CRM SCM FIN
Figure 2.6Business scenario “Service Request and Order Management”
(SROM).
ecution of a business scenario in order to provide defined functionality to the customer.
Many service providers offer differentiated and specialized services covering various types
of functionality within the complex service. They provide service components regarding
customer relationship management (CRM), supply chain management (SCM) and fi-
nance (FIN). In this scenario the functionality of each component can be modularized
and therefore performed by different software-as-a-service (SaaS) providers as depicted in
Table 2.2.
Table 2.2: SaaS providers for CRM, SCM and FIN components ofthe business scenario SROM.
CRM SCM FIN
Salesforce GXS Cashviewhttp://salesforce.com/ http://gxs.com/ http://cashview.com/
Rightnow 7Hills Opsourcehttp://rightnow.com/ http://7hillsbiz.com/ http://opsource.net/
Oracle Intaccthttp://oracle.com/crmondemand/ http://intacct.com/
SAPhttp://www.sap.com/solutions/sme/businessbydesign/
The rapid growth of the number of on-demand service providers shows the high de-
gree of innovation and market penetration as a result of service modularization. Service
providers offer specialized services and concentrate on their core competencies. Each ser-
vice provider is responsible for a certain part of the overall functionality, which conse-
quently spreads the risk of an erroneous business process over all contributing service
providers. Furthermore, they partly grant access to their own resources thus supporting
the realization of the overall business scenario.

32 CHAPTER 2. PRELIMINARIES & RELATED WORK
2.1.3 Service-Oriented Architectures
This section introduces fundamentals and basic concepts of service-oriented ar-chitectures with a focus on technologies and definitions that serve as a basis forthe remainder of this thesis. In Section 2.1.3.1, service-oriented architecture asa paradigm for organizing distributed services that are under the control of dif-ferent domains is introduced. The section provides a definition of the service-oriented architecture concept and introduces its key principles. The concept ofWeb services as the most prominent example of a technology that leverages thestrength of service-oriented architectures is presented in Section 2.1.3.2. The sec-tion guides through the Web service technology stack and state-of-the-art speci-fications and standards. It is well-known that the main value generated by a ser-vice activity is determined by its quality characteristics and their manifestationat run-time. Hence, Section 2.1.3.3 introduces the concept of quality of service(QoS), relevant factors in the context of Web services and how QoS guaranteescan be formulated in contracts, i.e. service level agreements. Contracts definingQoS aspects provide the legal basis for the market-based trade of services as a spe-cial form of coordination. Thus, technologies and concepts for the coordinationof Web services are introduced in Section 2.1.3.4 that provide means for organiz-ing dependencies among distributed service activities that have to be governedto achieve an overall outcome.
2.1.3.1 Basic Concepts
Service-oriented architectures (SOAs) have gained a lot of momentum over thelast years. SOA is a paradigm to organize distributed capabilities possibly underthe control of different domains. The paradigm itself and its concrete implemen-tations are fundamental for the development, production, innovation and pro-vision of services via electronic channels. Technology that is based on the SOAprinciple can be seen as the enabler technology for service-oriented computing.Definitions of service-oriented architectures and related concepts are based onthe OASIS Reference Model for Service Oriented Architectures [MLM+06].
The main goal of service-oriented architectures is the composition of com-plex applications out of loosely-coupled service components that provide spe-cific well-defined functionality. Service components are designed to live indepen-dently of the application they are part of and are therefore reusable and recom-posable in different application contexts [Ley03]. In order to illustrate the ideaof the flexible composition of loosely-coupled service components, the concept of

2.1. SERVICE CONCEPTS, DEFINITIONS, AND TECHNOLOGIES 33
a service and its interaction with central roles in the context of service-orientedarchitectures have to be elaborated in detail.
Relevant services in the context of service-oriented architectures are a sub-set of e-services as defined in Section 2.1.1.3. These types of electronic servicesare called software services. Software services are self-describing software com-ponents that provide certain capabilities through a programmatic interface viaelectronic networks such as the Internet. A service interface publishes the service’ssignature describing input and output parameters as well as message types. Theobjectives of a service are defined through its capabilities, which are acts or perfor-mances that solve problems of an economic unit. They state the conceptual pur-pose and expected result of the service by using terms or concepts defined in anapplication-specific taxonomy [PG03]. Narrowing down Definition 2.1, capabil-ities are provided through a software service by a service provider and consumedby a service requester in order to fulfill certain needs. Software services exposethree major properties that are essential for the SOA paradigm:
• The programmatic interface of the service is platform-independent.
• The service can be dynamically located and invoked.
• The service maintains its own state (self-contained).
By means of a well-defined platform independent interface, the service canbe consumed from anywhere, on any operating system and in any programminglanguage. The service can be discovered by means of a look-up mechanism facil-itating a service registry. In any state of its lifestyle the service manages its ownstate independently. Compromising this information the definition of softwareservices is the following:
Definition 2.4 [SOFTWARE SERVICE]. A software service is a self-describing, self-
contained mechanism that enables the access to certain capabilities of an encapsulated
software component via an electronic network by means of a well-defined platform-
independent programmatic interface. A software service is an open component that can
be dynamically located, bound and invoked.
The definition at hand is more restrictive then Definition 2.2 because it re-quires the existence of a well-defined platform-independent programmatic in-terface17. An example of a software service would be a credit card verification
17For the reader’s convenience, the terms software service and service are from now on usedinterchangeably.

34 CHAPTER 2. PRELIMINARIES & RELATED WORK
service accessible over the Internet that verifies credit cards at a central authoritybased on the card number provided through the service’s interface. In contrarya Web blog might not be considered to be a software service according to Defini-tion 2.4 as it does not expose a well-defined programmatic interface in the narrowsense.
In the context of service-oriented architectures there are three primary op-erations to manage the interaction between the provider and requester roles asdepicted in Figure 2.7. These are the publication of the service descriptions at aservice registry by the service provider, finding of the service descriptions, binding
and execution of the services based on their description by the service requester[Pap08].
Registry
Requester Provider
find publish
bind
execute
Figure 2.7Roles and primary operations in service-oriented architectures.
Publishing a service at a service registry mainly consists of two steps. Thefirst step is to describe the service at hand, that is, a description of its interfaceand usage conditions. The second step is the actual registration of the service inorder to facilitate discovery and reusability by service requesters. The finding ofa service involves two steps as well: The first step is to create a description in theform of a query that defines criteria and search terms concretizing the service thatis needed by the service requester. The second step, is the selection of the set ofservices retrieved from the discovery agency. Criteria defined in the query con-sist of the type of service that is needed, quality aspects and other technical aswell as non-functional service characteristics. The query is executed against thedata set stored in the service registry and a subset of services that meet the crite-rions in the search query are retrieved. In the second step the service requesterhas to chose from the set of discovered services either statically at design-time

2.1. SERVICE CONCEPTS, DEFINITIONS, AND TECHNOLOGIES 35
or automatically bound at run-time. Binding and invocation are the most impor-tant operations in service-oriented architectures. Once a service is chosen eitherstatically or dynamically, the service requester and the service provider agree toa well-defined and unambiguous contract that describes the service at hand andcorresponding service level agreements. The invocation can either be performeddirectly by the service requester using the technical service description from theregistry or via a mediation through the registry.
Having defined services, related concepts, roles and primary operations in thecontext of service-oriented architectures, the paradigm itself, its main goals andits key principles can be defined
Definition 2.5 [SERVICE-ORIENTED ARCHITECTURE]. A service-oriented architec-
ture is an architectural design paradigm to structure, utilize and compose distributed
interoperable software services that are under the control of decentralized ownership do-
mains in order to realize distributed applications.
In order to achieve defined purposes the SOA paradigm relies on the follow-ing key principles.
Loose-coupling The term coupling refers to the degree of dependency betweentwo systems. Therefore, loosely-coupled services can interact more freelyas they do not need to know the location, behavior, implementation orany other details of communication partners. Systems that are designedin a loosely-coupled manner are mostly based on asynchronous or event-driven interaction schemes instead of synchronous communication [Pap08].A loosely-coupled design allows for the flexible restructuring of processesand application logic without having to touch the internal structure of theservices involved as they live independently within a service-oriented ar-chitecture [Bur04].
Interoperability A main benefit of service-oriented architectures is the hetero-geneity of services that can be integrated in a distributed system. This di-versity and continuous evolution of services during their lifecycle impliesa high complexity to enable a seamless communication between serviceswithout manual adaption, i.e interoperability. The high degree of standard-ized formalisms and protocols in service-oriented architectures are key con-cepts to achieve the desired interoperability of distributed services.
Reusability As services in a service-oriented architecture are self-contained,loosely-coupled and not bound to a concrete system, they can be reused

36 CHAPTER 2. PRELIMINARIES & RELATED WORK
in different application contexts. Due to reusability, the number of redun-dant components in a service-oriented architecture is generally much lowercompared to traditional systems. This results in a lower effort for changemanagement and maintenance in service-oriented architectures.
Discoverability In order to reuse services in a service-oriented architecture, a po-tential consumer or developer must be able to find the service that matchesthe specified requirements. Discoverability is mostly realized by a servicerepository that entails services including their description to enable theirsearch and usage. The process of service discovery can either be performedmanually by consumers or automatically by the system.
The key principles of service-oriented architectures are pursued and enabledby the architectural design through the encapsulation of infrastructure, application
logic, services and business processes in a transparent manner. Figure 2.8 schemati-cally illustrates the architectural layers of a SOA as well as their interactions.
Services
Infrastructure
Virtualization
ApplicationLogic
Service Bus
BusinessProcesses
Figure 2.8SOA layers.

2.1. SERVICE CONCEPTS, DEFINITIONS, AND TECHNOLOGIES 37
The infrastructure layer comprises physical resources providing computingpower, storage, memory and bandwidth. Encapsulation and flexible resourceprovisioning is achieved by the adoption of virtualization technologies that al-low for the dynamic instantiation and migration of virtual resource environmentsindependent from their physical hosting location [BDF+03]. Virtualization is animportant step towards a service enablement of physical resources, which fostersa service-oriented management of hardware units.
Above the virtualized infrastructure is the application logic layer, which entailsapplications and application systems that provide the actual functionality in theform of software components. These systems are a mixture of up-to-date applica-tion systems and old legacy systems. Applications in the application logic layerare enhanced by service definitions to enable encapsulation and abstraction inorder to be manageable in a service-oriented context.
The application logic layer is abstracted by services in the service layer. Theyencapsulate functionality in a self-describing, self-contained and loosely-coupledmanner and provide access through well-defined interfaces. The service bus is themain component of a service-oriented architecture. It functions as the connectingelement between the set of services providing loosely-coupled functionality andbusiness processes reflecting organizational criterions and real-world businessprocedures. The service bus enables the retrieval, provision and binding of ser-vices [Ley03] while supporting standards to facilitate distributed communicationand message exchange between services.
2.1.3.2 Web Services
Over the last decade the Web has evolved from a content- or document-orientedenvironment to a service-centric environment. This is due to the rise of the con-cept of Web services. The term Web service in general does not per se imply aconcrete form of realization. Web services are a way to expose functionality in astandardized manner that is accessible over the Web in order to realize complexdistributed applications. The use of standard Web technology reduces hetero-geneity and enables the reuse and integration of distributed functionality inde-pendent of platforms and programming models. In contrary to traditional inter-company middleware that is centrally organized and controlled by a single com-pany, the Web service paradigm allows for the integration of globally distributedservices across organizational boundaries.

38 CHAPTER 2. PRELIMINARIES & RELATED WORK
A huge body of work has been done defining Web services. The most promi-nent definitions range from a very generic perspective to a strict and language-oriented view. Nevertheless, only focusing on the aspect that Web services areapplications that are accessible over the Web to other applications [ABC+02] iscertainly not practical. In contrary, the notion of the World Wide Web consor-tium (W3C) [AGB+04] is much stricter as it limits Web services to those servicesthat expose interfaces that are described using the eXtensible Markup Language(XML) [BPSM+06]. The W3C defines a Web service as “[...] a software systemidentified by a URI [BLFM98], whose public interfaces and bindings are definedand described using XML. Its definition can be discovered by other software sys-tems. These systems may then interact with the Web service in a manner pre-scribed by its definition, using XML based messages conveyed by Internet pro-tocols.” This definition excludes Web services that exchange messages in a morelightweight manner facilitating formatting standards that in contrary to XML re-duce payload. In order to include these types of Web services the definition byW3C has to be relaxed regarding language limitations.
Definition 2.6 [WEB SERVICE]. A Web service is a software service identified by a
URI [BLFM98] that exposes a public interfaces, based on Internet standards. A Web
service can be discovered by other software systems. These systems may then interact
with the Web service in a manner prescribed by its definition, using Internet standard
based messages conveyed by Internet protocols.
Conceptually Web services can be divided in two main categories dependingon the architectural style used for their realization, i.e. RESTful Web services18 andBig Web services. [PZL08].
Recently, RESTful Web services have increased attention not only because oftheir usage in the context of Web 2.019, service mashups and situational applica-tions, but also because of the presumed simplicity and their lightweight character.
RESTful Web services are based on an architectural style that is used for real-izing distributed hypermedia information systems (e.g. the Web). Messages aretransported via the HTTP protocol without the need for an envelope on-top suchas SOAP that generates extra XML payload. RESTful Web services expose uniquedocument processing interfaces. The signature consists of the scoping information
specified by a URI (e.g. “/reports/open-bugs/”) and method information spec-ified in the HTTP header (e.g. GET, HEAD, PUT, DELETE). Due to the strict and
18The term Representational State Transfer (REST) was firstly introduced in [Fie00]19cp. http://programmableweb.org/apis/

2.1. SERVICE CONCEPTS, DEFINITIONS, AND TECHNOLOGIES 39
exclusive use of standardized HTTP methods valuable properties are retained,i.e. safety and idempotence. Safety refers to the property that – assuming a correctimplementation of a RESTful Web service– the execution of HTTP methods GETand HEAD does not change the state of the corresponding service. Idempotenceis a property of an operation that states that the result of an operation is inde-pendent of the number of executions20. It is important that HTTP methods suchas PUT and DELETE are idempotent operations due to the unreliable nature ofthe Web and the uncertainty of a successful method execution. Therefore, it ispossible to invoke the same method multiple times without having to care aboutthe implications of the repeated calls. Furthermore, RESTful Web services areaddressable, connected and stateless meaning that they can be uniquely identified,they mostly point to other services that make sense in a certain context, and anyinformation that is necessary to understand a message is enclosed in the HTTPmessage.
Up to now the lightweight nature of RESTful Web services and the lack ofexpensive service descriptions have been regarded as feature of the approach es-pecially in the context of service mashups and situational applications. However,as applications become more complex and the number of services grows, the lackof a service description becomes increasingly problematic (see also discussion in[PZL08, Pau08]). Therefore, first approaches for annotating RESTful Web serviceshave been proposed. Similar to the approach used in SAWSDL [FL07] for WSDL-based services, SA-REST [SGL07, LGS07] can be used to attach model referenceannotations to HTML using RDFa [AB08]. It can thus be used to annotate RESTfulWeb services.
Recently, many service providers claim to offer RESTful Web services butmostly violate important properties that are outlined in this section [RR07].Prominent examples of service providers that offer correctly implemented REST-ful Web services are Amazon and Yahoo!. Amazon offers storage capacitythrough its Simple Storage Service (S3)21 that is fully accessible and manage-able in the manner of REST. Most of Yahoo!’s Web services22 are also availableas RESTful Web services.23
To pursue SOA principles such as interoperability and platform indepen-dence, Web service technology is based on standardized Internet protocols and
20e.g. the function f (x) = 1 · x is idempotent as f ( f (x)) = f (x) and in general f · · · f = f21http://aws.amazon.com/s3/22http://developer.yahoo.com/23Note that also most static Web sites are accessible and manageable as RESTful Web services
[RR07].

40 CHAPTER 2. PRELIMINARIES & RELATED WORK
description languages to allow for the interoperable automation of distributedapplications without the need for human intervention. Thus, Web services arenot built in a monolithic manner but rather founded on a stack of complementarystandards encapsulating several functional layers as illustrated in Figure 2.9.
Big
WS
Sta
ck
WS-BPEL, WS-CDL
WS-Coordination WS-Context
UDDI
WSDL
RE
ST
ful
WS
Sta
ck
WS-Policy
SOAP
XML, XML Schema
HTTP
JSON
Transport
Forma!ing
Messaging
Description
Discovery
Coordination & Context
Orchestration & Choreography
Figure 2.9Web service technology stack.
Due to this design principle, new standards in the context of Web servicesemerge quickly as they are developed on-top of existing functionality24.
Transport
Web services facilitate basic Internet infrastructure technology such as theHypertext Transfer Protocol (HTTP) [FGM+99], the Simple Mail Transfer Pro-tocol (SMTP) or the File Transfer Protocol (FTP). The HTTP protocol enablestransportation, ensures almost universal reach and support and is the mostprominent transport protocol used by Web servers and browsers. It allows forthe stateless interoperability of distributed, collaborative information systems. Inorder to enable the unique addressing for transportation, resources on the Webare identified using a Unique Resource Identifier (URI) [BLFM98].
Formatting
24The interested reader is referred to http://www.innoq.com/soa/ws-standards/poster/for a comprehensive overview of state-of-the-art Web service standards.

2.1. SERVICE CONCEPTS, DEFINITIONS, AND TECHNOLOGIES 41
Messages that are exchanged via the transport layer are structured based onformatting standards. The most prominent example that is widely used is theeXtensible Markup Language (XML) [BPSM+06] but there are also lightweightformats mainly pushed through Web 2.0 technology such as the JavaScript ObjectNotation (JSON) [Cro06].
Messaging
Message exchange in distributed environments such as the Web have to beorganized using standardized specifications. Specifications for the exchange ofmessages are developed on top of the transport layer and protocols such as HTTP,SMTP or FTP and function as an envelope that defines how messages shouldbe exchanged between communication partners. A well-established frameworkfor Web service information exchange is the Simple Object Access Protocol(SOAP) [BEK+00]. SOAP is a further development of XML-RPC [Win99]. Itis a network protocol that enables the XML-based message exchange betweendistributed software systems in the manner of a Remote Procedure Call (RPC)architectural style. It specifies how messages should be structured, formattedand interpreted independent of semantics and application-specific information.SOAP messaging can be enhanced by complementary Web service standardssuch as WS-Security [NKMHB06] to allow for integrity and confidentiality ofinformation exchange procedures.
Description
The publish-find-bind-execute paradigm as illustrated in Figure 2.7 allows ser-vice providers to publish services at a central registry, that can then be discov-ered, bound and executed by service requesters. In order to enable such roles,operations and interactions in a service-oriented architecture, Web services needto be described in a consistent manner. Thus, only if a service requester is able togather all necessary information on a service’s interface and the type and struc-ture of the messages being exchanged, services can be assembled and composedinto value-added complex services that expose business functionality. Servicedescription reduces the need for a common understanding and custom program-ming and is a key driver of loosely-coupling in service-oriented architectures.It is a machine-understandable description of a service’s structure, operationalcharacteristics and non-functional properties [Pap08].
42 CHAPTER 2. PRELIMINARIES & RELATED WORK
The Web service Description Language (WSDL) [CCMW01] is widely usedespecially for the description of SOAP-enabled Web services. Generally, WSDLdescribes what a service does, that is, the operations the service provides, whereit is located, and how to invoke it. WSDL is based on XML consisting of an ab-
stract part and a concrete part. A service’s interface consisting of operations andcorresponding data types of input and output messages are specified in the ab-stract part by means of a port type. The concrete part binds the abstract port typeto a message encoding protocol and adds a concrete end point address to each porttype.
Although the Web is mainly based on HTTP as the transport protocol, WSDLand SOAP hardly use the features of HTTP at all (e.g. SOAP only uses HTTPresponse codes “200” and “500”). Nevertheless, it is also possible to leveragethe power of HTTP by facilitating all features originally provided by HTTP 1.1in order to describe Web services. Exemplary, the Web Application DescriptionLanguage (WADL) [Had06] describes resources or services that respond toHTTP’s uniform interface by grouping their operations into a single end point.
Discovery
The full potential of reusable loosely-coupled Web services can only be utilizedif there exist mechanisms that enable service providers to publish information onthe capabilities of their service offers and how to access and use them. Servicerequesters should be able to discover adequate services that match their require-ments and the necessary information to bind and invoke them. Service discoveryis the process of querying a service registry and retrieving published Web servicedescriptions that specify the Web service’s properties, its capabilities and how toproperly interact with it. The discovery process can be differentiated in two basictypes, static and dynamic discovery [GSB+02]. Static discovery queries a registryand receives necessary information at design-time while dynamic discovery pro-ceeds these steps during run-time. After having retrieved a set of Web servicesthat match the query criteria, the service requester has to select a service to beinvoked.
The Universal Description, Discovery, and Integration (UDDI) [CHvRR04] isa framework representing a central registry to publish and discover Web servicesin a global and open manner. Information provided by a UDDI registry is three-fold. White pages provide contact information on companies that publish theirservices in a UDDI registry. Yellow pages provide the classification of information
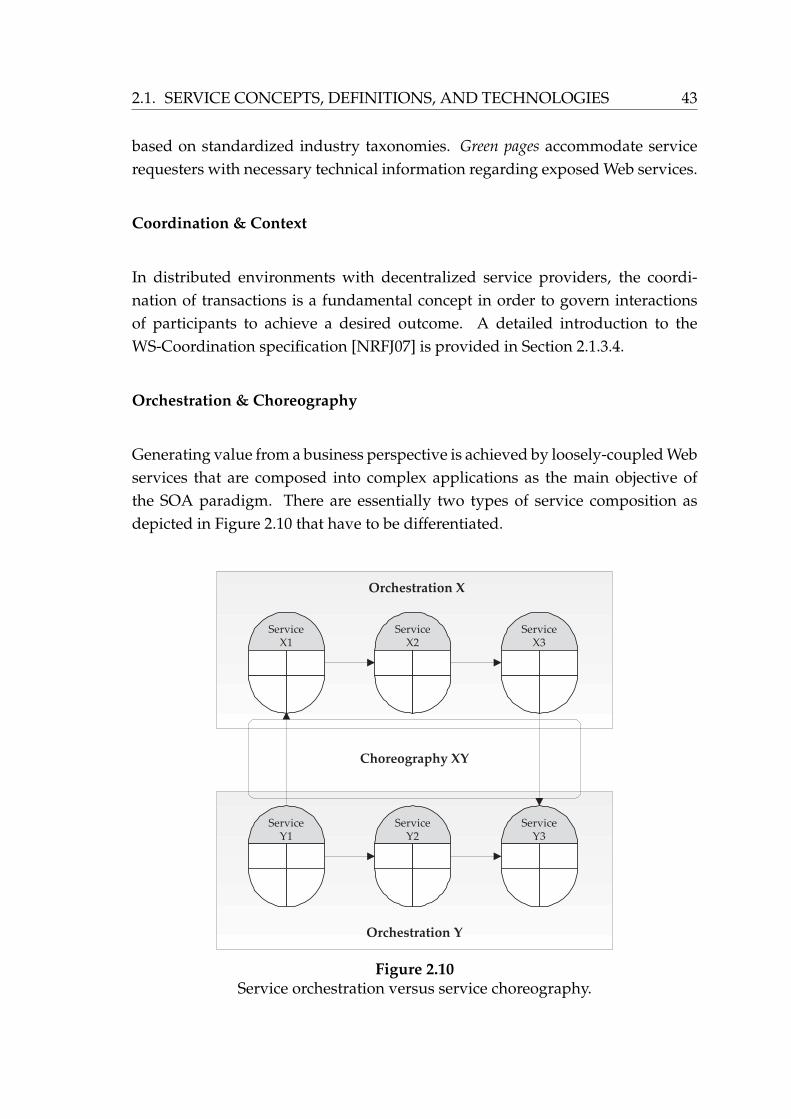
2.1. SERVICE CONCEPTS, DEFINITIONS, AND TECHNOLOGIES 43
based on standardized industry taxonomies. Green pages accommodate servicerequesters with necessary technical information regarding exposed Web services.
Coordination & Context
In distributed environments with decentralized service providers, the coordi-nation of transactions is a fundamental concept in order to govern interactionsof participants to achieve a desired outcome. A detailed introduction to theWS-Coordination specification [NRFJ07] is provided in Section 2.1.3.4.
Orchestration & Choreography
Generating value from a business perspective is achieved by loosely-coupled Webservices that are composed into complex applications as the main objective ofthe SOA paradigm. There are essentially two types of service composition asdepicted in Figure 2.10 that have to be differentiated.
Orchestration X
ServiceX2
ServiceX3
ServiceX1
Orchestration Y
ServiceY2
ServiceY3
ServiceY1
Choreography XY
Figure 2.10Service orchestration versus service choreography.
44 CHAPTER 2. PRELIMINARIES & RELATED WORK
Service orchestration completely describes the composition procedure of inter-nal or external services controlled by a central element. Each service thatis part of an orchestration has a limited scope that restricts its decision ra-dius. Activities that run internally within a service component are transpar-ent and hidden to other services. A specification of a service orchestrationdescribes service components, conditional dependencies and alternativeswithin a composition.
Service choreography is the description of a protocol that defines rules for theinteraction between service components and their function within the com-position. There is no central element to control and assure a correct behaviorof each service component and the composition itself. A service choreogra-phy focuses on the exchange of messages between services components andthe definition of necessary protocols.
In short the difference between service orchestration and choreography canbe narrowed down as follows:
Orchestration defines procedure, choreography defines protocol.
From a business perspective the goal of a service-oriented architecture is toprovide the architectural design that enables a flexible customization of businessprocesses in order to align IT and business. As business processes are volatileand change frequently, service-oriented architectures allow for an ad-hoc adap-tion of business processes according to situational needs and changing marketrequirements. The final process flow is instantiated at run-time, which enablesjust-in-time reflection of real-world business processes in a way that IT alignswith business and not vice versa.
Web service standards such as SOAP, WSDL and UDDI provide means for therealization of relatively simple Web services that fulfill limited tasks by provid-ing adequate functionality. Extending the vision of a loosely-coupled service-oriented architecture that overcomes physical boundaries and enables an inter-and intra-organizational integration of business functionality requires standard-ized formalisms to describe Web service orchestration into business processes andtheir choreography in a seamless manner. A Web service business process describeshow operations are composed out of a set of potential Web services, how theyinteract, share information and what partners are involved in order to create therequired business value.

2.1. SERVICE CONCEPTS, DEFINITIONS, AND TECHNOLOGIES 45
The Web Service Business Process Execution Language (WS-BPEL) [AAA+07]provides a standardized description language for specifying business processescomposed of operations that are exposed by WSDL-based Web services.Hence, WS-BPEL supports service composition models, recursive composition,separation of composability of concerns, stateful conversation and lifecyclemanagement, and recoverability properties [WCL+05]. WS-BPEL mainly con-tains five sections, i.e. the message flow, the control flow, the data flow, the process
orchestration, and the fault and exception handling section as illustrated in Listing2.1.
1 <process name="paymentProcessing" ...>
3 <partnerLinks> ... </partnerLinks>
5 <variables> ... </variables>
7 <correlationSets> ... </correlationSets>
9 <!- Activities -->
11 <faultHandlers> ... </faultHandlers>
13 <compensationHandlers> ... </compensationHandlers>
15 <eventHandlers> ... </eventHandlers>
17 </process>
Listing 2.1: WS-BPEL Structure
The selection of services for composition and for the definition of relationshipsamong services revolves around the notion of partner links. WS-BPEL maintainsthe state of the process and control data which is stored in variables analogousto variables in programming languages which are specified by names and types.Partner links describe a pair of roles which exchange messages and port typesthat the service playing these roles has to implement. Enabling the mapping ofmessages to composition instances, correlation sets can be defined that describehow to correlate messages with concrete instances.
The component model of WS-BPEL consists of basic and structured activities.Structured activities define the actual orchestration whereas basic activities spec-ify the components itself and correspond to the invocation of a WSDL operation.As basic activities, WS-BPEL provides invoke activities, that invoke operations,as well as receive and reply activities which correspond to the receipt of a client’smessage and to the reply in response to an operation invoked. Structured activi-ties however are capable of defining more sophisticated process logic by combin-
46 CHAPTER 2. PRELIMINARIES & RELATED WORK
ing other activities (basic and structured). Constructs of structured activities aresequences, switches, picks, whiles and flows.
Providing means for exception handling, fault handlers define how certainexceptions should be managed. fault handlers specify a catch element whichdefines the fault it manages and the corresponding activity that is triggered incase an exception occurs. Combining exception handling and transactional tech-niques, compensation handlers define the logic required to undo the execution ofactivities as a compensation. In contrary to the try-catch-approach, event han-dlers continuously monitor certain events and define activities to be triggered incase that particular event occurs.
2.1.3.3 Quality of Service (QoS)
The value generated by a service is mainly embodied through intangible elementsexposed at execution (cp. service characteristic C 2.4). Therefore, a service con-sumer expects a service to function reliably and to deliver a consistent outcomeat a variety of levels, i.e. quality of service (QoS). To provision, control and as-sure QoS it requires not only for focus on functional properties of a service butalso on non-functional aspects. The context of a service also influences its qual-ity, which is experienced by the consumer, e.g. the partner network that comeswith a service, its reputation in certain communities or advertisement campaignspromoting the service. From an economic perspective, QoS is the most importantcharacteristic that differentiates service offerings and leverages market advan-tage, as price competition is tough due to low variable costs of service provision-ing. Thus, QoS is the key criterion to keep the business side competitive as it hasserious implications on the provider and consumer side [Pap08]. The provisionof services with a defined QoS over electronic networks such as the Web is chal-lenging due to issues like infrastructure problems, unpredictable reliability, lowperformance of Web protocols and many more. In addition, the distributed na-ture of Web service environments and their high degree of complexity requires acomprehensive description of Web service quality characteristics, both functionaland non-functional. The main aspects of QoS in a Web service context, which arepartly derived from [MN02, ZBD+03, LNZ04, CSM+04, Pap08] are as follows:
Availability Service availability is the likelihood of absence of downtime, i.e. theprobability that a service is available for invocation. Small values indicatean unpredictability of the service to be accessible at a certain point of time.This probability can be estimated by incorporating historical data on a ser-
2.1. SERVICE CONCEPTS, DEFINITIONS, AND TECHNOLOGIES 47
vice’s downtime. The ration of observed average downtime and total timeof potential availability results in an estimated probability of unavailabilityfor the future, whereas the probability of the complementary event reflectsan estimated probability of availability of a service.
Reliability Service reliability refers to the characteristic to function correctly andconsistently, i.e to produce the desired outcome or result. This is usuallyexpressed in transaction failures over a defined period of time. It can be bemeasured using historical data of previous invocations and a correspondingsuccessful delivery.
Scalability The ability to service requests independently of volume is referredto as the scalability of a service. Scalability is important in periods withhigh peaks of demand with uncertain occurrence and hardly predictablepatterns.
Performance The service quality aspect performance consists of two parts,throughput and latency. A service’s throughput refers to the number of re-quests that can be served at a defined time period. Latency of a service is thetime between sending a request and receiving the outcome or result. Thismeans that high throughput and low latency characterize a service with ahigh degree of performance.
Security As Web services are usually provided over the Internet, security is animportant issue for service providers and consumers. Especially in orderto represent long-lived mission-critical business transactions that involveprivate business information, Web services must fulfill serious security re-quirements such as access control (authentication, authorization), confiden-tiality, and integrity of information.
Reputation The reputation of a service is a measurement of its trustworthiness.The value creation of a service is mostly dominated by intangible elementsand is therefore subjective to the individual that experiences a service’s out-come. As the sum of individual experiences is a suitable indicator for ser-vice quality, reputation is an important aspect that takes consumers’ expe-riences and opinions into account25.
An agreement between service provider and service consumer about the QoSto be delivered must be founded on a legal basis, i.e by specifying a service level
25A star ranking mechanism is a possible solution to capture consumers’ valuations for a ser-vice. An example can be found at http://aws.amazon.com/.

48 CHAPTER 2. PRELIMINARIES & RELATED WORK
agreement. A service level agreement is a contract that defines mutual under-standings and expectations of a service between service provider and service con-sumer [JMS02]. It defines service characteristics and the quality to be deliveredby the provider and monetary penalties in case of non-performance. Such a con-tract represents a guarantee for the service consumer, which assures the deliveryof the defined quality or an adequate charge-back mechanism.
Depending on the frequency by which a service level agreement can be rede-fined and adapted according to changed requirements or conditions, two typesof service level agreements can be differentiated, static and dynamic service levelagreements. Static service level agreements generally remain unchanged for along period of time or multiple service time intervals. The quality of situa-tional and short-termed Web services is covered by dynamic service level agree-ments that change from period to period. This type of service level agreementis inevitable in highly dynamic environments where Web services are composedand provisioned on-demand and roles of service provider and consumer changequickly.
2.1.3.4 Web Service Coordination
Environments in which distributed units provide functionality in a loosely-coupled manner (according to the SOA paradigm) require some sort of processor set of rules to align activities in order to generate a desired outcome, i.e. theyrequire coordination. The objective of coordination is to make a set of entities –either by providing incentives or establishing constraints upon them – pursue acommon goal, e.g. producing a defined outcome.
Definition 2.7 [COORDINATION]. Coordination is managing the dependencies of ac-
tivities.26
Coordination can be formalized by designing adequate mechanisms, i.e sets ofrules that govern the interaction between the various entities. Coordination isthe key instrument to organize multiple activities especially in distributed en-vironments. In the context of Web services two specifications provide frame-works to implement coordination scenarios, WS-Coordination [NRFJ07] and WS-CF [CNLP05]. This section focuses on WS-Coordination as it is a finalized stan-dard in contrary to WS-CF, which is still a public review draft. A detailed com-
26The definition of coordination is based on [MC94] and is consistent with literature from or-ganization theory [Gal73]
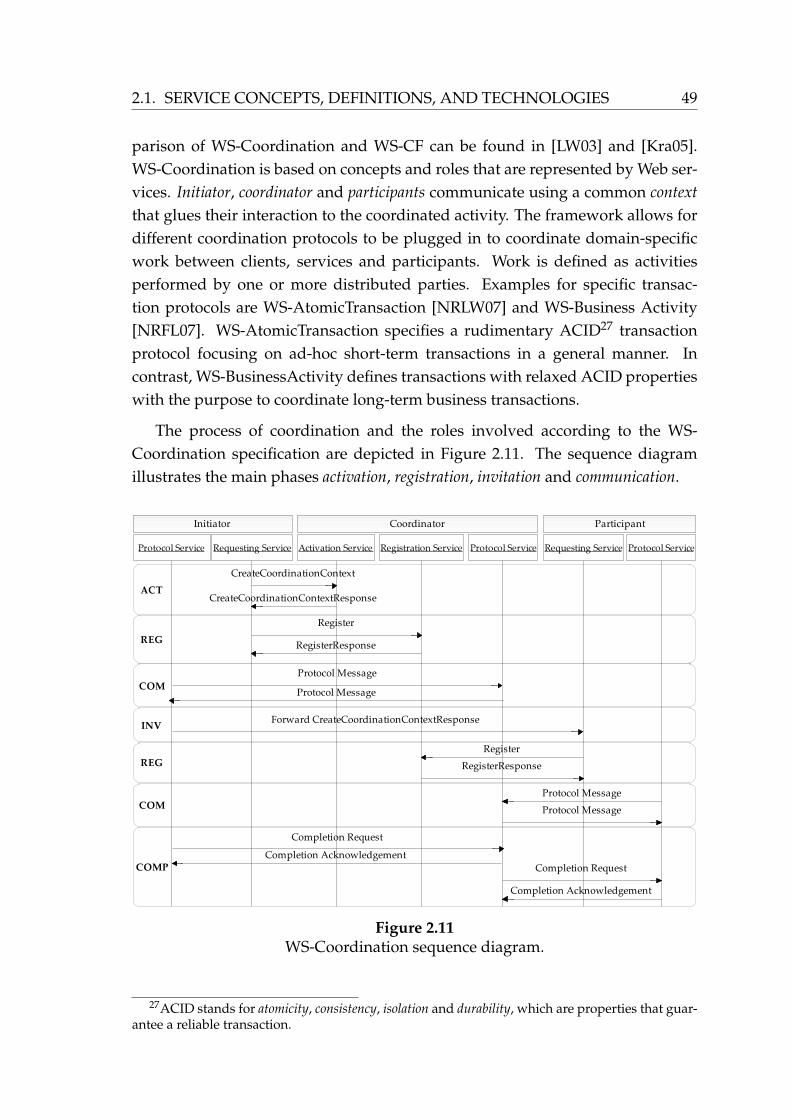
2.1. SERVICE CONCEPTS, DEFINITIONS, AND TECHNOLOGIES 49
parison of WS-Coordination and WS-CF can be found in [LW03] and [Kra05].WS-Coordination is based on concepts and roles that are represented by Web ser-vices. Initiator, coordinator and participants communicate using a common context
that glues their interaction to the coordinated activity. The framework allows fordifferent coordination protocols to be plugged in to coordinate domain-specificwork between clients, services and participants. Work is defined as activitiesperformed by one or more distributed parties. Examples for specific transac-tion protocols are WS-AtomicTransaction [NRLW07] and WS-Business Activity[NRFL07]. WS-AtomicTransaction specifies a rudimentary ACID27 transactionprotocol focusing on ad-hoc short-term transactions in a general manner. Incontrast, WS-BusinessActivity defines transactions with relaxed ACID propertieswith the purpose to coordinate long-term business transactions.
The process of coordination and the roles involved according to the WS-Coordination specification are depicted in Figure 2.11. The sequence diagramillustrates the main phases activation, registration, invitation and communication.
Figure 2.11WS-Coordination sequence diagram.
27ACID stands for atomicity, consistency, isolation and durability, which are properties that guar-antee a reliable transaction.

50 CHAPTER 2. PRELIMINARIES & RELATED WORK
Activation The WS-Coordination framework exposes an activation service that isresponsible for the creation of specific coordinator instances with concreteprotocols and associated context. To start a coordination process, the initia-tor sends a CreateCoordinationContext message to the endpoint ofthe activation service in an asynchronous manner. The coordinator eitherreplies with a CreateCoordinationContextResponse message or anerror message. A CreateCoordinationContext message has the fol-lowing structure:The CoordinationType points to a uniform resource identifier that speci-
1 <CreateCoordinationContext ...>
2 <CoordinationType> ... </CoordinationType>
3 <wsu:Expires> ... </wsu:Expires>
4 <CurrentContext> ... </CurrentContext>
5 ...
6 </CreateCoordinationContext>
Listing 2.2: Structure of aCreateCoordinationContext Message
fies the type of coordination to be used in the coordination process (e.g. WS-AT, WS-BA). wsu:Expires is an optional argument that defines a time-outvalue for the corresponding coordination context. The semantic of this ar-gument depends on the coordination type used. The CurrentContext
argument is also optional and can be used to hand over an existing context(activity import). In this case, the coordinator participates at the runningactivity instead of creating a new context.
In case the activation is successful, the coordinator replies asynchronouslywith a CreateCoordinationContextResponse message that is struc-tured as follows:The CoordinationContext consists of a unique Identifier that guar-
1 <CreateCoordinationContextResponse ...>
2 <CoordinationContext>
3 <Identifier> ... </Identifier>
4 <CoordinationType> ... </CoordinationType>
5 <RegistrationService> ... </RegistrationService>
6 </CoordinationContext>
7 </CreateCoordinationContextResponse>
Listing 2.3: Structure of aCreateCoordinationContextResponse Message
antees a well-defined mapping from message to activity. The argumentCoordinationType defines the type of coordination. The actual endpointreference to the registration service exposed by the coordinator is specified

2.1. SERVICE CONCEPTS, DEFINITIONS, AND TECHNOLOGIES 51
using WS-Addressing [BCC+04] in the RegistrationService section.The registration service is responsible for handling registration requestsfrom participants that intent to participate in the activity.
Registration Once a coordinator has been activated by the activation ser-vice, a registration service is exposed that allows for participants toregister for being part of the activity and to send – if this is supportedby the coordination protocol – and receive protocol messages. Via theCoordinationContextRespond message, the initiator receives andendpoint reference to the registration service. By sending a Register
message to this uniform resource identifier, the initiator’s registrationis confirmed by the coordinator with a RegisterRespond message.The RegisterRespond message contains and endpoint reference to theprotocol service of the coordinator that is responsible for managing thecommunication between participating roles. A Register message isstructured as follows:The ProtocolIdentifier argument specifies the coordination protocol
1 <Register ...>
2 <ProtocolIdentifier> ... </ProtocolIdentifier>
3 <ParticipantProtocolService> ... </ParticipantProtocolService>
4 ...
5 </Register>
Listing 2.4: Structure of a Register Message
that is supported by the chosen coordination type of the coordination con-text. An endpoint reference to the protocol service of the initiator is definedin the ParticipantProtocolService section as the destination forfurther communication. In case of a successful registration, the coordinatorsends a RegisterRespond message to the initiator that is structured asfollows:The registration response message contains the endpoint ref-
1 <RegisterResponse ...>
2 <CoordinationProtocolService> ... </CoordinationProtocolService>
3 ...
4 </RegisterRepsonse>
Listing 2.5: Structure of a RegisterResond Message
erence to the protocol service of the coordinator in theCoordinationProtocolService section.

52 CHAPTER 2. PRELIMINARIES & RELATED WORK
Invitation Recall, the CreateCoordinationContextResponse messagecontains the endpoint reference to the registration service of the coordina-tor and can therefore be used as an invitation or call for participation. Byforwarding the message to potential participants they obtain the possibilityto register for the activity at hand. Although the initiator normally invitesfurther participants, one can think of multiple scenarios with different rolesto be the inviting party in the process. The coordinator can step into therole of pushing the invitation process using a UDDI registry to find suit-able participants. It is also possible to reverse the roles in such a lookupscenario, meaning that potential participants are proactively searching forsuitable coordination services. Potential participants could also subscribeto a notification service – analogue to the observer design pattern – usingthe WS-Notification [GNC+04] specification in order to automatically beinformed if an adequate coordination service is available.
Communication Initiator and participants share common knowledge about theendpoint reference of the coordinator’s protocol service. Depending on thecoordination type and the activity that is realized by the coordination pro-cess, initiator and participants use the protocol service of the coordinator toexchange messages in an asynchronous manner. The registration phase alsoprovides the coordinator with the necessary address information about theactive parties to be able to respond to incoming messages.
Completion Termination of the coordination process is usually initiated by theinitiator. The initiator sends a completion request message to the coordina-tor that acknowledges the request by a completion acknowledge message.The coordinator informs all registered participants by sending a comple-tion request message. A confirmation of each registered participant is thenresponded as a completion acknowledge message back to coordinator.
Example 2.3 [WS-COORDINATION COMPLIANT REVERSE AUCTION]. To illus-
trate the specification of a coordination model according to the WS-Coordination frame-
work, an auction mechanism is introduced as a special type of coordination, i.e a single
item sealed bid reverse auction. There is one buyer that intents to procure a single good or
service from multiple sellers. The auction conduction including the type of messages to
be exchanged between the participants is specified by auction rules which are controlled
and enforced by an auctioneer. The mapping between roles and entities in a reverse
auction and a coordination model is depicted in Figure 2.12.
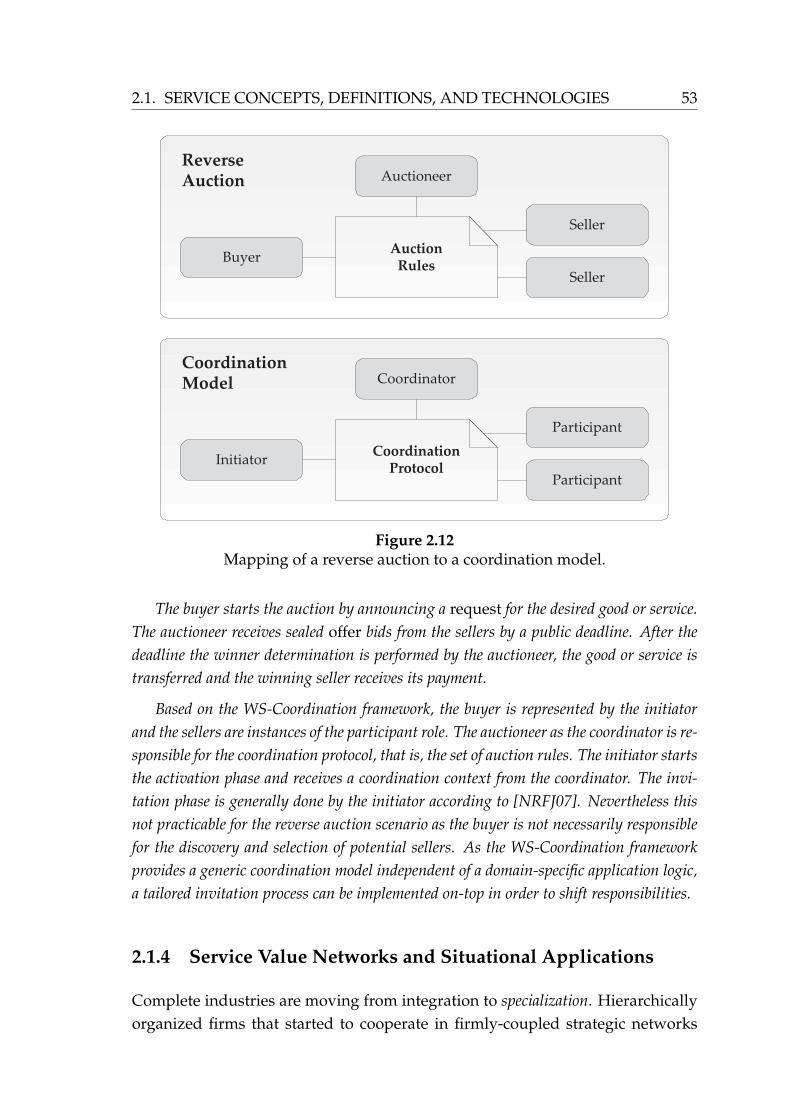
2.1. SERVICE CONCEPTS, DEFINITIONS, AND TECHNOLOGIES 53
Reverse Auction Auctioneer
Buyer
Seller
Seller
Coordination Model Coordinator
Initiator
Participant
Participant
AuctionRules
CoordinationProtocol
Figure 2.12Mapping of a reverse auction to a coordination model.
The buyer starts the auction by announcing a request for the desired good or service.
The auctioneer receives sealed offer bids from the sellers by a public deadline. After the
deadline the winner determination is performed by the auctioneer, the good or service is
transferred and the winning seller receives its payment.
Based on the WS-Coordination framework, the buyer is represented by the initiator
and the sellers are instances of the participant role. The auctioneer as the coordinator is re-
sponsible for the coordination protocol, that is, the set of auction rules. The initiator starts
the activation phase and receives a coordination context from the coordinator. The invi-
tation phase is generally done by the initiator according to [NRFJ07]. Nevertheless this
not practicable for the reverse auction scenario as the buyer is not necessarily responsible
for the discovery and selection of potential sellers. As the WS-Coordination framework
provides a generic coordination model independent of a domain-specific application logic,
a tailored invitation process can be implemented on-top in order to shift responsibilities.
2.1.4 Service Value Networks and Situational Applications
Complete industries are moving from integration to specialization. Hierarchicallyorganized firms that started to cooperate in firmly-coupled strategic networks
54 CHAPTER 2. PRELIMINARIES & RELATED WORK
with stable inter-organizational ties recently explore the benefits of exploitingmore loosely-coupled configurations of legally independent firms. In theory,complex products or services can be produced by a single vertically integratedcompany. However, doing so, the company cannot focus on its core competen-cies since it has to cover the whole spectrum of the value chain. Also, it has toburden all the risks in a complex, changing and uncertain environment by itself.
2.1.4.1 Networks as a Type of Governance Form
As a consequence, business networks (BNs) have been proposed as the supe-rior governance form for today’s highly dynamic and complex business world[MS86]. Business networks evolve from a pool of potential horizontal as well asvertical business partnerships. In this respect they differ both from strategic al-
liances, comprising only horizontal business partners, and supply chains, denotingpurely vertical relationships. The advantages of business networks compared tomore traditional governance forms are manifold:
• Insurance against uncertainty in demand and supply.
• Balancing adaptability to highly complex tasks while maintaining control.
• Protection of business knowledge through modularization.
• Market-based forces as coordination mechanism to ensure efficiency.
A bulk of managerial and academic literature deals with variations of suchbusiness networks, whose complete characterization would be far beyond thescope of this section. In this section, Service Value Networks (SVNs) as a specialtype of business networks are identified and the differences to related organiza-tional forms, which are to described in the following are described.
Virtual Organizations (VOs) are temporary networks of independent enter-prises that bring in complementary competencies and resources for mutual ben-efit [DM93]. Virtual organizations stress the complementarity of firms’ core com-petencies in the value creation process and the temporary nature of the interac-tion. However, virtual organizations often suffer from trust related problems andare therefore usually constituted among firms in a closed pool of known networkpartners.
Smart Business Networks (SBNs) are one way beyond the virtual organiza-tion framework and particularly stress the smart use of information and com-munication technology (ICT) as a facilitator to network interaction. Smartness is
2.1. SERVICE CONCEPTS, DEFINITIONS, AND TECHNOLOGIES 55
thereby a relative term, which refers to effectiveness and a comparative advan-tage through the use of ICT. Moreover, ICT is also seen as an enabler of networkagility, i.e. the network’s ability to “rapidly pick, plug, and play” business pro-cesses [vHV07]. Furthermore, nodes in a smart business network need to meetspecific requirements in order to be ready to contribute to ad-hoc joint value cre-ation. This modularity of potential network members allows not only for sponta-neous network orchestration, but also for better protection of a firm’s core com-petencies as compared to virtual organizations. Trust problems are thus not assevere and the smart business networks may therefore recruit members from amore open pool of potential partners. The instantiations of smart business net-works are also more short-lived than those of virtual organizations. However,like in virtual organizations, the network pool itself is sustainable over time.
Business Webs are defined as “customer-centric, hetrarchical organizationalforms that consisting of legally independent but economically interdependentspecialized firms that co-opetitively contribute modules to a product systembased on a value-enabling platform under the presence of network externali-ties which are supported by extensive usage of information and communicationtechnologies.” [Ste04]. Business Webs stress the internet as the primary channelfor business communications [TLT00]. Moreover, the so-called “shaper-adapterconfiguration” is an important assumption: A shaper (i.e. a focal company ornucleus) controls the central element in a business web, while adapters (i.e. con-text providers) add complementary elements. A closely related field of researchconsiders Business Ecosystems whose quintessence is each participant’s ultimateconnection to the fate of the network as a whole [IL04].
In this context, service value networks are a special type of smart business net-works with features of business webs. They exhibit the crucial features of smartbusiness networks, such as the smart use of ICT, agility, ad-hoc value creationand sustainability of the network pool. With respect to business webs, servicevalue networks share the feature of being enabled through ubiquitously avail-able ICT, foremost the Internet. However, service value networks are distinct tobusiness webs because they do not follow the shaper-adapter paradigm and arerather constituted by market-based composition from an open pool of networkpartners.
2.1.4.2 Service Value Networks
Companies tend to engage in networked value creation, which allows partic-ipants to focus on their strengths. Partners in such ecosystem-like environ-

56 CHAPTER 2. PRELIMINARIES & RELATED WORK
ments can leverage the know-how and capital assets of partners, at the sametime spreading risk and sharing investment cost. Focusing on core competenciesdoes not put constraints on the company or limit its reach. In contrary, by re-aggregating with partners, a network of companies can broaden its range of cus-tomer attraction. Especially in complex and highly dynamic industries, formingsuch open networks is more than an attractive strategic alternative. Service valuenetworks bring together mutually networked, permanently changing, legally in-dependent actors in customer centric, mostly heterarchical organizational formsin order to create joint value for customers. Specialized firms co-opetitively con-tribute modules to an overall value proposition under the presence of networkexternalities.
There is still only few research in the context of service value networks, es-pecially regarding attempts to provide a definition. Service value networks areconstituted by loosely-coupled formations of companies that provide modular-ized services while concentrating on their core competencies. These Web-enabledservices expose standardized interfaces and foster an ad-hoc composition in or-der to jointly generate added value for customers in an on-demand fashion. Thisargumentation leads to the following definition:
Definition 2.8 [SERVICE VALUE NETWORK]. Service value networks are goal-
oriented business networks, which provide business value through the agile and market-
based composition of complex services from a steady, but open pool of complementary as
well as substitutive standardized service modules by the use of ubiquitously accessible
information technology.
To foster a fundamental understanding of the service value network concept,Figure 2.13 depicts the main components and their interdependencies in a sim-plified manner.
A service value network consists of a set of service providers (s ∈ S) that sup-ply a portfolio of service offers (v ∈ V) that provide specified functionality. Eachservice provider can own one or multiple service offers, indicated by an owner-
ship relation. The example in Figure 2.13 shows a service value network with fourservice offers (v1,v2,v3,v4) that are owned by three service providers (s1, s2, s3).Service offers that are substitutes – which provide roughly similar functionality –are clustered in candidate pools (Y ∈ Y). A candidate pool is a set of potential ser-vice offers that are substitutes and can therefore be replaced on-demand. Serviceoffers that are compatible, this is, they are interoperable regarding their interfacesand input and output capabilities, expose a directed composition relation. Service

2.1. SERVICE CONCEPTS, DEFINITIONS, AND TECHNOLOGIES 57
Caption
Composition Relation
Source Node
Sink Node
Service Offer
1v
Candidate Pool
Complex Service
1s
2s
3s
2v
3v
4v
aY b
Y
Service Provider
OwnershipRelation
v
s
Y
Figure 2.13Service value network model.
offers – clustered into candidate pools – and their connections form a graph-likestructure that is directed and a-cyclic starting from a source node and ending ata sink node. Each feasible connected set of service offers within this graph iscalled a path and represents a possible instantiation of a complex service consistingof functionality from each candidate pool. According to the example in Figure2.13, a complex service can be instantiated either by a composition of v1 and v2 orv1 and v4 or v3 and v4.
Service Providers and Service Offers The number of service providers offeringvarious types of utility, elementary and complex services in ecosystem-likeenvironments is constantly increasing.
Exemplarily, Amazon offers utility services based on their infrastructure asa computing and a storage service called Elastic Compute Cloud (EC2)28
and Simple Storage Service (S3)29 that are accessible and manageablethrough simple highly standardized interfaces based on REST and WSDL.In most cases, such cloud computing infrastructures are organized in acluster-like structure facilitating virtualization technologies. Nevertheless,there are service providers that focus on offering computing on-demand
28http://aws.amazon.com/ec2/29http://aws.amazon.com/s3/
58 CHAPTER 2. PRELIMINARIES & RELATED WORK
through a server Grid such as the Sun Grid Computing Utility30. Amongproviding pure utility services, providers such as RightScale31 often enrichtheir offerings through value-added elementary services for managing theunderlying hardware (i.e. scaling, migration) that are accessible via Webfront-ends.
Service providers such as StrikeIron32 offer a comprehensive portfolio ofelementary and complex Web services that provide functionality in the con-text of communications, customer relationship management (CRM), dataenhancement, e-commerce, finance, and marketing. Especially in the finan-cial sector, companies (e.g. Xignite33) sell Web services providing financialinformation such as real-time stock quotes, options, historical data, com-modity prices, mutual funds, currency rates, and financial market indices.
Nevertheless, not only rather simple, but also complex services supportingmulti-step business processes are offered modularized in an on-demandfashion. For instance, providers like salesforce.com34 or Netsuite35 suc-cessfully entered the business software ecosystem with their entirely Web-based on-demand customer relationship management (CRM) suites. Com-ponents offered within these suites can be dynamically composed to cus-tomized complex services. AppExchange36, the service marketplace offeredby salesforce.com, offers a range of pre-integrated complementary servicesprovided by third-party vendors grouped around the core service SalesforceCRM.
Service Requester The open and dynamic character of service value networksenables customers to request customized complex services from whateverservice value network they prefer that satisfy their needs and match marketrequirements. Service requesters creatively create their complex services bycomposing adequate service components from multiple candidate pools ina plug-and-play fashion in order to receive added value. By concentratingon their core competencies, companies are not forced to provide solutionscovering the whole range of a business process but they are able to com-plement their service portfolio by requesting complex services from servicevalue networks (cp. Example 2.1).
30http://www.network.com/31http://www.rightscale.com/32http://www.strikeiron.com/33http://www.xignite.com/34http://www.salesforce.com/35http://www.netsuite.com/36http://www.salesforce.com/appexchange/

2.1. SERVICE CONCEPTS, DEFINITIONS, AND TECHNOLOGIES 59
Candidate Pool The structure of service value networks, characterized by theirparticipants and their interrelations, is not static and predefined but formedon-demand in a short term, goal-oriented fashion. The formation processrequires a steady pool of distributed and loosely-coupled service providersthat offer predefined functionality through modularized services to beready on call. In order to participate in service value networks, i.e. partici-pate in candidate pools to be ready for service provision, service providersmust register at a central registry and satisfy a set of minimum requirementssuch as interoperability through well-defined interfaces based on Internetstandards. The process of registration can be activated by switching initia-tors, meaning that also an operator of a central registry might query andproactively invite suitable service providers to join a candidate pool. Theopen character of service value networks allows any service provider to po-tentially participate in value creation as long as minimum requirements aremet.
Candidate pools group service offers of multiple service providers by func-tionality and capabilities exposed. Service offers covering the same spec-trum of functionality (e.g. login/ID services such as OpenID37 and GoogleAccounts38,39) are categorized in identical candidate pools. These servicesare replaceable and represent service substitutes form an economic perspec-tive. The actual formation process occurs when a concrete service requestis addressed to the loosely formation of service providers. Based on the re-quired functionality and capabilities described by the request, feasible can-didate pools are iteratively arranged in a way that they together contain thepotential to jointly generate desired value. A coordination mechanism isrequired to chose a single service offer from each candidate pool based on aset of rules in order to efficiently instantiate the requested complex serviceto be provided to the service requester.
Complex Service The final outcome that is produced by a service value networkis realized through a sequence of modularized service offers from a set ofiteratively arranged candidate pools (cp. Figure 2.13), that is, a complexservice. This final outcome is the added value generated for the servicerequester. The concept of a complex service, its characteristics and the wayit is composed is explained in detail in Section 2.1.2.3.
37http://openid.net/38https://google.com/accounts/39Note that the Google Accounts service is not an adequate candidate to participate in an ser-
vice value network in a strict sense, as it is proprietarily bound to Google services and does notexpose a well-defined interface to be accessed in an open manner.
60 CHAPTER 2. PRELIMINARIES & RELATED WORK
Coordination Mechanism In environments with distributed, self-interested en-tities that jointly contribute to an overall goal, mechanisms are needed thatcoordinate procedures from multiple parties with possibly colliding objec-tives. Service value networks are a prominent example of such complexenvironments and their success therefore highly depends on adequate andefficient coordination mechanisms. As already mentioned in Section 2.1.3.4,coordination is managing the dependencies of activities. It is obvious that thereexist various facettes of coordination forms that have to be chosen accordingto the characteristics and requirements imposed by the type of environment.The continuum of coordination ranges from market-based approaches tohierarchical control and dictatorships [Tho91, MC94]. Market-based ap-proaches manage the activities of distributed, self-interested entities onlyindirectly by institutionalizing a rule set that incentivizes market partici-pants to act in a desired manner in order to achieve an overall goal. Actorsand dependencies of their activities are managed ’invisible’ and ’unseen’driven by rational behavior of utility-maximizing economic entities and in-centivized by rules to perform a social choice and compensate the entities’efforts. Nevertheless, there are situations in which this ’liberal’ form of co-ordination results in inefficient outcomes. In this case, the economic entitiesneed to be consciously organized in hierarchical forms to streamline activi-ties in an efficient manner.
The problem of efficiently choosing adequate service offers from candidatepools to instantiate a complex service that meets the requirements imposedby the service requester is a traditional problem of coordination. Serviceproviders are self-interested, act rational and therefore try to maximize theirutility without accounting for a system-wide solution (e.g. a solution thatmaximizes welfare). Thus, the design of adequate coordination mecha-nisms is crucial to the efficiency and success of a service value network.
Example 2.4 [SVN REALIZING A CRM COMPLEX SERVICE]. This example shows
the formation of a service value network that is ready to instantiate a complex service
based on the requirements imposed by a service request. A service requester requires a
complex service that scans calendar entries within the upcoming week with regard to
future meetings within a company. Based on the the meetings’ descriptions, the complex
service queries soft skills of all meeting participants by browsing their profiles in social
communities. Gathered information is then updated in a CRM data base that is stored by
on-demand storage infrastructure (Figure 2.14).

2.1. SERVICE CONCEPTS, DEFINITIONS, AND TECHNOLOGIES 61
Salesforce
Facebook LinkedIn
Amazon
GoogleCalendar
FacebookBrowser
LinkedInBrowser
S3
App Engine
Caption
Composition Relation
Source Node
Sink Node
Service Offer
Service Provider
OwnershipRelation
Strategic Alliance
Figure 2.14Example of a service value network realizing a CRM complex
service.
A set of service providers participates in the service value network by offering services
grouped in candidate pools. Google offers its Google Calendar service40 and Google App
Engine41 which provides a scalable infrastructure for service development and storage.
The social community platforms Facebook42 and LingedIn43 provide services to browser
profiles of registered users. Amazon offers flexible storage capabilities through its Simple
Storage Service (S3)44. As depicted in Figure 2.14 the requested complex service can be
realized in four different versions by selecting feasible service combinations (e.g. Google
Calendar, LinkedIn Browser and Amazon S3).
This example shows that service value networks foster the ad-hoc creationof short-living complex services that fulfill individual needs of a variety of con-sumers. This type of complex service is also called service mashup or situationalapplication. The following section introduces fundamentals of situational appli-cations and service mashups, explains their role within service-ecosystems, andintroduces key principles they are based on.
40http://google.com/calendar41http://code.google.com/appengine/42http://facebook.com/43http://linkedin.com/44http://aws.amazon.com/s3/

62 CHAPTER 2. PRELIMINARIES & RELATED WORK
2.1.4.3 Situational Applications and Service Mashups
Competitive forces in today’s markets result in the fact that dealing with changeis a necessity for companies. This needs to be exploited and enabled by achievingflexibility in the organization and IT infrastructure [Eva91, GS06, AB91]. Flex-ibility is mainly concerned with the quick development of new applications tosupport changing business processes. In the past, IT departments have fallenshort to satisfy the demand for new applications. Typically, situational applica-tions that are needed only for a limited time span never made it into realizationin favor of strategically important applications as part of the development back-log. Nowadays, most of the efforts of the IT departments are devoted to main-tenance leaving many application wishes unfulfilled. With the advent of Web2.0 technologies and the renaissance of HTTP appreciation, the possibilities tobuild “good enough” applications have greatly increased and traditional roles ofservice provider and service consumer blur.
A so-called service mashup is an application or Web site that aggregates con-tent such as data feeds, applications, widgets, or gadgets from different sources[Mer06]. The number of publicly available mashups is dramatically increas-ing and can be checked at programmableweb.org45. While the first mashupswere dedicated to small consumer mashups, where simple data (e.g. RSS feeds[BDBD+00]) is integrated in the Web browser, mashup technology promises tointegrate enterprise applications. In fact, mashups can be considered to providesolutions for the long tail of applications [And06].
As depicted in Figure 2.15, standard applications (such as ERP modules) arestandardized, but need customization. This mass market exhibits only small de-grees of customization but enjoys demand by many customers, i.e. volume busi-
ness. Software companies have been exploiting these market segments. However,there is also a long tail of applications, which require highly specialized features– accordingly, this highly specialized software cannot be offered to many cus-tomers in scalable manner. It is thus not astonishing that these segments aroundthe long tail have so far not been exploited. Summarizing, the long tail of appli-cations is very fat in a sense that the demand for customized and quality differ-entiated software is immense, i.e. value business. Due to the diversified demandthere are numerous, hitherto unexploited niche markets, where the project set-upcosts exceed the benefit.
45http://programmableweb.org/

2.1. SERVICE CONCEPTS, DEFINITIONS, AND TECHNOLOGIES 63
Situational/Tailored (Service Mashups)
Off-the-Shelf(SaaS)
Dem
and
Service Customization
Mass Market Niche Market
Sat
isfa
ctio
n
Figure 2.15Situational applications address the long tail of business.
With the technology of mashups, it is now possible to exploit the long tail ascustomization becomes cheaper through the aggregation of small services. Bigand RESTful Web services encapsulate functionality and put it behind clearlydefined interfaces based on SOAP, WSDL and HTTP respectively. Typically, itis distinguished between consumer, data and enterprise mashups. In fact, con-sumer mashups combine data elements from different sources and hides them be-hind a simple GUI (e.g. TuneGlue being an interactive visualization of the musicartists available at Last.fm46 which is linked with Amazon customer data). Datamashups combine data streams from different sources into one single data feedwith one dedicated user interface attached to it. Enterprise mashups integratedata and other services (e.g. infrastructure services) from internal and externalsources creating composite Web applications. Because of the simplicity in settingup composite applications, mashup technologies are expected to evolve signifi-cantly. Fierce competition and the corresponding needs for applications coercecompanies into imperatives of the modern service-oriented economy that opensup the long tail of strong differentiation of their service offerings, and customer-centricity in the creation of services.
Service mashups also allow end-users to create customized applications bycombining content, presentation functionality and business logic from heteroge-neous sources using lightweight Web technologies. Through the extensive reuse
46http://lastfm.com/

64 CHAPTER 2. PRELIMINARIES & RELATED WORK
of existing resources and simple programming models mashups facilitate the ad-hoc development of highly situation-specific applications which are often usedfor a short time only. Mashups therefore support the long tail of business, whichcannot be served by traditional off-the-shelf software. Situational applicationsembody the next step in service-oriented computing and their ease of use heraldsthe next generation of flexibly recombined services. The following principles en-compass the key innovation of situational applications:
Principle 2.1 [SIMPLIFICATION AND STANDARDIZATION]. Service mashups and
the way they are developed is a prominent result of a clear trend towards the simplifica-
tion and standardization. Even complex services are increasingly exposed in the manner
of puristic service descriptions and interfaces. As explained in Section 2.1.3.2, REST-
ful architectural styles leverage the power of the highly standardized and interoperable
HTTP protocol. HTTP methods (e.g. GET, DELETE and CREATE) are used to build the
most elementary signatures encapsulating scalable functionality in a distributed fash-
ion. Unlike heavy-weight RPC-style architectures with high XML payload and complex
programming-language-like interfaces, RESTful Web services are founded on unified in-
terfaces based on HTTP methods and scoping information encoded in the service’s URI.
Principle 2.2 [LIGHTWEIGHT COMPOSITION AND FLEXIBLE BINDING]. Puristic
Web APIs such as REST and other lightweight approaches to Web service protocols and
messages formats (e.g. JSON) enable ad-hoc composition and flexible binding of replace-
able services [Jhi06]. Situational applications mostly focus on simple data manipulation
and can therefore be piped sequentially. Well-defined building blocks as components of
these sequences can be composed, decomposed and rearranged dynamically and enable
demand-driven customization and satisfaction of individual consumer needs. A high de-
gree of standardization regarding service interfaces allows for the specification of reusable
service blueprints that define a skeleton of service mashups. Service components within
these blueprints can be bound and instantiated at run-time as they are replaceable and
puristic in nature.
Principle 2.3 [MASS COLLABORATION AND CUSTOMIZATION]. The central prin-
ciple of a continuous development of situational applications is collaboration and cus-
tomization [Mul06]. Participants are part of a mass co-production process that blurs
the border between creation and consumption. Users contribute their individual knowl-
edge about the existence, capabilities and compatibilities of feasible service components to
service mashup models. A high degree of customization and self-selection continuously
generates new demand and satisfies niche markets in the long tail [And06].
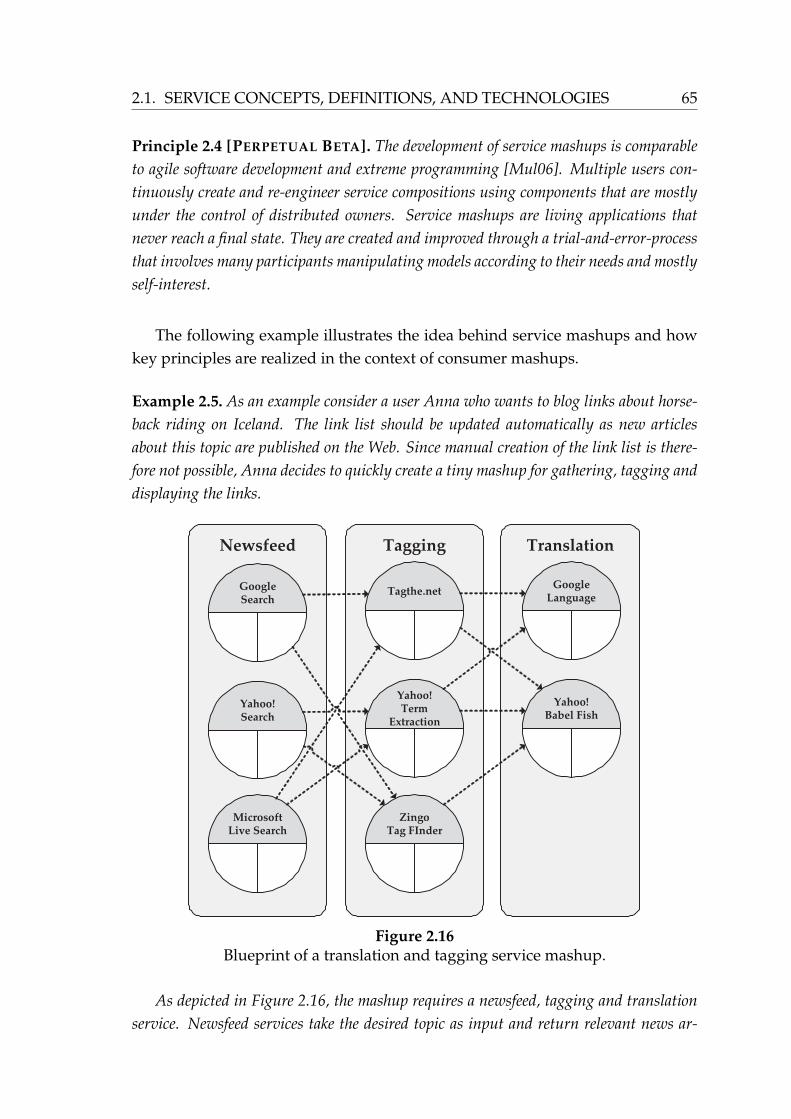
2.1. SERVICE CONCEPTS, DEFINITIONS, AND TECHNOLOGIES 65
Principle 2.4 [PERPETUAL BETA]. The development of service mashups is comparable
to agile software development and extreme programming [Mul06]. Multiple users con-
tinuously create and re-engineer service compositions using components that are mostly
under the control of distributed owners. Service mashups are living applications that
never reach a final state. They are created and improved through a trial-and-error-process
that involves many participants manipulating models according to their needs and mostly
self-interest.
The following example illustrates the idea behind service mashups and howkey principles are realized in the context of consumer mashups.
Example 2.5. As an example consider a user Anna who wants to blog links about horse-
back riding on Iceland. The link list should be updated automatically as new articles
about this topic are published on the Web. Since manual creation of the link list is there-
fore not possible, Anna decides to quickly create a tiny mashup for gathering, tagging and
displaying the links.
TaggingNewsfeed Translation
GoogleSearch
Yahoo!Search
MicrosoftLive Search
Tagthe.net
Yahoo!Term
Extraction
ZingoTag FInder
GoogleLanguage
Yahoo!Babel Fish
Figure 2.16Blueprint of a translation and tagging service mashup.
As depicted in Figure 2.16, the mashup requires a newsfeed, tagging and translation
service. Newsfeed services take the desired topic as input and return relevant news ar-

66 CHAPTER 2. PRELIMINARIES & RELATED WORK
ticles. In the following, relevant tags have to be determined for these articles. As Anna
would like to keep her blog consistent in German, a service is required to translate the
foreign language tags.
2.2 Markets in a Service World
The community is a fictitious body, composed of the individual persons who are
considered as constituting as it were its members. The interest of the community then is,
what? – the sum of the interests of the several members who compose it?
[Ben38]
This section elaborates the idea, necessity and applicability of markets in service-dominated environments which are constantly evolving in almost any field ofsociety. Providing a first insight and a general motivation to the topic, Section2.2.1 provides a thorough line of argument answering the question why auctionsshould be applied in the context of complex services and how they can serveto coordinate distributed activities to enable a flawless composition. The argu-mentation builds upon the general service characteristics as introduced in Section2.1.1.2 and proclaims the need for auction-based dynamic allocation and pricingof service components generating added value through the composition of com-plex services.
Laying the groundwork for the design of mechanisms, Section 2.2.3 intro-duces the approach of mechanism design, elaborates economic objectives that aredesirable when implementing a social choice, and briefly introduces prominentmechanisms along with a set of impossibility theorems. Bringing mechanism de-sign in the context of service value networks and information systems design, theidea behind algorithmic mechanism design is motivated.
As the process of designing market-mechanisms for a specific domain is com-plex and involves many steps and multiple factors, Section 2.2.2 introduces theconcept of an electronic market and provides a market engineering process as astructured approach for the discipline of market engineering. Each phase withinthe market engineering process is iteratively mapped on the structure of the workat hand.
The Section 2.2.4 concludes with a detailed analysis of economic and appli-cability requirements, an auction mechanism has to meet to support dynamicallocation and pricing of complex services in networked environments such as
2.2. MARKETS IN A SERVICE WORLD 67
service value networks. Based on the requirements analysis, related work is pre-sented and evaluated illustrating the research gap which is filled by this thesis.
2.2.1 Why Auctions for Complex Services?
In general, an adequate approach for allocation and pricing of complex serviceshas to account for service characteristics as introduced in Section 2.1.1.2. As statedby [Smi89] “auctions flourish in situations in which the convential ways of estab-lishing price and ownership are inadequate”. Smith concretizes the argumenta-tion by briefly pointing out the main characteristics of such situations which arepredestinated for the application of auctions by focusing on the roles and itemsinvolved: “costs cannot be established, [...], there is something special or unusual
about the item, ownership is in question, different persons assert special claims, [...].”Although this statement is rather fuzzy, the characterization of the type of ’item’which price is best established by the application of an auction mechanism opensup an analogy to the service concept. Recall, in Section 2.1.1.2 services are char-acterized by the coincide of production and consumption (uno-actu), they cannotbe inventoried, value creation is dominated by intangible elements, consumerco-production and fuzzy inputs and outputs.
Smith points out that auctions are preferable in situation where costs cannotbe established. From an microeconomic perspective such costs refer to internalcosts that are private information to the one producing the item, i.e. the producer’sindividual valuation for the item. In the context of services, this argument alsoholds for the consumer side. According to the service characteristic C 2.4, valuethat is generated for the service consumer is mostly dominated by intangible el-ements and therefore hard to determine. An objective measurement of qualitywhich might be an indicator for the consumer’s valuation is also hardly applica-ble due to a service’s fuzzy inputs and outputs according to characteristic C 2.5.The complexity of value elicitation and the problem of establishing adequate priceseven increases in scenarios with joint value creation through service compositions(e.g. in service value networks where complex services are produced). Analogueto Smith’s argumentation, such problems can be addressed by the design of asuitable auction mechanism that induces incentives for service providers to re-port their private valuations truthfully. Auctions haven proven to be the idealinstrument to aggregate information from distributed parties which results in anaggregated valuation [PS00, Jac03]. Without prior knowledge about the valua-tions of each participant, auctions can provide suitable incentives to make truthrevelation an equilibrium strategy and therefore automatically aggregate neces-
68 CHAPTER 2. PRELIMINARIES & RELATED WORK
sary information from self-interested participants to determine adequate prices forcomplex services.
Another criterion that is crucial to establishing a suitable approach for allo-cation and pricing according to [Smi89] is if the item subject to trade exposesspecial or unusual characteristics. The uno-actu principle (C 2.1) implies thatin the context of services there cannot be a producer without at a consumer asproduction and consumption coincides in time. This service characteristic has fun-damental implications on coordination aspects as service cannot be inventoriedin order to balance demand and supply. Following the same direction, Lucking-Reiley enriches this argumentation by adding an economic perspective whichexplicitly focuses on the trade of services by stating that “[...] in the future wemay see much more auctioning of services [...]. Services are particularly attrac-tive for auctions because they are in relatively fixed supply – unlike durable goods,one cannot store surpluses or draw down inventory in order to meet fluctuating de-mand.” [LR00]. Market mechanisms such as auctions are preferable in situationswith a fast changing demand and supply ratio as dynamic pricing smoothes highamplitudes. This property is crucial to success of efficient allocation and pricingespecially when perishable services are traded [Eso01].
The rapid growth of information and communication technology has tremen-dously decreased transaction costs for service provision and consumption.Computing power and storage raises exponentially while prices drop anti-proportionally for hardware as illustrated by Moore’s Law. This developmentdirectly leads to a tough price competition for service providers. In order to staycompetitive, service providers have to differentiate their service offers with respect
to quality (not price) [Dev98, MV98, DLP03, LSW01, BP91]. Quality is the main
value-determining factor in the context of services as service consumers experiencea service activity mainly based on the quality provided. Quality is idiosyncraticto the individual and often determined by various factors and the interplay ofmultiple service components that are part of a service composition. Hence, itis unbearable for service consumers to reason about all feasible combinations ofsingle services and the resulting quality provided by the service composition inorder to meet their requirements. Therefore an auction mechanism is neededwhich accounts for different preferences of service requesters defined for a variety of
quality characteristics that are determined by each component that is part of fea-sible complex service instances (cp. Section 2.1.2.3). Especially in the context ofsituational complex services provided by distributed parties in service value net-works, a QoS-sensitive auction mechanism allows for the provision and pricing ofhighly customized short-term solutions to various types of customers leveraging

2.2. MARKETS IN A SERVICE WORLD 69
the nature and benefits of situational applications and service mashups (cp. Sec-tion 2.1.4.3). As a consequence, service providers in service value networks areable to address the long tail of business by satisfying a great amount of individualservice requests [And06]. In these environments, it is assumed that service of-fers are under the control of distributed self-interested owners. In the absence ofcentral control, non-performance or complete drop-outs of service componentsmaybe rare but inevitable. Auction mechanisms that are computational feasible al-low for reallocation and price adaption during run-time enabling dynamic failovers
in unreliable environments [FKNT02].
2.2.2 Electronic Markets and Market Engineering
Coordination of transactions requires an adequate form of organization and coor-dination mechanism. From an economic theory perspective, two extreme formshave to be distinguished: markets and hierarchies. Markets coordinate transac-tions by means of a rule set which constraints the way transactions may takeplace. The coordination itself results from a balance between demand and sup-ply and consequently determines dynamic prices, quantities, quality and so forth.In the past, markets have been used in environments with relatively simple prod-ucts with respect to attributes and quality and low specificity (e.g. commoditygoods) due to high coordination costs for message exchange and matching ofdemand and supply (cp. Figure 2.17). In the absence of modern information andcommunication technology, complex products or services are costly to coordinate(e.g. complex descriptions require complex bidding languages and messages aswell as highly sophisticated matching algorithms) [MS84]. Traditionally, in sce-narios with complex products, hierarchies have proven to perform quite well dueto a higher degree of planning and control, which results in lower coordinationcosts (less messages have to be exchanged and no complex matching is required).A detailed analysis of trade-offs between markets and hierarchies with respect totransaction and coordination costs can be found in [Wil79, Mal85, MS84, Mal87].
However, this argumentation does not hold under the presence of moderninformation and communication technology and powerful dynamic infrastruc-tures built upon the principles of the SOA paradigm. Due to more efficient andsophisticated information and communication infrastructures, market-based co-ordination in electronic environments can be realized [MYB87]. Therefore thefollowing definition of an electronic market can be concluded:

70 CHAPTER 2. PRELIMINARIES & RELATED WORK
Lo
wH
igh
Co
mp
lexi
ty o
f P
rod
uct
Des
crip
tio
n
Low High
Asset Specificity
Hierarchy
Market
Figure 2.17Characteristics of products and services affect forms of
organization [MYB87].
Definition 2.9 [ELECTRONIC MARKET]. An electronic market is an institutions built
upon information and communication technology that establishes a market-based coordi-
nation of transactions by enabling the ubiquitous trade of products and services between
multiple distributed participants.
Designing market mechanisms in electronic environments is a complex pro-cess that requires knowledge and expertise in the area of economics and com-puter science. Interdependencies between economic desiderata such as alloca-tion efficiency (cp. Section 2.2.3) and technical applicability requirements such ascomputational tractability have to be identified and feasible trade-offs have tobe analyzed in order to achieve desired goals [WNH06]. Different aspects fromtechnical and economic viewpoints often lead to colliding objectives that haveto be resolved through relaxation of requirements and objectives or designingsuitable trade-offs between conflicting goals. Relying on existing market mecha-
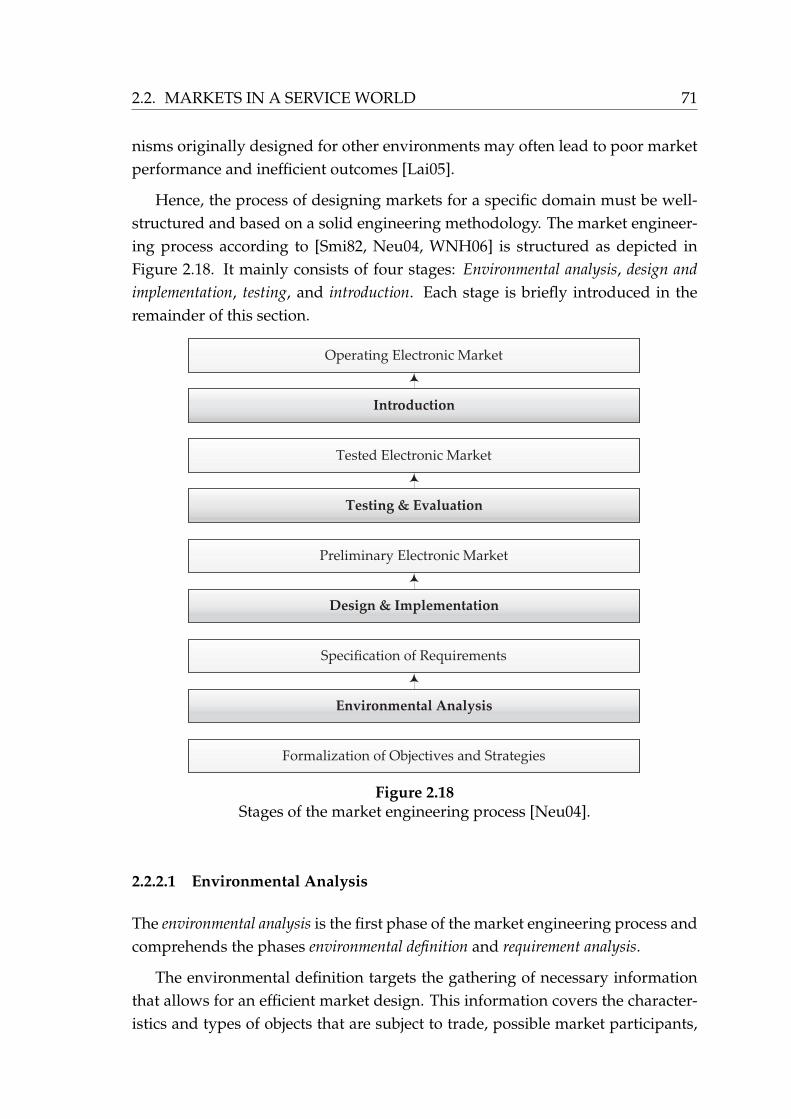
2.2. MARKETS IN A SERVICE WORLD 71
nisms originally designed for other environments may often lead to poor marketperformance and inefficient outcomes [Lai05].
Hence, the process of designing markets for a specific domain must be well-structured and based on a solid engineering methodology. The market engineer-ing process according to [Smi82, Neu04, WNH06] is structured as depicted inFigure 2.18. It mainly consists of four stages: Environmental analysis, design and
implementation, testing, and introduction. Each stage is briefly introduced in theremainder of this section.
Environmental Analysis
Formalization of Objectives and Strategies
Specification of Requirements
Design & Implementation
Preliminary Electronic Market
Testing & Evaluation
Tested Electronic Market
Introduction
Operating Electronic Market
Figure 2.18Stages of the market engineering process [Neu04].
2.2.2.1 Environmental Analysis
The environmental analysis is the first phase of the market engineering process andcomprehends the phases environmental definition and requirement analysis.
The environmental definition targets the gathering of necessary informationthat allows for an efficient market design. This information covers the character-istics and types of objects that are subject to trade, possible market participants,
72 CHAPTER 2. PRELIMINARIES & RELATED WORK
their objectives and possible strategies as well as information about intermedi-aries in the market as analyzed in Chapter 2. Based on this information, potentialmarket segments are identified and evaluated comparatively.
Hence, this analysis serves as a basis for deriving requirements and desideratafor the design phase, i.e. the requirement analysis. A thorough environmentalanalysis is fundamental to the success of an efficient market design. The resultsof the environmental analysis of this work are outlined in Section 2.2.4.
2.2.2.2 Design and Implementation
Having derived desiderata and requirements for a domain-specific market de-sign, the next stage covers the conceptual design phase as the central element ofthe market engineering process. Analogously to the design of systems and ar-chitectures in the computer science domain, markets are meaningfully composedout of modularized elements in order to achieve a desired market performanceand outcome. The conceptual design constitutes a set of institutional rules inan abstract manner independent of a concrete implementation (analogue to aplatform- and programming-model-independent design of a software artifacte.g. in UML [OMG07]). The conceptual design of this work that comprehendsthe design of a bidding language to express service offers and requests as well asa mechanism design with additional extensions is introduced in Section 3 usingan implementation-independent mathematical formalization.
The conceptual design lays the groundwork for the actual implementation ofthe market into an information system. This phase is distinguished in the embodi-
ment phase and the implementation phase. In the embodiment phase, the conceptualdesign is refined, concretized and extended where required into a more specificmarket scheme but still remains implementation-independent. This phase of themarket engineering process is realized in the work at hand in Chapter 4.
The condensed market scheme is subsequently modeled into a formal processmodel describing the domain-specific market to be prototypically realized. Sec-tion 3.5 introduces the process model for the auction conduction which serves asprocedural blueprint for the subsequent implementation phase.
Finally, in the implementation phase, the prototypical implementation of themarket design is realized based on the results of the previous phases. A proto-typical implementation of the work at hand is introduced and briefly describedin Section 3.6.

2.2. MARKETS IN A SERVICE WORLD 73
2.2.2.3 Testing and Evaluation
Having completed the conceptual design phase, the embodiment phase and theimplementation phase, the created artifacts are tested and evaluated with respectto the specified desiderata and requirements in the environmental analysis. Inthe evaluation phase, both, technical and applicability requirements (e.g. supportfor service compositions) as well as economic requirements (e.g. incentive com-patibility) are evaluated and verified in this phase.
Depending on the aspect subject to evaluation, adequate methods and ap-proaches have to be chosen and selected based on their applicability. Exemplary,the economic desideratum, which states that the mechanism shall implement asocial choice function that is weakly budget-balanced can be theoretically evalu-ated using mathematical proofs. Strategic behavior of market participants withrespect to bundling strategies might be too complex to be theoretically investi-gated but requires an agent-based simulation approach to evaluate such aspects.The evaluation phase of the work at hand is therefore divided into an analyticalevaluation part in Chapter 5 and an numerical evaluation part in Chapter 6.
Based on the obtained information out of the testing and evaluation phaseabout the satisfaction of requirements by the market design and the achievementof desired outcomes, a final refinement takes place to complete the market foroperative introduction.
2.2.2.4 Introduction
The introduction phase constitutes the final phase of the market engineering pro-cess. In this phase, the evaluated and refined electronic market is introduced andinitiates its operation cycle.
2.2.3 Mechanism Design
Mechanism design is a subfield of game theory that pursues the idea of design-ing institutions that determine decisions as a function of the information that isknown by the individuals in the economy in order to achieve a desired outcome[Mye88]. Mechanisms serve as a unifying conceptual structure, which allows foranalyzing and comparing economic institutions with respect to their propertiesand suitability in order to foster certain outcomes. Analogue to traditional gametheory, mechanism design assumes individuals in an economy to be rational-
74 CHAPTER 2. PRELIMINARIES & RELATED WORK
acting and self-interested, meaning they pursue individual utility maximization.According to [Par01] the mechanism design problem can be defined as follows:
Definition 2.10 [MECHANISM DESIGN]. The mechanism design problem is to im-
plement an optimal system-wide solution (social choice) to a decentralized optimization
problem with self-interested agents with private information about their preferences for
different outcomes.
2.2.3.1 Social Choice
The main goal of mechanism design is to provide mechanisms that implement asocial choice. A social choice function is an aggregation of the preferences of mul-tiple participants into a single joint decision [NRTV07]. In environments withdecentralized, rationally-acting agents that have private information about theirpreferences for different outcomes, the implementation of a social choice functionis necessary to achieve an overall goal due to the absence of complete informa-tion.
Given the agent’s type θi ∈Θi with i∈ I , the preferences for different outcomesρ ∈ R result in the agent’s utility ui(ρ,θi). A social choice function selects – giventhe agents’ types – the optimal outcome ρ∗.
Definition 2.11 [SOCIAL CHOICE FUNCTION]. A social choice function ω : Θ1 ×
· · · × ΘI → R selects an optimal outcome ω(θ) = ρ∗ with ρ∗ ∈ R given the agent’s
types θ = (θ1, . . . ,θI). The outcome ρ is decomposable into a choice ωo(θ) ∈ Ωo and
payments made by each agent ωti(θ) ∈Ωt.
47
The outcome of a social choice function is a system-wide solution that cannot be solved directly as the agent’s types are private information to the agents.Thus, an adequate mechanism is needed that defines a set of game theoretic rulesto implement the solution to the social choice function accounting for rationaland selfish behavior of the agents. The behavior of agents is game theoreticallydefined by means of strategies. A strategy describes a complete and contingentplan that defines the actions an agent will select in every possible state of a game[Gib92, Par01]. A strategy ψi(θi) of an agent i is defined as ψi(θi) ∈ Ψi where θi
denotes the type of agent i and Si all possible strategies depending on its type.
47Decomposition into a choice and a payment component is only feasible under the assump-tion of quasi-linear preferences which is common in game theory.

2.2. MARKETS IN A SERVICE WORLD 75
Based on the concept of a social choice function and agents’ behavior by meansof their strategies, a mechanism is defined as follows:
Definition 2.12 [MECHANISM]. A mechanism M = (Ψ1, . . . ,ΨI ,m(·)) defines an
outcome rule m(·) that maps strategies Ψ1, . . . ,ΨI of agents 1, . . . , I to an outcome ρ ∈R
such that m : Ψ1×, . . . ,×ΨI →R. The outcome rule m(o(·), t(·)) consists of a choice
or allocation rule o(·) and a payment or transfer rule t(·) that determines the monetary
transfer to the agents. 47
Hence, a mechanism determines the agents’ strategy space and defines acertain outcome given the chosen strategies. The outcome defines an allocation
(e.g. agent sr gets service v from agent sp) and the monetary exchange – the trans-
fer – between agents (e.g. agent sr has to transfer an amount x to agent sp).
Recall that the goal of mechanism design is to implement an optimal system-wide solution (social choice) to a decentralized optimization problem eventhough the participants are self-interested and have private information abouttheir preferences for different outcomes. As agents are assumed to act rationaland therefore to maximize their individually utility, a solution in such a scenariomust be a state where no agent gains by changing its own chosen strategy uni-laterally, i.e. an equilibrium in game theoretic terms. The goal of a mechanism isto implement a social choice function, that is, a mechanism constitutes an equi-librium that yields the same outcome as the optimal solution to the social choicefunction for all possible agent preferences.
Definition 2.13 [MECHANISM IMPLEMENTATION]. A social choice function ω(θ)
with outcome ρ∗ ∈ R is implemented by a mechanism M = (Ψ1, . . . ,ΨI ,m(·)) if
m(ψ∗1(θ1), . . . ,ψ∗I (θI)) = ρ∗ with (ψ∗1 , . . . ,ψ∗I ) ∈ Ψ1×, . . . ,×ΨI and (θ1, . . . ,θI) ∈
Θ1×, . . . ,×ΘI where strategy profile (ψ∗1 , . . . ,ψ∗I ) is an equilibrium strategy given mech-
anismM.
One can distinguish between direct and indirect mechanisms. In a directmechanism, agents submit their messages once to the mechanism and the out-come is computed subsequently. In an indirect mechanism, agents may submitseveral messages to the mechanism an receive feedback which is incorporated bythe agents. The focus of the work at hand is restricted to direct mechanisms. Adirect-revelation mechanism is defined as follows:
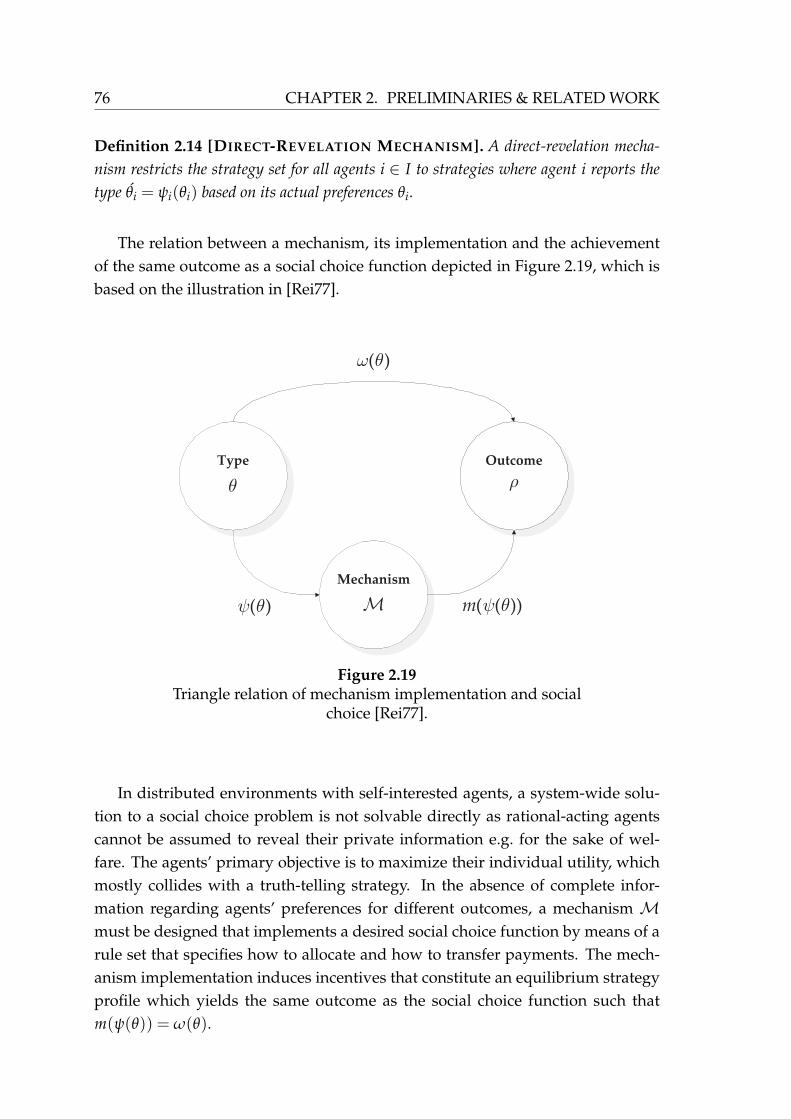
76 CHAPTER 2. PRELIMINARIES & RELATED WORK
Definition 2.14 [DIRECT-REVELATION MECHANISM]. A direct-revelation mecha-
nism restricts the strategy set for all agents i ∈ I to strategies where agent i reports the
type θi = ψi(θi) based on its actual preferences θi.
The relation between a mechanism, its implementation and the achievementof the same outcome as a social choice function depicted in Figure 2.19, which isbased on the illustration in [Rei77].
Mechanism
Type Outcome
( )ω θ
( )ψ θ ( ( ))m ψ θ
θ
M
ρ
Figure 2.19Triangle relation of mechanism implementation and social
choice [Rei77].
In distributed environments with self-interested agents, a system-wide solu-tion to a social choice problem is not solvable directly as rational-acting agentscannot be assumed to reveal their private information e.g. for the sake of wel-fare. The agents’ primary objective is to maximize their individual utility, whichmostly collides with a truth-telling strategy. In the absence of complete infor-mation regarding agents’ preferences for different outcomes, a mechanism Mmust be designed that implements a desired social choice function by means of arule set that specifies how to allocate and how to transfer payments. The mech-anism implementation induces incentives that constitute an equilibrium strategyprofile which yields the same outcome as the social choice function such thatm(ψ(θ)) = ω(θ).

2.2. MARKETS IN A SERVICE WORLD 77
2.2.3.2 Properties of Social Choice and Mechanism Implementations
The objective of mechanism design is to implement a social choice function inequilibrium strategies that yields desired properties. Such properties are oftenreferred to as mechanism properties. Nevertheless mechanisms do not directlyexpose these properties but they implement social choice functions that do. Forthe reader’s convenience properties of social choice are also referred to as mech-anism properties in the remainder of this thesis. For an extended introductionto mechanism and social choice properties, the interested reader is referred to[Par01].
Desideratum 2.1 [ALLOCATIVE EFFICIENCY]. A social choice function ω(θ) =
(ωo(θ),ωt(θ)) is allocative efficient if it maximizes the total utility over all agents. Let
ω∗o (θ) ∈Ωo be an allocative efficient choice, then no alternative choice ωo(θ) ∈Ωo yields
a higher utility for all agents such that:
∑i∈I
ui(ω∗o (θ),θi) ≥ ∑
i∈I
ui(ωo(θ),θi), ∀ωo(θ) ∈Ωo (AE)(2.1)
Desideratum 2.2 [(DOMINANT STRATEGY) INCENTIVE COMPATIBILITY]. A
mechanismM is incentive compatible if agents report truthful information about their
preferences in equilibrium. A mechanismM is strategy-proof or dominant-strategyincentive-compatible if each agent i’s best response to any strategy of the other agents
is revealing its true type, i.e. reporting true information about the preferences is a domi-
nant strategy in equilibrium. In other words there is no incentive for agents to announce
untruthful information about their preferences in order to increase their individual util-
ity. Let ψ∗i (θi) = θi be the truth-revelation strategy for agent i. For a strategy-proof
mechanismM it is required that
ui(m(ψ∗i (θi),ψ−i(θ−i)),θi) ≥ ui(m(ψi(θi),ψ−i(θ−i)),θi),(2.2)
∀ψi ∈ Ψi \ ψ∗i , ∀ψ−i ∈ Ψ−i, ∀i ∈ I
which means that the truth-revelation strategy is a dominant strategy for all agents. Fur-
thermore it is required that the strategy profile
ψ∗ = (ψ∗1(θ1), . . . ,ψ∗I (θI)) (DSIC)(2.3)
is an equilibrium given mechanismM.

78 CHAPTER 2. PRELIMINARIES & RELATED WORK
Desideratum 2.3 [INDIVIDUAL RATIONALITY]. A mechanismM is individual ra-
tional if it implements a social choice function ω(θ) = (ωo(θ),ωt(θ)) = ρ that guaran-
tees that agents are not worse-off by participating. Let ui(ρ,θi) be the utility of agent i
in case of participation and ui(θi) the utility of its outside option, i.e. its utility if agent i
does not participate.
ui(ρ,θi) ≥ ui(θi), ∀i ∈ I (IR)(2.4)
Assuming a mechanism where an agent can withdraw once it knows the outcome ex-post
is individual rational if participation makes the agent not worse-off compared to the out-
side option of not participating for all possible agent types in the system. In mechanisms
where agents are not able to observe the outcome, meaning the decision to participate has
to be done ex-ante, the concept of interim individual rationality is introduced, which
is a weaker property from an ex-ante perspective.
E(ui(ρ,θi)) ≥ E(ui(θi)), ∀i ∈ I (IIR)(2.5)
The expected utility E(ui(ρ,θi)) for agent i from participation is not worse then its ex-
pected utility E(ui(θi)) from not participating.
Desideratum 2.4 [BUDGET BALANCE]. A social choice function ω(θ) =
(ωo(θ),ωt(θ)) is strong budget-balanced if all payments made by the agents are dis-
tributed among all agents. This means that there are no outside payments necessary to
realize transfers according to the outcome of the social choice function.
∑i∈I
ωti(θ) = 0 (BB)(2.6)
There are no net transfers neither into the system nor out of the system. A weaker ver-
sion of budget balance is if there are transfers out of the system but not into the system,
i.e. weak budget balance.
∑i∈I
ωti(θ) ≥ 0 (WBB)(2.7)
Although all of these valuable properties of social choice and mechanismimplementations are desired from an economical perspective, they cannot beachieved at the same time due to impossibilities, which are presented in detailin Section 2.2.3.4.

2.2. MARKETS IN A SERVICE WORLD 79
2.2.3.3 Possibility Results
Maybe the most important possibility result in mechanism design is the revela-tion principle as it implies that it is sufficient to restrict to direct incentive com-patible mechanisms. The principle is defined as follows:
Definition 2.15 [REVELATION PRINCIPLE]. Any mechanismM that implements a
social choice function ω(·) in dominant strategies48 can also be implemented by an incen-tive compatible direct-revelation mechanism that implements the same social choice
function ω(·) in dominant strategies.
The intuition behind the revelation principle can be illustrated as follows: As-suming the agents’ strategy profile ψ∗ = (ψ∗1 , . . . ,ψ∗I ) in equilibrium in a mecha-nismM leads to an outcome ρ(ψ∗). Now, the behavior of the agents is simulatedby a mechanism M called a simulator which computes the optimal strategies ofthe agents based on their reported preferences. Hence, for each agent i ∈ I it isa dominant strategy to report its type truthfully to the mechanism M. Conse-quently the simulator M implements the same social choice function asM.
To illustrate the idea of the revelation principle the following examplepresents a general mechanism and an equivalent incentive compatible direct-revelation mechanism that leads to the same outcome. The example is a slightlychanged variant of an example in [Mye88] with an extensive analysis.
Example 2.6 [INCENTIVE COMPATIBLE DIRECT-REVELATION MECHANISM].
Consider a game where two agents i and −i have private valuations vi and v−i for a
good g. Both agents separately put amounts bi and b−i in two different envelops. The
agent that reports the higher amount gets the good and the other one gets both envelopes.
Presented game is symmetric and therefore both agents try to maximize the same expected
utility. Without loss of generality, agent i’s expected utility is analyzed.
(2.8) Ei(·) = P(bi > b−i) [vi − bi] + P(bi < b−i) [bi + b−i]
Two cases must be considered:
48Note that the first version of the revelation principle in [Gib73] is restricted to mechanismsthat implement a social choice function in dominant strategies. In [Mye82] the principle is extendedto the general case for all equilibrium concepts e.g. Bayesian-Nash equilibria.

80 CHAPTER 2. PRELIMINARIES & RELATED WORK
1. Getting the good g yields a higher utility for agent i then getting both envelopes
such that
(vi − bi) > (bi + b−i)(2.9)
vi − 2bi > b−i(2.10)
Consequently agent i wants to maximize the probability of winning the good.
P(bi > b−i) is maximized by reporting an amount bi = vi − 2bi which leads to
the strategy of reporting an amount bi =13 vi.
2. Getting the good g yields a lower utility for agent i then getting both envelopes
such that
(vi − bi) < (bi + b−i)(2.11)
vi − 2bi < b−i(2.12)
Consequently agent i wants to maximize the probability of getting both envelopes
and loosing the good. P(bi < b−i) is maximized by reporting an amount bi =
vi − 2bi which leads to strategy of reporting an amount bi =13 vi.
The strategy of announcing an amount b∗i =13 vi is the best response of agent i not know-
ing agent−i’s strategy. As the game is symmetric this argumentation also holds for agent
−i. Consequently, the strategy b∗ = 13 v constitutes an equilibrium.
Without loss of generality let agent i be the agent that wins the good g such that
bi > b−i. Thus, the outcome of the game based on the agents’ equilibrium strategies
evolves as follows:
ui(·) =23
vi(2.13)
u−i(·) =13
v−i +13
vi(2.14)
According to the revelation principle (Definition 2.15) an equivalent incentive compatible
direct-revelation mechanism can be designed that yields the same outcome:
The mechanism allocates the good g to the agent that reports the higher amount and
charges one-third of that amount. The other agent that does not receive the good gets one-
third of both reported amounts. Analogously to the previous game, the expected utility of
agent i is analyzed.
(2.15) Ei(·) = P(bi > b−i)
[
vi −13
bi
]
+ P(bi < b−i)
[
13
bi +13
b−i
]

2.2. MARKETS IN A SERVICE WORLD 81
Two cases must be considered:
1. Getting the good g yields a higher utility for agent i then getting one-third of both
reported amounts such that
(vi −13
bi) > (13
bi +13
b−i)(2.16)
3vi − 2bi > b−i(2.17)
Consequently agent i wants to maximize the probability of winning the good.
P(bi > b−i) is maximized by reporting an amount bi = 3vi − 2bi which leads to
the truth-telling strategy bi = vi.
2. Getting the good g yields a lower utility for agent i then getting one-third of both
reported amounts such that
(vi −13
bi) < (13
bi +13
b−i)(2.18)
3vi − 2bi < b−i(2.19)
Consequently agent i wants to maximize the probability of getting both envelopes
and loosing the good. P(bi < b−i) is maximized by reporting an amount bi =
3vi − 2bi which also leads to the truth-telling strategy bi = vi.
Without loss of generality let agent i be the agent that wins the good g such that bi > b−i.
Thus, the outcome of the game based on the agents’ equilibrium truth-telling strategies
evolves as follows:
ui(·) =23
vi(2.20)
u−i(·) =13
v−i +13
vi(2.21)
The example at hand illustrates the idea of the revelation principle by showingthat there exists a direct-revelation mechanism that yields the same outcome asthe general mechanism in a truth-telling equilibrium, i.e its incentive compatible.Note that the example demonstrates the application of the more general revela-tion principle according to [Mye82] that extends results in [Gib73] – that restrictthe revelation principle to dominant strategy equilibria – to the general case formultiple equilibrium concepts e.g. Bayesian-Nash equilibria.
Summarizing, with the results of the revelation principle, impossibility resultscan be proven over the space of direct-revelation mechanisms, and possibilityresults can be constructed over the space of direct-revelation mechanisms.

82 CHAPTER 2. PRELIMINARIES & RELATED WORK
Maybe the most prominent family of direct-revelation mechanisms are theVickrey-Clarke-Groves (VCG) mechanisms [Vic61], [Cla71] and [Gro73]. VGCmechanisms belong to the class of Groves mechanisms and are individual ratio-
nal, allocatively-efficient and strategy-proof direct-revelation mechanisms. For a de-tailed analysis of the family of VCG mechanisms and their properties, the inter-ested reader should refer to [Par01].
2.2.3.4 Impossibility Results
Despite of possibility results such as the revelation principle, there are importantimpossibility results that have strong limitations to design goals that can be si-multaneously pursued. In fact, it is impossible to achieve certain combinations ofdesign desiderata as outlined in the previous section. Among the most prominentare the following theorems:
Theorem 2.1 [HURWICZ (GREEN-LAFFONT) IMPOSSIBILITY THEOREM]. There
is no double-sided mechanism that is at the same time allocative efficient, budget-balanced,
and truthful in settings with quasi-linear preferences [GL78, Wal80, HW90].
The Theorem 2.1 restricts its proposition and applicability to dominant-strategy equilibria, whereas the following theorem by Myerson and Satterthwaitemakes a more generic statement:
Theorem 2.2 [MYERSON-SATTERTHWAITE IMPOSSIBILITY THEOREM]. There is
no double-sided mechanism that is at the same time allocative efficient, budget-balanced,
Bayesian-Nash incentive compatible, and (interim) individually rationality, even in set-
tings with quasi-linear preferences [MS83].
Theorem 2.2 extends the former theorem also to situations where reportingones true type is a Bayesian-Nash equilibrium where participants intent to max-imize their expected utility instead of their ex-post utility. By extending theirproposition, Myerson and Satterthwaite add the condition that the mechanismmust be individual rational.
In summary, the Myerson-Satterthwaite Impossibility Theorem implies thatat most two desiderata out of allocation efficiency, individual rationality, andbudget balance can be achieved when designing truthful mechanisms in settingswhere agents are assumed to have quasi-linear preferences.

2.2. MARKETS IN A SERVICE WORLD 83
2.2.3.5 Algorithmic Mechanism Design
Algorithmic mechanism design – firstly introduced by [NR01] – broadens the eco-nomic focus by considering problems that are inherent in the mechanism designproblem from a computer science and algorithmic perspective such as complex-ity and computational feasibility of computing an optimal system-wide solution.Internet protocols for example are designed under the implicit assumption thateach participant within the system behaves according to a deterministic proce-dure or program. Nevertheless, this assumption does not hold in environmentssuch as the Web as participants and owner of computer systems and applicationsare self-interested and act according to their individual objectives.
Many challenges in computer science involve selfish behavior of decentral-ized participants and thus, require adequate mechanisms to implement an effi-cient solution such us internet routing, scheduling and task allocation, resourceallocation, and service composition [NRTV07]. In such scenarios, agents cannotbe assumed to follow a deterministic algorithm but try to maximize their ownutility which might collude with other objectives and a system-wide solution.
Especially the coordination of service composition requires a mechanism de-sign that accounts for selfish behavior of distributed service providers by imple-menting the right incentives to jointly achieve a common goal that serves theobjectives and well-being of the overall system. Despite of such economic chal-lenges, this scenario puts further technical requirements upon a potential mech-anism design in order to be applicable for the coordination of composite servicecreation. Hence, this broadens the view of mechanism design regarding the fieldof algorithms and information systems design [DJP03].
2.2.4 Environmental Analysis and Related Work
This section outlines requirements upon a mechanism in order to be applicablein the context of coordination in service value networks from an economic andtechnical perspective (Section 2.2.4.1). Based on the requirement analysis, Sec-tion 2.2.4.2 introduces and describes related work and critically examines theirshortcomings in the context of stated requirements and the approach at hand.
2.2.4.1 Requirements
There is a number of requirements a mechanism must and partly should satisfyin order to be applicable in the context of service composition in service value

84 CHAPTER 2. PRELIMINARIES & RELATED WORK
networks from an economic and technical perspective. Requirements upon amechanism are basically dividable into economic requirements and applicability re-
quirements. Economic requirements are explained in detail in Section 2.2.3.5 andare therefore only outlined briefly at this point:
Requirement 1 [ALLOCATIVE EFFICIENCY]. A mechanism is said to be allocative
efficient if it always determines the outcome that maximizes the overall utility across
all participants (consumer and provider surplus), i.e. it always maximizes the system’s
welfare (cp. Desideratum 2.1).
Requirement 2 [INCENTIVE COMPATIBILITY]. A mechanism is said to be (dominant
strategy) incentive compatible or truthful if the truth-telling strategy is an equilibrium
in weakly dominant strategies (cp. Desideratum 2.2).
Incentive compatibility is an important requirement as it functions a precondi-tion for the allocative efficiency requirement. In distributed environments incen-tive compatibility enables the transition from incomplete (private) informationto the situation in which participants reveal their true types voluntarily. This re-ported information is necessary for a welfare-maximizing solution to be alwayscomputable as stated in Requirement 1. Furthermore, truthfulness tremendouslyreduces the complexity of the strategy space of participants. Under the presenceof a weakly dominant strategy there is no need to reason about the other partici-pants’ preferences.
Requirement 3 [INDIVIDUAL RATIONALITY]. A mechanism implements a social
choice that is said to provide the property of individual rationality if agents cannot suffer
a loss in utility from participating in the mechanism, i.e. the option to participate in the
mechanism is not worth than the outside option.
Requirement 4 [BUDGET BALANCE]. A mechanism is said to be (weakly) budget-
balanced if its transfers do not require external subsidization by outside payments, i.e. the
requester’s willingness to pay covers payments transferred to providers (cp. Desideratum
2.4).
Budget balance and individual rationality are crucial for a sustainable imple-mentation of a mechanism with respect to the underlying business model. Ifbudget balance is not met, the mechanism must continuously be subsidized byoutside payments which is not feasible from the strategic perspective of e.g. aservice platform provider. Additionally if individual rationality is not me by the
2.2. MARKETS IN A SERVICE WORLD 85
mechanism, agents will not voluntarily participate in the mechanism as they facethe risk of being worse off compared to their outside option.
For a mechanism in order to be applicable in the context of complex servicesin service value networks from a technical and domain-specific perspective, thefollowing requirements have to be met:
Requirement 5 [COMPUTATIONAL TRACTABILITY]. A mechanism is said to be
computational tractable if it computes an allocation and corresponding prices in poly-
nomial runtime in the size of its inputs, i.e. e.g. the number of service offers and their
feasible compositions into a complex service.
Computational tractability is important for mechanisms that need to performin online systems, i.e. they need to compute an allocation and prices at runtimewithin a feasible time frame. Especially in the context of service value networks,the number of feasible paths through the network – that is, the number of feasiblecomplex service instances – increases rapidly (exponentially) as the number ofservice providers and candidate pools increases49.
Requirement 6 [SERVICE COMPOSITION SUPPORT]. Service compositions, in con-
trary to service bundles, only generate value for the requester in the right order of their
components. Thus, a mechanism in a broader sense is said to support service composition
if its bidding language and allocation function accounts for the well-defined sequence of
service components in order to form a feasible complex or composite service.
Support for service composition is a rare requirement in the context of com-binatorial mechanisms. Although most approaches in this area provide rich bid-ding languages, they only support bundles in an economic sense which ignoresthe order of the entities the bundle consists of50.
Requirement 7 [QOS-SENSITIVITY]. A mechanism in a broader sense is said to be
QoS-sensitive if it accounts for complex QoS characteristics by providing an adequate
bidding language and allocation function that is implemented by a corresponding alloca-
tion algorithm.
49Based on the service value network model in Section 2.1.4, the number of feasible pathsdepends on the number of candidate pools and service offers per candidate pool. Assuming an
equal number of service offers per pool, the number of paths is(
|V\vs,v f |K
)K, with K denotes the
number of candidate pools.50E.g. its not possible to express a preference like (A, B) ≻ (B, A)
86 CHAPTER 2. PRELIMINARIES & RELATED WORK
Requirement 8 [SERVICE LEVEL ENFORCEMENT]. A mechanism in a broader sense
is said to provide service level enforcement if it incorporates information about the ful-
fillment of QoS aspects. Based on this information, the mechanism’s transfer function
provides means for rewarding or penalizing agents.
Requirements 6 and 8 together are important to provide a sustainable supportfor the coordination and trade of complex services as it enables differentiation inquality and a trustworthy environment for service contracts.
2.2.4.2 Related Work
This section outlines research approaches that are closely related to the workat hand and highlights research gaps and shortcomings that are addressed andpartly solved by this approach.
A double-sided market mechanism for trading Grid resources is presented in[Sto09]. The computation of the allocation is based on a greedy heuristic which isscalable and performs well also in large-scale settings while minimizing efficiencyloses compared to an optimal solution that is computational intractable. In thework, two pricing schemes are presented. The first, a proportional critical valuepricing scheme that successfully limits strategic behavior of market participantson the expense of computational costs. The second pricing scheme, k-pricingis highly scalable while sacrificing incentive compatibility to a certain degree.Nevertheless, only low-level resource-oriented services (cp. the bottom layer inthe service decomposition model in Section 2.1.2) are tradable as the mechanismand the bidding language do not support compositions of services, complex QoScharacteristics and their enforcement.
Allowing the trade of service bundles, MACE (Multi-Attribute Combinato-rial Exchange [Sch07]) and the Bellagio System [ACSV04] provide mechanism forthe trade of infrastructure resources. Resource service are specified by rudimen-tary quality attributes and can be requested and provisioned as bundled services.Although the trade of service bundles is supported, their is no support for ser-vice compositions as the bidding language is only capable of capturing bundlespecifications independent of the sequence of entailed service components. Fur-thermore, preferences for service attributes can only be specified by means ofrudimentary operations such as AND, OR, and XOR whereas only simple qual-ity attributes such as response time are supported. From an economic perspec-tive, neither mechanism implements truthfulness with respect to resource priceswhich allows for strategic behavior of participants that is only partly limited by
2.2. MARKETS IN A SERVICE WORLD 87
the pricing scheme. From a technical perspective, the winner determination prob-lem in both mechanisms is computational intractable which does not allow fortheir application in large-scale online settings.
In [LS06], the MACE exchange is extended by means of semantic concepts andtechnologies. A combinatorial double auction is presented that is continuouslycleared. Corresponding bidding language supports the trade of service bundlesbut is not capable of capturing information about sequential compositions. Ser-vices are specified by means of semantically describable quality attributes whichallows for highly differentiated service offers with respect to their QoS charac-teristics. Nevertheless, from an economic perspective, the auction mechanismdoes not provide incentives for truth-revelation of private valuations and QoSattributes of traded services. Furthermore, in settings which require the timelyallocation of services, the auction mechanism is not applicable as it exposes ex-ponential run-time behavior.
Focusing on mechanisms for allocation and pricing of service compositionsthat expose a well-defined control sequence, a combinatorial auction for QoS-aware dynamic web services composition is proposed in [MNM+07]. Their com-position model heavily relies on the work in [ZBD+03] where feasible servicecompositions are predefined based on a statechart graph. Based on this model,a QoS-sensitive combinatorial auction mechanism is proposed which allocatesthe composition of services which yields the highest quality level based on therequesters preferences subject to budget constraints which results in a compu-tational intractable problem. From an economic perspective, the mechanism’sdesign does not implement incentives for truth-revelation of QoS attributes andprivate valuations. The mechanism neither verifies the services’ performance ex-post nor incorporates penalties at the current state of the work.
In summary, as comprised in Table 2.3, a lot of work has been done with re-spect to designing suitable mechanisms for allocation and pricing of services indifferent levels of granularity (utility, elementary and complex services). Never-theless, there still exist various research gaps especially in the context of incor-porating feasibility of service compositions in the allocation problem as well asQoS-sensitivity and adequate ex-post verification mechanisms to impose penal-ties for non-performance.

88 CHAPTER 2. PRELIMINARIES & RELATED WORK
Table 2.3: Requirements satisfaction degree of related ap-proaches ( = fully satisfied, G#= partly satisfied, #= not satis-fied).
(R1)
All
oca
tiv
eE
ffici
en
cy
(R2)
Ince
nti
ve
Co
mp
ati
bil
ity
(R3)
Ind
ivid
ual
Rati
on
ali
ty
(R4)
Bu
dg
et
Bala
nce
(R5)
Co
mp
uta
tio
nal
Tra
ctab
ilit
y
(R6)
Serv
ice
Co
mp
osi
tio
nS
up
po
rt
(R7
)Q
oS
-Sen
siti
vit
y
(R8)
Serv
ice
Lev
el
En
forc
em
en
t
Economic Requirements Applicability Requirements
Ap
pro
ach Stößer 2009 # G# # # #
Schnizler 2007 # # # # G# #
Lamparter et al. 2006 # # # # #
Mohabey et al. 2007 # # # #
This Work #
This Work (extended) G# G#
2.3 Research Methods
The primary goal of the work at hand is not to analyze existing mechanisms butto design novel mechanisms that expose desired properties and induce desiredbehavior of participants in a particular domain. As pointed out in [Rot02], an “en-gineering approach” is required for designing suitable market mechanisms. Thiswork is founded on the approach of mechanism design [Mye88, NR01] which isintroduced in detail in Section 2.2.3.5. In order to evaluate the properties and thebehavior of participants in the developed auction mechanism, the complex ser-vice auction, this work heavily relies on two methodologies: theoretical analysis
and simulations which are briefly introduced in the remainder of this section.

2.3. RESEARCH METHODS 89
2.3.1 Theoretical Analysis
To study the main properties of the auction mechanism, concepts and methodsfrom game theory are employed. This implies to make strong assumption aboutthe market participants with respect to the information about other participantsand the utility functions [MCWG95]. There exist multiple solution concepts ingame theory such as Nash equilibria and dominant strategy equilibria. Theoret-ical analysis provides strong results. Nevertheless, in order to apply analyticalgame theoretic evaluations, models usually rely on strong assumptions that donot necessarily reflect real world settings.
2.3.2 Simulations
Evaluating certain mechanism properties or behavior of participants in settingswith a multitude of variable factors, a theoretical analysis is not applicable inmost of the cases due to the high complexity of the system. As a remedy, numer-ical simulations provide a useful tool to analyze particular properties of a mech-anism by means of randomly generated problem sets, i.e. the variable factors arerandomly generated for multiple simulation runs. Numerical simulations canprovide insights into the general problem structure, performance aspects of thealgorithm that solves the winner determination problem, mechanism propertiesand strategic behavior of participants.
Focusing on more complex settings with participants that face large strategyspaces which precludes theoretical solutions, the methodology of agent-basedsimulations has proven to be promising [Bon02]. Strategic behavior is simu-lated by means of collections of computerized agents that implement the abilityto learn their surroundings and the space of feasible solutions. In contrary to atraditional game theoretic analysis, agent-based simulations provide means forthe evaluation of rare strategies which are more complex and occur in specialdomains. Nevertheless, it is crucial to design reasonable strategies and learningbehavior and incorporate them into software agents. However, a lot of work hasbeen done in the area of agent-based simulations and a whole set of differentstrategies has been shown to work well in many settings [Phe08].


Part II
Design & Implementation

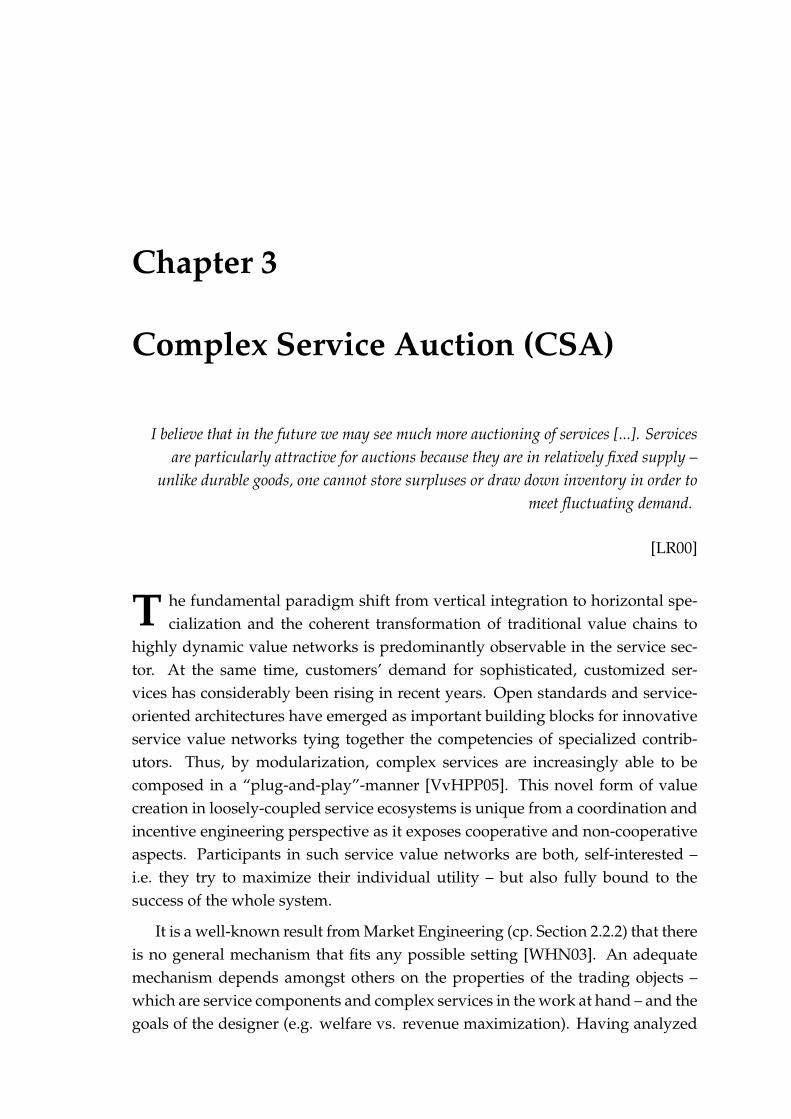
Chapter 3
Complex Service Auction (CSA)
I believe that in the future we may see much more auctioning of services [...]. Services
are particularly attractive for auctions because they are in relatively fixed supply –
unlike durable goods, one cannot store surpluses or draw down inventory in order to
meet fluctuating demand.
[LR00]
T he fundamental paradigm shift from vertical integration to horizontal spe-cialization and the coherent transformation of traditional value chains to
highly dynamic value networks is predominantly observable in the service sec-tor. At the same time, customers’ demand for sophisticated, customized ser-vices has considerably been rising in recent years. Open standards and service-oriented architectures have emerged as important building blocks for innovativeservice value networks tying together the competencies of specialized contrib-utors. Thus, by modularization, complex services are increasingly able to becomposed in a “plug-and-play”-manner [VvHPP05]. This novel form of valuecreation in loosely-coupled service ecosystems is unique from a coordination andincentive engineering perspective as it exposes cooperative and non-cooperativeaspects. Participants in such service value networks are both, self-interested –i.e. they try to maximize their individual utility – but also fully bound to thesuccess of the whole system.
It is a well-known result from Market Engineering (cp. Section 2.2.2) that thereis no general mechanism that fits any possible setting [WHN03]. An adequatemechanism depends amongst others on the properties of the trading objects –which are service components and complex services in the work at hand – and thegoals of the designer (e.g. welfare vs. revenue maximization). Having analyzed

94 CHAPTER 3. COMPLEX SERVICE AUCTION (CSA)
the characteristics of services in general in Section 2.1.1.2, and special aspects ofsoftware services in Section 2.1.3 as well as their composition into complex ser-vices in service value networks in Section 2.1.2 and 2.1.4, the set of requirementsand desiderata from a technical and an economic perspective upon a suitablemechanism were outlined in Section 2.2.4.
Section 3 focuses on the design of an auction mechanism – the Complex Ser-vice Auction (CSA) – that enables based on service offers and requests the al-location of multidimensional service components which are sequentially com-posed into feasible complex service instances. An abstract model is introducedthat comprehends a bidding language to describe information objects that are ex-changed during the auction process. Additionally the model provides meansto formalize service value networks in a graph-based structure. The mecha-nism itself is capable of allocating service components and determining dynamicprices and corresponding QoS characteristics of complex services. Furthermore,in Chapter 4 extensions to the complex service auction are developed in orderto meet the applicability requirements such as QoS-sensitivity and service levelenforcement and to achieve budget balance.
For the remainder of this section it is useful to refer to the design frameworkfor market mechanisms depicted in Figure 3.1. Analogue to the structure of thissection, there are three fundamental components in the design of a market mech-anism [DVVfMSiES03]: the bidding language (cp. Section 3.2), that provides meansfor formalizing information objects and all their necessary parts for the requesterand the provider side that are exchanged during the conduction of e.g. the com-plex service auction; the allocation function (cp. Section 3.3.1) which determineswhich trading object(s) are allocated to which participant(s); and the transfer func-
tion (cp. Section 3.3.2) that determines based on the allocation the monetary trans-fers that have to be realized among the participants. Focusing on the realizationof a mechanism implementation, the concrete allocation algorithm that computesthe allocation function is a central design issue. In this context, design desider-ata such as computational tractability and allocative efficiency strongly dependon the design of the allocation algorithm. Counteracting complexity, heuristic al-gorithms might restore computational tractability by sacrificing optimality to acertain extent [Sto09]. In contrary, exact algorithms enable the computation of anallocative efficient outcome (assuming incentive compatibility) but might resultin exponential run-time [Sch07].
Based on the impossibility results as described in Section 2.2.3.4, there is aninherent trade-off between design desiderata (cp. Section 2.2.4.1) that has to beconsidered when constructing the mechanism’s components.

3.1. SERVICE VALUE NETWORK MODEL 95
Mechanism
Bidding Language Transfer FunctionAllocation Function
Allocation Algorithm
Heuristic Exact
Figure 3.1Framework for the design of mechanisms.
For the reader’s convenience, the formal notation that is used throughout thissection, is outlined in Section A.1 in tabular form.
3.1 Service Value Network Model
Recall that Section 2.1.4 is concerned with an initial description of service valuenetworks, their main characteristics and the various roles involved in value cre-ation. In addition to this first outline, this section focuses on providing a mathe-matical model of a service value network that captures the presented aspects in acomprehensive technical manner.
A service value network is described by means of a simplified statechartmodel [HN96] and is aligned with the representation in [ZBD+03] as depictedin Figure 3.2. Statecharts have proven to be the preferred choice for specifyingprocess models as they expose well-defined semantics and they provide flowconstructs offered by prominent process modeling languages (e.g. WS-BPEL) andtherefore allow for simple serialization in standardized formalisms.
Hence, a service value network is represented by a k-partite, directed andacyclic graph G = (V, E). Each partition Y1, . . . ,YK of the graph represents a can-
didate pool that entails service offers that provide the same (business) functional-
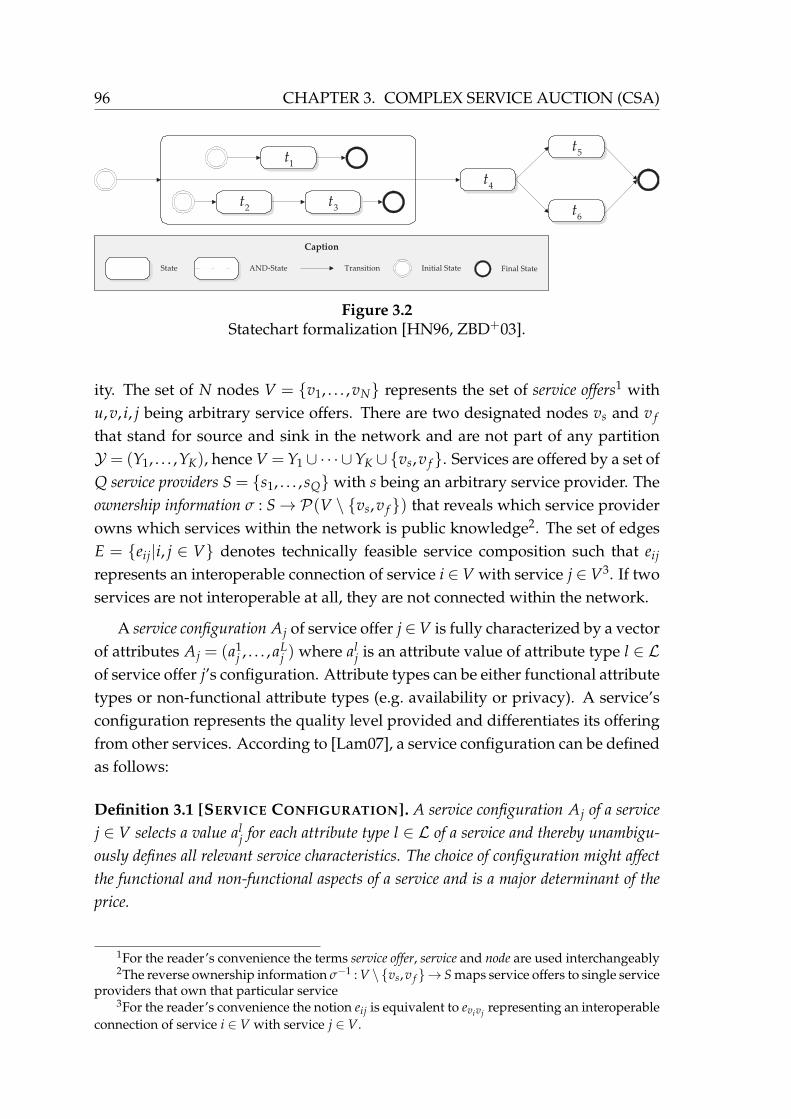
96 CHAPTER 3. COMPLEX SERVICE AUCTION (CSA)
1t
2t
3t
4t
5t
6t
Caption
State AND-State Transition Initial State Final State
Figure 3.2Statechart formalization [HN96, ZBD+03].
ity. The set of N nodes V = v1, . . . ,vN represents the set of service offers1 withu,v, i, j being arbitrary service offers. There are two designated nodes vs and v f
that stand for source and sink in the network and are not part of any partitionY = (Y1, . . . ,YK), hence V = Y1 ∪ · · · ∪YK ∪ vs,v f . Services are offered by a set ofQ service providers S = s1, . . . , sQ with s being an arbitrary service provider. Theownership information σ : S→P(V \ vs,v f ) that reveals which service providerowns which services within the network is public knowledge2. The set of edgesE = eij|i, j ∈ V denotes technically feasible service composition such that eij
represents an interoperable connection of service i ∈ V with service j ∈ V3. If twoservices are not interoperable at all, they are not connected within the network.
A service configuration Aj of service offer j ∈V is fully characterized by a vectorof attributes Aj = (a1
j , . . . , aLj ) where al
j is an attribute value of attribute type l ∈ L
of service offer j’s configuration. Attribute types can be either functional attributetypes or non-functional attribute types (e.g. availability or privacy). A service’sconfiguration represents the quality level provided and differentiates its offeringfrom other services. According to [Lam07], a service configuration can be definedas follows:
Definition 3.1 [SERVICE CONFIGURATION]. A service configuration Aj of a service
j ∈ V selects a value alj for each attribute type l ∈ L of a service and thereby unambigu-
ously defines all relevant service characteristics. The choice of configuration might affect
the functional and non-functional aspects of a service and is a major determinant of the
price.
1For the reader’s convenience the terms service offer, service and node are used interchangeably2The reverse ownership information σ−1 : V \ vs,v f → S maps service offers to single service
providers that own that particular service3For the reader’s convenience the notion eij is equivalent to evivj
representing an interoperableconnection of service i ∈ V with service j ∈ V.
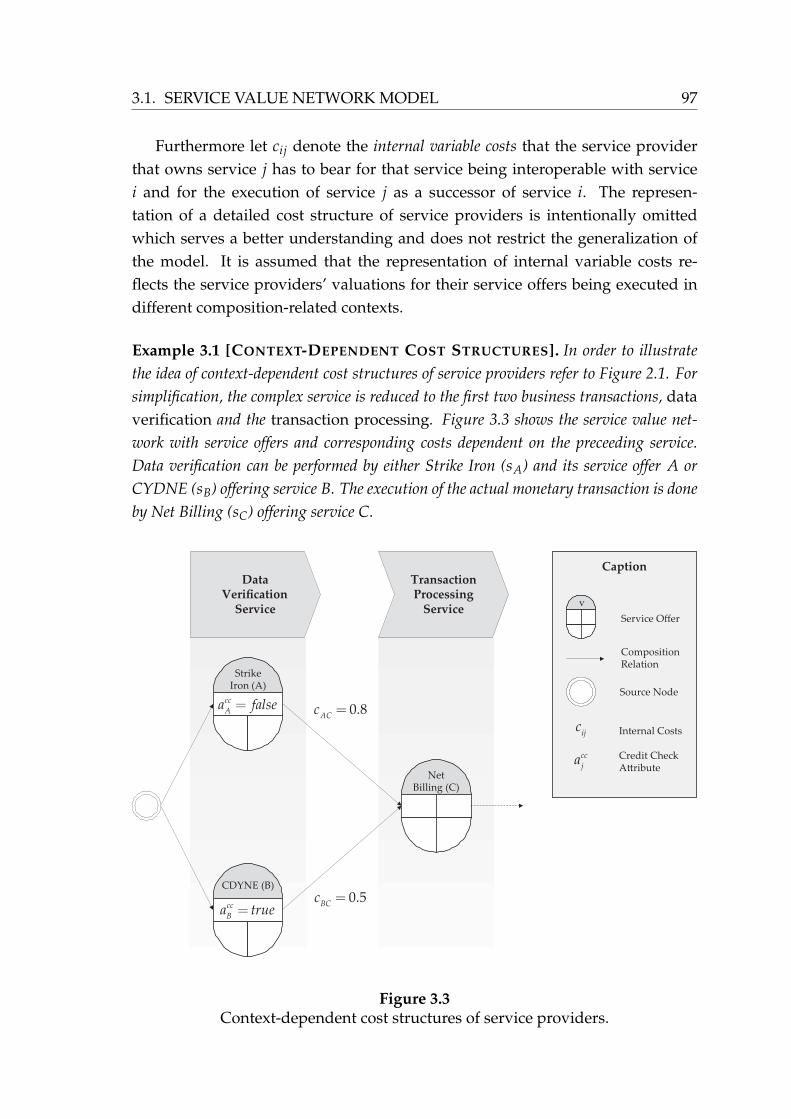
3.1. SERVICE VALUE NETWORK MODEL 97
Furthermore let cij denote the internal variable costs that the service providerthat owns service j has to bear for that service being interoperable with servicei and for the execution of service j as a successor of service i. The represen-tation of a detailed cost structure of service providers is intentionally omittedwhich serves a better understanding and does not restrict the generalization ofthe model. It is assumed that the representation of internal variable costs re-flects the service providers’ valuations for their service offers being executed indifferent composition-related contexts.
Example 3.1 [CONTEXT-DEPENDENT COST STRUCTURES]. In order to illustrate
the idea of context-dependent cost structures of service providers refer to Figure 2.1. For
simplification, the complex service is reduced to the first two business transactions, dataverification and the transaction processing. Figure 3.3 shows the service value net-
work with service offers and corresponding costs dependent on the preceeding service.
Data verification can be performed by either Strike Iron (sA) and its service offer A or
CYDNE (sB) offering service B. The execution of the actual monetary transaction is done
by Net Billing (sC) offering service C.
DataVerification
Service
TransactionProcessing
Service
StrikeIron (A)
CDYNE (B)
NetBilling (C)
0.8ACc =
0.5=BCc
cc
Aa false=
cc
Ba true=
Caption
Composition Relation
Source Node
Service Offer
v
ijc Internal Costs
cc
ja Credit Check
A"ribute
Figure 3.3Context-dependent cost structures of service providers.

98 CHAPTER 3. COMPLEX SERVICE AUCTION (CSA)
A mandatory step of the overall payment processing service is the credit assessment.
As a precondition, a transaction processing service has to check if the customer is credit
worthy in order to charge the corresponding account. The credit assessment has to be
performed at a central authority (e.g. Equifax, Experian or Trans Union) and generates
variable costs each time it is executed. In the concrete scenario, Net Billing has to bear
higher costs of 0.8 in case it is executed as a successor of the Sales Force data verification
service as it does not provide a credit check in advance. In contrary, the service offered by
CYDNE is capable of performing a credit check, which results in lower internal costs for
Net Billing of 0.5.
As already illustrated in Section 2.1.2.3 and Section 2.1.4, the instantiation ofa complex service is represented by a path from source to sink within the servicevalue network. Let F denote the set of all feasible paths from source to sink. Everyf ∈ F with f ⊂ E represents a possible instantiation of the complex service4.
Definition 3.2 [SERVICE VALUE NETWORK MODEL]. A service value network
model is an acyclic, k-partite and directed graph such that
(3.1) G = (V, E)
with the set of nodes V representing service offers and the set of edges E that denotes
technically feasible service compositions. G contains two designated nodes vs and v f
representing source and sink such that every feasible path f ∈ F connecting both nodes is
a possible instantiation of the complex service.
For illustration purpose, Figure 3.4 shows the model of a service value net-work with service offers V = v1, . . . ,v4 ∪ vs,v f and service providers S =
s1, . . . , s3. Every feasible path f ∈ F connecting source node vs and sink node v f
represents a possible realization of the overall complex service.
3.2 Bidding Language
As a formalization of information objects which are exchanged during auctionconduction a bidding language is introduced that is based on bidding languages
4Focusing on the presence or absence of a particular service i ∈ V, F−i represents the set ofall feasible paths from source to sink in the reduced graph G−i without node i and without all itsincoming and outgoing edges. In contrary, let Fi be the subset of all feasible paths from source tosink that explicitly entail node i.

3.2. BIDDING LANGUAGE 99
Caption
Composition Relation
Source Node
Sink Node
Service Offer
1v
Candidate Pool
Complex Service
1s
2s
3s
2v
3v
4v
1Y 2
Y
Service Provider
OwnershipRelation
v
s
Y
1
1a…
… 1
La
sv f
v
1sc
3sc
14c
12c
34c
sv
fv
1
2a…
… 2
La
1
3a…
… 3
La
1
4a…
… 4
La
Figure 3.4Service value network model.
for products with multiple attributes as discussed in [EWL06]. The formaliza-tion is aligned to multiattribute auction theory as presented in [PK02, RL05] andassures compliance with the WS-Agreement specification [ACD+04] in order toenable realization in decentralized environments such as the Web.
3.2.1 Scoring Function
A complex service – represented by a path f – is characterized by a configura-tion A f . The importance of certain attributes and prices of a requested complexservice is idiosyncratic and depends on the preferences of the requester. The re-questers’ preferences are represented by a scoring function S of the form:
(3.2) S(A f ) =
(
L
∑l=1
λl‖Alf ‖
)
The scoring function S represents the requesters’ preferences for a configura-tionA f of the complex service represented by f analog to the definition of scoringrules in [AC08]. It maps the configuration of a complex service to a value repre-
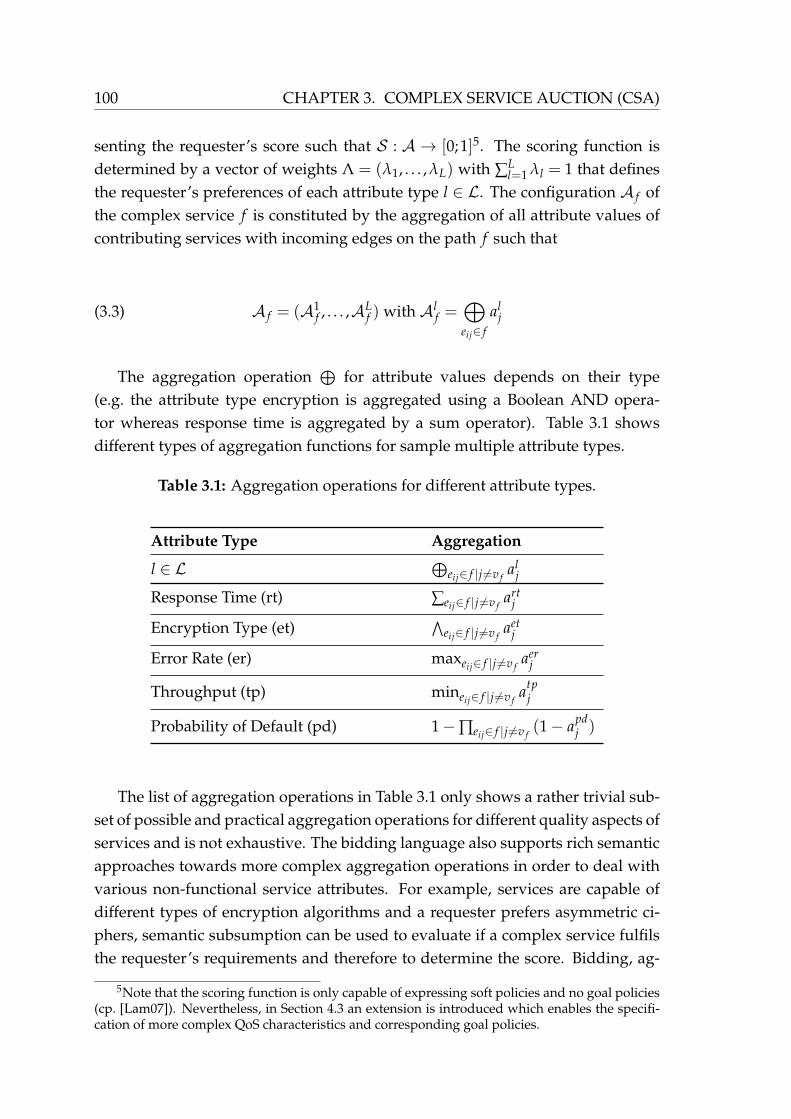
100 CHAPTER 3. COMPLEX SERVICE AUCTION (CSA)
senting the requester’s score such that S : A → [0;1]5. The scoring function isdetermined by a vector of weights Λ = (λ1, . . . ,λL) with ∑
Ll=1 λl = 1 that defines
the requester’s preferences of each attribute type l ∈ L. The configuration A f ofthe complex service f is constituted by the aggregation of all attribute values ofcontributing services with incoming edges on the path f such that
(3.3) A f = (A1f , . . . ,AL
f ) with Alf =
⊕
eij∈ f
alj
The aggregation operation⊕
for attribute values depends on their type(e.g. the attribute type encryption is aggregated using a Boolean AND opera-tor whereas response time is aggregated by a sum operator). Table 3.1 showsdifferent types of aggregation functions for sample multiple attribute types.
Table 3.1: Aggregation operations for different attribute types.
Attribute Type Aggregation
l ∈ L⊕
eij∈ f |j 6=v fal
j
Response Time (rt) ∑eij∈ f |j 6=v fart
j
Encryption Type (et)∧
eij∈ f |j 6=v faet
j
Error Rate (er) maxeij∈ f |j 6=v faer
j
Throughput (tp) mineij∈ f |j 6=v fa
tpj
Probability of Default (pd) 1−∏eij∈ f |j 6=v f(1− a
pdj )
The list of aggregation operations in Table 3.1 only shows a rather trivial sub-set of possible and practical aggregation operations for different quality aspects ofservices and is not exhaustive. The bidding language also supports rich semanticapproaches towards more complex aggregation operations in order to deal withvarious non-functional service attributes. For example, services are capable ofdifferent types of encryption algorithms and a requester prefers asymmetric ci-phers, semantic subsumption can be used to evaluate if a complex service fulfilsthe requester’s requirements and therefore to determine the score. Bidding, ag-
5Note that the scoring function is only capable of expressing soft policies and no goal policies(cp. [Lam07]). Nevertheless, in Section 4.3 an extension is introduced which enables the specifi-cation of more complex QoS characteristics and corresponding goal policies.

3.2. BIDDING LANGUAGE 101
gregation and management of complex QoS aspects within the CSA is presentedin detail in Section 4.3.
To assure comparability of attribute values from different attribute typesand to express requesters’ preferences more sophisticated, the aggregated at-tribute values are normalized on an interval [0;1] using preference functions withlower (bottom) and upper (top) boundaries. Boundaries are defined by a vectorΓ = ((γ1
B,γ1T), . . . , (γL
B,γLT)) for each attribute type l with γl
B 6= γlT ∀l ∈ L. γl
B rep-resents the attribute value boundary that results in a zero utility for the requesterwith respect to attribute type l (bottom boundary). γl
T denotes the attribute valueboundary for type l ∈ L that just leads to a maximum utility of 1 for the requester(top boundary). The mapping of attribute values is specified by the followingpiecewise defined function.
‖Alf ‖ =
gl(Alf ) ,if γl
T > γlB ∧ γl
B <Alf < γl
T
1 ,if γlT > γl
B ∧Alf ≥ γl
T
0 ,if γlT > γl
B ∧Alf ≤ γl
B
hl(Alf ) ,if γl
T < γlB ∧ γl
T <Alf < γl
B
1 ,if γlT < γl
B ∧Alf ≤ γl
T
0 ,if γlT < γl
B ∧Alf ≥ γl
B
(3.4)
The function g : A→ [0;1] is a monotonically increasing utility function suchthat gl represents the requesters’ utility function for attribute type l. An increas-ing utility function gl indicates that the requesters utility increases with highervalues of attribute type l. Attribute types such as response time result in a loss ofutility the higher the attribute value. The preference for these types of attributes isexpressed by a monotonically decreasing utility function such that h :A→ [0;1].
Example 3.2 [SCORING FUNCTION COMPUTATION]. This example illustrates how
different attribute types are aggregated along a path of composed service offers in service
value networks. It furthermore shows how the requester’s weights and boundaries for
different attribute types are used to compute the requesters individual score for feasible
service compositions constituting complex service instances.
As depicted in Figure 3.5 the service value network contains four service offerings
unambiguously specified by attribute values for the types response time (rt) and encryp-
tion (enc). Each feasible path f a = es1, e12, e2 f and f b = es3, e34, e4 f from source to
sink represents a possible instantiation of the complex service. Attribute values for the
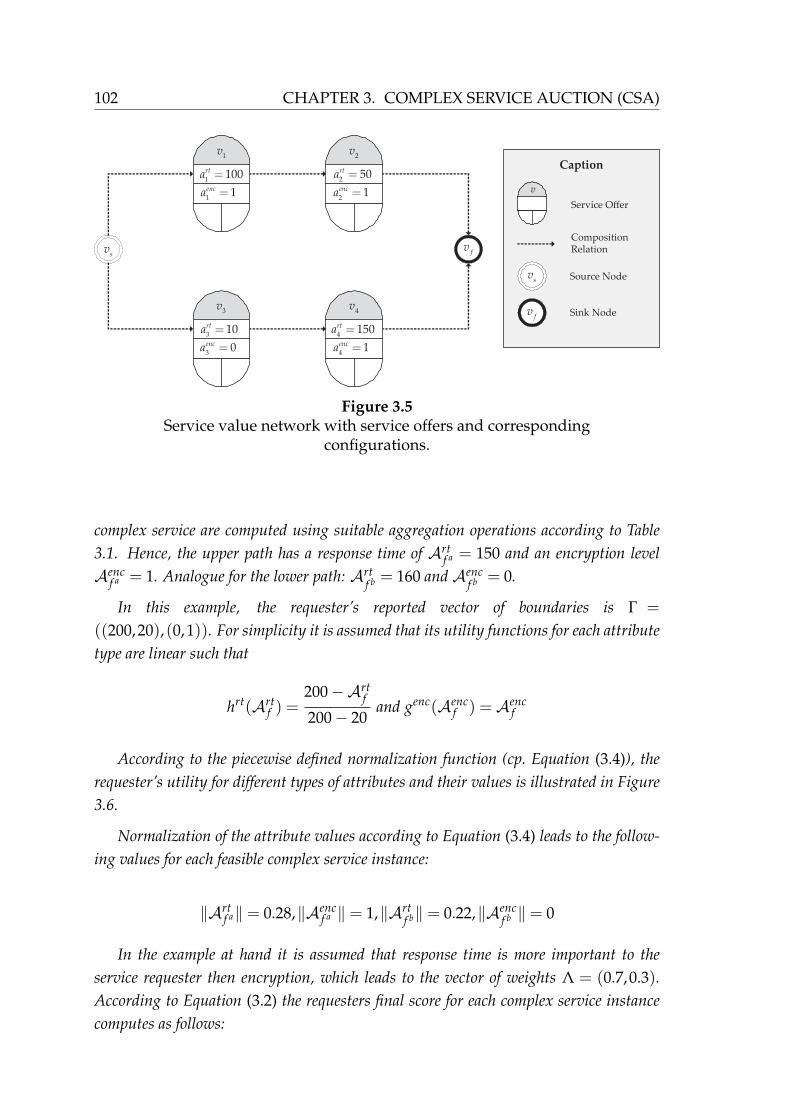
102 CHAPTER 3. COMPLEX SERVICE AUCTION (CSA)
Caption
Composition Relation
Source Node
Sink Node
Service Offer
1v
v
sv f
v
sv
fv
1100rta =
11enca =
2v
250rta =
21enca =
3v
310rta =
30enca =
4v
4150rta =
41enca =
Figure 3.5Service value network with service offers and corresponding
configurations.
complex service are computed using suitable aggregation operations according to Table
3.1. Hence, the upper path has a response time of Artf a = 150 and an encryption level
Aencf a = 1. Analogue for the lower path: Art
f b = 160 and Aencf b = 0.
In this example, the requester’s reported vector of boundaries is Γ =
((200,20), (0,1)). For simplicity it is assumed that its utility functions for each attribute
type are linear such that
hrt(Artf ) =
200−Artf
200− 20and genc(Aenc
f ) =Aencf
According to the piecewise defined normalization function (cp. Equation (3.4)), the
requester’s utility for different types of attributes and their values is illustrated in Figure
3.6.
Normalization of the attribute values according to Equation (3.4) leads to the follow-
ing values for each feasible complex service instance:
‖Artf a‖ = 0.28,‖Aenc
f a ‖ = 1,‖Artf b‖ = 0.22,‖Aenc
f b ‖ = 0
In the example at hand it is assumed that response time is more important to the
service requester then encryption, which leads to the vector of weights Λ = (0.7,0.3).According to Equation (3.2) the requesters final score for each complex service instance
computes as follows:
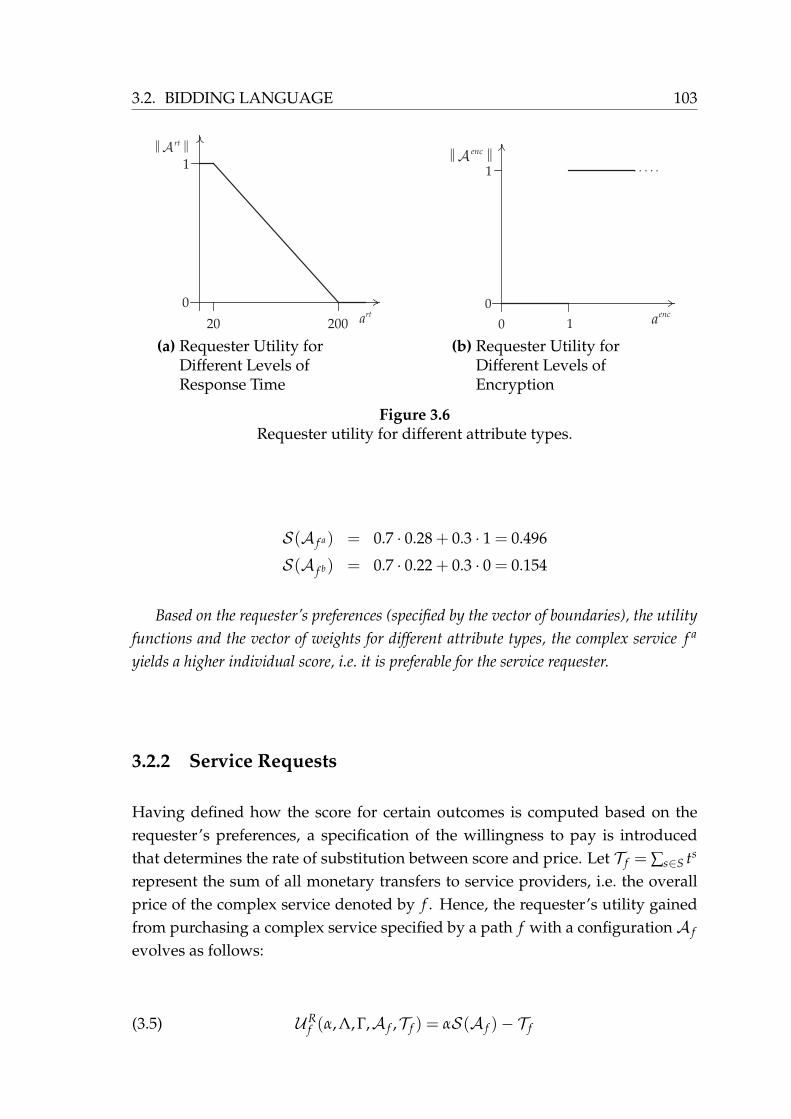
3.2. BIDDING LANGUAGE 103
rtA‖ ‖
rta20 200
1
0
(a) Requester Utility forDifferent Levels ofResponse Time
encA‖ ‖
enca1
1
0
0
(b) Requester Utility forDifferent Levels ofEncryption
Figure 3.6Requester utility for different attribute types.
S(A f a) = 0.7 · 0.28 + 0.3 · 1 = 0.496
S(A f b) = 0.7 · 0.22 + 0.3 · 0 = 0.154
Based on the requester’s preferences (specified by the vector of boundaries), the utility
functions and the vector of weights for different attribute types, the complex service f a
yields a higher individual score, i.e. it is preferable for the service requester.
3.2.2 Service Requests
Having defined how the score for certain outcomes is computed based on therequester’s preferences, a specification of the willingness to pay is introducedthat determines the rate of substitution between score and price. Let T f = ∑s∈S ts
represent the sum of all monetary transfers to service providers, i.e. the overallprice of the complex service denoted by f . Hence, the requester’s utility gainedfrom purchasing a complex service specified by a path f with a configuration A f
evolves as follows:
(3.5) URf (α,Λ,Γ,A f ,T f ) = αS(A f )− T f
104 CHAPTER 3. COMPLEX SERVICE AUCTION (CSA)
The factor α represents the requester’s willingness to pay for a ”perfect” con-figuration A f with score S(A f ) = 1 based on reported preferences. In otherwords α defines the individual substitution rate between quality and price suchthat the requester is indifferent between an increase of 1 score unit and α mon-etary units. Incorporating that information, a service request for a multidimen-sional complex service is defined as follows:
Definition 3.3 [MULTIDIMENSIONAL SERVICE REQUEST]. A multidimensional
service request for a complex service is a vector of the form:
(3.6) R := (Y ,α,Λ,Γ)
such that Y = (Y1, . . . ,YK) represents all candidate pools with the service value network,
i.e. necessary information for each service provider about preceeding service offers6. The
maximum willingness to pay for a configuration that yields a score of 1 is denoted by α.
The set of weights Λ represents the requesters’ preferences for different attribute types
l ∈ L. Γ denotes the set of lower and upper boundaries for each attribute type.
Example 3.3 [MULTIDIMENSIONAL SERVICE REQUEST]. Recalling Example 3.2, a
multidimensional service request of a requester with a willingness to pay of α = 100 is
denoted by
R = (v1,v3,v2,v4,100, (0.7,0.3), ((200,20), (0,1)))
For realization in a distributed environment such as the Web, compliance with inter-
operable and standardized exchange formats such as the WS-Agreement specification
[ACD+04] is preferable. As the representation of α, Λ and Γ is straightforward, the in-
formation about the service value network topology requires an intermediate XML-based
serialization such as the Graph eXchange Language (GXL) [Win02].
3.2.3 Service Offers
Having specified the bidding language for requesters we define a notation for theprovider side. A multidimensional service offer consists of an announced serviceconfiguration Aj and a corresponding price pij that a service provider wants tocharge for the service j being invoked depending on the predecessor service i. Anoffer bid bij = (Aj, pij) is a service offer for invocation of service j as a successor of
6Note that there are no preceeding service offers for services v with v ∈ Y1.

3.2. BIDDING LANGUAGE 105
service i. A service provider s announces a matrix of bids Bs ∈ B for all incomingedges to every service it owns:
Definition 3.4 [MULTIDIMENSIONAL SERVICE OFFER]. A multidimensional ser-
vice offer is a matrix of bids of the form:
Bs :=
bij = (Aj, pij), i ∈ τ(j), j ∈ σ(s)
(Aj,−∞), otherwise(3.7)
with τ(v) denotes the set of all predecessor services to service v with τ : V→ V and σ(s)
the set of all services owned by service provider s. Aj is an arbitrary service configuration.
Example 3.4 [MULTIDIMENSIONAL SERVICE OFFER]. Recall, the computation of
a scoring function is illustrated in Example 3.2. This example is extended with respect
to internal costs that occur on the provider side for the invocation of a service offer in a
certain context. Figure 3.7 shows the extended service value network.
Caption
Composition Relation
Source Node
Sink Node
Service Offer
1v
v
sv f
v
sv
fv
1100rta =
11enca =
2v
250rta =
21enca =
3v
310rta =
30enca =
4v
4150rta =
41enca =
110
sc =
38
sc =
1212c =
347c =
146c =
Figure 3.7Service value network with service offers and internal costs.
It is assumed that service offers v1 and v4 are owned by a service provider s1 and
service offers v2 and v3 are owned by another service provider s2. Therefore, the ownership
information σ(s1) = v1,v4 and σ(s2) = v2,v3 is public knowledge. For simplicity,
it is further assumed that service providers follow a truth-telling strategy, that is, they
report their multidimensional types truthfully. According to Definition 3.4 the service
offer bid matrixes for service providers s1 and s2 evolve as follows:

106 CHAPTER 3. COMPLEX SERVICE AUCTION (CSA)
Bs1 =
−∞ ((100,1),10) −∞ −∞ −∞ −∞
−∞ −∞ −∞ −∞ ((150,1),6) −∞
−∞ −∞ −∞ −∞ −∞ −∞
−∞ −∞ −∞ −∞ ((150,1),7) −∞
−∞ −∞ −∞ −∞ −∞ −∞
−∞ −∞ −∞ −∞ −∞ −∞
Bs2 =
−∞ −∞ −∞ ((10,0),8) −∞ −∞
−∞ −∞ ((50,1),12) −∞ −∞ −∞
−∞ −∞ −∞ −∞ −∞ −∞
−∞ −∞ −∞ −∞ −∞ −∞
−∞ −∞ −∞ −∞ −∞ −∞
−∞ −∞ −∞ −∞ −∞ −∞
3.3 Mechanism Implementation
To design a procurement auction for complex services we follow the approach ofalgorithmic mechanism design as introduced in [NR01]. The discipline of mecha-nism design forms a subset of game theory that focuses on solving social choiceproblems from an engineering perspective accounting for technical constraintsand preconditions. The central objective is to maximize the system’s welfareby allocating adequate service offers from a set of decentralized, self-interestedand rationally acting service providers. All service providers have private infor-mation about their internal costs and the quality of their services representingthe providers’ multidimensional types. The challenge is to design a mechanismm = (o, t) consisting of an allocation function o and a transfer function t that in-centivizes service providers to report their types truthfully to the auctioneer withrespect to all dimensions of all their service offerings. Such truthful information isnecessary in order to achieve the system-wide solution as desired. The allocationoutcome of such a mechanism yields the same solution as the overall problembased on the same social choice in a fictive setting with complete informationabout the agents’ types.
The auctioneer has to solve the problem of allocating a path f ∗ from sourceto sink connecting selected service offers within the network G that yields thehighest welfare as the sum of all utilities (consumer and provider surpluses). Themain challenge in such a setting is that types are private information to serviceproviders. Therefore the auctioneer is not capable of solving the welfare maxi-
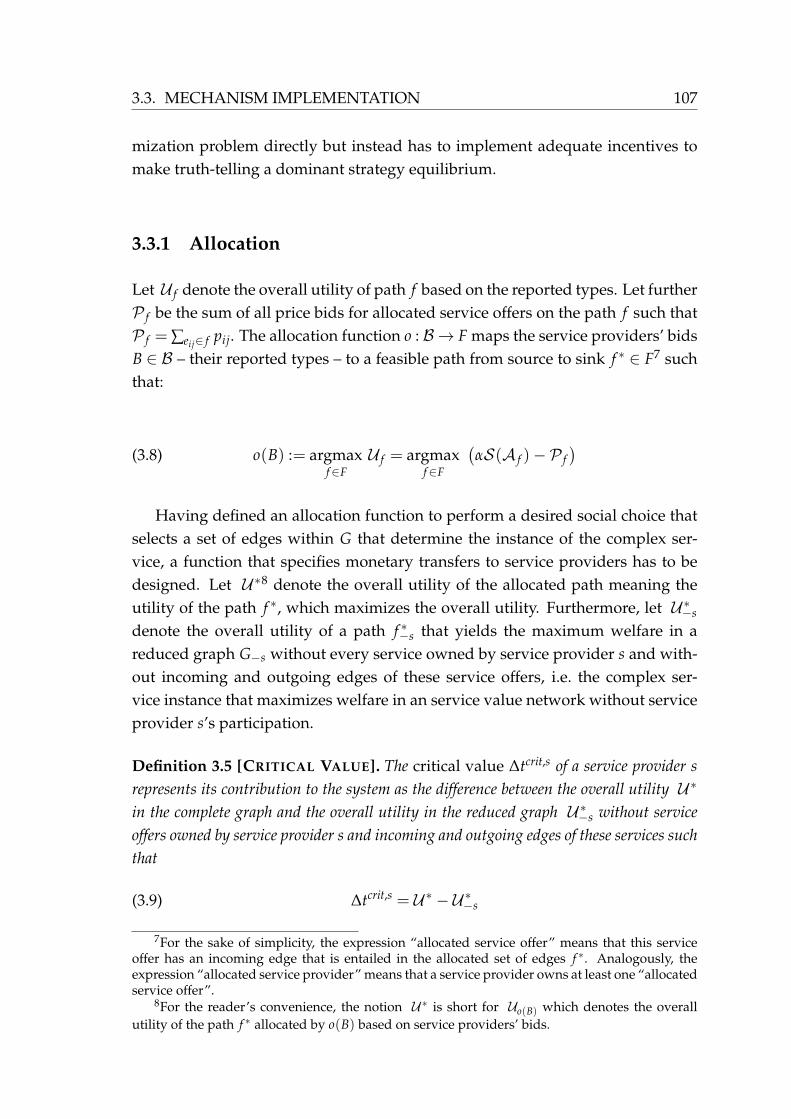
3.3. MECHANISM IMPLEMENTATION 107
mization problem directly but instead has to implement adequate incentives tomake truth-telling a dominant strategy equilibrium.
3.3.1 Allocation
Let U f denote the overall utility of path f based on the reported types. Let furtherP f be the sum of all price bids for allocated service offers on the path f such thatP f = ∑eij∈ f pij. The allocation function o : B→ F maps the service providers’ bidsB ∈ B – their reported types – to a feasible path from source to sink f ∗ ∈ F7 suchthat:
(3.8) o(B) := argmaxf∈F
U f = argmaxf∈F
(
αS(A f )−P f
)
Having defined an allocation function to perform a desired social choice thatselects a set of edges within G that determine the instance of the complex ser-vice, a function that specifies monetary transfers to service providers has to bedesigned. Let U ∗8 denote the overall utility of the allocated path meaning theutility of the path f ∗, which maximizes the overall utility. Furthermore, let U ∗−s
denote the overall utility of a path f ∗−s that yields the maximum welfare in areduced graph G−s without every service owned by service provider s and with-out incoming and outgoing edges of these service offers, i.e. the complex ser-vice instance that maximizes welfare in an service value network without serviceprovider s’s participation.
Definition 3.5 [CRITICAL VALUE]. The critical value ∆tcrit,s of a service provider s
represents its contribution to the system as the difference between the overall utility U ∗
in the complete graph and the overall utility in the reduced graph U ∗−s without service
offers owned by service provider s and incoming and outgoing edges of these services such
that
(3.9) ∆tcrit,s = U ∗ − U ∗−s
7For the sake of simplicity, the expression “allocated service offer” means that this serviceoffer has an incoming edge that is entailed in the allocated set of edges f ∗. Analogously, theexpression “allocated service provider” means that a service provider owns at least one “allocatedservice offer”.
8For the reader’s convenience, the notion U ∗ is short for Uo(B) which denotes the overallutility of the path f ∗ allocated by o(B) based on service providers’ bids.

108 CHAPTER 3. COMPLEX SERVICE AUCTION (CSA)
The following example shows the computation of service provider s’s contri-bution to the system.
Example 3.5 [CRITICAL VALUE AND INDIVIDUAL CONTRIBUTION]. The service
value network in Figure 3.8a consists of four service offers a,b, c and d and source and sink
nodes s and f . Service provider s1 owns two services b and c such that σ(s1) = b, c. For
simplicity there are no quality attributes of service offers, which implies one dimensional
types of service providers.
a b
s f
c d
0.1
0.3
0.2
0.1
0.9
0.1
(a) Complete Graph withParticipation of z
a
s f
d
0.1
0.2
(b) Reduced Graph withoutParticipation of z
Figure 3.8Critical value and individual contribution.
Values on the edges within the graph denote price bids of service providers for all
incoming edges of service offers they own. Focusing on service provider s1, there are bids
bab = 0.3, bcb = 0.2 and bsc = 0.1. Assuming a service requester’s willingness to pay of
α the path f ∗ = esc, ecb, ec f is allocated by o(B) as it yields the highest overall utility of
U ∗ = α− 0.2, which represents the highest welfare.
In order to determine service provider s1’s critical value ∆tcrit,s1 – i.e. s1’s utility
contribution to the system – the overall utility U ∗−s1in the reduced graph depicted in
Figure 3.8b without s1’s participation is computed. In the absence of service provider
s1’s service offers b and c only a single path from source to sink remains. Hence, the path
f ∗−s1= esa, ead, ed f is allocated and represents the only feasible complex service instance
which results in an overall utility of U ∗−s1= α− 0.3.
Consequently the critical value evolves as ∆tcrit,s1 = 0.1, which represents service
provider s1’s contribution the overall system.
3.3.2 Transfer
Every service provider s receives a monetary transfer ts for all services s owns thatare allocated by o(B). Analogue to the idea of a second-price auction, a monetary

3.3. MECHANISM IMPLEMENTATION 109
compensation ts − ∑eij|eij∈o,j∈σ(s),i∈τ(j) pij for service provider s that owns serviceoffers j ∈ σ(s) corresponds to the monetary equivalent of the utility gap betweenthe allocated path and the allocated path in the reduced graph without s and allits incoming and outgoing edges, i.e the critical value of service provider s. Inother words the additional payment ts −∑eij|eij∈o,j∈σ(s),i∈τ(j) pij ≥ 0 is a monetaryequivalent to the utility service provider s contributes to the overall utility of thesystem. Thus, the transfer ts represents the price that service provider s couldhave charged without loosing its participation in the winning allocation:
U ∗ − U ∗−s = ts − ∑eij|eij∈o,j∈σ(s),i∈τ(j)
pij
ts = ∑eij|eij∈o,j∈σ(s),i∈τ(j)
pij + (U ∗ − U ∗−s)
ts = ∑eij|eij∈o,j∈σ(s),i∈τ(j)
pij + ∆tcrit,s
Consequently, the transfer function ts for service provider s is defined as
ts :=
∑i∈τ(j) ∑j∈σ(s) pij + (U ∗ − U ∗−s), if eij ∈ o
0, otherwise(3.10)
The transfer function belongs to the class of VCG-based payment schemeswhich implements valuable mechanism properties that are extensively analyzedin Chapter 5.
Costs cs that service provider s has to bear for performing offered and allo-cated services result accordingly:
cs :=
∑i∈τ(j) ∑j∈σ(s) cij, if eij ∈ o
0, otherwise(3.11)
3.3.3 Summary
The goal of the mechanism implementation is to incentivize service providersto report their types truthfully to the auctioneer. This fosters a system-wide so-
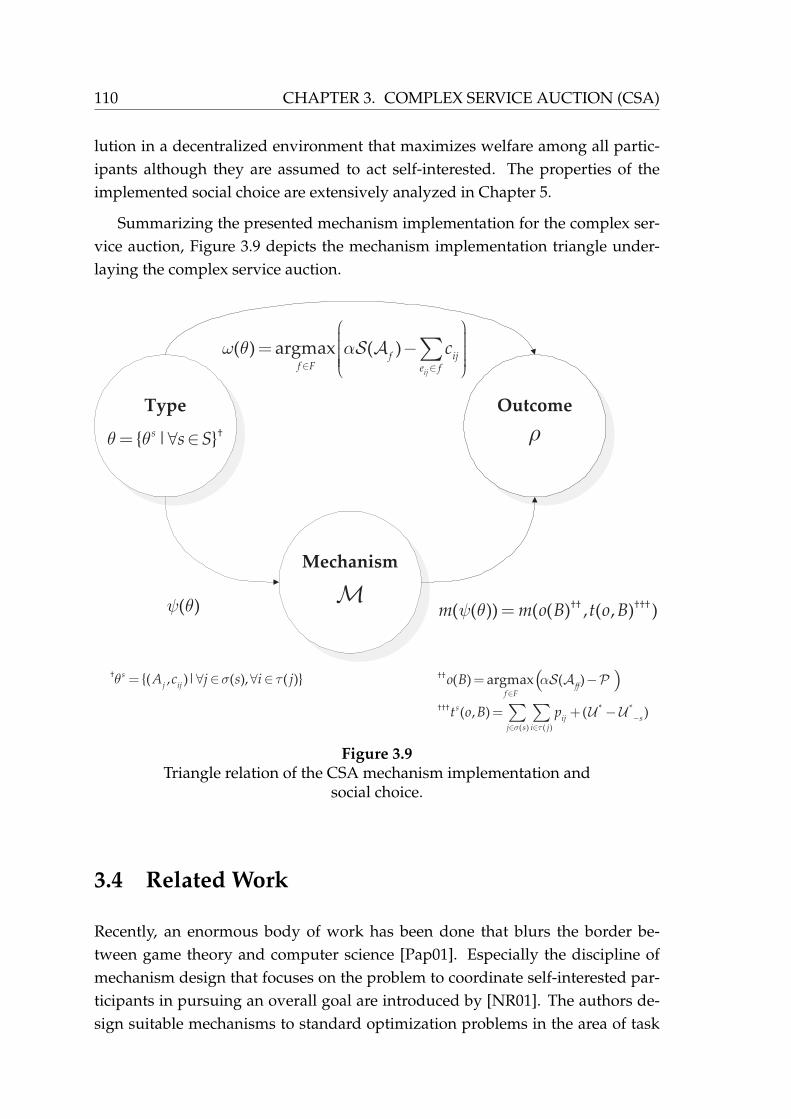
110 CHAPTER 3. COMPLEX SERVICE AUCTION (CSA)
lution in a decentralized environment that maximizes welfare among all partic-ipants although they are assumed to act self-interested. The properties of theimplemented social choice are extensively analyzed in Chapter 5.
Summarizing the presented mechanism implementation for the complex ser-vice auction, Figure 3.9 depicts the mechanism implementation triangle under-laying the complex service auction.
Mechanism
Type Outcome
( ) argmax ( )ij
ijf F e f
fcω θ α
∈ ∈
− =
∑S A
( )ψ θ †† †††( ( )) ( ( ) , ( , ) )m m o B t o Bψ θ =
† | s s Sθ θ= ∀ ∈
M
ρ
† ( , )| ( ), ( )s
j ijA c j s i jθ σ τ= ∀ ∈ ∀ ∈ ( )
††† * *
( ) (
††
)
( )
( , ) ( )
( ) argmaxff
f F
s
ij sj s i j
t o B
o
p
B
σ τ
α∈
−∈ ∈
−
= + −
=
∑ ∑
S A P
U U
Figure 3.9Triangle relation of the CSA mechanism implementation and
social choice.
3.4 Related Work
Recently, an enormous body of work has been done that blurs the border be-tween game theory and computer science [Pap01]. Especially the discipline ofmechanism design that focuses on the problem to coordinate self-interested par-ticipants in pursuing an overall goal are introduced by [NR01]. The authors de-sign suitable mechanisms to standard optimization problems in the area of task

3.4. RELATED WORK 111
scheduling and routing. In incentive compatible mechanisms agents are incen-tivized to choose the strategy of revealing their true type. Incentive compatiblemechanisms such as the celebrated Vickrey-Clarke-Groves (VCG) mechanism arefirstly introduced and extensively investigated by [Vic61, Cla71, Gro73, GL78].
Most of the research has been done with respect to truth-telling of one-dimensional types. The field of designing incentive compatible mechanisms,that induce truth-telling of multidimensional properties of goods or services, stilllacks deeper research. A thorough analysis and investigation in the area of mul-tidimensional optimal auctions and the design of optimal scoring rules has beendone by [CIoWM93, Bra97, AC05]. An investigation of the winner determina-tion problem in configurable multiattribute auctions from an operational researchperspective without accounting for mechanism design aspects such as incentivecompatibility has been done in [BK05]. In [PK02, PK05], iterative multiattributeprocurement auctions are introduced while focusing on mechanism design issuesand on solving the multiattribute allocation problem. Preferences for multidi-mensional goods and multidimensional types in scoring auctions are extensivelyinvestigated in [AC08] and extended to combinatorial auctions in [MPW08]. Nev-ertheless their work does not consider compositions and sequences of services aswell as their technical feasible interrelations in order to coordinate value gener-ation. All of these approaches assume bundles of goods in scenarios where thesequence and order does not matter and therefore cannot be applied to compositeservices that only fulfil their objectives in the right sequence of composition.
Nevertheless, combinatorial auctions yield major drawbacks regarding com-putational feasibility that result from an NP-hard complexity. Computational fea-sibility implies a trade-off between optimality and valuable mechanism proper-ties such as incentive compatibility. Several authors propose approximate so-lutions for incentive compatible mechanisms to overcome issues of computa-tional complexity [MN08b, NR07, Ron01, RL05]. Path auctions as a subset ofcombinatorial auctions reduce complexity through predefining all feasible ser-vice combinations in an underlying graph topology and are investigated by[FRS06, HS01, AT07]. In their work, path auctions are utilized for pricing androuting in networks of resources such as computation or electricity. Application-related issues of auctions to optimal routing are examined by [FCSS05, MT07].All of these approaches deal with the utility services layer according to the ser-vice classification by [BS08, BBS08] and hence do not cover the problems relatedto elementary services and complex services.
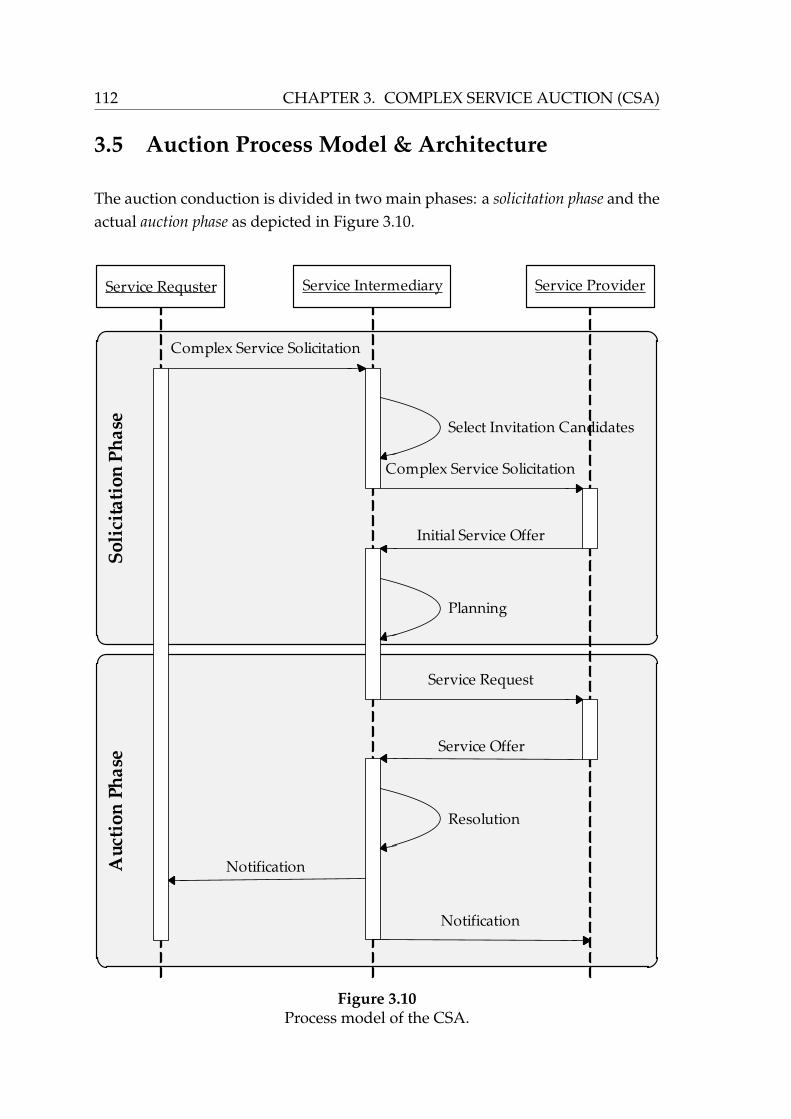
112 CHAPTER 3. COMPLEX SERVICE AUCTION (CSA)
3.5 Auction Process Model & Architecture
The auction conduction is divided in two main phases: a solicitation phase and theactual auction phase as depicted in Figure 3.10.
Figure 3.10Process model of the CSA.

3.5. AUCTION PROCESS MODEL & ARCHITECTURE 113
The solicitation phase serves as an initial screening phase regarding the ser-vice request and potential service provider candidates to be invited to participatein the auction. The service requester sends a complex service solicitation to the ser-vice intermediary which initiates the coordination process. The complex servicesolicitation specifies required modularized functionality which determines thecandidate pools that are sequentially involved in the production of the complexservice requested.
Based on this information, the service intermediary reasons about potentialservice providers to be invited to participate in the auction phase. There are dif-ferent forms of finding and defining suitable participants. The service intermedi-ary can step into the role of pushing the invitation process using e.g. a registry tofind adequate service providers. It is also possible to reverse the roles in such alookup scenario, meaning that potential participants are proactively searching forsuitable coordination services provided by a service intermediary. Potential par-ticipants could also subscribe to a notification service – analogue to the observerdesign pattern – in order to automatically be informed if an adequate auctionservice is available.
Having defined the set of potential service providers to participate in the auc-tion phase, the service intermediary sends out the complex service solicitationand additional information as an invitation to the candidates. This informationenables service providers to register their service offerings to be part of the ser-vice value network and to be considered in the auction phase by sending initial
service offers.
Combining the information about the complex service solicitation and the ini-tial service offers from service providers, the service intermediary plans the topol-ogy of the service value network and proceeds its virtual formation (cp. Section2.1.4 and Section 3.1). This step concludes the solicitation phase and lays the basisto the actual auction phase.
The auction phase embodies the central coordination process to allocate andprice complex services. Messages and information objects exchanged during theauction conduction are fully specified according to the bidding language in Sec-tion 3.2. The topology information about the service value network as well as therequester’s preferences and willingness to pay is sent as a service request (cp. Sec-tion 3.2.2) to registered service providers. Having received the requester’s infor-mation, the service providers privately submit their service offers – as specified inSection 3.2.3 – to the service intermediary. Having collected necessary informa-tion from requester and provider side, the service intermediary resolves the auc-

114 CHAPTER 3. COMPLEX SERVICE AUCTION (CSA)
tion by computing the winner determination and resulting monetary transfers.The auction process concludes with notifications about the final outcome andcorresponding transfers sent to the service requester and the service providers.
Providing an architectural overview, Figure 3.11 shows service providers thatintent to participate in the auction, their service offers which are realized in alightweight manner and necessary big Web services that enable the overall coor-dination of the auction process.
ServiceProvider
Service
Offer
REST Interface
WSDLInterface
Participant
Service
Service
Offer
REST Interface
ServiceProvider
Service
Offer
REST Interface
WSDLInterface
Participant
Service
Service
Offer
REST Interface
Complex Service Auction Platform
AbstractComposition
Coordinator
Service
WSDLInterface
Auction process coordination
Candidate binding Candidate binding Candidate binding
Figure 3.11Architectural overview of the CSA.
The CSA platform as the central coordination unit communicates with po-tential participants via a coordinator service implemented as a Web service with aWSDL interface. Analogously, each service provider exposes a participant service
for the message exchange with the coordinator. After the coordination phaseis completed, concrete candidate service instances are bound to each step inthe abstract composition in a lightweight manner leveraging the simplicity of
3.6. REALIZATION & IMPLEMENTATION 115
REST/HTTP interfaces. The final composition embodies the outcome of the co-ordination process in the form of a concrete complex service instance.
3.6 Realization & Implementation
This section provides an in-depth analysis of the ComputeAllocation algorithmwhich performs the winner determination in the complex service auction. Specialchallenges that result from aggregation operations such as min and max as wellas Boolean operations which are used in the context of semantic QoS extensions(cp. Section 4.3) are outlined and adequate remedies are discussed. The proce-dure of the algorithm is illustrated stepwise by means of an extensive example.Furthermore, this section introduces a prototypical implementation of a servicevalue network planner tool and an agent-based simulation tool to analyze thecomplex service auction.
From an algorithmic mechanism design perspective computational feasibilityaccording to Requirement 5 is a central desideratum in order to implement themechanism in an online system which requires on-the-fly computation at run-time.
It is well-known that solving the winner determination problem in generalcombinatorial auctions is NP-complete. Focusing on finding efficient compu-tational approaches, several algorithms have been proposed to solve the winnerdetermination problem [PS98, RPH98, SSGL05].
The solution to the allocation problem in (3.8) can be compute in polynomialtime using well-known graph algorithms to determine the “shortest” path withina network such as the Dijkstra algorithm [Dij59].
According to the payment scheme in (3.11) the allocation must be computedtwice for each allocated service offer – based on the graph with the service offer-ings of the service provider receiving the payment and without its participation.In the second case the graph can be preprocessed and reduced by all service of-ferings owned by the service provider that receives the payment. After the re-duction the allocation can be computed accordingly which yields the same timecomplexity.
Nevertheless, the extension of the complex service auction with respect tocomplex QoS aggregation using also aggregation operations that require com-plete information about predecessors’ attribute values – memory-dependent at-tribute types (e.g. cp. Section 4.3) – such as min, max and Boolean operations may

116 CHAPTER 3. COMPLEX SERVICE AUCTION (CSA)
result in sub-optimal solutions using the traditional Dijkstra algorithm. Analogueto the problem of negative edge weights which is well-known in literature [Dij59],memory-dependent operations may result in non-monotone utility characteris-tics. Such behavior conflicts with the main procedure of the Dijkstra algorithm,that is, it truncates a sub-path which is directly dominated by another sub-paththat intersects it at the point of intersection. Considering an attribute type en-
cryption which is aggregated by a Boolean AND operation according to Table 3.1.A sub-path f 1
s dominates another sub-path f 2s as it yields a higher utility which
results from an aggregated value for encryption of TRUE. In case both sub-pathsintersect at a certain node, the Dijkstra algorithm only considers f 1
s and drops f 2s
as f 1s yields a higher overall utility so far. Nevertheless, this might be error prone
if the subsequent service offer does not support encryption which leads to an ag-gregated encryption value for f 1
s of FALSE. Hence, the former decision of drop-ping f 2
s might have been incorrect since now both sub-paths are not encryptedand f 2
s might dominate f 1s in price.
To overcome illustrated shortcomings of the Dijkstra algorithm, Algorithm 3.1accounts for attribute types which are aggregated by memory-dependent opera-tions always yielding an optimal solution.
Algorithm 3.1 ComputeAllocation
Require: V, E, B1: Q← getNodesPoolWise(V)2: for all u ∈ Q do3: states [u]← getNonMonotoneStates(u)4: for all w ∈ states [u] do5: utility [u][w]←−∞
6: path [u][w]← ∅
7: while getNextNode(Q) 6= null do8: u← getNextNode(Q)9: removeNode(u, Q)
10: for all v ∈ getSuccesors(u, E) do11: for all w ∈ states [u] do12: w← computeState(w, euv, B)13: altUtility← computeUtility(path [u][w] ∪ euv, B)14: if altUtility > utility [v][w] then15: utility [v][w]← altUtility16: path [v][w]← path [u][w] ∪ euv
17: w∗← argmaxw∈states [v f ](utility [v f ][w])
18: return path [v f ][w∗]
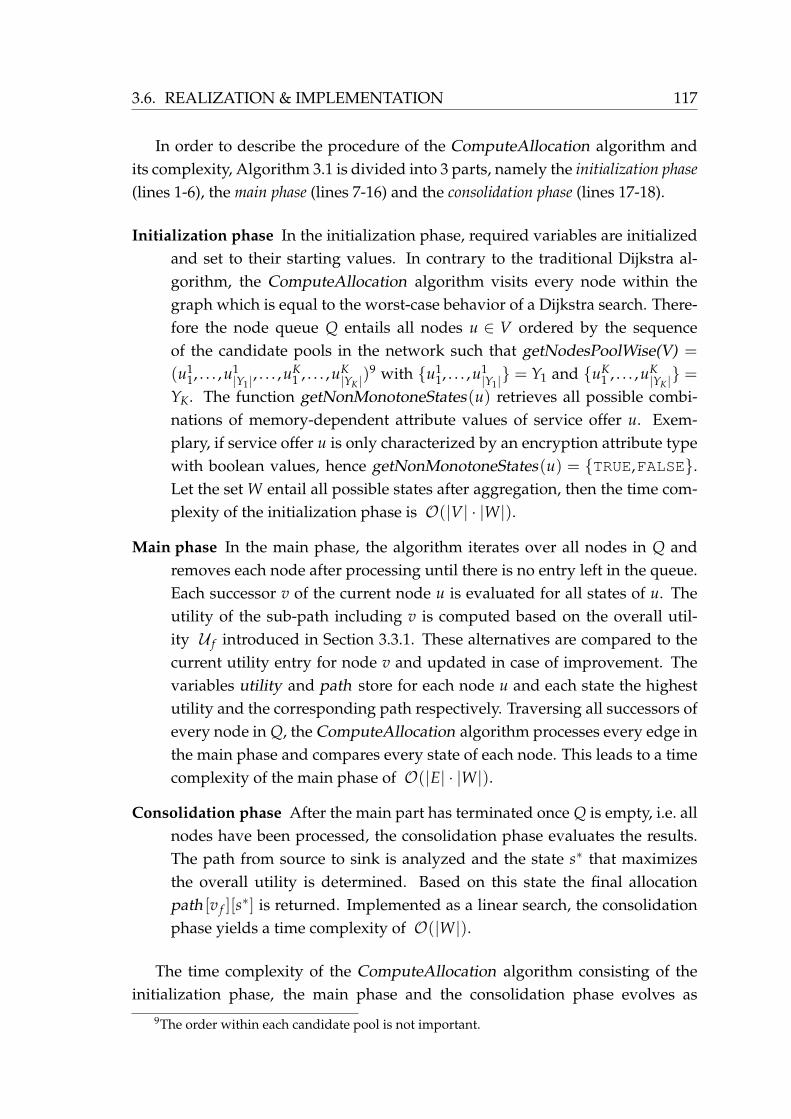
3.6. REALIZATION & IMPLEMENTATION 117
In order to describe the procedure of the ComputeAllocation algorithm andits complexity, Algorithm 3.1 is divided into 3 parts, namely the initialization phase
(lines 1-6), the main phase (lines 7-16) and the consolidation phase (lines 17-18).
Initialization phase In the initialization phase, required variables are initializedand set to their starting values. In contrary to the traditional Dijkstra al-gorithm, the ComputeAllocation algorithm visits every node within thegraph which is equal to the worst-case behavior of a Dijkstra search. There-fore the node queue Q entails all nodes u ∈ V ordered by the sequenceof the candidate pools in the network such that getNodesPoolWise(V) =
(u11, . . . ,u1
|Y1|, . . . ,uK
1 , . . . ,uK|YK |
)9 with u11, . . . ,u1
|Y1| = Y1 and uK
1 , . . . ,uK|YK | =
YK. The function getNonMonotoneStates(u) retrieves all possible combi-nations of memory-dependent attribute values of service offer u. Exem-plary, if service offer u is only characterized by an encryption attribute typewith boolean values, hence getNonMonotoneStates(u) = TRUE,FALSE.Let the set W entail all possible states after aggregation, then the time com-plexity of the initialization phase is O(|V| · |W|).
Main phase In the main phase, the algorithm iterates over all nodes in Q andremoves each node after processing until there is no entry left in the queue.Each successor v of the current node u is evaluated for all states of u. Theutility of the sub-path including v is computed based on the overall util-ity U f introduced in Section 3.3.1. These alternatives are compared to thecurrent utility entry for node v and updated in case of improvement. Thevariables utility and path store for each node u and each state the highestutility and the corresponding path respectively. Traversing all successors ofevery node in Q, the ComputeAllocation algorithm processes every edge inthe main phase and compares every state of each node. This leads to a timecomplexity of the main phase of O(|E| · |W|).
Consolidation phase After the main part has terminated once Q is empty, i.e. allnodes have been processed, the consolidation phase evaluates the results.The path from source to sink is analyzed and the state s∗ that maximizesthe overall utility is determined. Based on this state the final allocationpath [v f ][s
∗] is returned. Implemented as a linear search, the consolidationphase yields a time complexity of O(|W|).
The time complexity of the ComputeAllocation algorithm consisting of theinitialization phase, the main phase and the consolidation phase evolves as
9The order within each candidate pool is not important.

118 CHAPTER 3. COMPLEX SERVICE AUCTION (CSA)
O(|V| · |W| + |E| · |W| + |W|). Assuming a worst case number of edges withrespect to the number of nodes |E| can be substituted by ( |V|−2
2 )2 + (|V| − 2).This leads to an overall complexity of O(|W| · |V|2). The time complexity re-garding the number of service offers and connecting edges, the number of pathsrespectively, is polynomial which means that the algorithms run-time is robustwith respect to a changing number of participants and feasible complex serviceinstances. In contrary to the NP-complete complexity in general combinatorialauctions this is a valuable achievement that enables the conduction of the com-plex service auction in online systems.
Nevertheless, with respect to the number of memory-dependent attributetypes and the number of their discrete values, the computational complexity isexponential (e.g. assuming N Boolean attribute types, |W|= 2N). From a domain-specific perspective, the impact of this theoretical result is rather weak, as thenumber of states that have to be iterated by the algorithm decreases rapidly in theaverage case. Figure 3.12 illustrates the run-time performance of the ComputeAl-location algorithm in a scenario with 100 service offers in 10 candidate pools(cp. Figure 3.12a) and 1000 service offers in 100 candidate pools (cp. Figure 3.12b).The service value network is assumed to be fully connected which means thateach service offer has the maximum number of incoming edges which results inthe maximum number of feasible paths from source to sink. The algorithm’s per-formance is evaluated dependent on the number of memory-dependent attributetypes. Attribute types are assumed to be Boolean and their values are uniformlydistributed for each service offer. Although the theoretical worst case analysisof the computational complexity is exponential with respect to the number N ofmemory-dependent attribute types ( O(2N)), the average case with boolean at-tribute types results in a linear increasing computation time. The ComputeAllo-cation algorithm quickly solves the winner determination problem even for hugeinstances and satisfies Requirement 5 (computational tractability).
Example 3.6 [ALLOCATION COMPUTATION WITH MEM.-DEPENDENT QOS].
This example illustrates the procedure of the ComputeAllocation algorithm in a step-
wise manner based on the service value network as depicted in Figure 3.13.
The service value network consists of 6 service offers V = 1,2,3,4,5,6 ∪ s, f .
Each service offer u is unambiguously configured through a boolean attribute value aencu
for the attribute type encryption whereas 1≡ TRUE and 0≡ FALSE. Values on incoming
edges pij represent price bids of service providers. It is assumed that the service requester’s
willingness to pay αS(A f ) for a complex service depending on its QoS characteristicsA f
evolves as
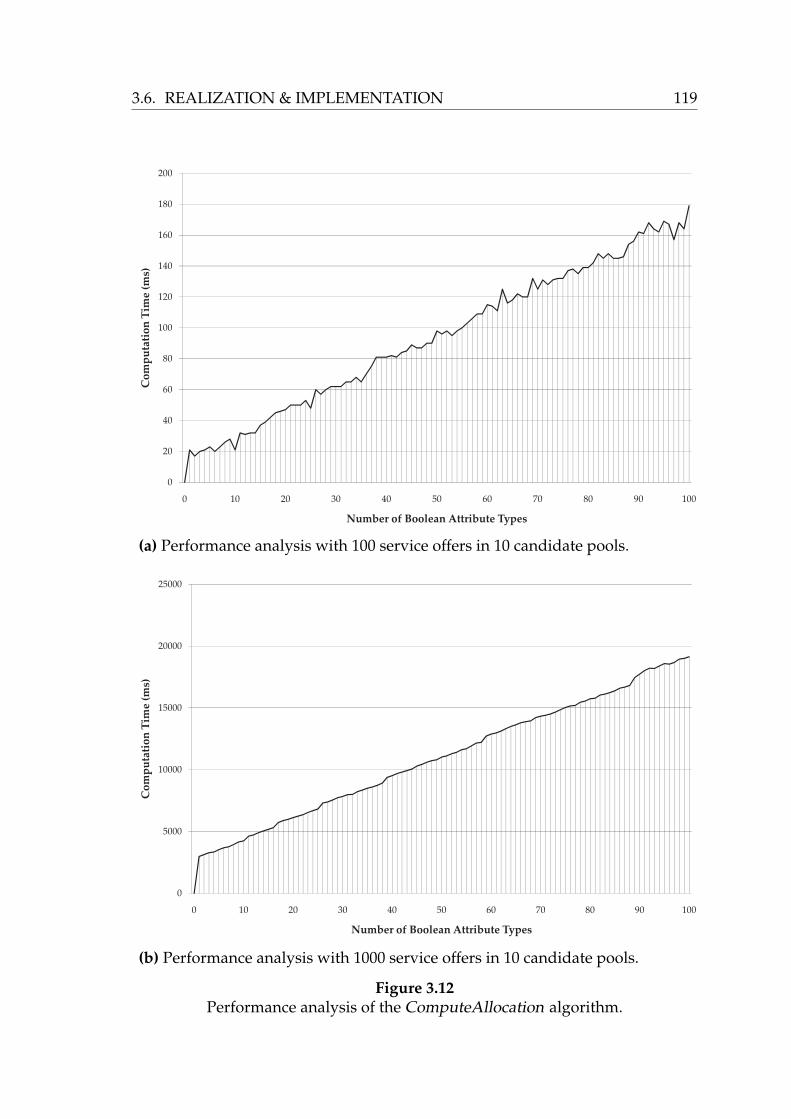
3.6. REALIZATION & IMPLEMENTATION 119
(a) Performance analysis with 100 service offers in 10 candidate pools.
(b) Performance analysis with 1000 service offers in 10 candidate pools.
Figure 3.12Performance analysis of the ComputeAllocation algorithm.

120 CHAPTER 3. COMPLEX SERVICE AUCTION (CSA)
Caption
Composition Relation
Source Node
Sink Node
Service Offer
1
v
s f
s
f
11enca =
2
21enca =
4
40enca =
5
51enca =
11
sp =
42
sp =
3
31enca =
6
60enca =
452p = 56
1p =
126p = 23
2p =
152p =
421p =
262p =
Figure 3.13Service value network with service offers exposing
memory-dependent attribute types.
αS(A f ) =
15, if A f = 1
12, if A f = 0
Table 3.2 illustrates the algorithm’s procedure to find an optimal allocation based on
the allocation function in Section 3.3.1 accounting for the memory-dependent attribute
type encryption representing the QoS of service offers.
In the last step when node f is processed, the optimal path given a not encrypted
complex service results as f ∗FALSE
= es1, e15, e56, e6 f and yields an overall utility of
U f ∗FALSE
= 8. Given a encrypted complex service, the optimal allocation is f ∗TRUE
=
es1, e12, e23, e3 f with an overall utility of U f ∗TRUE
= 6. Thus, the state s∗ = FALSE
yields an optimal path f ∗ = es1, e15, e56, e6 f that maximizes the system’s overall utility
U ∗ = 8.
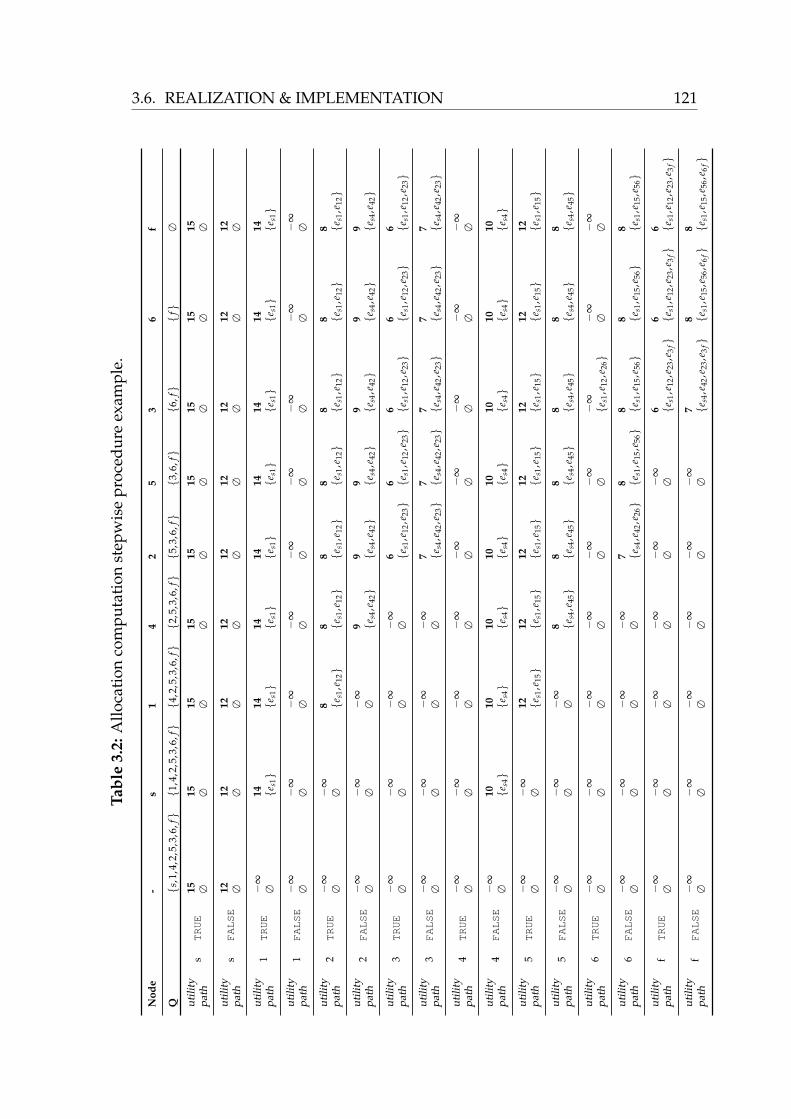
3.6. REALIZATION & IMPLEMENTATION 121T
ab
le3.2
:A
lloca
tion
com
pu
tati
onst
epw
ise
pro
ced
ure
exam
ple
.
No
de
-s
14
25
36
f
Q
s,1,
4,2,
5,3,
6,f
1,4
,2,5
,3,6
,f4
,2,5
,3,6
,f2
,5,3
,6,f5
,3,6
,f
3,6
,f
6,f
f
∅
utili
tys
TRUE
15
15
15
15
15
15
15
15
15
path
∅∅
∅∅
∅∅
∅∅
∅
utili
tys
FALSE
12
12
12
12
12
12
12
12
12
path
∅∅
∅∅
∅∅
∅∅
∅
utili
ty1
TRUE
−∞
14
14
14
14
14
14
14
14
path
∅
e s1
e s
1
e s
1
e s
1
e s
1
e s
1
e s
1
e s
1
utili
ty1
FALSE
−∞
−∞
−∞
−∞
−∞
−∞
−∞
−∞
−∞
path
∅∅
∅∅
∅∅
∅∅
∅
utili
ty2
TRUE
−∞
−∞
88
88
88
8pa
th∅
∅
e s1,
e 12
e s
1,e 1
2
e s
1,e 1
2
e s
1,e 1
2
e s
1,e 1
2
e s
1,e 1
2
e s
1,e 1
2
utili
ty2
FALSE
−∞
−∞
−∞
99
99
99
path
∅∅
∅
e s4,
e 42
e s
4,e 4
2
e s
4,e 4
2
e s
4,e 4
2
e s
4,e 4
2
e s
4,e 4
2
utili
ty3
TRUE
−∞
−∞
−∞
−∞
66
66
6pa
th∅
∅∅
∅
e s1,
e 12,
e 23
e s1,
e 12,
e 23
e s1,
e 12,
e 23
e s
1,e 1
2,e 2
3
e s
1,e 1
2,e 2
3
utili
ty3
FALSE
−∞
−∞
−∞
−∞
77
77
7pa
th∅
∅∅
∅
e s4,
e 42,
e 23
e s4,
e 42,
e 23
e s4,
e 42,
e 23
e s
4,e 4
2,e 2
3
e s
4,e 4
2,e 2
3
utili
ty4
TRUE
−∞
−∞
−∞
−∞
−∞
−∞
−∞
−∞
−∞
path
∅∅
∅∅
∅∅
∅∅
∅
utili
ty4
FALSE
−∞
10
10
10
10
10
10
10
10
path
∅
e s4
e s
4
e s
4
e s
4
e s
4
e s
4
e s
4
e s
4
utili
ty5
TRUE
−∞
−∞
12
12
12
12
12
12
12
path
∅∅
e s
1,e 1
5
e s
1,e 1
5
e s
1,e 1
5
e s
1,e 1
5
e s
1,e 1
5
e s
1,e 1
5
e s
1,e 1
5
utili
ty5
FALSE
−∞
−∞
−∞
88
88
88
path
∅∅
∅
e s4,
e 45
e s
4,e 4
5
e s
4,e 4
5
e s
4,e 4
5
e s
4,e 4
5
e s
4,e 4
5
utili
ty6
TRUE
−∞
−∞
−∞
−∞
−∞
−∞
−∞
−∞
−∞
path
∅∅
∅∅
∅∅
e s
1,e 1
2,e 2
6
∅∅
utili
ty6
FALSE
−∞
−∞
−∞
−∞
78
88
8pa
th∅
∅∅
∅
e s4,
e 42,
e 26
e s1,
e 15,
e 56
e s1,
e 15,
e 56
e s
1,e 1
5,e 5
6
e s
1,e 1
5,e 5
6
utili
tyf
TRUE
−∞
−∞
−∞
−∞
−∞
−∞
66
6pa
th∅
∅∅
∅∅
∅
e s1,
e 12,
e 23,
e 3f
e s1,
e 12,
e 23,
e 3f
e s1,
e 12,
e 23,
e 3f
utili
tyf
FALSE
−∞
−∞
−∞
−∞
−∞
−∞
78
8pa
th∅
∅∅
∅∅
∅
e s4,
e 42,
e 23,
e 3f
e s1,
e 15,
e 56,
e 6f
e s1,
e 15,
e 56,
e 6f


Chapter 4
Applicability Extensions
The management of QoS metrics directly impacts the success of organizations
participating in e-commerce.
[CSM+04]
T his section introduces design extensions to the complex service auction toenable the applicability in service value networks in order to coordinate dis-
tributed activities in creating and provisioning complex services to customers. Acompensation transfer function is introduced in Section 5.1.2. The auction con-duction is divided in a declaration phase and an execution phase in order toincorporate ex-post information on provided QoS levels (monitoring informa-tion) into the monetary transfers which are distributed among participating ser-vice providers. Counteracting the absence of budget balance, Section 4.2 intro-duces the budget-balanced interoperability transfer function (ITF). By sacrificingincentive compatibility to a certain degree, the design of the payment scheme in-centivizes service providers to increase their services’ degree of interoperability.Properties of the ITF are analyzed in detail in Section 6.2. As quality aspects aregaining importance especially in the context of services, Section 4.3 introducesand rule-based extension to the complex service auction which allows for the de-scription and evaluation of complex QoS characteristics and their incorporationin the allocation and pricing component of the basic mechanism.

124 CHAPTER 4. APPLICABILITY EXTENSIONS
4.1 Verification and Service Level Enforcement
In Section 2.1.3.3, the expressiveness of the complex service auction with respectto complex QoS characteristics and their management has been introduced indetail. From a computer science perspective, protocols and algorithms for dis-tributed environments such as the Internet have been designed under the im-plicit assumption that participants report their information (e.g. the QoS of theirservice offers) truthfully. This assumption only holds for predefined algorithmsand processes that produce a deterministic outcome but not in the context of self-interested service providers that constantly seek to maximize their individualutility while participating in distributed systems.
This section provides an extension for the complex service auction that en-hances the transfer function (cp. Section 2.2.3.5) by a compensation function,which on the one hand punishes service providers for untruthful announcementsabout the QoS of their service offers and on the other hand compensates servicerequesters for the utility loss they incur due to resulting non-performance.
4.1.1 Related Work
The assumption that service providers only announce attribute values that theyactually perform during execution is not realistic [NRTV07]. The basic assump-tion in traditional mechanism design theory is that agents can follow any of theirstrategies no matter what their type is1. Nevertheless, especially in algorithmicmechanism design, settings are observed in which computer systems can gain ex-
tra information about the agents and their behavior that can be used in the mech-anism. According to [NR01] the mechanism implementation can be divided intotwo phases: a declaration phase and an execution phase.
Declaration phase In the declaration phase the service requester and the serviceproviders announce requests and offers according to the bidding languageintroduced in Section 3.2. The declaration phase predominantly collects in-formation objects exchanged according to the coordination protocol. Theseinformation objects represent agents’ types which are directly reported tothe coordinator. This information which is explicitly announced by theagent, is the only information available to the coordinator at this point oftime.
1Nevertheless it is obvious that the agents’ strategy space is limited due to technological andphysical restrictions

4.1. VERIFICATION AND SERVICE LEVEL ENFORCEMENT 125
Execution phase Based on the information gathered in the declaration phase, thecoordinator allocates a subset of service offers that together form the de-sired complex service instance. In the execution phase the service offersthat have been allocated by the mechanism embody the complex service in-stance, which is executed sequentially. During this phase the actual realizedoutput of each participant can be observed by the coordinator using mon-itoring techniques [SMS+02, PBB+04]. Required monitoring tasks can alsobe outsourced by the coordinator in order to leverage external core com-petencies [Men02]. Such a scenario enables the coordinator to observe theagents’ types with respect to reported QoS attributes and control the actualoutcome of offered services. Consequently, payments to allocated agentsare transferred after execution in order to incorporate ex-post informationabout the services’ performances.
The utilization of the extra information about the agents that can be observedex-post in the execution phase enables the design of a penalty for deviating fromthe announced attributes. That is an equivalent monetary penalty componentwhich enhances the transfer function in order to implement a threat based on apunishment for lying about the offered QoS.
4.1.2 Compensation
Let alj be the announced attribute value for attribute type l of service j’s configura-
tion. Furthermore let alj be the verified attribute value for attribute type l realized
by service j and monitored during execution. Analogously, Aj and Aj denoteannounced and verified configurations of service j. Distinguishing between an-nounced and verified attribute values, the overall utility may also differ. Recallthat U ∗ denotes the ex-ante overall utility of the allocated path f ∗ based on theinformation available in the declaration phase. Furthermore, U ∗s denotes theex-post overall utility that results from the complex service instance formed byallocated service offers on a path f ∗ and based on the verified attribute valuesa1
j , . . . , alj of all service offers j ∈ σ(s). According to the Compensation-and-Bonus
mechanism introduced in [NR01] a compensation function ∆tcomp,s is constructedas follows:
(4.1) ∆tcomp,s := (U ∗ − U ∗s)
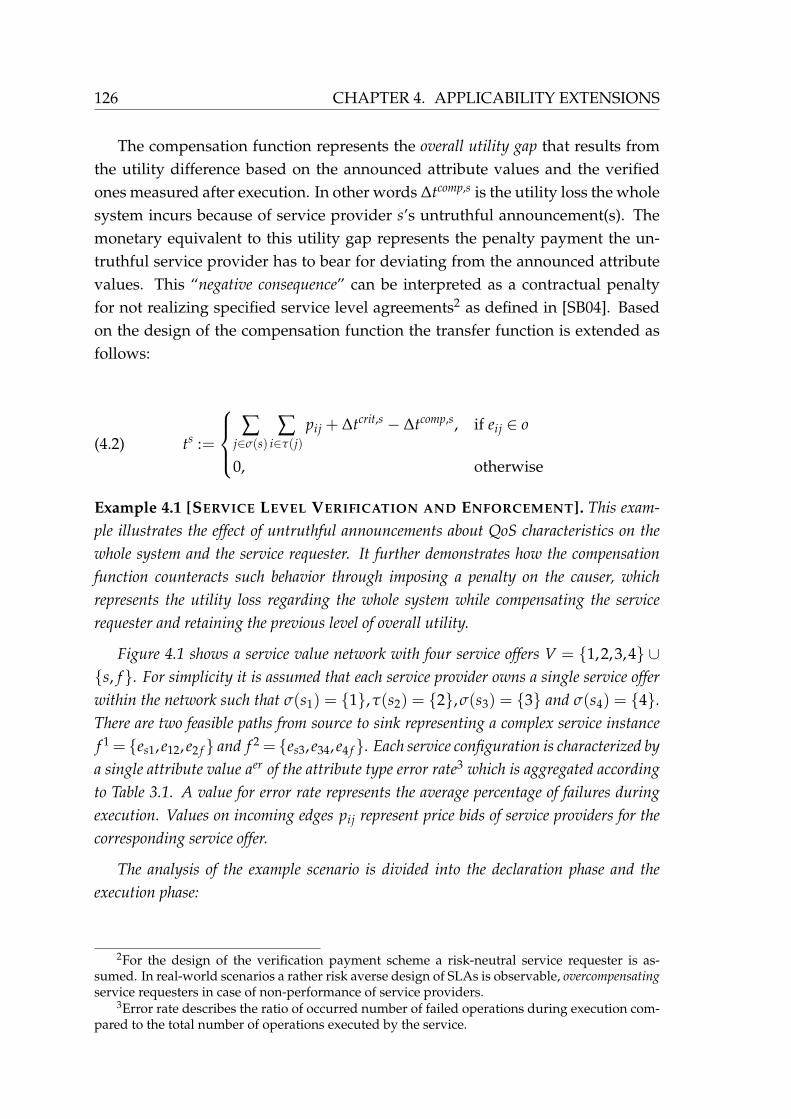
126 CHAPTER 4. APPLICABILITY EXTENSIONS
The compensation function represents the overall utility gap that results fromthe utility difference based on the announced attribute values and the verifiedones measured after execution. In other words ∆tcomp,s is the utility loss the wholesystem incurs because of service provider s’s untruthful announcement(s). Themonetary equivalent to this utility gap represents the penalty payment the un-truthful service provider has to bear for deviating from the announced attributevalues. This “negative consequence” can be interpreted as a contractual penaltyfor not realizing specified service level agreements2 as defined in [SB04]. Basedon the design of the compensation function the transfer function is extended asfollows:
ts :=
∑j∈σ(s)
∑i∈τ(j)
pij + ∆tcrit,s − ∆tcomp,s, if eij ∈ o
0, otherwise(4.2)
Example 4.1 [SERVICE LEVEL VERIFICATION AND ENFORCEMENT]. This exam-
ple illustrates the effect of untruthful announcements about QoS characteristics on the
whole system and the service requester. It further demonstrates how the compensation
function counteracts such behavior through imposing a penalty on the causer, which
represents the utility loss regarding the whole system while compensating the service
requester and retaining the previous level of overall utility.
Figure 4.1 shows a service value network with four service offers V = 1,2,3,4 ∪s, f . For simplicity it is assumed that each service provider owns a single service offer
within the network such that σ(s1) = 1,τ(s2) = 2,σ(s3) = 3 and σ(s4) = 4.There are two feasible paths from source to sink representing a complex service instance
f 1 = es1, e12, e2 f and f 2 = es3, e34, e4 f . Each service configuration is characterized by
a single attribute value aer of the attribute type error rate3 which is aggregated according
to Table 3.1. A value for error rate represents the average percentage of failures during
execution. Values on incoming edges pij represent price bids of service providers for the
corresponding service offer.
The analysis of the example scenario is divided into the declaration phase and the
execution phase:
2For the design of the verification payment scheme a risk-neutral service requester is as-sumed. In real-world scenarios a rather risk averse design of SLAs is observable, overcompensatingservice requesters in case of non-performance of service providers.
3Error rate describes the ratio of occurred number of failed operations during execution com-pared to the total number of operations executed by the service.
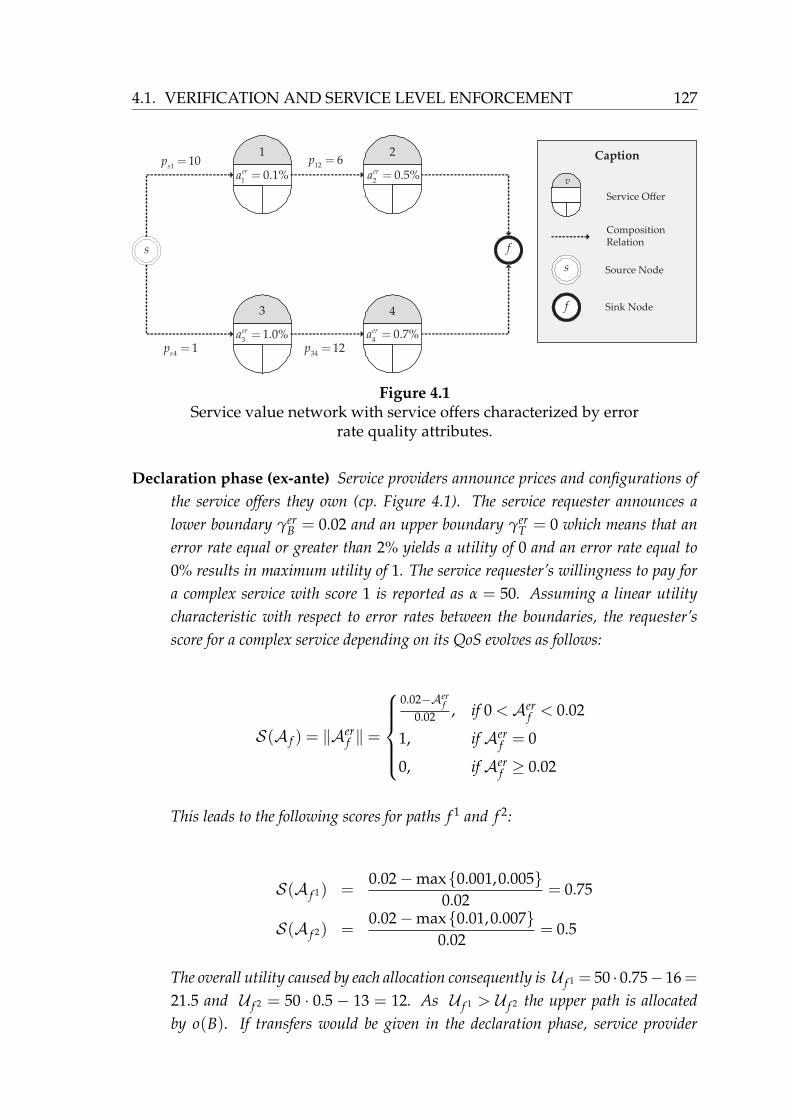
4.1. VERIFICATION AND SERVICE LEVEL ENFORCEMENT 127
Caption
Composition Relation
Source Node
Sink Node
Service Offer
1
v
s f
s
f
10.1%era =
3
31.0%era =
110
sp =
41
sp =
2
20.5%era =
4
40.7%era =
3412p =
126p =
Figure 4.1Service value network with service offers characterized by error
rate quality attributes.
Declaration phase (ex-ante) Service providers announce prices and configurations of
the service offers they own (cp. Figure 4.1). The service requester announces a
lower boundary γerB = 0.02 and an upper boundary γer
T = 0 which means that an
error rate equal or greater than 2% yields a utility of 0 and an error rate equal to
0% results in maximum utility of 1. The service requester’s willingness to pay for
a complex service with score 1 is reported as α = 50. Assuming a linear utility
characteristic with respect to error rates between the boundaries, the requester’s
score for a complex service depending on its QoS evolves as follows:
S(A f ) = ‖Aerf ‖ =
0.02−Aerf
0.02 , if 0 <Aerf < 0.02
1, if Aerf = 0
0, if Aerf ≥ 0.02
This leads to the following scores for paths f 1 and f 2:
S(A f 1) =0.02−max0.001,0.005
0.02= 0.75
S(A f 2) =0.02−max0.01,0.007
0.02= 0.5
The overall utility caused by each allocation consequently is U f 1 = 50 · 0.75− 16=21.5 and U f 2 = 50 · 0.5 − 13 = 12. As U f 1 > U f 2 the upper path is allocated
by o(B). If transfers would be given in the declaration phase, service provider
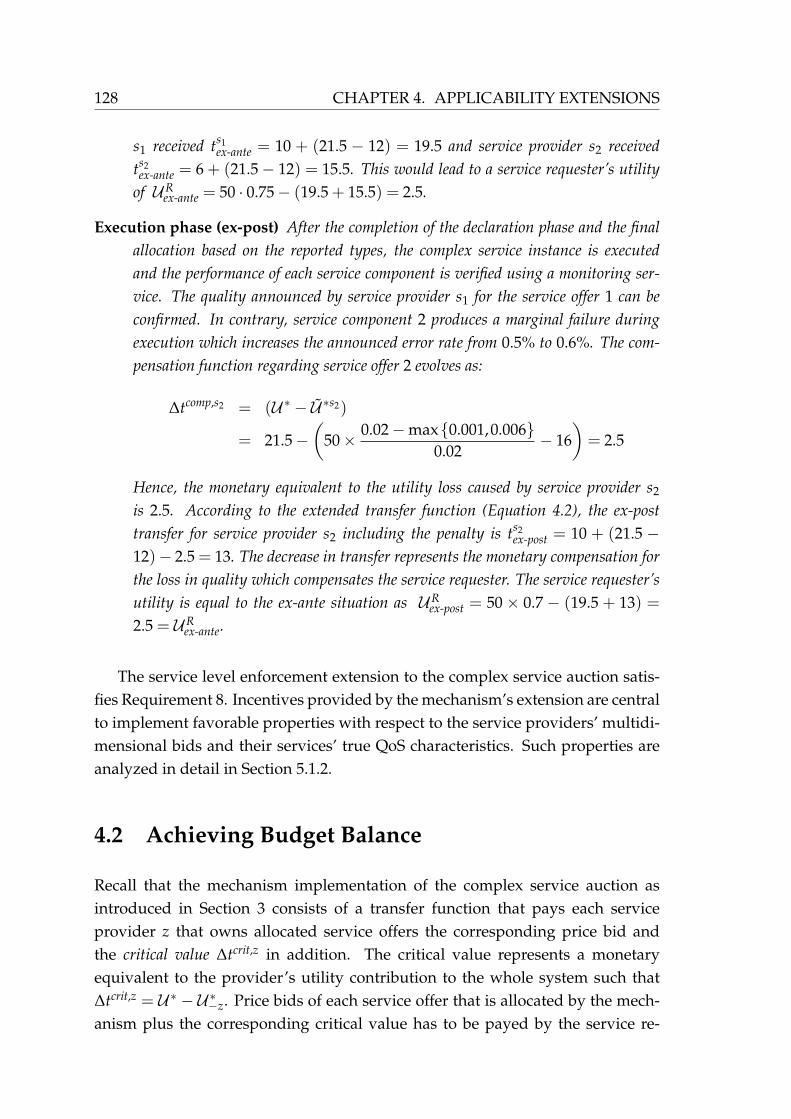
128 CHAPTER 4. APPLICABILITY EXTENSIONS
s1 received ts1ex-ante = 10 + (21.5 − 12) = 19.5 and service provider s2 received
ts2ex-ante = 6 + (21.5− 12) = 15.5. This would lead to a service requester’s utility
of URex-ante = 50 · 0.75− (19.5 + 15.5) = 2.5.
Execution phase (ex-post) After the completion of the declaration phase and the final
allocation based on the reported types, the complex service instance is executed
and the performance of each service component is verified using a monitoring ser-
vice. The quality announced by service provider s1 for the service offer 1 can be
confirmed. In contrary, service component 2 produces a marginal failure during
execution which increases the announced error rate from 0.5% to 0.6%. The com-
pensation function regarding service offer 2 evolves as:
∆tcomp,s2 = (U ∗ − U ∗s2)
= 21.5−(
50×0.02−max0.001,0.006
0.02− 16
)
= 2.5
Hence, the monetary equivalent to the utility loss caused by service provider s2
is 2.5. According to the extended transfer function (Equation 4.2), the ex-post
transfer for service provider s2 including the penalty is ts2ex-post = 10 + (21.5 −
12)− 2.5 = 13. The decrease in transfer represents the monetary compensation for
the loss in quality which compensates the service requester. The service requester’s
utility is equal to the ex-ante situation as URex-post = 50 × 0.7 − (19.5 + 13) =
2.5 = URex-ante.
The service level enforcement extension to the complex service auction satis-fies Requirement 8. Incentives provided by the mechanism’s extension are centralto implement favorable properties with respect to the service providers’ multidi-mensional bids and their services’ true QoS characteristics. Such properties areanalyzed in detail in Section 5.1.2.
4.2 Achieving Budget Balance
Recall that the mechanism implementation of the complex service auction asintroduced in Section 3 consists of a transfer function that pays each serviceprovider z that owns allocated service offers the corresponding price bid andthe critical value ∆tcrit,z in addition. The critical value represents a monetaryequivalent to the provider’s utility contribution to the whole system such that∆tcrit,z = U ∗ − U ∗−z. Price bids of each service offer that is allocated by the mech-anism plus the corresponding critical value has to be payed by the service re-
4.2. ACHIEVING BUDGET BALANCE 129
quester to the service providers. A provider’s critical value compensates the in-dividual contribution to the system which depends on the contributions of theother participants. Hence, the payments, the service requester has to distributeamong service providers depend on multiple factors (e.g. the network topology).In case the payments exceed the requester’s willingness to pay in the complexservice auction, the budget balance (cp. Requirement 4) cannot be achieved bythe mechanism.
Example 4.2 [ACHIEVING BUDGET BALANCE]. This example illustrates a non-
budget-balanced outcome of the complex service auction. Figure 4.2 shows a service value
network with service offers V = 1,2,3,4,5,6 ∪ s, f . For simplicity it is assumed that
each service provider s1, . . . , s6 only owns a single service within the network such that
σ(si) = i with i = 1, . . . ,6. Furthermore it is assumed that the requester’s willingness
to pay is α = 12.
1 2
s 3 4 f
5 6
2
5
3
6
2
5
4
6
6
7
Figure 4.2Non-budget-balanced outcome of the CSA.
The mechanism allocates the path f ∗ = es1, e14, e4 f as it yields the highest over-
all utility of U f ∗ = 12 − (2 + 2) = 8. According to the transfer function, each ser-
vice provider that owns allocated service offers receives a payment consisting of the
corresponding price bid and the critical value such that t1 = 2 + (8 − 3) = 7 and
t4 = 2 + (8 − 4) = 6. The sum of transfers which are distributed among the service
providers exceeds the service requesters willingness to pay as UR = 12− (7 + 6) =−1.
Thus, an amount of 1 unit has to be externally subsidized in order to obtain the efficient
allocation maximizing welfare.
This section introduces an extension to the complex service auction that re-stores the desideratum of budget balance (cp. Requirement 4) by sacrificing truth-fulness to a certain degree. The extension is based on the design of a transferfunction – the Interoperability Transfer Function (ITF) – that limits overpayments

130 CHAPTER 4. APPLICABILITY EXTENSIONS
to satisfy budget balance constraints (cp. Section 2.2.3.5). The ITF implementsincentives for increasing services’ interoperability with adjacent offers to fosterthe growth of agile service value networks with an increased level of feasiblecomplex service instantiations.
4.2.1 Related Work
In VCG-based mechanisms, the transfers are indeterministic and can be arbitrar-ily high [AT07]. These so called overpayments or a mechanism’s frugality is a cen-tral characteristic of a mechanism implementation, which is extensively analyzedin mechanism design research especially in the context of graph-based implemen-tations [ESS04, AT07, Tal03, KK05]. A frugality ratio that measures the paymentsin a truthful mechanism compared to a non-truthful implementation is a ratiothat “characterizes the cost of insisting on truthfulness” [KK05]. Approaches topredict overpayments that occur in truthful graph-based mechanisms have beendeveloped in [KN04] in the context of random graphs and in [KN05] for large-scale networks.
Addressing this shortcoming of VCG-based mechanisms, an approximatelyefficient and budget-balanced solution to overpayment issues in VCG-based com-binatorial auctions is introduced in [PKE01] while focusing on solving linearproblems subject to budget balance that yield approximate incentive compatiblesolutions. Another approach to counteract the loss of budget balance by sacrific-ing efficiency is introduced in [AT07] in the context of path auctions. In their workthey replace the efficient allocation function by a class of ”minimum functions”that yield lower overpayments in certain scenarios. Nevertheless they show thatit is always possible to construct worse case scenarios in which minimum func-tions perform as bad as the efficient variant.
4.2.2 Interoperability Transfer
Let T denote the sum of all incoming edges to service offers V \ v f . Fur-thermore let τi be the number of incoming edges to service offer i such that
∑i∈V\v f τi = T. The ratio ri =
τiT denotes the incoming-edge-ratio for each node.
Recall, eui represents an interoperable connection of service i ∈ V with serviceu ∈ V, meaning that service i is capable of interpreting service u’s output, i.e. ser-vice i is interoperable with service u. Thus, the more incoming edges to a serviceoffer, the higher its feasible interoperability with its predecessor services. Hence,

4.2. ACHIEVING BUDGET BALANCE 131
the incoming-edge-ratio ri represents the degree of interoperability of service i
with its predecessor services in comparison to all other services. Focusing on all
service offers owned by a service provider s, the ratio rs =∑i∈σ(s) τi
T denotes theincoming-edge-ratio of service provider s.
Let ∆tcrit,s denote the critical value of service provider s. The idea to con-struct a transfer function that accounts for budget balance constraints is basedon the work in [PKE01] and focuses on choosing adequate discounts ∆s for eachservice provider s ∈ S instead of paying every allocated service provider the crit-ical value. The decision on how to choose adequate discounts is formulated as ageneral optimization problem subject to budget balance constraints.
(4.3) Lτ(∆,∆tcrit,s) = ∑s∈S
rs(∆tcrit,s − ∆s)
Lτ represents the weighted distance function that measures the distance be-tween the service providers’ critical values and computed discounts with re-spect to the incoming-edge-ratio. The goal is to distribute the surplus S∗ =
αS(A f ∗) − P f ∗ in a way that it minimizes the distance function Lτ. In otherwords, the goal is to transfer discounts ∆s to service providers, which togetherminimize the overall weighted distance ∑s∈S rs(∆tcrit,s − ∆s) and do not exceedthe surplus S∗. Minimizing the distance function Lτ subject to budget balance,individual rationality and the critical values as upper boundaries leads to thefollowing special optimization problem:
min∆
∑s∈S
rs(∆tcrit,s − ∆s)(4.4)
s.t. ∑s∈S
∆s ≤S∗ (BB)
∆s ≤ ∆tcrit,s,∀s ∈ S (CV)
∆s ≥ 0,∀s ∈ S (IR)
The Lagrangian problem consequently follows such that
z(λ) = min∆
∑s∈S
rs(∆tcrit,s − ∆s) + λ(∑s∈S
∆s −S∗)

132 CHAPTER 4. APPLICABILITY EXTENSIONS
s.t. 0≤ ∆s ≤ ∆tcrit,s,∀s ∈ S
The problem decomposes into smaller problems for each s.
min∆s
(rs∆tcrit,s)− ∆s(λ− rs)
s.t. 0≤ ∆s ≤ ∆tcrit,s,∀s ∈ S
If the coefficient (λ − rs) is negative, the expression is minimized by setting∆s to the maximum value that does not violate the side condition which is ∆∗s =
∆tcrit,s. If the term (λ − rs) is positive, the whole expression is minimized by∆∗s = 0. If (λ− rs) = 0, ∆∗s is set to a value ∆s which is defined in the remainderof this section. Consequently the optimization problem implies finding a optimalthreshold parameter Cτ for λ such that
∆∗s(Cτ) =
∆tcrit,s, if Cτ < rs
∆s, if Cτ = rs
0, otherwise
(4.5)
Based on the optimal solution ∆∗, the complete interoperability transfer func-tion evolves accordingly:
tITF,s :=
∑i∈τ(j) ∑j∈σ(s) pij + ∆tcrit,s, if eij ∈ o,Cτ < rs
∑i∈τ(j) ∑j∈σ(s) pij + ∆s, if eij ∈ o,Cτ = rs
∑i∈τ(j) ∑j∈σ(s) pij, if eij ∈ o,Cτ > rs
0, otherwise
(4.6)
Service providers that have an incoming-edge ratio which equals the thresh-old (Cτ = rs) and own service offers with allocated incoming edges, receive a partof their critical value which depends on the number of service providers withCτ < rs, corresponding critical values and the number of service providers withCτ = rs. The value ∆s is defined as follows:

4.2. ACHIEVING BUDGET BALANCE 133
(4.7) ∆s :=
S∗ − ∑s∈S|Cτ<rs
∆tcrit,s
∑s∈S|Cτ=rs
1
4.2.3 Finding the Optimal Threshold Parameter
The threshold Cτ divides allocated service providers into two groups where onegets a discount of ∆tcrit,s and the other 0. Let k denote the threshold index suchthat if Cτ falls into the interval k such that Cτ ∈ [rτk+1 ,rτk
) service providers 1, . . . k
(ordered increasingly based on their critical values) get their critical value whileservice providers k + 1, . . . , I get no discount. Putting the solution ∆∗s(Cτ) in theLagrangian problem z(Cτ) leads to
(4.8) z(Cτ,k) =I
∑i=k+1
(ri∆tcrit,i) + Cτ
(
k
∑i=1
∆tcrit,i −S∗
)
The optimum is attained at
(4.9) C∗τ = rk∗+1,k∗
∑i=1
∆tcrit,i ≤S∗ ∧k∗+1
∑i=1
∆tcrit,i>S∗
Example 4.3 [ACHIEVING BUDGET BALANCE (CONTINUED)]. Recalling Example
4.2, this continuation illustrates how budget balance can be retained by implementing the
interoperability transfer function. In order to determine an optimal threshold parameter
Cτ, each service provider that owns allocated service offers is decreasingly ordered by
its incoming-edge-ratio rs. The number of possible edges within G is denoted by T =
10. Consequently, the incoming-edge-ratio r for service providers that own allocated
service offers evolves as rs1 =∑i∈σ(s1)
τi
T = 110 and rs4 = 2
10 . The vector of the ordered
incoming-edge ratios is ( 215 , 1
10). Equation (4.9) is satisfied by C∗τ = 110 with k∗ = 2
which is the solution that satisfies the conditions ∑k∗
i=1 ∆tcrit,i ≤S∗ ∧∑k∗+1i=1 ∆tcrit,i
>S∗.
The value ∆ for service provider s1 is ∆s1 = 8−41 = 4. Payments for allocated service
offers evolve accordingly such that tITF,s1 = 2 + 4 = 6 and tITF,s4 = 2 + 4 = 6. As
UR = 12− (6 + 6) = 0, the outcome of the extended complex service auction is budget-
balanced and does not have to be subsidized externally. It is important to notice that
the interoperability transfer function rewards service provider s4 for the high degree of
interoperability – i.e. the incoming-edge-ratio rs4 – which increases the variety of feasible
complex service compositions.

134 CHAPTER 4. APPLICABILITY EXTENSIONS
4.2.4 Summary
In summary, the ITF extension as a novel budget-balanced payment schemewhich satisfies Requirement 4 implements incentives for service providers to in-crease their services’ degree of interoperability which is shown in Section 6.2.2.
It is important to note that the incentives provided by the ITF are twofold:First, the ITF limits strategic behavior of service providers which is shown inSection 6.1. Second, the ITF rewards interoperability endeavors. Dependingon the design goals the payment scheme can be adjusted in order to calibrateboth effects. Introducing a calibration weight βITF ∈ [0;1] and a threshold termrs := βITFrs + (1− βITF) tcrit,s
∑s∈S ∆tcrit,s an adjustable interoperability transfer functionevolves as follows:
tITF,s :=
∑i∈τ(j) ∑j∈σ(s) pij + ∆tcrit,s, if eij ∈ o, Cτ < rs
∑i∈τ(j) ∑j∈σ(s) pij + ∆s, if eij ∈ o, Cτ = rs
∑i∈τ(j) ∑j∈σ(s) pij, if eij ∈ o, Cτ ≥ rs
0, otherwise
(4.10)
The computation of the optimal threshold parameter Cτ is done analogouslyto the procedure described in Section 4.2.3 accounting for rs instead of rs. Thus,βITF adjusts the transfer function with respect to both incentives. Higher valuesfor βITF result in stronger incentives for interoperability endeavors whereas lowervalues provide stronger incentives to reduce strategic behavior.
With respect to the service level enforcement extension, the ITF can easily becombined with the compensation function as introduced in Section 4.1. Serviceproviders that pass the threshold receive their critical value minus their compen-sation value. Note that in this case the computation of the optimal thresholdparameter has to be adjusted accordingly to assure budget balance.
4.3 Managing Service Quality
Recall that with the tremendous decrease of costs for the provision of highly scal-able services, service providers shift from price to quality competition. QoS isthe key criterion to keep the business competitive as it has serious implicationson the provider and consumer side [Pap08]. Thus, an efficient management of
4.3. MANAGING SERVICE QUALITY 135
highly complex QoS characteristics is inevitable for service-oriented value cre-ation in service value networks. In Section 3.2, the basic concept of QoS aggre-gation and evaluation has been described based on rather simple QoS attributessuch as response time, which are characterized by well-defined metrics to mea-sure corresponding values.
In order to determine the overall score for a provider based on the scoringfunction, the attribute values of the complex service have to be computed. Thetype of operation for aggregating attribute value highly depends on the attributetype. Basic quality of service attributes such as response time for example canbe aggregated with a sum operator. Table 3.1 shows different types of aggrega-tion functions for multiple attribute types exemplarily. For example, the overallthroughput of a complex service that consists of multiple service components isdetermined by the lowest throughput rate within the allocation and can thereforebe computed using a minimum operator.
Nevertheless, only considering basic quality of service attributes is not suffi-cient for dealing with complex non-functional service characteristics that expressrich semantic information. The auction mechanism must be capable of aggregat-ing a broad range of descriptive service attributes that express multiple qualityaspects (e.g. the physical hosting location of a service and additional semantic in-formation about the environment, a service’s usage policies or ownership rights). This section focuses on providing the conceptual foundations for a seamlessmanagement of more sophisticated QoS characteristics, which require a semanticunderstanding of their context and interrelations in order to measure and evalu-ate their particular occurrences.
To represent semantic knowledge about service quality attributes in an inter-operable manner, ontologies are used to describe a conceptualization of servicecharacteristics and properties. The following definition is predominantly used inthe semantic Web community [SBF98].
Definition 4.1 [ONTOLOGY]. An ontology is a formal explicit specification of a shared
conceptualization of a domain of interest.
In order to enable automatic processing and interpretation of explicit knowl-edge representations, adequate and machine-interpretable formalisms are used,which are explained in the following section.
136 CHAPTER 4. APPLICABILITY EXTENSIONS
4.3.1 Knowledge Representation Formalisms
As a formalism to represent an ontology framework the Web Ontology Language(OWL) is used. OWL is an ontology language standardized by the World WideWeb Consortium (W3C) [MvH04] and is based on the description logic (DL) for-malism [BCM+07]. Due to its close connection to DL it facilitates logical inferenc-ing and allows to derive conclusions from an ontology that have not been statedexplicitly. As a brief introduction a review of some of the modeling constructsof OWL using its DL-syntax is outlined here. The main elements of OWL areindividuals, properties that relate individuals to each other and classes that grouptogether individuals, which share some common characteristics. Classes as wellas properties can be put into subsumption hierarchies. Furthermore, OWL al-lows for describing classes in terms of complex class constructors that pose restric-tions on the properties of a class. For example, the statement BigCity ⊑ ∃ isCon-nectedTo.Highway describes the class of big cities, which are connected to someHighway. Subclass relationship can be expressed by a statement like BigCity ⊑InterestingCity, saying that any big city is also interesting.
For the reader’s convenience, ontologies are illustrated in UML notationwhere UML classes correspond to OWL concepts, UML associations to ob-ject properties, UML inheritance to sub-concept relations, UML dependenciesto OWL class instantiations and UML attributes to OWL datatype properties[BVEL04].
To enable rule-like knowledge representation which is not supported bythe modeling primitives based on OWL-DL, the Semantic Web Rule Language(SWRL) [HPSB+04] allows to extend OWL with Horn-like rules according tofirst-order semantics. Additionally, SWRL provides an XML-based formalization,which enables automatic processing of rule-based knowledge as an extension tothe OWL semantics. Furthermore SWRL allows for the implementation of algo-rithmic calculations such as mathematic operations and string comparison.
4.3.2 Semantic QoS Management
To foster a comprehensive management of QoS characteristics, the complex ser-vice auction is extended using concepts from Semantic Web research. Provid-ing a broad contextual knowledge about attribute types, their conceptualizationand relations to other concepts in a machine-readable and interoperable man-ner, ontologies are used to capture relevant semantic information. Based on thisknowledge, individual attribute types can be expressed using a rule language

4.3. MANAGING SERVICE QUALITY 137
formalism. The following example demonstrates the expressiveness of a seman-tic approach towards the description of QoS characteristics and the expression ofindividual requirements of requesters.
Example 4.4 [CSA WITH SEMANTIC QOS MANAGEMENT]. For the reader’s con-
venience, the scenario is reduced to a minimal setting that is sufficient to illustrate the
strength of semantic service description and attribute aggregation. Figure 4.3 shows a
service value network with four service offers 1,2,3 and 4 and three feasible paths from
source to sink: f 1 = es1, e12, e2 f , f 2 = es1, e14, e4 f and f 3 = es3, e34, e4 f .
Caption
Composition Relation
Source Node
Sink Node
Service Offer1
v
s fs
f
1DES128eta =
1
10.9psa =
12RSA128eta =
2
20.9psa =
13CFB128eta =
3
30.9psa =
14RSA256eta =
4
40.8psa =
113
sp =
310
sp =
1216p =
1417p =
3420p =
Figure 4.3Service value network with semantic QoS characteristics.
For simplicity it is assumed that each service provider owns only a single service such
that σ(s1) = 1, σ(s2) = 2, σ(s3) = 3 and σ(s4) = 4. Price values pij on the
edges represent price bids announced by service providers. Each service configuration
Aj consists of attribute values for encryption type aetj and probability of success a
psj .
The attribute values in Figure 4.3 are assumed to be announced by each service provider
additionally to the corresponding price bid such that bij = (Aj pij). Attribute values are
aggregated according to the aggregation operations in Table 3.1. Attribute values for
encryption type are derived from the concepts in the security algorithm ontology as
illustrated in Figure 4.4.
The security encryption ontology provides a brief conceptualization of encryption
types an their hierarchical classification in symmetric and asymmetric cipher methods.
Symmetric cipher methods are further divided into synchronous and self-synchronizing
stream ciphers and block cipher methods. Based on this semantic information about
different encryption types, the requester is capable of designing an individual attribute
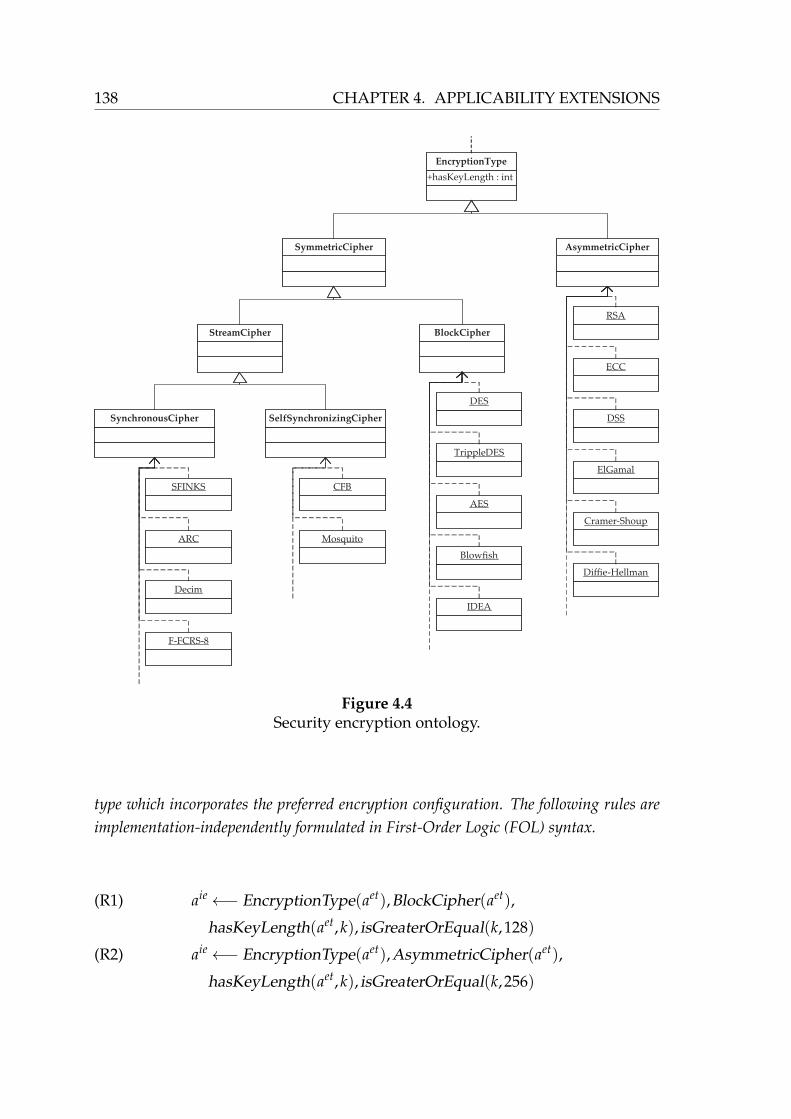
138 CHAPTER 4. APPLICABILITY EXTENSIONS
+hasKeyLength : int
EncryptionType
SymmetricCipher AsymmetricCipher
StreamCipher BlockCipher
SynchronousCipher SelfSynchronizingCipher
SFINKS
ARC
Decim
F-FCRS-8
CFB
Mosquito
DES
TrippleDES
AES
Blowfish
IDEA
RSA
ECC
DSS
ElGamal
Cramer-Shoup
Diffie-Hellman
Figure 4.4Security encryption ontology.
type which incorporates the preferred encryption configuration. The following rules are
implementation-independently formulated in First-Order Logic (FOL) syntax.
aie←− EncryptionType(aet),BlockCipher(aet),(R1)
hasKeyLength(aet,k), isGreaterOrEqual(k,128)
aie←− EncryptionType(aet),AsymmetricCipher(aet),(R2)
hasKeyLength(aet,k), isGreaterOrEqual(k,256)

4.3. MANAGING SERVICE QUALITY 139
In this example the requester specifies an attribute type ie ∈ L representing individ-ual encryption. This attribute type is defined by Rule (R1) and Rule (R2). If a single
rule fires, the boolean attribute value aie is set to true, meaning that the service offer
satisfies the individual encryption requirements expressed by the requester.
Assuming a requester’s maximum willingness to pay for a complex service with a
score of 1 is α = 100 and preferences for attribute types individual encryption and
probability of success are λie = 0.2 and λps = 0.8, the overall utility of each feasible
path evolves as follows
U f 1 = 100× (0.2× (1∧ 0) + 0.8× (0.9× 0.7))− (13 + 16) = 21.4
U f 2 = 100× (0.2× (1∧ 1) + 0.8× (0.9× 0.8))− (13 + 17) = 47.6
U f 3 = 100× (0.2× (0∧ 1) + 0.8× (0.9× 0.8))− (10 + 20) = 27.6
As the complex service instance f 2 yields the highest overall utility, service offers 1and 4 via edges es1, e14 and e4 f are allocated by o(B). Thus, service providers s1 and
s2 receive a transfer according to the transfer function in Equation (3.10) based on their
critical value.
ts1 = ts11 = 13 + (47.6− 27.6) = 33
ts4 = ts44 = 17 + (47.6− 21.4) = 43.2
Consequently the service requester’s utility evolves as
UR = 100× (0.2× (1∧ 1) + 0.8× (0.9× 0.8))− (33 + 43.2) = 1.4
In summary, the integration of rule-based semantic description techniques al-lows for the specification, aggregation and management of highly complex QoScharacteristics which satisfies Requirement 7.


Part III
Evaluation


Chapter 5
Analytical Results
[...] the set of incentive-compatible direct-revelation mechanisms has simple
mathematical properties that often make it easy to characterize, because can be defined by
a set of linear inequalities.
[Mye88]
T his chapter thoroughly analyzes the economic properties of the complex ser-vice auction and their extensions as introduced in Chapter 3. Section 5.1
analytically shows that the complex service auction with the service level en-forcement extension implements a strategyproof social choice, i.e. reporting onestrue multidimensional type is an equilibrium in weakly dominant strategies. Fo-cusing on cooperative behavior of adjacent service providers in service value net-works, Section 5.2 studies the effect of interface customization and implicit costreductions for preceeding or succeeding services within service value networks.
5.1 Incentive Compatibility & Individual Rationality
Recalling Section 2.2.4, incentive compatibility is a valuable property to beachieved in mechanism design. In decentralized environments such as ser-vice value networks with self-interested participants that have private informa-tion about their preferences for different outcomes, solving a global optimiza-tion problem fully depends on how participants can be incentivized to reporttheir private information to the auctioneer in a truthful manner. This informa-tion is needed to compute e.g. an allocative efficient outcome in such a setting.
144 CHAPTER 5. ANALYTICAL RESULTS
Hence, incentive compatibility can be seen as a necessary precondition in order toachieve a welfare maximizing outcome in scenarios with incomplete information.
Another major beneficial result that derives from truthfulness is that it tremen-dously simplifies the strategy space of participants as they do not have to rea-son about strategies of other participants. Thus, incentive compatibility reducesthe participants’ strategy space and simplifies their decision problem to a singleweakly dominant strategy maximizing their individual utility.
The remainder of this section analytically shows that in the basic complex ser-vice auction (without the compensation function extension), bidding ones truevaluations for all offered services is a weakly dominant strategy for all partic-ipating service providers (Section 5.1.1). Based on these results, Section 5.1.2shows that in the complex service auction with the service level enforcementextension (cp. Section 4.1), bidding true valuations and true QoS characteristicsfor all offered services is a weakly dominant strategy for all participating serviceproviders which satisfies Requirement 2. Based on the results regarding truth-fulness it is briefly shown that service providers always end up with a payoffequal to or greater than zero which satisfies individual rationality as stated inRequirement 3.
5.1.1 One-Dimensional Bids in the Basic CSA
This section is concerned with strategic behavior in the basic complex service auc-tion, i.e. the basic mechanism implementation without the compensation func-tion extension which enables service level enforcement. The following analyticalevaluation of the mechanism implementation with respect to service providers’bidding strategy considers price bids only in the first place. Thus, the providers’strategy space is reduced to announcing prices for each incoming edge of eachservice offer they own.
First, Corollary 5.1 shows that once a service provider is allocated – that is, theservice provider owns service offers that have at least one incoming edge whichis allocated by the mechanism – its payoff is independent of its bidding strategy.This means that once a service provider is allocated it is indifferent between anyalternative bidding strategy within its strategy space.
Consequently, the only event that service providers can actively influence bytheir bidding strategy is whether they are allocated by the mechanism or not.Based on the results of Corollary 5.1, Theorem 5.1 considerers the cases in whichservice providers intent to be allocated and derives the optimal bidding strategy:

5.1. INCENTIVE COMPATIBILITY & INDIVIDUAL RATIONALITY 145
Service providers act best (or at least equally good) by following a truth-tellingstrategy, i.e. reporting their true valuations – which are assumed to be reflectedby corresponding internal costs – for each service offer is a weakly dominantstrategy for all service providers that participate in the complex service auction.
Corollary 5.1. For each service provider s ∈ S that participates in the complex service
auction, the transfer ts is independent of its price bid. More precisely this means that for
each service offer j ∈ V owned by s ∈ S with an incoming edge which is allocated by o
such that eij ∈ o with j ∈ σ(s) and i ∈ τ(j), service provider s’s payoff is independent of
its price bid pij.
Proof 5.1 [COROLLARY 5.1]. Let F−s denotes the set of all feasible paths from source
to sink in the reduced graph G−s without every service offer owned by service provider s
and corresponding incoming and outgoing edges. Let further f ∗ denote the path which
is allocated by o. Let U ∗ be the utility of path f ∗. Let U ∗−s be the utility of path f ∗−s in
the reduced graph G−s. Let Es denote the set of edges with Es = eij|eij ∈ o, j ∈ σ(s), i ∈τ(j). Distinguishing two possible cases, service provider s’s payoff πs evolves as follows.
1. Es = ∅. Service provider s is not allocated. More precisely, none of the incoming
edges of service offers owned by service provider s are allocated by o.
It follows directly that in this case πs = 0 independent of s’s price bid.
2. Es 6= ∅. Service provider s is allocated. More precisely, at least one of the incoming
edges of service offers owned by service provider s is allocated by o.
πs = ts − cs
πs = ∑Es
pij + (U ∗ − U ∗−s)−∑Es
cij
πs = ∑Es
pij + αS(A f ∗)− ∑eij∈o
pij − U∗−s −∑
Es
cij
πs = αS(A f ∗)− ∑eij|eij∈o,eij /∈Es
pij − U∗−s −∑
Es
cij(5.1)
This shows that for each service offer j owned by s that has an incoming edge eij
which is allocated by o – otherwise s does not receive a transfer – the corresponding profit
is independent of s’s price bid pij.
Theorem 5.1. For each service provider s ∈ S that participates in the complex service
auction, the price bidding strategy pij = cij (truth-telling) ∀i∈ τ(j),∀j∈ σ(s) is a weakly
dominant strategy.

146 CHAPTER 5. ANALYTICAL RESULTS
Proof 5.1 [THEOREM 5.1]. Corollary 5.1 shows that the transfer ts for each service
provider s ∈ S is independent of the price bid. Consequently, the only event that s can
proactively influence by its bidding strategy is whether its service offers are allocated
by o or not. Let Es = eij|eij ∈ o, j ∈ σ(s), i ∈ τ(j) denote the set of incoming edges
of service offers owned by service provider s that are allocated by o. Service provider
s wants incoming edges of service offers that s owns to be allocated by o (Es 6= ∅) iff
πs> 0. Hence, service provider s wants the following equivalence1 to be fulfilled through
an adequate choice of its price bid.
Es 6= ∅ ⇐⇒ U ∗ > U ∗−s ⇐⇒ πs> 0
U ∗ − U ∗−s > 0 ⇐⇒ ∑Es
(pij − cij) + (U ∗ − U ∗−s) > 0(5.2)
Equation (5.2) holds for pij = cij ∀j ∈ σ(s), i ∈ τ(j). According to Corollary 5.1, if
Es 6= ∅, s is indifferent between any other solution that satisfies Equation (5.2) which
means that reporting true internal costs is a weakly dominant price bidding strategy for
service provider s.
5.1.2 Multidimensional Bids in the Extended CSA
The analytical evaluation of service providers’ bidding strategies in this section isconducted analogously to the one-dimensional case. Nevertheless, the followingevaluation accounts for the complete strategy space of service providers, i.e. ser-vice providers announce multidimensional bids consisting of a price and QoS com-
ponent for each incoming edge of every service offer they own within the servicevalue network. The analysis is based on the complex service auction mechanismwith the compensation function extension (cp. Section 4.1) which implements aservice level enforcement component.
Laying the groundwork for Theorem 5.2, Corollary 5.2 shows that once a ser-vice provider is allocated, its payoff is independent of its announced price andcorresponding attribute values which characterize guaranteed QoS. This meansthat once a service provider is allocated it is indifferent between any alternativebidding strategy within its strategy space with respect to all dimensions of its bid.
However, the service providers’ bid (price and attribute values) influencesthe chance of being allocated by the mechanism. Based on the results of Corol-lary 5.2, Theorem 5.2 considerers the cases in which service providers intent to
1Two statements are equivalent as denoted by ⇐⇒ if and only if both statements yield thesame outcome for every possible interpretation.

5.1. INCENTIVE COMPATIBILITY & INDIVIDUAL RATIONALITY 147
be allocated and derives the optimal bidding strategy. Theorem 5.2 shows thatservice providers act best (or at least equally good) by reporting their true mul-tidimensional type, i.e. reporting their true valuations and guaranteed QoS foreach service offer regarding its predecessor is a weakly dominant strategy for allservice providers that participate in the extended complex service auction.
Corollary 5.2. For each service provider s ∈ S that participates in the complex service
auction with the compensation function extension (cp. Section 4.1), the transfer ts is
independent of all dimensions of s’s bids (configuration and price). This means that for
each service offer j ∈ V owned by s ∈ S that has an incoming edge which is allocated by o
such that eij ∈ o with j ∈ σ(s) and i ∈ τ(j), service provider s’s payoff is independent of
all dimensions of its bid bij = (Aj, pij).
Proof 5.2 [COROLLARY 5.2]. Let F−s denote the set of all feasible paths from source to
sink in the reduced graph G−s without every service offer owned by service provider s
and corresponding incoming and outgoing edges. Let further f ∗ denote the path which
is allocated by o. Let U ∗ be the utility of path f ∗. Let U ∗−s be the utility of path f ∗−s
in the reduced graph G−s. Let U ∗s denote the overall utility of the allocated path f ∗
computed based on the verified attribute values a1j , . . . , aL
j of the verified configurations
Aj of all service offers j ∈ σ(s). Let Es denote the set of edges with Es = eij|eij ∈ o, j ∈
σ(s), i ∈ τ(j). Distinguishing two possible cases, service provider s’s payoff πs evolves
as follows.
1. Es = ∅. Service provider s is not allocated. More precisely, none of the incoming
edges of service offers owned by service provider s are allocated by o.
It follows directly that in this case πs = 0 independent of s’s price bid.
2. Es 6= ∅. Service provider s is allocated. More precisely, at least one of the incoming
edges of service offers owned by service provider s is allocated by o.
πs = ts − cs
πs = ∑Es
pij + (U ∗ − U ∗−s)− tcomp,s −∑Es
cij
πs = ∑Es
pij + (U ∗ − U ∗−s)− (U ∗ − U ∗s)−∑Es
cij
πs = ∑Es
pij + (U ∗s − U ∗−s)−∑Es
cij
πs = αS(Asf ∗)− ∑
eij|eij∈o,eij /∈Es
pij − U∗−s −∑
Es
cij(5.3)

148 CHAPTER 5. ANALYTICAL RESULTS
Equation (5.3) shows that for each service offer j∈V owned by s∈ S that has an incoming
edge which is allocated by o such that eij ∈ o with j ∈ σ(s) and i ∈ τ(j), service provider
s’s payoff is independent of all dimensions of its bid bij = (Aj, pij).
Theorem 5.2. For each service provider s ∈ S that participates in the complex service
auction with the compensation function extension (cp. Section 4.1), the bidding strategy
bij = (Aj, cij) with Aj = (a1j , . . . , aL
j ) – truth telling with respect to all dimensions of the
bid – ∀i ∈ τ(j),∀j ∈ σ(s) is a weakly dominant strategy.
Proof 5.2 [THEOREM 5.2]. Let F−s denote the set of all feasible paths from source to
sink in the reduced graph G−s without every service offer owned by service provider s
and corresponding incoming and outgoing edges. Let further f ∗ denote the path which
is allocated by o. Let U ∗ be the utility of path f ∗. Let U ∗−s be the utility of path f ∗−s
in the reduced graph G−s. Let U ∗s denote the overall utility of the allocated path f ∗
computed based on the verified attribute values a1j , . . . , aL
j of the verified configurations
Aj of all service offers j ∈ σ(s). Let Es denote the set of edges with Es = eij|eij ∈ o, j ∈
σ(s), i ∈ τ(j). Corollary 5.2 shows that the transfer ts for each service provider s ∈ S is
independent of all dimensions of its bid. In other words, s’s bid does not have an impact on
its transfer ts and its payoff πs respectively. Nevertheless, the bidding strategy influences
service provider s’s chance of being allocated by o. Thus, s wants to be allocated iff πs> 0.
Es 6= ∅ ⇐⇒ U ∗ > U ∗−s ⇐⇒ πs> 0
U ∗ > U ∗−s ⇐⇒ ∑Es
pij + (U ∗s − U ∗−s)−∑Es
cij > 0
U ∗ > U ∗−s ⇐⇒ ∑Es
pij + U∗s> ∑
Es
cij + U∗−s(5.4)
Equation (5.4) holds for pij = cij and U ∗ = U ∗s. According to Corollary 5.2, if Es 6=
∅, s is indifferent between any other solution that satisfies Equation (5.4) which means
that reporting attribute values a1j , . . . , al
j truthfully meaning that the announced values
equal the verified ones in the execution phase such that alj = al
j ∀l ∈ L,∀j ∈ σ(s) and
consequently U ∗ = U ∗s is a weakly dominant strategy.
The analytical proof in Section A.2 evaluates service providers’ bidding strate-gies from the perspective of the providers’ expected payoff which they intent tomaximize. Analogue to the previous result, it turns out that there exists a singlebidding strategy that maximizes service providers’ expected payoff.

5.1. INCENTIVE COMPATIBILITY & INDIVIDUAL RATIONALITY 149
5.1.3 Results & Implications
Theorem 5.2 shows that service providers act best (or at least as good as any otheralternative) by reporting their services’ configurations and internal costs truth-fully which is a valuable mechanism property as it enables the computation of anoptimal welfare maximizing outcome although the scenario is predominated byincomplete information. This property assures that although all service providersact self-interested and therefore try to maximize their profit, their dominant strat-egy maximizes the system’s welfare and the requester receives a technically feasi-ble instantiation of the desired complex service at a guaranteed service level2. Thepresence of a single beneficial strategy tremendously lowers strategic complexityfor service providers and fosters a trustful requester-provider-relationship. Theresults at hand show that the extended complex service auction satisfies Require-ment 2. It is straightforward to see that with the results of Theorem 5.2, partic-ipating service providers always end up with a payoff equal to or greater thanzero which satisfies individual rationality as stated in Requirement 3. In otherwords, service providers have an incentive to participate in the complex serviceauction without running into the risk of being worth of than their outside option.Furthermore, it follows directly form Corollary A.1 that Requirement 1 is satisfiedthrough the social choice implemented by the complex service auction.
It is well-known in literature that incentive compatibility in VCG-based mech-anisms may fail in repeated games [BS00]. Assuming that participants are ableto gather historic information about previous outcomes, deviation from truth-telling might be beneficial in certain situations and the theoretical results fromthis section might not hold. However, in service value networks through a highdegree of alteration with respect to changing service providers, variable costsand network topologies is observable. As outlined in Section 2.1.4, the complexservice auction is designed for scenarios with fast changing participants that to-gether foster value creation which satisfies situational needs. Thus, each auctionsetting is different from the preceding one which makes learning from past situa-tions impossible and each game can therefore be treated as a one-shot game. Fora simulation-based analysis of collusion behavior in the complex service auction,the interested reader is referred to [CvD09].
2Despite of service level agreement violations caused by events which are not under the con-trol of service providers.
150 CHAPTER 5. ANALYTICAL RESULTS
5.2 Cooperation within the Value Chain
This section studies a special form of cooperation in the context of the complexservice auction in service value networks. Traditionally in social network re-search, the creation of links connecting players requires a cooperative processsuch that both participants have to agree to a connection. Removing links, how-ever, is a non-cooperative act as it can be done unilaterally by a single playerwithin the network. In the context of service value networks where service com-ponents’ input and outputs are plugged together realizing a value-added com-plex service, service providers have the strategic opportunity to customize theirservice offers in a way that they are interoperable with predecessor services. Thisform of establishing a feasible connection to another component within the net-work is – in contrary to traditional social network theory – unilateral and non-cooperative. Predecessor services cannot control which successor service createsa connection by postprocessing its output.
5.2.1 Related Work
In [JW96] the evolution of social and economic networks where self-interestedindividuals form or sever links is analyzed. In [JW02] network formation isfounded upon players’ individual improvements resulting from changes in thenetwork topology. Traditionally, breaking relationships can be done unilaterallywhile the formation of links requires consent from both players [JW96]. In [BG00],however, links can be formed by individual decision under certain circumstances.This is also the case in service value networks since service providers cannot in-fluence which other services process their outputs.
5.2.2 A Model of Cooperation
In a service value network with four service offers a,b,y,z are two particular ser-vice offers y ∈ V and z ∈ V that are owned by two different service providerssy ∈ S and sz ∈ S. Based on the topology of the Service Value Network y is thepredecessor of z connected by an edge eyz. Costs that service provider sz has tobear for its service z being executed as a successor of service y are denoted by cyz.
Furthermore it is assumed that service provider sy has the strategic opportu-nity to invest an amount I in order to customize its service offer y in a way thatcosts cyz of service provider sz are reduced from cH
yz to cLyz with cH
yz > cLyz. As sy

5.2. COOPERATION WITHIN THE VALUE CHAIN 151
y z
s f
a b
cyz
Figure 5.1Cost dependency between service provider sy and sz.
is familiar with its internal processes and properties of its service offer y, propor-tionate investment costs I are less then the effect of cost reduction for sz such thatI < cH
yz− cLyz. Focusing on one-shot games, incorporating total fix costs for service
customization in order to reduce variable costs caused by the preceeding serviceis not reasonable. Therefore I constitutes proportionate investment costs as a frac-tion of the total fix costs for a particular auction conduction. The assumption isthat these proportionate investment costs are less than the reduction in variablecosts caused by the preceeding service.
Corollary 5.3 [COOPERATION WITHIN THE VALUE CHAIN]. Given two service
providers sy and sz that own service offers y and z with y being the predecessor ser-
vice of z. Furthermore let Θyz be an enforceable ex-ante agreement that states that iff
services y and z are allocated such that eyz ∈ f ∗ then service provider sy is committed to
invest I in order to reduce costs cyz from cHyz to cL
yz. Committing to an agreement Θyz is
an equilibrium in weakly dominant strategies if I ≤ cHyz − cL
yz.
Proof 5.3 [COROLLARY 5.3]. Let U ∗H(eyz) be the overall utility of the path allocated
by o that entails edge eyz and costs cHyz. Analogously let U ∗L(eyz) be the overall utility of
the path allocated by o that entails edge eyz and costs cLyz. Let further U ∗−sy
be the overall
utility of the path allocated by o in the reduced graph without node y and all its incoming
and outgoing edges. Service offer i is an arbitrary predecessor of y.
The expected payoff of service provider sy under the assumption that there is no agree-
ment Θyz evolves as follows
Esy = P(U ∗H(eyz) > U∗−sy
)[
piy + (U ∗H − U ∗−sy)− ∆tcomp,sy − ciy
]
With the results of Theorem 5.2 that each service provider reports its type truthfully the
equation can be simplified to
Esy = P(U ∗H(eyz) > U∗−sy
)[
U ∗H − U ∗−sy
]

152 CHAPTER 5. ANALYTICAL RESULTS
Analogously for service provider sz
Esz = P(U ∗H(eyz) > U∗−sz
)[
U ∗H − U ∗−sz
]
Assuming that sy and sz commit to the agreement Θyz expected payoffs evolve as follows
Esy
Θyz= P(U ∗L(eyz) > U
∗−sy
)[
U ∗L − U ∗−sy− I]
(5.5)
EszΘyz
= P(U ∗L(eyz) > U∗−sz
)[
U ∗L − U ∗−sz
]
(5.6)
In order to be an equilibrium in weakly dominant strategies, the commitments θy and θz
to agreement Θyz must be a weakly dominant strategy for service provider sy and sz. The
strategy space of each service provider and corresponding expected payoffs are illustrated
as a normal form game in Table 5.1.
Table 5.1: Cooperation decision as a normal form game. θ de-notes an ex-ante commitment to an agreement Θ whereas θ statesthe decision not to commit to an agreement Θ.
y,z θ θ
θ Esy
Θyz, Esz
ΘyzEsy , Esz
θ Esy , Esz Esy , Esz
The strategy θ is a weakly dominant strategy for each player if Esy
Θyz≥ Esy and Esz
Θyz≥
Esz .
Based on the assumption that cHyz > cL
yz and the quasi-linearity of U it follows that
U ∗H(eyz)< U ∗L(eyz). Consequently the probability of service offer y being allocated by o
increases if sy follows strategy θy such that P(U ∗H(eyz)> U ∗−sy)< P(U ∗L(eyz)> U ∗−sy
).
If investment costs I for service provider y are lower (or at least equal) compared to the
cost reduction cHyz − cL
yz for service provider z it can be derived that U ∗H − I ≤ U ∗L.
Finally it can be concluded that Esy
Θyz≥ Esy .
As the service provider sz can only benefit from a cost reduction the same argumenta-
tion leads to P(U ∗H(eyz) > U ∗−sz) < P(U ∗L(eyz) > U ∗−sz
), U ∗H< U ∗L and directly to
EszΘyz
> Esz .
Example 5.1 [COOPERATION WITHIN THE VALUE CHAIN]. To illustrate Corollary
5.3 and its implications for cooperative behavior in service value networks, Example 2.1

5.2. COOPERATION WITHIN THE VALUE CHAIN 153
is consulted. For the reader’s convenience the complex service is reduced to the first two
business transactions, data verification and transaction processing. Figure 5.2 shows the
service value network with service offers and corresponding costs. Each feasible path from
s to f represents a possible instantiation of the payment processing complex service. Data
verification can be performed by either StrikeIron (sy) and its service offer y or Duo Share
(sa) offering service a. The execution of the actual monetary transaction can be done by
JETTIS (sz) offering service z or service b offered by Net Billing (sb).
y z
s f
a b
2
8− x
1
10
Figure 5.2Cooperation within the value chain of a payment processing
complex service.
A mandatory step for a transaction processing service is the credit assessment. As a
precondition, a transaction processing service has to check if the customer is credit worthy
in order to charge the corresponding account. The credit assessment has to be performed
at a central authority and generates variable costs each time the transaction processing
service is executed. The predecessor service that verifies the customer’s data has to consult
the same central authority to assure the correctness of processed data.
The provider of the data verification service has the strategic opportunity to customize
its internal process in a way that a credit assessment is done on the fly which is cheaper
than doing it in the second transaction. In other words if service provider sy agrees to bear
proportionate investment costs of I ∈ R+ with I ≤ x to customize its internal process in
order to enable credit assessment in case of eyz being allocated, service provider sz can
reduce its costs by x ∈ R+.
To analyze the effect of such an agreement Θyz according to Corollary 5.3 two cases
are considered:
1. There is no conclusion to agreement Θyz such that x = 0
The top path f T consisting of service offer y and z such that f T = esy, eyz, ez f gen-
erates a welfare of U f T = α− 10 whereas the bottom path f B = esa, eab, eb f gen-
erates a welfare of U f B = α− 11. Consequently service offers y and z are allocated
by o such that f ∗ = esy, eyz, ez f . Each service provider that owns a service that is

154 CHAPTER 5. ANALYTICAL RESULTS
allocated receives its transfer. Service provider sy is payed tsy = 2 + (11− 10) = 3and sz gets tsz = 8 + (11 − 10) = 9. This leads to a payoff for provider sy of
πsy = 1 and for service provider sz of πsz = 1. The requester’s utility evolves as
UR = α− 12.
2. Both parties agree on Θyz such that costs for sz are reduced by x
In this case the top path f T consisting of service offer y and z such that f T =
esy, eyz, ez f generates a welfare of U f T = α − 10 + x whereas the bottom path
f B = esa, eab, eb f generates a welfare of U f B = α − 11. Analogue to the first
case, service offers y and z are allocated by o such that f ∗ = esy, eyz, ez f . Service
provider sy is payed tsy = 2 + (11− 10 + x) = 3 + x and sz gets tsz = 8− x +
(11− 10 + x) = 9. This leads to a payoff for provider sy of πsy = 1 + x and for
service provider sz of πsz = 1. The requester’s utility evolves as UR = α− 12− x.
The example shows that it is beneficial (or at least equally good) for adjacent service
providers to commit to an agreement according to Corollary 5.3 as πsy
case 1 = 1 ≤π
sy
case 2 = 1 + x− I and πszcase 1 = 1≤ πsz
case 2 = 1.

Chapter 6
Numerical Results
In economic applications the analytical apparatus [...] diminishes the economic content
of the models.
[KV98]
T his chapter analyzes properties of the complex service auction and their ex-tensions as well as strategic behavior of service providers by means of a
simulation-based evaluation. In Section 6.1, the interoperability transfer func-tion (ITF) is analyzed with respect to manipulation attempts of service providersthat deviate from their truth-telling strategy. The question is answered to whatdegree bid manipulation is beneficial for service providers given different lev-els of competition in service value networks. Based on these results, Section 6.2evaluates the incentives provided by the ITF which fosters interoperability en-deavors of service providers, i.e. the ITF provides incentives for service providersto customize their services’ interfaces to increase interoperability with adjacentservice components. Focusing on bundling and unbundling strategies of ser-vice providers, Section 6.3 analyzes strategic behavior by means of an agent-based simulation. Based on these results strategic recommendations for serviceproviders are derived depending on how they are situated within service valuenetworks.
6.1 Manipulation Robustness of the ITF Extension
This section considerers strategic behavior of service providers participating inthe complex service auction with the interoperability transfer function (ITF). Re-

156 CHAPTER 6. NUMERICAL RESULTS
call, in the basic complex service auction, allocated service providers are payedtheir price bid plus their critical value compensating their contribution to thewhole system. This critical value is designed to implement a dominant strategyequilibrium in which every service provider reports its multidimensional typetruthfully to the auctioneer according to Theorem 5.2.
Nevertheless, incentive compatibility comes at the price of losing budgetbalance, i.e. the sum of service providers’ transfers may exceed the service re-quester’s willingness to pay which results in a negative budget that has to besubsidized externally. As a possible remedy to retain budget balance, the ITF ex-tending the basic complex service auction was introduced in Section 4.2. The ITFdistributes the available surplus – the difference between the service requester’swillingness to pay and the sum of providers’ transfers – in a way that addition-ally to their bid, allocated providers are payed their critical value in the priorityof their degree of interoperability subject to budget balance. It is obvious that inorder to recover budget balance, incentive compatibility has to be sacrificed toa certain degree. Incurring this trade-off, the set of possibly beneficial biddingstrategies of service providers increases and from a pure analytical perspectiveTheorem 5.2 does not hold under the presence of the ITF extension. Although theprimary goal from an incentive engineering perspective of the ITF is to rewardinteroperability endeavors, the design of the ITF gives a good indication that bidmanipulation is only beneficial to a certain level which strongly depends on thelevel of competition [Jac92, RP76, Hur72].
This section analyzes strategic behavior of service providers in the complexservice auction with the ITF extension following a simulation-based approach(cp. Section 2.3.2).
6.1.1 Simulation Model
To analyze the manipulation robustness of the complex service auction with theITF extension, a simulation is conducted as follows. A random service valuenetwork topology is created with density 1.0 (complete graph) and – dependingon the degree of competition – with a predefined number of service offers andcandidate pools. For simplicity and without loss of generality it is assumed thateach service provider owns only a single service offer within the service valuenetwork. The competition rate results from the number of alternative complexservice instances (number of feasible paths) without the participation of a singleservice provider. The number of feasible paths depends on the number of service

6.1. MANIPULATION ROBUSTNESS OF THE ITF EXTENSION 157
offers within the network, the number of candidate pools and the density of thegraph, i.e. the ratio between the number of edges and the number of all possi-ble edges in the graph. The ratio between the number of service offers and thenumber of candidate pools is also responsible for the number of possible servicecompositions.
Each problem set is characterized by a random network topology with ran-dom costs cij assigned to each incoming edge of service offers drawn fromU(0,1.0). Furthermore, the requester’s willingness to pay α is analogously drawnfrom U(0, 1
2 K)1 with K being the number of candidate pools.
For each problem set, a random service offer’s incoming edge eij is randomlydrawn. The bid price pij is manipulated stepwise from 50% to 150% in steps of10% of the truth-telling price pij = cij. For each manipulation rate the auctionis conducted and the service provider’s utilities for the deviation and the truth-telling strategies are computed based on the critical value transfer function andthe ITF. Figure 6.1 depicts the stepwise procedure of the simulation.
Generation of random topology. Assignment of random edge costs and requester’s willingness to pay.
Random selection of a service offer. Random selection of an
incoming edge ije
Deviation from truth-telling strategy by manipulation rate
mr
(1 )ij ijp c mr= +
Increase of manipulation rate
Computation of absolute utility for truth-telling and
deviation strategies
Figure 6.1Simulation model for the evaluation of manipulation robustness
using the ITF.
As the number of variable parameters and their interdependencies are high,heavy statistical noise is likely to be generated. To counteract the high volatil-ity of the simulation model, a large number of problem sets of 5000 is evaluatedfor each degree of manipulation and the mean results are reported. In order toidentify the degree of manipulation for which a deviation from the truth-tellingstrategy is beneficial for service providers, the statistical significance is tested us-ing a one-tailed matched-pairs t-test analyzing the alternative hypothesis thatservice providers benefit from manipulation, that is, the mean difference in util-ity is greater than zero. The large size of analyzed problem sets for each obser-
1 12 K denotes the mean price of a complex service in a network with K candidate pools and
internal costs of service providers drawn from U(0,1.0) under the presence of truth-revelation.
158 CHAPTER 6. NUMERICAL RESULTS
vation assures robustness of the t-test to violations of the normality assumption[SB92, BS99, Ram80].
6.1.2 Results
Participating in the complex service auction with the ITF extension, serviceproviders’ strategies and corresponding outcomes are illustrated in Figure 6.2.The decision tree evaluates possible bidding strategies in comparison to a truth-telling strategy. Focusing on a single service provider, two fundamental casesmust be considered in order to evaluate the result of different strategies:
1. Having followed a truth-telling strategy, the service provider s would havebeen allocated by o.
In this case, overstating the true valuation by announcing a price pij > cij
leads to a payoff πs ≥ πs if the service providers stays allocated and to apayoff πs
< πs if it is dropped out of the allocation. The monotonicity ofthe allocation function assures that the service provider still gets allocatedby understating the true valuation such that pij < cij which leads to a payoffπs ≤ πs.
2. Having followed a truth-telling strategy, the service provider s would nothave been allocated by o.
In this case, by overstating the true valuation announcing a price pij > cij,the service provider is not allocated due to monotonicity of the allocationfunction which leads to a payoff πs = πs. Understating the true valuationresults in a payoff πs
< πs if the service provider gets allocated and to apayoff πs = πs if it is not allocated.
The effect of a bid manipulation strategy of service providers is highly depen-dent on the level of competition in the service value network as this increases therisk of dropping out of the allocation by overstating ones true valuation. As mar-ket size increases, participants become price takers and strategic considerationsconverge towards a truth-telling strategy [Jac92, RP76, Hur72]. In the complexservice auction, the level of competition results from the number of alternative
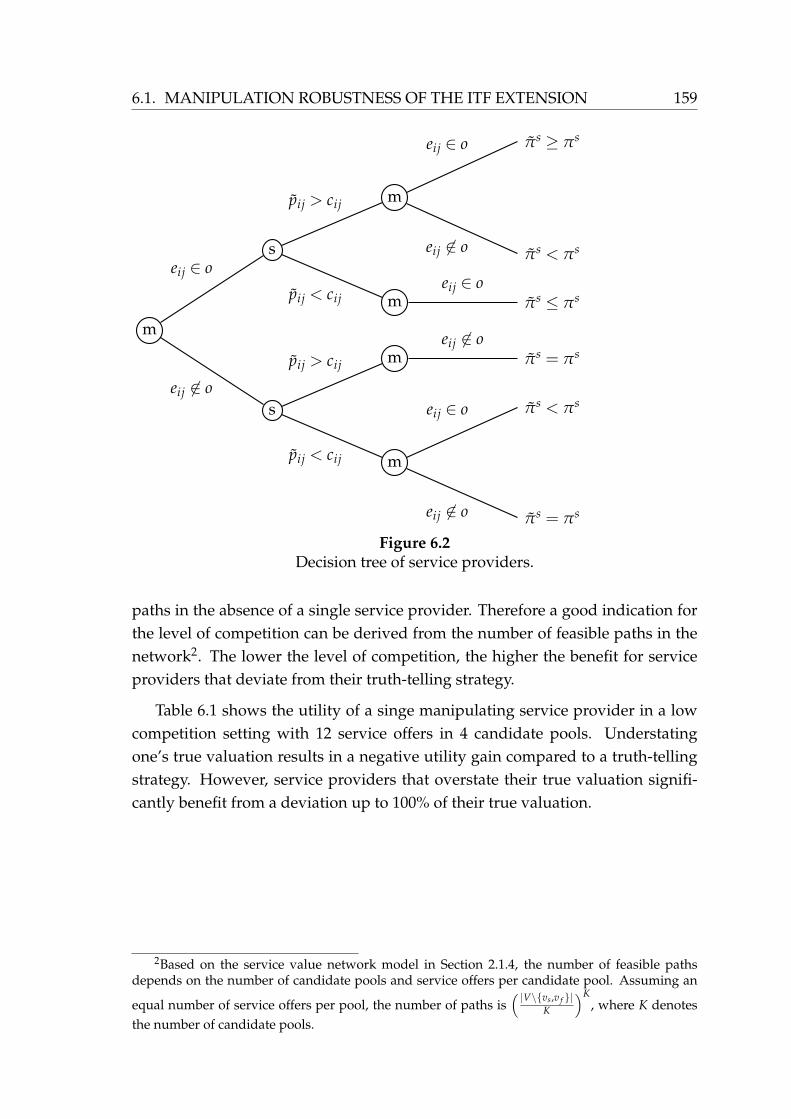
6.1. MANIPULATION ROBUSTNESS OF THE ITF EXTENSION 159
m
seij ∈ o
mpij > cij
πs ≥ πseij ∈ o
πs< πseij 6∈ o
mpij < cij πs ≤ πseij ∈ o
seij 6∈ o
mpij > cij πs = πseij 6∈ o
mpij < cij
πs< πseij ∈ o
πs = πseij 6∈ o
Figure 6.2Decision tree of service providers.
paths in the absence of a single service provider. Therefore a good indication forthe level of competition can be derived from the number of feasible paths in thenetwork2. The lower the level of competition, the higher the benefit for serviceproviders that deviate from their truth-telling strategy.
Table 6.1 shows the utility of a singe manipulating service provider in a lowcompetition setting with 12 service offers in 4 candidate pools. Understatingone’s true valuation results in a negative utility gain compared to a truth-tellingstrategy. However, service providers that overstate their true valuation signifi-cantly benefit from a deviation up to 100% of their true valuation.
2Based on the service value network model in Section 2.1.4, the number of feasible pathsdepends on the number of candidate pools and service offers per candidate pool. Assuming an
equal number of service offers per pool, the number of paths is(
|V\vs,v f |K
)K, where K denotes
the number of candidate pools.

160 CHAPTER 6. NUMERICAL RESULTS
Table 6.1: Utility for a single manipulating service provider with12 service offers in 4 candidate pools. abs denotes the mean ab-solute utility and rel the ratio of means of the utility with manip-ulation and the utility following a truth-telling strategy. sd is thestandard deviation of the mean absolute utility. * denotes signif-icance at the level of p = 0.1, ** at p = 0.05, and *** at p = 0.01.
Critical Value Transfer Interoperability Transfer
Manipulation Rate abs rel sd abs rel sd
-50% 0.0423 0.5865 0.0793 -0.0209 -0.6871 0.1022
-40% 0.0562 0.7789 0.0506 -0.0009 -0.0308 0.0714
-30% 0.0631 0.8741 0.0334 0.0113 0.3645 0.0478
-20% 0.0693 0.9603 0.0136 0.0194 0.6763 0.0264
-10% 0.0715 0.9904 0.0050 0.0250 0.8795 0.0144
0% 0.0722 1.0000 0.0000 0.0302 1.0000 0.0000
10% 0.0715 0.9906 0.0050 0.0317 1.0688*** 0.0125
20% 0.0705 0.9771 0.0097 0.0327 1.0968*** 0.0199
30% 0.0703 0.9738 0.0102 0.0393 1.1380*** 0.0283
40% 0.0696 0.9638 0.0137 0.0384 1.1776*** 0.0355
50% 0.0673 0.9320 0.0261 0.0379 1.1774*** 0.0435
60% 0.0640 0.8870 0.0383 0.0384 1.1016*** 0.0445
70% 0.0627 0.8691 0.0424 0.0377 1.0866*** 0.0486
80% 0.0603 0.8354 0.0508 0.0355 1.0535*** 0.0449
90% 0.0596 0.8251 0.0521 0.0362 1.0233* 0.0475
100% 0.0591 0.8181 0.0533 0.0351 1.0581*** 0.0508
110% 0.0578 0.8006 0.0560 0.0378 1.0091 0.0537
120% 0.0554 0.7670 0.0632 0.0354 0.9652 0.0524
130% 0.0550 0.7613 0.0639 0.0314 0.9824 0.0543
140% 0.0534 0.7395 0.0672 0.0317 0.9529 0.0576
150% 0.0526 0.7285 0.0685 0.0344 0.9557 0.0581
A marginal increase in the level of competition decreases the number of ben-eficial manipulation strategies. Table 6.2 shows the simulation results in a settingwith 16 service offers in 4 candidate pools. The utility of a single manipulating

6.1. MANIPULATION ROBUSTNESS OF THE ITF EXTENSION 161
service provider is analyzed with respect to its manipulation rate. In this settings,deviation from truth-telling is only significantly beneficial – at a level of p = 0.05 –up to a manipulation rate of 60%. It is also noticeable that the mean utility gainsof manipulation strategies compared to a truth-telling strategy are smaller andless favorable in comparison to the previous setting.
Table 6.2: Utility for a single manipulating service provider with16 service offers in 4 candidate pools. abs denotes the mean ab-solute utility and rel the ratio of means of the utility with manip-ulation and the utility following a truth-telling strategy. sd is thestandard deviation of the mean absolute utility. * denotes signif-icance at the level of p = 0.1, ** at p = 0.05, and *** at p = 0.01.
Critical Value Transfer Interoperability Transfer
Manipulation Rate abs rel sd abs rel sd
-50% 0.0171 0.4002 0.0757 -0.0081 -0.3140 0.0845
-40% 0.0300 0.7035 0.0465 0.0072 0.2799 0.0546
-30% 0.0383 0.8983 0.0217 0.0158 0.6344 0.0315
-20% 0.0413 0.9687 0.0095 0.0209 0.8354 0.0176
-10% 0.0424 0.9954 0.0027 0.0234 0.9331 0.0083
0% 0.0426 1.0000 0.0000 0.0248 1.0000 0.0000
10% 0.0425 0.9980 0.0013 0.0263 1.0453*** 0.0070
20% 0.0420 0.9858 0.0055 0.0274 1.0659*** 0.0131
30% 0.0403 0.9466 0.0144 0.0276 1.0334*** 0.0213
40% 0.0402 0.9434 0.0149 0.0283 1.0562*** 0.0246
50% 0.0394 0.9244 0.0180 0.0271 1.0570*** 0.0282
60% 0.0382 0.8974 0.0227 0.0281 1.0256* 0.0309
70% 0.0373 0.8757 0.0261 0.0267 1.0170 0.0325
80% 0.0359 0.8418 0.0315 0.0268 0.9777 0.0376
90% 0.0352 0.8259 0.0339 0.0268 0.9607 0.0391
100% 0.0348 0.8168 0.0348 0.0276 0.9411 0.0395
110% 0.0329 0.7724 0.0414 0.0254 0.8877 0.0383
120% 0.0320 0.7504 0.0437 0.0245 0.8816 0.0412
130% 0.0314 0.7376 0.0463 0.0240 0.8616 0.0420
140% 0.0305 0.7153 0.0487 0.0246 0.8350 0.0444

162 CHAPTER 6. NUMERICAL RESULTS
Table 6.2: Utility for a single manipulating service provider with16 service offers in 4 candidate pools. abs denotes the mean ab-solute utility and rel the ratio of means of the utility with manip-ulation and the utility following a truth-telling strategy. sd is thestandard deviation of the mean absolute utility. * denotes signif-icance at the level of p = 0.1, ** at p = 0.05, and *** at p = 0.01.
Critical Value Transfer Interoperability Transfer
Manipulation Rate abs rel sd abs rel sd
150% 0.0299 0.7012 0.0506 0.0234 0.8274 0.0440
In the setting with 20 service offers in 4 candidate pools as shown in Table6.3, service providers do not significantly gain from deviation of more than 20%.Although, the complex service auction with the ITF extension is not incentivecompatible in a strict theoretical sense, in settings with relatively low competition(e.g. 28 service offers in 4 candidate pools), service providers cannot significantlybenefit from deviation from reporting their true valuation as shown in Table 6.4,i.e. the truth-telling strategy is a best (or equally good) strategy compared to anymanipulation strategy.
Table 6.3: Utility for a single manipulating service provider with20 service offers in 4 candidate pools. abs denotes the mean ab-solute utility and rel the ratio of means of the utility with manip-ulation and the utility following a truth-telling strategy. sd is thestandard deviation of the mean absolute utility. * denotes signif-icance at the level of p = 0.1, ** at p = 0.05, and *** at p = 0.01.
Critical Value Transfer Interoperability Transfer
Manipulation Rate abs rel sd abs rel sd
-50% 0.0025 0.1122 0.0630 -0.0111 -0.7315 0.0741
-40% 0.0107 0.4870 0.0425 0.0003 0.0187 0.0495
-30% 0.0173 0.7854 0.0231 0.0090 0.5533 0.0292
-20% 0.0208 0.9444 0.0089 0.0137 0.8251 0.0146
-10% 0.0219 0.9916 0.0020 0.0150 0.9434 0.0063
0% 0.0220 1.0000 0.0000 0.0167 1.0000 0.0000
10% 0.0219 0.9920 0.0017 0.0169 1.0298*** 0.0059
20% 0.0215 0.9748 0.0051 0.0168 1.0227*** 0.0086
30% 0.0205 0.9300 0.0108 0.0157 0.9929 0.0111

6.1. MANIPULATION ROBUSTNESS OF THE ITF EXTENSION 163
Table 6.3: Utility for a single manipulating service provider with20 service offers in 4 candidate pools. abs denotes the mean ab-solute utility and rel the ratio of means of the utility with manip-ulation and the utility following a truth-telling strategy. sd is thestandard deviation of the mean absolute utility. * denotes signif-icance at the level of p = 0.1, ** at p = 0.05, and *** at p = 0.01.
Critical Value Transfer Interoperability Transfer
Manipulation Rate abs rel sd abs rel sd
40% 0.0195 0.8849 0.0156 0.0150 0.9266 0.0143
50% 0.0191 0.8662 0.0169 0.0149 0.9129 0.0163
60% 0.0189 0.8562 0.0176 0.0150 0.8881 0.0166
70% 0.0185 0.8387 0.0197 0.0148 0.8794 0.0187
80% 0.0183 0.8324 0.0201 0.0153 0.8847 0.0201
90% 0.0182 0.8246 0.0207 0.0149 0.8776 0.0218
100% 0.0179 0.8125 0.0217 0.0149 0.8526 0.0220
110% 0.0176 0.7988 0.0235 0.0148 0.8480 0.0234
120% 0.0174 0.7888 0.0243 0.0154 0.8303 0.0266
130% 0.0168 0.7602 0.0270 0.0139 0.7904 0.0270
140% 0.0165 0.7474 0.0285 0.0139 0.7947 0.0293
150% 0.0163 0.7397 0.0293 0.0139 0.7869 0.0279
Table 6.4: Utility for a single manipulating service provider with28 service offers in 4 candidate pools. abs denotes the mean ab-solute utility and rel the ratio of means of the utility with manip-ulation and the utility following a truth-telling strategy. sd is thestandard deviation of the mean absolute utility. * denotes signif-icance at the level of p = 0.1, ** at p = 0.05, and *** at p = 0.01.
Critical Value Transfer Interoperability Transfer
Manipulation Rate abs rel sd abs rel sd
-50% 0.0000 0.0005 0.0501 -0.0048 -0.4739 0.0540
-40% 0.0081 0.6271 0.0247 0.0037 0.3617 0.0305
-30% 0.0103 0.8014 0.0152 0.0069 0.6498 0.0191
-20% 0.0119 0.9275 0.0070 0.0090 0.8521 0.0100
-10% 0.0127 0.9908 0.0014 0.0097 0.9500 0.0042
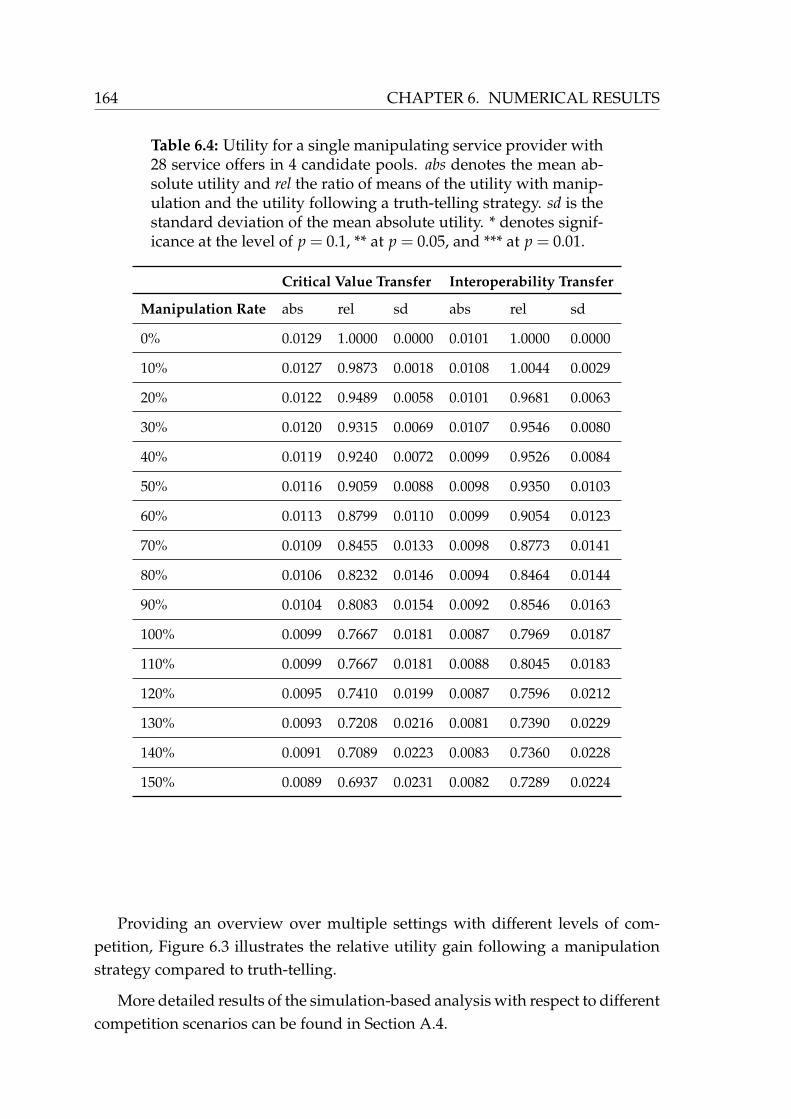
164 CHAPTER 6. NUMERICAL RESULTS
Table 6.4: Utility for a single manipulating service provider with28 service offers in 4 candidate pools. abs denotes the mean ab-solute utility and rel the ratio of means of the utility with manip-ulation and the utility following a truth-telling strategy. sd is thestandard deviation of the mean absolute utility. * denotes signif-icance at the level of p = 0.1, ** at p = 0.05, and *** at p = 0.01.
Critical Value Transfer Interoperability Transfer
Manipulation Rate abs rel sd abs rel sd
0% 0.0129 1.0000 0.0000 0.0101 1.0000 0.0000
10% 0.0127 0.9873 0.0018 0.0108 1.0044 0.0029
20% 0.0122 0.9489 0.0058 0.0101 0.9681 0.0063
30% 0.0120 0.9315 0.0069 0.0107 0.9546 0.0080
40% 0.0119 0.9240 0.0072 0.0099 0.9526 0.0084
50% 0.0116 0.9059 0.0088 0.0098 0.9350 0.0103
60% 0.0113 0.8799 0.0110 0.0099 0.9054 0.0123
70% 0.0109 0.8455 0.0133 0.0098 0.8773 0.0141
80% 0.0106 0.8232 0.0146 0.0094 0.8464 0.0144
90% 0.0104 0.8083 0.0154 0.0092 0.8546 0.0163
100% 0.0099 0.7667 0.0181 0.0087 0.7969 0.0187
110% 0.0099 0.7667 0.0181 0.0088 0.8045 0.0183
120% 0.0095 0.7410 0.0199 0.0087 0.7596 0.0212
130% 0.0093 0.7208 0.0216 0.0081 0.7390 0.0229
140% 0.0091 0.7089 0.0223 0.0083 0.7360 0.0228
150% 0.0089 0.6937 0.0231 0.0082 0.7289 0.0224
Providing an overview over multiple settings with different levels of com-petition, Figure 6.3 illustrates the relative utility gain following a manipulationstrategy compared to truth-telling.
More detailed results of the simulation-based analysis with respect to differentcompetition scenarios can be found in Section A.4.

6.1. MANIPULATION ROBUSTNESS OF THE ITF EXTENSION 165
Figure 6.3Utility for a single manipulating service provider in differentcompetition scenarios. ITF_|V|_K denotes the setting with |V|service offers in K candidate pools, where |V| = V \ vs,v f .
6.1.3 Implications
In Section 6.1, strategic behavior of service providers has been analyzed in thecomplex service auction with the interoperability transfer in comparison to thecomplex service auction with the critical value transfer.
As shown analytically in Section 5.1, the complex service auction with criticalvalue transfer implements a truth-telling equilibrium in weakly dominant strate-gies, i.e. service providers cannot benefit from misreporting their true valuation.This is a valuable property for a mechanism and the implemented social choice asit assures truthful behavior of all participants which allows for an efficient alloca-tion that maximizes welfare among service providers and the service requester. Itfurthermore reduces the strategy space of beneficial strategies to a single weaklydominant strategy independent of the strategies of all other participants. Thisimplies that service providers do not have to reason about the behavior of otherparticipants in the complex service auction.
Incentive compatibility comes at the price of budget balance. As a remedy forthis shortcoming, the ITF has been introduced in Section 4.2. The ITF sacrifices
166 CHAPTER 6. NUMERICAL RESULTS
incentive compatibility and efficiency to a certain degree in order to retain budgetbalance. The ITF furthermore rewards service providers that offer highly inter-operable services within the service value network, which increases the numberof feasible service compositions that can be offered to the requester. Thus, theITF implements incentives to increase a services’ interoperability and thereforefosters the growth of vital and more agile service value networks. This propertyis analyzed in detail in Section 6.2.
Using the complex service auction with the critical value transfer as a bench-mark, the robustness of the complex service auction with the ITF extension hasbeen analyzed with respect to bid manipulation (deviation from the truth-tellingstrategy). The simulation-based results show that in scenarios with a low levelof competition, implementing the ITF extension opens up strategic behavior to acertain degree. Service providers can significantly benefit from misreporting theirtrue valuation. Nevertheless, in settings with a slightly higher level of competi-tion (e.g. 20 service offers in 4 candidate pools), the set of beneficial manipulationstrategies is decreased tremendously. Although the complex service auction withthe ITF extension is not incentive compatible in a strict analytical sense, serviceproviders cannot significantly benefit from misreporting their true valuation insettings with a still relatively low level of competition (e.g. cp. results in TableA.5 in a setting with 28 service providers in 4 candidate pools).
As the attraction of service value networks underlays network externalities,the value that service requesters gain from initiating a complex service auctionhighly depends on the number of participating service providers and the numberof feasible complex service instances that can be provided through the network.Hence, especially in an early growing stage of a service value network, it might bedesirable for platform providers to implement a mechanism that rewards serviceproviders for offering multiple services with a high degree of interoperability,such as the complex service auction with the ITF extension does. Especially insettings with a low level of competition, critical values of service providers canbe relatively high and unpredictable for the platform provider. Hence, a budget-balanced variant might be favorable in such an early stage as well. Reachinga critical mass of participants the network’s inherent competition increases andcritical values of service providers tremendously decrease. Assuring completetruthful behavior of service provider, the complex service auction with the criti-cal value transfer might be beneficial for both service providers and the servicerequester. Service providers do not have to reason about the other participants’behavior and the service requester trustfully receives a tailored complex service

6.2. INCENTIVIZING INTEROPERABILITY ENDEAVORS 167
instance. This variant always assures a welfare maximizing solution accountingfor the providers’ and the requester’s side.
6.2 Incentivizing Interoperability Endeavors
The interoperability transfer function (ITF) is designed as a remedy to overcomethe lack of budget balance in the complex service auction. The design goal ofthe ITF is on the one hand to reduce strategic behavior of service providers withrespect to beneficial deviation from the truth-telling strategy as evaluated in Sec-tion 6.1. On the other hand the design of the ITF targets to incentivize serviceproviders to increase their services’ degree of interoperability, i.e. to increase thecapability of their offered services to communicate and function with other ser-vices within the service value network. A higher degree of interoperability in-creases the potential of a service value network to satisfy different customers’needs and to provide a huge variety of feasible complex service instances to re-questers. Increasing customers’ choice leads to a rapid growth of demand and ad-dresses the long tail of business [And06](cp. Section 2.1.4.3). These implicationsare especially important for service value networks in their early stage of devel-opment as it attracts various customers which leads to a growth of rich candidatepools by attracting service providers to participate in value creation (the effect ofnetwork externalities is well-known in literature [SV99, FK07, LM94, KS85]).
To study the effect of the ITF on the network’s degree of interoperability,the work at hand follows the research method of an agent-based simulation asoutlined in Section 2.3.2. As a suitable benchmark to evaluate incentives imple-mented by the ITF, an Equal Transfer Function (ETF) is consulted that distributesthe system’s surplus equally among all allocated service providers [PKE01]3. TheETF represents a neutral payment scheme as it equally distributes the same sur-plus as the ITF. The goal of this evaluation is to analyze if and to what degreeincreasing the interoperability degree of service offers within a service value net-work is beneficial for service providers in the complex service auction with theITF compared to the complex service auction with the ETF. This leads to the fol-lowing hypotheses:
Hypothesis 6.1. The overall interoperability degree of a service value network increases
by establishing the ITF compared to the ETF.
3The equal transfer function that serves as a benchmark is similar to the k-pricing scheme in[Sto09, Sch07] with parameter selection k = 1
168 CHAPTER 6. NUMERICAL RESULTS
Hypothesis 6.2. The interoperability degree of allocated service offers increases using the
ITF compared to the ETF.
Hypothesis 6.3. The interoperability degree of non-allocated service offers increases us-
ing the ITF compared to the ETF.
6.2.1 Simulation Model
According to the design of the ITF, allocated service providers can gain by in-creasing their degree of interoperability as this increases their chance of receiv-ing their critical value as a discount in addition. Nevertheless, in the complexservice auction with the ETF it might also be beneficial to increase one’s degreeof interoperability. Focusing on non-allocated service offers, by building addi-tional connections to predecessor services proactively, service providers face theopportunity to change the network’s topology and augment the chance of beingallocated. It is unclear which effect dominates in settings with different levels ofcompetition and different proportionate investment costs.
Each service provider is assumed to have a set of strategies representing thedegree of its service’s interoperability that the service provider intents to realizedepending on how it is situated within the network4. This means that depend-ing on the number of predecessor services, service providers can decide on howmany edges to predecessor services they want to establish. Recall, an edge be-tween two adjacent services denotes the capability of interpreting each othersinputs and outputs, i.e. both services are interoperable and therefore can be iter-atively combined within a complex service instance.
Each agent’s5 strategy space is determined by all feasible degrees of interoper-ability (ID) of its service offer represented by its number of incoming edges. E.g.if a service offer has 4 predecessor services within the service value network andthe initial number of incoming edges is 2, the service provider’s strategy space is2,3,4.
For each extra edge built additionally to the initial number of incoming edgesthe service provider is charged proportionate investment costs (IVC) no matterif the service is being allocated or not6. Proportionate investment costs are cal-
4For simplicity it is assumed that each service provider owns only a single service within thenetwork
5In the context of the agent-based simulation, the terms service provider and agent are usedinterchangeably.
6It is important to note that the complex service auction is conducted as a one-shot gamewhich has to be considered when evaluating specific properties. Therefore, accounting for full

6.2. INCENTIVIZING INTEROPERABILITY ENDEAVORS 169
culated as a fraction of the internal costs for executing the particular service de-pending on the predecessor service. It is assumed that internal costs for context-dependent execution reflect the degree of similarity of both services’ interfaces(e.g. low internal costs indicate a high degree of interfaces’ compatibility). Hence,investment costs for reprogramming a service’s interface in order to work seam-lessly with another service component behave accordingly.
Analogue to Section 6.1.1, each problem set is characterized by a random net-work topology with random costs cij assigned to each incoming edge of serviceoffers drawn from U(0,1.0). Furthermore, the requester’s willingness to pay α isanalogously drawn from U(0, 1
2 K) with K being the number of candidate pools.
The evaluation is conducted by means of an agent-based simulation based ona simple form of a Q-Learning model [WD92]. In contrary to more sophisticatedvariants of Q-learning models, the simulation model at hand only considers asingle state which reduces the parameter complexity and therefore simplifies thecalibration of the simulation. Simplifying the simulation model reduces the num-ber of assumptions which allows for a better generalization of results.
Each agent maintains a fitness table which keeps track of the “successfulness”of each action such that frik represents the fitness of agent i for action k in sim-ulation round r. The fitness for each chosen action is updated based upon theresulting “reward” (represented by the agent’s utility ur
ik). Balancing past andpresent experiences, the learning parameter β ∈ [0;1] determines to which de-gree past and present feedback is incorporated into the fitness update. Thus, thefitness update evolves as follows:
(6.1) frik = βfr−1ik + (1− β)ur
ik
Each action is selected based on a softmax selection method [SB99], i.e. each ac-tion is randomly chosen based on the probability Pr
ik that results from the action’sfitness relative to the sum of all actions’ fitness such that
(6.2) Prik =
frik
∑k frik
investment costs that are necessary to reprogram a service’s interface in order to enable interop-erability with certain other services results in prohibitively high costs which hinders a feasibleone-shot game analysis.

170 CHAPTER 6. NUMERICAL RESULTS
The simulation is conducted as depicted in Figure 6.4. The simulation processis divided into an exploration phase and a simultaneous exploitation phase.
Strategy selection for a single node i based on probability
Computation of allocation and
transfers
Fitness update for node i based on past and present information
Exploration Phase
Simultaneous Exploitation Phase
r ik
r
ik
ik
r
k
P =∑f
f1( ) (1 )r r r
ik ik ikuβ β−= + −f f
All nodes choose a strategy based on
Calculation of allocation and transfer to each node based on
each requester type
Calculation of mean transfer and update of fitness for all nodes
, s fv vi V∀ ∈ ∖
r∀ ∈R
r∀ ∈R
1( ) (1 )r r r
ik ik ikuβ β−= + −f f
r ik
r
ik
ik
r
k
P =∑f
f
Figure 6.4Simulation model for the evaluation of interoperability
incentives using the ITF.
Exploration Phase In this phase each agent explores the solution space in a con-stant environment where only a single agent learns simultaneously. Start-ing based on an initial fitness table with equal probabilities for every action,each agent adapts its individual best action given the other agents do notchange their decisions. The exploration phase is conducted 100 rounds 7
for each agent i ∈ V \ vs,v f .
Simultaneous Exploitation Phase In order to determine the most promising ac-tion for each agent dependent on the decision taken by every other agent,in the exploitation phase every agent learns its best action simultaneouslybased on the experiences gained from the exploration phase. The simulta-neous exploration phase is conducted 100 rounds. 7
7The number of required rounds in order to achieve a convergence of the fitness values foreach action has been analyzed by means of a sensitivity analysis.

6.2. INCENTIVIZING INTEROPERABILITY ENDEAVORS 171
As the number of observations is relatively high (N = 50) and the data is nor-mally distributed which has been tested by means of a Kolmogorov-Smirnov test,stated hypothesis are tested using a one-tailed matched-pairs t-test. With respectto the overall network, allocated, and non-allocated service offers, the alternativehypothesis that the interoperability degree of a service value network increasesby establishing the ITF compared to the ETF is analyzed, i.e. the mean differencein interoperability degrees is greater than zero.
6.2.2 Results
Recall, the complex service auction with the interoperability transfer function(ITF) is designed to incentivize service providers to increase their services’ degreeof interoperability. In order to evaluate this property, the ITF is benchmarkedagainst an equal transfer function (ETF) which distributes the system’s surplusamong all allocated service providers equally.
Table 6.5 and Figure 6.5 show a comparison of the ITF and the ETF with re-spect to resulting interoperability degrees (ID) at different levels of proportionateinvestment costs (IVC) for 20 service offers in 4 candidate pools.
Table 6.5: Interoperability degrees (ID) at different levels of pro-portionate investment cost (IVC) for 20 service offers in 4 candi-date pools. ID denotes the overall interoperability degree, ID_-A denotes the interoperability degree of all allocated service of-fers, and ID_NA denotes the interoperability degree of all non-allocated service offers. * denotes significance at the level ofp = 0.1, ** at p = 0.05, and *** at p = 0.01.
Critical Value Transfer Interoperability Transfer
IVC ID ID_A ID_NA ID ID_A ID_NA
0% 0.6665 0.7571 0.6438 0.6766*** 0.7711*** 0.6530***
10% 0.4595 0.6025 0.4238 0.4891*** 0.6710*** 0.4436***
20% 0.3676 0.4811 0.3392 0.3963*** 0.5780*** 0.3509***
30% 0.3343 0.4201 0.3129 0.3544*** 0.4934*** 0.3196***
40% 0.3199 0.3838 0.3040 0.3347*** 0.4474*** 0.3065***
50% 0.3201 0.3831 0.3043 0.3321*** 0.4394*** 0.3053*
60% 0.3147 0.3576 0.3039 0.3218*** 0.3899*** 0.3048**
70% 0.3118 0.3355 0.3059 0.3164*** 0.3616*** 0.3051*

172 CHAPTER 6. NUMERICAL RESULTS
Table 6.5: Interoperability degrees (ID) at different levels of pro-portionate investment cost (IVC) for 20 service offers in 4 candi-date pools. ID denotes the overall interoperability degree, ID_-A denotes the interoperability degree of all allocated service of-fers, and ID_NA denotes the interoperability degree of all non-allocated service offers. * denotes significance at the level ofp = 0.1, ** at p = 0.05, and *** at p = 0.01.
Critical Value Transfer Interoperability Transfer
IVC ID ID_A ID_NA ID ID_A ID_NA
80% 0.3145 0.3612 0.3029 0.3196*** 0.3854*** 0.3032
90% 0.3097 0.3407 0.3019 0.3133*** 0.3616*** 0.3013
100% 0.3111 0.3617 0.2985 0.3137*** 0.3772*** 0.2979
110% 0.3101 0.3542 0.2990 0.3113*** 0.3614*** 0.2988
120% 0.3150 0.3789 0.2990 0.3159*** 0.3841*** 0.2989
130% 0.3084 0.3749 0.2918 0.3110*** 0.3877*** 0.2918
140% 0.3114 0.3504 0.3017 0.3122*** 0.3537*** 0.3018
150% 0.3091 0.3431 0.3006 0.3101*** 0.3479** 0.3007
160% 0.3101 0.3407 0.3025 0.3111** 0.3469** 0.3022
170% 0.3076 0.3416 0.2991 0.3080* 0.3437* 0.2991
180% 0.3115 0.3563 0.3003 0.3076* 0.3505 0.2969
190% 0.3126 0.3539 0.3022 0.3126 0.3541 0.3022
200% 0.3098 0.3598 0.2973 0.3101 0.3613 0.2973
In general, it is observable that an increase of proportionate investment costs results
in a decrease of interoperability degrees with respect to both transfer functions. Invest-ment costs are obviously a disincentive for increasing ones services’ degree ofinteroperability and therefore counteract the incentive schema provided by theITF. Despite of the primary incentives provided by the transfer function, serviceproviders might also have an incentive to increase their degree of interoperabilityindependent of the design of the transfer function as establishing more relationsto other services allows for proactively changing the initial topology of the servicevalue network. By doing so, service providers face the opportunity to be bettersituated within the network and increase the likelihood of being allocated. Thus,proportionate investment costs also disincentivize interoperability endeavors un-
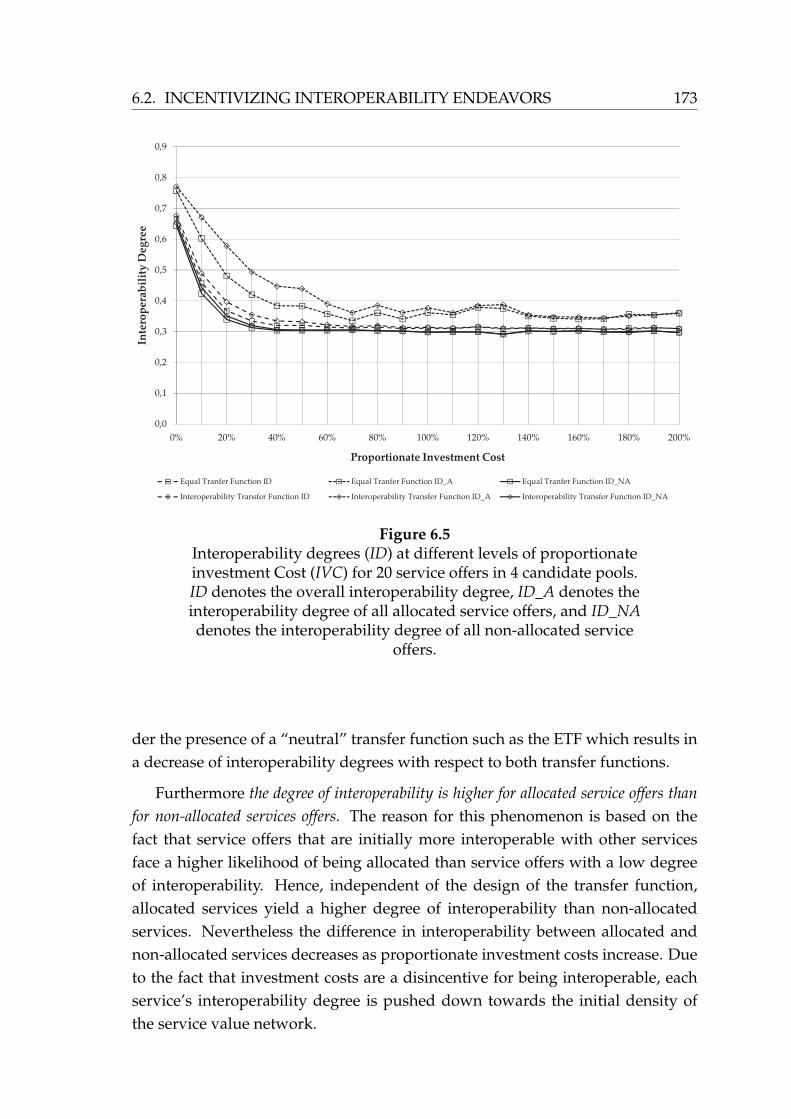
6.2. INCENTIVIZING INTEROPERABILITY ENDEAVORS 173
Figure 6.5Interoperability degrees (ID) at different levels of proportionateinvestment Cost (IVC) for 20 service offers in 4 candidate pools.ID denotes the overall interoperability degree, ID_A denotes theinteroperability degree of all allocated service offers, and ID_NAdenotes the interoperability degree of all non-allocated service
offers.
der the presence of a “neutral” transfer function such as the ETF which results ina decrease of interoperability degrees with respect to both transfer functions.
Furthermore the degree of interoperability is higher for allocated service offers than
for non-allocated services offers. The reason for this phenomenon is based on thefact that service offers that are initially more interoperable with other servicesface a higher likelihood of being allocated than service offers with a low degreeof interoperability. Hence, independent of the design of the transfer function,allocated services yield a higher degree of interoperability than non-allocatedservices. Nevertheless the difference in interoperability between allocated andnon-allocated services decreases as proportionate investment costs increase. Dueto the fact that investment costs are a disincentive for being interoperable, eachservice’s interoperability degree is pushed down towards the initial density ofthe service value network.

174 CHAPTER 6. NUMERICAL RESULTS
In the setting with 20 service offers in 4 candidate pools (cp. Table 6.5), Hy-pothesis 6.1 is supported significantly until a level of proportionate investmentcosts of 180%. Distinguishing between allocated and non-allocated service offers,Hypothesis 6.2 is supported until 170% investment costs and Hypothesis 6.3 issignificantly supported up to 70% proportionate investment costs. The differencein the levels of investment costs until each hypothesis is supported bases on twoeffects. First, allocated services are primarily incentivized by the construction of the ITF
whereas non-allocated services only benefit from a higher degree of interoper-ability if they are allocated in the changed topology. Hence, for service providers
that own non-allocated services, the effect of the implemented incentive is compensated
earlier by the disincentive provided through the investment costs. The second effect forthe different support levels of each hypothesis is based on the fact that there aremore discrete degrees of interoperability for the overall network than for a subsetof service offers. This means that as allocated service offers are rare, if a single ser-vice’s degree of interoperability decreases, the overall degree of interoperabilityfor all allocated services drops rapidly.
Looking at different levels of competition in the service value network, Table6.6 shows a comparison of the ITF and the ETF with respect to resulting interoper-ability degrees at different levels of proportionate investment costs for 32 serviceoffers in 4 candidate pools.
Table 6.6: Interoperability degrees (ID) at different levels of pro-portionate investment cost (IVC) for 32 service offers in 4 candi-date pools. ID denotes the overall interoperability degree, ID_-A denotes the interoperability degree of all allocated service of-fers, and ID_NA denotes the interoperability degree of all non-allocated service offers. * denotes significance at the level ofp = 0.1, ** at p = 0.05, and *** at p = 0.01.
Critical Value Transfer Interoperability Transfer
IVC ID ID_A ID_NA ID ID_A ID_NA
0% 0.6118 0.7298 0.5949 0.6189*** 0.7369*** 0.6020***
50% 0.2026 0.2474 0.1962 0.2051*** 0.2642*** 0.1966*
100% 0.2015 0.2453 0.1952 0.2017*** 0.2472** 0.1952*
150% 0.2016 0.2427 0.1957 0.2016* 0.2433* 0.1957
200% 0.2004 0.2369 0.1952 0.2004 0.2369 0.1952
6.2. INCENTIVIZING INTEROPERABILITY ENDEAVORS 175
Compared to the previous setting, the overall incentive provided by the ITFto increase interoperability is weakened. At a level of 150% proportionate in-vestment costs, Hypothesis 6.1 and 6.2 are only supported at a level of p = 0.1whereas Hypothesis 6.3 is not supported at all. A higher level of competitiondecreases critical values of service providers. Thus, increasing ones degree of in-teroperability to obtain ones critical value is less favorable in highly competitivesettings.
6.2.3 Implications
In Section 6.2 the interoperability transfer function (ITF) is analyzed with respectto its design to incentivize service providers to increase their services’ degree ofinteroperability. The evaluation is conducted by means of an agent-based sim-ulation comparing the complex service auction with the ITF extension and theITF with an equal transfer function (ETF) that distributes the available surplusequally among service providers that own allocated service offers within the ser-vice value network.
Summarizing the results in Section 6.2.2, the ITF extension incentivizes serviceproviders – those which own allocated (cp. Hypothesis 6.2) and non-allocated(cp. Hypothesis 6.3) service offers – to increase their services’ degree of interop-erability as stated by Hypothesis 6.1. That is, the design of the ITF implementsincentives to undertake endeavors to customize service interfaces which enablescommunication and data transfer with multiple adjacent service components. Ofcourse, proportionate investment costs that service providers have to bear for thiscustomization process function as a disincentive counteracting interoperabilityendeavors. In general, in service value networks with a low level of competi-tion and only few interrelated service offers, the ITF extension appears to be apromising approach to foster the growth of service value networks’ variety inan early stage of development and to increase the multitude of feasible complexservice instances that can be offered to customers. An increase of variety andinteroperability leverages network externalities [SV99, FK07, LM94, KS85] andattracts customers which in turn attracts more service providers to participate inthe complex service auction.

176 CHAPTER 6. NUMERICAL RESULTS
6.3 Bundling Strategies of Service Providers
Recall, in Section 5.1 it has been shown that under the assumption of rationality,service providers act best (or at least equally good) by revealing their true multi-dimensional type which reduces their bidding strategy space to a single strategy.Broadening service providers’ strategic horizon, it might be beneficial under cer-tain circumstances to form coalitions and offer services in a bundled fashion. Thissection focuses on strategies of service providers with focus on opportunities toform bundled offers with other providers depending on how they are situatedwithin service value networks.
Since a service provider’s offer is only successful if one of its edges is allocated,service providers tend to find strategies to improve their situation. Two optionsare mainly distinguished, unbundling vs. bundling. Service providers can decideon either offering services on their own with a certain degree of interoperabilityto preceeding offers. Such a strategy is referred to as unbundling strategy. Onthe other hand service providers can also provide bundled services together withservice providers that own services in adjacent candidate pools (either preceedingor succeeding), i.e. two service providers from different candidate pools combinetheir offers to a single service which aggregates both service characteristics. It isfurthermore assumed that a combined service offer results in lower internal costsdue to synergy effects that can be leverage through bundled offers. This strategyis referred to as bundling strategy. There are mainly two contrary effects and it isunclear which effect dominates in what setting.
Competing in quality through differentiation and flexibility It is certainly justreasonable to follow an unbundling strategy if a provider’s service offersexpose significantly lower prices (due to lower internal costs) or signifi-cantly better QoS characteristics than competing offers. Additionally, un-bundled services offer more differentiated and specialized functionalitywhich increases their flexible integration into different complex services,and thus, increase the number of possible combinations with other servicesfrom other candidate pools.
Competing in price through cost reduction On the other hand, it might be ad-vantageous for service providers to cut costs through forming bundled of-fers collaboratively, i.e. combining their service offers to a service bundlewhich offers the functionality of both services in an integrated manner.In that case internal costs of the bundled services are likely to be lowercompared to the sum of internal costs of two single offers. In the case of

6.3. BUNDLING STRATEGIES OF SERVICE PROVIDERS 177
bundling, an aggregation of attribute values defining the service’s configu-ration is done according to aggregation operations in Table 3.1. Neverthe-less, bundling service offers results in a reduction of the degree of interop-erability, i.e. a merge of service offers prunes incoming edges to preceedingservices which decreases the number of complex service instances the bun-dled offer is part of.
It is unclear which strategy is beneficial for service providers with respect tohow their service offers are situated within the service value network. Even forservice offers that are competitive in price and attractive for the service requesters– i.e. they are allocated solely – forming a bundled offer with a less competitiveservice offer may be mutually beneficial for both partners. The following exampleillustrates the phenomenon where a bundling strategy is mutually beneficial foran allocated and a non-allocated service provider at the same time even thoughthere is no reduction of internal costs due to bundling synergies assumed:
Example 6.1 [BENEFICIAL BUNDLING STRATEGY]. Figure 6.6 depicts the service
value network from an initial ex-ante perspective. Without loss of generality it is assumed
that service providers only announce price bids (no QoS) and each service provider only
owns a single service offer within the service value network. Consequently there are four
service providers sy, sz, sa, sb that own service offers y,z, a,b. Numbers on incoming edges
to each node represent price bids placed by service providers8.
y z
s f
a b
0.1
0.3
0.2
0.1
0.9
0.1
Figure 6.6Beneficial bundling strategy for allocated and non-allocated
service providers (ex-ante case).
According to the CSA mechanism, the path f ∗ = esa, eaz, ez f is allocated as it yields
the overall lowest price of 0.2 and therefore maximizes welfare. The “second-best” path
f 2 = esy, eyb, ez f yields an overall price of 0.3. According to the CSA’s transfer func-
tion, payments are given to allocated service providers such that tsa = 0.1+(0.3− 0.2) =0.2 and tsz = 0.1 + (0.3− 0.2) = 0.2.
8Note that according to Theorem 5.2 it is a dominant strategy equilibrium in the CSA thatservice providers report their valuations truthfully, that is, they announce their internal costs.

178 CHAPTER 6. NUMERICAL RESULTS
Focusing on the ex-post case depicted in Figure 6.7, service providers sy and sz have
agreed on offering their service offers y and z as a bundle yz. As it is assumed that it is
not possible to realize a cost reduction following a bundling strategy, internal costs for
offering the single services add up to 0.4 for service offer yz.
yz
s f
a b
0.4
0.1
0.9
Figure 6.7Beneficial bundling strategy for allocated and not allocated
service providers (ex-post case).
According to the CSA mechanism, the path f ∗ = esyz, ez f is allocated which results
in a price of 0.4 whereas the other path f 2 = esa, eab, eb f yields a price of 1.0. It is as-
sumed that service providers sy and sz divide their payoff according to their contribution
to the alliance which means the ratio of their internal costs determines their share. Con-
sequently payments to service providers evolve es follows: tsy = 34(0.4 + (1.0− 0.4)) =
0.75 and tsz = 14(0.4 + (1.0− 0.4)) = 0.25.
The example at hand shows that although if there is no cost reduction due to synergy
effects when following a bundling strategy it might be beneficial for allocated and non-
allocated service providers to jointly offer a bundled solution. In this scenario the effect of
reducing the network’s density (meaning cutting edges by merging service offerings) also
affects the number of feasible complex service instances and the composition outcome.
Both fundamental strategies imply advantageous and disadvantageous ef-fects and it is unclear which effect dominates: lower costs to increase the likeli-hood of being part of the allocation by offering bundled services at a lower pricebut at the same time a decrease in interoperability which reduces the number ofpossible service combinations that entail the bundled offer, and thus, reducing thelikelihood to be part of the allocation. In contrary an unbundling strategy increasedifferentiation and specialization but disables opportunities to realize synergy ef-fects. It is proposed that the question whether or not bundling or unbundling isthe better strategy to follow depends on the service provider’s individual strate-gic strength. Thus, it is distinguished in service providers that are part of theallocation and those which are not. The following hypotheses are derived:

6.3. BUNDLING STRATEGIES OF SERVICE PROVIDERS 179
Hypothesis 6.4. Service offers which are not allocated have a higher likelihood of being
allocated by choosing a bundling strategy instead of an unbundling strategy.
Hypothesis 6.5. For service offers which are not allocated, a bundling strategy leads to
a higher expected payoff than an unbundling strategy.
Hypothesis 6.6. Allocated service offers have a higher likelihood of staying allocated by
following an unbundling strategy instead of a bundling strategy.
Hypothesis 6.7. For service offers that are allocated, an unbundling strategy leads to a
higher payoff than following a bundling strategy.
The terms likelihood or probability and expected payoff are used with respect tothe limited set of observations. Therefore the likelihood or probability of an eventrefers to the relative frequency of the occurrences of that particular event. Anal-ogously, the term expected payoff refers to the relative frequency times the meanpayment observed.
6.3.1 Simulation Model
The stated hypotheses are studied following a simulation approach. The prob-lem is modeled as an n-person game in which each node represents a serviceoffer. Without loss of generality it is assumed that service providers only owna single service offer within the network. Each service offer is characterized byan attribute value for the types encryption and response time. Dependent on thenetwork topology each service provider faces the decision of choosing an action k
which is either to offer a service on its own, i.e. an unbundling strategy which is de-noted by k = u, or to form a bundled offer with one of its successors, i.e. a bundling
strategy which is denoted by k = b. Thus, in each simulation round r ∈ R eachnode i ∈ V \ vs,v f has to choose an action k ∈ Ki. The service provider’s utilityuik resulting from the action chosen is dependent on the topology of the network,the service requester’s scoring function, and all other service offers within thenetwork including their quality and price. For each topology all these factors arestochastic. As such, the node’s action decision does not solely control the pay-off. Thus, the decision problem of the nodes is comparable to an n-armed bandit
problem. Since reinforcement learning has proven to cope with such a model-freesituation, a simple form of a reinforcement learning algorithm is applied in thepresent approach. Each node i assigns a fitness value frik to each possible action

180 CHAPTER 6. NUMERICAL RESULTS
k ∈ Ki. The fitness of the chosen action k is updated at the end of the periodaccording to the update rule with the learning rate β ∈ [0;1].:
(6.3) frik = βfr−1ik + (1− β)ur
ik
Actions are chosen according to a probability choice rule based on each fitnesspropensity.
(6.4) Prik =
frik
∑k frik
The action’s propensity is calculated as its fitness weighted by the sum of allfitness values corresponding to the node’s actions.
Analogue to the simulation model in Section 6.2.1, the conduction of the simu-lation is divided in two phases: an exploration phase and a simultaneous exploitation
phase. Figure 6.8 displays the simulation phases and the steps of each phase. Eachphase consists of a certain number of rounds r ∈ R. Each round in the single ex-ploration phase consists of 3 steps. In the first step a single node i chooses anaction k with propensity Pr
ik out of its action set. In the second step, the allocationis computed as well as the mean payoffs for all allocated nodes based on all re-quester types (different requester types are explained in detail in Section 6.3.2). Itis important to notice that, depending on the requesters’ scoring functions, allo-cated service offers and corresponding payoffs differ. In the third step, the fitnessvalue of the chosen action is updated based on the mean payoff computed basedon all requester types.
After having trained all nodes, the simultaneous exploitation phase starts inorder to evaluate settings with simultaneous decisions. Analogue to the explo-ration phase, each round of the simultaneous exploitation phase runs throughthree steps. In the first step, all nodes simultaneously choose a strategy basedon Pik. Note, that in the training phase it is just one node choosing the strategy.Only if bilateral bundling decisions match, service offers are merged to a singlenode forming a bundled offer. The allocation and the mean payoffs based on allrequester types are computed in the second step. Each service provider is as-signed a numerical value indicating its market power within the service valuenetwork. In case two service offers are merged to a bundled offer which is al-located, resulting payoff is distributed based on the market power ratio of both

6.3. BUNDLING STRATEGIES OF SERVICE PROVIDERS 181
Strategy selection for a single node i based on probability
Computation of allocation and
transfers based on all different requester
types
Fitness update for node i based on past and present information
Exploration Phase
Simultaneous Exploitation Phase
r ik
r
ik
ik
r
k
P =∑f
f1( ) (1 )r r r
ik ik ikuβ β−= + −f f
All nodes choose a strategy based on
and matching decision are accepted
Calculation of allocation and transfer to each node based on all different requester
types
Calculation of mean transfer and update of fitness for all nodes
, s fv vi V∀ ∈ ∖
r∀ ∈R
r∀ ∈R
1( ) (1 )r r r
ik ik ikuβ β−= + −f f
r ik
r
ik
ik
r
k
P =∑f
f
Figure 6.8Simulation model for the evaluation of bundling and
unbundling strategies of service providers.
service providers. The last step is again to update the fitness values of all nodesbased on the mean payoff.
The data of the simultaneous exploitation phase is analyzed with respect toevery possible event that may occur during the conduction of the complex serviceauction. Table 6.7 shows each possible event that is analyzed with respect to itsrelative frequency of occurrence (which can be interpreted as the likelihood of theevent’s realization) and its expected payoff, i.e. the corresponding mean payoffsreceived times the event’s likelihood of occurrence.
The stated hypothesis are tested using a Wilcoxon signed-rank test as thenumber of observations is relatively small (N = 30) and the data is not normallydistributed which was tested by means of a Kolmogorov-Smirnov test. The datais based on the mean relative frequencies of each event and corresponding ex-pected payoffs over all service providers.

182 CHAPTER 6. NUMERICAL RESULTS
Table 6.7: Analyzed events for the evaluation of bundling andunbundling strategies of service providers with respect to theirrelative frequency of occurrence and the corresponding expectedpayoffs. The set Es denotes the set of edges with Es = eij|eij ∈o, j ∈ σ(s), i ∈ τ(j), i.e. the set of allocated edges that belong toservice provider s’s service offers.
Metric Et Et+1 k = b k = u
RelativeEt 6= ∅
Et+1 6= ∅ P(Et+1 6= ∅|k = b, Et 6= ∅) P(Et+1 6= ∅|k = u, Et 6= ∅)
FrequencyEt+1 = ∅ P(Et+1 = ∅|k = b, Et 6= ∅) P(Et+1 = ∅|k = u, Et 6= ∅)
Et = ∅Et+1 6= ∅ P(Et+1 6= ∅|k = b, Et = ∅) P(Et+1 6= ∅|k = u, Et = ∅)Et+1 = ∅ P(Et+1 = ∅|k = b, Et = ∅) P(Et+1 = ∅|k = u, Et = ∅)
ExpectedEt 6= ∅
Et+1 6= ∅ E(Et+1 6= ∅|k = b, Et 6= ∅) E(Et+1 6= ∅|k = u, Et 6= ∅)
PayoffEt+1 = ∅ E(Et+1 = ∅|k = b, Et 6= ∅) E(Et+1 = ∅|k = u, Et 6= ∅)
Et = ∅Et+1 6= ∅ E(Et+1 6= ∅|k = b, Et = ∅) E(Et+1 6= ∅|k = u, Et = ∅)Et+1 = ∅ E(Et+1 = ∅|k = b, Et = ∅) E(Et+1 = ∅|k = u, Et = ∅)
6.3.2 Simulation Settings
As introduced in Section 6.3 there are two fundamental strategic alternatives ser-vice providers have to face: Focusing on differentiation and the provision of flexi-ble service offers that are of highly specialized by following an unbundling strategy
or focusing on cost reduction due to synergy effects in order to compete in priceby following a bundling strategy.
To evaluate the success of both strategies and how advantageous and disad-vantageous effects of both strategies dominate under which conditions, five dif-ferent representative types of services requesters are simulated that have differentpreferences over different QoS attributes and prices of the complex service. Eachof these five standard subjects represents a homogenous group of requesters9.
As the results are dependent on the level of competition, multiple scenarioswith different numbers of service offers and candidate pools are evaluated. Eachscenario has been evaluated with 30 different problems sets, i.e. 30 randomly gen-erated topologies based on the parameters outlines in Table 6.8. The explorationphase as well as the simultaneous exploitation phase are conducted 500 times10.
Each service offer is characterized by attribute values for the types responsetime and encryption. Attribute values for the type response time are uniformly
9An alternative approach is the simulation of service requesters with randomly chosen prefer-ences. Nevertheless, this results in heavy statistical noise and hinders the convergence of serviceproviders’ fitness in an appropriate number of exploration and exploitation rounds.
10A sensitivity analysis has shown that after 500 rounds with a learning rate of β = 0.1, whichavoids stagnation in local optima, the agents’ fitness converges to a single best action.
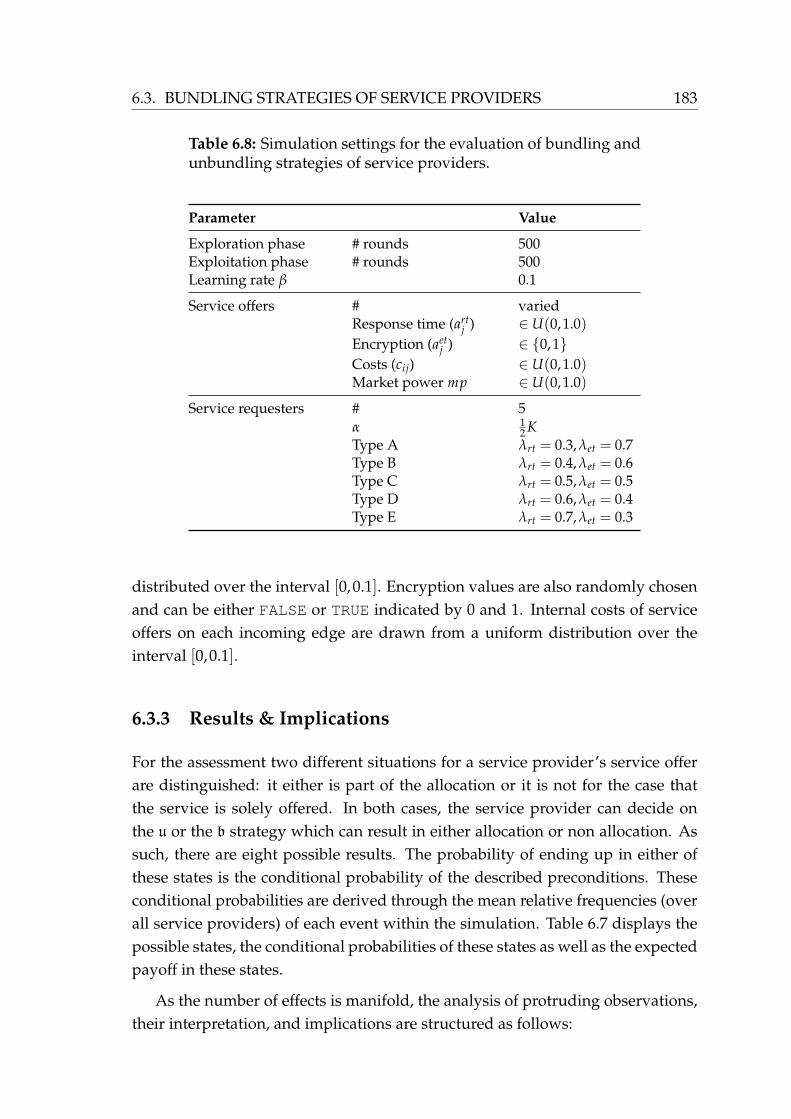
6.3. BUNDLING STRATEGIES OF SERVICE PROVIDERS 183
Table 6.8: Simulation settings for the evaluation of bundling andunbundling strategies of service providers.
Parameter Value
Exploration phase # rounds 500Exploitation phase # rounds 500Learning rate β 0.1
Service offers # variedResponse time (art
j ) ∈U(0,1.0)Encryption (aet
j ) ∈ 0,1Costs (cij) ∈U(0,1.0)Market power mp ∈U(0,1.0)
Service requesters # 5α 1
2 KType A λrt = 0.3,λet = 0.7Type B λrt = 0.4,λet = 0.6Type C λrt = 0.5,λet = 0.5Type D λrt = 0.6,λet = 0.4Type E λrt = 0.7,λet = 0.3
distributed over the interval [0,0.1]. Encryption values are also randomly chosenand can be either FALSE or TRUE indicated by 0 and 1. Internal costs of serviceoffers on each incoming edge are drawn from a uniform distribution over theinterval [0,0.1].
6.3.3 Results & Implications
For the assessment two different situations for a service provider’s service offerare distinguished: it either is part of the allocation or it is not for the case thatthe service is solely offered. In both cases, the service provider can decide onthe u or the b strategy which can result in either allocation or non allocation. Assuch, there are eight possible results. The probability of ending up in either ofthese states is the conditional probability of the described preconditions. Theseconditional probabilities are derived through the mean relative frequencies (overall service providers) of each event within the simulation. Table 6.7 displays thepossible states, the conditional probabilities of these states as well as the expectedpayoff in these states.
As the number of effects is manifold, the analysis of protruding observations,their interpretation, and implications are structured as follows:
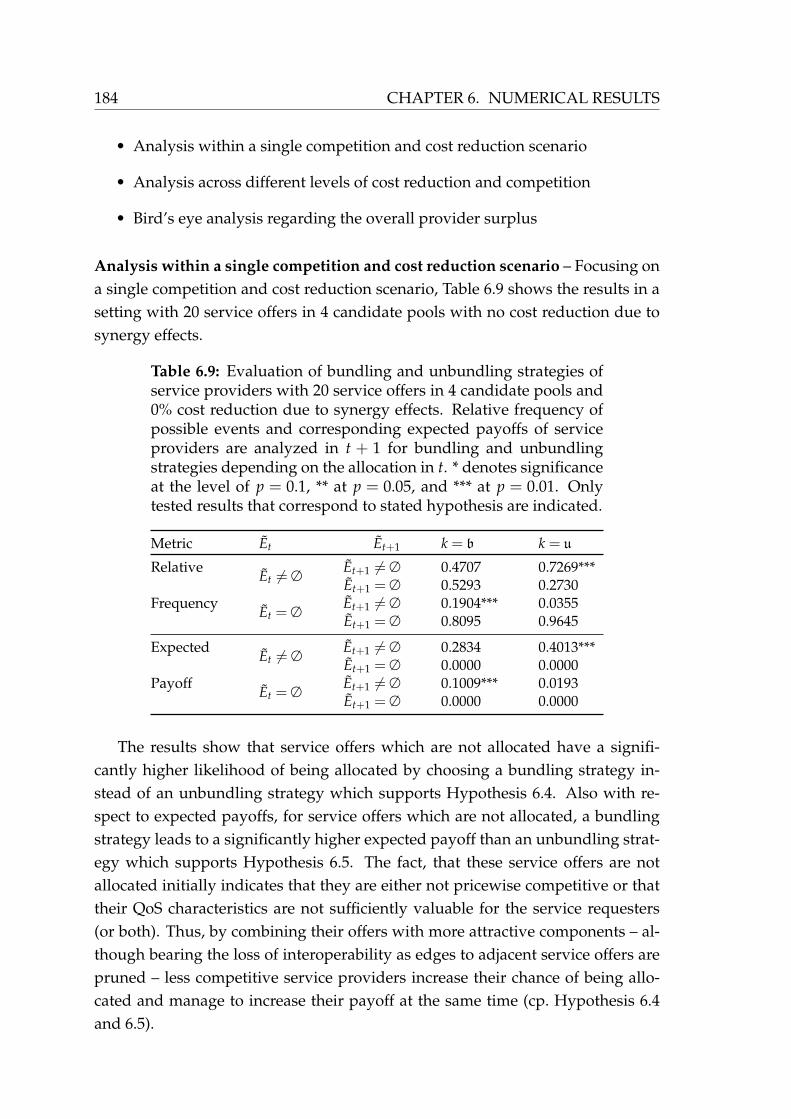
184 CHAPTER 6. NUMERICAL RESULTS
• Analysis within a single competition and cost reduction scenario
• Analysis across different levels of cost reduction and competition
• Bird’s eye analysis regarding the overall provider surplus
Analysis within a single competition and cost reduction scenario – Focusing ona single competition and cost reduction scenario, Table 6.9 shows the results in asetting with 20 service offers in 4 candidate pools with no cost reduction due tosynergy effects.
Table 6.9: Evaluation of bundling and unbundling strategies ofservice providers with 20 service offers in 4 candidate pools and0% cost reduction due to synergy effects. Relative frequency ofpossible events and corresponding expected payoffs of serviceproviders are analyzed in t + 1 for bundling and unbundlingstrategies depending on the allocation in t. * denotes significanceat the level of p = 0.1, ** at p = 0.05, and *** at p = 0.01. Onlytested results that correspond to stated hypothesis are indicated.
Metric Et Et+1 k = b k = u
RelativeEt 6= ∅
Et+1 6= ∅ 0.4707 0.7269***
FrequencyEt+1 = ∅ 0.5293 0.2730
Et = ∅Et+1 6= ∅ 0.1904*** 0.0355Et+1 = ∅ 0.8095 0.9645
ExpectedEt 6= ∅
Et+1 6= ∅ 0.2834 0.4013***
PayoffEt+1 = ∅ 0.0000 0.0000
Et = ∅Et+1 6= ∅ 0.1009*** 0.0193Et+1 = ∅ 0.0000 0.0000
The results show that service offers which are not allocated have a signifi-cantly higher likelihood of being allocated by choosing a bundling strategy in-stead of an unbundling strategy which supports Hypothesis 6.4. Also with re-spect to expected payoffs, for service offers which are not allocated, a bundlingstrategy leads to a significantly higher expected payoff than an unbundling strat-egy which supports Hypothesis 6.5. The fact, that these service offers are notallocated initially indicates that they are either not pricewise competitive or thattheir QoS characteristics are not sufficiently valuable for the service requesters(or both). Thus, by combining their offers with more attractive components – al-though bearing the loss of interoperability as edges to adjacent service offers arepruned – less competitive service providers increase their chance of being allo-cated and manage to increase their payoff at the same time (cp. Hypothesis 6.4and 6.5).

6.3. BUNDLING STRATEGIES OF SERVICE PROVIDERS 185
Service providers that are initially capable of competing successfully withinthe service value networks, i.e. their unbundled service offers are pricewise at-tractive and expose valuable characteristics for the requesters, have a higherchance of staying allocated by following an unbundling strategy instead of abundling strategy. Thus, Hypothesis 6.6 is supported. Also with respect to the ex-pected payoff, an unbundling strategy is beneficial for allocated service providersand outperforms a bundling strategy significantly which supports Hypothesis6.7.
Summarizing the results, Figure 6.9 shows the corresponding decision treefor service providers participating in the complex service auction with respect tobundling and unbundling strategies in a setting with a low level of competitionand no cost reduction due to bundling synergies.
Analysis across different levels of cost reduction and competition – On average,the results show that cost reduction due to synergy effects realized through a bundling
strategy increase the likelihood of being allocated in more competitive scenarios. Thiseffect is not observable in a setting with 20 service offers in 4 candidate pools asthe relatively low level of competition requires a tremendous cost reduction tooutperform other substitute service offers (cp. Table 6.9 and Table 6.10).
Table 6.10: Evaluation of bundling and unbundling strategies ofservice providers with 20 service offers in 4 candidate pools and50% cost reduction due to synergy effects. Relative frequencyof possible events and corresponding expected payoffs of ser-vice providers are analyzed in t+ 1 for bundling and unbundlingstrategies depending on the allocation in t. * denotes significanceat the level of p = 0.1, ** at p = 0.05, and *** at p = 0.01. Onlytested results that correspond to stated hypothesis are indicated.
Metric Et Et+1 k = b k = u
RelativeEt 6= ∅
Et+1 6= ∅ 0.5035 0.7068***
FrequencyEt+1 = ∅ 0.4965 0.2931
Et = ∅Et+1 6= ∅ 0.1851*** 0.0328Et+1 = ∅ 0.8148 0.9672
ExpectedEt 6= ∅
Et+1 6= ∅ 0.2519 0.3940***
PayoffEt+1 = ∅ 0.0000 0.0000
Et = ∅Et+1 6= ∅ 0.0698*** 0.0157Et+1 = ∅ 0.0000 0.0000
In other words, the spread between dominant and dominated serviceproviders is larger in settings with a low level of competition which makes ef-

186 CHAPTER 6. NUMERICAL RESULTS
m
s
Et 6= ∅
m
k = b
P(Et+1 6= ∅|k = b, Et 6= ∅) = 0.4707Et+1 6= ∅
E(Et+1 6= ∅|k = b, Et 6= ∅) = 0.2834
. . .Et+1 = ∅
m
k = u
P(Et+1 6= ∅|k = u, Et 6= ∅) = 0.7269***Et+1 6= ∅
E(Et+1 6= ∅|k = u, Et 6= ∅) = 0.4013***
. . .Et+1 = ∅
s
Et = ∅m
k = b
P(Et+1 6= ∅|k = b, Et = ∅) = 0.1904***Et+1 6= ∅
E(Et+1 6= ∅|k = b, Et = ∅) = 0.1009***
. . .Et+1 = ∅
m
k = u
P(Et+1 6= ∅|k = u, Et = ∅) = 0.0355Et+1 6= ∅
E(Et+1 6= ∅|k = u, Et = ∅) = 0.0193
. . .Et+1 = ∅
Figure 6.9Relative frequencies and expected payoffs of bundling and
unbundling strategies with 20 service offers in 4 candidate poolsand no cost reduction due to synergy effects. Nodes indicated
by m denote a decision triggered by the mechanism and s adecision by the service provider.
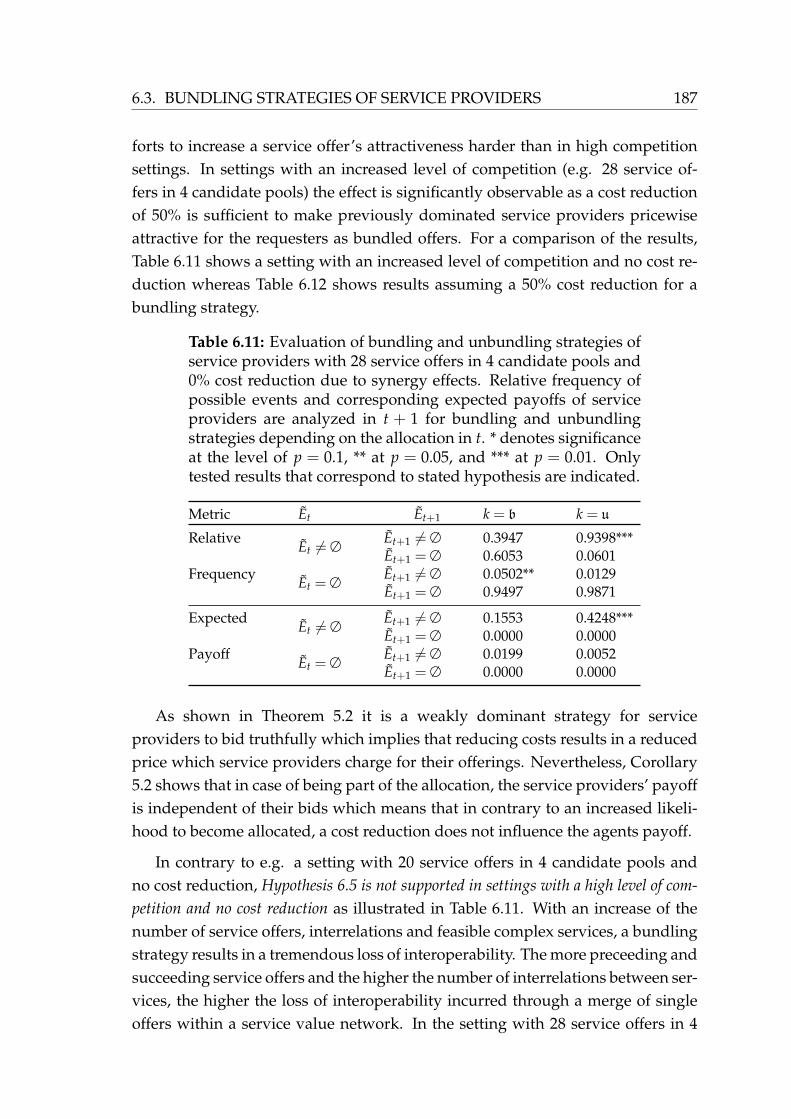
6.3. BUNDLING STRATEGIES OF SERVICE PROVIDERS 187
forts to increase a service offer’s attractiveness harder than in high competitionsettings. In settings with an increased level of competition (e.g. 28 service of-fers in 4 candidate pools) the effect is significantly observable as a cost reductionof 50% is sufficient to make previously dominated service providers pricewiseattractive for the requesters as bundled offers. For a comparison of the results,Table 6.11 shows a setting with an increased level of competition and no cost re-duction whereas Table 6.12 shows results assuming a 50% cost reduction for abundling strategy.
Table 6.11: Evaluation of bundling and unbundling strategies ofservice providers with 28 service offers in 4 candidate pools and0% cost reduction due to synergy effects. Relative frequency ofpossible events and corresponding expected payoffs of serviceproviders are analyzed in t + 1 for bundling and unbundlingstrategies depending on the allocation in t. * denotes significanceat the level of p = 0.1, ** at p = 0.05, and *** at p = 0.01. Onlytested results that correspond to stated hypothesis are indicated.
Metric Et Et+1 k = b k = u
RelativeEt 6= ∅
Et+1 6= ∅ 0.3947 0.9398***
FrequencyEt+1 = ∅ 0.6053 0.0601
Et = ∅Et+1 6= ∅ 0.0502** 0.0129Et+1 = ∅ 0.9497 0.9871
ExpectedEt 6= ∅
Et+1 6= ∅ 0.1553 0.4248***
PayoffEt+1 = ∅ 0.0000 0.0000
Et = ∅Et+1 6= ∅ 0.0199 0.0052Et+1 = ∅ 0.0000 0.0000
As shown in Theorem 5.2 it is a weakly dominant strategy for serviceproviders to bid truthfully which implies that reducing costs results in a reducedprice which service providers charge for their offerings. Nevertheless, Corollary5.2 shows that in case of being part of the allocation, the service providers’ payoffis independent of their bids which means that in contrary to an increased likeli-hood to become allocated, a cost reduction does not influence the agents payoff.
In contrary to e.g. a setting with 20 service offers in 4 candidate pools andno cost reduction, Hypothesis 6.5 is not supported in settings with a high level of com-
petition and no cost reduction as illustrated in Table 6.11. With an increase of thenumber of service offers, interrelations and feasible complex services, a bundlingstrategy results in a tremendous loss of interoperability. The more preceeding andsucceeding service offers and the higher the number of interrelations between ser-vices, the higher the loss of interoperability incurred through a merge of singleoffers within a service value network. In the setting with 28 service offers in 4
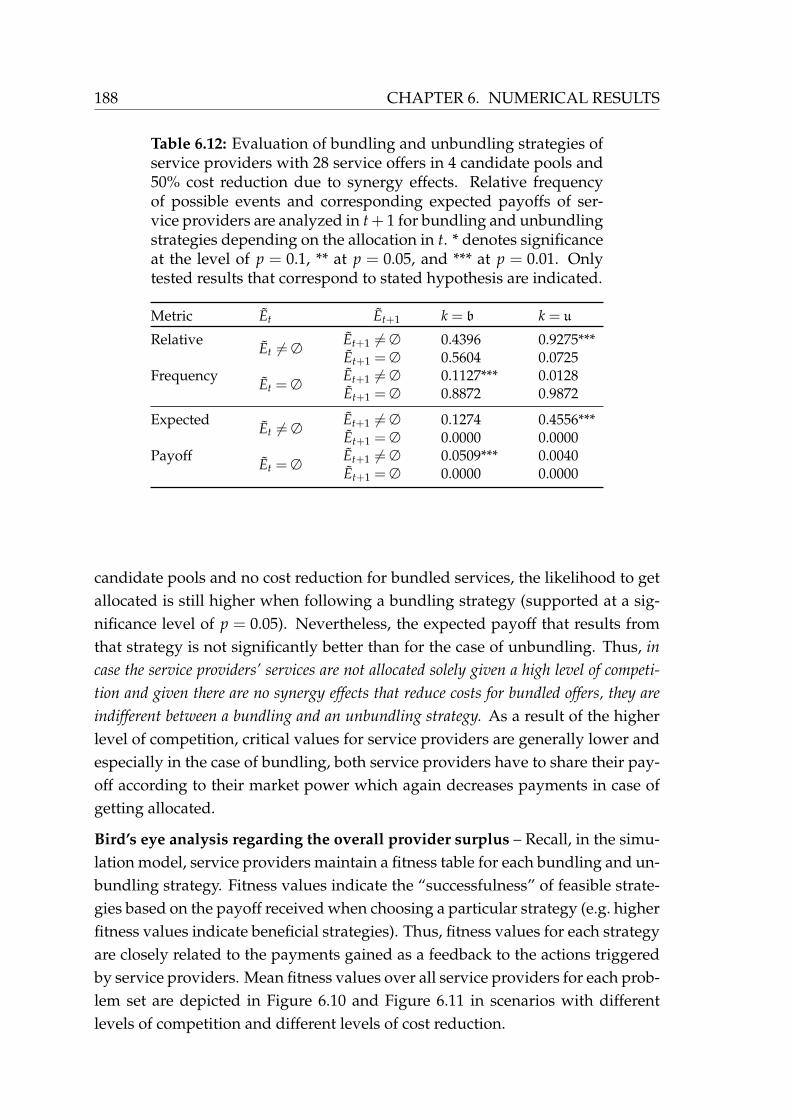
188 CHAPTER 6. NUMERICAL RESULTS
Table 6.12: Evaluation of bundling and unbundling strategies ofservice providers with 28 service offers in 4 candidate pools and50% cost reduction due to synergy effects. Relative frequencyof possible events and corresponding expected payoffs of ser-vice providers are analyzed in t+ 1 for bundling and unbundlingstrategies depending on the allocation in t. * denotes significanceat the level of p = 0.1, ** at p = 0.05, and *** at p = 0.01. Onlytested results that correspond to stated hypothesis are indicated.
Metric Et Et+1 k = b k = u
RelativeEt 6= ∅
Et+1 6= ∅ 0.4396 0.9275***
FrequencyEt+1 = ∅ 0.5604 0.0725
Et = ∅Et+1 6= ∅ 0.1127*** 0.0128Et+1 = ∅ 0.8872 0.9872
ExpectedEt 6= ∅
Et+1 6= ∅ 0.1274 0.4556***
PayoffEt+1 = ∅ 0.0000 0.0000
Et = ∅Et+1 6= ∅ 0.0509*** 0.0040Et+1 = ∅ 0.0000 0.0000
candidate pools and no cost reduction for bundled services, the likelihood to getallocated is still higher when following a bundling strategy (supported at a sig-nificance level of p = 0.05). Nevertheless, the expected payoff that results fromthat strategy is not significantly better than for the case of unbundling. Thus, in
case the service providers’ services are not allocated solely given a high level of competi-
tion and given there are no synergy effects that reduce costs for bundled offers, they are
indifferent between a bundling and an unbundling strategy. As a result of the higherlevel of competition, critical values for service providers are generally lower andespecially in the case of bundling, both service providers have to share their pay-off according to their market power which again decreases payments in case ofgetting allocated.
Bird’s eye analysis regarding the overall provider surplus – Recall, in the simu-lation model, service providers maintain a fitness table for each bundling and un-bundling strategy. Fitness values indicate the “successfulness” of feasible strate-gies based on the payoff received when choosing a particular strategy (e.g. higherfitness values indicate beneficial strategies). Thus, fitness values for each strategyare closely related to the payments gained as a feedback to the actions triggeredby service providers. Mean fitness values over all service providers for each prob-lem set are depicted in Figure 6.10 and Figure 6.11 in scenarios with differentlevels of competition and different levels of cost reduction.

6.3. BUNDLING STRATEGIES OF SERVICE PROVIDERS 189
0 5 10 15 20 25 30
0.0
0.2
0.4
0.6
0.8
1.0
Topology
Fitness
unbundlingbundling
unbundling bundling
0.0
0.2
0.4
0.6
0.8
1.0
Strategy
Fitness
(a) No cost reduction due to bundling synergies with 20 service offers in 4candidate pools.
0 5 10 15 20 25 30
0.0
0.2
0.4
0.6
0.8
1.0
Topology
Fitness
unbundlingbundling
unbundling bundling
0.0
0.2
0.4
0.6
0.8
1.0
Strategy
Fitness
(b) 50% cost reduction due to bundling synergies with 20 service offers in 4candidate pools.
Figure 6.10Strategy fitness in different cost reduction scenarios with 20
service offers in 4 candidate pools.

190 CHAPTER 6. NUMERICAL RESULTS
0 5 10 15 20 25 30
0.0
0.2
0.4
0.6
0.8
1.0
Topology
Fitness
unbundlingbundling
unbundling bundling
0.0
0.2
0.4
0.6
0.8
1.0
Strategy
Fitness
(a) 0% cost reduction due to bundling synergies with 28 service offers in 4candidate pools.
0 5 10 15 20 25 30
0.0
0.2
0.4
0.6
0.8
1.0
Topology
Fitness
unbundlingbundling
unbundling bundling
0.0
0.2
0.4
0.6
0.8
1.0
Strategy
Fitness
(b) 50% cost reduction due to bundling synergies with 28 service offers in 4candidate pools.
Figure 6.11Strategy fitness in different cost reduction scenarios with 28
service offers in 4 candidate pools.

6.3. BUNDLING STRATEGIES OF SERVICE PROVIDERS 191
In general, bundling strategies seem to outperform unbundling strategies re-garding their fitness values. Nevertheless, this is only true for the collectivityof service providers. It is important to notice that there are less allocated ser-vice offers than non-allocated services and service providers that own serviceswithin each group valuate each strategy differently. As already shown, followingan unbundling strategy is in general not beneficial for providers that offer lesscompetitive services which is true for the majority of participants. Hence, fitnessvalues for an unbundling strategy for service providers that offer less competi-tive services are close to zero which in turn strongly decreases the mean fitnessfor that strategy.
A fundamental effect is observable when comparing scenarios with no costreduction due to missing synergies as illustrated in Figure 6.10a and with largesynergy effects as depicted in Figure 6.10b. The higher the synergy effects real-ized through bundled offers, the lower the mean fitness value for that strategy.Recall, fitness value are closely related to the payments gained by following a par-ticular strategy. Thus, a decrease in the mean fitness value for the bundling strat-egy reflects the fact that service providers receive lower payments when realizingsynergy effects. Synergy effects reduce costs for service provision. A reduction ofcosts is directly reflected in the bid prices as shown in Theorem 5.2. Consequently,by simultaneously realizing synergy effects and reducing costs, service providersrun into a stronger price competition which is constantly decreasing their pay-offs. Looking at service providers as a collectivity, realizing synergy effects byoffering bundled solutions decreases the overall provider surplus.
6.3.4 Strategic Recommendations
Based on the results described in Section 6.3.3, the following coarse-grainedstrategic recommendations regarding single service offers and bundled forms arederived.
For less competitive service offers, a bundling strategy leads to a significantly higher
expected payoff than an unbundling strategy and increases the likelihood of being allo-
cated if synergy effects can be realized. Less competitive means that these serviceoffers are either not pricewise competitive or that their QoS characteristics arenot sufficiently valuable for the service requesters (or both). Thus, by combin-ing their offers with more attractive components – although bearing the loss ofinteroperability as edges to adjacent service offers are pruned – less competitive

192 CHAPTER 6. NUMERICAL RESULTS
service providers increase their chance of being allocated and manage to increasetheir payoff at the same time.
Service providers that are initially capable of competing successfully within the ser-
vice value network have a higher chance of staying allocated and also face a higher ex-
pected payoff by following an unbundling strategy instead of a bundling strategy even
though synergy effects lie idle. In this case, a loss of interoperability through themerge with another service offer even if compensated by a reduction of costs isnot advantageous as it increases the risk of being less favorable from a requesterperspective.

Part IV
Finale

Chapter 7
Conclusion & Outlook
This explosion of large-scale e-commerce poses new computational challenges that stem
from the need to understand incentives. Because individuals and organizations that own
and operate networked computers and systems are autonomous, they will generally act
to maximize their own self-interest – a notion that is absent from traditional algorithm
design.
[FPP09]
C oncluding the work at hand, this chapter points out the key contributionsin Section 7.1 followed by an elaboration of open questions and future re-
search directions that are closely related to this work in Section 7.2. Section 7.3briefly outlines research streams and future challenges that complement the top-ics addressed in the work at hand.
7.1 Contribution
The key objective of this work is to design a mechanism that enables the coor-dination of value generation in service value networks which requires that it ison the one hand theoretically sound and on the other hand applicable in the con-text of electronic services and their composition. It is a well-known result fromalgorithmic or computational mechanism design [NR01, DJP03] and market engi-neering [WHN03, Neu04] that these theoretical and practical goals are oftentimesconflicting which requires reasonable solutions regarding these trade-offs to sat-isfy the requirements upon a suitable mechanism in a certain domain. Address-ing these challenges and satisfying detailed requirements derived from a thor-

196 CHAPTER 7. CONCLUSION & OUTLOOK
ough environmental analysis, the work at hand extends the body of research onmechanisms for trading combinatorial entities in distributed environments withspecial focus on sequential compositions of service components in service valuenetworks. The fact that service compositions only generate value for requestersthat expose a feasible order of their service components imposes novel challengeson an adequate coordination mechanism.
A thorough mechanism design requires an in-depth understanding of the eco-nomic and technical environment, i.e. the trading objects, the market participants,and the characteristics of the surrounding environment. Hence, the intention ofthe following research question is to lay the groundwork for the design, imple-mentation and evaluation of an adequate mechanism that enables the trade ofcomposite services in service value networks.
Research Question 1 ≺ENVIRONMENTAL ANALYSIS≻. What are
the characteristics of service value networks and complex services, and
what are resulting economic and applicability requirements upon a mech-
anism to coordinate value creation?
Addressing this question, characteristics and definition of tangibles, intangi-bles and services are developed and discussed in Section 2.1.1. This discussionis followed by an analysis of different types of services categorized by a servicedecomposition model in Section 2.1.2. Especially complex services constituting thefinal outcome of the value creation process in service value networks throughthe realization of a sequence of modularized service offers is in the focus of thisanalysis. The concept of traditional services, e-services, software services, Web services
and related technical concepts such as service-oriented architectures are analyzedand their key characteristics are outlined in Section 2.1.3. Based on these results, aclear understanding of service value networks is provided in Section 2.1.4 by defin-ing their characteristics, their structure, and their components, and by filling thelack of definitions in current related literature. The discussion about service valuenetworks which embody the trading environment subject to the work at handis followed by an analysis of economic and applicability requirements upon anadequate mechanism for coordinating value creation in service value networksin Section 2.2.4.1. Based on these requirements, current approaches which areclosely related to this work are analyzed and existing research gaps are identifiedin Section 2.2.4.2. In summary, the environmental analysis and resulting require-ment analysis serves as a starting point for further research.

7.1. CONTRIBUTION 197
Research Question 2 focuses on the core contribution: The development of anadequate multidimensional and scalable auction mechanism to coordinate valuecreation in service value networks.
Research Question 2 ≺MECHANISM DESIGN≻. How can a scalable,
multidimensional auction mechanism for allocating and pricing of com-
plex services in service value networks be designed that limits strategic
behavior of service providers?
The question is addressed by the development of an abstract model of service
value networks that captures the key characteristics and components in a compre-hensive manner in Section 3.1. As part of the mechanism, a bidding language isprovided that enables the specification of multidimensional service offers andservice requests in Section 3.2. To allow for the expression of the service re-quester’s preferences for different QoS characteristics and prices of complex ser-vices, the specification of a scoring function is developed. Finally, the core mecha-nism – the Complex Service Auction (CSA) – consisting of an allocation and trans-fer function which implements valuable properties that are analyzed in detail inthe evaluation part, is introduced in Section 3.3. A process model and an ade-quate architecture of the CSA from a technical perspective are presented in Sec-tion 3.5. Focusing on a computational tractable implementation of the auctionmechanism, an algorithm is presented in Section 3.6 that solves the winner deter-mination problem in polynomial time regarding the number of service offers andfeasible service compositions.
Focusing on the applicability of the proposed auction model in real-worldscenarios such as a Web-based intermediation service, Research Question 3 statesadditional requirements and addresses the challenge of developing necessary ex-tensions to the core mechanism in order to be applicable in practical settings.
Research Question 3≺APPLICABILITY EXTENSIONS≻. How can an
auction mechanism be extended to support complex QoS characteristics
and service level enforcement? How can the pricing scheme be modified in
order to achieve budget balance and incentivize interoperability endeavors
of service providers?
198 CHAPTER 7. CONCLUSION & OUTLOOK
In order to provide trust and assurance of service quality, service level en-forcement is an inevitable applicability aspect. In Section 4.1, the mechanismis enriched by a compensation function which incorporates ex-post informationabout each service’s performance in order to impose penalties if necessary. Thecompensation function provides valuable economic properties which are ana-lyzed in detail in the evaluation part. Addressing the challenge of supportingcomplex QoS characteristics, a common conceptualization of quality attributesand their description, aggregation and enforcement from an economic and tech-nical perspective is provided. The auction mechanism is extended in order tosupport complex QoS characteristics by means of rule-based semantic concepts anda toolbox of adequate aggregation operations in Section 4.3.
Another central requirement upon a mechanism from an economic perspec-tive is budget balance which is an important property for a mechanism in orderto be sustainable in the long-run as a continuous external subsidization is neitherreasonable nor profitable for e.g. a platform provider and its business model. Itis well-known from impossibility results in mechanism design that the achieve-ment of certain combinations of economic desiderata is not possible. Addressingthe second part of Research Question 3, an extended transfer function – the In-
teroperability Transfer Function (ITF) – is developed in Section 6.2 which restores
budget balance by sacrificing incentive compatibility to a certain extent and at thesame time incentivizes service providers to increase their services’ degree of interoper-
ability, i.e. to increase the capability of their offered services to communicate andfunction with other services within the service value network which is shownaddressing Question 4.
Research Question 4 ≺EVALUATION≻. How can an auction mech-
anism be analytically and numerically evaluated regarding its economic
properties as well as cooperation and bundling strategies of service
providers?
Focusing on central economic properties of a mechanism and the imple-mented social choice function, Research Question 4 is firstly addressed in Chapter5 by an analytical evaluation which shows that the complex service auction im-plements a social choice function that is incentive compatible and individual rational
for service providers (Section 5.1). The mechanism is strategyproof with respectto all dimensions of service providers’ bids, i.e. the truthful announcement of pri-vate information on QoS attributes and valuations of offered services is an equi-

7.1. CONTRIBUTION 199
librium in dominant strategies. Consequently, if the service requester announcesits accurate preferences for different outcomes, the social choice is allocative effi-
cient as it is shown in Section A.3. Based on a model of cooperation provided inSection 5.2, it is further shown that there exist mutually beneficial ex-ante agree-ments between service providers that face the opportunity to customize their ser-vice offers in order to reduce internal costs.
Following a numerical research method in Chapter 6, the extended budget-balanced transfer function ITF is firstly evaluated with respect to its robustnessagainst misreporting of service providers by means of simulation-based analysisin Section 6.1. The question is more precisely: To what degree is it beneficial forservice providers to deviate from their true valuation? Results show that evenin settings with a low level of competition strategic behavior of service providers
is tremendously limited as a deviation from a truth-telling strategy is not signifi-cantly beneficial. Despite of the incentives that limit service providers’ strategicbehavior, the ITF rewards service providers to increase their services’ degree ofinteroperability. This property is elaborated in detail in Section 6.2 by means ofan agent-based simulation. Compared to an equal transfer function which dis-tributes available surplus equally among allocated service providers, it is shownthat the ITF extension implements incentives to foster a higher overall degree of in-
teroperability in settings with a low level of competition and up to a certain levelof proportionate investment costs for customization.
Focusing on cooperation models in the form of offering bundled services, thequestion arises whether it is beneficial to offer bundled services which decreasesflexibility but leverages synergy effects or if it is beneficial to offer single highlyspecialized services that are more flexibly composable into various complex ser-vice instances. By means of an agent-based simulation with reinforcement learn-ing, this question is addressed in Section 6.3. More precisely there are two mainstrategies analyzed: Competing in quality through differentiation and flexibil-ity and competing in price through bundling synergies as cost reduction. Re-sults show that in general service providers that own services within the servicevalue network which are highly competitive, i.e. they are likely to be allocated,act best by following an unbundling strategy. In contrary, for service providerswith less competitive service offers it is beneficial to form bundled service offerswhile leveraging synergy effects.

200 CHAPTER 7. CONCLUSION & OUTLOOK
7.2 Open Questions
Based on the above mentioned results, there is a number of possible futureresearch directions and open questions which are briefly addressed in theremainder of this section.
Allocation computation in the context of sophisticated control logic
The allocation function of the complex service auction computes the “shortest”path in graphs and is therefore only capable of allocating rudimentary flow logicin the form of sequential compositions whereas e.g. AND-states have to be splitup in separate statecharts and different auction processes. Such an approach issufficient for the allocation of more granular service components that are itera-tively composed into a complex service.
However, more sophisticated flow logic increases the complexity of findingfeasible allocations that embody a flawless instantiation of a complex servicefrom a technical perspective. This leads directly to the questions of how more com-
plex control logic (e.g. AND-states, loops, branches, conditional flows) can be covered by
an allocation function? However, a more complex allocation problem that resultsfrom a more powerful control logic of complex services directly leads to anincrease of computational complexity with respect to solving the winner deter-mination problem while assuring feasible solutions from a technical perspective.This hinders the satisfaction of Requirement 5 which stresses the importance ofcomputational tractable algorithms to solve the winner determination problem inpolynomial time for the application in online systems. Addressing this challenge,heuristics might be a reasonable approach to solve the allocation problem inthe context of complex services that expose highly sophisticated control logic.Nevertheless, in the absence of an optimal solution, the central Requirement 1 ofallocative efficiency is not fully satisfied depending on the degree of optimalityof the heuristic allocation algorithm. In case the mechanism is designed tofoster an incentive compatible social choice, a suboptimal solution of the winnerdetermination problem becomes critical from an economic perspective. Theheuristic has to satisfy certain properties such as monotonicity – i.e. an allocatedparticipant in the complex service auction cannot drop out of the allocation bydecreasing its bid price – in order to retain truthfulness [MN08a, NS06].
Allocation and pricing of people services

7.2. OPEN QUESTIONS 201
Hybrid complex services that involve electronic and human activities imposenew challenges from an economic and organizational perspective. So far,micro-task markets such as Amazon’s Mechanical Turk1 provide a platform toleverage the power of human intelligence – the so called crowdsourcing – forhighly specialized tasks such as image recognition. A pool of human individualsencapsulated by well-defined interfaces can be integrated in hybrid processes.A seamless integration of human work force in automated compositions ofmultiple services opens up further research questions to be addressed in thefuture. How can people services sufficiently be described and integrated into service
value networks and the coordination of value creation? The challenges that arisefrom the service characteristic C 2.5 describing the fuzzyness of input andoutput parameters and capabilities are partly addressed by the high degree ofstandardization and specified description languages (e.g. WSDL, WS-BPEL)which are common sense. Nevertheless, in the context of people services, thesechallenges arise anew as human work force is hardly parameterizable and thescope, capabilities and quality of the output vary widely. Thus, incorporatinghuman activities in automated processes requires well-specified task descrip-tions [KCS08]. As inputs and outputs have to be carefully described the issue ofquality assurance becomes even more crucial. The question arises of how these
activities can be monitored in order to compute compensation transfers and apply service
level enforcement mechanisms.
Allocation and pricing of highly complex application services
As introduced in Section 2.1.4.3, a trend towards simplification is observablethat enables an agile composition of highly specialized services that exposepuristic interfaces and descriptions e.g. as in RESTful architectures based on theCRUD paradigm2. Nevertheless as outlined in Section 2.1.2.3, complex servicesconsist of service components that can themselves be a utility, elementary orcomplex service (analogue to the recursive specification in WS-BPEL). As thegranularity of service components decreases, the complexity of their interfacesand necessary descriptions grows which implies new challenges for the mech-anism. As a result of the increased interface complexity and the semantic ofinput and output values, the computational complexity of the algorithm thatsolves the respective winner determination problem augments as well. Thisconflicts with the requirement of computation tractability which is inevitable fora mechanism in order to be realized in online systems. Furthermore, investment
1http://mturk.com/2CRUD stands for the persistent functions create, read, update, and delete.

202 CHAPTER 7. CONCLUSION & OUTLOOK
costs for the customization of service offers’ interfaces fostering a higher degreeof interoperability rise which results in more static and less multifaceted servicevalue networks. More complex service descriptions and interfaces also impactthe elicitation and expression of preferences for different QoS levels. Servicerequesters have to specify their preferences for different outcomes regarding thecomplex service’s attributes which leads to the question of how service consumers
can be supported by tools and concepts to enable the elicitation and expression of
preferences for complex multidimensional QoS characteristics.
Multi-layered markets for utility and complex services
Service components that are traded in e.g. the complex service auction requirelow level resource services (utility services) to enable their deployment and as-sure scalability during run-time. Focusing on the infrastructure layer, it is alsoreasonable to trade utility services themselves independent from mechanisms toallocate and price complex services. Nevertheless, utility services expose dif-ferent characteristics and therefore impose different requirements upon suitablemarket mechanisms [Neu04]. There are several market mechanisms for the tradeof utility services proposed in literature [Sto09, Sch07]. Combining the trade ofutility and complex services as depicted in Figure 7.1, the question arises of how
a multi-layered market can be designed in order to enable a seamless allocation and pric-
ing of complex services and corresponding utility service which are required by the layer
above.
7.3 Complementary Research
Besides research directions closely related to the work at hand as illustrated inSection 7.2, this section points out research questions which are partly comple-mentary to this work and therefore possibly enrich certain aspects.
Alternative design goals and business models for platform providers
The design of the complex service auction mechanisms implements a socialchoice that is allocative efficient, i.e. it maximizes welfare. Although this is acommonly desired design goal that has valuable implications for all participants,there are alternative design desiderata that are favorable for certain stake holders.From the perspective of a platform provider that offers an intermediation serviceto e.g. a service value network, a revenue maximizing social choice is certainly

7.3. COMPLEMENTARY RESEARCH 203
Complex Service Auction
AbstractComposition
binding binding binding
Service Service Service
Resource Market
Resource Resource Resource Resource
allocation allocation allocation allocation
Figure 7.1Multi-layered market for complex services and resources.
beneficial compared to an optimal solution from a utilitarian point of view ife.g. the intermediary receives a fraction of the each service provider’s revenue.Research that deals with auction formats which are designed to maximize therevenue for e.g. the seller of an economic entity is well-known in literature asoptimal auction design [Mye81]. Focusing on procurement scenarios where priceand quality matters, optimal buying mechanisms that intent to maximize thebuyer’s expected payoff are evaluated in [CIoWM93, AC05]. Looking at optimalauction designs and revenue models for platform providers, the question of how
to design a successful business model for providers of intermediation services arises.The structure of “traditional” business model types might not be sufficient inorder to address the requirements that result from highly agile and distributedenvironments such as service value networks [MWL+06]. Recall that a mecha-nism in order to be sustainable in the long-run must satisfy the economic designdesideratum of budget balance (cp. Desideratum 2.4) in order to avoid the needfor external subsidization as well as the desideratum of individual rationality(cp. Desideratum 2.3) to provide incentives to participate in the market. In
204 CHAPTER 7. CONCLUSION & OUTLOOK
this regard, revenue models for platform providers that stipulate for chargingparticipation fees may violate individual rationality and (strong) budget balance.However, in certain cases it might be reasonable for a e.g. a public institutionto subsidize an efficient market. Nevertheless, such implications of the revenuemodel on economic properties of a mechanism implementation must be carefullyanalyzed and considered when constructing and structuring novel businessmodels.
Preference elicitation
It is a typical assumption in game theory and especially mechanism designresearch that market participants know their true valuations. However, elicita-tion of preferences especially in multidimensional settings (e.g. preferences fordifferent QoS levels of multiple service attributes and their semantics) embodiesa complex task for service providers and requesters. In combinatorial settings(cp. the complex service auction), participants must be capable of expressingpreferences for different combinations of e.g. service components. This is acrucial task as it implicitly requires the comparison of a large set of alternativecombinations. Although preference elicitation embodies a prerequisite of anymarket-based approach, research in this area is still in its infancy [SNP+05]. Forinstance, prominent approaches for the elicitation of preferences – e.g. in thecontext of services – are conjoint analysis [GR71, LT64] and analytical hierarchicalprocessing [Saa80, Saa08]. A major shortcoming of these approaches is that theybecome infeasible in settings with large sets of attributes which are common ine.g. service markets.
Automated bidding
Having suitably determined the true valuations for the trading object, a biddingstrategy must be developed in order to successfully participate in the market.With preference elicitation as a prerequisite, developing such a bidding strategyand efficiently communicating it to the market is another complex task to besolved by participants. In order to support users in evaluating and expressinga beneficial bidding strategy, tools for automated bidding are a promising ap-proach to overcome complexity and effort [MMW06, Tes01]. Another advantageof facilitating tools to interact with markets is that there is no need to constantlymonitor market activities and incorporate information in the bidding strategy asthis information can be processed and interpreted by automatic bidding agents.Although these tools can simplify market interaction, participants want to keep
7.4. FINAL REMARKS 205
control over their strategy and resulting actions. Hence, hybrid models aremore practical as they still hide complexity and simplify the trading process butalso allow for a manual interaction triggered by the user which might also benecessary for legal reasons. Another success factor of automatic trading agentsis the parameter selection and their customization for the application in differentmarket mechanisms that impose different requirements upon beneficial strate-gies. Addressing these challenges, strategies for bidding agents are developedthat successfully perform in multiple settings and market mechanisms [Bor09].
Reputation mechanisms
Another class of mechanisms that enable coordination of distributed activities ina broader sense are reputation mechanisms. Using feedback information, reputa-tion mechanisms aim at building trust in environments with self-interested par-ticipants [BKO02]. Reputation mechanisms aggregate trading histories of e.g. ser-vice providers and requesters and compute a metric which indicates the trust-worthiness of market participants. This information can be incorporated in theallocation and pricing procedure providing additional characteristics of the trad-ing parties. For example, the lower the reputation of a service provider, the lesslikely is the allocation of services offered by this service provider. Although itis well-known in literature that reputation mechanisms have proven to performwell in distributed systems in the absence of a central instance such as in peer-to-peer networks [WV03], it is an interesting question of how such reputationcomponents can be designed and realized additionally to a central market mech-anism. Challenges that arise in this context are e.g. how to make truthful reve-lation of reputation information an optimal strategy market participants [JF03].For a detailed survey on state-of-the-art trust and reputation systems for serviceprovision via electronic networks, the interested reader is referred to [JIB07].
7.4 Final Remarks
Services become a central component of value creation in today’s society. Noveltechnical, economic, and organizational challenges arise from their unique natureas services’ provision and consumption coincide in time [Hil77]. Recognizingand understanding the importance of an efficient design, production, and pro-vision of services under the presence of their special characteristics is inevitablefor individuals and the society to compete in today’s global economy. Especiallyrapid service innovation driven by the power of modularity that is inherent in the

206 CHAPTER 7. CONCLUSION & OUTLOOK
concept of services [BC00] embodies the success factor in service-centric environ-ments. However, when composing distributed service activities, the question ofan efficient form of coordination comes to light and turns out to be fundamentalto govern distributed value creation. As complex services are living artifacts thatgenerally exist under the ownership of different economic entities which are self-interested in nature, system-wide goals are hard to achieve as they mostly collidewith individual objectives and are therefore not intrinsically pursued [Par01].
The approach of mechanism design [Hur73, Mye88] – and the revelation prin-ciple [Gib73, Mye82] as the central possibility result – considers economic prob-lems in situations where individuals’ private information and actions are hardto monitor. The main objective is to design mechanisms that provide incentivesfor individuals to “share information and exert efforts” [Mye88] which imple-ments a social choice that constitutes a system-wide solution. Hence, althoughindividuals (e.g. service owners) seek to maximize their utility based on their pri-vate information about their preferences for different outcomes, they inevitablycontribute to the achievement of a global goal.
Following the approach of mechanism design, this work provided an auc-tion mechanism which enables the trade of composite services in service valuenetworks. The mechanism constitutes an equilibrium in which truth-revelationof private multidimensional types is a weakly dominant strategy for all serviceproviders and implements a social choice that maximizes the utility across allparticipants. The mechanism exposes valuable properties as it is not beneficialfor individuals to lie about their private information, neither on their services’QoS characteristics nor on corresponding private valuations. Furthermore, par-ticipation is voluntary and beneficial for service providers and the mechanismresults in an allocation which is optimal and constitutes a system-wide welfaremaximizing solution.
The work at hand shows that mechanism design in combination with techni-cal, computational, and applicability considerations is a promising approach toefficiently govern distributed service activities in agile and fast changing environ-ments such as service value networks. However, open questions and complemen-tary research directions constitute further challenges that need to be mastered inan integrated manner in order to leverage the power of algorithmic mechanismdesign and to move the results at hand from theory to practice, to innovation.
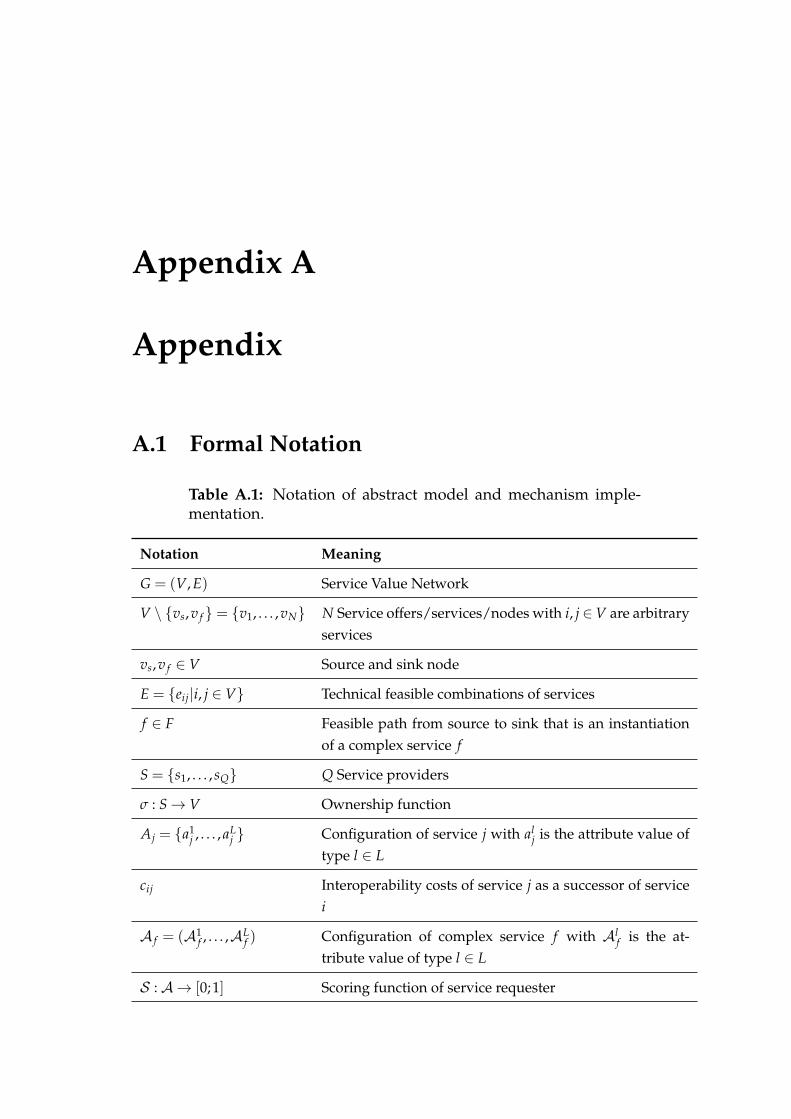
Appendix A
Appendix
A.1 Formal Notation
Table A.1: Notation of abstract model and mechanism imple-mentation.
Notation Meaning
G = (V, E) Service Value Network
V \ vs,v f = v1, . . . ,vN N Service offers/services/nodes with i, j ∈V are arbitrary
services
vs,v f ∈ V Source and sink node
E = eij|i, j ∈ V Technical feasible combinations of services
f ∈ F Feasible path from source to sink that is an instantiation
of a complex service f
S = s1, . . . , sQ Q Service providers
σ : S→ V Ownership function
Aj = a1j , . . . , aL
j Configuration of service j with alj is the attribute value of
type l ∈ L
cij Interoperability costs of service j as a successor of service
i
A f = (A1f , . . . ,AL
f ) Configuration of complex service f with Alf is the at-
tribute value of type l ∈ L
S :A→ [0;1] Scoring function of service requester

208 APPENDIX A. APPENDIX
Table A.1: Notation of abstract model and mechanism imple-mentation.
Notation Meaning
Λ = (λ1, . . . ,λL) Preference structure of service requester with λl is the
weight for attribute type l ∈ L
Γ = (γ1B,γ1
T, . . . ,γLB,γL
T) Preference boundaries of service requester with γlB is the
lower and γlT is the upper boundary for attribute type l ∈
L
α Willingness to pay of service requester for a complex ser-
vice f with S(A f ) = 1
A.2 Incentive Compatibility
Proof A.1 [THEOREM 5.2]. 1 Let F−s denotes the set of all feasible paths from source
to sink in the reduced graph G−s without every service offer owned by service provider s
and corresponding incoming and outgoing edges. Let further f ∗ denote the path which is
allocated by o. Let U ∗ be the utility of path f ∗. Let U ∗−s be the utility of path f ∗−s in the
reduced graph G−s. Let U ∗s denote the overall utility of the allocated path f ∗ computed
based on the verified attribute values a1j , . . . , aL
j of the verified configurations Aj of all
service offers j ∈ σ(s). Let Es denote the set of edges with Es = eij|eij ∈ o, j ∈ σ(s), i ∈τ(j). Service provider s wants to maximize its expected payoff:
E(πs) = P(U ∗ > U ∗−s)
[
∑Es
pij + (U ∗ − U ∗−s)− ∆tcomp,s −∑Es
cij
]
E(πs) = P(U ∗ > U ∗−s)
[
∑Es
pij +(
(U ∗ − U ∗−s)− (U ∗ − U ∗s))
−∑Es
cij
]
E(πs) = P(U ∗ > U ∗−s)
[
∑Es
pij +(
U ∗s − U ∗−s
)
−∑Es
cij
]
This leads to two possible cases:
1. If s’s payoff πs is positive, it wants to maximize the probability of being allocated
which leads to the problem statement
maxpij,Aj|j∈σ(s),i∈τ(j)
P(U ∗ > U ∗−s)
1This proof is based on the argumentation in [MMV94]
A.3. ALLOCATIVE EFFICIENCY 209
st.
[
∑Es
pij +(
U ∗s − U ∗−s
)
−∑Es
cij
]
> 0
From the side condition it follows directly that ∑Es pij + U∗s − ∑Es cij > U
∗−s.
Hence, P(·) is maximized by setting pij = cij and Aj = Aj, ∀j ∈ σ(s), i ∈ τ(j)
as this leads to U ∗ = U ∗s and finally to P(·) = 1.
2. If s’s payoff πs is negative, it wants to minimize the probability of being allocated
which leads to the problem statement
minpij,Aj|j∈σ(s),i∈τ(j)
P(U ∗ > U ∗−s)
st.
[
∑Es
pij +(
U ∗s − U ∗−s
)
−∑Es
cij
]
< 0
Symmetrically to the first case, it follows directly from the side condition that
∑Es pij + U∗s −∑Es cij < U
∗−s. Hence, P(·) is minimized by setting pij = cij and
Aj = Aj, ∀j ∈ σ(s), i ∈ τ(j) as this leads to U ∗ = U ∗s and finally to P(·) = 0.
In any case one solution that maximizes the expected payoff E(πs) of service provider
s is pij = cij and Aj = Aj, ∀j ∈ σ(s), i ∈ τ(j). This solution is the truth-telling strat-
egy as s reveals its true multidimensional type. Although truth-telling is not the only
solution, service provider s does not benefit from deviation as its strategy does not influ-
ence its payoff as shown in Corollary 5.2 which makes truth-telling with respect to the
multidimensional types of service providers (configuration and price) a weakly dominant
strategy.
A.3 Allocative Efficiency
This section briefly shows that under the assumption of the absence of strategicbehavior of the service requester, the complex service auction always leads to awelfare maximizing outcome:
Corollary A.1 [WELFARE MAXIMIZATION]. The allocation function according to
(3.8) argmax f∈F
(
αS(A f )−P f
)
is efficient as it maximizes the system’s welfare with
α representing the requester’s maximal willingness to pay, S(A f ) its score for the con-
figuration of the complex service f and P f the sum of all price bids of service providers
that own service offers that have incoming edges on the path f .

210 APPENDIX A. APPENDIX
Proof A.1 [COROLLARY A.1]. Let UR = αS(A f )− T f denote the service requester’s
utility with α represents the requester’s maximal willingness to pay, S(A f ) the re-
quester’s score for the configuration of the complex service f and T f the sum of all transfer
payments to allocated providers according to (4.2). Furthermore let U s = ts − cs be the
utility of service provider s ∈ S. The system’s welfare W f based on an allocated path f is
the sum of consumer (requester) and providers’ surplus such that
W f = UR + ∑s∈S
U s
W f = αS(A f )− T f + ∑s∈S
(ts − cs)
W f = αS(A f )− T f + T f −∑s∈S
cs
W f = αS(A f )−∑s∈S
cs
Based on the results of Theorem 5.2 truth-telling with respect to configuration and price
is a weakly dominant strategy for all service providers so it can be directly concluded that
W f ∗ = αS(A f ∗)−P f ∗
A.4 Manipulation Robustness
Table A.2: Utility for a single manipulating service provider with12 service offers in 4 candidate pools. abs denotes the mean ab-solute utility and rel the ratio of means of the utility with manip-ulation and the utility following a truth-telling strategy. sd is thestandard deviation of the mean absolute utility. * denotes signif-icance at the level of p = 0.1, ** at p = 0.05, and *** at p = 0.01.
Critical Value Transfer Interoperability Transfer
Manipulation Rate abs rel sd abs rel sd
-50% 0.0423 0.5865 0.0793 -0.0209 -0.6871 0.1022
-45% 0.0506 0.7007 0.0634 -0.0113 -0.3802 0.0860
-40% 0.0562 0.7789 0.0506 -0.0009 -0.0308 0.0714
-35% 0.0604 0.8359 0.0413 0.0055 0.1809 0.0596
-30% 0.0631 0.8741 0.0334 0.0113 0.3645 0.0478
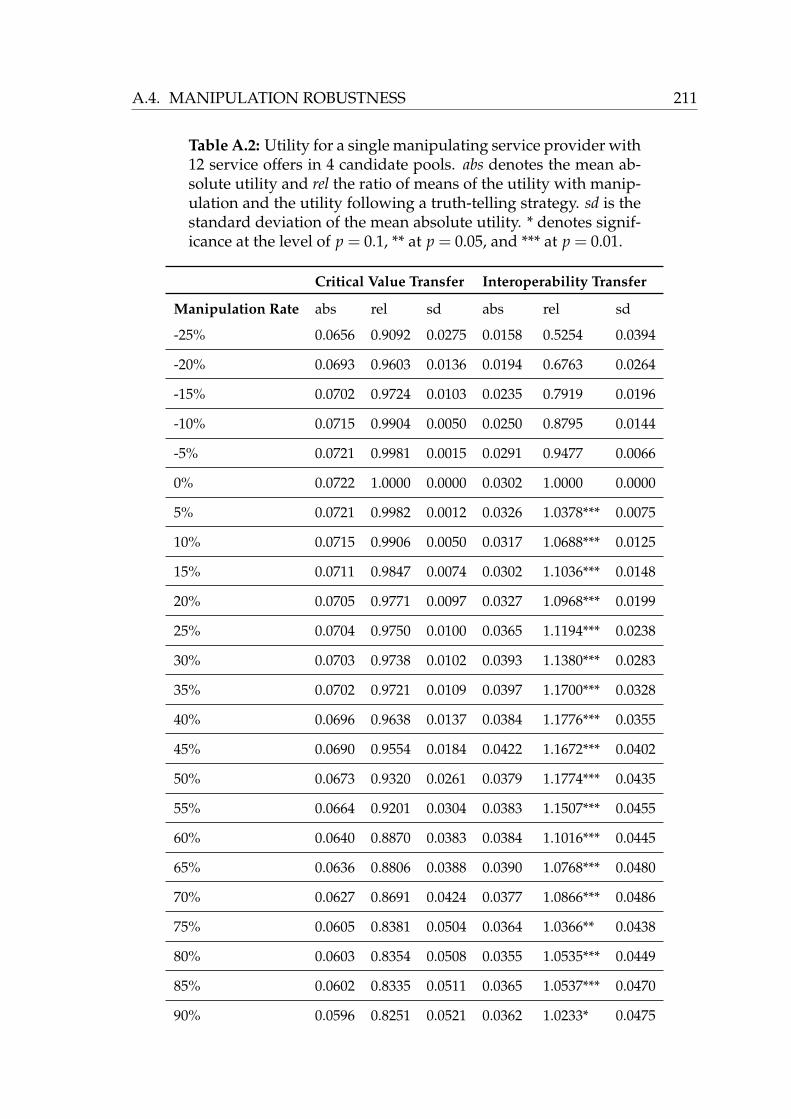
A.4. MANIPULATION ROBUSTNESS 211
Table A.2: Utility for a single manipulating service provider with12 service offers in 4 candidate pools. abs denotes the mean ab-solute utility and rel the ratio of means of the utility with manip-ulation and the utility following a truth-telling strategy. sd is thestandard deviation of the mean absolute utility. * denotes signif-icance at the level of p = 0.1, ** at p = 0.05, and *** at p = 0.01.
Critical Value Transfer Interoperability Transfer
Manipulation Rate abs rel sd abs rel sd
-25% 0.0656 0.9092 0.0275 0.0158 0.5254 0.0394
-20% 0.0693 0.9603 0.0136 0.0194 0.6763 0.0264
-15% 0.0702 0.9724 0.0103 0.0235 0.7919 0.0196
-10% 0.0715 0.9904 0.0050 0.0250 0.8795 0.0144
-5% 0.0721 0.9981 0.0015 0.0291 0.9477 0.0066
0% 0.0722 1.0000 0.0000 0.0302 1.0000 0.0000
5% 0.0721 0.9982 0.0012 0.0326 1.0378*** 0.0075
10% 0.0715 0.9906 0.0050 0.0317 1.0688*** 0.0125
15% 0.0711 0.9847 0.0074 0.0302 1.1036*** 0.0148
20% 0.0705 0.9771 0.0097 0.0327 1.0968*** 0.0199
25% 0.0704 0.9750 0.0100 0.0365 1.1194*** 0.0238
30% 0.0703 0.9738 0.0102 0.0393 1.1380*** 0.0283
35% 0.0702 0.9721 0.0109 0.0397 1.1700*** 0.0328
40% 0.0696 0.9638 0.0137 0.0384 1.1776*** 0.0355
45% 0.0690 0.9554 0.0184 0.0422 1.1672*** 0.0402
50% 0.0673 0.9320 0.0261 0.0379 1.1774*** 0.0435
55% 0.0664 0.9201 0.0304 0.0383 1.1507*** 0.0455
60% 0.0640 0.8870 0.0383 0.0384 1.1016*** 0.0445
65% 0.0636 0.8806 0.0388 0.0390 1.0768*** 0.0480
70% 0.0627 0.8691 0.0424 0.0377 1.0866*** 0.0486
75% 0.0605 0.8381 0.0504 0.0364 1.0366** 0.0438
80% 0.0603 0.8354 0.0508 0.0355 1.0535*** 0.0449
85% 0.0602 0.8335 0.0511 0.0365 1.0537*** 0.0470
90% 0.0596 0.8251 0.0521 0.0362 1.0233* 0.0475
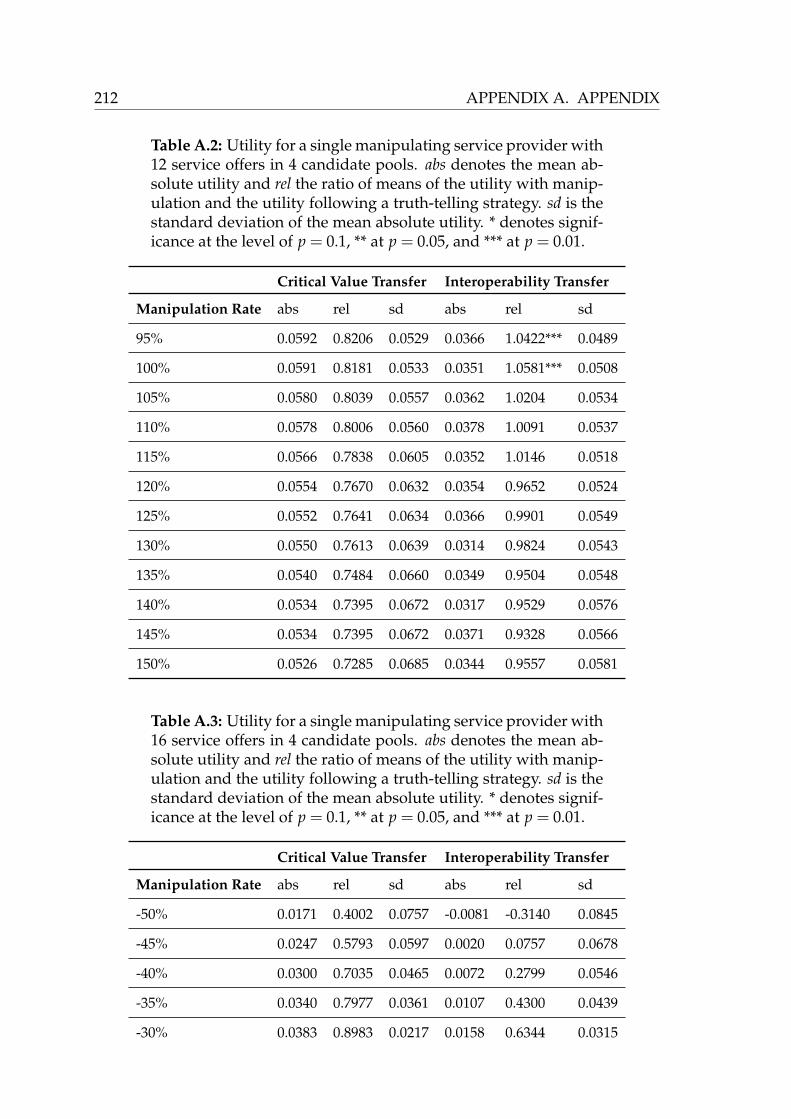
212 APPENDIX A. APPENDIX
Table A.2: Utility for a single manipulating service provider with12 service offers in 4 candidate pools. abs denotes the mean ab-solute utility and rel the ratio of means of the utility with manip-ulation and the utility following a truth-telling strategy. sd is thestandard deviation of the mean absolute utility. * denotes signif-icance at the level of p = 0.1, ** at p = 0.05, and *** at p = 0.01.
Critical Value Transfer Interoperability Transfer
Manipulation Rate abs rel sd abs rel sd
95% 0.0592 0.8206 0.0529 0.0366 1.0422*** 0.0489
100% 0.0591 0.8181 0.0533 0.0351 1.0581*** 0.0508
105% 0.0580 0.8039 0.0557 0.0362 1.0204 0.0534
110% 0.0578 0.8006 0.0560 0.0378 1.0091 0.0537
115% 0.0566 0.7838 0.0605 0.0352 1.0146 0.0518
120% 0.0554 0.7670 0.0632 0.0354 0.9652 0.0524
125% 0.0552 0.7641 0.0634 0.0366 0.9901 0.0549
130% 0.0550 0.7613 0.0639 0.0314 0.9824 0.0543
135% 0.0540 0.7484 0.0660 0.0349 0.9504 0.0548
140% 0.0534 0.7395 0.0672 0.0317 0.9529 0.0576
145% 0.0534 0.7395 0.0672 0.0371 0.9328 0.0566
150% 0.0526 0.7285 0.0685 0.0344 0.9557 0.0581
Table A.3: Utility for a single manipulating service provider with16 service offers in 4 candidate pools. abs denotes the mean ab-solute utility and rel the ratio of means of the utility with manip-ulation and the utility following a truth-telling strategy. sd is thestandard deviation of the mean absolute utility. * denotes signif-icance at the level of p = 0.1, ** at p = 0.05, and *** at p = 0.01.
Critical Value Transfer Interoperability Transfer
Manipulation Rate abs rel sd abs rel sd
-50% 0.0171 0.4002 0.0757 -0.0081 -0.3140 0.0845
-45% 0.0247 0.5793 0.0597 0.0020 0.0757 0.0678
-40% 0.0300 0.7035 0.0465 0.0072 0.2799 0.0546
-35% 0.0340 0.7977 0.0361 0.0107 0.4300 0.0439
-30% 0.0383 0.8983 0.0217 0.0158 0.6344 0.0315
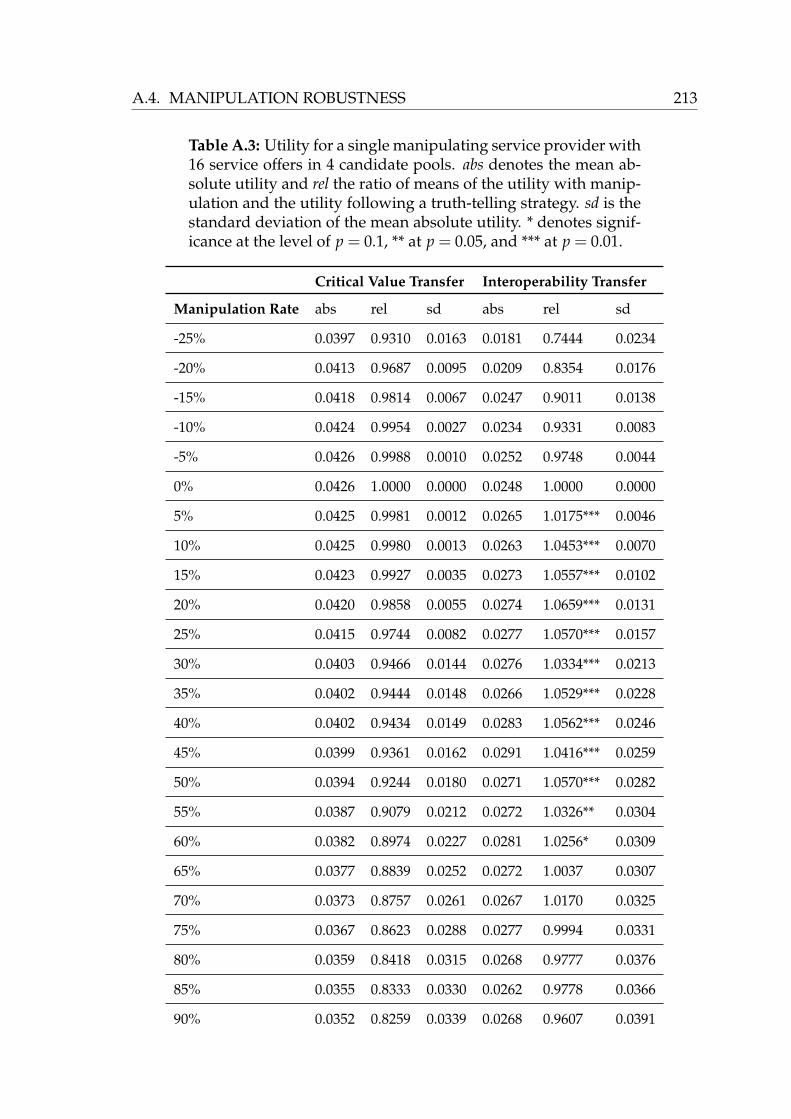
A.4. MANIPULATION ROBUSTNESS 213
Table A.3: Utility for a single manipulating service provider with16 service offers in 4 candidate pools. abs denotes the mean ab-solute utility and rel the ratio of means of the utility with manip-ulation and the utility following a truth-telling strategy. sd is thestandard deviation of the mean absolute utility. * denotes signif-icance at the level of p = 0.1, ** at p = 0.05, and *** at p = 0.01.
Critical Value Transfer Interoperability Transfer
Manipulation Rate abs rel sd abs rel sd
-25% 0.0397 0.9310 0.0163 0.0181 0.7444 0.0234
-20% 0.0413 0.9687 0.0095 0.0209 0.8354 0.0176
-15% 0.0418 0.9814 0.0067 0.0247 0.9011 0.0138
-10% 0.0424 0.9954 0.0027 0.0234 0.9331 0.0083
-5% 0.0426 0.9988 0.0010 0.0252 0.9748 0.0044
0% 0.0426 1.0000 0.0000 0.0248 1.0000 0.0000
5% 0.0425 0.9981 0.0012 0.0265 1.0175*** 0.0046
10% 0.0425 0.9980 0.0013 0.0263 1.0453*** 0.0070
15% 0.0423 0.9927 0.0035 0.0273 1.0557*** 0.0102
20% 0.0420 0.9858 0.0055 0.0274 1.0659*** 0.0131
25% 0.0415 0.9744 0.0082 0.0277 1.0570*** 0.0157
30% 0.0403 0.9466 0.0144 0.0276 1.0334*** 0.0213
35% 0.0402 0.9444 0.0148 0.0266 1.0529*** 0.0228
40% 0.0402 0.9434 0.0149 0.0283 1.0562*** 0.0246
45% 0.0399 0.9361 0.0162 0.0291 1.0416*** 0.0259
50% 0.0394 0.9244 0.0180 0.0271 1.0570*** 0.0282
55% 0.0387 0.9079 0.0212 0.0272 1.0326** 0.0304
60% 0.0382 0.8974 0.0227 0.0281 1.0256* 0.0309
65% 0.0377 0.8839 0.0252 0.0272 1.0037 0.0307
70% 0.0373 0.8757 0.0261 0.0267 1.0170 0.0325
75% 0.0367 0.8623 0.0288 0.0277 0.9994 0.0331
80% 0.0359 0.8418 0.0315 0.0268 0.9777 0.0376
85% 0.0355 0.8333 0.0330 0.0262 0.9778 0.0366
90% 0.0352 0.8259 0.0339 0.0268 0.9607 0.0391

214 APPENDIX A. APPENDIX
Table A.3: Utility for a single manipulating service provider with16 service offers in 4 candidate pools. abs denotes the mean ab-solute utility and rel the ratio of means of the utility with manip-ulation and the utility following a truth-telling strategy. sd is thestandard deviation of the mean absolute utility. * denotes signif-icance at the level of p = 0.1, ** at p = 0.05, and *** at p = 0.01.
Critical Value Transfer Interoperability Transfer
Manipulation Rate abs rel sd abs rel sd
95% 0.0350 0.8204 0.0344 0.0274 0.9673 0.0372
100% 0.0348 0.8168 0.0348 0.0276 0.9411 0.0395
105% 0.0335 0.7854 0.0405 0.0266 0.9083 0.0372
110% 0.0329 0.7724 0.0414 0.0254 0.8877 0.0383
115% 0.0324 0.7599 0.0430 0.0239 0.8655 0.0404
120% 0.0320 0.7504 0.0437 0.0245 0.8816 0.0412
125% 0.0314 0.7376 0.0463 0.0237 0.8639 0.0403
130% 0.0314 0.7376 0.0463 0.0240 0.8616 0.0420
135% 0.0306 0.7191 0.0485 0.0238 0.8278 0.0443
140% 0.0305 0.7153 0.0487 0.0246 0.8350 0.0444
145% 0.0305 0.7153 0.0487 0.0245 0.8290 0.0434
150% 0.0299 0.7012 0.0506 0.0234 0.8274 0.0440
Table A.4: Utility for a single manipulating service provider with20 service offers in 4 candidate pools. abs denotes the mean ab-solute utility and rel the ratio of means of the utility with manip-ulation and the utility following a truth-telling strategy. sd is thestandard deviation of the mean absolute utility. * denotes signif-icance at the level of p = 0.1, ** at p = 0.05, and *** at p = 0.01.
Critical Value Transfer Interoperability Transfer
Manipulation Rate abs rel sd abs rel sd
-50% 0.0025 0.1122 0.0630 -0.0111 -0.7315 0.0741
-45% 0.0075 0.3412 0.0502 -0.0032 -0.1944 0.0588
-40% 0.0107 0.4870 0.0425 0.0003 0.0187 0.0495
-35% 0.0147 0.6651 0.0316 0.0065 0.3905 0.0373
-30% 0.0173 0.7854 0.0231 0.0090 0.5533 0.0292

A.4. MANIPULATION ROBUSTNESS 215
Table A.4: Utility for a single manipulating service provider with20 service offers in 4 candidate pools. abs denotes the mean ab-solute utility and rel the ratio of means of the utility with manip-ulation and the utility following a truth-telling strategy. sd is thestandard deviation of the mean absolute utility. * denotes signif-icance at the level of p = 0.1, ** at p = 0.05, and *** at p = 0.01.
Critical Value Transfer Interoperability Transfer
Manipulation Rate abs rel sd abs rel sd
-25% 0.0194 0.8822 0.0155 0.0129 0.7391 0.0208
-20% 0.0208 0.9444 0.0089 0.0137 0.8251 0.0146
-15% 0.0212 0.9621 0.0068 0.0135 0.8736 0.0102
-10% 0.0219 0.9916 0.0020 0.0150 0.9434 0.0063
-5% 0.0220 0.9958 0.0011 0.0161 0.9756 0.0031
0% 0.0220 1.0000 0.0000 0.0167 1.0000 0.0000
5% 0.0220 0.9965 0.0009 0.0156 1.0155*** 0.0027
10% 0.0219 0.9920 0.0017 0.0169 1.0298*** 0.0059
15% 0.0217 0.9855 0.0032 0.0160 1.0339*** 0.0074
20% 0.0215 0.9748 0.0051 0.0168 1.0227*** 0.0086
25% 0.0210 0.9543 0.0079 0.0168 0.9996 0.0107
30% 0.0205 0.9300 0.0108 0.0157 0.9929 0.0111
35% 0.0199 0.9050 0.0135 0.0152 0.9629 0.0131
40% 0.0195 0.8849 0.0156 0.0150 0.9266 0.0143
45% 0.0192 0.8691 0.0167 0.0151 0.9063 0.0156
50% 0.0191 0.8662 0.0169 0.0149 0.9129 0.0163
55% 0.0190 0.8604 0.0173 0.0152 0.9012 0.0168
60% 0.0189 0.8562 0.0176 0.0150 0.8881 0.0166
65% 0.0188 0.8536 0.0177 0.0150 0.9143 0.0185
70% 0.0185 0.8387 0.0197 0.0148 0.8794 0.0187
75% 0.0184 0.8350 0.0200 0.0152 0.8847 0.0211
80% 0.0183 0.8324 0.0201 0.0153 0.8847 0.0201
85% 0.0183 0.8295 0.0204 0.0152 0.8771 0.0207
90% 0.0182 0.8246 0.0207 0.0149 0.8776 0.0218

216 APPENDIX A. APPENDIX
Table A.4: Utility for a single manipulating service provider with20 service offers in 4 candidate pools. abs denotes the mean ab-solute utility and rel the ratio of means of the utility with manip-ulation and the utility following a truth-telling strategy. sd is thestandard deviation of the mean absolute utility. * denotes signif-icance at the level of p = 0.1, ** at p = 0.05, and *** at p = 0.01.
Critical Value Transfer Interoperability Transfer
Manipulation Rate abs rel sd abs rel sd
95% 0.0181 0.8198 0.0211 0.0143 0.8751 0.0231
100% 0.0179 0.8125 0.0217 0.0149 0.8526 0.0220
105% 0.0178 0.8075 0.0222 0.0147 0.8461 0.0224
110% 0.0176 0.7988 0.0235 0.0148 0.8480 0.0234
115% 0.0175 0.7925 0.0241 0.0143 0.8359 0.0254
120% 0.0174 0.7888 0.0243 0.0154 0.8303 0.0266
125% 0.0173 0.7856 0.0245 0.0146 0.8280 0.0238
130% 0.0168 0.7602 0.0270 0.0139 0.7904 0.0270
135% 0.0165 0.7487 0.0284 0.0136 0.7826 0.0286
140% 0.0165 0.7474 0.0285 0.0139 0.7947 0.0293
145% 0.0165 0.7474 0.0285 0.0141 0.7801 0.0291
150% 0.0163 0.7397 0.0293 0.0139 0.7869 0.0279
Table A.5: Utility for a single manipulating service provider with28 service offers in 4 candidate pools. abs denotes the mean ab-solute utility and rel the ratio of means of the utility with manip-ulation and the utility following a truth-telling strategy. sd is thestandard deviation of the mean absolute utility. * denotes signif-icance at the level of p = 0.1, ** at p = 0.05, and *** at p = 0.01.
Critical Value Transfer Interoperability Transfer
Manipulation Rate abs rel sd abs rel sd
-50% 0.0000 0.0005 0.0501 -0.0048 -0.4739 0.0540
-45% 0.0046 0.3551 0.0371 0.0005 0.0468 0.0411
-40% 0.0081 0.6271 0.0247 0.0037 0.3617 0.0305
-35% 0.0091 0.7086 0.0208 0.0054 0.5255 0.0243
-30% 0.0103 0.8014 0.0152 0.0069 0.6498 0.0191

A.4. MANIPULATION ROBUSTNESS 217
Table A.5: Utility for a single manipulating service provider with28 service offers in 4 candidate pools. abs denotes the mean ab-solute utility and rel the ratio of means of the utility with manip-ulation and the utility following a truth-telling strategy. sd is thestandard deviation of the mean absolute utility. * denotes signif-icance at the level of p = 0.1, ** at p = 0.05, and *** at p = 0.01.
Critical Value Transfer Interoperability Transfer
Manipulation Rate abs rel sd abs rel sd
-25% 0.0113 0.8765 0.0112 0.0076 0.7570 0.0142
-20% 0.0119 0.9275 0.0070 0.0090 0.8521 0.0100
-15% 0.0124 0.9681 0.0042 0.0095 0.9224 0.0066
-10% 0.0127 0.9908 0.0014 0.0097 0.9500 0.0042
-5% 0.0128 0.9972 0.0007 0.0106 0.9837 0.0023
0% 0.0129 1.0000 0.0000 0.0101 1.0000 0.0000
5% 0.0128 0.9959 0.0009 0.0106 1.0080*** 0.0019
10% 0.0127 0.9873 0.0018 0.0108 1.0044 0.0029
15% 0.0124 0.9625 0.0047 0.0104 0.9845 0.0058
20% 0.0122 0.9489 0.0058 0.0101 0.9681 0.0063
25% 0.0121 0.9393 0.0064 0.0101 0.9587 0.0071
30% 0.0120 0.9315 0.0069 0.0107 0.9546 0.0080
35% 0.0119 0.9268 0.0071 0.0106 0.9563 0.0080
40% 0.0119 0.9240 0.0072 0.0099 0.9526 0.0084
45% 0.0117 0.9133 0.0082 0.0098 0.9396 0.0093
50% 0.0116 0.9059 0.0088 0.0098 0.9350 0.0103
55% 0.0116 0.9022 0.0090 0.0098 0.9432 0.0100
60% 0.0113 0.8799 0.0110 0.0099 0.9054 0.0123
65% 0.0111 0.8628 0.0122 0.0095 0.8963 0.0137
70% 0.0109 0.8455 0.0133 0.0098 0.8773 0.0141
75% 0.0107 0.8294 0.0142 0.0095 0.8635 0.0145
80% 0.0106 0.8232 0.0146 0.0094 0.8464 0.0144
85% 0.0104 0.8115 0.0152 0.0094 0.8522 0.0164
90% 0.0104 0.8083 0.0154 0.0092 0.8546 0.0163
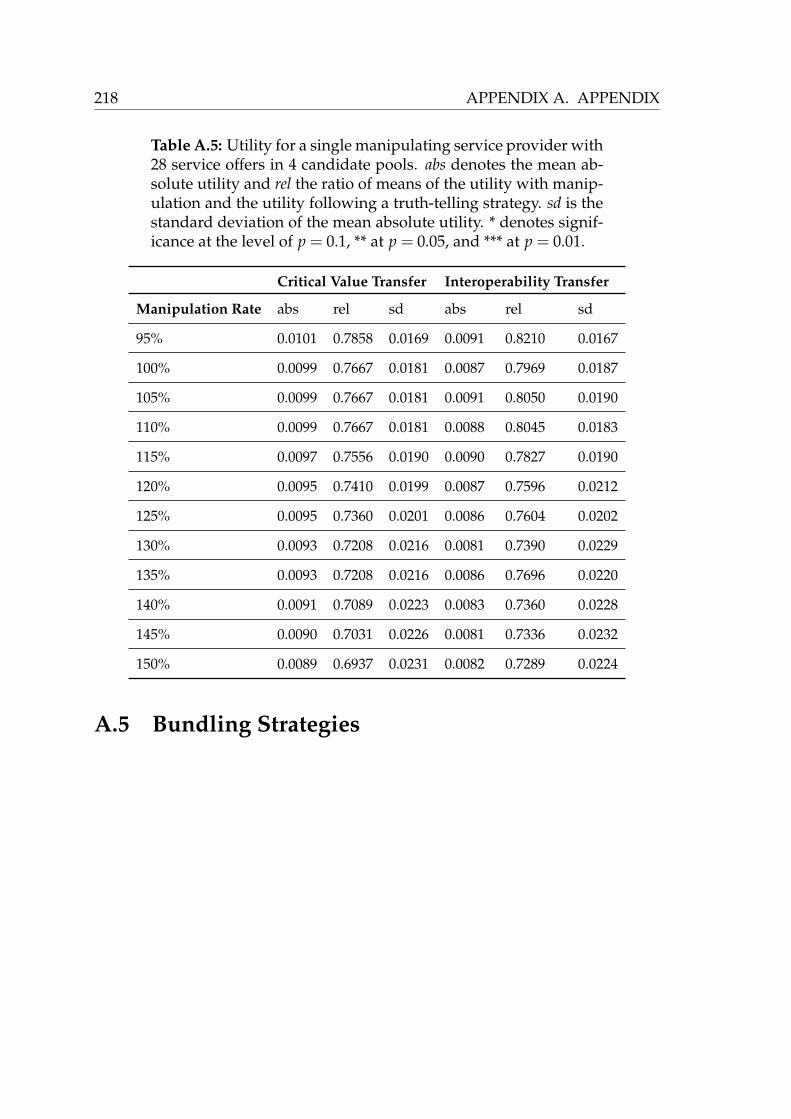
218 APPENDIX A. APPENDIX
Table A.5: Utility for a single manipulating service provider with28 service offers in 4 candidate pools. abs denotes the mean ab-solute utility and rel the ratio of means of the utility with manip-ulation and the utility following a truth-telling strategy. sd is thestandard deviation of the mean absolute utility. * denotes signif-icance at the level of p = 0.1, ** at p = 0.05, and *** at p = 0.01.
Critical Value Transfer Interoperability Transfer
Manipulation Rate abs rel sd abs rel sd
95% 0.0101 0.7858 0.0169 0.0091 0.8210 0.0167
100% 0.0099 0.7667 0.0181 0.0087 0.7969 0.0187
105% 0.0099 0.7667 0.0181 0.0091 0.8050 0.0190
110% 0.0099 0.7667 0.0181 0.0088 0.8045 0.0183
115% 0.0097 0.7556 0.0190 0.0090 0.7827 0.0190
120% 0.0095 0.7410 0.0199 0.0087 0.7596 0.0212
125% 0.0095 0.7360 0.0201 0.0086 0.7604 0.0202
130% 0.0093 0.7208 0.0216 0.0081 0.7390 0.0229
135% 0.0093 0.7208 0.0216 0.0086 0.7696 0.0220
140% 0.0091 0.7089 0.0223 0.0083 0.7360 0.0228
145% 0.0090 0.7031 0.0226 0.0081 0.7336 0.0232
150% 0.0089 0.6937 0.0231 0.0082 0.7289 0.0224
A.5 Bundling Strategies

A.5. BUNDLING STRATEGIES 219
0 5 10 15 20 25 30
0.0
0.2
0.4
0.6
0.8
1.0
Topology
Fitness
unbundlingbundling
unbundling bundling
0.0
0.2
0.4
0.6
0.8
1.0
Strategy
Fitness
(a) 0% cost reduction due to bundling synergies with 32 service offers in 4candidate pools.
0 5 10 15 20 25 30
0.0
0.2
0.4
0.6
0.8
1.0
Topology
Fitness
unbundlingbundling
unbundling bundling
0.0
0.2
0.4
0.6
0.8
1.0
Strategy
Fitness
(b) 50% cost reduction due to bundling synergies with 32 service offers in 4candidate pools.
Figure A.1Strategy fitness in different cost reduction scenarios with 32
service offers in 4 candidate pools.


References
[AAA+07] Alexandre Alves, Assaf Arkin, Sid Askary, Charlton Bar-reto, Ben Bloch, Francisco Curbera, Mark Ford, YaronGoland, Alejandro Guízar, Neelakantan Kartha, Canyang KevinLiu, Rania Khalaf, Dieter König, Mike Marin, VinkeshMehta, Satish Thatte, Danny van der Rijn, Prasad Yend-luri, and Alex Yiu. Web Service Business Process Execu-tion Language (WS-BPEL). Technical report, OASIS, 4 2007.http://docs.oasis-open.org/wsbpel/.
[AB91] B.R. Allen and A.C. Boynton. Information Architecture: InSearch of Efficient Flexibility. MIS Quarterly, 15(4):435–445,1991.
[AB08] Ben Adida and Mark Birbeck. Resource Description Frame-work - in - attributes. Technical report, W3C, 10 2008.http://www.w3.org/TR/xhtml-rdfa-primer/.
[ABC+02] Eric Armstrong, Stephanie Bodoff, Debbie Carson, MaydeneFisher, Dale Green, and Kim Haase. The Java Web Services Tu-
torial. Addison-Wesley, 2002.
[AC05] J. Asker and E. Cantillon. Optimal Procurement When BothPrice and Quality Matter. Technical report, 2005.
[AC08] J. Asker and E. Cantillon. Properties of Scoring Auctions. The
RAND Journal of Economics, 39(1):69–85, 2008.
[ACD+04] A. Andrieux, K. Czajkowski, A. Dan, K. Keahey, H. Ludwig,J. Pruyne, J. Rofrano, S. Tuecke, and M. Xu. Web Services Agree-ment Specification (WS-Agreement). In Global Grid Forum, 2004.
[ACSV04] A. AuYoung, B.N. Chun, A.C. Snoeren, and A. Vahdat. ResourceAllocation in Federated Distributed Computing Infrastructures.

222 REFERENCES
In Proceedings of the 1st Workshop on Operating System and Archi-
tectural Support for the On-demand IT InfraStructure, 2004.
[AGB+04] Daniel Austin, W. W. Grainger, Abbie Barbir, Christo-pher Ferris, and Sharad Garg. Web Services Archi-tecture Requirements. Technical report, W3C, 2 2004.http://www.w3.org/TR/wsa-reqs/.
[Ama08] Amazon. Amazon Web ServicesBlog. Technical report, Amazon, 5 2008.http://aws.typepad.com/aws/2008/05/lots-of-bits.html.
[And06] C. Anderson. The Long Tail: How Endless Choice is Creating Un-
limited Demand. Random House Business Books, 2006.
[AT07] Aaron Archer and Eva Tardos. Frugal Path Mechanisms. ACM
Transactions on Algorithms, 3(1):3, 2007.
[BBL99] Y. Bakos, E. Brynjolfsson, and D. Lichtman. Shared InformationGoods. The Journal of Law and Economics, 42(1):117–156, 1999.
[BBS08] B. Blau, C. Block, and J. Stösser. How to trade Electronic Ser-vices? – Current Status and Open Questions. In Proceedings of
the Joint Conference of the INFORMS section on Group Decision and
Negotiation, the EURO Working Group on Decision and Negotiation
Support, and the EURO Working Group on Decision Support Sys-
tems, 2008.
[BBT09] James Broberg, Rajkumar Buyya, and Zahir Tari. MetaCDN:Harnessing Storage Clouds for High Performance Content De-livery. Journal of Network and Computer Applications, In Press,Corrected Proof, 2009.
[BC00] C.Y. Baldwin and K.B. Clark. Design Rules: Volume 1: The Power
of Modularity. Mit Press Cambridge, MA, 2000.
[BCC+04] Don Box, Erik Christensen, Francisco Curbera, Donald Fer-guson, Jeffrey Frey, Marc Hadley, Chris Kaler, David Lang-worthy, Frank Leymann, Brad Lovering, Steve Lucco, SteveMillet, Nirmal Mukhi, Mark Nottingham, David Orchard,John Shewchuk, Eugene Sindambiwe, Tony Storey, San-jiva Weerawarana, and Steve Winkler. Web Services Ad-

REFERENCES 223
dressing (WS-Addressing). Technical report, W3C, 8 2004.http://www.w3.org/Submission/ws-addressing/.
[BCM+07] F. Baader, D. Calvanese, D.L. McGuinness, D. Nardi, and P.F.Patel-Schneider. The Description Logic Handbook. CambridgeUniversity Press New York, NY, USA, 2007.
[BCM09] B. Blau, T. Conte, and T. Meinl. Coordinating Service Composi-tion. In Proceedings of the 17th European Conference on Information
Systems, 2009.
[BDBD+00] Gabe Beged-Dov, Dan Brickley, Rael Dornfest, Ian Davis,Leigh Dodds, Jonathan Eisenzopf, David Galbraith, R.V. Guha,Ken MacLeod, Eric Miller, Aaron Swartz, and Eric van derVlist. RDF Site Summary (RSS) 1.0. Technical report, 2000.http://purl.org/rss/1.0/spec/.
[BDF+03] P. Barham, B. Dragovic, K. Fraser, S. Hand, T. Harris, A. Ho,R. Neugebauer, I. Pratt, and A. Warfield. Xen and the Art of Vir-tualization. ACM SIGOPS Operating Systems Review, 37(5):164–177, 2003.
[BEA08] BEA. Revised Statistics of Gross Domestic Product by Industry,2004-2006. Technical report, BEA (Bureau of Economic Analy-sis), 2008.
[BEK+00] Don Box, David Ehnebuske, Gopal Kakivaya, Andrew Layman,Noah Mendelsohn, Henrik Frystyk Nielsen, Satish Thatte, andDave Winer. Web Services Architecture Requirements. Techni-cal report, W3C, 5 2000. http://www.w3.org/TR/soap/.
[Ben38] J. Bentham. An Introduction to the Principles of Morals andLegislation. The Works of Jeremy Bentham, 43, 1838.
[BFHZ97] M.J. Bitner, W.T. Faranda, A.R. Hubbert, and V.A. Zeithaml.Customer Contributions and Roles in Service Delivery. Interna-
tional Journal of Service Industry Management, 8(3):193–205, 1997.
[BG00] V. Bala and S. Goyal. A Noncooperative Model of Network For-mation. Econometrica, pages 1181–1229, 2000.
[BK05] M. Bichler and J. Kalagnanam. Configurable Offers and WinnerDetermination in Multi-Attribute Auctions. European Journal of
Operational Research, 160(2):380–394, 2005.

224 REFERENCES
[BKCvD09] B. Blau, J. Krämer, T. Conte, and C. van Dinther. Service ValueNetworks. In Proceedings of the 11th IEEE Conference on Commerce
and Enterprise Computing (CEC 2009), 2009.
[BKO02] G. Bolton, E. Katok, and A. Ockenfels. How Effective are OnlineReputation Mechanisms. Discussion Papers on Strategic Interac-
tion, 25:2002–25, 2002.
[BLFM98] T. Berners-Lee, R. Fielding, and L. Masinter. RFC2396: UniformResource Identifiers (URI): Generic Syntax. RFC Editor United
States, 1998.
[BLH09] B. Blau, S. Lamparter, and S. Haak. remash! - Blueprints forRESTful Situational Web Applications. In Proceedings of the 2nd
Workshop on Mashups, Enterprise Mashups and Lightweight Com-
position on the Web (MEM 2009), 2009.
[BLNW08] B. Blau, S. Lamparter, D. Neumann, and C. Weinhardt. Planningand pricing of service mashups. In 10th IEEE Joint Conference on
E-Commerce Technology (CEC 2008) and Enterprise Computing, E-
Commerce and E-Services (EEE 2008), 21-24 July 2008, Washington,
D.C., USA, 2008.
[BNWM08] B. Blau, D. Neumann, C. Weinhardt, and W. Michalk. Provi-sioning of service mashup topologies. In Proceedings of the 16th
European Conference on Information Systems, ECIS 2008, 2008.
[Bon02] E. Bonabeau. Agent-Based Modeling: Methods And Techniquesfor Simulating Human Systems. In National Academy of Sciences,volume 99, pages 7280–7287. National Acad Sciences, 2002.
[Bor09] Nikolay Borissov. Q-Strategy: Automated Bidding and Con-vergence in Computational Markets. In 21st Innovative Applica-
tions of Artificial Intelligence (IAAI) Conference collocated with IJ-
CAI, July 2009.
[BP91] L.L. Berry and A. Parasuraman. Marketing Services: Competing
Through Quality. Free Press, 1991.
[BPSM+06] Tim Bray, Jean Paoli, C. M. Sperberg-McQueen, Eve Maler, andFrançois Yergeau. Extensible Markup Language (XML). Tech-nical report, W3C, 8 2006. http://www.w3.org/XML/.

REFERENCES 225
[BR04] R. Bianchini and R. Rajamony. Power and Energy Managementfor Server Systems. Computer, 37(11):68–76, 2004.
[Bra97] F. Branco. The Design of Multidimensional Auctions. RAND
Journal of Economics, 28(1):63–81, 1997.
[BS99] P.D. Bridge and S.S. Sawilowsky. Increasing PhysiciansŠ Aware-ness of the Impact of Statistics on Research Outcomes Com-parative Power of the T-Test and Wilcoxon Rank-Sum Test inSmall Samples Applied Research. Journal of Clinical Epidemiol-
ogy, 52(3):229–235, 1999.
[BS00] K. Binmore and J. Swierzbinski. Treasury Auctions: Uniform orDiscriminatory? Review of Economic Design, 5(4):387–410, 2000.
[BS08] B. Blau and B. Schnizler. Description languages and mecha-nisms for trading service objects in grid markets. In MartinBichler, Thomas Hess, Helmut Krcmar, Ulrike Lechner, Flo-rian Matthes, Arnold Picot, Benjamin Speitkamp, and PetraWolf, editors, Multikonferenz Wirtschaftsinformatik, MKWI 2008,
München, 26.2.2008 - 28.2.2008, Proceedings. GITO-Verlag 2008Berlin, 2 2008.
[Bur04] M. Burner. Service Orientation and Its Role in Your ConnectedSystems Strategy. Microsoft White Paper, July, 2004.
[BvDC+09] Benjamin Blau, Clemens van Dinther, Tobias Conte, YongchunXu, and Christof Weinhardt. How to Coordinate Value Genera-tion in Service Networks? – A Mechanism Design Approach.(forthcoming), Journal of Business and Information Systems Engi-
neering (Wirtschaftsinformatik), Special Issue Internet of Services,2009.
[BvDCW09] Benjamin Blau, Clemens van Dinther, Tobias Conte, andChristof Weinhardt. A Multidimensional Procurement Auctionfor Trading Composite Services. Electronic Commerce Research
and Applications, Special Issue on Emerging Economic, Strategic and
Technical Issues in Online Auctions and Electronic Market Mecha-
nisms (submitted), 2009.
[BVEL04] S. Brockmans, R. Volz, A. Eberhart, and P. Loffler. Visual Mod-eling of OWL DL Ontologies Using UML. Lecture Notes in Com-
puter Science, pages 198–213, 2004.

226 REFERENCES
[CAT+01] Jeffrey S. Chase, Darrell C. Anderson, Prachi N. Thakar,Amin M. Vahdat, and Ronald P. Doyle. Managing Energy andServer Resources in Hosting Centers. SIGOPS Oper. Syst. Rev.,35(5):103–116, 2001.
[CBSvD09] T. Conte, B. Blau, G. Satzger, and C. van Dinther. Enabling ser-vice networks through contribution-based value distribution. InProceedings of the 15th Americas Conference on Information Systems,2009.
[CCMW01] Erik Christensen, Francisco Curbera, Greg Meredith,and Sanjiva Weerawarana. Web Service DescriptionLanguage (WSDL) 1.1. Technical report, W3C, 3 2001.http://www.w3.org/TR/wsdl/.
[CHvRR04] Luc Clement, Andrew Hately, Claus von Riegen, andTony Rogers. Universal Description, Discovery, and In-tegration (UDDI). Technical report, OASIS, 10 2004.https://http://uddi.org/pubs/.
[CIoWM93] Y.K. Che, Social Systems Research Institute, and Universityof Wisconsin-Madison. Design Competition Through Multidi-mensional Auctions. RAND Journal of Economics, 24:668–668,1993.
[Cla71] E.H. Clarke. Multipart Pricing of Public Goods. Public Choice,11(1):17–33, 1971.
[CNLP05] Martin Chapter, Eric Newcomer, Mark Little, and GregPavlik. Web Services Coordination Framework (WS-CF).Technical report, OASIS, Public Review Draft, 10 2005.http://www.oasis-open.org/committees/ws-caf/.
[Cro06] D. Crockford. JSON: The Fat-Free Alternative To XML. In Pro-
ceedings of XML, 2006.
[CSM+04] J. Cardoso, A. Sheth, J. Miller, J. Arnold, and K. Kochut. Qual-ity of Service for Workflows and Web Service Processes. Web
Semantics: Science, Services and Agents on the World Wide Web,1(3):281–308, 2004.

REFERENCES 227
[CvD09] T. Conte C. van Dinther, B. Blau. Strategic Behavior in ServiceNetworks under Price and Service Level Competition. In Pro-
ceedings of the 9th International Conference on Business Informatics,2009.
[Dev98] J.F. Devlin. Adding Value to Service Offerings: The Case ofUK Retail Financial Services. European Journal of Marketing,32(11):1091–1109, 1998.
[Dij59] EW Dijkstra. A Note on Two Problems in Connexion WithGraphs. Numerische Mathematik, 1(1):269–271, 1959.
[DJP03] RK Dash, NR Jennings, and DC Parkes. Computational-Mechanism Design: A Call to Arms. IEEE Intelligent Systems,18(6):40–47, 2003.
[DLP03] A. Dan, H. Ludwig, and G. Pacifici. Web Service Differentiationwith Service Level Agreements. White Paper, IBM Corporation, 32003.
[DM93] W.H. Davidow and M.S. Malone. The Virtual Corporation:
Structuring and Revitalizing The Corporation for the 21st Century.HarperBusiness, 1993.
[DSBF01] G. Da Silveira, D. Borenstein, and F.S. Fogliatto. Mass Cus-tomization: Literature Review and Research Directions. Inter-
national Journal of Production Economics, 72(1):1–13, 2001.
[DVVfMSiES03] S. De Vries, R.V. Vohra, Center for Mathematical Studies in Eco-nomics, and Management Science. Combinatorial Auctions: ASurvey. INFORMS Journal on Computing, 15(3):284–309, 2003.
[EOS07] B. Edelman, M. Ostrovsky, and M. Schwarz. Internet Adver-tising and the Generalized Second-Price Auction: Selling Bil-lions of Dollars Worth of Keywords. American Economic Review,97(1):242–259, 2007.
[Eso01] M. Eso. An Iterative Online Auction for Airline Seats. IMA
Volumes In Mathematics And Its Applications, 127:45–58, 2001.
[ESS04] E. Elkind, A. Sahai, and K. Steiglitz. Frugality in Path Auc-tions. In Proceedings of the fifteenth annual ACM-SIAM symposium
on Discrete algorithms, pages 701–709. Society for Industrial andApplied Mathematics Philadelphia, PA, USA, 2004.

228 REFERENCES
[Eva91] J.S. Evans. Strategic Flexibility for High Technology Manoeu-vres: A Conceptual Framework. Journal of Management Studies,28(1):69–89, 1991.
[EWL06] Yagil Engel, Michael P. Wellman, and Kevin M. Lochner. Bid Ex-pressiveness and Clearing Algorithms in Multiattribute DoubleAuctions. In Proceedings of the 7th ACM Conference on Electronic
Commerce, pages 110–119. ACM, 2006.
[FCSS05] Michael Feldman, John Chuang, Ion Stoica, and Scott Shenker.Hidden-Action in Multi-Hop Routing. In Proceedings of the 6th
ACM Conference on Electronic commerce, pages 117–126. ACM,2005.
[FGM+99] R. Fielding, J. Gettys, J. Mogul, H. Frystyk, L. Masinter, P. Leach,and T. Berners-Lee. RFC2616: Hypertext Transfer Protocol–HTTP/1.1. RFC Editor United States, 1999.
[Fie00] Roy Thomas Fielding. Architectural Styles and the Design of
Network-based Software Architectures. PhD thesis, University ofCalifornia, Irvine, 2000.
[FK07] J. Farrell and P. Klemperer. Coordination and Lock-In: Compe-tition with Switching Costs and Network Effects. Handbook of
Industrial Organization, page 1967, 2007.
[FKNT02] I. Foster, C. Kesselman, J.M. Nick, and S. Tuecke. Grid Servicesfor Distributed System Integration. COMPUTER, pages 37–46,2002.
[FL07] Joel Farrell and Holger Lausen. Semantic Annotations forWSDL and XML Schema. Technical report, W3C, 8 2007.http://www.w3.org/TR/sawsdl/.
[FPP09] Joan Feigenbaum, David C. Parkes, and David M. Pennock.Computational Challenges in E-commerce. Communications of
the ACM, 52(1):70–74, 2009.
[FRS06] Joan Feigenbaum, Vijay Ramachandran, and Michael Schapira.Incentive-Compatible Interdomain Routing. In Proceedings of the
7th ACM Conference on Electronic Commerce, pages 130–139, 2006.
[Fuc68] V.R. Fuchs. The Service Economy. Natl Bureau of Economic Res,1968.
REFERENCES 229
[Gad92] J. Gadrey. L’économie des Services. 1992.
[Gad00] J. Gadrey. The Characterization of Goods and Services: An Al-ternative Approach. Review of Income and Wealth, 46(3):369–387,2000.
[Gal73] J.R. Galbraith. Designing Complex Organizations. Addison-Wesley Longman Publishing Co., Inc. Boston, MA, USA, 1973.
[Gib73] Allan Gibbard. Manipulation of Voting Schemes: A GeneralResult. Econometrica, 41(4):587–601, July 1973.
[Gib92] R. Gibbons. Game Theory for Applied Economists. Princeton Uni-versity Press Princeton, 1992.
[GL78] Jerry R. Green and Jean-Jacques Laffont. Incentives in Public De-
cision – Making, Studies in Public Economics. North–Holland Pub-lishing Company, Boston, 1978.
[GNC+04] Steve Graham, Peter Niblett, Dave Chappell, Amy Lewis,Nataraj Nagaratnam, Jay Parikh, Sanjay Patil, ShivajeeSamdarshi, Igor Sedukhin, David Snelling, Steve Tuecke,William Vambenepe, and Bill Weihl. Web Services Notifi-cation (WS-Notification). Technical report, OASIS, 5 2004.http://www.oasis-open.org/committees/wsn/.
[GR71] P.E. Green and V.R. Rao. Conjoint Measurement for QuantifyingJudgmental Data. Journal of Marketing Research, pages 355–363,1971.
[Gri92] Z. Griliches. Output Measurement in the Service Sectors, Stud-ies in Income and Wealth. 56, 1992.
[Gro73] Theodore Groves. Incentives in Teams. Econometrica, 41(4):617–631, 1973.
[GS06] J. Gebauer and F. Schober. Information System Flexibility andthe Cost Efficiency of Business Processes. Journal of the Associa-
tion for Information Systems, 7(3):122–147, 2006.
[GSB+02] S. Graham, S. Simeonov, T. Boubez, D. Davis, G. Daniels,Y. Nakamura, and R. Neyama. Building Web services with Java.Sams, 2002.
230 REFERENCES
[GW97] F. Gallouj and O. Weinstein. Innovation in Services. Research
Policy, 26(4-5):537–556, 1997.
[Had06] Marc J. Hadley. Web Application Description Language(WADL). Technical report, Sun Microsystems Inc., 11 2006.https://wadl.dev.java.net/.
[Hil77] T.P. Hill. On Goods and Services. Review of Income and Wealth,23(4):315–338, 1977.
[Hil99] T.P. Hill. Tangibles, Intangibles and Services: A New Taxonomyfor the Classification of Output. Canadian Journal of Economics,32:426–446, 1999.
[HN96] D. Harel and A. Naamad. The STATEMATE Semantics of Stat-echarts. ACM Transactions on Software Engineering and Methodol-
ogy, 5(4):293–333, 1996.
[HPSB+04] Ian Horrocks, Peter F. Patel-Schneider, Harold Boley, SaidTabet, Benjamin Grosof, and Mike Dean. Semantic WebRule Language (SWRL). Technical report, W3C, 5 2004.http://www.w3.org/Submission/SWRL/.
[HS01] J. Hershberger and S. Suri. Vickrey Prices and Shortest Paths:What Is an Edge Worth? In Foundations of Computer Science,
2001. Proceedings. 42nd IEEE Symposium on, pages 252–259, 2001.
[Hur72] L. Hurwicz. On Informationally Decentralized Systems/Deci-sion And Organization. Radner, R., CB McGuire. In Honor of J.
Marschak, 1972.
[Hur73] L. Hurwicz. The Design of Mechanisms for Resource Allocation.American Economic Review, 63(2):1–30, 1973.
[HW90] L. Hurwicz and M. Walker. On the Generic Nonoptimality ofDominant-Strategy Allocation Mechanisms: A General Theo-rem that Includes Pure Exchange Economies. Econometrica: Jour-
nal of the Econometric Society, pages 683–704, 1990.
[IL04] M. Iansiti and R. Levien. Strategy as Ecology. Harvard Business
Review, 82(3):68–81, 2004.
[Jac92] M.O. Jackson. Incentive Compatibility and Competitive Alloca-tions. Economics Letters, 40:299–302, 1992.

REFERENCES 231
[Jac03] M.O. Jackson. Efficiency and Information Aggregation in Auc-tions With Costly Information. Review of Economic Design,8(2):121, 2003.
[JF03] R. Jurca and B. Faltings. An Incentive Compatible ReputationMechanism. In Proceedings of the IEEE International Conference on
E-Commerce, pages 285–292, 2003.
[Jhi06] A. Jhingran. Enterprise Information Mashups: Integrating In-formation, Simply. In Proceedings of the 32nd International Con-
ference on Very Large Data Bases, pages 3–4. VLDB Endowment,2006.
[JIB07] A. Jøsang, R. Ismail, and C. Boyd. A Survey of Trust and Rep-utation Systems for Online Service Provision. Decision Support
Systems, 43(2):618–644, 2007.
[JMS02] L. Jin, V. Machiraju, and A. Sahai. Analysis on Service LevelAgreement of Web Services. HP, 6 2002.
[JW96] M.O. Jackson and A. Wolinsky. A Strategic Model of Socialand Economic Networks. Journal of economic Theory, 71(1):44–74,1996.
[JW02] M.O. Jackson and A. Watts. The Evolution of Social and Eco-nomic Networks. Journal of Economic Theory, 106(2):265–295,2002.
[KCS08] A. Kittur, E.H. Chi, and B. Suh. Crowdsourcing User Studieswith Mechanical Turk. 2008.
[KK05] AR Karlin and D. Kempe. Beyond VCG: Frugality of Truth-ful Mechanisms. In Foundations of Computer Science, 2005. FOCS
2005. 46th Annual IEEE Symposium on, pages 615–624, 2005.
[KN04] D. Karger and E. Nikolova. VCG Overpayment in RandomGraphs. In DIMACS Workshop on Computational Issues in Auction
Design, 2004.
[KN05] D. Karger and E. Nikolova. Brief Announcement: On the Ex-pected Overpayment of VCG Mechanisms in Large Networks.In Proceedings of the twenty-fourth annual ACM symposium on
Principles of distributed computing, pages 126–126. ACM NewYork, NY, USA, 2005.
232 REFERENCES
[Kra05] B. Kratz. Protocols For Long Running Business Transactions.Technical Report 17, Infolab Technical Report Series, 2005.
[KS85] M.L. Katz and C. Shapiro. Network Externalities, Competition,and Compatibility. The American Economic Review, pages 424–440, 1985.
[KV98] S. Kochugovindan and N.J. Vriend. Is the Study of ComplexAdaptive Systems Going to Solve the Mystery of Adam Smith’sInvisible Hand? Independent Review, 3:53–66, 1998.
[Lai05] K. Lai. Markets are Dead, Long Live Markets. ACM SIGecom
Exchanges, 5(4):1–10, 2005.
[Lam07] Steffen Lamparter. Policy-Based Contracting in Semantic Web Ser-
vice Markets. PhD thesis, Universität Karlsruhe (TH), 2007.
[Lev81] T. Levitt. Marketing Intangible Products and Product Intan-gibles. Cornell Hotel and Restaurant Administration Quarterly,22(2):37, 1981.
[Ley03] F. Leymann. Web Services: Distributed Applications withoutLimits. Business, Technology and Web, 2003.
[LGS07] Jon Lathem, Karthik Gomadam, and Amit P. Sheth. SA-RESTand (S)mashups: Adding Semantics to RESTful Services. InICSC ’07: Proceedings of the International Conference on Semantic
Computing, pages 469–476, Washington, DC, USA, 2007. IEEEComputer Society.
[LM94] SJ Liebowitz and S.E. Margolis. Network Externality: An Un-common Tragedy. The Journal of Economic Perspectives, pages133–150, 1994.
[LNZ04] Yutu Liu, Anne H. Ngu, and Liang Z. Zeng. QoS Computationand Policing in Dynamic Web Service Selection. In Proceedings of
the 13th international World Wide Web conference on Alternate Track
Papers & Posters, pages 66–73, New York, NY, USA, 2004. ACM.
[LR00] D. Lucking-Reiley. Auctions on the Internet: What’s Being Auc-tioned, and How? Journal of Industrial Economics, 48(3):227–252,2000.
REFERENCES 233
[LS06] S. Lamparter and B. Schnizler. Trading Services in Ontology-Driven Markets. In Proceedings of the 2006 ACM symposium on
Applied computing, pages 1679–1683. ACM New York, NY, USA,2006.
[LSW01] Z. Liu, M.S. Squillante, and J.L. Wolf. On Maximizing Service-Level-Agreement Profits. In Proceedings of the 3rd ACM confer-
ence on Electronic Commerce, pages 213–223. ACM New York, NY,USA, 2001.
[LT64] R.D. Luce and J.W. Tukey. Simultaneous Conjoint Measurement:A New Type of Fundamental Measurement. Journal of Mathe-
matical Psychology, 1(1):1–27, 1964.
[LVO07] R.F. Lusch, S.L. Vargo, and M. OŠBrien. Competing ThroughService: Insights From Service-Dominant Logic. Journal of Re-
tailing, 83(1):5–18, 2007.
[LW01] C.H. Lovelock and J. Wirtz. Services Marketing: People, Technol-
ogy, Strategy. Prentice Hall, 2001.
[LW03] M. Little and J. Webber. Introducing WS-CAF – More Than JustTransactions. Web Services Journal, 3(12):52–55, 2003.
[Mal85] T.W. Malone. Organizational Structure and Information Tech-nology: Elements of a Formal Theory. 1985.
[Mal87] Thomas W. Malone. Modeling Coordination in Organizationsand Markets. Management Science, 33(10):1317–1332, 1987.
[MB09] T. Meinl and B. Blau. Web Service Derivatives. In Proceedings
of the 18thInternational World Wide Web Conference (WWW2009),Madrid, Spain, 4 2009.
[MC94] Thomas W. Malone and Kevin Crowston. The InterdisciplinaryStudy of Coordination. ACM Comput. Surv., 26(1):87–119, 1994.
[MCWG95] A. Mas-Colell, M.D. Whinston, and J.R. Green. Microeconomic
Theory. Oxford University Press New York, 1995.
[Men02] DA Menasce. QoS Issues in Web services. IEEE Internet Comput-
ing, 6(6):72–75, 2002.
234 REFERENCES
[Mer06] D. Merrill. Mashups: The New Breed of Web App – AnIntroduction to Mashups. Technical report, IBM, 8 2006.http://www.ibm.com/developerworks/xml/library/x-mashups.html.
[MLM+06] C. Matthew MacKenzie, Ken Laskey, Francis McCabe, Peter FBrown, and Rebekah Metz. Reference Model for Service Ori-ented Architecture 1.0. Technical report, OASIS, 10 2006.
[MMV94] J.K. MacKie-Mason and H.R. Varian. Generalized Vickrey Auc-tions. Technology report. University of Michigan, July, 1994.
[MMW06] J.K. MacKie-Mason and M.P. Wellman. Automated Markets andTrading Agents. Ann Arbor, 1001:48109–1092, 2006.
[MN02] A. Mani and A. Nagarajan. Understanding quality of service forWeb services. IBM developerWorks, 1 2002.
[MN08a] A. Mu’Alem and N. Nisan. Truthful Approximation Mecha-nisms for Restricted Combinatorial Auctions. Games and Eco-
nomic Behavior, 64(2):612–631, 2008.
[MN08b] Ahuva Mu’alem and Noam Nisan. Truthful ApproximationMechanisms for Restricted Combinatorial Auctions. Games and
Economic Behavior, 2008.
[MNM+07] M. Mohabey, Y. Narahari, S. Mallick, P. Suresh, and SV Subrah-manya. A Combinatorial Procurement Auction for QoS-AwareWeb Services Composition. In IEEE International Conference on
Automation Science and Engineering, 2007. CASE 2007, pages 716–721, 2007.
[MPW08] R. Müller, A. Perea, and S. Wolf. Combinatorial Scoring Auc-tions. Technical report, 2008.
[MS83] R. Myerson and M. Satterthwaite. Efficient Mechanisms for Bi-lateral Exchange. Journal of Economic Theory, 28:265–281, 1983.
[MS84] T.W. Malone and S.A. Smith. Tradeoffs in Designing Organi-zations: Implications for New Forms of Human Organizationsand Computer Systems. 1984.
[MS86] R.E. Miles and C.C. Snow. Organizations: New Concepts forNew Forms. California Management Review, 28(3):62–74, 1986.

REFERENCES 235
[MSS+08] Justin Moore, Ratnesh Sharma, Rocky Shih, Jeff Chase, Chan-drakant Patel, and Parthasarathy Ranganathan. Going beyondCPUs: The Potential of Temperature-Aware Solutions for theData Center. Whitepaper, Hewlett Packard Labs, January 2008.
[MSZ01] S.A. McIlraith, T.C. Son, and H. Zeng. Semantic Web Services.IEEE Intelligent Systems, pages 46–53, 2001.
[MT07] P. Maille and B. Tuffin. Why VVG Auctions Can Hardly be Ap-plied to the Pricing of Inter-Domain and Ad Hoc Networks.In 3rd EuroNGI Conference on Next Generation Internet Networks,pages 36–39, 2007.
[Mul06] A. Mulholland. The End of Business as Usual: Service-OrientedBusiness Transformation. Lecture Notes in Computer Science,4294:540, 2006.
[MV98] P. Matthyssens and K. Vandenbempt. Creating Competitive Ad-vantage in Industrial Services. Journal Of Business and Industrial
Marketing, 13:339–355, 1998.
[MvH04] Deborah L. McGuinness and Frank van Harmelen. Web On-tology Language (OWL). Technical report, W3C, 2 2004.http://www.w3.org/2004/OWL/.
[MWL+06] T.W. Malone, P. Weill, R.K. Lai, V.T. D’Urso, G. Herman, T.G.Apel, S. Woerner, and I. Author. Do Some Business Models Per-form Better than Others? Technical report, 2006.
[MYB87] Thomas W. Malone, Joanne Yates, and Robert I. Benjamin. Elec-tronic Markets and Electronic Hierarchies. Communications of the
ACM, 30(6):484–497, 1987.
[Mye81] R.B. Myerson. Optimal Auction Design. Mathematics of opera-
tions research, pages 58–73, 1981.
[Mye82] Roger B. Myerson. Optimal Coordination Mechanisms in Gen-eralized Principal-Agent Problems. Journal of Mathematical Eco-
nomics, 10(1):67–81, June 1982.
[Mye88] R.B. Myerson. Mechanism Design. 1988.

236 REFERENCES
[Neu04] Dirk Georg Neumann. Market Engineering – A Structured Design
Process for Electronic Markets. PhD thesis, Universität Karlsruhe(TH), 2004.
[NKMHB06] Anthony Nadalin, Chris Kaler, Ronald Monzillo, and PhillipHallam-Baker. Web Services Security: SOAP Message Se-curity 1.1 (WS-Security). Technical report, OASIS, 2 2006.http://docs.oasis-open.org/wss/v1.1/.
[NR01] N. Nisan and A. Ronen. Algorithmic Mechanism Design. Games
and Economic Behavior, 35(1-2):166–196, 2001.
[NR07] N. Nisan and A. Ronen. Computationally Feasible VCG Mech-anisms. Journal of Artificial Intelligence Research, 29:19–47, 2007.
[NRFJ07] Eric Newcomer, Ian Robinson, Max Feingold, andRam Jeyaraman. Web Services Coordination (WS-Coordination). Technical report, OASIS, 7 2007.http://docs.oasis-open.org/ws-tx/wscoor/.
[NRFL07] Eric Newcomer, Ian Robinson, Tom Freund, andMark Little. Web Services Business Activity (WS-BusinessActivity). Technical report, OASIS, 7 2007.http://docs.oasis-open.org/ws-tx/wsba/.
[NRLW07] Eric Newcomer, Ian Robinson, Mark Little, and An-drew Wilkinson. Web Services Atomic Transaction (WS-AtomicTransaction). Technical report, OASIS, 7 2007.http://docs.oasis-open.org/ws-tx/wsat/.
[NRTV07] Noam Nisan, Tim Roughgarden, Eva Tardos, and Vijay V. Vazi-rani. Algorithmic Game Theory. Cambridge University Press,2007.
[NS06] N. Nisan and A. Sen. Weak Monotonicity Characterizes De-terministic Dominant-Strategy Implementation. Econometrica,pages 1109–1132, 2006.
[OEC05] OECD. Science, Technology and Industry Scoreboard 2005 – To-wards a Knowledge-Based Economy. Technical report, OECD,2005.

REFERENCES 237
[OMG07] OMG. The Unified Modeling Language (UML) 2.1.2. Tech-nical report, Object Management Group (OMG), 4 2007.http://www.omg.org/spec/UML/2.1.2/.
[Pap01] C. Papadimitriou. Algorithms, games, and the internet. In Pro-
ceedings of the thirty-third annual ACM symposium on Theory of
computing, pages 749–753. ACM New York, NY, USA, 2001.
[Pap08] P. Papazoglou. Web Services: Principles and Technologies. PrenticeHall, 2008.
[Par01] D.C. Parkes. Iterative Combinatorial Auctions: Achieving Economic
and Computational Efficiency. PhD thesis, University of Pennsyl-vania, 2001.
[Pau08] C. Pautasso. BPEL for REST. In Proceedings of the 6th International
Conference on Business Process Management (BPM 2008), Milan,
Italy. Springer, September 2008.
[PBB+04] M. Pistore, F. Barbon, P. Bertoli, D. Shaparau, and P. Traverso.Planning and Monitoring Web service Composition. Lecture
Notes in Computer Science, pages 106–115, 2004.
[PD04] M.P. Papazoglou and J. Dubray. A Survey of Web Service Tech-nologies. Technical report, University of Tronto, Department ofInformation and Communication Technology, 6 2004.
[PG03] M.P. Papazoglou and D. Georgakopoulos. Service-OrientedComputing. Communications of the ACM, 46(10):25–28, 2003.
[Phe08] S.G. Phelps. Evolutionary Mechanism Design. PhD thesis, Univer-sity of Liverpool, 2008.
[PK02] D. Parkes and J. Kalagnanam. Iterative Multiattribute VickreyAuctions. Technical report, Harvard University, 2002.
[PK05] D.C. Parkes and J. Kalagnanam. Models for Iterative Multiat-tribute Procurement Auctions. Management Science, 51(3):435–451, 2005.
[PKE01] D.C. Parkes, J. Kalagnanam, and M. Eso. Achieving Budget-Balance with Vickrey-Based Payment Schemes in CombinatorialExchanges. Technical report, IBM Research, 2001.

238 REFERENCES
[PMS04] F.T. Piller, K. Moeslein, and C.M. Stotko. Does Mass Customiza-tion Pay? An Economic Approach to Evaluate Customer Inte-gration. Production Planning & Control, 15(4):435–444, 2004.
[PS98] C.H. Papadimitriou and K. Steiglitz. Combinatorial Optimization:
Algorithms and Complexity. Dover Publications, 1998.
[PS00] W. Pesendorfer and J.M. Swinkels. Efficiency and InformationAggregation in Auctions. American Economic Review, 90(3):499–525, 2000.
[PZL08] C. Pautasso, O. Zimmermann, and F. Leymann. RESTful WebServices vs. Big Web Services: Making the Right ArchitecturalDecision. ACM New York, NY, USA, 2008.
[Ram80] P.H. Ramsey. Choosing the Most Powerful Pairwise MultipleComparison Procedure in Multivariate Analysis of Variance.Journal of Applied Psychology, 65(3,317-326), 1980.
[Rap04] M.A. Rappa. The Utility Business Model and the Future of Com-puting Services. IBM Systems Journal, 43(1):32–42, 2004.
[Rat66] J.M. Rathmell. What is meant by services? Journal of Marketing,30(4):32–36, 1966.
[Rei77] Stanley Reiter. Information and Performance in the (New) Wel-fare Economics. The American Economic Review, 67(1):226–234,1977.
[RH07] Stuart Rance and Ashley Hanna. Glossary of Terms and Defini-tions. Technical report, ITIL IT Service Management, 2007.
[RK02] R.T. Rust and PK Kannan. E-Service: New Directions in Theory
and Practice. ME Sharpe, 2002.
[RK03] R.T. Rust and PK Kannan. E-service: A New Paradigm for Busi-ness in the Electronic Environment. Communications of the ACM,46(6):36–42, 2003.
[RL05] A. Ronen and D. Lehmann. Nearly Optimal Multi-AttributeAuctions. In Proceedings of the 6th ACM conference on Electronic
commerce, pages 279–285. ACM Press New York, NY, USA, 2005.

REFERENCES 239
[Ron01] Amir Ronen. On Approximating Optimal Auctions. In Proceed-
ings of the 3rd ACM Conference on Electronic Commerce, pages 11–17. ACM, 2001.
[Rot02] A.E. Roth. The Economist as Engineer: Game Theory, Exper-imentation, and Computation as Tools for Design Economics.Econometrica, pages 1341–1378, 2002.
[RP76] D.J. Roberts and A. Postlewaite. The Incentives for Price-TakingBehavior in Large Exchange Economies. Econometrica: Journal of
the Econometric Society, pages 115–127, 1976.
[RPH98] M.H. Rothkopf, A. Pekec, and R.M. Harstad. Computation-ally Manageable Combinational Auctions. Management Science,pages 1131–1147, 1998.
[RR07] L. Richardson and S. Ruby. RESTful Web Services. O’Reilly, 2007.
[Saa80] T.L. Saaty. The Analytical Hierarchy Process. McGraw-Hill, NewYork, 1980.
[Saa08] T.L. Saaty. Decision Making with the Analytic Hierarchy Pro-cess. International Journal of Services Sciences, 1(1):83–98, 2008.
[SB92] SS Sawilowsky and RC Blair. A More Realistic Look at the Ro-bustness and Type II Error Properties of the T Test to Departuresfrom Population Normality. Psychological Bulletin, 111(2):352–360, 1992.
[SB99] RS Sutton and AG Barto. Reinforcement Learning. Journal of
Cognitive Neuroscience, 11(1):126–134, 1999.
[SB04] M. Salle and C. Bartolini. Management by Contract. Network Op-
erations and Management Symposium, 2004. NOMS 2004. IEEE/I-
FIP, 1, 2004.
[SBF98] R. Studer, V.R. Benjamins, and D. Fensel. Knowledge Engineer-ing: Principles and Methods. Data & Knowledge Engineering,25(1-2):161–197, 1998.
[Sch07] B. Schnizler. Resource allocation in the Grid. A Market Engineering
Approach. PhD thesis, Universität Karlsruhe (TH), 2007.
240 REFERENCES
[SGL07] Amit P. Sheth, Karthik Gomadam, and Jon Lathem. SA-REST: Semantically Interoperable and Easier-to-Use Servicesand Mashups. IEEE Internet Computing, 11(6):91–94, 2007.
[Sho85] G.L. Shostack. Planning the Service Encounter. The Service En-
counter, Lexington Books, Lexington, MA, pages 243–54, 1985.
[Smi82] V.L. Smith. Microeconomic Systems as an Experimental Science.The American Economic Review, pages 923–955, 1982.
[Smi89] C.W. Smith. Auctions: The Social Construction of Value. Universityof California Press, 1989.
[SMS+02] A. Sahai, V. Machiraju, M. Sayal, A. Van Moorsel, F. Casati, andL.J. Jin. Automated SLA Monitoring for Web services. Lecture
Notes in Computer Science, pages 28–41, 2002.
[SNP+05] J. Shneidman, C. Ng, D.C. Parkes, A. AuYoung, A.C. Snoeren,A. Vahdat, and B. Chun. Why Markets Could (But DonŠt Cur-rently) Solve Resource Allocation Problems in Systems. In Pro-
ceedings of the 10th Conference on Hot Topics in Operating Systems,pages 7–7, 2005.
[SSGL05] T. Sandholm, S. Suri, A. Gilpin, and D. Levine. CABOB: A FastOptimal Algorithm for Winner Determination in CombinatorialAuctions. Management Science, 51(3):374–390, 2005.
[Sta79] T.M. Stanback. Understanding the Service Economy: Employment,
Productivity, Location. Johns Hopkins Univserity Press, 1979.
[Ste04] F. Steiner. Formation and Early Growth of Business Webs: Modular
Product Systems in Network Markets. Physica-Verlag Heidelberg,2004.
[Sto09] Jochen Stoesser. Market-Based Scheduling in Distributed Comput-
ing Systems. PhD thesis, Universität Karlsruhe (TH), 2009.
[SV99] C. Shapiro and H.R. Varian. Information Rules. Harvard BusinessSchool Press Boston, Mass, 1999.
[Tal03] K. Talwar. The Price of Truth: Frugality in Truthful Mechanisms.Lecture Notes in Computer Science, pages 608–619, 2003.

REFERENCES 241
[Tes01] L. Tesfatsion. Introduction to The Special Issue on Agent-BasedComputational Economics. Journal of Economic Dynamics and
Control, 25(3-4):281–293, 2001.
[Tho91] G. Thompson. Markets, Hierarchies and Networks: The Coordina-
tion of Social Life. Sage, 1991.
[TLT00] D. Tapscott, A. Lowy, and D. Ticoll. Digital Capital: Harnessing
the Power of Business Webs. Harvard Business School Press, 2000.
[TW06] D. Tapscott and A.D. Williams. Wikinomics: How Mass Collabora-
tion Changes Everything. Portfolio, 2006.
[Var09] H.R. Varian. Online Ad Auctions. American Economic Review,2009.
[vHV07] E. van Heck and P. Vervest. Smart Business Networks: How theNetwork Wins. Communications of the ACM, 50(6):29–37, 2007.
[Vic61] William Vickrey. Counterspeculation, Auctions, and Competi-tive Sealed Tenders. The Journal of Finance, 16(1):8–37, 1961.
[VL04] S.L. Vargo and R.F. Lusch. Evolving to a New Dominant Logicfor Marketing. Journal of Marketing, 68(1):1–17, 2004.
[VvHPP05] P. Vervest, E. van Heck, K. Preiss, and L.F. Pau. Smart Business
Networks. Springer, 2005.
[Wal80] M. Walker. On the Nonexistence of a Dominant Strategy Mech-anism for Making Optimal Public Decisions. Econometrica: Jour-
nal of the Econometric Society, pages 1521–1540, 1980.
[WCL+05] S. Weerawarana, F. Curbera, F. Leymann, T. Storey, and D.F.Ferguson. Web Services Platform Architecture: SOAP, WSDL,
WS-Policy, WS-Addressing, WS-BPEL, WS-Reliable Messaging and
More. Prentice Hall PTR Upper Saddle River, 2005.
[WD92] C.J.C.H. Watkins and P. Dayan. Q-Learning. Machine learning,8(3):279–292, 1992.
[WHN03] C. Weinhardt, C. Holtmann, and D. Neumann. Market Engi-neering. Wirtschaftsinformatik, 45(6):635–640, 2003.

242 REFERENCES
[Wil79] O.E. Williamson. Transaction-Cost Economics: The Governanceof Contractual Relations. The journal of Law and Economics,22(2):233, 1979.
[Win99] Dave Winer. Extensible Markup Language RemoteProcedure Call (XML-RPC). Technical report, 7 1999.http://www.xmlrpc.com/spec/.
[Win02] A. Winter. Exchanging Graphs with GXL. Lecture Notes in Com-
puter Science, pages 485–500, 2002.
[WNH06] C. Weinhardt, D. Neumann, and C. Holtmann. Computer-Aided Market Engineering. Communications of the ACM, 2006.
[WV03] Y. Wang and J. Vassileva. Trust and Reputation Model in Peer-to-Peer Networks. In Proceedings of the 3rd International Confer-
ence on Peer-to-Peer Computing, pages 150–157, 2003.
[ZBD+03] Liangzhao Zeng, Boualem Benatallah, Marlon Dumas, JayantKalagnanam, and Quan Z. Sheng. Quality Driven Web ServicesComposition. In Proceedings of the 12th international conference
on World Wide Web, pages 411–421, New York, NY, USA, 2003.ACM.
[ZVB96] A. Zeithaml Valarie and M.J. Bitner. Services Marketing. 1996.

The fundamental paradigm shift from traditional value chains to agile service va-lue networks (SVN) implies new economic and organizational challenges. In service value networks, a multitude of participants co-create complex services that create added value for customers by providing highly specialized service components and by leveraging lightweight paradigms such as RESTful architectures and mashup tech-nologies. Addressing the challenge of coordinating distributed activities in order to achieve a desired outcome, auctions have proven to perform quite well in situations where intangible and heterogeneous economic entities are traded.
Nevertheless, traditional approaches in the area of multidimensional combinatorial auctions are not quite suitable to enable the trade of composite services. A flawless service execution and therefore the requester’s valuation highly depends on the accu-rate sequence of the functional parts of the composition, meaning that in contrary to service bundles, composite services only generate value through a valid order of their components. From a technical perspective, service composition research traditionally assumes complete information about QoS characteristics and prices and does not account for self-interested service owners that intent to maximize their utility and therefore behave strategically.
Benj
amin
Seb
astia
n Bl
auC
oo
rdin
ati
on
in
Serv
ice V
alu
e N
etw
ork
s
13
Benjamin Sebastian Blau
Coordination in Service Value Networks A Mechanism Design Approach
Studies on eOrganisation and Market Engineering 13
ISBN 978-3-86644-724-0ISSN 1862-8893
9 783866 447240
ISBN 978-3-86644-724-0