berkshire hathaway $100 billion in cash and … · restaurants 09-02-16 51.25 59.26 17% buy...
TRANSCRIPT
This issue: Stock Performance Pages 2-3 Portfolio Review Pages 4-5 Fundamentals Pages 6-7 Portfolio HI-Lites Pages 8-9 New Stock Page 10 Ross Stores
Under the Spotlight Page 11 Walgreens Page 12 Berkshire notes continued
Editor: Ingrid R. Hendershot, CFA June 2017 Volume 24 Issue 2
Berkshire Hathaway’s annual meeting was held on May 6, 2017, in Omaha, Nebraska. Warren Buffett, Chairman of Berkshire Hatha-way, and Charlie Munger, Vice-Chairman, answered questions from shareholders, ana-lysts and the media. Here are highlights from our meeting notes with the complete notes available on our website.
FIRST QUARTER RESULTS Warren Buffett said, “I feel very good about the first quarter even though our operating earnings were down a little bit. One quarter means nothing over time. What really counts is whether we are building value of the busi-nesses we own. I’m always interested in the current figures, but I’m always dreaming about the future figures.”
SWEET SPOT FOR INVESTING Buffett explained, “The sweet spot for a Berk-shire investment would tend to be a business, that for one reason or another, we can look out 5, 10 or 20 years and decide that the competitive advantage that it had at the pre-sent would last over that period. It would have a trusted manager that would not only fit into the Berkshire culture but was eager to join the Berkshire culture. Then it would be a matter of price. When we buy a business, essentially we are laying out a lot of money now based on what we think that business would deliver over a period of time. The higher certainty in which we make that prediction, the better we feel about it.”
COMPOUNDING INTRINSIC VALUE Buffett was asked at what rate Berkshire has compounded intrinsic value over the last dec-ade and what rate he expected intrinsic value to compound over the next decade. Buffett stated, “The true intrinsic value of a business is the cash to be generated between now and judgment day discounted at an inter-est rate that seems appropriate at the time. That’s varied enormously over a 30 or 40-year period. If you pick out 10 years, and
you’re back to May of 2007, we had some un-pleasant things coming up. I’d say we’ve proba-bly compounded intrinsic value about 10% an-nually since then.“ “I’d say the chances of getting a terrible result in Berkshire are about as low as anything you could find. Chances of getting a sensational rate are also about as low as anything you could find. My best guess would be in the 10% range, but that assumes somewhat higher inter-est rates, not dramatically, but somewhat higher interest rates in the next 10 or 20 years than we experienced in the last seven years.“ Charlie Munger added, “The future with our pre-sent size in terms of percentage rates of return is going to be less glorious than in the past. We keep saying that and now we are proving it. I think we have a collection of businesses that on average has better investment values than say the S&P 500. I don’t think you shareholders have a terrible problem. I think we have one other advantage. A lot of other people are try-ing to be brilliant. We are just trying to stay ra-tional. It’s a big advantage.”
LOWER TAX RATES If corporate tax rates are reduced, Warren Buf-fett was asked how much will go to Berkshire shareholders in terms of a higher book value. Buffett responded, “In the case of our utility businesses, all benefit of lower tax rates go to customers. For all of our other businesses, if tax rates are lowered, some of it almost certain-ly gets competed away. It’s very industry and company specific as to how that plays out. It’s certain some of it would be to the benefit of the shareholder. We have $90 billion plus of de-ferred taxes on unrealized gains. If the rates were changed on those in either direction, our owners dollar for dollar would participate in that.” Charlie Munger exclaimed, “Dollar for dollar, on $90 or $95 billion of deferred taxes, if the rate would drop 10%, that $9 billion to $9.5 billion is real!” (Berkshire notes continued on page 12.)
BERKSHIRE HATHAWAY $100 BILLION IN CASH AND COUNTING

Page 2 Hendershot Investments, June 2017
STOCK PERFORMANCE Stock-Symbol
Business
Purchase Date(a) Price(b)
Price 5-26-17
Total (c) Return
Advice*
Comment
Abbott-ABT Healthcare 03-09-10 12-03-10
$26.34 22.68
$44.71 144% SELL Selling position (see p. 4)
AbbVie-ABBV Pharmaceuticals 03-09-10 12-03-10
28.57 24.59
66.06 170% BUY 1Q sales up 10% and EPS up 28%
Accenture-ACN Consulting 03-06-12 59.95 122.89 123% HOLD Free cash flow +37% in first half to $1 billion
Alphabet, Cl A-GOOGL Alphabet, Cl A-GOOGL Alphabet, Cl C-GOOG
Technology
06-10-11 06-08-15 06-10-11
256.38 546.47 254.89
993.27 971.47
121% 281%
HOLD
1Q free cash flow up 35% to $7.5 billion contributing to $92 billion in
cash as of quarter end
Apple-AAPL Computers, iPhones 09-07-10 36.97 153.61 346% HOLD Increased dividend 10.5% and expanded share buyback by $50 billion
Automatic Data Processing-ADP
Human capital mgmt. 03-09-16 85.62 101.35 21% HOLD Free cash flow up 35% year-to-date to $1.5 billion
Baxter International-BAX Healthcare 09-09-09 03-14-14
30.86 37.09
58.64 77% HOLD Trimming position (see p. 4)
Becton Dickinson-BDX Medical technology 03-13-02
36.74
186.48 466% HOLD Acquiring CR Bard for $24 billion in cash and stock
Berkshire Hathaway-BRKB
Insurance/diversified 12-28-94! 03-10-00 03-17-00
21.56 27.45 34.13
165.69 522% HOLD Book value +3.5% in 1Q; increased stake in Apple to $19.2 billion
Biogen-BIIB Biotechnology 09-09-15 286.19 250.80 -12% BUY YTD repurchased $1 billion of stock
Bioverativ-BIVV Hemophilia products 09-09-15 48.15 56.73 18% BUY Acquiring True North Therapeutics for $400 million
Brown-Forman-BFB Liquor 03-10-00 5.32 51.73 1,051% HOLD Rebuffs buyout overture (see p. 4)
Canadian National Railway-CNI
Railroad 06-28-15 58.05 77.01 36% BUY 1Q free cash flow up 44% to C$860 million
Cheesecake Factory-CAKE
Restaurants 09-02-16 51.25 59.26 17% BUY Targeting $100 million in share repurchases in 2017
Cisco Systems-CSCO Internetworking 03-12-97
5.78 31.50 514% HOLD Acquiring Vitptela for $610 million in cash
Cognizant Tech.-CTSH IT Consulting 09-07-12 33.43 66.79 100% BUY Repurchased $1.5 billion of stock in 1Q and declared first dividend
Express Scripts-ESRX Healthcare mgmt. 12-13-96 03-09-11
1.18 53.99
59.76 160% BUY Free cash flow up 42% in 1Q to $1 billion
F5 Networks-FFIV Network technology 09-09-15 121.84 127.16 4% BUY Ended 1Q with $1.2 billion in cash
FactSet Research-FDS Financial Information 03-14-14 104.42 161.95 60% BUY Increased dividend 12%, marking 12th consecutive year of dividend hikes
Fastenal-FAST Industrial supplies 03-10-00 06-10-14
4.89 50.50
43.47 26% BUY Acquired Mansco for $58 million; 1Q free cash flow up 38%
Fluor-FLR Engineering 12-08-08 03-11-09 09-07-12
51.15 37.42 54.91
44.98 -2% HOLD Lowered 2017 EPS guidance to $2.25-$2.75
Gentex-GNTX Auto Mirrors 12-08-15 16.29 19.15 21% HOLD Increased dividend 11%
Genuine Parts-GPC Diversified distributor 03-10-00 09-09-15
20.81 84.10
93.28 46% HOLD Raised 2017 EPS outlook to $4.75- $4.85
*All recommendations made in this newsletter may not be suitable for every account, depending on an individual’s investment objective, risk-tolerance and financial situation. It should not be assumed that recommendations will be profitable or will equal the performance of securities listed here or recommended in the past. Clients should contact Hendershot Investments, Inc. if there are any changes in your financial situation or investment objectives, or if you wish to impose, add or modify any reasonable restrictions to the management of your account. (a) Date purchased for Hendershot IRA. See personal trading restrictions footnote on page 3. ! Received BRKB shares following acquisition of FlightSafety Int’l in Dec ‘96 and Int’l Dairy Queen in Jan ‘98 ( b) Price includes commissions paid. (c) Total return includes dividends. NI-Net Income, Q-quarter, H-half, YTD-year-to-date, ROE-return on equity
www.hendershotinvestments.com Page 3
(continued) Stock-Symbol
Business
Purchase Date(a) Price(b)
Price 5-26-17
Total (c) Return
Advice*
Comment
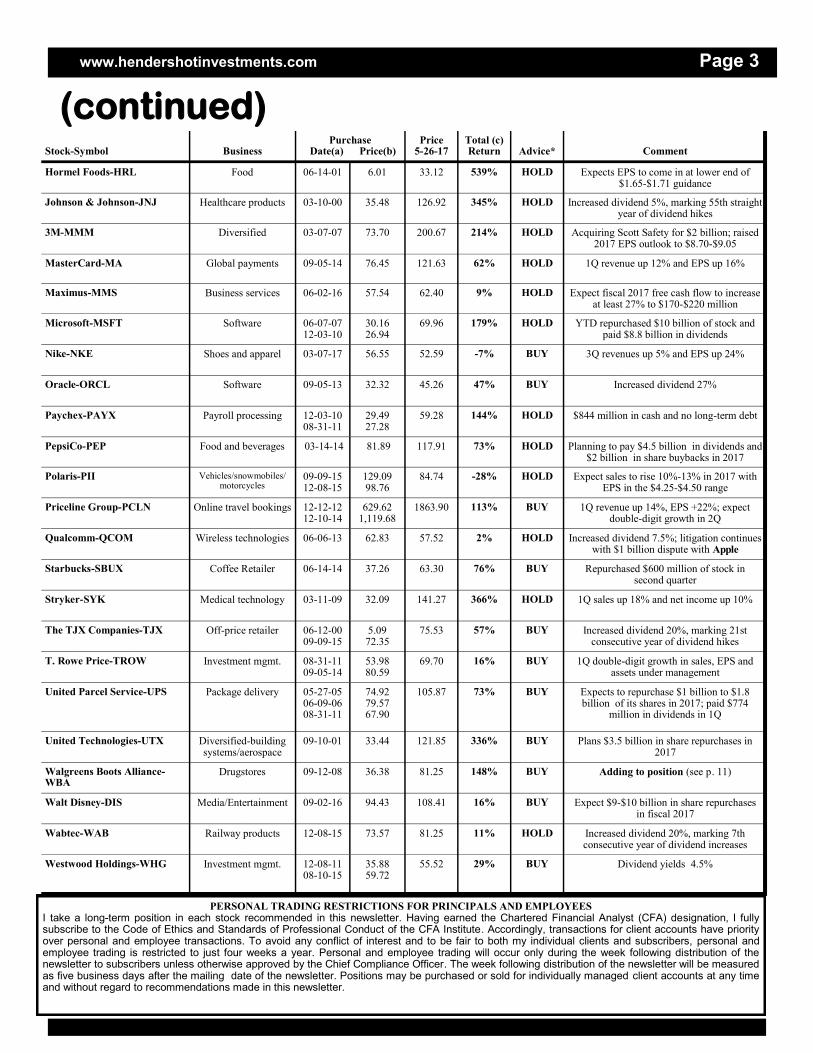
Hormel Foods-HRL Food 06-14-01 6.01 33.12 539% HOLD Expects EPS to come in at lower end of $1.65-$1.71 guidance
Johnson & Johnson-JNJ Healthcare products 03-10-00 35.48 126.92 345% HOLD Increased dividend 5%, marking 55th straight year of dividend hikes
3M-MMM Diversified 03-07-07 73.70 200.67 214% HOLD Acquiring Scott Safety for $2 billion; raised 2017 EPS outlook to $8.70-$9.05
MasterCard-MA Global payments 09-05-14 76.45 121.63 62% HOLD 1Q revenue up 12% and EPS up 16%
Maximus-MMS Business services 06-02-16 57.54 62.40 9% HOLD Expect fiscal 2017 free cash flow to increase at least 27% to $170-$220 million
Microsoft-MSFT Software 06-07-07 12-03-10
30.16 26.94
69.96 179% HOLD YTD repurchased $10 billion of stock and paid $8.8 billion in dividends
Nike-NKE Shoes and apparel 03-07-17 56.55 52.59 -7% BUY 3Q revenues up 5% and EPS up 24%
Oracle-ORCL Software 09-05-13 32.32 45.26 47% BUY Increased dividend 27%
Paychex-PAYX Payroll processing 12-03-10 08-31-11
29.49 27.28
59.28 144% HOLD $844 million in cash and no long-term debt
PepsiCo-PEP Food and beverages 03-14-14 81.89 117.91 73% HOLD Planning to pay $4.5 billion in dividends and $2 billion in share buybacks in 2017
Polaris-PII Vehicles/snowmobiles/motorcycles
09-09-15 12-08-15
129.09 98.76
84.74 -28% HOLD Expect sales to rise 10%-13% in 2017 with EPS in the $4.25-$4.50 range
Priceline Group-PCLN Online travel bookings 12-12-12 12-10-14
629.62 1,119.68
1863.90 113% BUY 1Q revenue up 14%, EPS +22%; expect double-digit growth in 2Q
Qualcomm-QCOM Wireless technologies 06-06-13 62.83 57.52 2% HOLD Increased dividend 7.5%; litigation continues with $1 billion dispute with Apple
Starbucks-SBUX Coffee Retailer 06-14-14 37.26 63.30 76% BUY Repurchased $600 million of stock in second quarter
Stryker-SYK Medical technology 03-11-09 32.09 141.27 366% HOLD 1Q sales up 18% and net income up 10%
The TJX Companies-TJX Off-price retailer 06-12-00 09-09-15
5.09 72.35
75.53 57% BUY Increased dividend 20%, marking 21st consecutive year of dividend hikes
T. Rowe Price-TROW Investment mgmt. 08-31-11 09-05-14
53.98 80.59
69.70 16% BUY 1Q double-digit growth in sales, EPS and assets under management
United Parcel Service-UPS Package delivery 05-27-05 06-09-06 08-31-11
74.92 79.57 67.90
105.87 73%
BUY Expects to repurchase $1 billion to $1.8 billion of its shares in 2017; paid $774
million in dividends in 1Q
United Technologies-UTX Diversified-building systems/aerospace
09-10-01 33.44 121.85 336% BUY Plans $3.5 billion in share repurchases in 2017
Walgreens Boots Alliance-WBA
Drugstores 09-12-08 36.38 81.25 148% BUY Adding to position (see p. 11)
Walt Disney-DIS Media/Entertainment 09-02-16 94.43 108.41 16% BUY Expect $9-$10 billion in share repurchases in fiscal 2017
Wabtec-WAB Railway products 12-08-15 73.57 81.25 11% HOLD Increased dividend 20%, marking 7th consecutive year of dividend increases
Westwood Holdings-WHG Investment mgmt. 12-08-11 08-10-15
35.88 59.72
55.52 29% BUY Dividend yields 4.5%
PERSONAL TRADING RESTRICTIONS FOR PRINCIPALS AND EMPLOYEES I take a long-term position in each stock recommended in this newsletter. Having earned the Chartered Financial Analyst (CFA) designation, I fully subscribe to the Code of Ethics and Standards of Professional Conduct of the CFA Institute. Accordingly, transactions for client accounts have priority over personal and employee transactions. To avoid any conflict of interest and to be fair to both my individual clients and subscribers, personal and employee trading is restricted to just four weeks a year. Personal and employee trading will occur only during the week following distribution of the newsletter to subscribers unless otherwise approved by the Chief Compliance Officer. The week following distribution of the newsletter will be measured as five business days after the mailing date of the newsletter. Positions may be purchased or sold for individually managed client accounts at any time and without regard to recommendations made in this newsletter.
Page 4 Hendershot Investments, June 2017
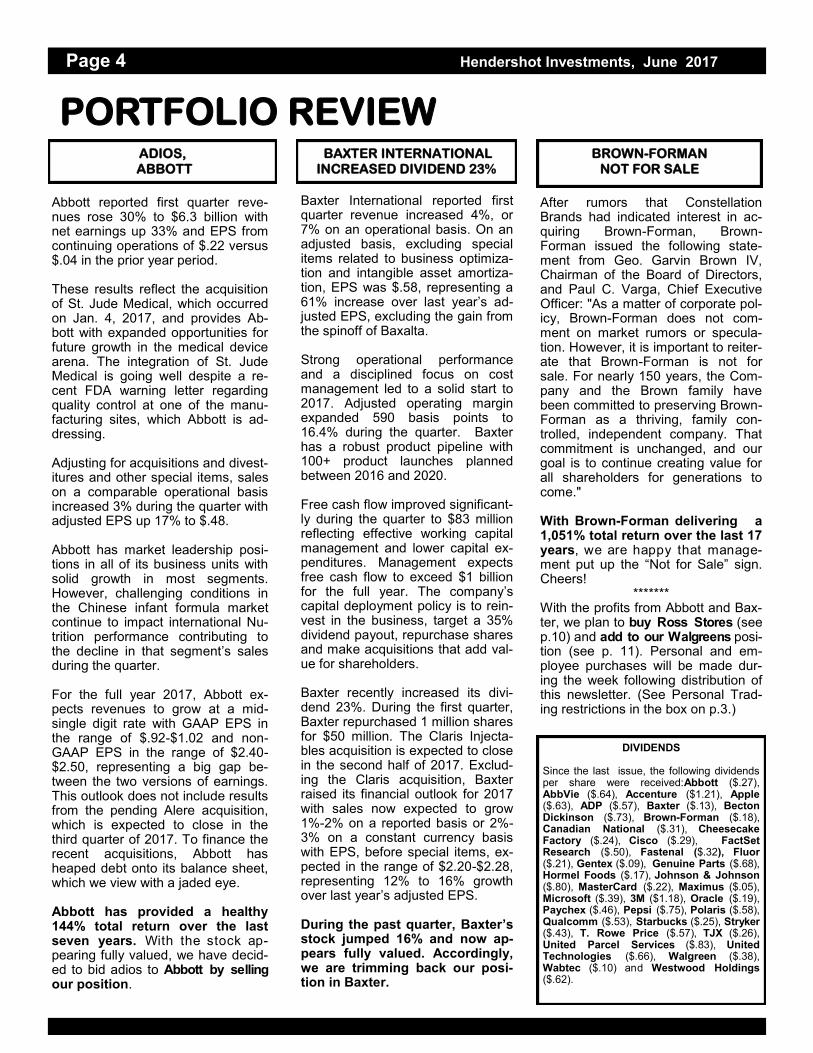
Baxter International reported first quarter revenue increased 4%, or 7% on an operational basis. On an adjusted basis, excluding special items related to business optimiza-tion and intangible asset amortiza-tion, EPS was $.58, representing a 61% increase over last year’s ad-justed EPS, excluding the gain from the spinoff of Baxalta. Strong operational performance and a disciplined focus on cost management led to a solid start to 2017. Adjusted operating margin expanded 590 basis points to 16.4% during the quarter. Baxter has a robust product pipeline with 100+ product launches planned between 2016 and 2020. Free cash flow improved significant-ly during the quarter to $83 million reflecting effective working capital management and lower capital ex-penditures. Management expects free cash flow to exceed $1 billion for the full year. The company’s capital deployment policy is to rein-vest in the business, target a 35% dividend payout, repurchase shares and make acquisitions that add val-ue for shareholders. Baxter recently increased its divi-dend 23%. During the first quarter, Baxter repurchased 1 million shares for $50 million. The Claris Injecta-bles acquisition is expected to close in the second half of 2017. Exclud-ing the Claris acquisition, Baxter raised its financial outlook for 2017 with sales now expected to grow 1%-2% on a reported basis or 2%-3% on a constant currency basis with EPS, before special items, ex-pected in the range of $2.20-$2.28, representing 12% to 16% growth over last year’s adjusted EPS. During the past quarter, Baxter’s stock jumped 16% and now ap-pears fully valued. Accordingly, we are trimming back our posi-tion in Baxter.
PORTFOLIO REVIEW
DIVIDENDS
Since the last issue, the following dividends per share were received:Abbott ($.27), AbbVie ($.64), Accenture ($1.21), Apple ($.63), ADP ($.57), Baxter ($.13), Becton Dickinson ($.73), Brown-Forman ($.18), Canadian National ($.31), Cheesecake Factory ($.24), Cisco ($.29), FactSet Research ($.50), Fastenal ($.32), Fluor ($.21), Gentex ($.09), Genuine Parts ($.68), Hormel Foods ($.17), Johnson & Johnson ($.80), MasterCard ($.22), Maximus ($.05), Microsoft ($.39), 3M ($1.18), Oracle ($.19), Paychex ($.46), Pepsi ($.75), Polaris ($.58), Qualcomm ($.53), Starbucks ($.25), Stryker ($.43), T. Rowe Price ($.57), TJX ($.26), United Parcel Services ($.83), United Technologies ($.66), Walgreen ($.38), Wabtec ($.10) and Westwood Holdings ($.62).
After rumors that Constellation Brands had indicated interest in ac-quiring Brown-Forman, Brown-Forman issued the following state-ment from Geo. Garvin Brown IV, Chairman of the Board of Directors, and Paul C. Varga, Chief Executive Officer: "As a matter of corporate pol-icy, Brown-Forman does not com-ment on market rumors or specula-tion. However, it is important to reiter-ate that Brown-Forman is not for sale. For nearly 150 years, the Com-pany and the Brown family have been committed to preserving Brown-Forman as a thriving, family con-trolled, independent company. That commitment is unchanged, and our goal is to continue creating value for all shareholders for generations to come." With Brown-Forman delivering a 1,051% total return over the last 17 years, we are happy that manage-ment put up the “Not for Sale” sign. Cheers!
******* With the profits from Abbott and Bax-ter, we plan to buy Ross Stores (see p.10) and add to our Walgreens posi-tion (see p. 11). Personal and em-ployee purchases will be made dur-ing the week following distribution of this newsletter. (See Personal Trad-ing restrictions in the box on p.3.)
Abbott reported first quarter reve-nues rose 30% to $6.3 billion with net earnings up 33% and EPS from continuing operations of $.22 versus $.04 in the prior year period. These results reflect the acquisition of St. Jude Medical, which occurred on Jan. 4, 2017, and provides Ab-bott with expanded opportunities for future growth in the medical device arena. The integration of St. Jude Medical is going well despite a re-cent FDA warning letter regarding quality control at one of the manu-facturing sites, which Abbott is ad-dressing. Adjusting for acquisitions and divest-itures and other special items, sales on a comparable operational basis increased 3% during the quarter with adjusted EPS up 17% to $.48. Abbott has market leadership posi-tions in all of its business units with solid growth in most segments. However, challenging conditions in the Chinese infant formula market continue to impact international Nu-trition performance contributing to the decline in that segment’s sales during the quarter. For the full year 2017, Abbott ex-pects revenues to grow at a mid-single digit rate with GAAP EPS in the range of $.92-$1.02 and non-GAAP EPS in the range of $2.40-$2.50, representing a big gap be-tween the two versions of earnings. This outlook does not include results from the pending Alere acquisition, which is expected to close in the third quarter of 2017. To finance the recent acquisitions, Abbott has heaped debt onto its balance sheet, which we view with a jaded eye. Abbott has provided a healthy 144% total return over the last seven years. With the stock ap-pearing fully valued, we have decid-ed to bid adios to Abbott by selling our position.
BROWN-FORMAN NOT FOR SALE
ADIOS, ABBOTT
BAXTER INTERNATIONAL INCREASED DIVIDEND 23%
www.hendershotinvestments.com Page 5
(continued)
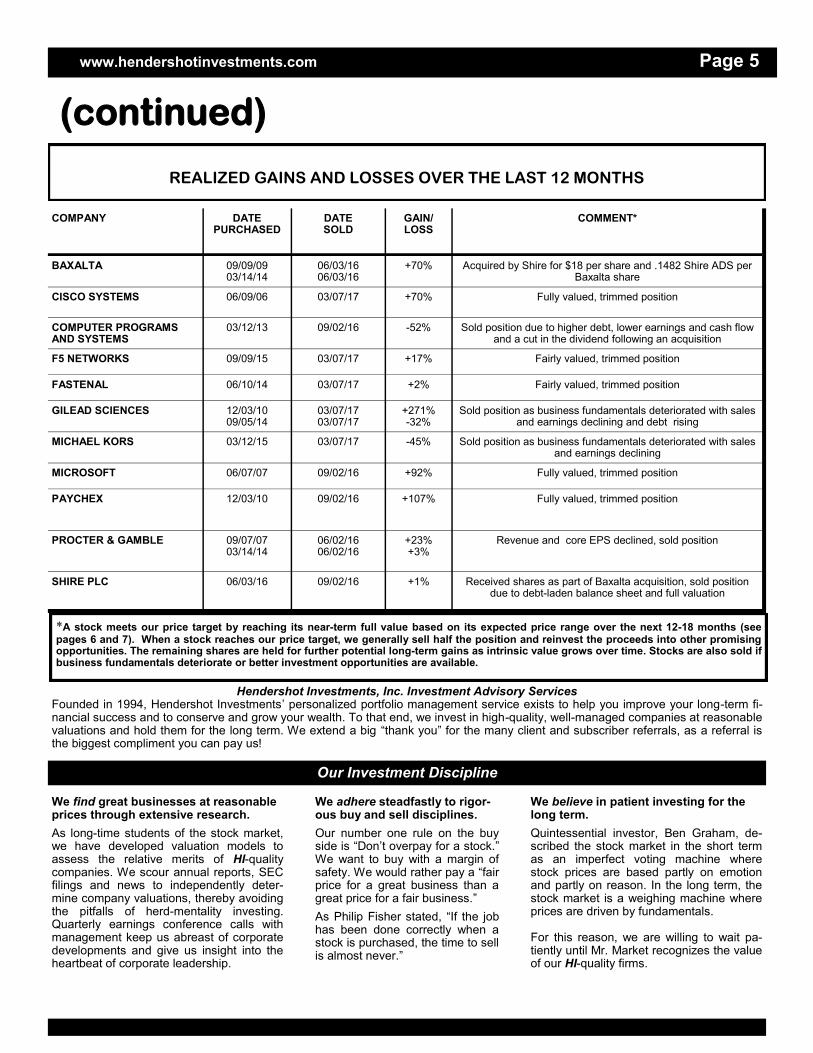
REALIZED GAINS AND LOSSES OVER THE LAST 12 MONTHS
COMPANY DATE PURCHASED
DATE SOLD
GAIN/LOSS
COMMENT*
BAXALTA 09/09/09 03/14/14
06/03/16 06/03/16
+70% Acquired by Shire for $18 per share and .1482 Shire ADS per Baxalta share
CISCO SYSTEMS 06/09/06 03/07/17 +70% Fully valued, trimmed position
COMPUTER PROGRAMS AND SYSTEMS
03/12/13 09/02/16 -52% Sold position due to higher debt, lower earnings and cash flow and a cut in the dividend following an acquisition
F5 NETWORKS 09/09/15 03/07/17 +17% Fairly valued, trimmed position
FASTENAL 06/10/14 03/07/17 +2% Fairly valued, trimmed position
GILEAD SCIENCES 12/03/10 09/05/14
03/07/17 03/07/17
+271% -32%
Sold position as business fundamentals deteriorated with sales and earnings declining and debt rising
MICHAEL KORS 03/12/15 03/07/17 -45% Sold position as business fundamentals deteriorated with sales and earnings declining
MICROSOFT 06/07/07 09/02/16 +92% Fully valued, trimmed position
PAYCHEX 12/03/10 09/02/16 +107% Fully valued, trimmed position
PROCTER & GAMBLE 09/07/07 03/14/14
06/02/16 06/02/16
+23% +3%
Revenue and core EPS declined, sold position
SHIRE PLC 06/03/16 09/02/16 +1% Received shares as part of Baxalta acquisition, sold position due to debt-laden balance sheet and full valuation
Hendershot Investments, Inc. Investment Advisory Services Founded in 1994, Hendershot Investments’ personalized portfolio management service exists to help you improve your long-term fi-nancial success and to conserve and grow your wealth. To that end, we invest in high-quality, well-managed companies at reasonable valuations and hold them for the long term. We extend a big “thank you” for the many client and subscriber referrals, as a referral is the biggest compliment you can pay us!
We find great businesses at reasonable prices through extensive research.
As long-time students of the stock market, we have developed valuation models to assess the relative merits of HI-quality companies. We scour annual reports, SEC filings and news to independently deter-mine company valuations, thereby avoiding the pitfalls of herd-mentality investing. Quarterly earnings conference calls with management keep us abreast of corporate developments and give us insight into the heartbeat of corporate leadership.
We adhere steadfastly to rigor-ous buy and sell disciplines.
Our number one rule on the buy side is “Don’t overpay for a stock.” We want to buy with a margin of safety. We would rather pay a “fair price for a great business than a great price for a fair business.”
As Philip Fisher stated, “If the job has been done correctly when a stock is purchased, the time to sell is almost never.”
We believe in patient investing for the long term.
Quintessential investor, Ben Graham, de-scribed the stock market in the short term as an imperfect voting machine where stock prices are based partly on emotion and partly on reason. In the long term, the stock market is a weighing machine where prices are driven by fundamentals. For this reason, we are willing to wait pa-tiently until Mr. Market recognizes the value of our HI-quality firms.
Our Investment Discipline
*A stock meets our price target by reaching its near-term full value based on its expected price range over the next 12-18 months (see pages 6 and 7). When a stock reaches our price target, we generally sell half the position and reinvest the proceeds into other promising opportunities. The remaining shares are held for further potential long-term gains as intrinsic value grows over time. Stocks are also sold if business fundamentals deteriorate or better investment opportunities are available.

Page 6 Hendershot Investments, June 2017
COMPANY SYMBOL
EXP. ** PRICE
RANGE
PRICE 5-26-17
This year
Actual EPS
Next year Est. EPS
Current
P/E
PRICE/ BOOK VALUE
PRICE/ SALES
DIV.
YIELD
SALES 4-YR
CAGR*
EPS 4-YR
CAGR*
Return
on Equity
Cash/ Equity
Debt/
Equity
Current
Ratio
SALES (000)
AAPL 114-174
153.61 $8.31 $8.93 17.9 6.0 3.7 1.6% 8% 7% 36% 192% 63% 1.0X $215,639,000
ABBV 67-91 66.06 3.63 4.64 17.1 21.0 4.1 3.9 9% 2% 28% 100+ 100+ 1.8 25,638,000
ACN 107-135
122.89 6.45 5.47 20.5 9.6 2.3 2.0 4% 14% 54% 43 0 1.3 32,822,723
ADP 83-109 101.35 3.25 3.71 26.2 11.1 3.9 2.3 7% 8% 33% 73 49 2.2 11,667,800
BAX 39-53 58.64 1.96 2.27 26.9 3.7 3.1 1.1 4% 13% 60% 33 28 2.7 10,163,000
BDX 157-198
186.48 4.49 7.82 31.0 5.2 3.2 1.6 13% -4% 13% 13 119 1.1 12,483,000
BF.B 37-47 51.73 2.61 1.74 19.7 16.8 5.0 1.4 3% 13% 68% 17 141 2.1 4,011,000
BIIB 226-337
250.80 16.93 20.48 15.7 4.7 4.7 - 20% 31% 31% 50 52 2.3 11,448,000
BIVV 51-73 56.73 4.07 2.78 13.9 10.5 6.9 - n/a n/a 16% 61 0 4.9 887,400
BRK.B ! 131-170
165.69 10,693 11,220 23.5 1.4 1.9 - 8% 9% 6% n/a n/a n/a 215,825,000
CAKE 51-70 59.26 2.83 2.99 20.7 4.5 1.2 1.6 6% 12% 23% 11 0 0.6 2,275,719
CNI 70-94 77.01 4.67 5.07 15.9 3.9 4.9 1.7 32% 11% 24% 2 63 0.7 12,037,000
CSCO 25-35 31.50 2.11 1.94 16.0 2.4 3.2 3.7 2% 9% 17% 104 43 3.5 49,247,000
CTSH 62-82 66.79 2.55 3.26 24.3 3.9 2.9 - 16% 10% 14% 48 7 3.6 13,487,000
DIS 94-134 108.41 5.73 5.96 18.9 4.0 3.2 1.5 7% 16% 23% 18 38 0.9 55,632,000
ESRX 68-93 59.76 5.39 5.23 10.9 2.2 0.4 - 2% 32% 21% 20 87 0.7 100,287,500
FAST 40-53 43.47 1.73 1.87 24.8 6.3 3.2 3.0 6% 5% 26% 7 18 4.9 3,962,036
FDS 163-205
161.95 8.19 7.28 18.4 13.0 5.7 1.4 9% 19% 66% 38 74 2.2 1,127,092
FFIV 119-170
127.16 5.38 6.04 21.7 6.9 4.1 - 10% 12% 31% 103 0 1.6 1,995,034
FLR 44-66 44.98 2.00 2.47 26.6 2.0 0.3 1.9 -9% -7% 9% 68 47 1.5 19,036,500
GNTX 15-23 19.15 1.19 1.31 15.4 2.8 3.3 1.9 11% 19% 18% 40 2 4.4 1,678,000
GOOGL!! 713-993
993.27 27.85 33.95 33.6 4.7 7.6 - 18% 13% 14% 64 3 7.1 90,272,000
GPC 79-106 93.28 4.59 4.81 20.2 4.3 0.9 2.7 4% 3% 22% 6 17 1.4 15,339,713
PORTFOLIO FUNDAMENTALS
** Exp. price range—the expected price range for the stock in the next 12-18 months based on our valuation models and the historical trading range of the stock over the last five years. If the current price is below the low end of the expected range, the stock appears undervalued. If the current stock price is above the high end of the expected range, the stock appears overvalued. The expected price range will change based upon company developments. Highlighted stocks appear undervalued or are new additions. !Berkshire price is for the class B shares, the class A shares approximate 1500 times the B shares. !!GOOGL (the original class A share price is used for the table. GOOGL will typically trade slightly higher than the Class C non-voting shares (GOOG).

www.hendershotinvestments.com Page 7
COMPANY SYMBOL
EXP. ** PRICE
RANGE
PRICE 5-26-17
This Year
Actual EPS
Next Year Est. EPS
Current
P/E
PRICE/ BOOK VALUE
PRICE/ SALES
DIV.
YIELD
SALES 4-YR
CAGR*
EPS 4-YR
CAGR*
Return
on Equity
Cash/ Equity
Debt/
Equity
Current
Ratio
SALES (000)
HRL 32-42 33.12 1.64 1.67 19.8 3.7 1.8 2.1% 4% 15% 20% 12% 5% 2.6X $9,523,224
JNJ 95-123 126.92 5.93 7.11 21.3 4.9 4.8 2.6% 2% 11% 24% 56 38 2.5 71,890,000
MA 89-124 121.63 3.69 4.30 31.8 22.9 11.9 .7 10% 14% 72% 137 93 1.8 10,776,000
MMM 135-179
200.67 8.16 8.95 24.3 10.9 4.0 2.4 0% 7% 49% 22 98 2.0 30,109,000
MMS 47-71 62.40 2.69 3.05 18.3 4.9 1.7 .3 23% 25% 24% 12 14 2.1 2,403,360
MSFT 48-65 69.96 2.10 3.03 30.8 7.7 6.3 2.2 4% 1% 23% 181 109 2.8 85,320,000
NKE 49-69 52.59 2.16 2.40 21.9 3.5 2.7 1.4 9% 16% 31% 48 27 3.1 32,376,000
ORCL 40-52 45.26 2.07 2.13 21.5 3.8 5.0 1.4 0% -1% 19% 116 99 4.2 37,047,000
PAYX 49-63 59.28 2.04 2.23 27.6 11.2 7.2 3.1 7% 8% 40% 45 0 1.9 2,950,000
PCLN 1695-2372
1,863.90 42.65 70.62 42.1 8.5 8.5 - 20% 11% 22% 143 67 2.2 10,743,006
PEP 84-107 117.91 4.36 5.14 25.5 14.4 2.7 2.7 -1% 3% 56% 136 257 1.3 62,799,000
PII 72-113 84.74 3.27 4.42 33.8 6.4 1.2 2.7 9% -7% 25% 16 138 1.3 4,516,629
QCOM 48-70 57.52 3.81 2.28 19.2 2.7 3.6 3.9 5% 6% 18% 95 32 2.0 23,554,000
ROST 54-76 63.52 2.83 3.17 21.8 9.0 1.9 1.0 7% 12% 41% 45 14 1.6 12,866,757
SBUX 58-77 63.30 1.90 2.11 31.3 16.3 4.3 1.6 13% 21% 48% 62 70 1.2 21,315,900
SYK 101-130
141.27 4.35 5.83 31.7 5.4 4.7 1.2 7% 6% 17% 34 74 3.9 11,325,000
TJX 76-99 75.53 3.46 3.89 21.5 10.7 1.5 1.7 6% 8% 51% 69 49 1.6 33,183,744
TROW 71-89 69.70 4.75 5.17 13.6 3.4 4.0 3.3 9% 9% 24% 58 0 2.8 4,222,900
UPS 96-119 105.87 3.87 5.95 27.0 162.9 1.5 3.1 3% 47% 100% 100+ 100+ 1.0 60,906,000
UTX 107-141
121.85 6.13 6.58 18.9 3.3 1.7 2.2 3% 6% 20% 24 71 1.2 57,244,000
WAB 72-106 81.25 3.34 3.75 26.3 3.3 2.7 .6 5% 6% 14% 12 76 1.5 2,931,188
WBA 77-99 81.25 3.82 4.97 16.1 2.9 0.7 1.9 13% 12% 14% 39 58 1.6 117,351,000
WHG 47-67 55.52 2.77 2.92 18.1 3.4 4.0 4.5 12% 14% 16% 52 0 5.7 123,021
(continued)
* CAGR-Compound Annual Growth Rate. n/a-not applicable due to financial stock or equity less than zero. Estimated EPS reflects consensus earnings estimate for current fiscal year. The valuation measures (P/E, price-to-book value, price-to-sales and dividend yield) are calculated using the closing price on the date listed in column 3. Balance sheet ratios (cash/equity, debt/equity and current ratio) reflect the latest quarterly financial statements. Return on equity and sales figures are as of the company’s most recent fiscal year end.

Page 8 Hendershot Investments, June 2017
During the past three months, the S&P 500 index rose 2% on encouraging earnings news. The following HI-quality stocks all generated double-digit gains during the same period.
Alphabet reported first quarter revenues rose 22% to $25 billion with net income up 29% to $5.4 billion. On a geographic basis, revenues jumped 25% in the U.S. to $11.8 billion, EMEA revenues rose 13% to $8.1 billion, APAC revenues gained 26% to $3.6 billion and Other Americas revenues increased 34% to $1.3 billion. Google advertising revenues increased 19% to $21 billion. Aggregate paid clicks jumped 44% during the quarter with aggregate cost-per-click down 19% due to the explosion in mobile searches. Operating cash flow increased 25% from last year’s first quarter to $9.5 billion. Google’s capital expenditures increased 18% year-over-year to $2.4 billion as the company continued its investment in the Google cloud and machine learning. Other Bets capital expenditures declined to $170 million, down from $277 million last year, as management paced Other Bets investments. Free cash flow increased 35% to $7 billion with the firm repurchasing $1.1 billion of its own shares during the quarter. Alphabet ended the quarter with $92 billion in cash and marketable securities on its fortress balance sheet. Cash held overseas accounted for about 60% of Alphabet’s total cash hoard. Alphabet’s stock has clicked up a 281% gain over the last six years as the stock price approaches the $1,000 per share milestone. Hold.
Priceline reported first quarter revenues rose 14% to $2.4 billion with net income up 22% to $456 million. First quarter gross travel bookings were $20.7 billion, an increase of 24% over a year ago. Booking.com's total property count now stands at over 1.2 million, which represents a 36% increase over the prior year period. During the quarter, room nights booked increased 27% to 173 million while rental car days grew 15% driven by Rentalcars.com. Free cash flow increased 6% to $310 million with the company repurchasing $212 million of its own shares during the quarter. Management’s outlook is for continued double-digit growth in the second quarter. Priceline’s stock has booked a high-flying 196% gain over the last five years. Buy.
Cognizant Technology Solutions reported first quarter revenues rose 11% to $3.5 billion with EPS up 28% to $.92. These solid results reflected the company’s accelerating shift to digital services and solutions. Growth was broad-based both in business segments and by geographies. Free cash flow rose significantly during the quarter to $161 million thanks to higher earnings and favorable working capital changes. The company spent $1.5 billion on an accelerated share repurchase program during the quarter and also announced its initial quarterly dividend of $.15 per share. Even after the hefty share buyback, Cognizant ended the quarter with a strong balance sheet with $4.3 billion in cash. Consulting Cognizant’s stock price, we are pleased to see it has doubled over the last five years. Buy.
Bioverativ reported healthy first quarter revenue growth of 35% to $259 million. Cash flow from operations more than doubled during the first quarter to $108 million. Bioverativ recently announced the $400 million acquisition of True North Therapeutics, a rare disease biotech firm. Bioverativ’s stock has pumped out an 11% gain since its spinoff from Biogen last quarter. Buy.
Apple reported second quarter revenues rose 5% to $52.9 billion with EPS up 11% to $2.10. Revenue growth accelerated from the December quarter due to continued robust demand for iPhone 7 Plus. Given the strength of the business and management’s confidence in the future, Apple announced another $50 billion increase in their capital return program as management’s goal is to return free cash flow to shareholders. The Board increased the share repurchase authorization $35 billion and increased the dividend 11%, making Apple one of the largest dividend payers in the world. Over the last seven years, Apple has provided a red delicious 346% total return. Hold.
Starbucks reported second quarter revenues rose 6% to $5.3 billion with EPS up 15% to $.45. Global comparable store sales increased 3%. The company repurchased 11.3 million of its shares in the second quarter for $600 million at an average price of approximately $53.10 per share with 99 million shares remaining authorized for future share repurchases. Over the last three years, Starbucks has brewed up a perky 76% total return. Buy.
PORTFOLIO HI-LITES QUARTERLY
MOVERS AND SHAKERS
PRICELINE DOUBLE-DIGIT GROWTH
ALPHABET $92 BILLION IN CASH
COGNIZANT $1.5 BILLION BUYBACK
BIOVERATIV $400 MILLION ACQUISITION
APPLE INCREASED DIVIDEND 11%
STARBUCKS BUYING BACK SHARES

www.hendershotinvestments.com Page 9
(continued)
FactSet reported second quarter revenues rose 4% to $294 million with EPS up 3% to $1.68. Excluding the Market Metrics business which was sold, organic revenues grew 7% with adjusted EPS up 14%. The Board of Directors authorized a $300 million expansion of the share repurchase program and increased the dividend 12%, marking the 12th consecutive year of dividend increases. Over the last six years, FactSet has returned 94% of free cash flow to shareholders through dividends and share repurchases, highlighting the company’s continued commitment to returning value to shareholders. Buy.
Fastenal reported solid first quarter results with revenues up 6% to $1 billion and earnings up 6% to $134 million. This was the strongest first quarter in two years as industrial demand is improving. On the last day of the quarter, Fastenal acquired for $57.9 million Manufacturers Supply Company, an industrial distributor that is generating $50 million in revenue. Fastenal’s free cash flow increased 38% during the first quarter to $189 million, thanks to improved earnings and lower capital expenditures. Buy.
F5 Networks reported second fiscal quarter sales increased 7% to $518 million with EPS storming ahead 29% to $1.43. Sales growth was powered by new products and strong U.S. enterprise and service provider sales. F5 Networks ended the quarter with $1.2 billion of cash on its weather-resistant balance sheet after repurchasing $150 million of its stock during the quarter. Buy.
Disney reported second quarter sales increased 3% to $13.3 billion with EPS up 15% to $1.50. Growth was driven by Parks and Resorts with segment operating income increasing a magical 20% thanks in large part to the Shanghai Disney Resort, which expects to soon welcome its ten millionth guest. During the quarter, Disney generated $2.6 billion in free cash flow, up 7% year-over-year. The company ended the quarter with about $8 billion in cash and investments and $17 billion in long-term debt, which represented about 36% of shareholders’ equity. During the quarter, Disney repurchased 18.6 million shares for $2 billion at an average price of about $107.53 per share. The company now expects to repurchase $9 billion to $10 billion of its shares during fiscal 2017, which is no Mickey Mouse share buyback program. Disney expects modest growth for fiscal 2017 with robust growth returning in fiscal 2018. Buy.
Westwood reported first quarter revenue rose 12% to $32.6 million with net income up 72% to $6.1 million. The increase in revenues was related to higher average assets under management (AUM) which increased 5% from the prior year to end the quarter at $22.1 billion. The company ended the quarter with a strong balance sheet with no long-term debt and more than $75 million in cash and investments or $8.48 per share in cash. The company paid out $6.5 million in dividends during the quarter, a 15% increase over the prior year, with the dividend currently yielding an attractive 4.5%. Buy.
Maximus reported second quarter revenue grew 3% to $622 million driven by 6% growth in the Health Services Segment to $349 million. The company’s net income rose 8% during the quarter to $52.5 million with earnings per share up 8% to $.80 due to favorable results on several volume-based contracts in both the U.S. Federal Services and Health Services business segments. Excluding special items from the second quarter of fiscal 2016, year-over year revenue grew 5% and adjusted diluted earnings per share jumped 38%. During the second quarter of fiscal 2017, Maximus generated strong cash flows from operations of $65.7 million and free cash flow of $60.5 million. During the first half of fiscal 2017, the company paid $5.8 million in dividends and repurchased $5.9 million of common stock. The company has $109 million remaining authorized for future share repurchases. Year-to-date, signed contract awards at 3/31/17 totaled $1.5 billion and included a three-year contract extension with the State of New York. New contracts pending (awarded but unsigned) totaled $155.1 million. The sales pipeline at 3/31/17 was $3.3 billion, comprised of approximately $600 million in proposals pending, $900 million in proposals in preparations and $1.9 billion in opportunities tracking. Maximus reiterated its 2017 revenue guidance of $2.425 billion to $2.475 billion and narrowed EPS guidance from $2.90-$3.10 to $3.00-$3.10. The company is also reaffirming free cash flow guidance in the range of $170 million to $220 million, representing 27% to 64% growth in free cash flow over last year. Hold.
QUARTERLY RATING CHANGE FROM HOLD TO BUY
FACTSET INCREASED DIVIDEND 12%
WALT DISNEY NO MICKEY MOUSE BUYBACK
QUARTERLY RATING CHANGE FROM BUY TO HOLD
MAXIMUS MAXIMIZING CASH FLOWS
FASTENAL FREE CASH FLOW UP 38%
WESTWOOD DIVIDEND YIELDS 4.5%
F5 NETWORKS HOLDS $1.2 BILLION IN CASH

Page 10 Hendershot Investments, June 2017
MARKET LEADER Ross Department Store was first opened in San Bruno, California, in 1950 by Morris Ross. In 1958, Ross sold his store to William Isaacson who built the company to six stores located in the San Francisco Bay Area. In 1982, a group of investors purchased the six Ross Department Stores and changed the format to off-price retail units. Thirty-five years later, the chain has expanded to 1,363 stores in 37 states with sales approaching $13 billion. In 2004, Ross Stores launched dd’s DISCOUNTS, which targeted customers from households with more moderate income compared to Ross customers. The company’s focus has been on bringing customers a constant stream of high-quality department and specialty store brands at extraordinary savings. The rapidly changing merchandise assortment, with shipments typically arriving three to six times per week, provides the customer a “treasure hunt” shopping experience with the core customer returning two to three times per month. As a leading off-price retail chain, Ross is able to negotiate the best deals for the top brands and latest fashions from their 8,000 vendors. The company is able to provide additional value to their customers and their bottom line by offering a no-frills shopping experience with low-cost displays and fixtures. OUTSTANDING PROFITABILITY
Ross is highly profitable with a stylish fiscal 2016 return on shareholders’ equity of 42.8% and a trendy 44.3% average return on equity during the last five years. Net profit margins have steadily expanded over the last five years from 8.1% to 8.7% in 2016. The
NEW STOCK ROSS STORES, INC. (ROST—$63.52)
5130 Hacienda Drive, Dublin, California 94568 www.rossstores.com
consistent long-term profitability showcases management’s ability to navigate a challenging retail environment amid wage inflation headwinds.
STEADY GROWTH Ross Stores has generated steady sales and EPS growth over the last five years with growth compounding at 7% and 12% annual rates, respectively. In fiscal 2016, 87 new stores were opened and same-store sales increased 4%, contributing to 8% total revenue growth for the year. Ross was able to grow sales despite a difficult retail landscape which saw department store retail sales decline nearly 6% during calendar 2016. Revenue growth for fiscal 2017 is expected to be in the high single-digit range with 90 new stores expected to open. In fiscal 2017, Ross plans to allocate $400 million of capital to open the new stores and enhance existing stores, distribution, transportation and information systems. Management’s long-term strategy is to grow its store base from its current 1,363 stores to 2,500 stores based on their proven ability to cluster stores closer together and fully saturate existing and new markets.
STRONG CASH FLOWS Free cash flow for fiscal 2016 was $1.3 billion up more than 30% over the prior year with a four-year compounded annual growth rate of 23%. Ross Stores ended 2016 with $1.1 billion of cash and short-term investments and $396 million of long-term debt on its thrifty balance sheet. The company completed a two-year $1.4 billion share repurchase program during 2016 by buying back 11.6 million shares for $700 million at an average price of $60.35 per share. In Feb. 2017, the Board of Directors approved a two-year $1.75 billion stock repurchase program for fiscal 2017 and 2018, which represents about 6% of the company’s current market value. At the same time, the Board approved a 19% increase in the cash dividend to an annualized $.64 per share. This marks the 23rd consecutive annual dividend increase reflecting management’s confidence in future growth prospects and a continued commitment to enhancing shareholder value. Long-term investors seeking to outfit their portfolio with a HI-quality market leader with outstanding profitability, steady growth and strong cash flows should consider adding Ross Stores to their shopping list. Buy.
Ross Dress for Less is a leading off-price apparel and home fashion chain in the U.S. with 1,363 stores in 37 states, the District of Columbia and Guam. Ross Stores sells name brand and designer apparel, accessories, footwear and home fashions at savings of 20% to 60% off department and specialty store regular prices every day. The company also operates 198 dd’s DISCOUNTS stores in 15 states that feature more moderately-priced goods.
Fiscal Year January
4-YR CAGR
2016
2015
2014
2013
2012
Sales (000)
7.3% $12,867 $11,940 $11,042 $10,230 $9,721
Net Income (000)
9.2% $1,118 $1,021 $925 $837 $787
EPS 12.4% $2.83 $2.51 $2.21 $1.94 $1.77
Dividend 15.8% $.54 $.47 $.40 $.26 $.30
Profit Margin 8.7% 8.6% 8.4% 8.2% 8.1%

www.hendershotinvestments.com Page 11
MARKET LEADER In 1849, John Boot opened the first Boots store in Nottingham, UK selling herbal remedies. Eleven years later John Boot died and his 10-year-old son, Jesse Boot, helped his mother run the family's herbal medicine shop with the company opening its 1,000
th UK store in 1933.
On the other side of the Atlantic, in 1901, Charles R. Walgreen, Sr. purchased the Chicago drugstore where he had worked as a pharmacist for $6,000. In 1984, Walgreens opened its 1,000
th store
in the U.S. Walgreens and Alliance Boots combined in December 2014, bringing together two leading firms with iconic brands, complementary geographic footprints, shared values and a heritage of trusted healthcare services dating back more than a century. The combined company boasts more than 13,000 stores in 11 countries. To gain distribution efficiency and manufacturer pricing leverage in a competitive market, Walgreens Boots Alliance recently took an equity stake in AmerisourceBergen — a major U.S. pharmaceutical distributor — and agreed to buy rival drugstore chain Rite Aid. In response to the Federal Trade Commission’s store divestiture requirements, Walgreens Boots Alliance’s offer has been reduced from $9 per Rite Aid share to $6.50 to $7 per share, valuing the deal between $6.8 billion to $7.4 billion, which is now expected to close in late July.
ROBUST CASH FLOWS Walgreens Boots Alliance’s strong cash flow and sturdy balance sheet provides the wherewithal to make this and other strategic deals possible while also returning cash to shareholders. During fiscal 2016, Walgreens Boots Alliance generated
UNDER THE SPOTLIGHT WALGREENS BOOTS ALLIANCE (WBA-$81.25)
108 Wilmot Road, Deerfield, IL 60015 www.walgreensbootsalliance.com
$6.5 billion in free cash flow with the company paying nearly $1.6 billion in cash dividends and returning $1.2 billion to shareholders through share repurchases. As of 2/28/2017, the company reported about $12 billion of cash on its healthy balance sheet, more than enough cash on hand to pay for the Rite Aid acquisition. Fiscal year-to-date, free cash flow increased 13% to $2.7 billion. During the first half of this fiscal year, the company returned $1.3 billion to shareholders through cash dividends of $817 million and shares buybacks of $457 million. In April, Walgreens Boots Alliance announced a new $1 billion share buyback program, initiated in response to its robust year-to-date free cash flow and the revised consideration for the Rite Aid merger. HEALTHY LONG-TERM GROWTH
Walgreens has a solid record of consistent growth with sales compounding at a 13% annual clip during the past five years and net earnings growing at an even healthier 18% annual rate. Amid a challenging retail environment, the firm rang up sales of $57.9 billion during the first half of fiscal 2017, down 2% year-over-year, or up 1% on a constant currency basis. Net earnings and EPS each increased 4% to $2.1 billion and $1.94,
respectively. Second quarter U.S. Pharmacy sales, which accounted for 66.5% of Walgreens’ sales in the quarter, increased 3.7% on a 4.2% jump in comparative store sales. Prescriptions filled in comparable stores increased 8%, the highest comp growth in more than seven years. U.S. “front end” retail sales dropped nearly 3% as declines in general merchandise and personal care were partially offset by solid growth in the health and wellness and beauty categories. Walgreens continued its efforts to boost retail sales by expanding and revamping its beauty offerings in 2,000 stores last year with 1,000 more expansions expected this year. Second quarter Retail Pharmacy International sales of $3.1 billion fell 14.5% on a 3.7% comp store decline, hurt by foreign currency and lower pharmacy funding by the British government. Walgreens maintained its fiscal 2017 guidance of $4.90 to $5.08 adjusted EPS, up 7% to 11% from fiscal 2016. Long-term investors seeking a profitable prescription should consider Walgreens Boots Alliance, a HI-quality market leader with robust cash flows and healthy long-term growth. Buy.
Walgreens Boots Alliance is the world’s leading pharmacy-led health and well-being retailer, through its network of over 13,200 stores in 11 countries. In addition, the company provides one of the largest global pharmaceutical wholesale and distribution networks with over 390 distribution centers delivering to more than 230,000 healthcare providers annually in more than 20 countries. The company’s portfolio of retail brands includes Walgreens, Duane Reade, Boots and Alliance Healthcare. Global health and beauty brands include No7, Botanics, Liz Earle and Soap & Glory.
Fiscal Year August
4-YR CAGR
2016
2015
2014
2013
2012
Sales (000,000)
13.1% $117,351 $103,444 $76,392 $72,217 $71,633
Net Income (000,000)
18.4% $4,173 $4,220 $1,932 $2,548 $2,127
EPS 12.1% $3.82 $4.00 $2.00 $2.67 $2.42
Dividend 11.3% $1.46 $1.37 $1.28 $1.14 $0.95
Profit Margin 3.6% 4.1% 2.5% 3.5% 3.0%
Page 12 Hendershot Investments, June 2017
SUBSCRIPTION INFORMATION Hendershot Investments is published quarterly by Hendershot Investments, Inc., 11321 Trenton Court, Bristow, VA 20136. Phone: (703)-361-6130. Subscription price: $50 per year. Photocopying, reproduction or quotation is strictly prohibited without written permission. Information presented here was obtained from sources believed to be reliable but accuracy and completeness and opinions based on this information are not guaranteed. It should not be assumed that recommendations will be profitable or will equal the performance of securities listed here or recommended in the past. All data, information and opinions expressed are subject to change without notice. Further information on companies mentioned in this newsletter is available upon request.
SUBSCRIPTION INFORMATION Hendershot Investments is published quarterly by Hendershot Investments, Inc., 11321 Trenton Court, Bristow, VA 20136. Phone: (703)-361-6130. Subscription price: $50 per year. Photocopying, reproduction or quotation str ictly prohibited without wr itten permission. Information presented here was obtained from sources believed to be reliable but accuracy and completeness and opinions based on this information are not guaranteed. It should not be assumed that recommendations will be profitable or will equal the performance of securities listed here or recommended in the past. All data, information and opinions expressed are subject to change without notice. Further information on companies mentioned in this newsletter is available upon request.
and we thought repurchases had a
price that was still attractive to continuing shareholders and was feasible in a substantial sum, that could make a lot of sense. The last thing we like to do is own something at 100 times earnings [like Treasury bills] where the earnings can’t grow. It’s kind of a lousy business. We don’t like that. We shouldn’t use your money that way for long periods of time. Are we going to be able to deploy it? I would say history is on our side, but it would be more fun if the phone rang instead of just relying on history books. I am sure that sometime in the next ten years, and it could be next week or nine years from now, there will be markets in which we could do intelligent things on a big scale. It would be no fun if it happened to be nine years off. I don’t think it will be based on how humans behave, the government behaves and the world behaves, but at a point, the burden of proof really shifts to us big time. Three years from now, we cannot come back here holding $150 billion in cash.” (Munger noted later in the meeting that a $150 billion deal might be the limit for Berkshire to swallow at the current time.)
APPLE After famously avoiding technology investments, Buffett said, “Fairly recently, we took a large position in Apple, which I do regard more as a consumer goods company in terms of certain economic characteristics. It has a huge tech component in terms of what that product can do or what other people might come along to do to leapfrog it in some way. I certainly can get a lot of information on consumer behavior and then try to draw inferences as to what consumer behavior is likely to be in the future.” Charlie Munger noted, “I think it’s a very good sign that you bought Apple. It shows either one of two things. Either you’ve gone crazy or you’re learning. I prefer the learning explanation.” Buffett laughed, “So do I, actually.”
SUBSCRIPTION INFORMATION Hendershot Investments is published quarterly by Hendershot Investments, Inc., 11321 Trenton Court, Bristow, VA 20136. Phone: (703)-361-6130. Subscription price: $50 per year. Photocopying, reproduction or quotation is strictly prohibited without written permission. Information presented here was obtained from sources believed to be reliable but accuracy and completeness and opinions based on this information are not guaranteed. It should not be assumed that recommendations will be profitable or will equal the performance of securities listed here or recommended in the past. All data, information and opinions expressed are subject to change without notice. Further information on companies mentioned in this newsletter is available upon request.
IDEAL BUSINESS With Berkshire’s substantial cash flows, Buffett was asked if investing in capital-light businesses were better than capital-intensive businesses like the railroad and utilities. Buffett answered, “There’s no question that buying a high return on assets and very light capital-intensive business that is going to grow, beats the hell out of buying something that requires a lot of capital to grow. And this varies from day to day – but I believe that probably the five largest American companies by market cap [Apple, Alphabet, Microsoft, Amazon, and Facebook] have a market value over two and half trillion dollars, which is probably getting up close to 10% of the whole market cap of the U.S. If you take those five companies, essentially you could run them with no equity capital at all. There’s no question that a business that doesn’t take any capital and grows almost infinite returns and doesn’t require equity capital is the ideal business. We aren’t seeing those that we can buy. You’re absolutely right, that’s a far, far better way of laying out money than what we are able to do when buying capital-intensive businesses.” Charlie Munger agreed, “The world has changed a lot, and the people who made the right decisions of getting into these new businesses [Apple and Google] that are so different from the old ones have done very well. It’s a wonderful field, but not everybody is going to win big in it. A few will win big.”
AJIT JAIN GRABBING BILLIONS When asked if Ajit Jain, an insurance executive at Berkshire Hathaway, were to retire, what would be the effect on Berkshire’s insurance operations, Warren Buffett replied, “No one could possibly replace Ajit. We have a terrific operation in insurance outside of Ajit, and it’s terrific-squared with Ajit. There are things only he can do, but there are a
lot of things that are institutionalized in our insurance business where we’ve got extraordinarily able management. Ajit has made more money for Berkshire than I have probably. We still have what I would consider the world’s best property casualty insurance operation, even without him, and with him, I don’t think anybody comes close. We have $105 billion in insurance float. It is a good business when people pay you to hold and invest that money.” Charlie Munger added, “A few years ago, California made a little change in its workmen’s compensation law. Ajit saw instantly that it caused the underwriting results to change drastically. We went to 10% of the market which is big. He grabs a couple billion dollars at least out of the air. We don’t have a lot of people like Ajit. It’s hard to snap your fingers and grab a couple billion dollars out of the air.”
ALLOCATING $100 BILLION With about $100 billion in cash, Buffett was asked if he would increase the multiple Berkshire would pay for share buybacks from the current limit of 1.2 times book value. Buffett responded, “When the time comes, and it could come reasonably soon, even while I’m around. But if we really don’t think we can get the money out in a reasonable period of time into things we like, we have to re-examine then what we can do with the funds that we don’t think could be deployed well. At that time, we have to make a decision. It might include both repurchases and dividends. There are inferences that people draw from a dividend policy, different than from a repurchase policy, in terms of expectations that you won’t cut a dividend. You have to factor that all in. If we felt we had excess cash that was unlikely to be used in a reasonable period of time,
SUBSCRIPTION INFORMATION Hendershot Investments is published quarterly by Hendershot Investments, 11321 Trenton Court, Bristow, VA 20136. 703-361-6130. Subscription price: $50 per year. Photocopying, reproduction or quotation str ictly prohibited without written permission. Information presented here was obtained from sources believed to be reliable but accuracy and completeness and opinions based on this information are not guaranteed. It should not be assumed that recommendations will be profitable or will equal the performance of securities listed here or recommended in the past. All data, information and opinions expressed are subject to change without notice. Further information on companies mentioned in this newsletter is available upon request.
BERKSHIRE HATHAWAY NOTES (CONTINUED FROM PAGE ONE)