berth deepening eia visual impact assessment of... · 2010-10-20 · berth deepening eia visual...
TRANSCRIPT

Berth Deepening EIA
Visual Impact Assessment
Report Prepared for
Transnet
Report No: 367079/VIA January 2007

Berth Deepening EIA
Visual Impact Assessment
Transnet
SRK Project Number 367079/VIA SRK Consulting
The Administrative Building Albion Springs
183 Main Road, Rondebosch Cape Town
South Africa
Post Box Suite #206 Private Bag X18
7701, Rondebosch South Africa
Tel: (021) 659-3060
Fax: (021) 685-7105
Belinda Gebhardt [email protected]
January 2007
Compiled by: Reviewed by: _________________________ _________________________ Project Consultant Project Reviewer
Authors: S Reuther, BL Gebhardt

Table of Contents
1 Introduction..................................... ................................................................................4 1.1 Scope of Work .................................................................................................................... 5 1.2 Assumptions and Limitations .............................................................................................. 5 1.3 Methodology ....................................................................................................................... 5
2 Description of the Visual Environment............ ............................................................7 2.1 Cape Town and the Port of Cape Town ............................................................................. 7 2.2 Visual Character and Sense of Place ................................................................................. 9
3 Project Description .............................. ........................................................................11 3.1 Deepening the BSD Basin and Berths 601-604 ............................................................... 11 3.2 Widening the Deck of Berths 601-604 .............................................................................. 12
4 Visual Impact Assessment......................... .................................................................14 4.1 Visual Impact Sources ...................................................................................................... 14
4.1.1 Dredging and Dumping Plumes ..........................................................................................14 4.1.2 Deck Construction Activities................................................................................................16 4.1.3 New Crane Installations ......................................................................................................17
4.2 Visual Absorption Capacity............................................................................................... 19 4.3 Affected View Points......................................................................................................... 19
4.3.1 Hotels near the V&A Waterfront..........................................................................................20 4.3.2 De Waal Drive.....................................................................................................................21 4.3.3 N2 .......................................................................................................................................22 4.3.4 Signal Hill............................................................................................................................23 4.3.5 Table Mountain ...................................................................................................................24
4.4 Affected Viewers and Their Sensitivity ............................................................................. 27 4.5 Visual Integration with the Existing Landscape ................................................................ 28 4.6 Rating of Impacts.............................................................................................................. 29
4.6.1 Dredging and Dumping Plumes ..........................................................................................29 4.6.2 Deck Construction Activities................................................................................................30 4.6.3 New Crane Installations ......................................................................................................30
4.7 Mitigation Measures.......................................................................................................... 31
5 Conclusion ............................................................................................................................................32

The Administrative Building, Albion Spring, 183 Main Road, Rondebosch 7700 Cape Town Postnet Suite #206 Private Bag X18 Rondebosch 7701 South Africa e-Mail: [email protected] URL: http://www.srk.co.za
Tel: +27 (21) 659 3060 Fax: +27 (21) 685 7105
VIA Berth Deepening FINAL.doc
Partners MJ Braune, JM Brown, JAC Cowan, CD Dalgliesh, T Hart, PR Labrum, LGA Maclear, RRW McNeill, HAC Meintjes, BJ Middleton, MJ Morris, GP Murray, GP Nel, VS Reddy, PN Rosewarne, PE Schmidt, PJ Shepherd, AA Smithen, , PJ Terbrugge, KM Uderstadt, DJ Venter, HG Waldeck, A Wood
Directors AJ Barrett, PR Labrum, BJ Middleton, MJ Morris, PE Schmidt, PJ Terbrugge, MB Zungu, S Mayekiso
Associates JCJ Boshoff, SA McDonald, DM Duthe, R Gardiner, WA Naismith, JP Odendaal, VM Simposya, D Visser, AC White, AC Woodford
Consultants AC Burger, BSc (Hons); IS Cameron-Clarke, PrSci Nat, MSc; JH de Beer, PrSci Nat, MSc; GA Jones, PrEng, PhD; WD Ortlepp, PrEng, Meng; TR Stacey, PrEng, DSc; OKH Steffen, PrEng, PhD; RJ Stuart, PrTech Eng, GDE; DW Warwick, PrSci Nat, BSc (Hons)
Corporate Shareholder: Kagiso Enterprises (Pty) Lt d
SRK Consulting (South Africa) (Pty) Ltd
Reg No 1995.012890.07
Cape Town +27 (0) 21 659 3060
Durban +27 (0) 31 279 1200
East London +27 (0) 43 748 6292
Harare +263 (4) 496 182
Johannesburg +27 (0) 11 441 1111
Pietermaritzburg +27 (0) 33 345 6311
Port Elizabeth +27 (0) 41 581 1911
Pretoria +27 (0) 12 361 9821
Rustenburg +27 (0) 14 594 1280
367079/VIA January 2007
Berth Deepening EIA: Visual Specialist Study
1 Introduction
The various shipping lines that form part of the South African European Communities Service
Conference, and others, have indicated that they will be investing in new generation container liner
vessels. Some of these new vessels have working draughts in excess of what can currently be
accommodated by the depth of the Ben Schoeman Dock (BSD) in the Port of Cape Town. As such,
new infrastructure has to be created to accommodate these vessels (i.e. greater basin depth). In
addition, due to the width of these new container vessels, ship to shore gantry cranes, with longer
reaches, are required. The present quay width cannot accommodate these new generation gantry
cranes1, and the quay will thus need to be extended (widened) to accommodate the new cranes.
As part of a programme for the expansion of the Port of Cape Town, the National Ports Authority of
South Africa (NPA), a division of Transnet Limited (“Transnet”), proposes to deepen the BSD
within the Port of Cape Town and to implement alterations to berths 601, 602, 603 and 604 of the
BSD.
SRK Consulting (SRK) is undertaking the Environmental Impact Assessment (EIA) for the proposed
alterations of the BSD. This visual specialist study has been commissioned as part of a suite of
specialist studies informing the Ben Schoeman Dock EIA, to assess the potential visual impacts of
the proposed project.
1 Shangoni (2005). Final Scoping Report: Proposed Alterations to Berths 601, 602, 603 & 604 and Associated Deepening
of the Ben Schoeman Dock at the Port of Cape Town.

SRK Consulting Page 5
REUT/GEBH VIA Berth Deepening FINAL.doc January 2007
1.1 Scope of Work
The Terms of Reference (ToR) and Scope of Work of the visual specialist study were laid out in the
appointment letter dated 21 September 2006 and encompass the following:
1. Provide an overview of existing visual conditions in the affected environment;
2. Identify potentially affected parties and view points;
3. Identify the sources of the visual impacts, (including dredging activities);
4. Where required, identify the need for mitigation and suggest methods to achieve this; and
5. Conform to any relevant guidelines for specialist studies issued by the Department of
Environmental Affairs and Development Planning (D:EA&DP).
1.2 Assumptions and Limitations
The following assumptions and limitations are applicable to this study:
• Visual impact assessment is not, by its nature, a purely objective, quantitative process, and
depends to some extent on subjective judgments. Where subjective judgments are required,
appropriate criteria and motivations have been clearly stated;
• The assessment has been based on background information supplied by Transnet regarding the
proposed development;
• The drawings (including design, layout and height of the cranes and berth extension) were
supplied by Transnet and are assumed to be accurate; and
• Data and information pertaining to the visibility of the plume and plume modelling2 was
supplied by the CSIR and are assumed to be accurate.
This specialist study does not provide motivation for or against the proposed project, but rather seeks
to give insight into the visual character and quality of the area, its visual absorption capacity and the
potential significance of the visual impacts created by the proposed project in order to evaluate these
impacts from a visual perspective. However, in the event that unacceptable visual impacts are
identified, this will be clearly indicated in the report.
1.3 Methodology
To meet the Terms of Reference, the following methodology was applied:
• All the required data were collected as accurately and thoroughly as possible;
• Fieldwork was conducted to gather photographic references of the visibility of the sites from
key view points and visual corridors;
• The magnitude or intensity of the visual impacts for the port works and the alternative
dredge disposal sites was determined through analysis and synthesis of the following factors:
− Visibility;
− Visual absorption capacity;
2 Assumptions and limitations relevant to the CSIR modelling and data are also relevant to this report. Please refer to “Ben Schoeman Dock Berth Deepening Project Integrated Marine Impact Assessment Study” CSIR Report No CSIR/NRE/ECO/ER/2006/Draft.
SRK Consulting Page 6
REUT/GEBH VIA Berth Deepening FINAL.doc January 2007
− Landscape / townscape integrity; and
− Sensitivity of viewers.
• The significance of the visual impacts was then assessed, making use of the prescribed EIA
methodology. The significance rating methodology is described in detail in Annexure 1.
• Mitigation measures for the reduction of the significance of negative impacts were
identified where possible.

SRK Consulting Page 7
REUT/GEBH VIA Berth Deepening FINAL.doc January 2007
2 Description of the Visual Environment
2.1 Cape Town and the Port of Cape Town
The BSD is located within the Port of Cape Town, which is situated at the southern shore of Table
Bay, to the north-east of Cape Town Central Business District (CBD) and north of Table Mountain.
The mountains surrounding the city and Table Bay provide a number of viewpoints over the bay,
which includes the port. These view points include the tops of Table Mountain (accessible on foot or
by cable car), Lion’s Head (accessible on foot) and Signal Hill (accessible by car) (see Figure 2-1).
Figure 2-1: Location of the Port of Cape Town
The city of Cape Town, and the area around the port in particular, accommodates a number of
different activities and users that influence the sense of place at a micro and macro scale. Areas
outside of, but adjacent to the Port of Cape Town to the east and south, particularly Paarden Island
and Beach Road in Woodstock, are industrial in nature. Areas located further to the south and south-
west, including Woodstock, Zonnebloom, the Central Business District (CBD) and the V&A
Waterfront, are dominated by residential and commercial uses (see Figure 2-2). The Salt River Canal
enters Table Bay in Paarden Island and further north-east, between Brooklyn and Woodbridge
Island, the Diep River estuary opens out to the sea. Further along the eastern shoreline the land use is
predominantly residential and recreational.
The Port of Cape Town itself is a working harbour with a long history, as the first port in Table Bay
was established in the 1600s by the Dutch East India Company to serve ships sailing around the
Horn of Africa. The port is now a modern harbour serving Cape Town and its hinterland. It is
equipped with an extensive industrial infrastructure designed to accommodate, load and offload
vessels with a wide range of sizes and cargoes. The port has three docks or basins, namely:
• Victoria Basin – mainly accommodating passenger and fishing vessels and surrounded by the
V&A Waterfront, a major attraction for tourists and residents;
• Duncan Dock – fresh-produce terminal and multi-purpose dock; and
• Ben Schoeman Dock – mainly accommodating container vessels.
Port of Cape Town
Cape Town CBD
Table Mountain
V&A Waterfront
BSD
Signal Hill
Lion’s Head
Paarden Island

SRK Consulting Page 8
REUT/GEBH VIA Berth Deepening FINAL.doc January 2007
The BSD is located at the north-eastern end of the harbour, the furthest away from the commercial
and residential areas of the V&A Waterfront clustered around the Victoria basin at the western end
of the harbour (see Figure 2-3).
Figure 2-2: Area surrounding the Port of Cape Town
Figure 2-3: Location of the Ben Schoeman Dock within the Port of Cape Town
Industrial
Industrial
Residential
Commercial/ Residential
Commercial/ Residential
Ben Schoeman Dock
Berths 601-604
Duncan Dock
Victoria Basin
NPA Building
Port Administration Building
Culemborg Site

SRK Consulting Page 9
REUT/GEBH VIA Berth Deepening FINAL.doc January 2007
The BSD measures approximately 113 ha and has 12 berths at which ships can dock3. Infrastructure
currently in place at the BSD includes crane rails running parallel to berths 600 – 604, gantry cranes
that can move along the rail to offload container vessels docked in these berths, container storage
space on berth decks to the north-east, south-east and south-west of the BSD and lighting (see Figure
2-4 and Figure 2-5).
Figure 2-4: View of the BSD from the top of the Port Adminis tration building towards the south-west
Figure 2- 5: View of the BSD from the top of the Port Admini stration building towards the north-east
2.2 Visual Character and Sense of Place
Aesthetic value is an emotional response derived from our experience and perceptions. As such, it is
subjective and difficult to quantify in absolute terms. Additionally our sense of a place depends not
only on spatial form and quality but also on culture, temperament, status, experience and the current
purpose of the observer4. Central to the idea of ‘sense of place’ (or Genius Loci) is identity. An area
will have a stronger sense of place if it can easily be identified, that is to say, if it is unique and
distinct from other places. Lynch (1992) defines ‘sense of place’ as “the extent to which a person can
3 Four berths are used for cargo handling and the remainder are used for lay-up and ship repair. 4 Lynch (1992).

SRK Consulting Page 10
REUT/GEBH VIA Berth Deepening FINAL.doc January 2007
recognise or recall a place as being distinct from other places – as having a vivid or unique, or at
least a particular, character of its own”5.
The Port of Cape Town has a unique sense of place or strongly defined visual character. This is
created by the activities of the working harbour, with the associated visual elements such as the
stacks of containers, gantry cranes and shipping vessels. This is complimented by the backdrop of
the surrounding (visually appealing) mountains and sea.
Overall the sense of place is one of a working harbour in a visually appealing context, which creates
a visual character that is industrial but congruent.
5 Lynch (1992).
SRK Consulting Page 11
REUT/GEBH VIA Berth Deepening FINAL.doc January 2007
3 Project Description
Transnet proposes to undertake the following activities at the BSD within the Port of Cape Town:
1. Deepening the BSD basin and berths 601 – 604;
2. Construction of a new deck quay structure, which will extend 10 m beyond the existing berths
601 – 604; and
3. Installing new cranes.
The dredge material will be disposed of at disposal (dump) sites located west of Table Bay. The
proposed activities, as they relate to visual impacts, are described in more detail below. A detailed
project description is provided in the Berth Deepening Environmental Impact Report.
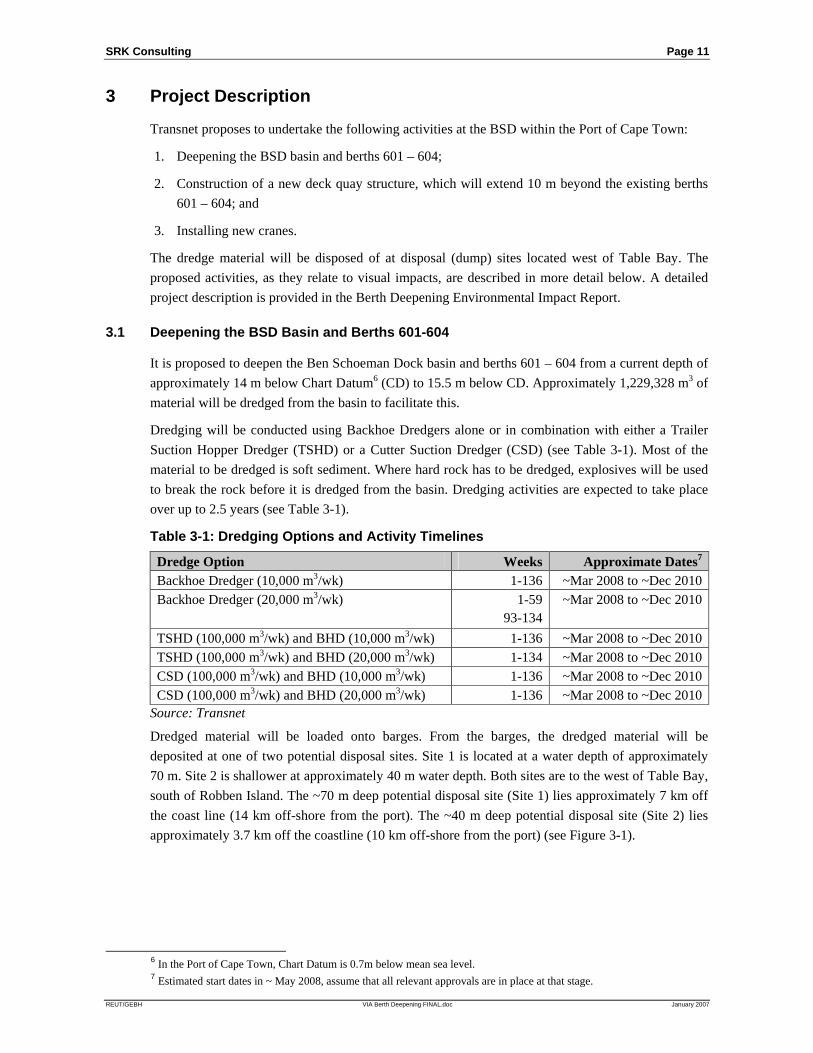
3.1 Deepening the BSD Basin and Berths 601-604
It is proposed to deepen the Ben Schoeman Dock basin and berths 601 – 604 from a current depth of
approximately 14 m below Chart Datum6 (CD) to 15.5 m below CD. Approximately 1,229,328 m3 of
material will be dredged from the basin to facilitate this.
Dredging will be conducted using Backhoe Dredgers alone or in combination with either a Trailer
Suction Hopper Dredger (TSHD) or a Cutter Suction Dredger (CSD) (see Table 3-1). Most of the
material to be dredged is soft sediment. Where hard rock has to be dredged, explosives will be used
to break the rock before it is dredged from the basin. Dredging activities are expected to take place
over up to 2.5 years (see Table 3-1).
Table 3-1: Dredging Options and Activity Timelines
Dredge Option Weeks Approximate Dates7 Backhoe Dredger (10,000 m3/wk) 1-136 ~Mar 2008 to ~Dec 2010 Backhoe Dredger (20,000 m3/wk) 1-59
93-134 ~Mar 2008 to ~Dec 2010
TSHD (100,000 m3/wk) and BHD (10,000 m3/wk) 1-136 ~Mar 2008 to ~Dec 2010 TSHD (100,000 m3/wk) and BHD (20,000 m3/wk) 1-134 ~Mar 2008 to ~Dec 2010 CSD (100,000 m3/wk) and BHD (10,000 m3/wk) 1-136 ~Mar 2008 to ~Dec 2010 CSD (100,000 m3/wk) and BHD (20,000 m3/wk) 1-136 ~Mar 2008 to ~Dec 2010
Source: Transnet
Dredged material will be loaded onto barges. From the barges, the dredged material will be
deposited at one of two potential disposal sites. Site 1 is located at a water depth of approximately
70 m. Site 2 is shallower at approximately 40 m water depth. Both sites are to the west of Table Bay,
south of Robben Island. The ~70 m deep potential disposal site (Site 1) lies approximately 7 km off
the coast line (14 km off-shore from the port). The ~40 m deep potential disposal site (Site 2) lies
approximately 3.7 km off the coastline (10 km off-shore from the port) (see Figure 3-1).
6 In the Port of Cape Town, Chart Datum is 0.7m below mean sea level. 7 Estimated start dates in ~ May 2008, assume that all relevant approvals are in place at that stage.

SRK Consulting Page 12
REUT/GEBH VIA Berth Deepening FINAL.doc January 2007
Figure 3-1: Potential Disposal Sites for Dredged Material a t ~70 m (Site 1) ~40 m (Site 2) Water Depths Source: CSIR, 2006 (Figure adapted from Lwandle, 2006)
3.2 Widening the Deck of Berths 601-604
The proposed alterations to berths 601 to 604 include:
3760000
3755000
3750000
3745000
3740000
3735000
65000 60000
-45-50
55000 50000 45000
RobbenIsland
Blouberg-strand
Blouberg Rocks
DiepRiver
SaltRiver
Camps Bay
Clifton Beach
Milnerton
Table View
Sea Point
Green Point
Cape TownHarbour
MouillePoint
Stormwater Outfall
Small Stormwater Outfalls
Industrial & Sewage Outfalls
0 km 2.5 km 5 km
Site 1
Site 2
SRK Consulting Page 13
REUT/GEBH VIA Berth Deepening FINAL.doc January 2007
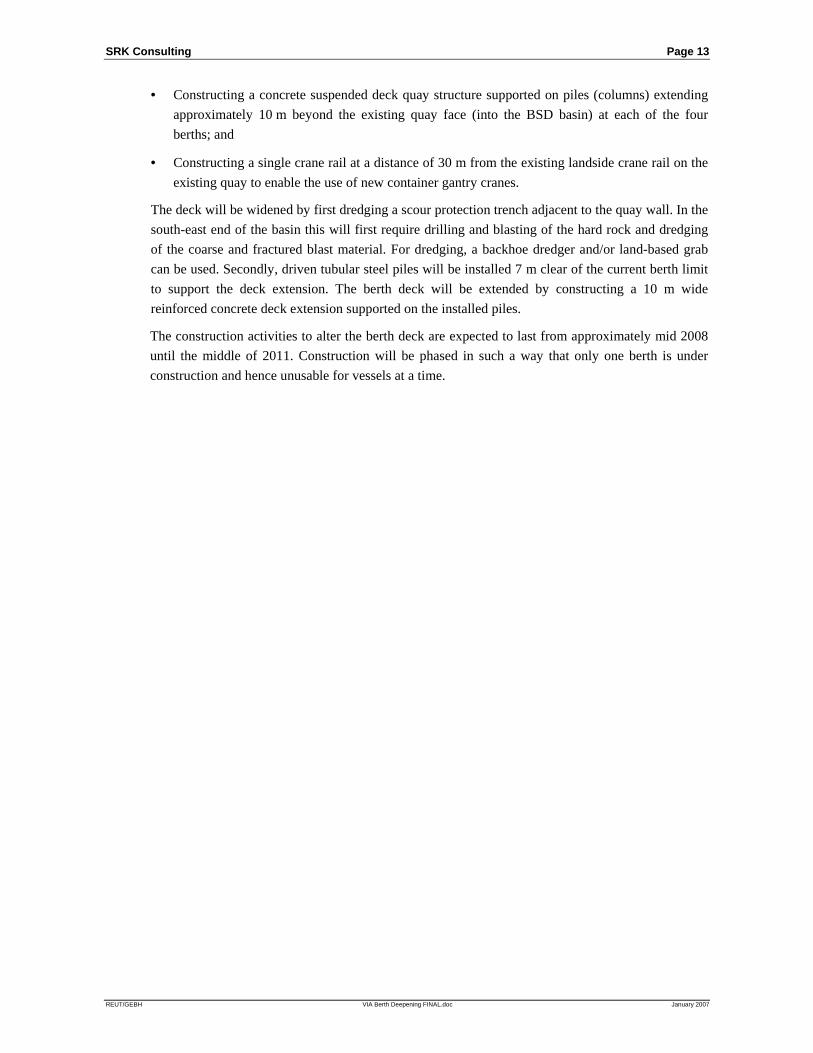
• Constructing a concrete suspended deck quay structure supported on piles (columns) extending
approximately 10 m beyond the existing quay face (into the BSD basin) at each of the four
berths; and
• Constructing a single crane rail at a distance of 30 m from the existing landside crane rail on the
existing quay to enable the use of new container gantry cranes.
The deck will be widened by first dredging a scour protection trench adjacent to the quay wall. In the
south-east end of the basin this will first require drilling and blasting of the hard rock and dredging
of the coarse and fractured blast material. For dredging, a backhoe dredger and/or land-based grab
can be used. Secondly, driven tubular steel piles will be installed 7 m clear of the current berth limit
to support the deck extension. The berth deck will be extended by constructing a 10 m wide
reinforced concrete deck extension supported on the installed piles.
The construction activities to alter the berth deck are expected to last from approximately mid 2008
until the middle of 2011. Construction will be phased in such a way that only one berth is under
construction and hence unusable for vessels at a time.

SRK Consulting Page 14
REUT/GEBH VIA Berth Deepening FINAL.doc January 2007
4 Visual Impact Assessment
The following sections outline the analysis that was undertaken to determine the magnitude or
intensity of the overall visual impact resulting from the proposed BSD deepening project. Visual
impacts associated with the proposed activity were identified and the overall impact of these
analysed. Various factors were considered in the assessment, including:
• Visibility and viewing distance;
• Visual absorption capacity;
• Integrity with existing landscape / townscape; and
• Sensitivity of the viewers.
The analysis of the magnitude or intensity of the visual impact, as described in this section, forms the
basis for the assessment and rating of impacts (see Section 4.6).
4.1 Visual Impact Sources
The potential visual impacts associated with different aspects of the proposed project are described
below. Most visual impacts relate to the construction phase of the project (e.g. plume and
construction activities) and will thus be temporary in nature. Some visual impacts relate to the
operational phase (e.g. new cranes) and will thus be of a more permanent nature.
The widened berth deck, once constructed, (increasing the width of the quay from currently
approximately 170 m to 180 m) is not considered to have a noticeable visual effect. The addition of
10 m will only increase the width and the overall size of the deck (quay) at berths 601-604 by 6%.
Within the existing environment, the visibility of this change will be negligible and this impact has
therefore not been assessed in this report.
4.1.1 Dredging and Sediment Plumes
Dredging will be conducted by vessel-mounted suction or excavation equipment. The vessels will be
moored or moving within the BSD. Figure 4-1 illustrates different types of dredge equipment that
might be utilised in the dredging of the BSD, including a Backhoe Dredger (left photo), Trailer
Suction Hopper Dredger (middle photo) and Cutter Suction Dredger (right photo). It is expected that
at maximum two vessels will operate simultaneously in the BSD.
Depending on the choice of dredging equipment, the dredged material will be either deposited into a
barge alongside the dredging equipment or into a holding container within the dredging vessel itself.
The vessel containing the dredged material will then sail to the selected off-shore disposal site where
it will discharge the dredged material into the water.

SRK Consulting Page 15
REUT/GEBH VIA Berth Deepening FINAL.doc January 2007
Figure 4-1: Different Types of Dredge Equipment Source: www.dredging.com
The dredging of particularly soft sediment in the BSD, the blasting of hard rock in the BSD and the
disposal of dredged material at an off-shore site will result in sediment being suspended and
concentrated, temporarily, in the water. The visibility of the suspended sediment in the form of a
plume (see Figure 4-2) depends on a number of factors such as the:
• Colour of the suspended sediment;
• Concentration of the suspended sediment8;
• Background concentration of sediment in the water, which may vary seasonally;
• The state of the sea;
• Angle of the sun (light conditions); and
• Height of the viewer above the sea.
The CSIR9, undertaking the specialist study of the proposed BSD dredging and disposal activities for
this EIA, is anticipating that the sediments to be disposed of from the BSD will be dark coloured
mud. The plumes will therefore consist of dark coloured sediment against the background of the
darker blue water. A darker coloured plume is less visible than a lighter coloured plume.
Recent studies undertaken for marine sediments indicate that sediment plumes become visible at
suspended sediment concentrations of between 9 and 13 mg/l, with a significantly more visible
plume occurring at a concentration of 23 mg/l. Based on background conditions for Table Bay it is
assumed that sediment concentrations are likely to become visible at about 10 mg/l. Modelling was
based on these assumptions and indicated that elevated suspended sediment concentrations
exceeding 10 to 20 mg/l are only likely to occur for a total duration of 2 to 5 days over a 90 day
period10.
The modelling indicated that these elevated sediment concentrations are most likely to result from
dredged material in the port being flushed out of the port and accumulating in the quieter regions of
the bay (SE corner).
At the disposal sites, the plumes are expected to be visible for a total of 2 to 5 days over a 90 day
period. Here, the plumes will only be visible for a short duration as each barge dumps its load.
8 CSIR (2003). EIA for the Expansion of the Container Terminal Stacking Area at the Port of Cape Town: Specialist Study
on Physical Impacts of Dredging. CSIR Report ENV-S-C 2003-083. 9 CSIR (2006). Ben Schoeman Dock Berth Deepening Project Integrated Marine Impact Assessment Study. CSIR Report
No CSIR/NRE/ECO/ER/2006/Draft. 10 CSIR (2006). Ben Schoeman Dock Berth Deepening Project Integrated Marine Impact Assessment Study. CSIR Report
No CSIR/NRE/ECO/ER/2006/Draft.

SRK Consulting Page 16
REUT/GEBH VIA Berth Deepening FINAL.doc January 2007
Various scenarios for disposal are being considered and the scenarios with a greater number of barge
dumps per day will therefore have a marginally greater visual impact (Scenarios 1 and 2 in CSIR
Report)11. However this will still be negligible (see assessment in section below).
Currently, natural sediment plumes are regularly experienced in Table Bay. These plumes result
from the river inflows from the Salt and Diep Rivers. They vary in colour and, as can be seen in
Figure 4-2 below, the darker sediments entering the Bay from the Salt River closer to the Port are
significantly less visible than the lighter sediments entering the Bay from the Diep River further
north.
Figure 4-2: Discolouration of the Water in Table Bay due to r iver inflows from the Salt and Diep Rivers Source: CSIR, 2006
4.1.2 Deck Construction Activities
The extension of the berth deck involves the dredging of a scour protection trench, the driving of
piles into the sea bed to support the deck extension and the construction of a concrete deck
extension, casting the concrete in situ or using pre-cast concrete. Visual impacts at the BSD will be
mainly related to those construction activities, such as machinery and material moving on the site.
In addition, storage of construction materials, concrete batching and welding activities are proposed
to take place on the 1.8 ha Culemborg site south of the BSD and just south of the N1 (see Figure
11 CSIR (2006). Ben Schoeman Dock Berth Deepening Project Integrated Marine Impact Assessment Study. CSIR Report
No CSIR/NRE/ECO/ER/2006/Draft.
SRK Consulting Page 17
REUT/GEBH VIA Berth Deepening FINAL.doc January 2007
2-3). This site is surrounded by industrial infrastructure of the BSD and the Woodstock industrial
area and not easily accessible or visible to the public.
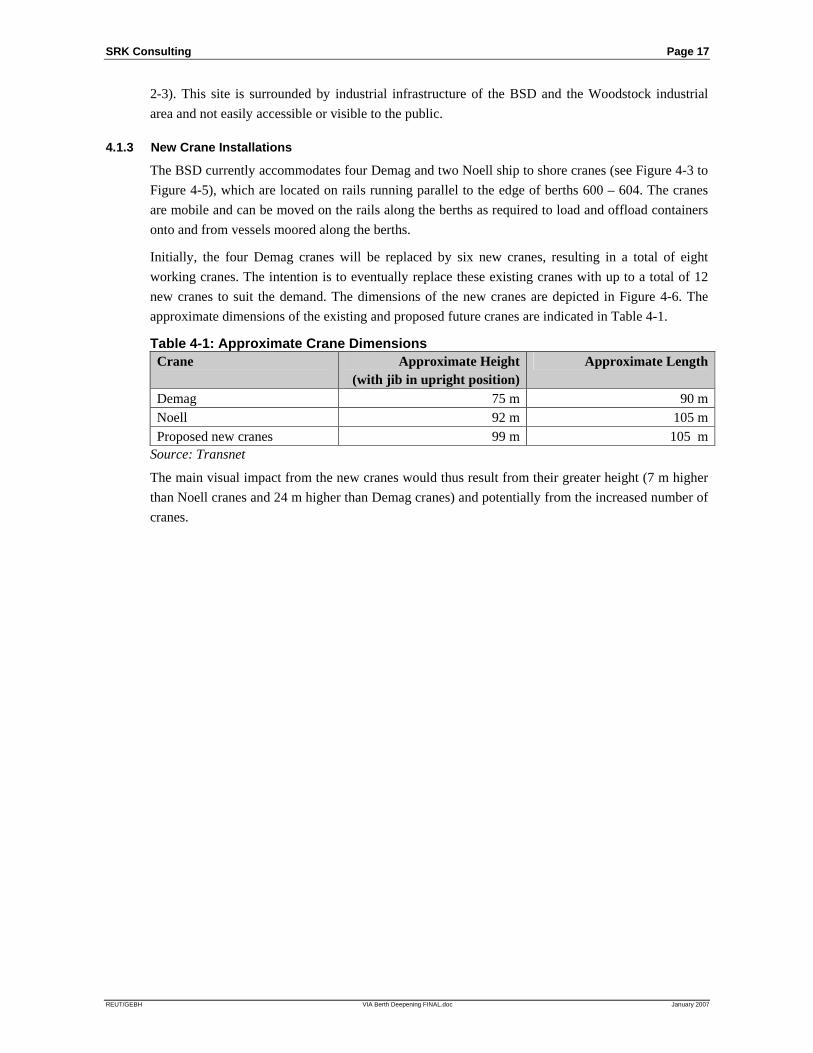
4.1.3 New Crane Installations
The BSD currently accommodates four Demag and two Noell ship to shore cranes (see Figure 4-3 to
Figure 4-5), which are located on rails running parallel to the edge of berths 600 – 604. The cranes
are mobile and can be moved on the rails along the berths as required to load and offload containers
onto and from vessels moored along the berths.
Initially, the four Demag cranes will be replaced by six new cranes, resulting in a total of eight
working cranes. The intention is to eventually replace these existing cranes with up to a total of 12
new cranes to suit the demand. The dimensions of the new cranes are depicted in Figure 4-6. The
approximate dimensions of the existing and proposed future cranes are indicated in Table 4-1.
Table 4-1: Approximate Crane Dimensions Crane Approximate Height
(with jib in upright position) Approximate Length
Demag 75 m 90 m Noell 92 m 105 m Proposed new cranes 99 m 105 m
Source: Transnet
The main visual impact from the new cranes would thus result from their greater height (7 m higher
than Noell cranes and 24 m higher than Demag cranes) and potentially from the increased number of
cranes.

SRK Consulting Page 18 of 35
Authors Initials/typist initials VIA Berth Deepening FINAL.doc December 2006
Figure 4-3: Layout of Existing Crane – Demag
Figure 4-4: Existing Cranes at BSD
Figure 4-5: Layout of Existing Cranes - Noell
Figure 4-6: Example Layout of Proposed New Crane
SRK Consulting Page 19 of 35
Authors Initials/typist initials VIA Berth Deepening FINAL.doc Date
4.2 Visual Absorption Capacity
The Visual Absorption Capacity (VAC) is the potential of an area to conceal the proposed
development, or absorb the visual impact. Factors contributing to the VAC include:
• Topography and vegetation that is able to provide screening and increase the visual absorption
capacity of a landscape;
• The degree of urbanisation compared to open space. A highly urbanised landscape is better able
to absorb the visual impacts of similar developments;
• The scale and density of surrounding development; and
• The visual character of the receiving environment (existing environmental conditions or
activities that help to reduce the visibility of particular impacts e.g. current sea conditions).
Table 4-2 outlines the characteristics of different levels of VAC in more detail.
Table 4-2: Visual Absorption Capacity Criteria High Moderate Low
The area is able to absorb the visual impact as it has:
• Undulating topography and relief;
• Good screening vegetation (high and dense);
• Is highly urbanised in character;
• Existing development is of a scale and density that absorbs the visual impact; and/or
• Receiving environment has characteristics that mask the visual impacts.
The area is moderately able to absorb the visual impact, as it has:
• Moderately undulating topography and relief;
• Some or partial screening vegetation;
• A relatively urbanised character;
• Existing development is of a scale and density that absorbs the visual impact to some extent; and/or
• Receiving environment has characteristics that partially mask the visual impacts.
The area is not able to absorb the visual impact as it has:
• A flat topography;
• Low growing or sparse vegetation;
• Is not urbanised;
• Existing development is not of a scale and density that absorbs the visual impact; and/or
• Receiving environment has characteristics that emphasise visual impacts.
Although the port itself is flat and not vegetated, the VAC of the BSD is considered to be high due to
the existing highly urbanised (industrial) nature of the site and the screening provided by the
buildings and structures in the harbour and surrounds (particularly the CBD).
Additionally, the background conditions of the sea in the bay absorb much of the visual impact
generated by the sediment plumes. Sediments entering the sea from river estuaries naturally result in
visible plumes, and there is naturally occurring suspended sediment concentration in the surf-zone.
These factors, together with reflected light and the colour of the sea, contribute to the visual
absorption capacity of the sea with regards to the visual impacts of sediment plumes.
4.3 Affected View Points
As briefly discussed in Section 2, Cape Town has a number of points that offer scenic views of the
city and surrounding areas, including the Port of Cape Town. Activities undertaken at the BSD may
therefore be visible from those areas. A sample of representative view points that offer views of the
BSD is discussed in the sections below. The location of those view points are also indicated in
Figure 4-7 as points 1 to 6.

SRK Consulting Page 20
REUT/GEBH VIA Berth Deepening FINAL.doc January 2007
Figure 4-7: Location of view points discussed in this section Hotels near the V&A Waterfront
Several hotels, each approximately 20 storeys high, are located within the Cape Town CBD and in
close vicinity to the V&A Waterfront. These include the Arabella Sheraton, Southern Sun, Ibis and
Cullinan Hotels at the Foreshore and the Table Bay Hotel at the V&A Waterfront. These hotels
provide views of the port from rooms facing in a northerly direction on the upper floors. These view
points are mostly frequented by tourists and business travellers. A view of the Port of Cape Town
taken from the Cullinan Hotel (location is indicated by Point 1 in Figure 4-7) is shown in.
2
3
1 4
5a
6b
6a
5b
SRK Consulting Page 21
REUT/GEBH VIA Berth Deepening FINAL.doc January 2007
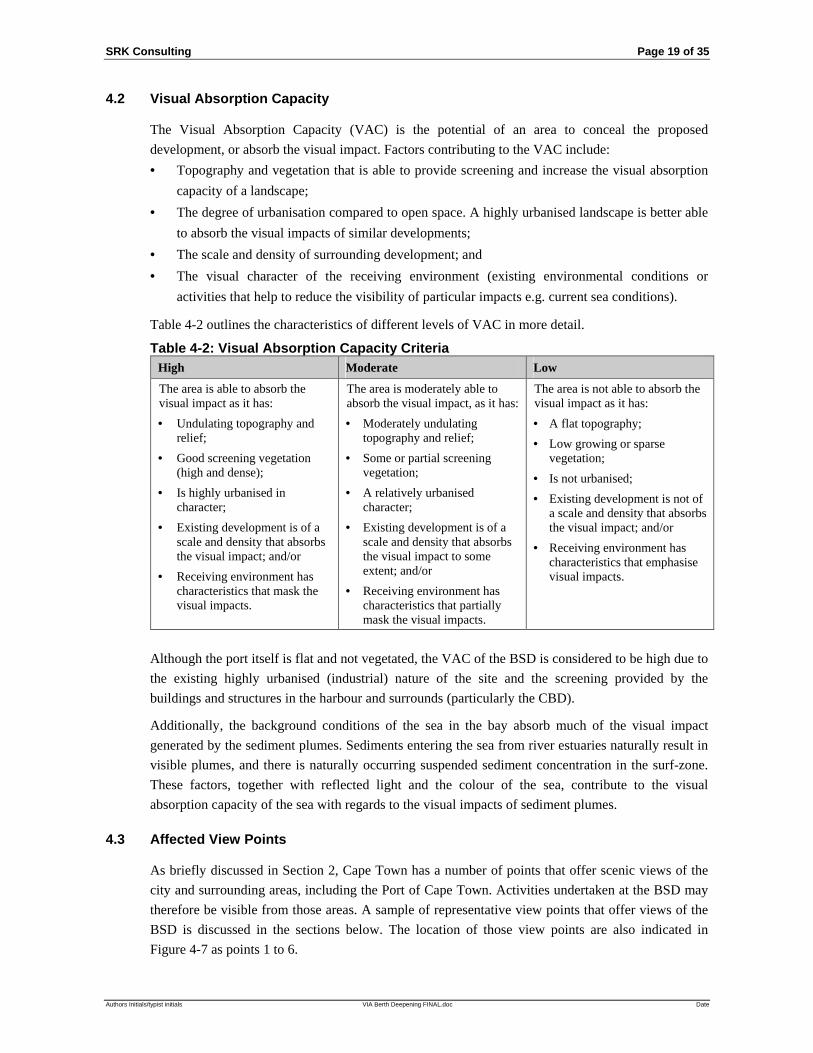
Figure 4-8: View of the Port of Cape Town from the Cullinan Hotel
The photo above shows that the BSD is located some distance from the hotels, approximately
1,100 m. The picture also conveys the generally industrial and densely developed appearance of the
Port of Cape Town and adjacent areas from this view point. Any construction activities at the BSD
that take place above ground are likely to be highly concealed by and consistent with the surrounding
structures and environment. From this viewpoint the BSD and Table Bay are viewed from a
relatively low angle so that any activities or visual effects below the water surface are likely to have
a very low visibility.
4.3.1 De Waal Drive
De Waal Drive is the extension of the M3 linking Cape Town’s southern suburbs with the CBD. The
motorway is located at the foot of Devil’s Peak and higher than most houses within the city bowl. As
such it provides scenic views of central Cape Town and the Port of Cape Town, as shown in (the
approximate location is indicated by Point 2 in Figure 4-7). De Waal Drive is used regularly by a
large number of motorists (commuters and tourists), especially at peak times when the speed of
traffic can be very slow. At off-peak times, cars travel at approximately 80 km/h.
BSD

SRK Consulting Page 22
REUT/GEBH VIA Berth Deepening FINAL.doc January 2007
Figure 4-9: View of the Port of Cape Town from De Waal Dr ive
As shown in, the BSD is visible but relatively distant from De Waal Drive (approximately 1,600 m).
A large number of other man-made structures are also visible in the foreground and along the shore
of Table Bay which divert the viewer and make the Port of Cape Town appear to be integrated into
an urban/industrial environment. Due to the distance and angle of the view it is unlikely that
observers along De Waal Drive will clearly distinguish activities and visual effects above and below
the water surface. Houses located below De Waal Drive are closer to the port but are also situated at
a lower elevation, which further reduces the angle of the view and hence visibility of the port and
any effects beneath the surface of the water.
4.3.2 N2
The N2 is located to the north of and lower than De Waal Drive, but is still elevated relative to the
sea level. It is frequented by motorists (commuters and tourists), typically travelling at about 80
km/hr at off-peak times and at lower speeds at peak times. Pedestrians use the pedestrian bridges
across the N2, which connect suburbs on either side of the N2. Figure 4-10 shows the view of the
Port from the Roodebloem pedestrian bridge across the N2. The location of the bridge is indicated as
Point 3 in Figure 4-7.
BSD
SRK Consulting Page 23
REUT/GEBH VIA Berth Deepening FINAL.doc January 2007
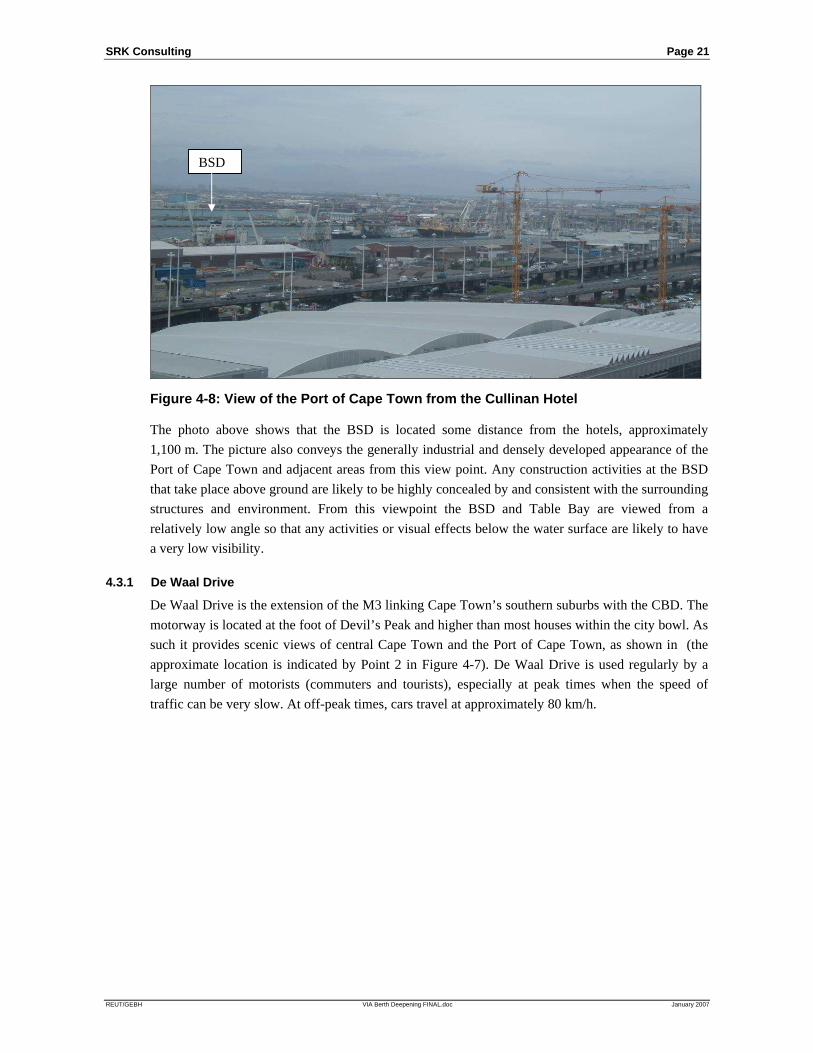
Figure 4-10: View of the Port of Cape Town from Roodebloem Bridge over the N2
As can be seen in Figure 4-10, the Port of Cape Town is closer to the N2 than De Waal Drive but
viewed from a lower angle. Activities above the surface of the water are likely to be more visible
from vantage points such as the pedestrian bridge across the N2 than from De Waal Drive due to the
shorter distance. Effects below the water surface is likely to be less visible due to the lower angle the
water surface is viewed from. A large number of other man made structures are also visible in the
foreground, which diverts the viewer and makes the Port of Cape Town appear integrated into the
existing urban/industrial landscape.
4.3.3 Signal Hill
Signal Hill is located approximately 2,600 m to the west of the Port of Cape Town beyond the CBD
(also see Figure 2-1). It reaches a height of approximately 400 m and is the lowest peak in the Table
Mountain Group within central Cape Town. The top of Signal Hill can be reached by car and attracts
local residents and visitors who want to enjoy a view of Cape Town. The view from Signal Hill is
shown in. Point 4 in Figure 4-7 indicates the approximate direction of Signal Hill’s location relative
to the Port of Cape Town.
SRK Consulting Page 24
REUT/GEBH VIA Berth Deepening FINAL.doc January 2007
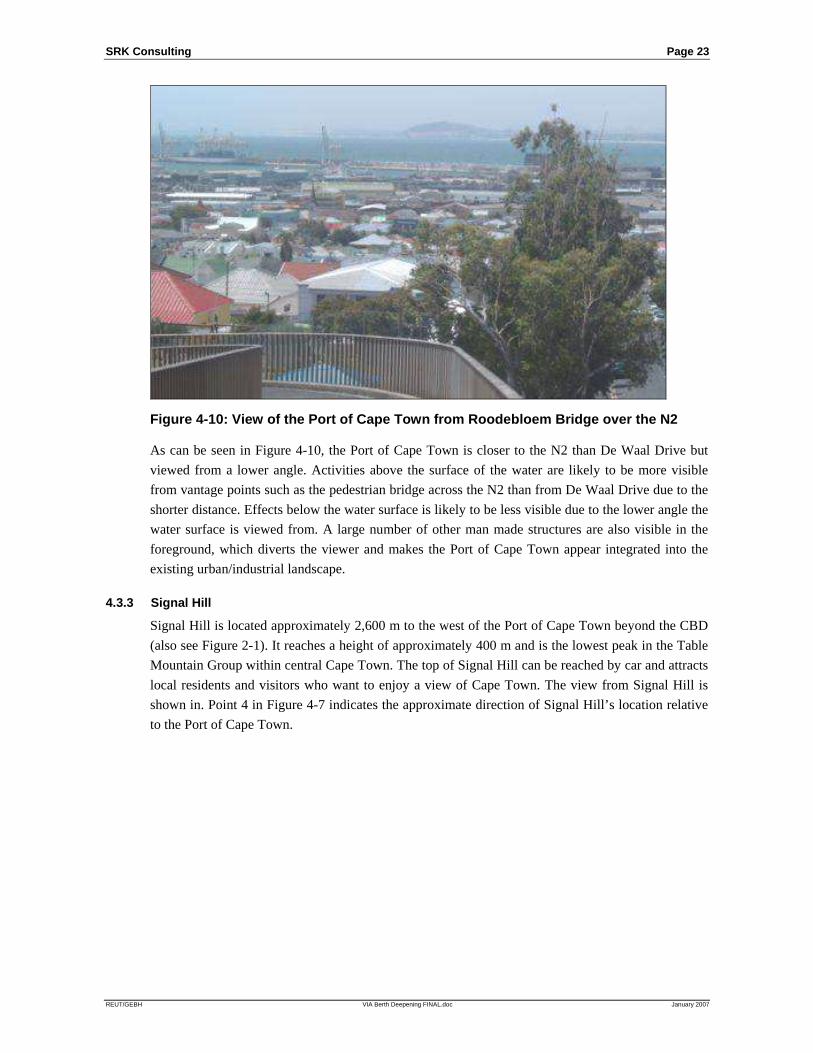
Figure 4-11: View of the Port of Cape Town from Signal Hi ll
As can be seen above, the BSD is visible in the distance from Signal Hill. However, due to the Port’s
distance from this viewpoint and the large number of other man-made structures in the foreground,
which partly obscure the port and distract the viewer, it is likely that any activities above or below
the surface of the water within the BSD will not be visible from this viewpoint.
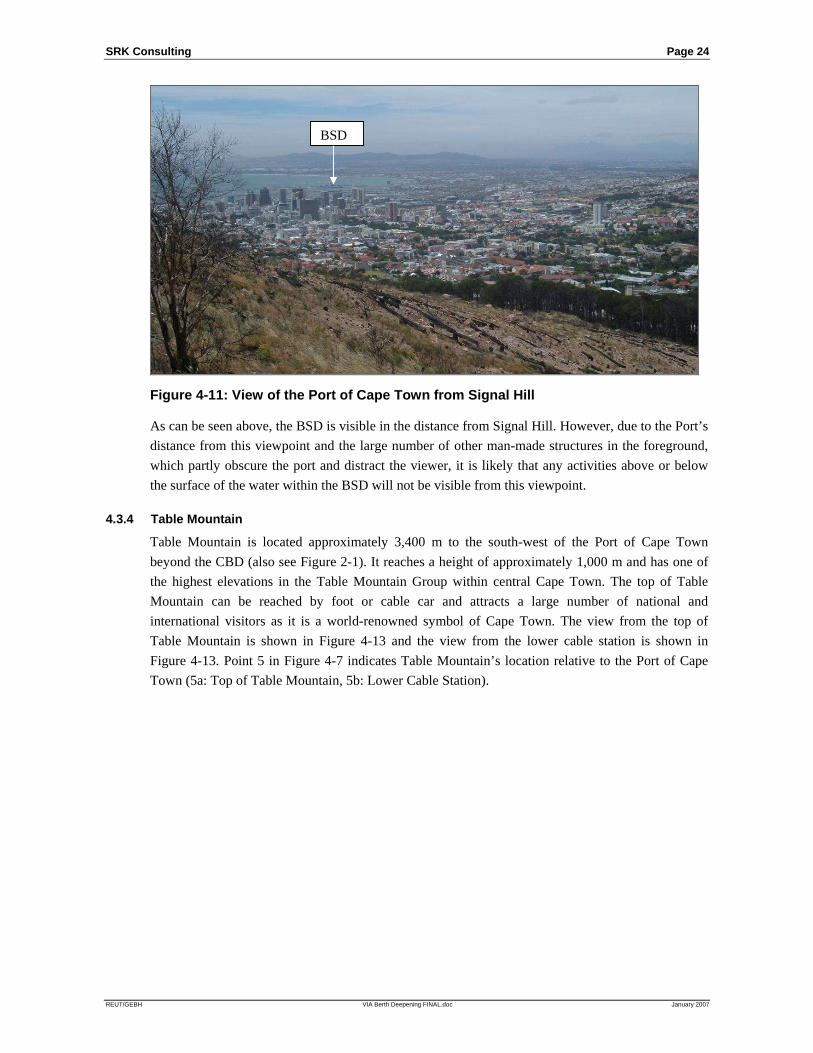
4.3.4 Table Mountain
Table Mountain is located approximately 3,400 m to the south-west of the Port of Cape Town
beyond the CBD (also see Figure 2-1). It reaches a height of approximately 1,000 m and has one of
the highest elevations in the Table Mountain Group within central Cape Town. The top of Table
Mountain can be reached by foot or cable car and attracts a large number of national and
international visitors as it is a world-renowned symbol of Cape Town. The view from the top of
Table Mountain is shown in Figure 4-13 and the view from the lower cable station is shown in
Figure 4-13. Point 5 in Figure 4-7 indicates Table Mountain’s location relative to the Port of Cape
Town (5a: Top of Table Mountain, 5b: Lower Cable Station).
BSD

SRK Consulting Page 25
REUT/GEBH VIA Berth Deepening FINAL.doc January 2007
Figure 4-12: View of the Port of Cape Town from the top of Table Mountain
Figure 4-13: View of the Port of Cape Town from Table Mou ntain lower Cable Station
The BSD is visible from Table Mountain, which is the highest generally accessible viewpoint in
Cape Town and thus provides views from the highest angle onto the waters of the Port and Table
Bay. As such, any discolorations of the water or sub-surface activities are likely to be visible from
Table Mountain.
BSD
BSD
SRK Consulting Page 26
REUT/GEBH VIA Berth Deepening FINAL.doc January 2007
However, the Port is located at a considerable distance from this viewpoint and the BSD is a
relatively small and confined space in comparison to the expanse of Table Bay and the CBD. The
proposed activities and potential effects above or below the surface of the water within the BSD are
thus likely to be of low significance from this viewpoint, especially given their temporary nature.
Additionally, when the sun is reflecting off the water, the views of the plumes will be further
reduced and plumes are therefore unlikely to be visible during the afternoon.
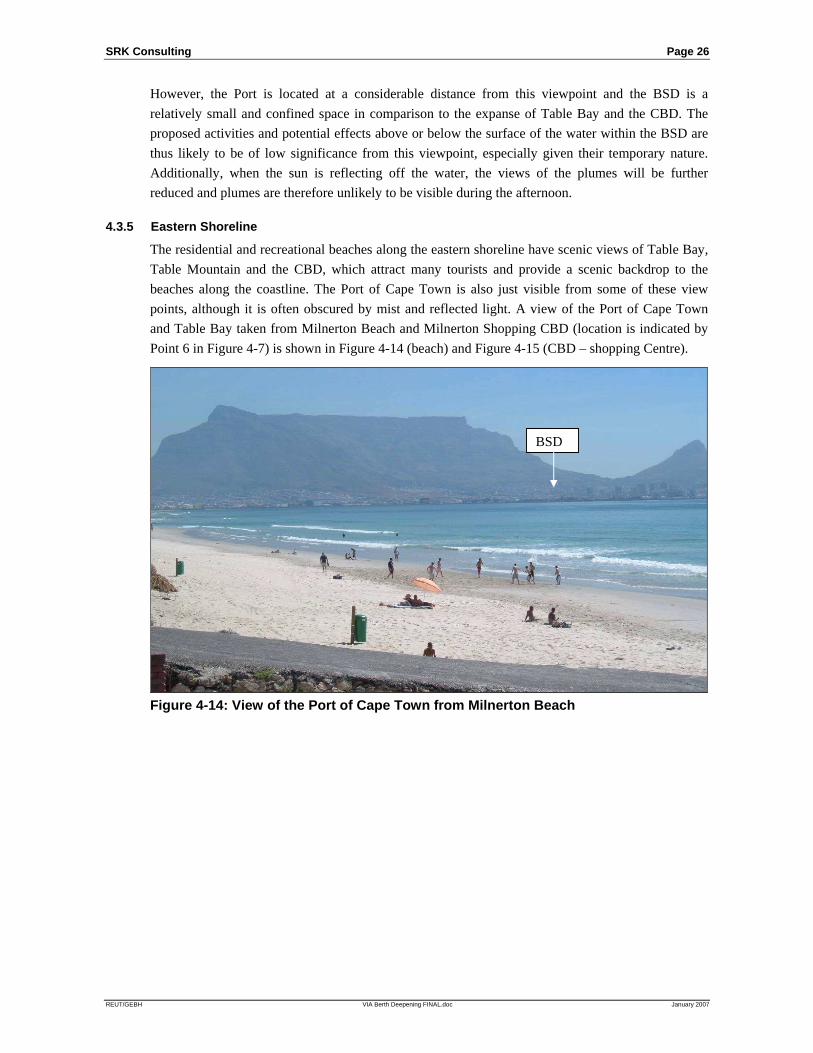
4.3.5 Eastern Shoreline
The residential and recreational beaches along the eastern shoreline have scenic views of Table Bay,
Table Mountain and the CBD, which attract many tourists and provide a scenic backdrop to the
beaches along the coastline. The Port of Cape Town is also just visible from some of these view
points, although it is often obscured by mist and reflected light. A view of the Port of Cape Town
and Table Bay taken from Milnerton Beach and Milnerton Shopping CBD (location is indicated by
Point 6 in Figure 4-7) is shown in Figure 4-14 (beach) and Figure 4-15 (CBD – shopping Centre).
Figure 4-14: View of the Port of Cape Town from Milnerton Beach
BSD

SRK Consulting Page 27
REUT/GEBH VIA Berth Deepening FINAL.doc January 2007
Figure 4-15: View of the Port of Cape Town from Milnerton CBD (Centre Point Shopping Centre 4 th Floor)
The above photos show that the BSD is located relatively far from the north-eastern shore of Table
Bay and that any of the proposed activities and structures above the water are likely to be
indiscernible from the existing surrounding environment. View points along this shore are generally
from a relatively low angle, so that any activities or visual effects below the water surface are likely
to have a low visibility. Additionally, the visibility of the sediment plumes is likely to be negligible
compared to current, naturally occurring plumes, especially given that they will be temporary and of
short duration.
4.4 Affected Viewers and Their Sensitivity
The sensitivity of viewers is determined by the number of viewers and by how likely they are to be
impacted upon. Potential viewers12 of the visual impacts associated with the Port deepening activities
include:
• Guests on the higher floors of multi-storey hotels located close to the V&A Waterfront, such as
Southern Sun, Ibis, Arabella Sheraton, Cullinan and Table Bay;
• Visitors to Table Mountain, Lion’s Head and Signal Hill;
• Residents close to De Waal Drive;
• Residents and tourists on the eastern shoreline (Milnerton, Tableview etc.); and
• Motorists travelling along De Waal Drive and the N2.
The most sensitive viewers will be the visitors and hotel guests that have come to the area
specifically for the views from the mountains and hotel rooms. The CBD area is heavily populated
and tourist destinations within the CBD (specifically Table Mountain) attract high numbers of
12 Many of these viewers will be very marginally impacted, due to the very low visibility of the impacts (especially
residents and tourist on the eastern shoreline).
BSD

SRK Consulting Page 28
REUT/GEBH VIA Berth Deepening FINAL.doc January 2007
visitors, particularly during the summer months. Motorist are considered to be less sensitive viewers
as they are transitory and will only see glimpses of potential impacts while moving at speed.
However, most of the more sensitive viewers visiting Cape Town will be viewing the potential
impacts from the mountains more than 2.5 km away and are likely to see any visual impacts for only
short periods of time (e.g. while visiting a view point, driving past or looking out of their hotel room
window). Moreover, the view including the Port of Cape Town is only one of numerous scenic
views in Cape Town, such as those of Camps Bay, Clifton and the Winelands, which do not include
the Port structures. As such the overall effect of the proposed project on views enjoyed by Cape
Town visitors and residents is minimal.
The overall sensitivity of viewers is likely to be moderate and will be mitigated to a large extent by
the low visibility of most visual impacts in the existing context as well as the temporary nature of
visual impacts.
4.5 Visual Integration with the Existing Landscape
Landscape or townscape integrity refers to the compatibility of the proposed development with the
existing landscape and townscape. The landscape / townscape integrity of the proposed port
deepening was rated based on the following criteria:
Table 4-3: Landscape / Townscape Integration Criteria High Moderate Low
The proposed activities and structures:
• Are consistent with the existing land use of the area;
• Are highly sensitive to the existing environment;
• Are consistent with the urban texture and layout;
• The buildings and structures are congruent / sensitive to the existing architecture / buildings; and
• The scale and size of the development is similar to nearby existing development.
The proposed activities and structures:
• Are moderately consistent with the existing land use of the area;
• Are moderately sensitive to the existing environment;
• Are moderately consistent with the urban texture and layout;
• The buildings and structures are moderately congruent / sensitive to the existing architecture / buildings; and
• The scale and size of the development is moderately similar to nearby existing development.
The proposed activities and structures:
• Are not consistent with the existing land use of the area;
• Are not sensitive to the existing environment;
• Are very different to the urban texture and layout;
• The buildings and structures are not congruent / sensitive to the existing architecture / buildings; and
• The scale and size of the development is different to nearby existing development.
The proposed activities associated with the Port deepening and the new gantry cranes are considered
to be highly consistent with current activities and structures in the BSD. The townscape integration
is considered to be high since the proposed activities are congruent with activities associated with a
working harbour and although the gantry cranes will be larger, they are similar to the existing cranes.
The sediment plumes are also consistent with current sea conditions in Table Bay, where natural
sedimentation plumes occur from time to time.
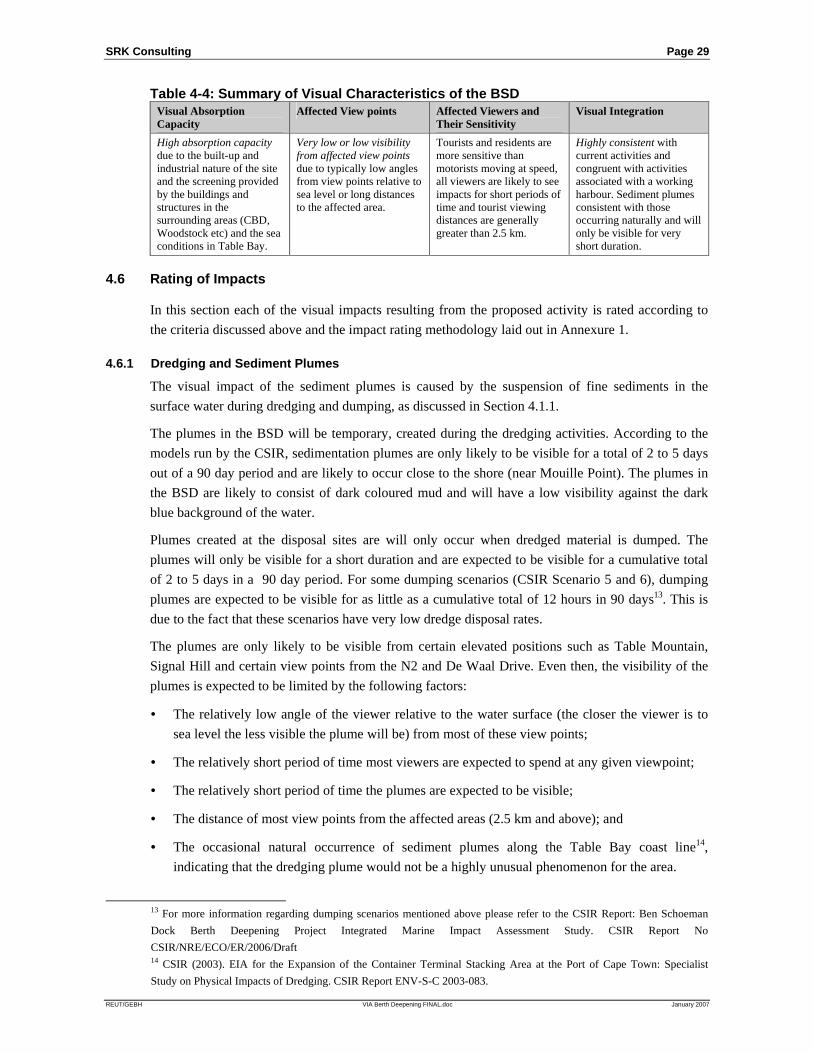
Table 4-4 summarises the visual characteristics of the BSD discussed in the previous sections.
SRK Consulting Page 29
REUT/GEBH VIA Berth Deepening FINAL.doc January 2007
Table 4-4: Summary of Visual Characteristics of the BS D Visual Absorption Capacity
Affected View points Affected Viewers and Their Sensitivity
Visual Integration
High absorption capacity due to the built-up and industrial nature of the site and the screening provided by the buildings and structures in the surrounding areas (CBD, Woodstock etc) and the sea conditions in Table Bay.
Very low or low visibility from affected view points due to typically low angles from view points relative to sea level or long distances to the affected area.
Tourists and residents are more sensitive than motorists moving at speed, all viewers are likely to see impacts for short periods of time and tourist viewing distances are generally greater than 2.5 km.
Highly consistent with current activities and congruent with activities associated with a working harbour. Sediment plumes consistent with those occurring naturally and will only be visible for very short duration.
4.6 Rating of Impacts
In this section each of the visual impacts resulting from the proposed activity is rated according to
the criteria discussed above and the impact rating methodology laid out in Annexure 1.
4.6.1 Dredging and Sediment Plumes
The visual impact of the sediment plumes is caused by the suspension of fine sediments in the
surface water during dredging and dumping, as discussed in Section 4.1.1.
The plumes in the BSD will be temporary, created during the dredging activities. According to the
models run by the CSIR, sedimentation plumes are only likely to be visible for a total of 2 to 5 days
out of a 90 day period and are likely to occur close to the shore (near Mouille Point). The plumes in
the BSD are likely to consist of dark coloured mud and will have a low visibility against the dark
blue background of the water.
Plumes created at the disposal sites are will only occur when dredged material is dumped. The
plumes will only be visible for a short duration and are expected to be visible for a cumulative total
of 2 to 5 days in a 90 day period. For some dumping scenarios (CSIR Scenario 5 and 6), dumping
plumes are expected to be visible for as little as a cumulative total of 12 hours in 90 days13. This is
due to the fact that these scenarios have very low dredge disposal rates.
The plumes are only likely to be visible from certain elevated positions such as Table Mountain,
Signal Hill and certain view points from the N2 and De Waal Drive. Even then, the visibility of the
plumes is expected to be limited by the following factors:
• The relatively low angle of the viewer relative to the water surface (the closer the viewer is to
sea level the less visible the plume will be) from most of these view points;
• The relatively short period of time most viewers are expected to spend at any given viewpoint;
• The relatively short period of time the plumes are expected to be visible;
• The distance of most view points from the affected areas (2.5 km and above); and
• The occasional natural occurrence of sediment plumes along the Table Bay coast line14,
indicating that the dredging plume would not be a highly unusual phenomenon for the area.
13 For more information regarding dumping scenarios mentioned above please refer to the CSIR Report: Ben Schoeman
Dock Berth Deepening Project Integrated Marine Impact Assessment Study. CSIR Report No
CSIR/NRE/ECO/ER/2006/Draft 14 CSIR (2003). EIA for the Expansion of the Container Terminal Stacking Area at the Port of Cape Town: Specialist
Study on Physical Impacts of Dredging. CSIR Report ENV-S-C 2003-083.

SRK Consulting Page 30
REUT/GEBH VIA Berth Deepening FINAL.doc January 2007
As such, the significance of the visual impact of the dredging and dumping activities is rated as very
low (negative), meaning that “the potential impact is very small and should not have any
meaningful influence on the decision regarding the proposed activity”.
Table 4-5: Significance of Potential Visual Impact of Dre dge Plume Extent Intensity Duration Consequence Probability Significance Status Confidence
Local Low Short term Very Low Without mitigation 1 1 1 3
Probable Very Low -ve Medium- High
Local Low Short term Very Low With mitigation 1 1 1 3
Probable Very Low -ve Medium - High
4.6.2 Deck Construction Activities
The visual impact of the berth alteration construction activities will result from dredging and
construction at berths 601-604 of the BSD as well as associated activities such as material storage
and cement batching at the Culemborg site, as described in Section 4.1.2.
The impact on the visibility is expected to be limited by:
• The current visual context and industrial nature of the area, which will visually absorb additional
construction machinery and activity at the BSD and the Culemborg site;
• The fact that vessels of different sizes are already using the BSD, so that additional dredging-
related vessels would not be highly noticeable;
• The relatively short period of time most viewers are expected to spend at any given viewpoint;
• The distance of most tourist view points from the BSD (2.5 km and above); and
• The temporary nature of the construction activities.
As such, the significance of the visual impact of the berth construction activities is rated as very low (negative), meaning that “the potential impact is very small and should not have any meaningful
influence on the decision regarding the proposed activity” .
Table 4-6: Significance of Potential Visual Impact of Cons truction Activities Extent Intensity Duration Consequence Probability Significance Status Confidence
Local Low Short term Very Low Without mitigation 1 1 1 3
Probable Very Low -ve High
Local Low Short term Very Low With mitigation 1 1 1 3
Probable Very Low -ve High
Some mitigation measures to reduce the negative impacts of construction are suggested in Section
4.7. However these are not expected to significantly reduce the visual impact and the rating therefore
remains the same.
4.6.3 New Crane Installations
The visual impact of the new cranes will result primarily from the fact that they will be 7 m higher
(with jib in an upright position) than the highest cranes, currently used, that they will be replacing. In
addition, the number of cranes installed along the berths 601-604 of the BSD may increase in the
future, as discussed in Section 4.1.3. They are therefore likely to have an increased visibility from a
number of view points, including certain points along De Waal Drive and the N2, from Table
Mountain and some of the surrounding hotels.
The visibility impact of the newly installed cranes is expected to be limited due to:
SRK Consulting Page 31
REUT/GEBH VIA Berth Deepening FINAL.doc January 2007
• The existing industrial nature of the site, which includes crane installations both at the BSD and
Duncan Dock, which is located much closer to viewers (see Figure 4-8), so that the installation
of new (even though higher) cranes at the BSD would not significantly alter the existing visual
environment;
• The distance of most tourist view points from the BSD (2.5 km and above); and
• The relatively short period of time most viewers are expected to spend at any given viewpoint.
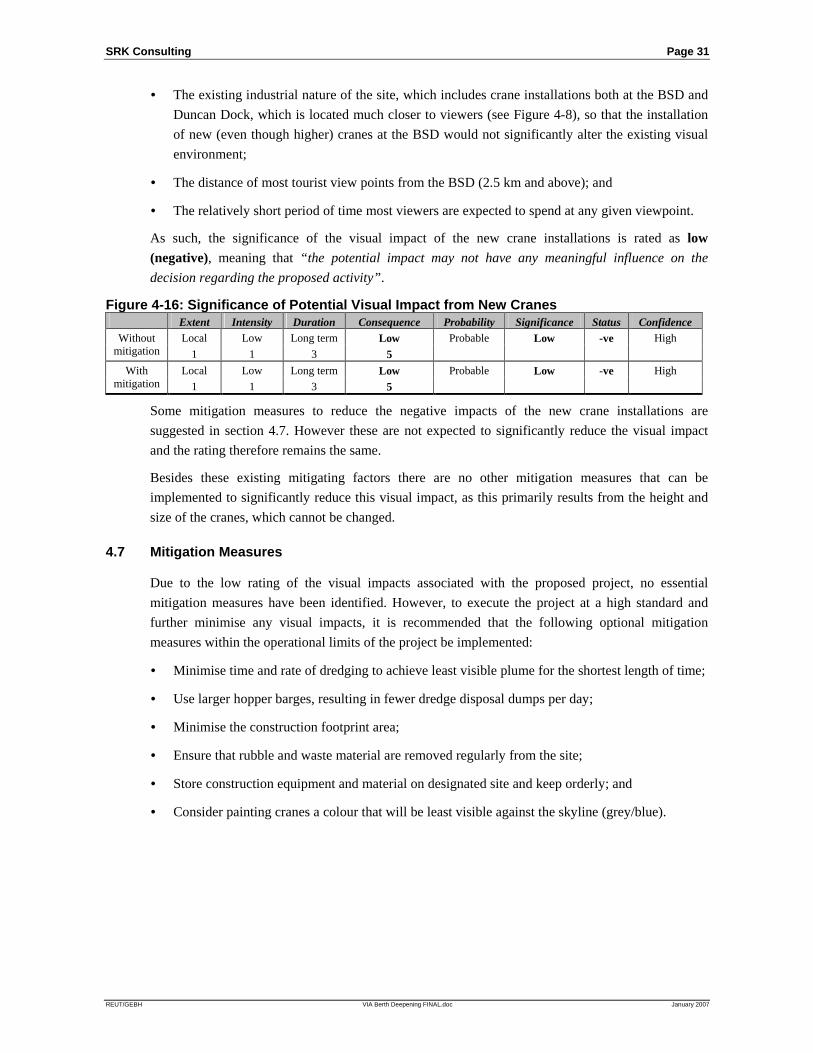
As such, the significance of the visual impact of the new crane installations is rated as low (negative), meaning that “the potential impact may not have any meaningful influence on the
decision regarding the proposed activity”.
Figure 4-16: Significance of Potential Visual Impact from N ew Cranes Extent Intensity Duration Consequence Probability Significance Status Confidence
Local Low Long term Low Without mitigation 1 1 3 5
Probable Low -ve High
Local Low Long term Low With mitigation 1 1 3 5
Probable Low -ve High
Some mitigation measures to reduce the negative impacts of the new crane installations are
suggested in section 4.7. However these are not expected to significantly reduce the visual impact
and the rating therefore remains the same.
Besides these existing mitigating factors there are no other mitigation measures that can be
implemented to significantly reduce this visual impact, as this primarily results from the height and
size of the cranes, which cannot be changed.
4.7 Mitigation Measures
Due to the low rating of the visual impacts associated with the proposed project, no essential
mitigation measures have been identified. However, to execute the project at a high standard and
further minimise any visual impacts, it is recommended that the following optional mitigation
measures within the operational limits of the project be implemented:
• Minimise time and rate of dredging to achieve least visible plume for the shortest length of time;
• Use larger hopper barges, resulting in fewer dredge disposal dumps per day;
• Minimise the construction footprint area;
• Ensure that rubble and waste material are removed regularly from the site;
• Store construction equipment and material on designated site and keep orderly; and
• Consider painting cranes a colour that will be least visible against the skyline (grey/blue).

SRK Consulting Page 32
REUT/GEBH VIA Berth Deepening FINAL.doc January 2007
5 Conclusion
The visual impacts of the plumes resulting from the dredging and disposal of sediment were rated as
being of very low significance (negative). The impacts resulting from construction activities to
extend the deck of berths 601-604 were rated as being of very low significance (negative). The
impact of the installation of new cranes at berths 601-604 was rated as being of low significance
(negative).
Overall, the visual impacts for the proposed berth deepening activities in the BSD are considered to
be acceptable due to the visual context in which the deepening and berth alteration activities will
take place and given the temporary nature of the visual impacts resulting from the dredging, disposal
and construction.
The CSIR dredging and disposal scenarios 5 and 6 are marginally preferred as they are not likely to
result in any visible plumes within Table Bay, while scenarios 1 and 2 are marginally the least
preferred options as they include the greatest number of hopper barge dumps. However, all scenarios
are considered acceptable from a visual perspective.
It is recommended that the mitigation measures mentioned in section 4.7 are implemented, where
possible, and that an environmental management plan is implemented and monitored during
construction activities.
Belinda Gebhardt Sue Reuther Senior Environmental Consultant Environmental Consultant

SRK Consulting Page 33
REUT/GEBH VIA Berth Deepening FINAL.doc January 2007
Annexure 1: Impact Rating Methodology Impact Assessment Methodology for EIAs - Instructions to Specialists The significance of all potential impacts that would result from the proposed project is determined in order to assist decision-makers. The significance rating of impacts is considered by decision-makers, as shown below. • INSIGNIFICANT : the potential impact is negligible and will not have an influence on the decision
regarding the proposed activity. • VERY LOW : the potential impact is very small and should not have any meaningful influence on the
decision regarding the proposed activity. • LOW : the potential impact may not have any meaningful influence on the decision regarding the
proposed activity. • MEDIUM : the potential impact should influence the decision regarding the proposed activity. • HIGH : the potential impact will affect a decision regarding the proposed activity. • VERY HIGH : The proposed activity should only be approved under special circumstances. The significance of an impact is defined as a combination of the consequence of the impact occurring and the probability that the impact will occur. The significance of each identified impact15 must be rated according to the methodology set out below: Step 1 – Determine the consequence rating for the impact by adding the score for each of the three criteria (A-C) listed below: Rating Definition of Rating Score
A. Extent– the area over which the impact will be experienced
0
Local Confined to project or study area or part thereof (e.g. site) 1
Regional The region, which may be defined in various ways, e.g. cadastral, catchment, topographic
2
(Inter) national Nationally or beyond 3
B. Intensity– the magnitude or size of the impact
None 0
Low Natural and/or social functions and processes are negligibly altered 1
Medium Natural and/or social functions and processes continue albeit in a modified way
2
High Natural and/or social functions or processes are severely altered 3
C. Duration– the time frame for which the impact will be experienced
None 0
Short-term Up to 2 years 1
Medium-term 2 to 15 years 2
Long-term More than 15 years 3
15 This does not apply to minor impacts which can be logically grouped into a single assessment.

SRK Consulting Page 34
REUT/GEBH VIA Berth Deepening FINAL.doc January 2007
The combined score of these three criteria corresponds to a Consequence Rating, as follows: Combined Score (A+B+C) 0 – 2 3 – 4 5 6 7 8 – 9
Consequence Rating Not significant Very low Low Medium High Very high Example 1: Extent Intensity Duration Consequence
Regional Medium Long-term High 2 2 3 7
Step 2 – Assess the probability of the impact occurring according to the following definitions: Probability– the likelihood of the impact occurring Improbable < 40% chance of occurring Possible 40% - 70% chance of occurring Probable > 70% - 90% chance of occurring Definite > 90% chance of occurring
Example 2:
Extent Intensity Duration Consequence Probability Regional Medium Long-term High
2 2 3 7 Probable Step 3 – Determine the overall significance of the impact as a combination of the consequence and probability ratings, as set out below: Significance Rating Consequence Probability Insignificant Very Low & Improbable Very Low & Possible Very Low Very Low & Probable Very Low & Definite Low & Improbable Low & Possible Low Low & Probable Low & Definite Medium & Improbable Medium & Possible Medium Medium & Probable Medium & Definite High & Improbable High & Possible High High & Probable High & Definite Very High & Improbable Very High & Possible Very High Very High & Probable Very High & Definite

SRK Consulting Page 35
REUT/GEBH VIA Berth Deepening FINAL.doc January 2007
Example 3:
Extent Intensity Duration Consequence Probability Significance Regional Medium Long-term High
2 2 3 7 Probable HIGH Step 4 – Note the status of the impact (i.e. will the effect of the impact be negative or positive?) Example 4:
Extent Intensity Duration Consequence Probability Significance Status Regional Medium Long-
term High
2 2 3 7 Probable HIGH – ve Step 5 – State your level of confidence in the assessment of the impact (high, medium or low). Depending on the data available, you may feel more confident in the assessment of some impact than others. For example, if you are basing your assessment on extrapolated data, you may reduce the confidence level to low, noting that further groundtruthing is required to improve this. Example 5:
Extent Intensity Duration Consequence Probability Significance Status Confidence Regional Medium Long-term High
2 2 3 7 Probable HIGH – ve High
Step 6 – Identify and describe practical mitigation measures that can be implemented effectively to reduce the significance of the impact. The impact should be re-assessed following mitigation, by following Steps 1-5 again to demonstrate how the Extent, intensity, duration and/or probability change after implementation of the proposed mitigation measures. Example 6: A completed impact assessment table
Extent Intensity Duration Consequence Probability Significance Status Confidence Regional Medium Long-term High Without
mitigation 2 2 3 7 Probable HIGH – ve High
Local Low Long-term Low With mitigation 1 1 3 5
Improbable VERY LOW – ve High
In the report, mitigation measures must be described as either: • Essential: must be implemented and are non negotiable; and • Optional: must be shown to have been considered and sound reasons provided by the MJV if not
implemented. Step 7 – Summarise all impact significance ratings as follows in your executive summary: Impact Consequence Probability Significance Status Confidence Impact 1: XXXX Medium Improbable LOW –ve High With Mitigation Low Improbable VERY LOW High Impact 2: XXXX Very Low Definite VERY LOW –ve Medium With Mitigation: Not applicable