best - defense technical information center to lowered ambient pressures as experienced by divers,...
TRANSCRIPT

BestAvailable
Copy

A-JA04I-S... .. m
AD-A280 412
CARDIAC PRESSURE CHANGES WITH VENOUSA RGAS EMBOLISM AND DECOMPRESSION
•'!. S Bruce D. Buter DTICT ~EMECT E
Unirautyof Tomn Msda SchooGeorgeFB.ln BoS C 1 15
00 Bo . Koi, Maor, USAF,
AROWACE MEDICINE DIRECTORATE aHYPERBARIC MEDICINE DIVION
2510 Kennedy Circle, Sulle 117BrOokS Air Force Base, TX 78235-11l
April 1994Fbd T mfa Rint tor pad Membr 1M- SsPnWNW 133
I IA~mvWd for pshlc relnme; dlnbtibon is uknliid.
"94-18434
14 6 14 109AIR FORCE MATERIEL COMMAND
BROOKS AIR FORCE BASE, TEXAS

/,~m . , III i IN n n nu
NOTICES
When Government drawings, specifications, or other data are used for anypurpose other than In connection with a definitely Government-related procure-ment, the United States Government Incurs no responsibility or any obligationwhatsoever The fact that the Government may have formulated or in any waysupplied the said drawings, specifications, or other data, Is not to be regarded byImplication, or otherwise In any manner construed, as licensing the holder, or anyother person or corporation; or as conveying any rights or permission tomanufacture, use, or sell any patented Invention that may In any way be relatedthereto.
The animals Involved In this study were procured, maintained, and used Inaccordance with the Animal Welfare Act and the "Guide for the Care and Use ofLaboratory Animals" prepared by the Institute of Laboratory Animal Resources -National Research Council.
The Office of Public Affairs has reviewed this report, and it Is releasable to theNational Technical Information Service, where it will be available to the generalpublic, Including foreign nationals.
This report has been reviewed and is approved for publication.
EMrlB4P ER. KMajor 7'US A F, B SCClnclInvestigations and Research Brach
MERRITT G, DAVIS, JR., Colonel, USAF, MC, CFPSChief, Hyperbaric Medicine Division

ii i iiForm Approved
REPORT DOCUMENTATION PAGE 0MB No, 0704o018
g w f t c�eto f fm u eatamatd to aea ho er .re oe. nuig te te for e vi#wing instructions sarching eaxiting data sources.u ntn 4r the dt n a c pt an reewng the thistn Of informatn. ted commenbu regrng thus burdf estimate or any other aspect of thi
mIOedden of Informatn. inld ing s for reducng this r;de tO W gon Headquartes Servic. Oirectortet for Information operations and Repots. 121S JeffersonOev=1002w1Z .= Ate 1V4. A . V& azr-IaD2. and to the Office of Managemt and Sudget. Papework Reduction Project (07044tI8). Washington. OC 20S03.
1., AGENCY USE ONLY (Leave blnk) 2. REPORT DATE 3. REPORT TYPE AND DATES COVERED
1N APri& 1994 IFinal November 1991.N- September 1993
4.TITE AND SUOTIT S. FUNDING NUMBERSC: S•EE G/TCARDIAC PRESSURE CHANGES WITH VENOUS GAS EMBOLISM F336C: 0-DO606,0014AND DECOMPRESSION PE: 61101F
4. AUTH0WS) PR: ILIR
BRUCE D. BUTLER TA: AR
GEORGE B. KEMPER WU: 21
7. PERFORMING ORGANIZATION NAME(S) AND ADORESS(ES) S. PERFORMING ORGANIZATION
Department of Anesthesiology REPORT NUMBER
University of Texas Medical School6431 Fannin, MSB 5.020Houston, Texas 77030
9. SPONSORING/MONITORING AGENCY NAME(S) AND ADDRESS(ES) 10. SPONSORING/ MONITORING
Armstrong Laboratory (AFMC) AGENCY REPORT NUMBER
Aerospace Medicine Directorate AL/AO-TR-1993-01762510 Kennedy Circle, Suite 117Brooks Air Force Base, Texas 78235-5119
11. SUPIPEMENTARY NOTES
Armstrong Laboratory Technical Monitor: Major George B. Kemper, (210) 536-3281
Us0. OISBUUION/AVAILABGWTY STATEMENT 12b. DISTRIBUTION CODE
Approved for public release; distribution is unlimited.
I& ABSTRACT (MAwhWmam 200woWdVenous air embolism is reported with decompression to a decreased ambient pressure.With severe decompressions or in cases where an intracardiac septal defect (patentforaeen ovale) exists, the venous bubbles can become arterialized and cause neu-rological decompression illness. Incidence rates of patent foramen ovale in thegeneral populatifn range from 25-34% and yet aviators, astronauts and underseadivers who have decompression-induced venous bubbles do not demonstrate neurolog-ical symptoms -at these high rates. This apparent disparity may be attributableto the normal pressure gradient across the atria of the heart that must bereversed for there to be flow patency. We eyaluated the effects of 1) venous airembolism (0 025 0.05 and 0.15 ml*kg -1'ai" n-f for 180 mmn, 2) hyperbaric decom-pression, and 35 hypobaric decompression on the pressure gradient across the leftand right atria. Left ventricular end-diastolic pressure was used as a measure ofleft atrial pressure. In a total of 92 experimental evaluations, there were noreported reversals in the mean pressure gradient across the atria, and a total of3 transient reversals in the peak gradient pressures. This disparit may be dueto insufficent amounts of venous gas to cause a pressure and hence flow reversalacross the atria.
14. SUBJECT TERMS 15. NUMBER OF PAGES
venous gas embolism intracardial pressure gradient 34patent foramen ovale bubbles 16. MICE CODEdcoe= ression decompression symptoms
17. SECURi• CLASSUICATION 1i. SECURITY C.ASSFICATION 19. SECURITY CLASSIFICATION 20. LIMITATION OF ABSTRACTOF REPORT OF THIS PAGE OF ABSTRACT
Unclassified Unclassified Unclassified UL
NSN 7n40-1-280-5500 Standard Form 298 (Rev. 2-89)i Plin d by ANSI Std. 1M-31i 2MI-02

CONTENTS
Zntroduc tnon ............................................................... 1
Methods and Materials ..................................................... 2
Results .................................................................... 4
Venous air Znfubions ................................................ 4
Hyperbaric Decompression ............................................ 4
Altitude Simulations ................................................ 5
Discussion ................................................................ 6
References ............................................................... 11
TABLES
1. Hemodynamia Data:Venous Air Infusion (0.025 ml*kg-1 *min-1 ) ............................ 16
2. Hemodynamic Data:Venous Air Infusion (0.05 ml*kg-*min-1 ) ............................. 17
3. Iemodynamic Data:Venous Air Infusion (0.15 ml*kg-l*min-1)............................. 18
4. Hemodynamic Data:Hyperbaric Decompression ............................................. 19
S. Hemodynamic Data:Altitude Decompression ............................................... 20
@AoOeSlon Yor
NTIS GRA&IDTIC TAB -Uiannoveed 0Juastiticatio
AvallabilitY J•8 _
lo spoa

FIGURES
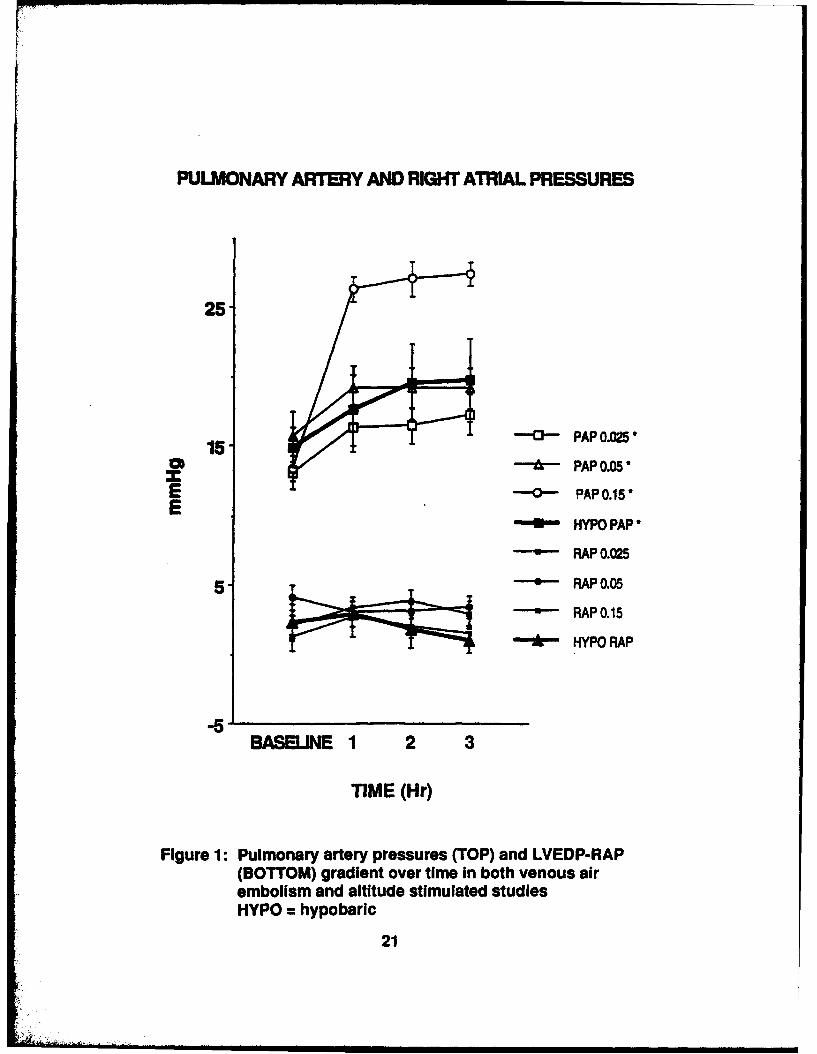
1. Pulmonary Artery Pressures and LVEDP-RAP Gradient .................... 21
2. Right Ventricular Pressures with VAR and Decompression .............. 22
3. Cardiac Output and Pulmonary Vascular Resistance ..................... 23
4. Peak LVEDP-RAP Gradient Pressure Change .............................. 24
iv

ACKNOWLEDGMENTS
The authors wish to thank Mrs. Tina Little, Mr. Tom Sutton and Dr. RonRobinson for their technical assistance in this investigation, and Mrs. Caro-line Duggs-Warner and Mrs. Olga Fafoutakis for manuscript preparation. Thiswork was supported in part by SCERE G/T F33615-90-D0606,0014 and NASA NAG 9-215.
V

INTRODUCTION
Venous air embolism (VAN) is commonly reported when decompression occursto lowered ambient pressures as experienced by divers, astronauts and avia-tors. These circulating bubbles ultimately become trapped within the lungswhere they are excreted via the airways or dissolved in the blood. Althoughvenous bubbles may be associated with lung injury (14,20,24,45), even atmoderate doses (11) theme events are less severe than those reported withsystemic arterial air embolism (28). Arterialization of the VAN can occurvial a) the lung microcirculation (9,10,12,61), b) large anatomical shuntswithin the lung parenchyma (38,44), or c) intracardiac septal defects(2,3,41,42,62,66).
An atrial meptal defect (ASD), often manifest as a patent foramen ovals(P7O) located between the atria of the heart, may provide an anatomical routefor the venous gas bubbles to access the systemic arterial circulation; i.e.,paradoxical air embolism (PAN). These arterial bubbles can result in cerebralor myocardial embolLzatLon and infarction thereby causing a more significantinjury or even death.
It is generally accepted that VAN commonly occur with even moderate do-compressions either from elevated hydrostatic pressures or increasing alti-tude. With the reported incidence of ASD's ranging from 25-34% in the adultpopulation (26,37), a disparity exists between these values and the actualcases of serious decompression illness (DCI) in aviators and astronauts thatexperience VAR. This disparity may be explained in part by the fact that thenormal pressure gradient between the right and left atria must be reversed forVAN to cross into the left heart via an ASD. In those subjects exhibiting anASD and that experience VAN after decompression, but no symptoms of any neuro-logical involvement, it is likely that the extent of bubbling was perhapsinadequate to cause a reversal in atrial pressure gradients and to effect theabnormal transport of bubbles across the anatomical shunt. The mechanism bywhich VAN can cause a reversal in the normal pressure gradient between theatria involves the obstruction of pulmonary vessels or a corresponding vaso-constriction resulting from reflex or mediator activation. These actionscause an increase in vascular resistance, thereby increasing right atrialpressure and decreasing cardiac output which in return may cause the leftatrial pressure to fall below that of the right atrium.
Recent studies have suggested a greater likelihood of serious hyperbaricDCI in individuals with an AND (41,42,66), although this finding was not sup-ported with altitude decompression (16). These observations do however, raisethe question of the validity of screening divers, aviators and astronauts forthe presence of ASD's to determine their acceptabilLty/fLtness for diving orflight duty.
The aim of the present study was to determine the effects of VAE as wellas decompression to altitude or from hyperbaric pressures on the intracardiacpressures of anesthetized dogs and to determine at what point the left toright atrial pressure gradients are likely to reverse. ArterLalLzatLon of theVAN was not studied.
1
i• ]i • - : • • i ...... . ... .. . . .. . .. ...... | i m

METHODS AND MATERIALS
Surgerys Twenty-two mongrel dogs (22±6 kg) of both sexes were fasted for
twenty four hours, anesthetized with pentobarbital sodium (25 mg/kg, IV) and
maintained with 10 mg/hr. The dogs were intubated and mechanically ventilated
with air using a volume regulated ventilator (Harvard) at a tidal volume (15
al/kg) and frequency (10-14 breaths/min) adequate to maintain baseline arteri-
al carbon dioxide (paCO2 ) tensions at between 30-45 umHg. The dogs were
maintained in a supine position, temperature controlled with a water-heated
blanket and hydrated with Ringer's lactate. Polyvinyl catheters were placed
into the abdominal aorta via the left femoral artery for measurement of mean
arterial blood pressure (MAP), in the right atrium (RAP), and the pulmonary
artery via the right jugular vein (PAP), the right veoitricle (RVP; mean,
systolic and diastolic), the left ventricle via the right carotid artery for
left ventricular end-diastolic pressure (LVEDP), as an indirect measure of
left atrial pressure, and the inferior vena cava via the left femoral vein for
venous access. Airway pressure was measured from a connector at the proximal
end of the endotracheal tube. The right ventricular catheter was a double
lumen with the proximal opening located at a point just above the right atri-
um, as verified by the pressure traqing, for the venous air infusions. The
catheters, excepting the airway, were fluid filled with degassed heparinized
"saline and connected to calibrated pressure transducers (Isotec), zero refer-
enced at the right atrial level. Cardiac output (CO) was measured using
thermodlution (Arrow) via the multi-lumen pulmonary artery catheter. Arteri-
al blood gases were measured (Instrumentation Laboratories) at baseline and
hourly thereafter. End-tidal carbon dioxide (ST-CO2 ) and arterial oxygen
saturation (0 2 -Sat) were continuously measured (Nellcor).
Air infusions Following stabilization (30-45 min) and collection of
baseline data, air was infused into the right atrium for 180 min using a vo-
lume controlled reciprocating servo pump (Harvard). The dogs in the air
infusion studies were subdivided into three experimental groups (n - 6 each),depending upon the air infusion dose and one control group (n - 4). The three
air doses were 0.025, 0.05 and 0.15 ml*kg-1 *min-1. Hemodynamic measurementswere collected throughout the air infusion and for a 60 min post infusion
period. CO and blood gases were measured every 60 min. Each dog received theVAN infusion for 180 min only once. The internal diameter of the air infusioncatheter was 500 microns, which approximated the initial size of the venousbubbles, although fracture into smaller progeny microbubbles in the sizesreported with decompression (27) likely occurred in the turbulent regions ofthe right ventrLcular outflow tract. The hearts were inspected post mortemfor the presence of an ASD.
zic 22 esion
Six dogs were prepared as previously described with the addition ofplacement of an ultrasonic Doppler probe used to detect VAE that formed as aresult of the decompression. A pulsed Doppler probe (20 mHz, Hartley), mount-ed in a 7-9 m acrylic cuff was surgically placed around the inferior venacava via laparotomy, approximately 1-2 cm above the renal veins. The probe
2

signal was range gated to maximize the reflected audible signal representingbubble recordings. A small number of test bubbles, created by agitating 3-5ml whole blood with < 0.25 cc air, were infused into the IV line to verifyprobe placement and probe excitation voltage. Decompression bubble signalswere semi-quantitatively evaluated according to Grades 1-4 using a modifiedSpencer code (55) which consisted of periodic audio sampling at resting condi-tions and following deep knee bends with the bubble score recorded as the peakvalue obtained in the two conditions. In some cases, the signals were record-ed on cassette (Marans) for playback analysis or digitized directly for com-puter-assisted evaluation (13). The instrumented animals were placed in theexperimental compression chamber, ventilation was switched to a pneumatic-driven time cycled ventilator (Bird) and compressed to 1.84 bar (60 feet ofsea water, few) at 0.37 bar/min (12 faw/min) for 120 min, then decompressed tosea level at 0.92 bar/min (30 few/min). The animals were then immediatelyremoved from the chamber and monitored post dive for 90 min.
Altitude studies
Six dogs were prepared as previously described, including the vena cavalDoppler probe. LVEDP was measured with a non fluid-filled transducer-tippedcatheter (Millar). Tetanic muscle stimulation was used while at altitude torelease venous bubbles trapped within the capillary beds of the left hind limbfor the Doppler detection. To effect muscle stimulation, two needle elec-trodes were inserted into the right biceps femoris muscle and the cables wereconnected to a nerve stimulator (Sun-Med) located outside of the chamber. Thedogs were placed into the altitude chamber and all pressure and Doppler moni-tors were connected to through-pass devices for continuous recordings. Follow-ing baseline data collection the dogs were decompressed to 40,000 ft (4,000ft/mmn) for 180 min. The animals were ventilated with room air to 20,000 ftand then switched to 100% oxygen thereafter. No oxygen prebreathing was admin-istered. The animals were then recompressed to sea level at 10,000 ft./min.Monitoring was continued throughout the altitude simulation and until nofurther VAN could be detected by the Doppler, usually not exceeding 45 min.The breathing gas was switched back to air at 20,000 ft during descent.
Data are expressed as mean ± SEM. Data were analyzed using analysis ofvariance (ANOVA) with individual comparisons made using Bonferroni correctedStudent's t test. p < 0.05 was considered statistically significant.
3

RESULTS
Yawncs I~ nfusioins
Hemodynamic data are summarized in Tables 1-3. Figure 1 shows the timecourse of changes for PAP and RAP in both the VAS and altitude simulatedstudies. MAP decreased with each of the dones; reaching significance atparticular intervals with each air dose. PAP increased significantly witheach air dose, beginning within the first 5 min of the infusion and remainingelevated for the 180 min period (Figure 1). Peak increases were dose depend-ent# the maximum value reaching 104% above baseline (0.15 ml*kg-l*min- 1 ).RAP values were unchanged at the 0.025 dose, decreased (nonsignificant) withthe 0.05 dose and elevated with the 0.15- ml*kg- 1 *min- 1 dose (nonsignificant).LVEDP values were not significantly different with any of the air infusiondoses. RVP mean, diastolic and systolic values were unchanged with the lowertwo doses, while mean and systolic values increased significantly with the0.15 ml*kg-l*min- 1 dose. RVP diastolic values slightly increased (nonsignifi-cant) with the hi'gher two doses (Figure 2). The LVEDP-RAP mean gradient re-mained positive (non-reversed at each dose) (Figure 4). Reversals were ob-served however, intermittently with inspiration and within an individualcardiac cycle. Examining peak gradient pressure changes (maximum RAP andminimum LVEDP, i.e. LVNDP-RAPp) throughout individual respirations and cardiaccycles did demonstrate two incidents of reversal; (one dog at hour three inthe 0.05 ml*kg' 1 *min- 1 group; one dog at hour two in the 0.15 ml*kg-l*min-1
group. Three additional dogs had pressure gradients of 0 to 0.2 mmHg duringthe experimental phases. HR decreased with all three doses, reaching signifi-cance at hour three of the 0.15 ml*kg 1 *min- 1 dose. CO was decreased (signif-cant) at the 0.025 and 0.05 ml*kg-l*min- doses (Figure 3). 0 2 -Sat and ZT-
CO were decreased with each air infusion. PVR was increased at each dose(Figure 3), while TPR was elevated (nonsignificant) at the lower doses andslightly decreased (nonsignificant) at the 0.15 ml*kg -*min- 1 dose. Arterialp02 was decreased (significant) with the 0.05 and 0.15 ml*kg-l*min- 1 dose andpaCO2 was elevated with each dose, 0.025 and 0.15 ml*kg -*min-1 groups achiev-ing significance.
vD9erbaric Decomoressions
The hemodynamic changes associated with decompression from 1.84 bar aregiven in Table 4. MAP values were not significantly changed. PAP values in-creased to a peak 30 min post decompression (nonsignificant), and returned tobaseline values over the next 60 min; RAP values were unchanged (Figure 1).LVEDP decreased within the first 10 min post decompression (nonsignificant)and remained slightly decreased. RVP pressures were slightly decreased (non-significant) for mean and systolic values, while diastolic values were slight-ly elevated (Figure 2). HR was decreased (nonsignificant) by 26% within thefirst 30 min post decompression, returning to within 13% of baseline over the90 min recovery period. CO steadily decreased, reaching significance 90 minpost dive (Figure 3). PVR increases reached peak values at 30 min post dive(155%) but were elevated throughout the 90 min (Figure 3). TPR increasedprogressively over the 90 min post dive period. The LVEDP-RAP mean gradientdecreased post decompression while never achieving a reversal in the directionof the gradient (Figure 4). Arterial PAO2 was elevated post decompression and
4

PCO2 was unchanged. NT-CO2 was decreased (significant) at 90 min, and 0 -Satwas unchanged. Doppler-detected venous bubbles were first recorded 12.3±i min(10-18 min, range) post decompression and persisted for up to 120 min. Spon-taneous bubbles were detected at a peak Grade of 2 in two dogs and Grade 3 and4 in one dog each. Grade 4 bubbles were detected in three dogs with deep kneebends. No symptoms of arterial DCI were recorded.
Altitude Si laina
The hemodynamic changes resulting from decompression to simulated alti-tude are summarized in Table 5. MAP increased at 20,000 ft, probably due inpart to the systemic vasoconstriction associated with the switch to 100% oxy-gen ventilation, and returned to lower than baseline values upon return to sealevel pressures. PAP increased progressively (significant) to 20,000 ft,decreased momentarily with the switch to oxygen ventilation then continued torise to a peak value (106%) 180 min into the simulated flight, presumably dueto the persistent embolization of pulmonary vessels by VAN (Figure 1). RAPdecreased upon transit to altitude, then increased after 60 min at 40,000 ft.RAP values taken at 120 and 180 min were decreased, although clotting of thevenous pressure lines occurred in several incidence and were not correcteduntil descent (Figure 1). RVP values increased upon ascent and remainedelevated throughout the flight (Figure 2). LVEDP increased over the durationof the flight and during the period of maximal venous bubbling (non-signifi-cant) then returned towards baseline upon return to sea level (Figure 2). HRwas decreased. The LVEDP-RAP peak gradient increased throughout the flight,returning towards baseline with recovery (Figure 4). The mean LVEDP-RAP wasnever reversed, although one dog had a transient reversal upon arrival at asimulated altitude of 40,000 ft. CO was slightly decreased post flight whilePVR was increased (significant) as was TPR (non-significant) (Figure 3).Arterial p02 and pCO2 values were increased post flight. Venous gas bubbleswere recorded at Grades 2-4 during the flights. No animals from any of theexperimental or control groups had an ASD detected at autopsy. No arterialsymptoms of DCI or air embolism were detected in any of the animals.
5
/

DISCUSSION
The results of this study demonstrated that the normal mean pressuregradient between the atria of the heart (LAP > RAP, using LVEDPm and p as auamaure of ;AP) wis not reversed with venous air infusions of 0.025, 0.05 and0.15 ml*k W'*min-', or with hypo- or hyperbaric decompressions in anesthetizeddogs with intact atrial septa. Examining peak gradient changes throughoutindividual respiratory and cardiac cycles revealed three incidence (3%) withmomentary reversals occurring during the experimental air infusions or decom-pressLons, out of a total of 92 recorded measurements.
This relatively low rate for the atrial pressure gradient to reversewith VAX or decompression is consistent with reported findings that patientswith a PF0 who have VAE do not appear to be symptomatic of arterial embolismat rates predictable from the incidence rates of PFO's in the general popula-tion (16). The incidence of PFO's in individuals with no history of cardiacdisease has been demonstrated at autopsy to be 27-35% (26,60). Using preop-erative precordial echo ultrasound, the detection rate has been reported from10% to 30% (25,37). Failure to demonstrate a PF0 with echocardiography canstill occur as a result of improper contrast technique, poor image resolutionor inability to produce flow through the defect because of inadequate atrialpressure changes. An inadequate degree of sensitivity and specificity of pre-cordial echocardiography can, for example, result in failure to correctlyidentify surgical patients at risk of PAR (34,46), examples of which are re-ported where actual PAR did subsequently occur (3,17). False negative resultsof preoperative screening for ASDs using precordial echocardiography are notuncommon (33), although superior sensitivity is reported with contrast imagingusing transesophageal echo machines (46). Reported use of echocardiographyfor detection of flow across a PFO suggests that incidence rates range from 5-10% (3,25,29,32,33,37) for resting conditions and from 10-24% for provokedmaneuvers (25,33). A review of these incidence rates and of the rates offalse-negative transesophageal echocardiography saline-contrast studies ispresented by Rafferty (51). From these data, Rafferty concluded that positivetests for a PF0 are definitive in nature, however a negative study does notnecessarily preclude the possibility of flow patency, especially without prbofthat any provoked maneuver indeed caused a reversal in the atrial pressuregradient (32).
VAR circulate into the pulmonary microcirculation resulting in both me-chanical obstruction and reflex vasoconstriction (30). The subsequent pulmo-nary hypertension and increase in vascular resistance can cause an increase inRAP relative to LAP that would result in a shunting of blood flow through anASD. However, even in the presence of VAN, the interatrial pressures, andhence flow, may not always be reversed. Quite often PFOs are located justbelow the limbus of the fossa ovalis which in some cases may be shielded fromsuperior vena cava blood flow (2). Further, it has been demonstrated thatinteratrial shunting via ASD's consists predominantly of inferior vena cavalblood flow (53,58). Consequently, it may be conjectured that even thoughsignificant VAR may occur as a result of decompression, trans-atrial movementof the bubbles as predicted by a reversal in the LAP-RAP gradient may notalways occur. The duration of embolization or the speed at which the VARenter the lung microcirculation may represent other factors influencing flow
6

reversal through a PFO. In fact, Mehta, et al., (40) reported that rapidL.olus injections of 0.5 - 1.5 mltkg-l *min- 1 of air into the right atria ofdogs with intact atrial septa did not cause a pressure reversal, but that 2.0ml*kg- did. This dose was 13.3 times the dose in the present study and farexceeded that normally seen with decompression (49). Vik, et al., (62) re-ported PAR in anesthetized pigs receiving venous air infusions as small as0.05 ml*kg-l*min- 1 , and who had PFOs detected by transesophageal echocardiog-raphy. Furthermore, in their study the size of the PFOs (4.5 ± 3.1 mm dia)were not related to the occurrence of PAE and although RAP was elevated (non-significantly) they did not report left heart values. Interestingly, thereappear to be significant differences in the tolerance of VAE by swine anddogs; earlier studies by Vik, et al., (61) showed much greater increases inPAP and decreases in MAP than reported for the same air doses in the presentstudy using dogs. Further, the PAP and atrial pressure gradient data with0.05 ml*kg- 1 *min-1 VAS and altitude decompression reported in the presentstudy approximated each other.
It is important to consider both mean atrial pressures and transientpressure changes that occur throughout a cardiac or respiratory cycle (3) whenevaluating PAR via an ASD. This is most evident when examining for the pres-ence of an ASD using contrast echocardiography during the release phase of avalsalva maneuver or following a cough (19,37). With these maneuvers, it isoften possible to detect an ASD in subjects that otherwise have normalintra-cardiac pressure gradients across the atria (57). The initial strainphase of a Valsalva causes intrathoracic pressure to increase thereby decreas-ing venous return and thus RAP. Upon release, the venous return abruptlyincreases as well as RAP. In subjects with pressure gradients of differentmagnitudes, varying degrees of intrathoracic pressure release may not beadequate to cause a flow reversal (29). Three percent of the total number ofVAN or decompression tests in the present study showed transient reversals inthe atrial pressure gradient. These values may change however, with individu-als undergoing physical activity.
MAP decreased with each VAE dose, and although statistically significantfor the 0.025 and 0.15 ml*kg-l*min- 1 doses, these values never exceeded 17% ofbaseline. ZCG changes reported with VAS, such as S-T segment depression or T-wave inversion have been associated with reductions in cardiac output andmyocardial contractility (9). MAP was not significantly affected by thealtitude or hyperbaric decompressions, although the decrease in HR likelycontributed to the decrease in CO. PAP was increased in a dose responsefashion for the three VAS doses and closely approximated the hypobaric decom-pression values. These responses have been previously reported over a widerrange of air doses (8,10) and are attributable to increased mechanical ob-struction, shunt, reflex vasoconstriction and release of vasoactive mediators.These combined effects on the pulmonary microcirculation account for thesignificant elevations in PVR and to some degree the increase in peripheralvascular tone. RVP values (mean, systolic and diastolic) increased with VASdue to the increased PVR. This finding was previously reported by Powell, etal., (49) who correlated RVP values with decompression-induced venous gasloads to the pulmonary circulation based on an algorithm that was determinedfrom calibrated venous gas infusions.
7

Arterial oxygen tensions and saturation values decreased with each VAEdose (significant at the larger doses) due largely because of the developmentof physiological shunt by obstruction of pulmonary vessels by the gas bubbles.Further explanations reported earlier include: 1) changes associated with lunginjury that cause diffusion impairment such as edema or atelectasis, 2) chang-es in the ventilation-perfusion ratio, or 3) opening of pulmonary shunts(36,44,54,56). Obstruction of pulmonary vessels reduces the CO2 tensions inthe exhaled gases (ET-CO2 ), thereby increasing the values in the arterialblood (paCO2 ). The increased paO2 post decompression may be due to the in-cr•ased oxygen tension at depth (hyperbaric) and reduced extraction postdecompression.
Certain conclusions drawn from the present study are dependent to somedegree on the degree of confidence that can be placed in the approximation ofLAr by LVEDP. Braunwald, et al., (6) reported that in normal individualsLVEDP exceeds LAP mean by an average of only 0.2 mmHg. They further suggestedthat although atrial systole increased the ventricular filling rate, it didnot cause LVEDP to further increase above LAP mean. In another study, Braun-wald, et al., (5) reported little difference between LAP mean, LAP z-wave(atrial pressure at onset of left ventricular contraction) and LVEDP. Addi-tionally, the LAP a-wave peak (atrial contraction) was the same as the leftventricular a-wave which represents the transmission of the atrial contractilewave into the left ventricle (6,39). The tallest wave in the LAP pulse is theV-wave which is the pressure at the time that the mitral valve opens.Although the apparent differences in LVEDP (obtained in a closed chestedanimal) and LAP (principally V waves, obtained by thoracotomy) pose someinterpretative limitations on the determination of the atrial gradients, therelative advantage of using a closed-chested versus open-chested preparationpresents a compelling argument for its use.
When a reversal of the atrial pressure gradient occurs, either tran-siently or with mean values during VAE and a PFO exist, the subject is at riskfor PAZ with subsequent cerebral complications if the bubbles circulate intothe brain, This risk factor has been previously recognized in hyperbaricdecompression sickness (41). In a later retrospective study of 90 divers,Moon, et al., (42) found a statistically significant relationship between PFOand serious DCI. For the individuals with a resting PFO (i.e., valsalvamaneuver or cough was not required to provoke venous contrast transmissionthrough the septal defect) they reported a five-fold increase in risk forserious DCI. Valsalva-induced shunts were not significantly correlated withan increased risk of DCI. Further, no data was reported on the incidence ofneurologic DCI and with precordial bubble Grade and PFO. Wilmshurst, et al.,(66) studied 61 divers with DCI and 63 controls without DCI and reported thatthe incidence of PFO did not impact onset of neurologic DCI more than 30 minafter surfacing but did so for those with early symptoms. Interestingly, theyreported that the group of symptom-free divers had a higher incidence of PF0sthan reported in the echocardiographic studies of healthy individuals. Fur-ther, they also found that many divers with neurologic DCI and Pros had under-gone other dives with more provocative pressure-time profiles yet withoutcomplication. This finding, plus the fact that many symptomless divers hadshunts, adds further evidence to the argument put forth in the present studythat the amount of gas phase present in the venous circulation is likely to be
8

an important factor influencing a reversal of the atrial pressure gradient.S•me of the variability may therefore be due to the degree of venous bubbleformation which is not always predictable, even at identical exposures andwith the same subjects.
The extent of venous bubble formation with decompression is difficult topredict, even with the same individual at identical exposures. The physiolog-ical impact of the bubbles, apart from mechanical obstruction of the pulmonarymicrocirculation, involves other criteria such as gas composition (50,56) aswell as the release of numerous vasoactive mediators that are likely to relateto the total bubble count or gas/blood interface upon which the biochemicalreaction is initiated.
Docompression-induced VAZ react with the blood to induce cellular sur-face changes resulting in the formation of a platelet and lipoidal materialulayer" about the blood/bubble interface (48,65). This material includes anelectron-dense layer of protein, including fibrinogen, that leads to furtherobstruction to blood flow and hence elevation in right heart pressures. Otherblood/bubble biochemical changes include 1) agglutination of red blood cells;2) microthrombus formation; 3) platelet aggregation; 4) neutrophil aggregationand activatior,; 5) alignment and denaturation of plasma proteins; 6) attrac-tion of oriented phospholipids and 7) alterations in blood viscosity, each ofwhich may be involved with the release of vasoactive mediators as well ascapillary permeability changes (7,35,43,45). Platelet aggregation(21,47,48,59) can result in release of ADP, serotonin and catecholamines (47)as well as further potentiate microvascular obstruction. Once activated,neutrophils become larger and less deformable (52,67), which reduce their flowthrough the lungs in acute injury (18). Zmigration of neutrophils to the gasbubbles with subsequent sequestration in the pulmonary capillaries is likelytriggered by a number of chemotactic factors (31) of which complement activa-tion, reportedly increased with decompression (64) is likely to play a role.Wang, et al. (63) reported that VAZ in isolated rat lungs did not increase theleukocyte count in the perfusate but did elevate those leukocytes that wereactivated. Several investigatcrs have also reported a significant elevationin thromboxane B2 with VAR (4,22). Thromboxane B2 is a metabolite of thecyclooxygenase pathway and is an active pulmonary vasoconstrictor. Wang alsoreported increases in endothelin with VAS, which is a recently describedendothelium derived peptide with profound vasoconstrictor effects (15).Although the specific role of each of these vasoactive mediators in the patho-genesis of DCI and the subsequent hemodynamic changes in vascular resistancethat may alter the LAP-RAP gradient are not resolved, it is likely that fur-ther studies in this area will elucidate a combination of cause and effectrelationships.
It has been established that systemic VAE pose a significant risk topersonnel undergoing decompression and further postulated that a PFO may in-crease that risk factor. Reversal of the normal atrial pressure gradient canoccur, at least transiently, with release of a valsalva maneuver, cessation ofpositive pressure breathing, cessation of the L-1 or M-1 anti-G strainingmaneuver, Muller maneuver, negative pressure breathing or even a cough(1,2,23). Further, pulmonary hypertension resulting from hypoxic pulmonaryvasoconstriction as a consequence of altitude exposure (23) or following
9

mediator release caused by VAE may also elevate RAP and contribute to an
atrial pressure gradient reversal.
Altitude decompression resulting in the formation of VAR and DCI has oc-curred for many years and is likely to continue an aircraft altitude capabili-ty increases. Continued exposure of individuals with a PPO to these environ-ments requires a better understanding of their hemodynamic consequences. Thisreport addresses some of these issues.
10

REFEiINCIS
1. Alexander JA, Rembert JC, Sealy WC, Greenfield JC: Shunt dynamics inexperimental atrial septal defects. i Appl Physiol 39:281-285, 1975.
2. Black S, Cucchiara RF, Nishimura RA, Michenfelder JD: Parameters affectingoccurrence of paradoxical air embolism. Anesthesiology 71:235-241, 1989.
3. Black S, Muszi DA, Nishimura RA, Cucchiara RFs Preoperative and intra-operative ochocardiography to detect right-to-left shunt in patientsundergoing neurosurgical procedures in the sitting position. Anesthesiol-ogy 72s436-438, 1990.
4. Bonsignore MR, Rice TR, Dodek PM, Staub NC: Thromboxane and prostacyclinin acute lung injury caused by venous air emboli in anesthetized sheep.Microcirc Endothelium Lymphatics 3:187-212, 1986.
5. Braunwald E, Brockenbrough EC, Frahm CJ, Ross Jr. JR: Left atrial andleft ventricular pressures in subjects without cardiovascular disease.Circulation 24:267-269, 1961.
6. Braunwald E, Frahm CJ: Studies on Starling's law of the heart. IV observa-tion on the hemodynamic functions of the left atrium in man. Circulation24:633-642, 1961.
7. Butler BD: Biophysical aspects of gas bubbles in blood. Med Instrum19:59-62, 1985.
8. Butler BD: Cardiopulmonary effects of decompression bubbles: physiologyof bubbles in the pulmonary and systemic circulation. In USA" SpecialReports Hypobaric Decompression Sickness, Pilmanis AA, ed. ArmstrongLaboratory, Brooks Air Force Base, Texas, pp 53-82, 1992.
9. Butler BD, Hills BA: The lung as a filter for microbubbles. J ApplPhysiol 47:537-543, 1979.
10. Butler BD, Hills BA: Transpulmonary passage of venous air emboli. iAppl Physiol 59:543-547, 1985.
11. Butler BD, Conkin J, Luehr 8: Pulmonary hemodynamics, extravascular lungwater and residual gas bubbles following low dose venous gas embolism indogs. Aviat Space Environ Med 60:1178-1182, 1989.
12. Butler BD, Katz J: Vascular pressures and passage of gas emboli throughthe pulmonary circulation. Undersea Biomed Reo 15s203-209, 1988.
13. Butler BD, Robinson R, Fife C, Sutton T: Doppler detection of decompres-sion bubbles with computer assisted digitization of ultrasonic signals.Aviat Space Inviron Med 62:997-1004, 1991.
11

14. Catron PU, Flynn IT, Yaffe L, Bradley ME, Thomas LB, Hinman D, Survanshi8, Johnson JT, Harrington Js Morphological and physiological responsesof the lungs to acute decompression. J Appl Physiol 57:467-474, 1984.
15. Cernacek P, Stewart DJ: Imuunoreactive endothelin in human plasma:marked elevations in patients in cardiogenic shock. Biochem Biophys RemComun 61:562-587, 1989.
16. Clark JB, Hayes GB: Patent foramen ovale and type II altitude decompres-sion sickness. Proceedings Annual Meeting Aerospace Medical Association,Al, 1991.
17. Cucchiara RF, Nishimura RA, Black S: Failure of preoperative echo testingto prevent paradoxical air embolism: report of two cases. Anesthesiology71:604-607, 1989.
18. Doerr TA, Rosolia DL, Peters SP, Gee XH, Albertine KH: PGE 1 inhibitedPHN attachment to air emboli in vivo during infusion of ZAP withoutpresenting lung injury. J Appl Physiol 72:340-351, 1992.
19. Dubourg 0, Bourdarias JP, Farcot JC, Gueret P, Terdjman M, Ferrier A,Rigaud M, Barclet JC: Contrast echocardiographic visualization of cough-induced right-to left shunt through a patent foramen ovale. 3 Am CollCardiol 4:587-594, 1984.
20. Durant TN, Long S, Oppenheimer NJ: Pulmonary (venous) air embolism.Amer Heart 1 33:269-281, 1947.
21. Frattali V, Quesada M, Robertson R: Supportive evidence for alteredplatelet function in the dived rat. Undersea Biomed Rem 2:167-172,1975.
22. Fukushima M, Kobayashi T: Effects of Thromboxane synthase inhibition onair emboli lung injury in sheep. J Appl Physiol 60:1828-1833, 1986.
23. Garrett JL: The role of patent foramen ovals in altitude-induced decom-pression sickness. in: The Proceedings of the 1990 Hyperbaric Decompression Sickness Workshop, ed: AA Pilmanis, Armstrong Laboratory, Brooks AFBTX, AL-SR-1992-0005:81-93, 1992.
24. Gottdiener JS, Papademetriou V, Notargiacomo A, Park WY, Cutler J:Incidence and cardiac effects of systemic venous air embolism. ArchIntern Ned 148:795-800, 1988.
25. Guggiari M, Lechat P, Garen-Colonne C, Fusciardi J, Viars P: Earlydetection of patent foramen ovals by two-dimensional contrast echocardi-ography for prevention of paradoxical air embolism during sitting posi-tion. Anesth Analg 67:192-194, 1988.
26. Hagen PT, Scholz DG, Edwards WDs Incidence and size of patent foramenovals during the first 10 decades of life: an autopsy study of 965normal hearts. Mayo Clin Proc 59:17-20, 1984.
12

27. Hills BA, Butler BD: Size distribution of intravascular air emboliproduced by decompression. Undersea Biomed Rem 8S163-170, 1981.
28. Holt EP, Webb WR, Cook WA, Unal MO: Air embolism. Hemodynamics andtherapy. Ann Thorac Surg 2:551-559, 1966.
29. Jaffe RA, Pinto FJ, Schnillger I, Siegel LC, Wranne B, Brock-Utne JG:Aspects of mechanical ventilation affecting interatrial shunt flowduring general anesthesia. Aneuth Analg 75:484-488, 1992.
30. Josephson 8: Pulmonary air embolization in the dog. II. Evidence andlocation of pulmonary vasoconstriction. Scand J Olin Lab Invest 26:113-123, 1970.
31. Kindt GC, Gadek J3, Weiland JE: Initial recruitment of neutrophils toalveolar structures in acute lung injury. J Appl Physiol 70:1575-1585,1991.
32. Konstadt SN, Louie EK, Black S, Rao TLK, Scanlon P: Intraoperativedetection of patent foramen ovals by transesophageal echocardiography.Anesthesiology 74:212-216, 1991.
33. Lechat P, Mas JL, Lascault G, et al: Prevalence of patent foramen ovalsin patients with stroke. N Engl J Med 318:1148-1152, 1988.
34. Lee RJ, Bartzokis T, Yeah TK, Grogin HR, Choi D, Schnittger Is Enhanceddetection of intracardiac sources of cerebral emboli by transesophagealechocardiography. Stroke 22:734-739, 1991.
35. Lee Jr WH, Hairston P: Structural effects upon blood proteins at thegas-blood interface. Fed Proc 30:1615, 1971.
36. Levy SE, Stein M, Totten RS, Bruderman I, Wessler S, Robin ED: Ventila-tion-perfusion abnormalities in experimental pulmonary embolism. J ClinInvest 44t1699-1707, 1965.
37. Lynch JJ, Schuchard GH, Gross CM, Wann LS: Prevalence of right-to-leftatrial shunting in a healthy population: detection by valsalva maneuvercontrast echocardiography. Am J Cardiol 53:1478-1480, 1984.
38. Marquez J, Sladen A, Gendell H, Boehnke M, Mendelow H: Paradoxicalcerebral alr embolism without an intracardiac septal defect. J Neurosurg55:997-1000, 1981.
39. Matsuda T, Toma Y, Matsuzaki M, Moritani K, Satoh A, Shiomi K, Ohtani N,Kohno M, Fujil T, Katayama K, Matsuda M, Kusukawa R: Change in leftatrial systolic pressure waveform in relation to left ventricular end-diastolic pressure. Circulation 82:1659-1667, 1990.
40. Hehta M, Sokoll MD: Relation of right and left atrial pressure duringvenous air embolism. Anesthesiology 55:A238, 1981.
13

41. Noon RZ, CamporeuL EM: Right-to-left shunting and decompression sickness.Undersea Bhomed Research 15 (Suppi) 18, 1988.
42. Moon RE, Kiuslo JA, Massey RW, Fawcett TA, Thoul DRt Patent foramenoval* (PFO) and decompression illness. Undersea Bhomed Rem 18 (Suppi)15, 1991.
43. Hourath H, Greenstein JP, Putnam TN, Erickson JO: The chemistry ofprotein denaturation. Chem Rev 34t157-266, 1944.
44. Widen AN, Aviado DX: Effects of pulmonary embolism on the pulmonarycirculation with special reference to arteriovenous shunts in the lung.Circ Res 4:67-73, 1956.
45. Ohkuda K, Nakahara A, Binder A, Staub NCt Venous air embolis reversibleincrease in lung microvascular permeability. J Appl Physiol 51:887-894,1981.
46. Pearson AC, Labovitz Aj, Tatineni S, Gomez CR: Superiority of tranesopha-geal echocardiography in detecting cardiac source of embolism in patientswith cerebral ischemia in uncertain etiology. J Am Coll Cardiol 17:66-72, 1991.
47. Philp 33, Schacham P, Gowdey CW: involvement of platelets and microthrom-bi in experimental decompression sickness: similarities with disseminatedintravascular coagulation. Aerosp Ned 42:494-502, 1971.
4S. Philp RD, Inwood NJ, Warren BA: Interactions between gas bubbles andcomponents of the blood. Aerospace Med 43t946-953, 1972.
49. Powell MR, Spencer MP, von Ramm 0: Ultrasonic surveillance of decompres-sian. In: Sennett PS, Elliott DH, eds. The Physiology and Medicine ofDiving. 3rd ed. London: Bailliere Tindall..1982:404-434.
50. Presson Jr. RG, Kirk KR, Haselby IA, Wagner Sr. NW: Effect. of ventilationwith soluble and diffusible gases on the size of air emboli. J ApplPhysiol 70:1068-1074, 1991.
51. Rafferty TDt Intraoperative transesophageal saline-contrast imaging offlow-patent foramen oval*. Anesth Analg 75:475-480, 1992.
52. Rothe 0, Xellermann W, Valet GZ Flow cytometric par-meters of neutrophilfunction as early indicators of sepsis- or trauma-related pulmonary orcardiovascular organ failure. J Lab Clin Med 11552-61, 1990.
53. Silver AN, Swan Bic, Kirklin 3W: Demonstration by dye dilution technicsof preferential flow across atrial septal defects from right pulmonaryveins and inferior von& cava. Fed Proc 13:138, 1954.
54.* Soloff LA, Rodman T: Acute pulmonary embolism. 1.* Review. Am Heart J74:710-724, 1970.
14

55. Spencer MP: Decompression limits for compressed air determined by ultra-sonically detected blood bubbles. J Appl Physiol 40:229-235, 1976.
56. Spencer NP, Oyama Y: Pulmonary capacity for dissipation of venous gasemboli. Aerospace Mod 42:822-827, 1971.
57. Strunk BL, Cheitlin MD, Stulbarg MS, Schiller NB: Right-to-left interat-rial shunting through a patent foramen ovals despite normal intracardiacpressures. Am J Cardiol 60:413-415, 1987.
58. Swan HJC, Burchell HB, Wood ZH: The presence of venoatrial shunts inpatients with interatrial communications. Circulation 10:705-713, 1954.
59. Tanoue K, Mano Y, Kuroiwa K, Suzuki H, Shibayama M, Yamazaki H: Consump-tion of platelets in decompression sickness of rabbits. J Appl Physiol62:1772-1779, 1987.
60. Thompson T, Ivans W: Paradoxical embolism. Q J Med 23:135-150, 1930.
61. Vik A, Brubakk AO, Hennessy TR, Jenssen BM, Nkker M, Slrdahl SA: Venousair embolism in swine: transport of gas bubbles through the pulmonarycirculation. J Appl Physiol 69:237-244, 1990.
62. Vik A, Jenssen BM, Brubakk AO: Paradoxical air embolism in pigs with apatent foramen ovals. Undersea Biomed Rem 19:361-374, 1992.
63. Wang D, Li K-H, Hsu K, Shea C-Y, Chen HI, Lin Y-C: Air embolism-inducedlung injury in isolated rat lungs. J Appl Physiol 72:1235-1242, 1991.
64. Ward CA, McCullough D, Fraser %,): Relation between complement activationand susceptibility to decompression sickness. J Appl Physiol 62:1160-1166, 1987.
65. Warren BA, Philp RB, Inwood MJ: The ultrastructural morphology of airembolism. Br J Nxp Pathol 54:163-172, 1973.
66. Wilmshurst PT, Byrne SC, Webb-Peploe MM: Relation between interatrialshunts and decompression sickness in divers. Lancet Dec 2:1302-1305,1989.
67. Worthen GS, Schwab 111 B, Elson N1, Downey GP: Mechanics of stimulatedneutrophils cell: stiffening induces retention in capillaries. Science24:182-186, 1989.
15

Table 1
VENOUS AIR INFUSION
AIR DOSE 0.025 ml*kg 1l*min1l (N - 6)
Baseline 60 mm 120 min 180 min
HP16S±7 157±6 155±5 148 ±6PAP 13.1±1.2 16.3 * ft.7 16.5 ± 1.3 17.3 ±1.5RMfm -0.4±0.9 0.1±1.2 -0.4_±0.7 -0.6±0.4RhPp 1.3±1.0 2.7±1.4 2.0±0.8 1.5±0.6LVZD~m 4.7±1.2 4.6±0.7 4.4±0.6 5.1±1.0LVUDPP 5.0±1.4 5.6±1.1 5.8±+1.1 5.7±1.0RV~k 8.0±0.5 10.0±1.9 8.4±1.1 8.9±2.3RYPs 20.3±1.7 22.2±2.9 20.8±1.8 21.5±1.6RVPd 1.6±0.5 2.3±1.1 1.a8±0.5 2.2±0.7LVEDP-RA~m 5.1±0.9 4.6±1.1 4.8±+0.4 5.7±0.7LVEDP-RAhpt 3.7±0.8 2.8±1.2 3.8±1.2 4.2±0.7HR (beats/min) 166±6 165±5 148±4 145±5CO (liters/min) 3.22±0.2 3.01±0.3 2.;48:±0.2 2.26±t0.2PVR (dyn*s*cm-5) 217±43 310L±21 3950±30 441 ±38TPR (dyfl*o*cm-5) 4150±276 4334±365 5192±525 5487±609
BLOOD GASES
~2(~)102+3 96.4±4 94.9±6 98.5ý±4paCO2 (Mfg) 29.8±+0.4 32.9±+0.6 34.2'1.2 34.5±1.4PH 7.43±0.01 7.38 ±.01 7.37'±0G01 7.36*_±0.01
ETcO2 (Nang) 33L±1.4 31±2.6 28±2.3 28±+2.1
02-Sat-(% 98±+0.6 97±0.9 96±1.1 96_±1.0
NO=E: 1. Pressure units are mm~g2. * is p <0.05 vs. Baseline3. + LVEDP and RAP values taken at peak inspiration4. a man, a systolic, d -diastolic, p -peak
16

Table 2
VENOUS AIR INFUSION
AIR DOSEM 0.05 ml*kg-l*min-1
Baseline 60 min 120 min T 180 min
MAP 160±5t 142±9 150+6 154±4PAP 15.7±1.8 19a2*±1.6 19.2-±1.5 19.2 *±1.5RAPm 1.1±0.5 0±0.2 0±0.3 0.3±+0.4RAPp 4.1±0.9 3.0±0.5 3.1±0.5 3.4±0.8LVIDPM 6.2±1.1 4.5±0.7 4.2±0.3 6.5±1.0LVUDPp 7.6±1.3 6.2±1.1 6.0±0.4 7.2+1.4RVPm 12.5+1.5 14.0±1.8 12.3+1.5 11.8±1.0RVPs 25.1+1.6 26.5±0.8 26.7±2.2 25.5+2.3RVPd 0.3+1.1 2.0±0.6 1.4+0.8 2.0±1.4LVEDP-RAPm 5.1±0.9 4.7+0.6 4.2±0.4 6.3±1.1LVEDP-RAPp+ 3.5±0.9 3.1±1.2 2.9±0.7 3.8±1.6HR (beats/aln) 160±17 168±9 159+9 155±7CO (liters/min) 4.21+0.5 3.55+0.4 3.13"±0.4 2.69"±O.3PVR (dyn*s*cm-5) 193±28 363±82 437*±103 4265±98TPR (dyn*s*cm-5) 3267+409 3338±283 4048±405 4956±767
BLOOD GASES
paO2 (mmHg) 115_±4 96.4 *+4 101+7 98.4±8paCO2 (mmHg) 35.6±1.5 40.1±1.4 41.9±1.9 41.3±1.1pH 7.36±0.01 7.32* ±0.01 7.33+0.01 7.33±0.01ZT-CO2 (mmHJg) 34±1.0 33±0.5 31+1.0 31±1.60 2 -Sat (M) 96±0.4 94+0.4 94±0.7 94±1.2
NOTES: 1. Pressure units are mmHg2. * is p < 0.05 vs. Baseline3. + LVEDP and RAP values taken at peak inspiration4. m - mean, s - systolic, d - diastolic, p - peak
17
fL

I , I
Table 3
VENOUS AIR INFUSION
AIR DOSEM 0.15 ml*kg-l*min-1
Baseline 60 min 120 min 180 min
NAP 155±8 129+14 134+11 139:±9
PAP 13.4±0.9 26.3*_+0.9 27.0 *+1.3 27.4 +0.9RAPs -1.0±+0.6 -0.2±0.6 0.0±-0.8 0.0+0.6RAPp 2.1±0.7 3.3±0.5 3.8+0.8 2.9±0.9
LVxDPm 5.7±0.7 5.3±0.9 5.6±1.1 6.1±0.9
LVEDPp 7.2±0.7 6 7±1.1 6.5±1.3 7.7+1.0RVPm 8.5±1.2 14.9 +0.4 19.6*+4.4 17.0 ±1.7RVPs 16.7+1.3 31.8"±2.9 32.1 ±2.3 34.9 +1.5
RVPd 3.1±0.8 4.8±1.4 3.6+0.6 4.6+2.2LVEDP-RAPm 6.4+0.6 5.5+1.1 5.8+1.0 6.2±0.9LV3DP-RAPp+ 5.1±0.2 3.3±0.9 2.7+1.1 4.8±1.1HR (beats/min) 161±9 148±9 151+12 135±10CO (liters/mmn) 2.81±0.1 2.87±0.2 2.88+0.1 2.87±0.1PVR (dyn*s*cU--5) 233±30 601*±52 593* ±40 594 *+27
TPR (dyn*s*cm-5) 4468±+231 3636+386 3761±394 3921±326
BLOOD GASES
paO2 (uuHg) 116+2 70.2 *+6 76.6 +6 83.1 ±70aC2 (mmB9)3.9_1 -paC02 (ing) 37.9±3.1 47.6 +1.9 47.6"+1.8 47.5*+2.3
pH 7.34±0.03 7.25±0.01 7.26±0.01 6.42*±0.84ET-002 (MMHg) 35+±0.5 28*+1.2 27* *1.3 27 ±1.3O2 -Sat (%) 96+0.5 90 +1.4 90*4+2.1 91±2.6
NOTESs 1. Pressure units are mmHg2. * is p < 0.05 vs. Baseline3. + LVXDP and RAP values taken at peak inspiration4. m - mean, s - systolic, d - diastolic, p - peak
-•. 18

Table 4
HYPERBARIC DECOMPRESSION
POST DIVE
Baseline J10 Min 1 30 Min 60 Min 1 90 Min
MAP 128±15 133±7 126+7 127+9 126+9PAP 8.3+_1.8 7.1±0.6 9.4±1.9 7.6+0.8 7.8±1.4.APfa -2.4±-+0.9 -2.7±0.3 -2.4+0.3 -2.3±0.3 -2.4+0.3
JAPp 0.0±10.4 0.66±0.8 0.5+0.3 0.1±0.3 0±0.3LV3DPW 3.1±L0.3 2.0+0.2 2.4±0.2 2.7±0.3 2.4±0.4LVWDPp 3.5±0.4 3.1±0.9 2.1+0.4 2.3+0.4 2.3±0.4
RVP 6.2±1.7 7.5+2.0 6.7+1.3 5.3±+1.0 5.4+0.7RVP8 20.6±2.3 16.8+1.9 17.5±1.3 16.9±2.5 16.1±1.2RVPd -1.4±0.5 -0.9±0.4 -0.6±1.0 -0.5±0.9 -0.9±+0.5LVxDP-RAPm 5.4±0.8 4.6±0.5 4.8+0.5 5.0±0.5 4.9±0.5LVKDP-RAPp 4.5±0.4 2.6+0.9 1.2"±0.5 2.3*±0.4 2.4* ±0.4HR (beats/min) 162±11 108±21 105+18 126±+5 123±6CO (liters/min 1.65±0.7 1.21±0.3 1.01+0.1 1.06_+0.2 0.87"_+0.1
PVR (dyn*s*cm-1) 250±81 368+97 638i ±228 408+105 514 +117TPR (dyn*s*cm•5 ) 6392±859 10580±+2058 10573±1188 10334±+1438 12215 +1479
BLOOD GASES
paO2 (mmHg) 103+7.3 123"±7.1 120"±6.1 124"±5.6 121"±7.0paCO2 (mm~g) 37.1±1.6 39.4+2.6 38.5±0.9 37.0±0.9 37.4±+1.7pH 7.34±0.02 7.33±0.02 7.33±0.01 7.35±0.01 7.34±0.01
ZT-O2 (mHg) 34±1 34±4 31±3 29±2 28 *±2
0 2 -Sat (S) 98±+1 100±+0 100±3.5 100±+0.5 100±0
NOTES: 1. Pressure units are mmHg2. * is p < 0.05 vs. Baseline
3. LVEDP and RAP values taken at peak inspiration4. m - mean, 9 = systolic, d = diastolic, p = peak
19

Table 5
ALTITUDE DECOMPRESSION (N - 6)
40,000 FEET
Baseline1 0 Min 60 Min 120 Min 1 180 Min I Post Flt
MAP 138±4 144+5 133±3 134+4 136+5 128+5
PAP 9.6+1.1 14.9'±1.4 17.6*+2.6 19.6*42.7 19.:8+3.0 11.5+1.9RAPp 2.5±0.7 2.3±1.3 2.9+0.9 1.8#;.1.3 1.0 0_.9 2.5+0.4LVzDPM 3.1±0.5 5.5±0.1 4.5+0.5 5.0±0.2 4.3+0.3 4.1+0.2LVZDPp 4.7±0.8 6.5±1.7 7.1±1.4 6.3±1.6 5.3+1.7 6.0+1.8RVP 6.7±1.7 8.2±2.8 9.2±2.5 1022.1 2 5.9+1.8
RVPs 23.5±1.7 27.0±3.7 28.0+6.6 37.5*+2.2 29.8±3.9 21.3+1.9RVPd -0.1+0.9 -0.4+1.8 1.4+2.6 5.1 ±0.9 4.4+1.4 -0.1+1.4LVEDP-RAPm 3.5±1.2 6.0±1.2 4.3+1.7 3.9+1.7 3.7+1.4 4.2+1.6LVZDP-RAPp 2.2±0.9 4.2±1.8 5.4±2.8 3.8±1.8 2.9+1.3 3.4+1.8HR (boats/min) 175±10 172±13 154"+10 153"+8 149"+6 149*+7CO (liters/mini 2.21±0.5 - -.. 1.84"+0.5PVR (dyn*s*cm-_) 333±62 505*+115TPR (dyn*s*cm- 5 ) 6145+1096 7088+1231
BLOOD GASES
paO2 (mmHg) 100.5±5.3 .... 153.4+47paco2 (mmug) 43.8+0.9 .... 45.2+2.0pH 7.30+0.02 .... 7.3+0.02
NOTES: 1. Pressure units are mmHg2. * is p < 0.05 vs. Baseline3. LVEDP and RAP values taken at peak inspiration4. m - mean, s - systolic, d - diastolic, p - peak5. 0 - Values affected by clotting of lines
"20
PULMONARY ARTERY AND RIGHT ATRIAL PRESSURES
25-
15 - -PAP 0.0
5 -*-- PAP 0.05'
E -0- PAP 0.15"2-,- HYPO PAP"
RAP 0.M5
5 - RAP 0.05
SRAP 0.15
--- HYPO RAP
-5.BASELINE 1 2 3
TIME (Hr)
Figure 1: Pulmonary artery pressures (TOP) and LVEDP-RAP(BOTTOM) gradient over time in both venous airembolism and altitude stimulated studiesHYPO = hypobaric
21

RIGHT VENTRICULAR PRESSURE WITHDECOMPRESSION
40-
30
20 HYPO RVPME HYPO RVPmE 10 HYPER RVPS
HYPER RVPM
01
"TIME
RIGHT VENTRICULAR PRESSURE WITH VAE
35-RVP 0.025d25- -- - RVP 0.05dRVP 0.15d
RVP O.M5RVP 0.025s
E RVP 0.15S-U- RVP 0.025m
-I RVP 0.05m5. - _RVP 0.15m
5-
E 1BAsSE2 3
TIME
Figure 2: Right ventricular mean, diastolic, and systolicpressure values with decompression (TOP) andvenous air embolism (BOTTOM)
22

K
CARDIAC OUTPUT: 5
4-
S 3--u-CO 0.025
-- CO 0.05Co 0.15
-CO HYPER1 CO HYPO
0 BASELE 2 3
TIME
PULMONARY VASCULAR RESISTANCE
700-
600-
500.
1300-S•'• -,-e--PVR 0.025"
300 PVR 0.05"i "-="-" PVR 0.15 *S-PVR HYPOBARIC*
200 " PVR HYPERBARIC"
10 BAS.NE1 2 3
TIME
Figure 3: Cardiac output (TOP) and pulmonary vascularresistance (BOTTOM) with decompression andvenous air embolism
23

LVEDP - RAP PRESSURE GRADIENT
7"
6.
5- VAE 0 .0O25m0 £3 VAE O.0m
4 • VAEO.15m
* HYPERBARICm
A HYPOBARIC m
[] 0 VAE 0.o2p
2' 0 VAE 0.05p
U VAE 0.15p
1 0- HYPERBARIC p
A HYPOBARIC p
0
-1 BASE NE1 2 3
TIME (Hr)
Figure 4: Peak LVEDP-RAP gradient pressure change
24
*U.*. GOVErNMENT "UTING OmIE: •m 11&4. N