best emc practice of high performance electronic device
TRANSCRIPT

1 August 3, 2017 ANSYS UGM 2017© 2017 ANSYS, Inc.
Best EMC Practice of High Performance Electronic Device
陈海平 Desmond Tan
ANSYS Singapore
2 August 3, 2017 ANSYS UGM 2017© 2017 ANSYS, Inc.
Summary
• Far-Field EMI Analysis Methodology and
Verification on SSD Boards
• Simulate with accuracy for high speed
connector
3 August 3, 2017 ANSYS UGM 2017© 2017 ANSYS, Inc.
Far-Field EMI Analysis Methodology
and Verification on SSD Boards
4 August 3, 2017 ANSYS UGM 2017© 2017 ANSYS, Inc.
Contents
• Introduction
• Far-Field EMI Simulation Methodology
− Proposed EMI simulation flow
− PCB-level EMI solution
• Correlation
− Simulation vs. Measurement
• Relationship Between Board Design and Far-Field EMI
• Q & A

5 August 3, 2017 ANSYS UGM 2017© 2017 ANSYS, Inc.
Trends of Data Storage
• Hard Disk Drive (HDD) Solid-State Drive (SSD) − Higher read/write rate, Faster access time, Lower power consumption
Source: www.google.com Source: www.samsung.com
SSD HDD Different
Media NAND FLASH Magnetic Platters
Read/Write Speed Sequential [MB/s] 540 / 330 60 / 160 ⅹ9 / 2
Random [IOPS*] 98000 / 70000 450 / 400 ⅹ217 / 175
Data Access Time [ms] 0.1 10~12 ⅹ100~120
Power Consumption
Active(Idle) [W] 0.127(0.046) 1.75(0.8) ⅹ13 ↓(ⅹ17 ↓)

6 August 3, 2017 ANSYS UGM 2017© 2017 ANSYS, Inc.
Potential EMI Risk in SSD Products
• Speed and density are continuously increasing ...
Source: High-speed digital system design
Source: www.google.com
Electromagnetic interference (EMI) becomes a critical issue !

7 August 3, 2017 ANSYS UGM 2017© 2017 ANSYS, Inc.
EMI Simulation Methodology
• Measurement-based EMI verification requires additional cost and time to debug
∙ Firmware Solution ∙ Operating Frequency Change ∙ Spread Spectrum Clock ∙ Shielding Solution ∙ Design Revision
Product Design
Fabrication
EMI Test Product
Re-Design
Mass Production
PASS FAIL
Product Design
Fabrication
EMI Test Product
Re-Design
Mass Production
PASS FAIL
EMI
Simulation
∙ PCB Deign Improvement
Conventional Flow
Improved Flow
8 August 3, 2017 ANSYS UGM 2017© 2017 ANSYS, Inc.
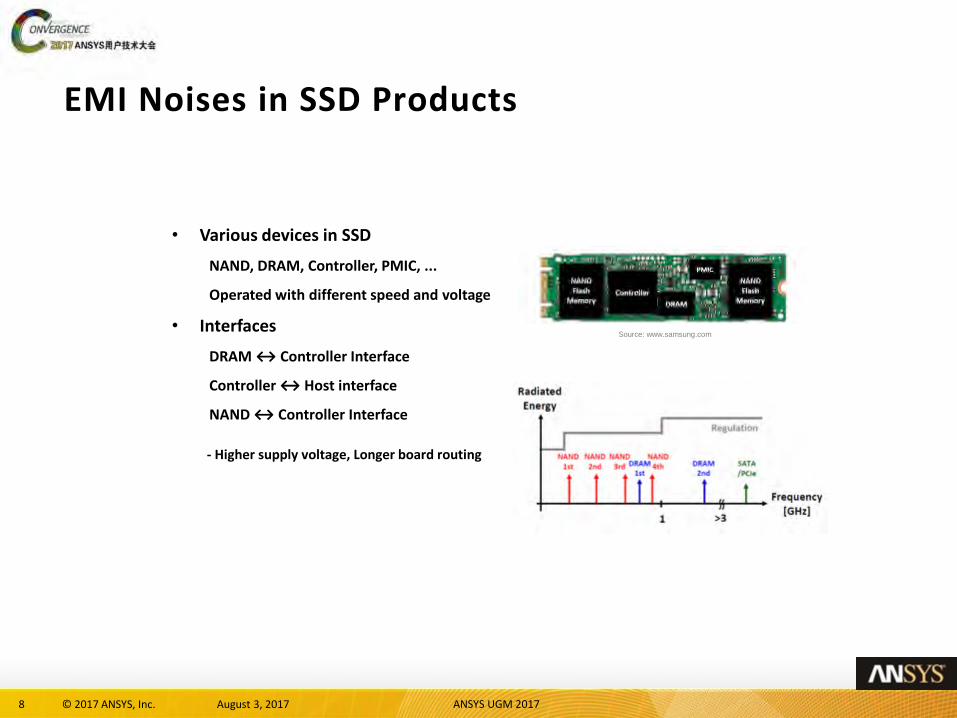
EMI Noises in SSD Products
• Various devices in SSD
NAND, DRAM, Controller, PMIC, ...
Operated with different speed and voltage
• Interfaces
DRAM ↔ Controller Interface
Controller ↔ Host interface
NAND ↔ Controller Interface
- Higher supply voltage, Longer board routing
Source: www.samsung.com
9 August 3, 2017 ANSYS UGM 2017© 2017 ANSYS, Inc.
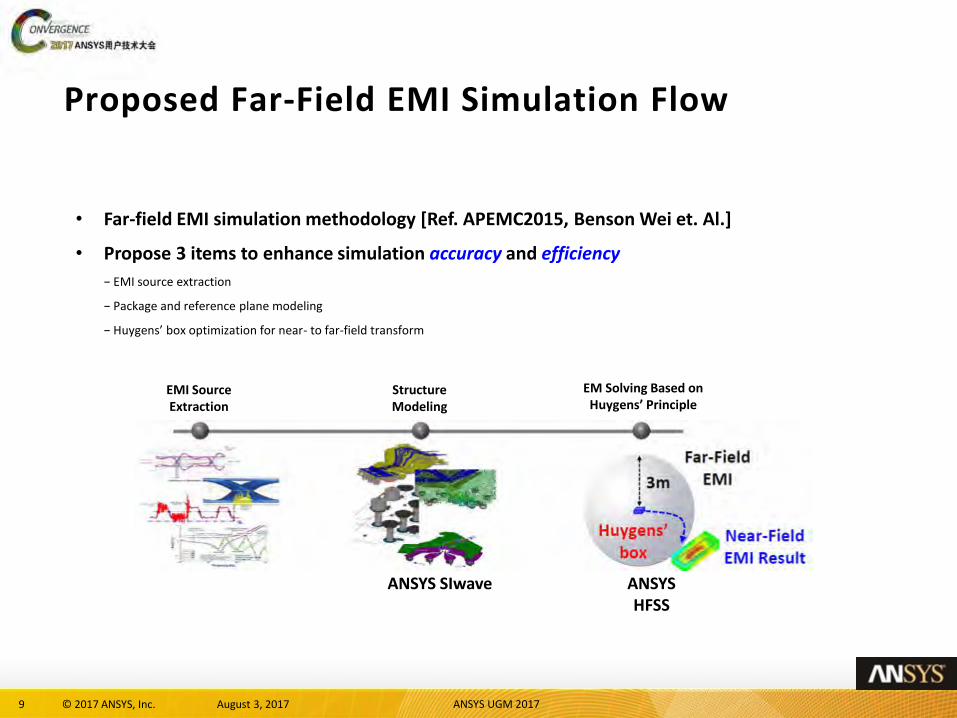
Proposed Far-Field EMI Simulation Flow
• Far-field EMI simulation methodology [Ref. APEMC2015, Benson Wei et. Al.]
• Propose 3 items to enhance simulation accuracy and efficiency
− EMI source extraction
− Package and reference plane modeling
− Huygens’ box optimization for near- to far-field transform
EMI Source Extraction
Structure Modeling
EM Solving Based on Huygens’ Principle
ANSYS HFSS
ANSYS SIwave
10 August 3, 2017 ANSYS UGM 2017© 2017 ANSYS, Inc.
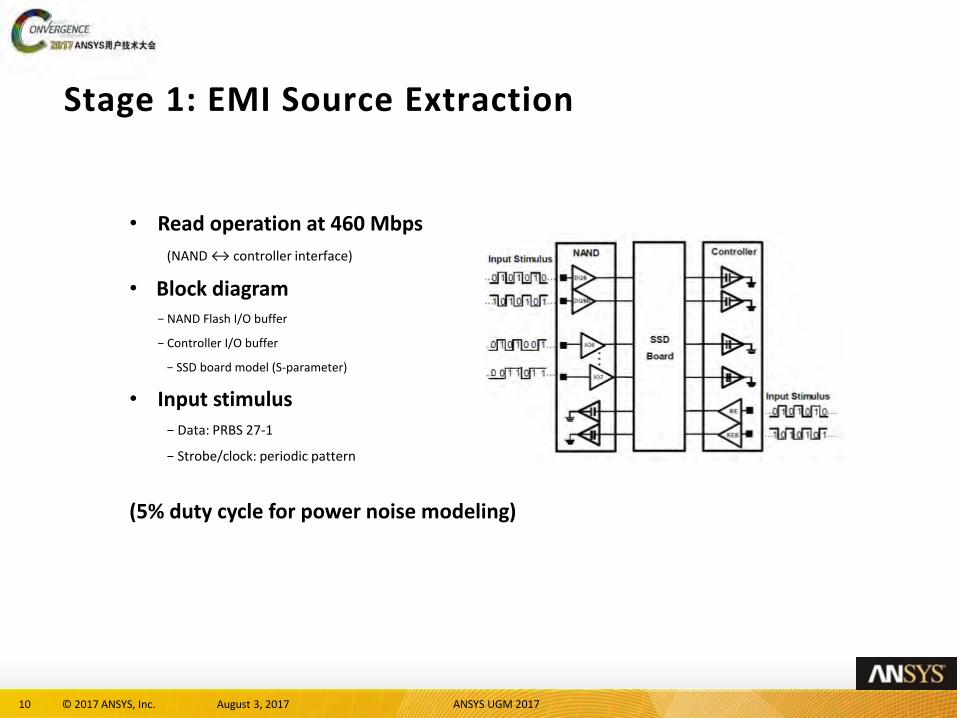
Stage 1: EMI Source Extraction
• Read operation at 460 Mbps
(NAND ↔ controller interface)
• Block diagram − NAND Flash I/O buffer
− Controller I/O buffer
− SSD board model (S-parameter)
• Input stimulus
− Data: PRBS 27-1
− Strobe/clock: periodic pattern
(5% duty cycle for power noise modeling)

11 August 3, 2017 ANSYS UGM 2017© 2017 ANSYS, Inc.
Stage 2: Structure Modeling (1)
• EM simulation with package and board together
− Impractical solution due to simulation time and hardware resources
• Propose virtual package model with metal plane
Real PKG model
Virtual PKG model
Both simulation results have similar tendency

12 August 3, 2017 ANSYS UGM 2017© 2017 ANSYS, Inc.
Stage 2: Structure Modeling (2)
Ground Reference
Power /Ground Reference

13 August 3, 2017 ANSYS UGM 2017© 2017 ANSYS, Inc.
Stage 3: EM Solving Based on Huygens’ Principle
• Near- to far-field transform method based on Huygens’ principle
− Radiated energy simulation at 3-m distance from micro-unit SSD board
N/F Simulation – 2.5D EM solver (ANSYS SIwave)
Attach I/O current as EMI source Maximum electric field calculation at 3-m sphere surface
F/F Simulation – 3D EM solver (Ansys HFSS)
How to optimize Huygens’ box size?
3m
Huygens’ box

15 August 3, 2017 ANSYS UGM 2017© 2017 ANSYS, Inc.
Stage 3: EM Solving Based on Huygens’ Principle (cont’d)
• Huygens’ box size optimization
− Optimized box size is necessary to minimize simulation error for near- to far-field transform
− Radiated field is saturated from 10-mm box size
16 August 3, 2017 ANSYS UGM 2017© 2017 ANSYS, Inc.
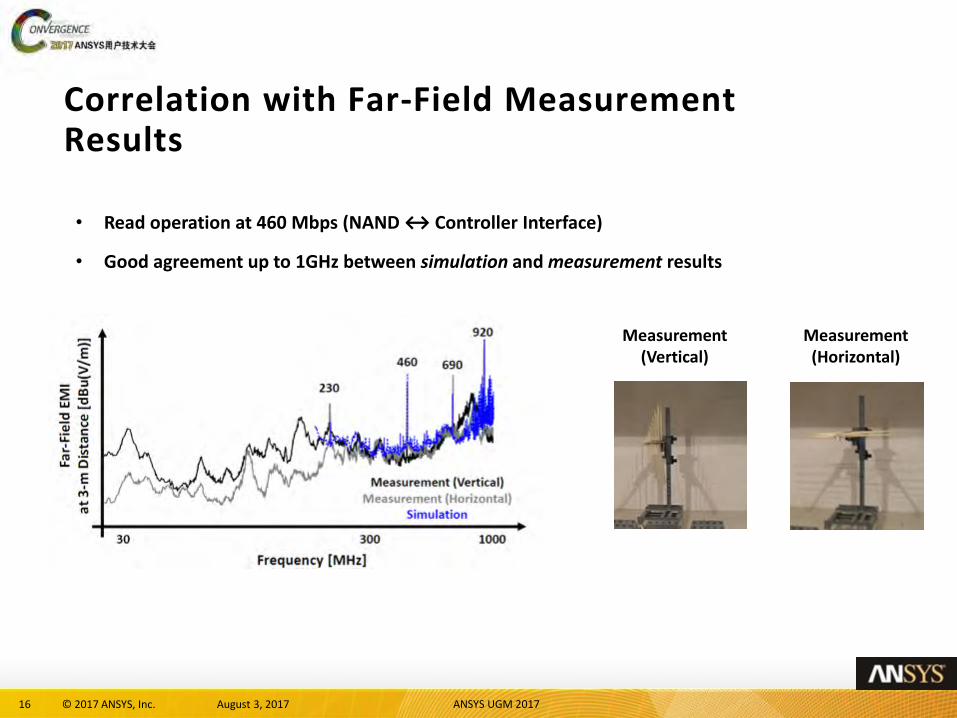
Correlation with Far-Field Measurement Results
• Read operation at 460 Mbps (NAND ↔ Controller Interface)
• Good agreement up to 1GHz between simulation and measurement results
Measurement (Vertical)
Measurement (Horizontal)
17 August 3, 2017 ANSYS UGM 2017© 2017 ANSYS, Inc.
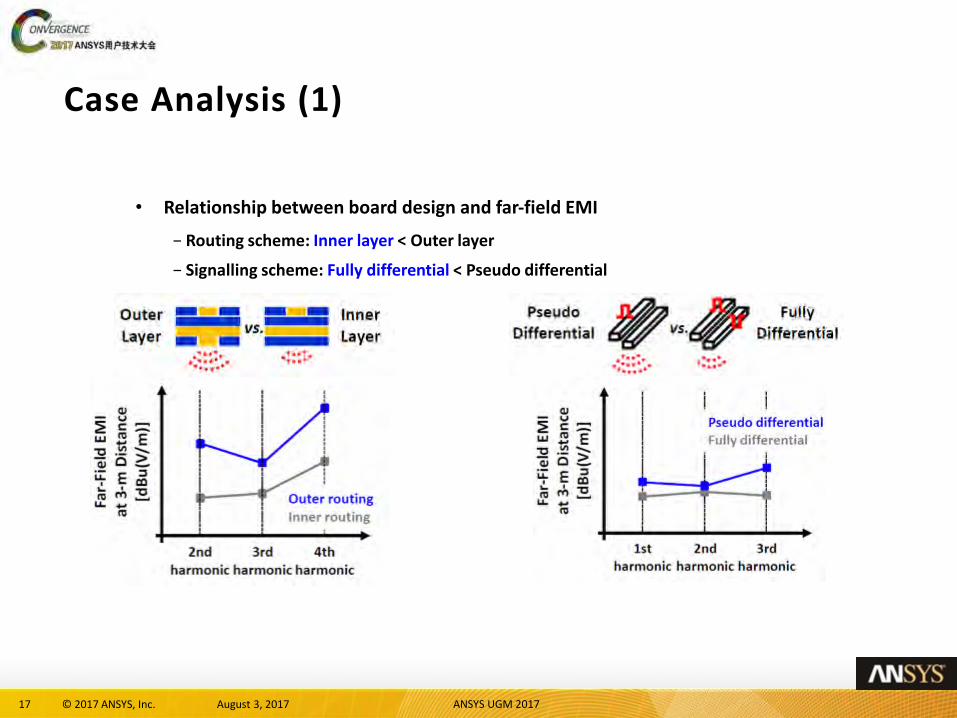
Case Analysis (1)
• Relationship between board design and far-field EMI
− Routing scheme: Inner layer < Outer layer
− Signalling scheme: Fully differential < Pseudo differential

18 August 3, 2017 ANSYS UGM 2017© 2017 ANSYS, Inc.
Case Analysis (1)
• Relationship between board design and far-field EMI
− Number of layer: 12 layer < 10 layer
− Number of channel: 4 channel < 8 channel
19 August 3, 2017 ANSYS UGM 2017© 2017 ANSYS, Inc.
Conclusion
• Far-Field EMI Simulation Methodology on Commercial SSD Products
− EMI source extraction
− PCB structure modeling
− EM solving method based on Huygens’ principle
• Good Correlation Between Simulation and Measurement Results
• Relationship Between Board Design and Far-Field EMI
− Routing scheme, signal scheme, number of board layer and channel
• EMI Analysis in the Design Stage Prior to the Manufacturing Process

20 August 3, 2017 ANSYS UGM 2017© 2017 ANSYS, Inc.
Simulate with accuracy for high
speed connector
21 August 3, 2017 ANSYS UGM 2017© 2017 ANSYS, Inc.
Objective
• Correlate simulation and measurement data of
customized Molex SAS-3 plug 78695 mated
with Molex SAS-3 receptacle.
• Both Differential S parameter and TDR are
extracted for correlation.
22 August 3, 2017 ANSYS UGM 2017© 2017 ANSYS, Inc.
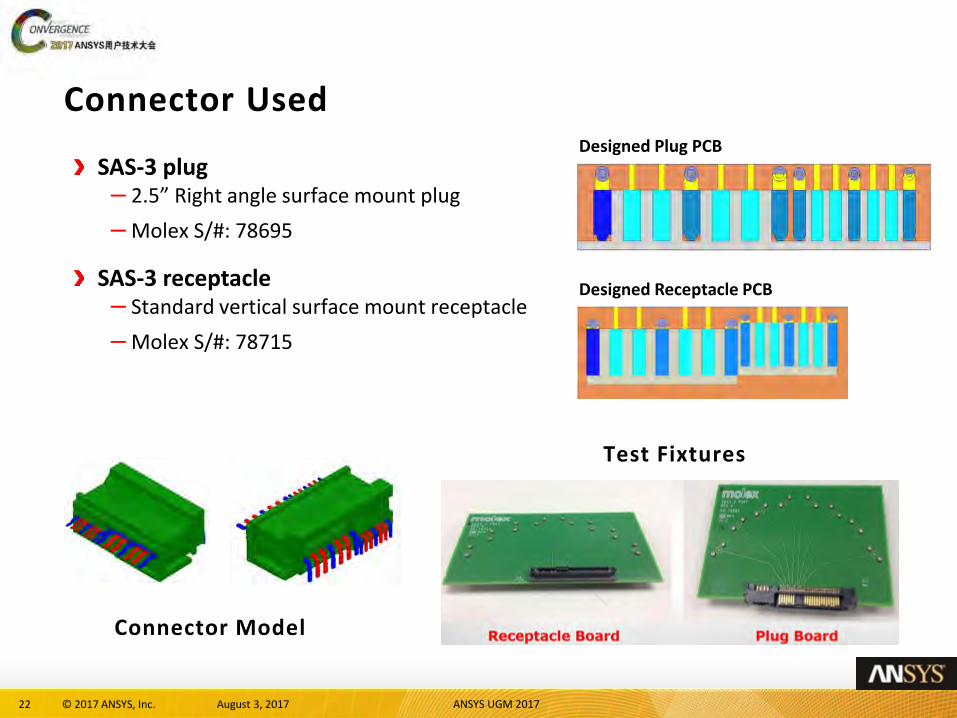
Connector Used
SAS-3 plug – 2.5” Right angle surface mount plug
– Molex S/#: 78695
SAS-3 receptacle – Standard vertical surface mount receptacle
– Molex S/#: 78715
Test Fixtures
Designed Plug PCB
Designed Receptacle PCB
Connector Model
23 August 3, 2017 ANSYS UGM 2017© 2017 ANSYS, Inc.
Differential S-Parameter Correlation Results
24 August 3, 2017 ANSYS UGM 2017© 2017 ANSYS, Inc.
0.00 2.00 4.00 6.00 8.00 10.00 12.00 14.00 16.00 18.00 20.00Freq [GHz]
-8.00
-7.00
-6.00
-5.00
-4.00
-3.00
-2.00
-1.00
0.00
Magnitude [
dB
]
Measurement_results_IL_RL_SCC11DiffIL (S2 & S3)
Curve Info
Measured
SAS-3 spec
Simulation
0.00 2.00 4.00 6.00 8.00 10.00 12.00 14.00 16.00 18.00 20.00Freq [GHz]
-8.00
-7.00
-6.00
-5.00
-4.00
-3.00
-2.00
-1.00
0.00
Magnitude [
dB
]
Measurement_results_IL_RL_SCC11DiffIL (S5 & S6)
Curve Info
Measured
SAS-3 spec
Simulation
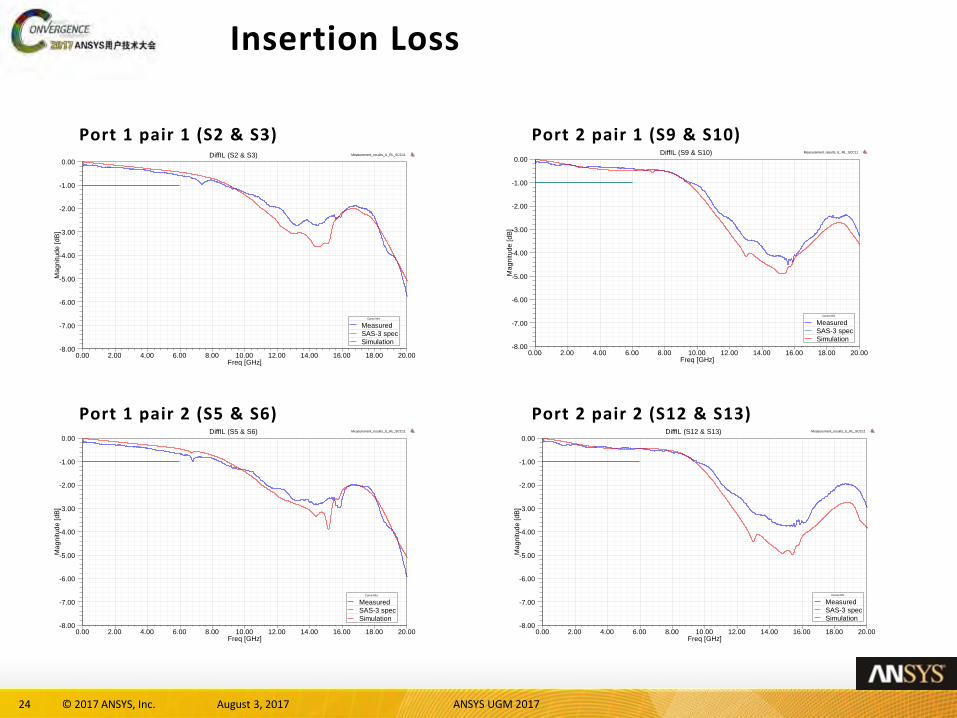
Port 1 pair 1 (S2 & S3)
Port 1 pair 2 (S5 & S6)
Insertion Loss
0.00 2.00 4.00 6.00 8.00 10.00 12.00 14.00 16.00 18.00 20.00Freq [GHz]
-8.00
-7.00
-6.00
-5.00
-4.00
-3.00
-2.00
-1.00
0.00
Magnitude [
dB
]
Measurement_results_IL_RL_SCC11DiffIL (S9 & S10)
Curve Info
Measured
SAS-3 spec
Simulation
Port 2 pair 1 (S9 & S10)
Port 2 pair 2 (S12 & S13)
0.00 2.00 4.00 6.00 8.00 10.00 12.00 14.00 16.00 18.00 20.00Freq [GHz]
-8.00
-7.00
-6.00
-5.00
-4.00
-3.00
-2.00
-1.00
0.00
Magnitude [
dB
]
Measurement_results_IL_RL_SCC11DiffIL (S12 & S13)
Curve Info
Measured
SAS-3 spec
Simulation

25 August 3, 2017 ANSYS UGM 2017© 2017 ANSYS, Inc.
0.00 2.00 4.00 6.00 8.00 10.00 12.00 14.00 16.00 18.00 20.00Freq [GHz]
-60.00
-50.00
-40.00
-30.00
-20.00
-10.00
0.00
Magnitude [
dB
]
Measurement_results_IL_RL_SCC11DiffRL (S12 & S13)
Curve Info
Measured
SAS-3 spec
Simulation
0.00 2.00 4.00 6.00 8.00 10.00 12.00 14.00 16.00 18.00 20.00Freq [GHz]
-60.00
-50.00
-40.00
-30.00
-20.00
-10.00
0.00
Ma
gn
itu
de
[d
B]
Measurement_results_IL_RL_SCC11DiffRL (S9 & S10)
Curve Info
Measured
SAS-3 spec
Simulation
0.00 2.00 4.00 6.00 8.00 10.00 12.00 14.00 16.00 18.00 20.00Freq [GHz]
-60.00
-50.00
-40.00
-30.00
-20.00
-10.00
0.00
Magnitude [
dB
]
Measurement_results_IL_RL_SCC11DiffRL (S5 & S6)
Curve Info
Measured
SAS-3 spec
Simulation
0.00 2.00 4.00 6.00 8.00 10.00 12.00 14.00 16.00 18.00 20.00Freq [GHz]
-60.00
-50.00
-40.00
-30.00
-20.00
-10.00
0.00
Ma
gn
itu
de
[d
B]
Measurement_results_IL_RL_SCC11DiffRL (S2 & S3)
Curve Info
Measured
SAS-3 spec
Simulation
Port 1 pair 1 (S2 & S3)
Port 1 pair 2 (S5 & S6)
Return Loss
Port 2 pair 1 (S9 & S10)
Port 2 pair 2 (S12 & S13)
26 August 3, 2017 ANSYS UGM 2017© 2017 ANSYS, Inc.
0.00 2.00 4.00 6.00 8.00 10.00 12.00 14.00 16.00 18.00 20.00Freq [GHz]
-60.00
-50.00
-40.00
-30.00
-20.00
-10.00
0.00
Magnitude [
dB
]
Measurement_results_IL_RL_SCC11SCC11 (S9 & S10)
Curve Info
Measured
SAS-3spec
Simulation
0.00 2.00 4.00 6.00 8.00 10.00 12.00 14.00 16.00 18.00 20.00Freq [GHz]
-60.00
-50.00
-40.00
-30.00
-20.00
-10.00
0.00
Magnitude [
dB
]
Measurement_results_IL_RL_SCC11SCC11 (S9 & S10)
Curve Info
Measured
SAS-3spec
Simulation
0.00 2.00 4.00 6.00 8.00 10.00 12.00 14.00 16.00 18.00 20.00Freq [GHz]
-60.00
-50.00
-40.00
-30.00
-20.00
-10.00
0.00
Magnitude [
dB
]
Measurement_results_IL_RL_SCC11SCC11 (S5 & S6)
Curve Info
Measured
SAS-3spec
Simulation
0.00 2.00 4.00 6.00 8.00 10.00 12.00 14.00 16.00 18.00 20.00Freq [GHz]
-60.00
-50.00
-40.00
-30.00
-20.00
-10.00
0.00
Magnitude [
dB
]
Measurement_results_IL_RL_SCC11SCC11 (S2 & S3)
Curve Info
Measured
SAS-3spec
Simulation
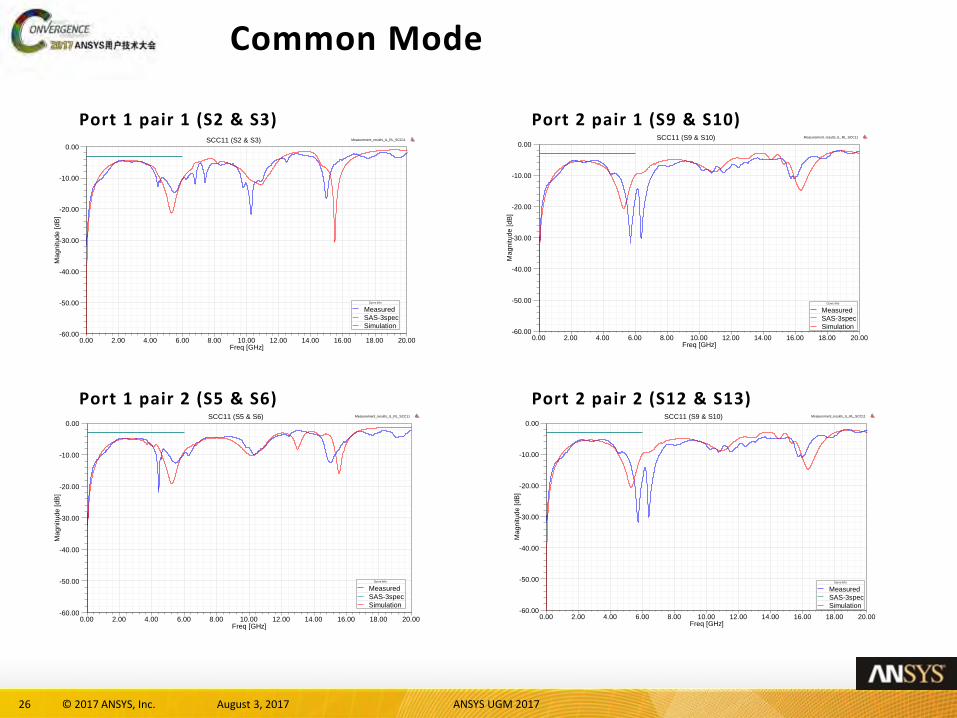
Port 1 pair 1 (S2 & S3)
Port 1 pair 2 (S5 & S6)
Common Mode
Port 2 pair 1 (S9 & S10)
Port 2 pair 2 (S12 & S13)

27 August 3, 2017 ANSYS UGM 2017© 2017 ANSYS, Inc.
0.00 2.00 4.00 6.00 8.00 10.00 12.00 14.00 16.00 18.00 20.00F [GHz]
-80.00
-70.00
-60.00
-50.00
-40.00
-30.00
-20.00
-10.00
0.00
Magnitude [
dB
]
Measurement_results_NEXTPort2_DDNEXT_recep side(Agg S9S10/VicS12S13)
Curve Info
Measured
Seagate spec
Simulation
SAS-3spec
0.00 2.00 4.00 6.00 8.00 10.00 12.00 14.00 16.00 18.00 20.00F [GHz]
-80.00
-70.00
-60.00
-50.00
-40.00
-30.00
-20.00
-10.00
0.00
Magnitude [
dB
]
Measurement_results_NEXTPort2_DDNEXT_plug side(Agg S9S10/VicS12S13)
Curve Info
Measured
Seagate spec
Simulation
SAS-3spec
0.00 2.00 4.00 6.00 8.00 10.00 12.00 14.00 16.00 18.00 20.00F [GHz]
-80.00
-70.00
-60.00
-50.00
-40.00
-30.00
-20.00
-10.00
0.00
Magnitude [
dB
]
Measurement_results_NEXTPort1_DDNEXT_recep side(Agg S2S3/VicS5S6)
Curve Info
Measured
Seagate spec
Simulation
SAS-3spec
0.00 2.00 4.00 6.00 8.00 10.00 12.00 14.00 16.00 18.00 20.00F [GHz]
-80.00
-70.00
-60.00
-50.00
-40.00
-30.00
-20.00
-10.00
0.00
Magnitude [
dB
]
Measurement_results_NEXTPort1_DDNEXT_plug side(Agg S2S3/VicS5S6)
Curve Info
Measured
Seagate spec
Simulation
SAS-3spec
Port1pair1 Driven / Port1pair2 Victim (Plug side)
Port1pair1 Driven / Port1pair2 Victim (Receptacle side)
DDNEXT
Port2pair1 Driven / Port2pair2 Victim (Plug side)
Port2pair1 Driven / Port2pair2 Victim (Receptacle side)
28 August 3, 2017 ANSYS UGM 2017© 2017 ANSYS, Inc.
0.00 2.00 4.00 6.00 8.00 10.00 12.00 14.00 16.00 18.00 20.00Freq [GHz]
-120.00
-110.00
-100.00
-90.00
-80.00
-70.00
-60.00
-50.00
-40.00
-30.00
-20.00
-10.00
0.00
Ma
gn
itu
de
[d
B]
Measurement_results_FEXTDDFEXT_recepdrivenAgg S12S13/VicS5S6plug
Curve Info
Measured
SAS-3spec
Simulation
0.00 2.00 4.00 6.00 8.00 10.00 12.00 14.00 16.00 18.00 20.00Freq [GHz]
-120.00
-110.00
-100.00
-90.00
-80.00
-70.00
-60.00
-50.00
-40.00
-30.00
-20.00
-10.00
0.00
Magnitude [
dB
]
Measurement_results_FEXTDDFEXT_recepdrivenAgg S5S6/VicS12S13plug
Curve Info
Measured
SAS-3spec
Simulation
0.00 2.00 4.00 6.00 8.00 10.00 12.00 14.00 16.00 18.00 20.00Freq [GHz]
-120.00
-110.00
-100.00
-90.00
-80.00
-70.00
-60.00
-50.00
-40.00
-30.00
-20.00
-10.00
0.00
Ma
gn
itu
de
[d
B]
Measurement_results_FEXTDDFEXT_plugdrivenAgg S9S10/VicS2S3recep
Curve Info
Measured
SAS-3spec
Simulation
0.00 2.00 4.00 6.00 8.00 10.00 12.00 14.00 16.00 18.00 20.00Freq [GHz]
-120.00
-110.00
-100.00
-90.00
-80.00
-70.00
-60.00
-50.00
-40.00
-30.00
-20.00
-10.00
0.00
Mag
nitu
de
[dB
]
Measurement_results_FEXTDDFEXT_plugdrivenAgg S2S3/VicS9S10recep
Curve Info
Measured
SAS-3spec
Simulation
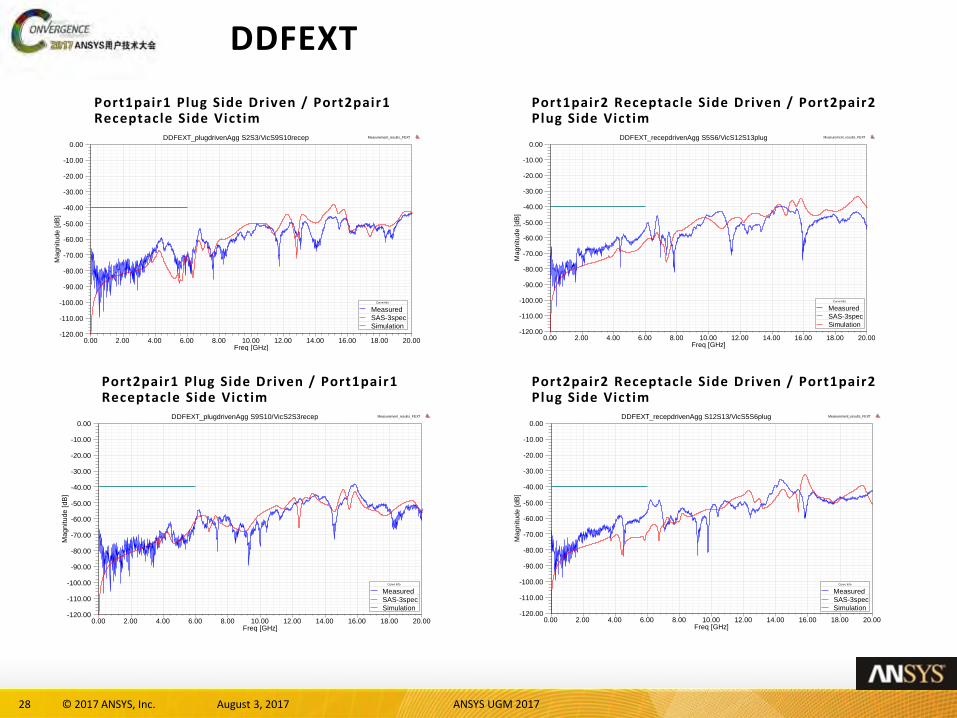
Port1pair1 Plug Side Driven / Port2pair1 Receptacle Side Victim
Port2pair1 Plug Side Driven / Port1pair1 Receptacle Side Victim
DDFEXT
Port1pair2 Receptacle Side Driven / Port2pair2 Plug Side Victim
Port2pair2 Receptacle Side Driven / Port1pair2 Plug Side Victim

29 August 3, 2017 ANSYS UGM 2017© 2017 ANSYS, Inc.
• The measured data correlated well with the simulated
results with both sets of plots displaying similar shape and
profile across the 20GHz bandwidth.
• The results had shown that the mated connector system
will meet SAS-3 T10 requirements for SI.
Observations

30 August 3, 2017 ANSYS UGM 2017© 2017 ANSYS, Inc.
Differential TDR Correlation Results

31 August 3, 2017 ANSYS UGM 2017© 2017 ANSYS, Inc.
Differential TDR Risetime Definition
Risetime (10% - 90%) at end of 1m cable is approximately 42ps.

32 August 3, 2017 ANSYS UGM 2017© 2017 ANSYS, Inc.
Measurement (from Tektronix)
Simulation (from HFSS)
112.5 Ω
88.0 Ω
TDR Plots @ 42ps (10% - 90%) – Port 1 pair 1 (S2 & S3)
109 Ω
77.7 Ω
Accuracy:3% for high TDR and 12% for low TDR.

33 August 3, 2017 ANSYS UGM 2017© 2017 ANSYS, Inc.
Model Comparison
Original Model
Modified Model
Add Nickel as a Finite Conductivity Boundary on Connector pins surface

34 August 3, 2017 ANSYS UGM 2017© 2017 ANSYS, Inc.
Modified Model
112 Ω
85.0 Ω
Blue – Modified ModelRed – Original ModelAccuracy
0.4% for high TDR and 3.4% for low TDR.
35 August 3, 2017 ANSYS UGM 2017© 2017 ANSYS, Inc.
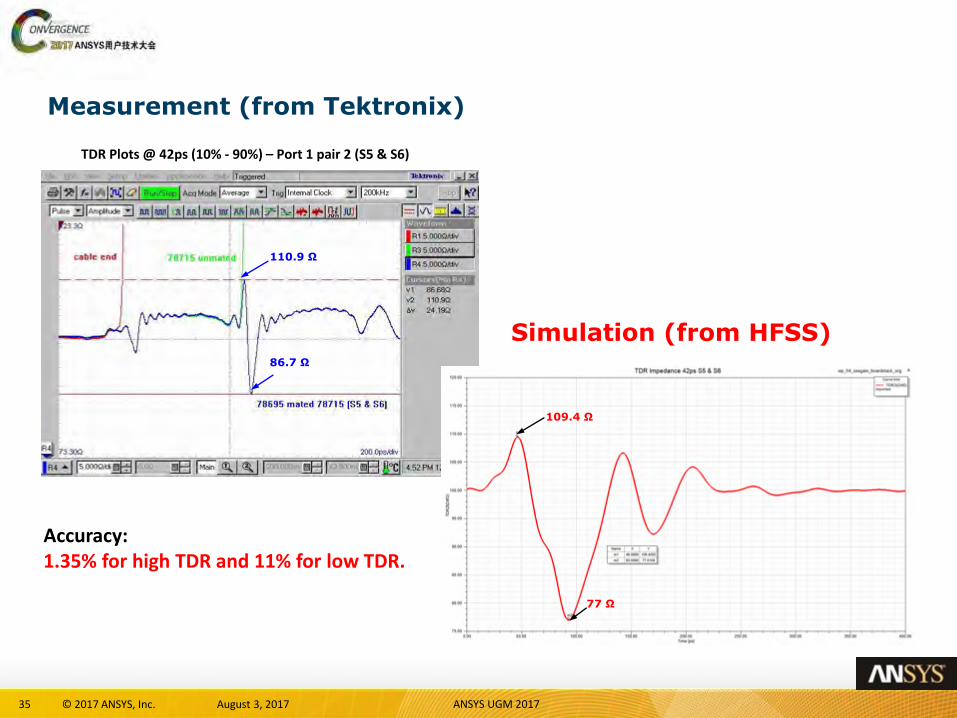
Measurement (from Tektronix)
Simulation (from HFSS)
TDR Plots @ 42ps (10% - 90%) – Port 1 pair 2 (S5 & S6)
Accuracy:1.35% for high TDR and 11% for low TDR.
110.9 Ω
86.7 Ω
77 Ω
109.4 Ω
36 August 3, 2017 ANSYS UGM 2017© 2017 ANSYS, Inc.
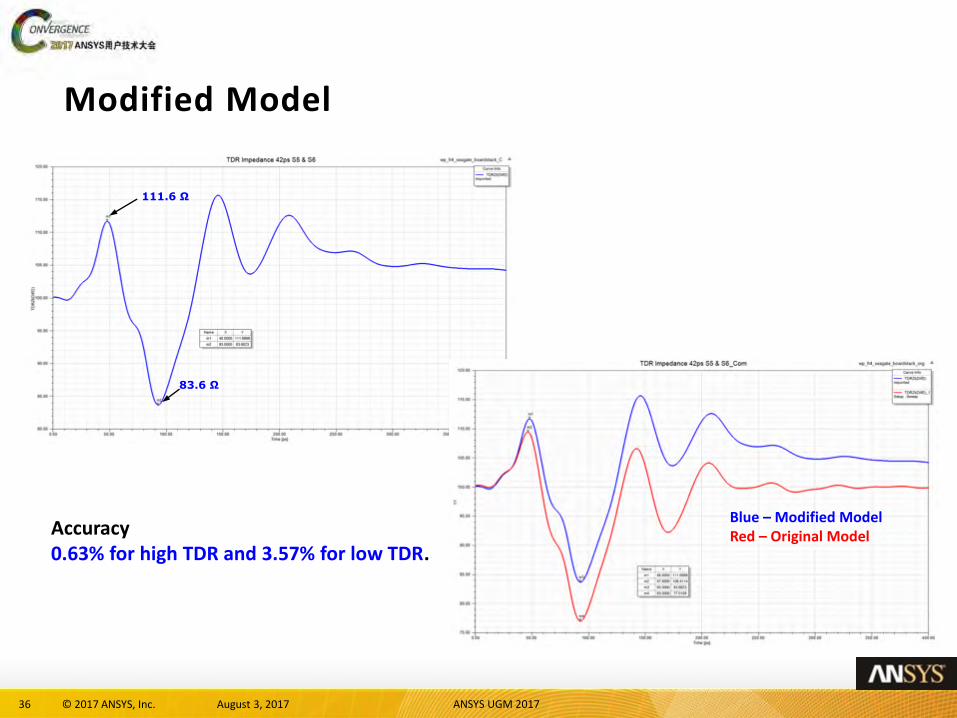
Modified Model
111.6 Ω
83.6 Ω
Accuracy0.63% for high TDR and 3.57% for low TDR.
Blue – Modified ModelRed – Original Model
37 August 3, 2017 ANSYS UGM 2017© 2017 ANSYS, Inc.
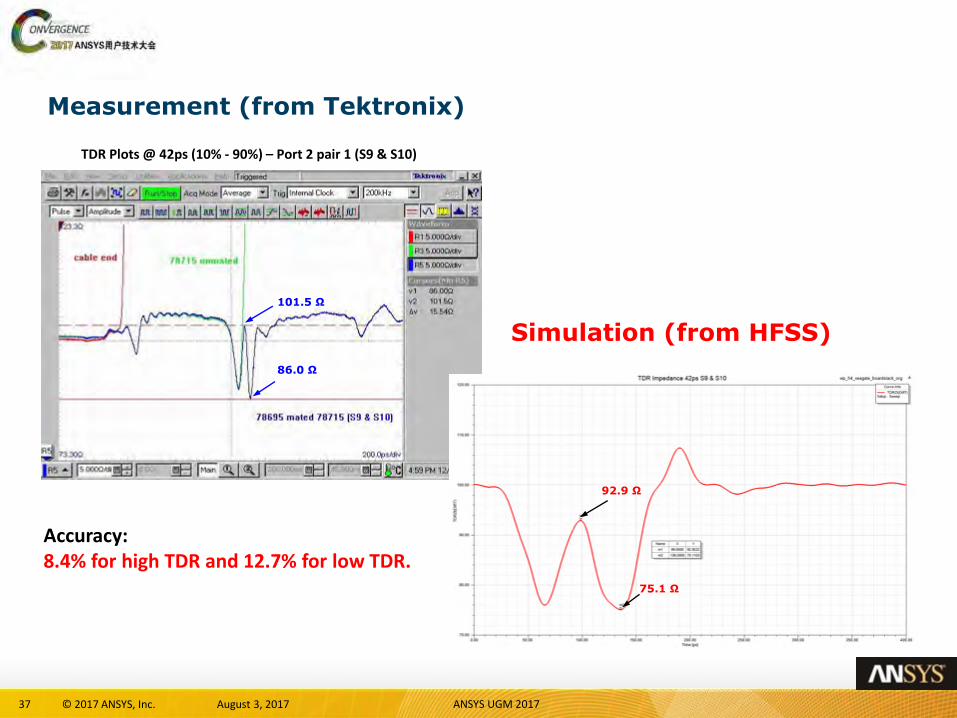
Measurement (from Tektronix)
Simulation (from HFSS)
TDR Plots @ 42ps (10% - 90%) – Port 2 pair 1 (S9 & S10)
Accuracy:8.4% for high TDR and 12.7% for low TDR.
101.5 Ω
86.0 Ω
75.1 Ω
92.9 Ω

38 August 3, 2017 ANSYS UGM 2017© 2017 ANSYS, Inc.
Modified Model
103.2 Ω
86.3 Ω
Accuracy1.6% for high TDR and 0.35% for low TDR.
Blue – Modified ModelRed – Original Model

39 August 3, 2017 ANSYS UGM 2017© 2017 ANSYS, Inc.
Measurement (from Tektronix)
Simulation (from HFSS)
TDR Plots @ 42ps (10% - 90%) – Port 2 pair 1 (S12 & S13)
Accuracy:7.9% for high TDR and 12.6% for low TDR.
101 Ω
86.0 Ω
75.2 Ω
93 Ω

40 August 3, 2017 ANSYS UGM 2017© 2017 ANSYS, Inc.
Modified Model
103.3 Ω
86.4 Ω
Accuracy2.2% for high TDR and 0.46% for low TDR.
Blue – Modified ModelRed – Original Model
41 August 3, 2017 ANSYS UGM 2017© 2017 ANSYS, Inc.
• The measured Differential TDR correlated well with the
simulated results with both sets of plots displaying similar
shape and profile across the 400ps.
• The results had shown that the mated connector system
will meet SAS-3 T10 requirements for TDR.
Observations

42 August 3, 2017 ANSYS UGM 2017© 2017 ANSYS, Inc.
感谢聆听