“best value approach” overview - van hes project ... · “best value approach” overview...
TRANSCRIPT

PBSRG GLOBAL
SKEMA Business School
NEVI
“Best Value Approach”
Overview
RISNET/CROW
Dean Kashiwagi, P.E., PhD Director, Professor
Performance Based Studies Research Group
CIB W117 Coordinator Fulbright Scholar
IFMA Fellow Pbsrg.com

1976 (38)

1992(22)

w w w . p b s r g . c o m
We Are Supply Chains P
are
nts
Myself a
nd m
y W
ife
Child
ren
Child
ren’s
Futu
re F
am
ilies
Child
ren’s
Futu
re J
obs
Ch
ildre
n's
Futu
re C
hild
ren
Sim
plic
ity/D
om
inant
Info
rmation
Technical Details
30K Foot Level


Life Silos
Fam
ily L
ife
Pro
fessio
nal Life
Socia
l Life
Polit
ical Life
Family Behavior
Business Behavior
Social Behavior
Political Behavior
Gravity Gravity Gravity Gravity
Technical Details
Sim
plic
ity/D
om
inant
Info
rmation
No Control No Control No Control No Control 30K Foot Level
Natural Laws

Change of Paradigm
• Replace management, direction and control with utilization of expertise [BV approach]
• Utilize BV expert to make paradigm shift
• Total transparency will provided by the expert vendor to identify their scope, their management of the risk that they do not control, their progress and their performance
• Project will be tracked by expert vendor
8

180K 170K
380K
290K
460K
330K
1.01M
480K 430K
120K
370K
560K
650K
570K
870K
1.04M
950K
1.33M 1.31M
700K
1.08M 1.20M
0.0
0.2
0.4
0.6
0.8
1.0
1.2
1.4
1993 1994 1995 1996 1997 1998 1999 2000 2001 2002 2003 2004 2005 2006 2007 2008 2009 2010 2011 2012 2013 2014
$ A
mo
un
t A
war
de
d (
Mill
ion
s)
Year
PBSRG Grant Awards Started: $180K Total to Date: $14.6M Avg Yearly % Increase: 28% Total % Increase: 584% Number of Grants: 313
$14.6M Research, 20 years, 1700+ tests, 98% Satisfaction

User Approach to Utilize Expertise
Know Nothing
• Assume that we know nothing
• Minimize decision making
• Do not manage, direct and control [MDC]
• Utilize expertise
• Make experts identify the future
• Simple, metrics and risk that expert does not control
Know Everything
• Know everything
• Decision making
• MDC
• Do not utilize expertise
• Buyer tells expert what the expert will do
• Technical details
10

Unique initial conditions
Unique final conditions
Time (dt)
Natural Laws Natural Laws Natural Laws = =
Decision Making and Direction by Client
Unique Final Conditions are Set by Initial
Conditions [No controlling of event,
Minimizing Decision Making]
Risk Mitigation by Minimizing DM and Transparency
• Decision Less Structure
• No management, direction and control (MDC) Approach (use expertise)
• Results
– Transparency
– Accountability
– Experience and expertise
– Detailed pre-planning
12

Traditional Risk Model [DM/C]
13
50% 50%
Whose Fault? • Decision Making • Transparency • Risk • Accountability

Get Rid of Decision Making
14
100% 0%

Minimize Direction and DM
• Direction and DM causes risk and confusion
• BV PIPS is different because there is no use of owner direction and DM
• Expert vendor creates transparency and a complete plan
• Cannot override natural laws
15

Observation/Logic over 20 years and 1,700 tests
• Utilization of expertise is the only real way to minimize cost
• MDC leads to low performance and minimum standards
• Concept of control of contractors is not effective
• Utilization of expertise and transparency is the only way to minimize risk
• Project non-performance is not a technical engineering or construction issue that can be resolved by construction technical expertise
• Hire based on expertise [system to measure]
16

Transparency [No confusion]
• Simple
• Less thinking
• Minimize decision making
• Everyone understands
• Non-technical
• Use language of metrics
17

Large and Small Project Satisfaction
18
*Source: Outsourcing Performance Giarte

De Nederlandsche Bank Report and Giarte Performance Report Results
86%
73%
100% 73%
60%
79%
50% 60% 70% 80% 90% 100%
(6) Provider 5
(5) Provider 4
(4) Schuberg Philis
(3) Provider 3
(2) Provider 2
(1) Provider 1
Outsourcing Recommendation Scores for Top 6 Critical Providers in NL


Best Value PIPS Approach in Oklahoma
Steve Hagar
Central Purchasing Deputy Director
Licensed by ASU
Certified BV Expert
405-522-3369

Longest Sustaining U.S. Effort
Performance Criteria Results
# of awarded projects 19
# of projects given to lowest bidder 12
# of cancelled projects 6
Estimated $ of BV projects procured $ 137.7M
Average Budget $ per project $ 6.2M
Estimated $ cost avoidance $ 71.8M
Average $ cost avoidance per project $ 3.26M
Customer Satisfaction 9.0
# of customer satisfaction surveys 9

Case Study #1: BV Performance at ASU
23

CenturyLink | ASU MSA Annual Review | August 2013 | PAGE 24
Business
Outcomes Pre MSA MSA (2010) MSA (2013)
MSA Baseline $12.29M $10.81M $11.96M
CL Business Outcomes: Costs
Growth – Out
of Scope N/A N/A $1.15M
Value Add N/A $0.43M/yr $0.98M/yr *see appendix for details
Net MSA $12.29M $10.38M $9.83M

CenturyLink | ASU MSA Annual Review | August 2013 | PAGE 25
CL Business Outcomes: Reliability &
Satisfaction
Business
Outcomes Pre MSA MSA (2010) MSA (2013)
# of Major
Outages N/K 37 11
% Uptime 99.802 99.989 99.998
Customer
Satisfaction 3.6 3.71
(max 4.0)
3.81 (max 4.0)
% of Tickets
within SLA 94% 97% 97%

CenturyLink | ASU MSA Annual Review | August 2013 | PAGE 26
Business Outcomes: Technology
Business
Outcomes Pre MSA MSA (2010) MSA (2013)
% Network
supported (Not at end-of-maintenance)
89% 99% 99%
% 1Gb- Wired
Connections 57.0% 71.5% 96.0%
% Wireless(n) 9.0% 8.7% 92.6%
IT Spending
Ratio 6/94
(New vs. Maintenance)
26/74 (New vs. Maintenance)
56/44 (New vs. Maintenance)
Includes New Growth
Includes Wireless-n

Definition of Experts
• Minimize cost by seeing into the future
• Understand people and risk that they cannot control
• Risk mitigation through transparency
• Do not cause risk
• Metrics create transparency

Deviations
• Risk that the vendor does not control
• Mistakes that the vendor rectifies
• The expert vendor must identify risk that they cannot control in their risk mitigation plan
• Unforeseens must be clearly identified and justified
28

Plan
• Detailed schedule from beginning to end
• Expertise used in areas where there is insufficient information [II]
• Risk that cannot be controlled [Risk]
29
Deliverables [metrics]
Milestones [metrics]
[II]
[II]
[Risk] [Risk]
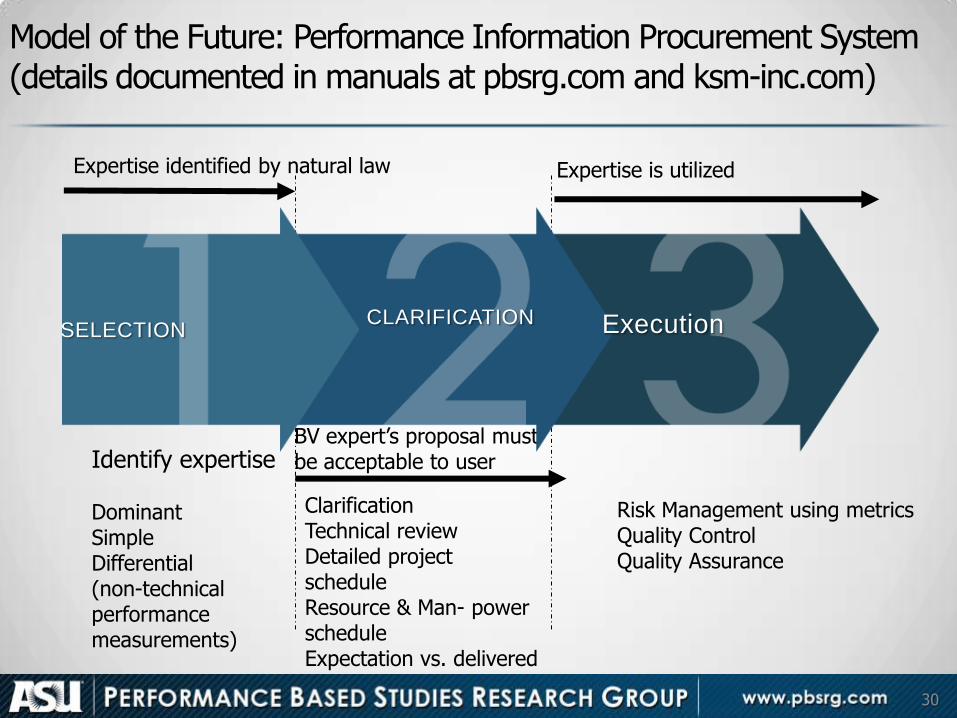
Model of the Future: Performance Information Procurement System (details documented in manuals at pbsrg.com and ksm-inc.com)
30
Expertise identified by natural law
BV expert’s proposal must be acceptable to user
Expertise is utilized
Identify expertise Dominant Simple Differential (non-technical performance measurements)
Clarification Technical review Detailed project schedule Resource & Man- power schedule Expectation vs. delivered
Risk Management using metrics Quality Control Quality Assurance
SELECTION CLARIFICATION Execution

System Created to Assist People to See

System Created to Increase Value and Performance


Simplification and Natural Laws Helps People Become the Best they can be
• Tested concept in Kashiwagi family
• Now testing in ASU honors program
• Optimizes behavior through simplicity, natural laws and transparency
• Minimizes negative behavior [depression, drugs, instability, suicide]
• Creates vision
34

Optimize the Environment using Transparency [Simplicity, Metrics, Logic]
• Expert vendors communicate project requirements using metrics
• Select vendors using their performance metrics and language of metrics
• Simplifying communications between vendors and buyers by using expert’s metrics
• Expert minimizes technical communications because they know how to deliver the technical requirements
35

BV Approach Creates Transparency
• Simple
• Communicate in form of metrics
• Does not require “trust”
• Accountable
• Forces pre-planning
• Goes against human nature
36

Conclusions • Replace MDC with the utilization of
expertise
• Create transparency with metrics
• Project managers become leaders who align resources in a transparent environment
• Experts can see into the future and create transparency
• New language of PM is “metrics”
37

“Best Value Approach”
[email protected] LinkedIn.com/in/deankashiwagi YouTube.com/user/PBSRG PBSRG.com KSMLeadership.com Jan 12-16, 2015 Tempe, AZ 2015 Best Value Education and Training Inexpensive training at site www.ksm-inc.com