bewise'i loeng: ivo vaks "performance management ja laienemine microsofti näitel"...
DESCRIPTION
Ivo Vaks viis läbi BeWise'i projekti raames loengu "Performance Management ja laienemine Microsofti näitel". Ivo Vaks, Westen Europe Area Segment Finance Lead (Mature/developed markets) Microsoftis, käsitles oma loengus neid teemasid: • hetketrendid äris • innovatsiooni koostisosad • eduka äri mõttelaad • väljakutsed uutel turgudel • seigad (äri)kultuuri erinevustest • õppetunnid elust enesest • Q&A jpm Ivo Vaks on omandanud majandusmagistrikraadi Tallinna Tehnikaülikoolis ja praeguseks on ta juba üheksa aastat töötanud Microsoftis nii finantsjuhi kui uute turgude värbajana, seda nii Eestis, Saksamaal kui ka praegu Microsoft Netherlands´s. Ivole meeldivad muuhulgas mootorrattasõit, reisimine ja uute asjade avastamine. http://bewise.jcitallinn.ee/ http://www.facebook.com/jci.bewise http://youtu.be/a-LLAIb65VITRANSCRIPT

Finance Today: reimagined to drive impact (performance&expansion)Ivo Vaks, Finance Lead,Enterprice & Commercial Devices SegmentMicrosoft Corporation, Amsterdam, WE
18 September 2014
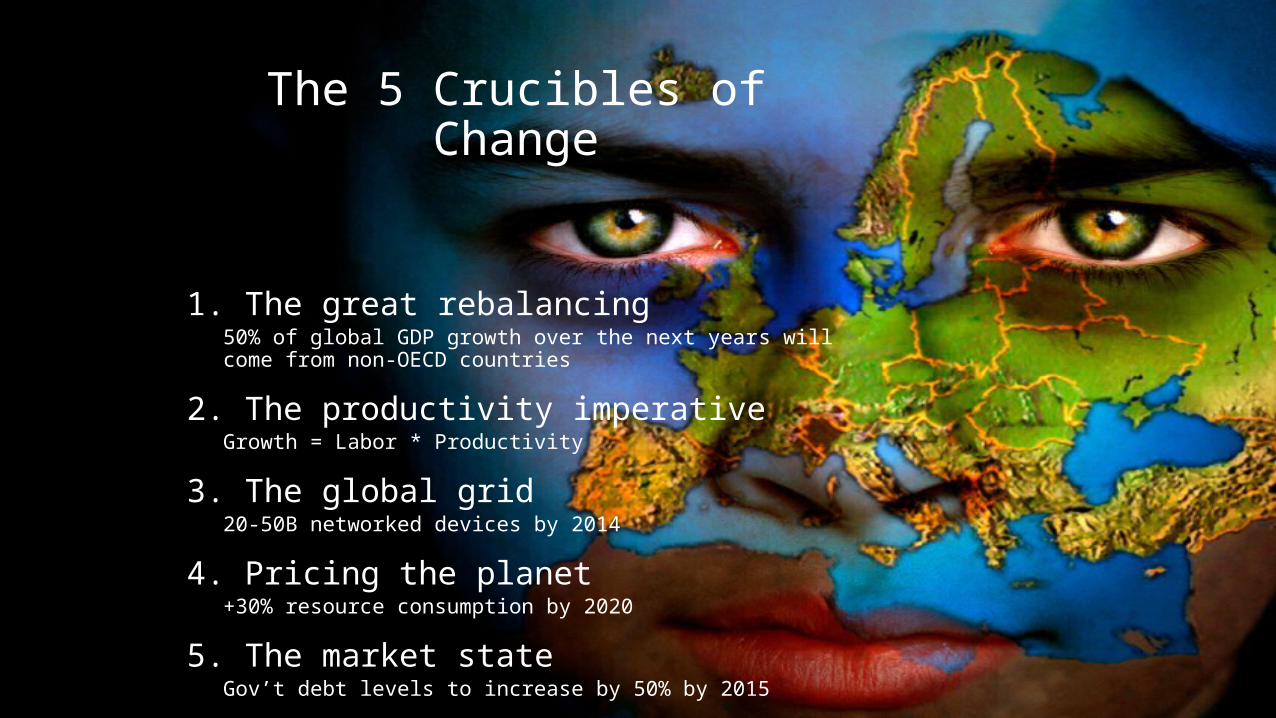
The 5 Crucibles of Change
1. The great rebalancing50% of global GDP growth over the next years will come from non-OECD countries
2. The productivity imperativeGrowth = Labor * Productivity
3. The global grid20-50B networked devices by 2014
4. Pricing the planet+30% resource consumption by 2020
5. The market stateGov’t debt levels to increase by 50% by 2015
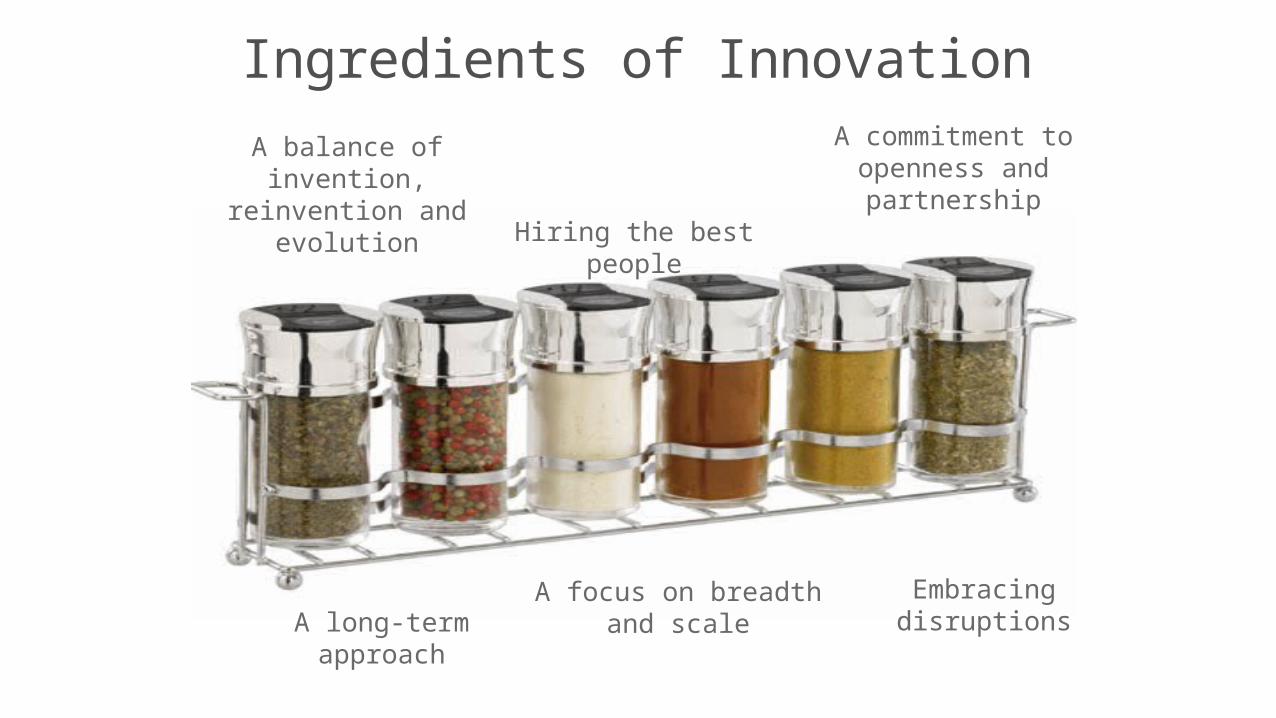
Ingredients of InnovationA balance of
invention, reinvention and evolution
Hiring the best people
A commitment to openness and partnership
A long-term approach
A focus on breadth and scale
Embracing disruptions
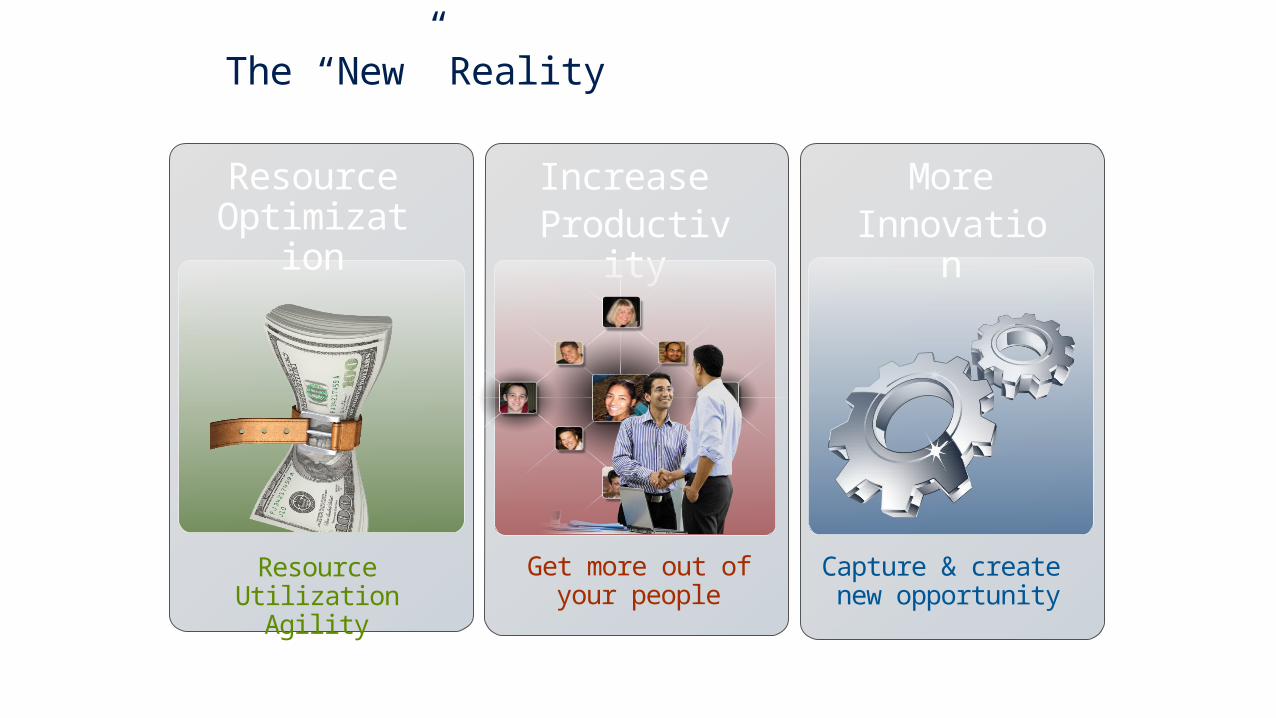
The “New” Reality
Resource Utilization Agility
Resource Optimizatio
n
MoreInnovation
Capture & create new opportunity
Get more out of your people
Increase Productivity
5
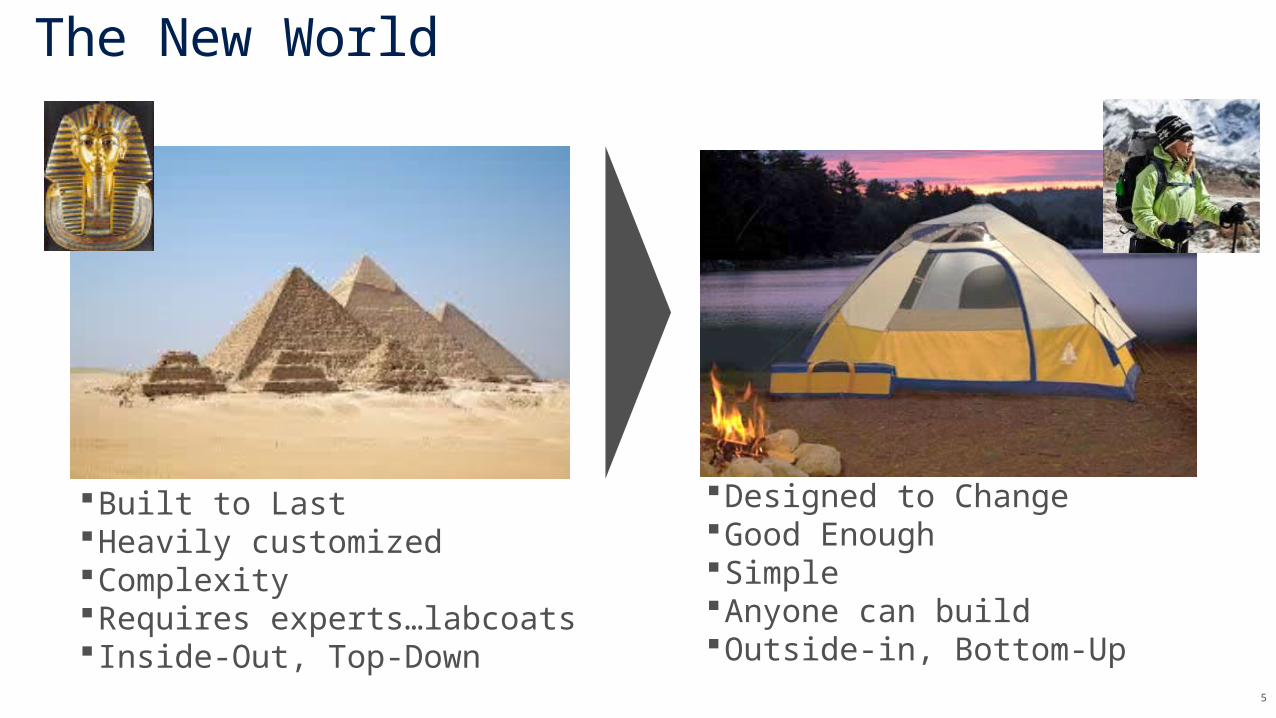
The New World
Designed to ChangeGood EnoughSimpleAnyone can buildOutside-in, Bottom-Up
Built to LastHeavily customizedComplexityRequires experts…labcoats Inside-Out, Top-Down
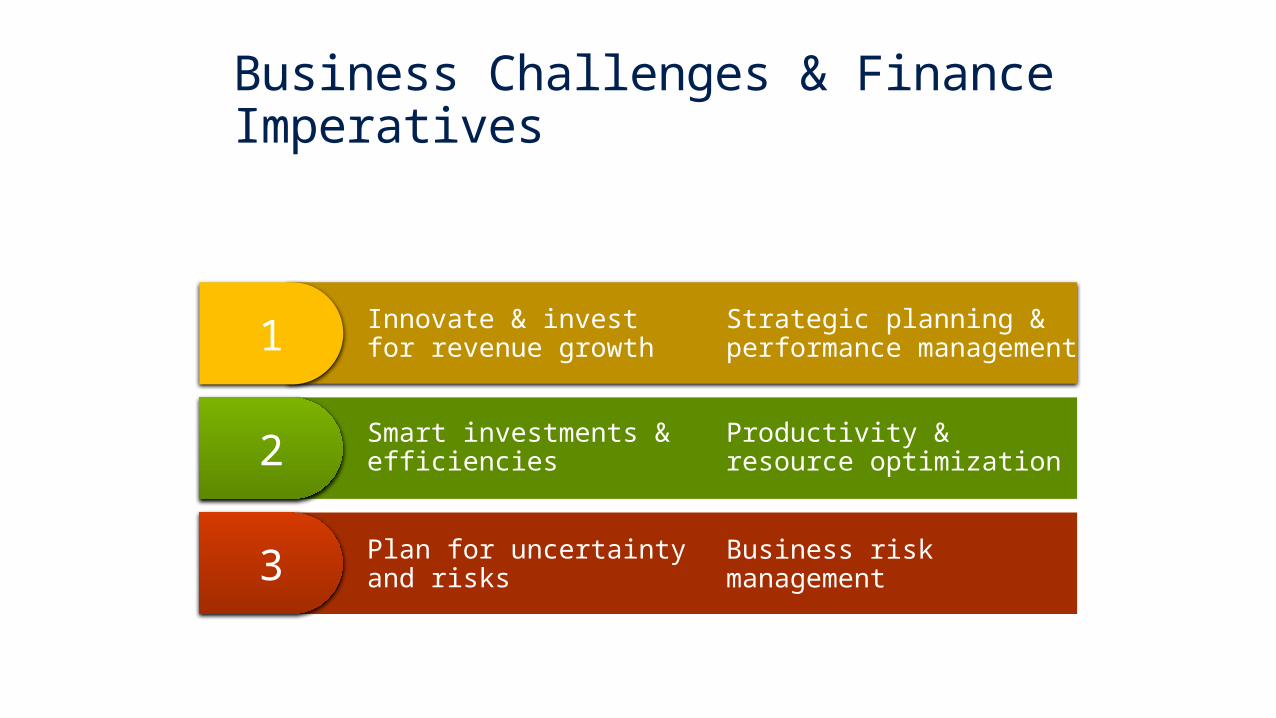
Business Challenges & Finance Imperatives
Business Challenges Finance Imperatives
Innovate & investfor revenue growth
Smart investments &efficiencies
Plan for uncertaintyand risks
Strategic planning & performance management
Productivity &resource optimization
Business risk management
1
2
3
7
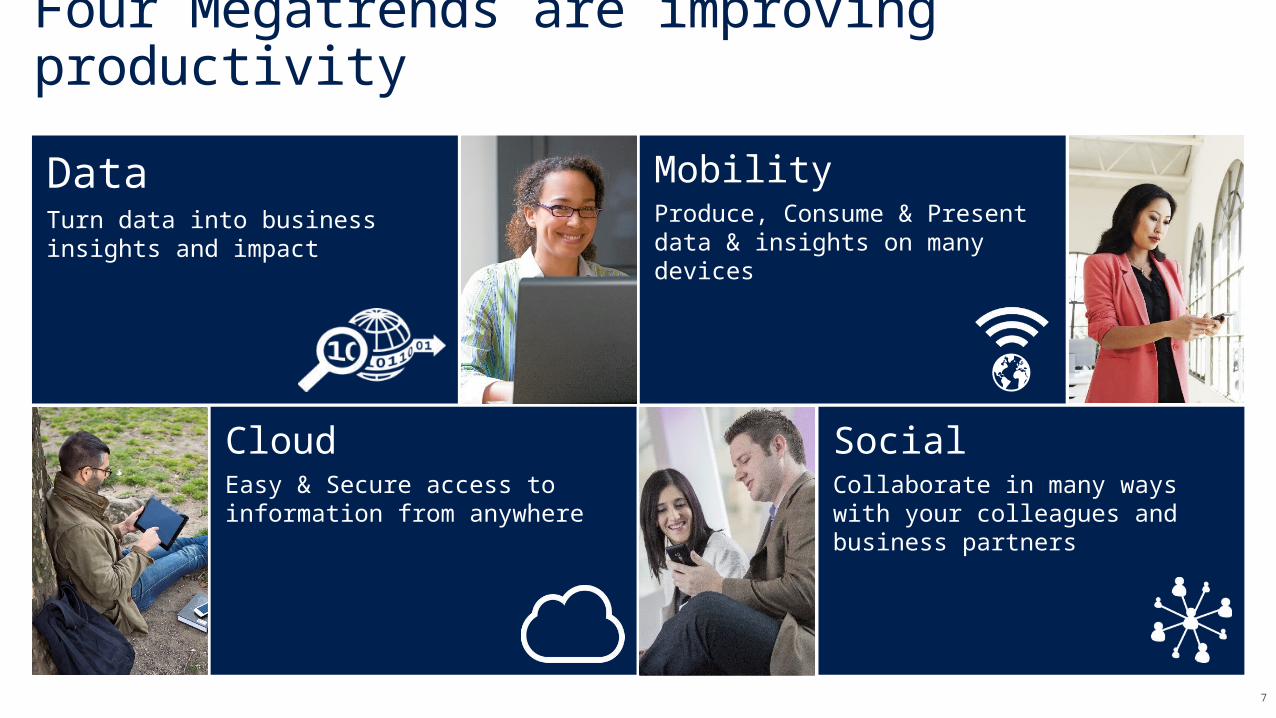
Four Megatrends are improving productivity
DataTurn data into business insights and impact
MobilityProduce, Consume & Present data & insights on many devices
CloudEasy & Secure access to information from anywhere
SocialCollaborate in many ways with your colleagues and business partners
8
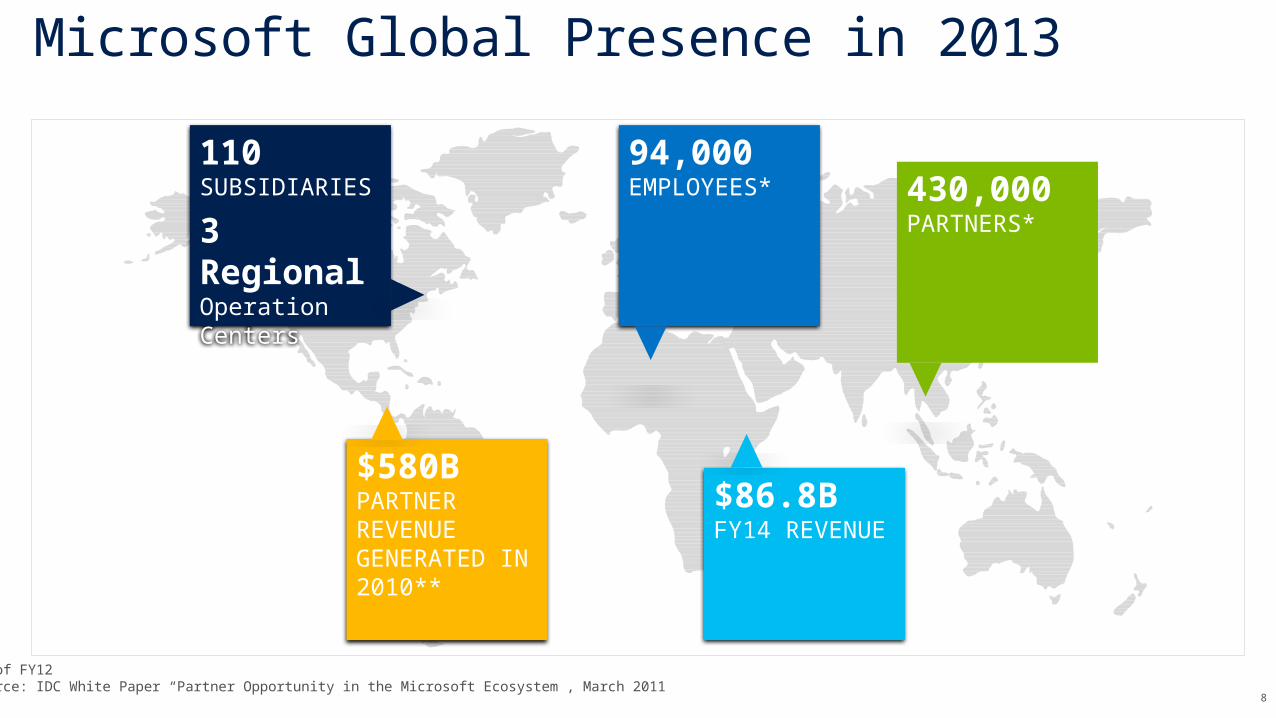
Microsoft Global Presence in 2013
*End of FY12**Source: IDC White Paper “Partner Opportunity in the Microsoft Ecosystem”, March 2011
110 SUBSIDIARIES
3 Regional Operation Centers
94,000EMPLOYEES* 430,000
PARTNERS*
$86.8B FY14 REVENUE
$580BPARTNER REVENUE GENERATED IN 2010**
9
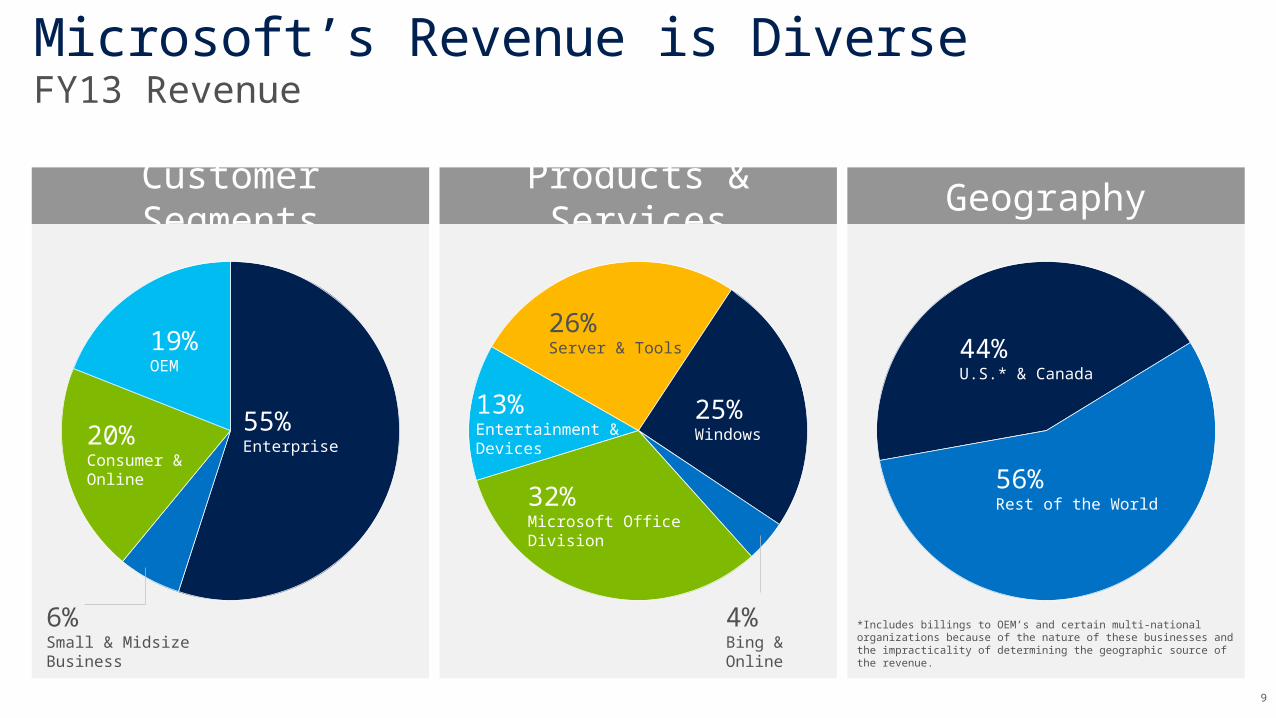
Microsoft’s Revenue is DiverseFY13 Revenue
Customer Segments
Products & Services Geography
*Includes billings to OEM’s and certain multi-national organizations because of the nature of these businesses and the impracticality of determining the geographic source of the revenue.
55%Enterprise
19%OEM
20%Consumer &Online
6%Small & Midsize Business
25%Windows
26%Server & Tools
13%Entertainment &Devices
32%Microsoft OfficeDivision
4%Bing & Online
44%U.S.* & Canada
56%Rest of the World
10
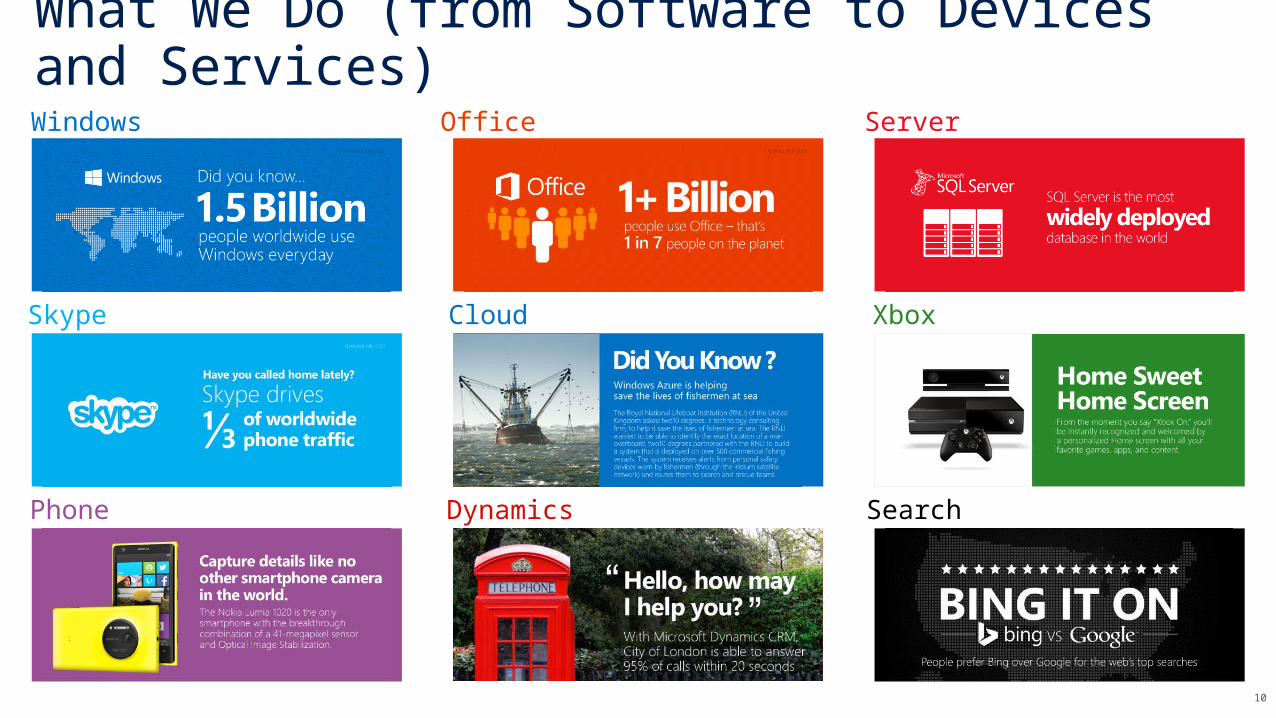
What We Do (from Software to Devices and Services) Windows
SearchPhone
Office
XboxSkype
Dynamics
Cloud
Server
11
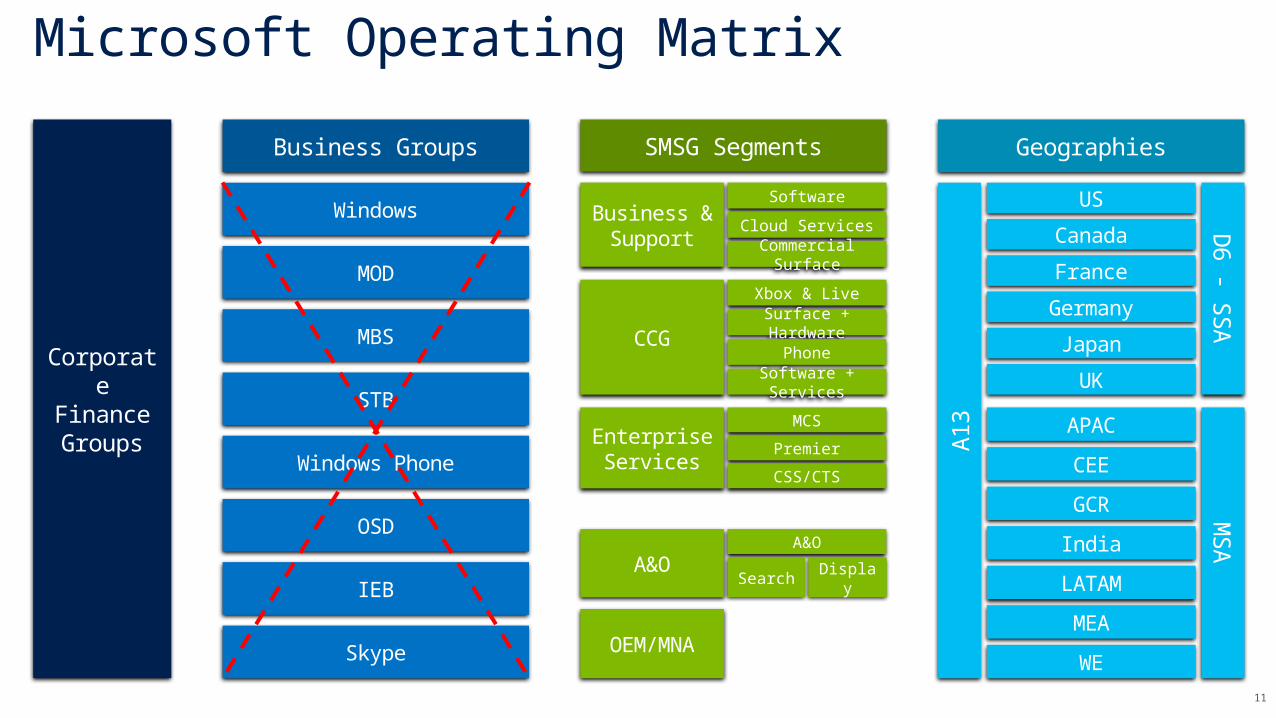
Corporate Finance Groups
Microsoft Operating Matrix
Business Groups
Windows
IEB
MBS
Windows Phone
MOD
OSD
STB
Skype
Enterprise Services
Business & Support
CCG
A&O
SMSG Segments
A&O
Search Display
OEM/MNA
Software
Cloud ServicesCommercial
Surface
Xbox & LiveSurface + Hardware
PhoneSoftware +
Services
MCS
Premier
CSS/CTS
US
Germany
Canada
Japan
France
UK
Geographies
D6 - S
SA
A13
MSA
APAC
India
CEE
LATAM
GCR
MEA
WE
12
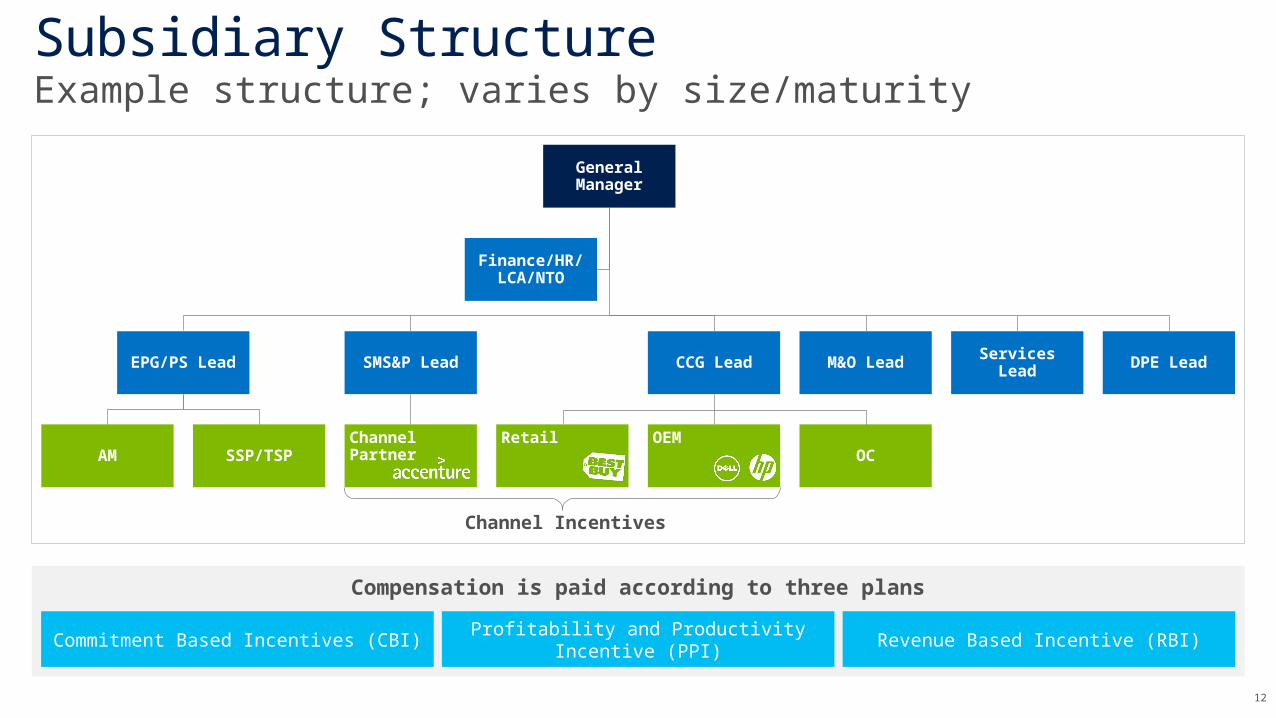
Subsidiary StructureExample structure; varies by size/maturity
Compensation is paid according to three plans
Channel Incentives
General Manager
EPG/PS Lead
AM SSP/TSP
SMS&P Lead
Channel Partner
CCG Lead
Retail OEMOC
M&O Lead Services Lead DPE Lead
Finance/HR/ LCA/NTO
Commitment Based Incentives (CBI)Profitability and Productivity Incentive
(PPI)Revenue Based Incentive (RBI)
13
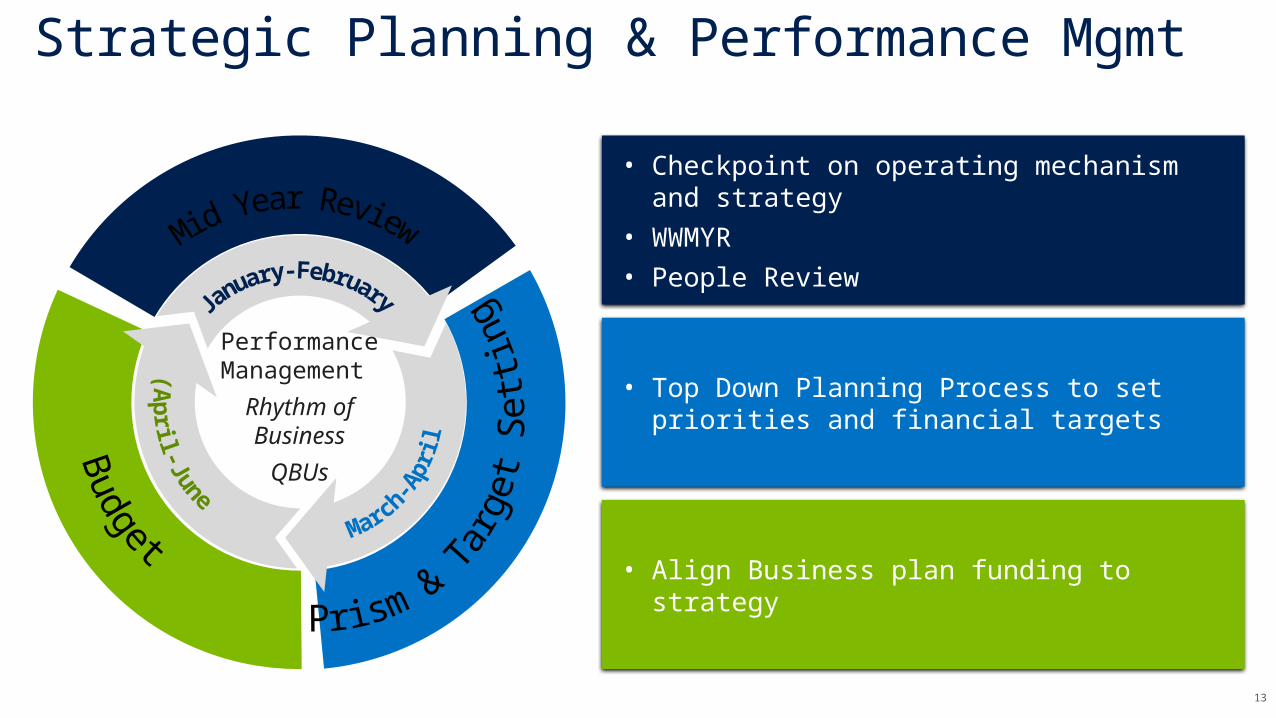
Strategic Planning & Performance Mgmt
Performance Management
Rhythm ofBusiness
QBUs
• Checkpoint on operating mechanism and strategy
• WWMYR• People Review
• Align Business plan funding to strategy
• Top Down Planning Process to set priorities and financial targets
14
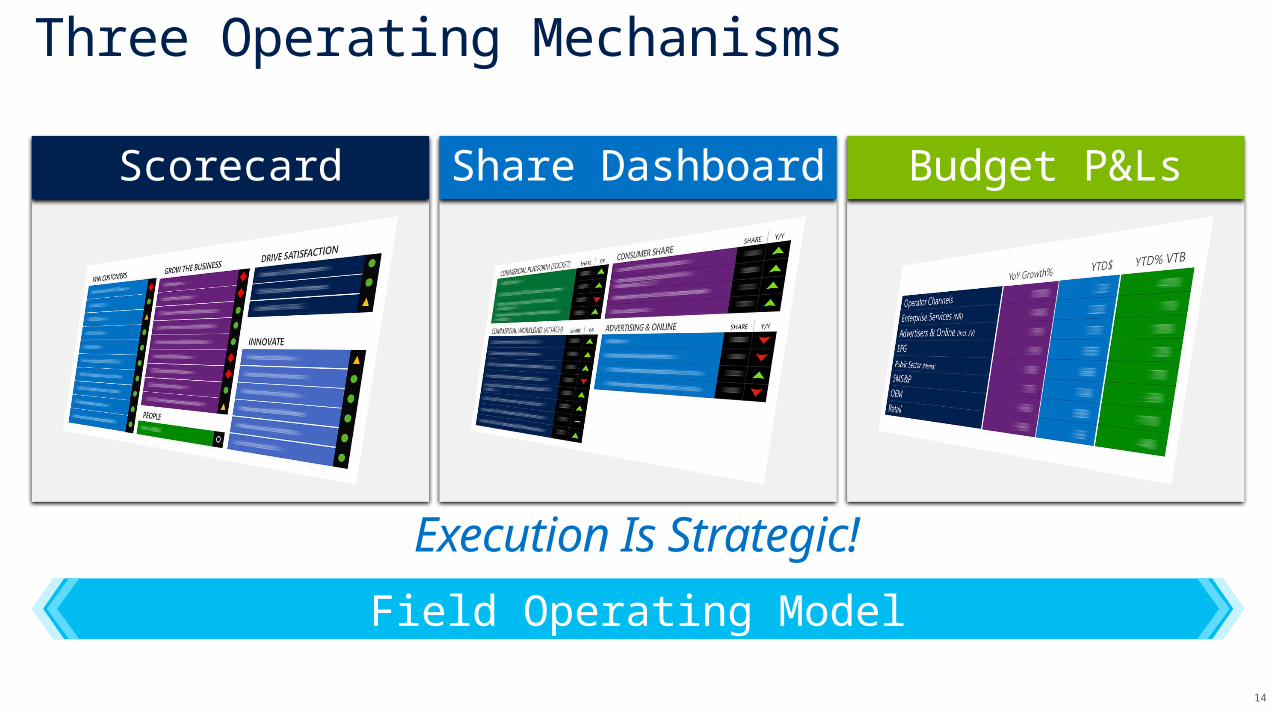
Execution Is Strategic!
Three Operating Mechanisms
Budget P&LsShare DashboardScorecard
Field Operating Model
15
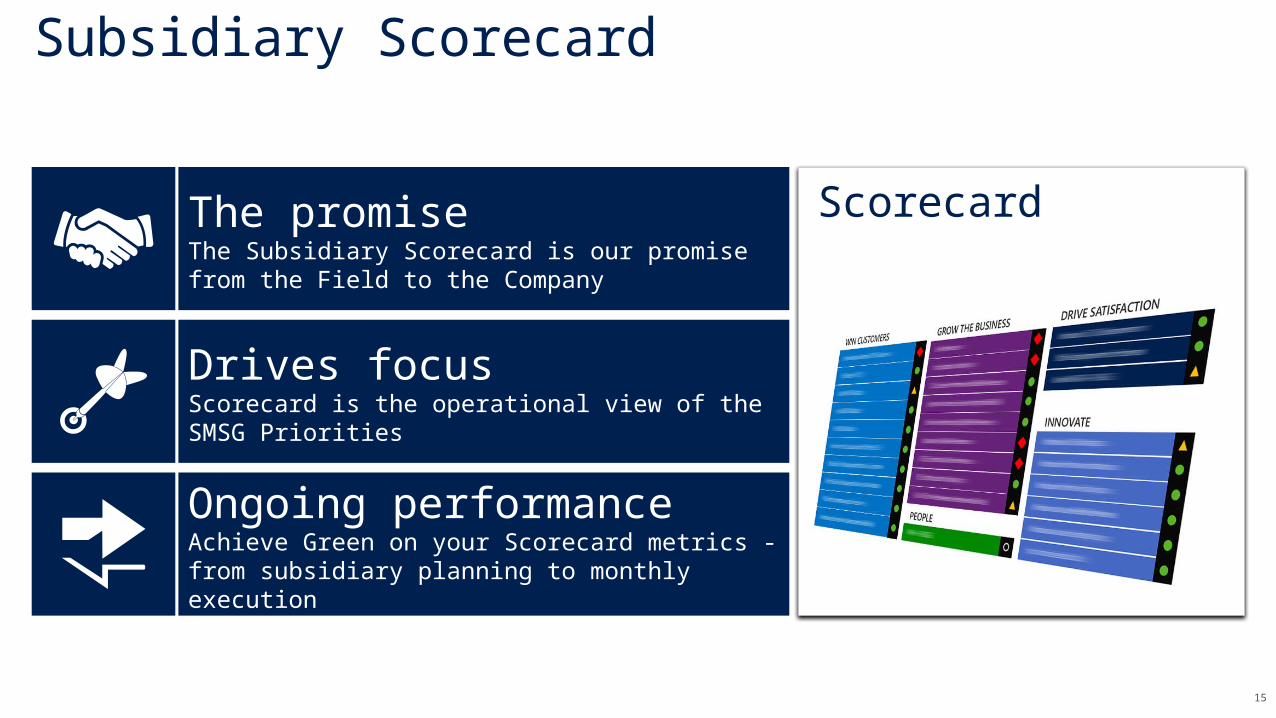
Scorecard
Subsidiary Scorecard
Drives focusScorecard is the operational view of the SMSG Priorities
Ongoing performanceAchieve Green on your Scorecard metrics - from subsidiary planning to monthly execution
The promiseThe Subsidiary Scorecard is our promise from the Field to the Company
16
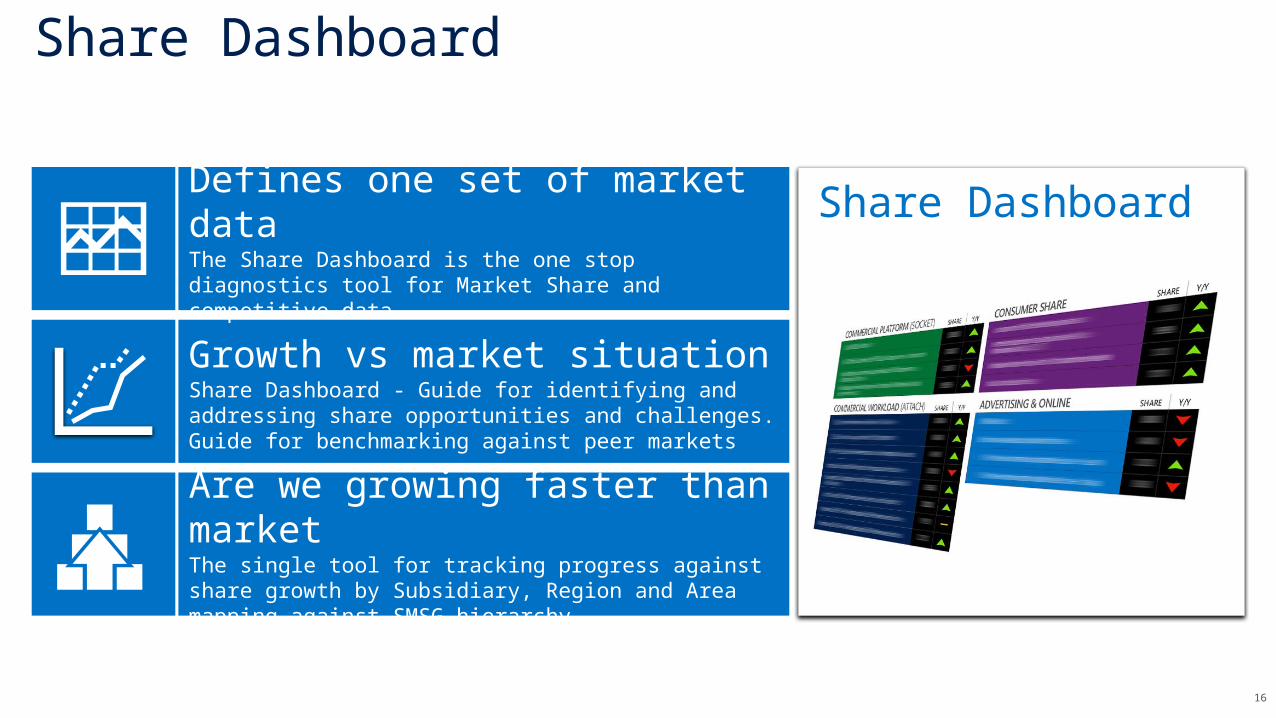
Share Dashboard
Share Dashboard
Growth vs market situationShare Dashboard - Guide for identifying and addressing share opportunities and challenges. Guide for benchmarking against peer markets
Are we growing faster than marketThe single tool for tracking progress against share growth by Subsidiary, Region and Area mapping against SMSG hierarchy
Defines one set of market dataThe Share Dashboard is the one stop diagnostics tool for Market Share and competitive data
17
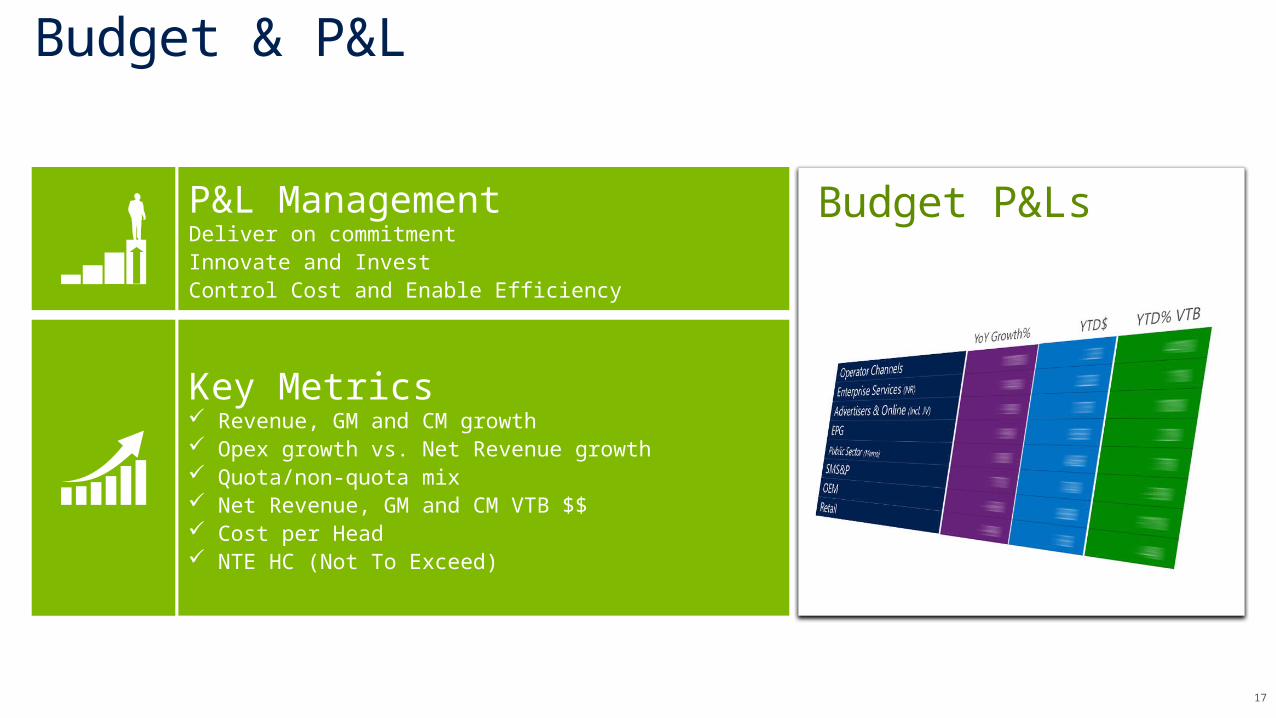
Budget & P&L
Budget P&Ls
Key Metrics Revenue, GM and CM growth Opex growth vs. Net Revenue growth Quota/non-quota mix Net Revenue, GM and CM VTB $$ Cost per Head NTE HC (Not To Exceed)
P&L ManagementDeliver on commitmentInnovate and InvestControl Cost and Enable Efficiency
18
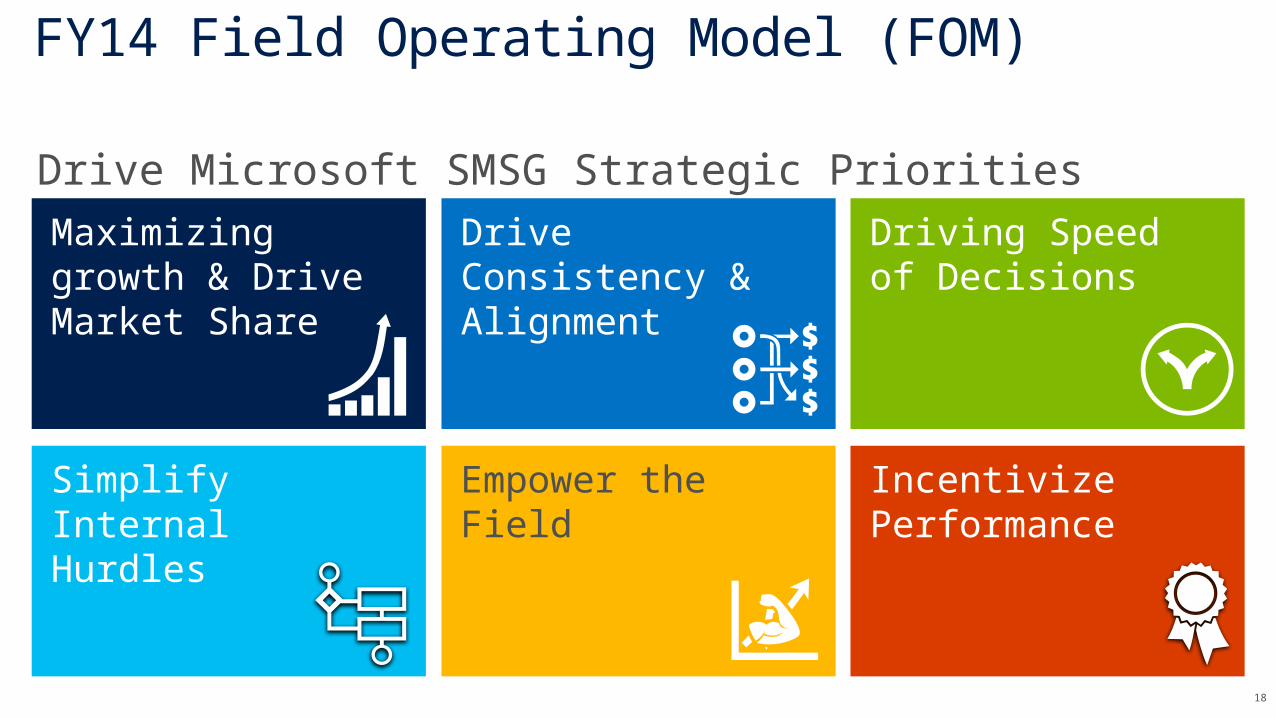
FY14 Field Operating Model (FOM)
Maximizing growth & Drive Market Share
Drive Consistency & Alignment
Driving Speed of Decisions
Simplify Internal Hurdles
Empower the Field Incentivize Performance
Drive Microsoft SMSG Strategic Priorities
19
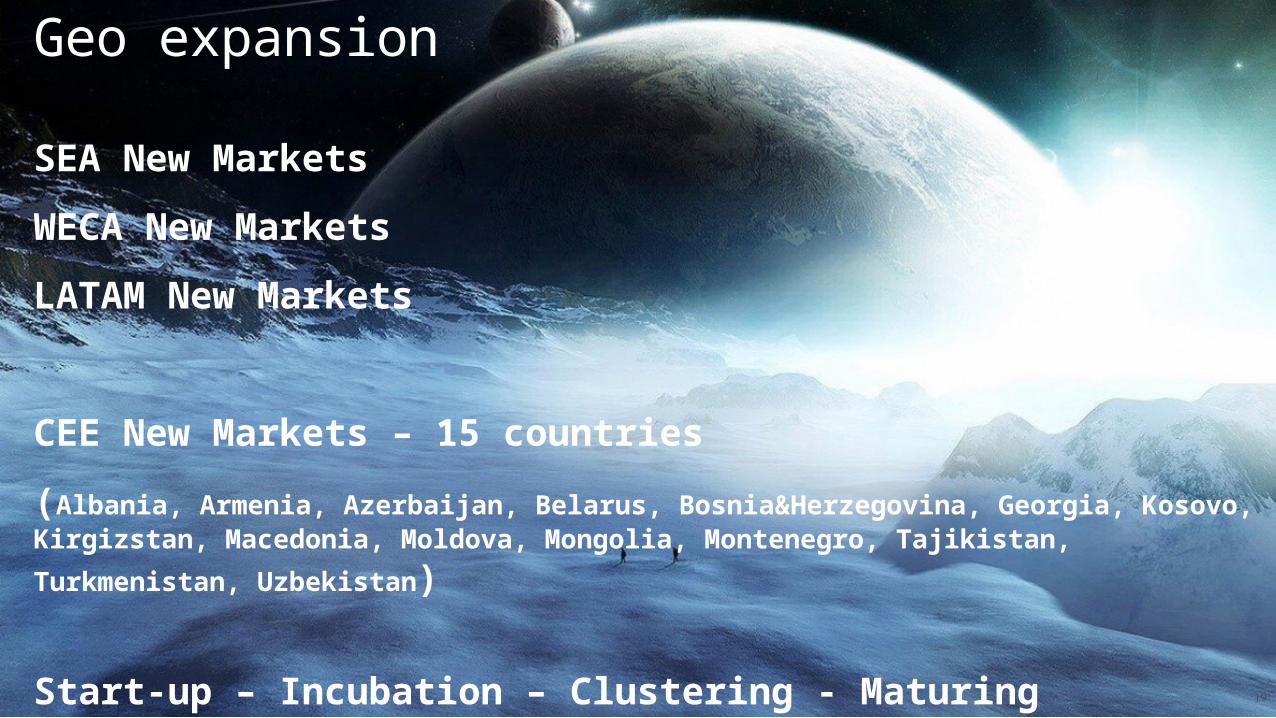
Geo expansion
SEA New Markets
WECA New Markets
LATAM New Markets
CEE New Markets – 15 countries
(Albania, Armenia, Azerbaijan, Belarus, Bosnia&Herzegovina, Georgia, Kosovo, Kirgizstan, Macedonia, Moldova, Mongolia, Montenegro, Tajikistan, Turkmenistan,
Uzbekistan)
Start-up – Incubation – Clustering - Maturing
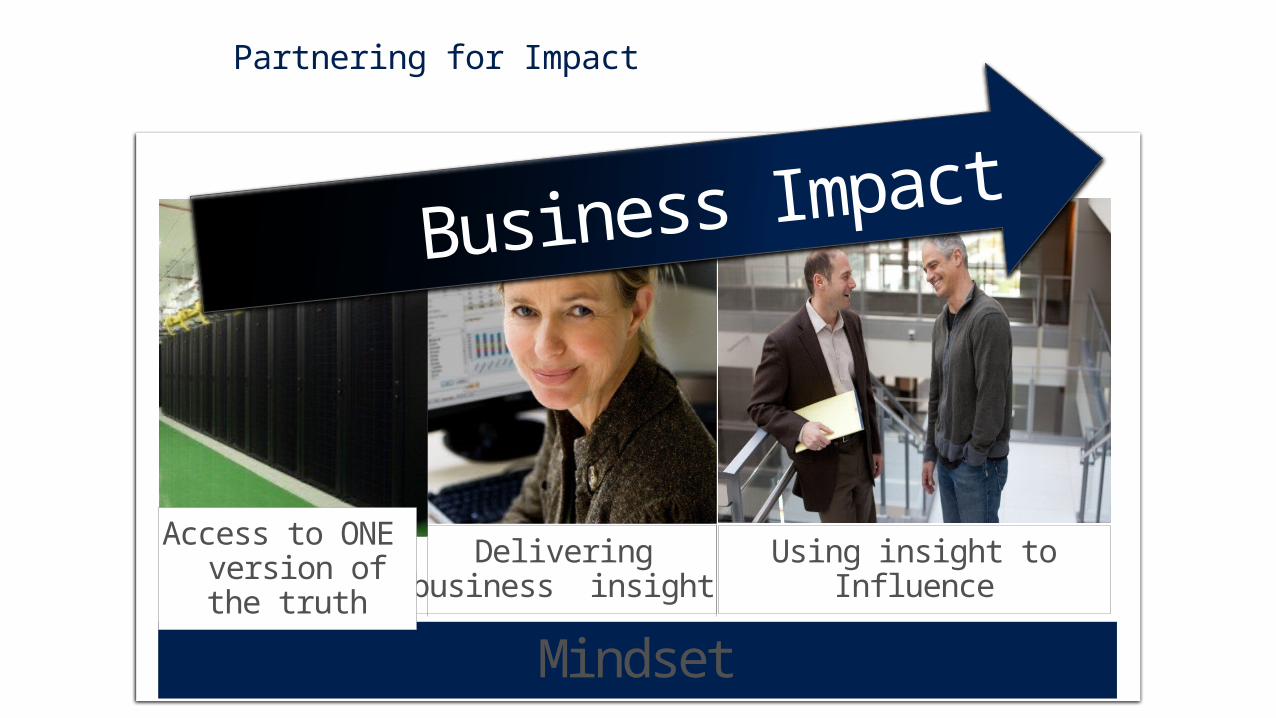
Mindset
Using insight toInfluence
Partnering for Impact
Delivering business insight
Access to ONE version of the
truth
Business Impact
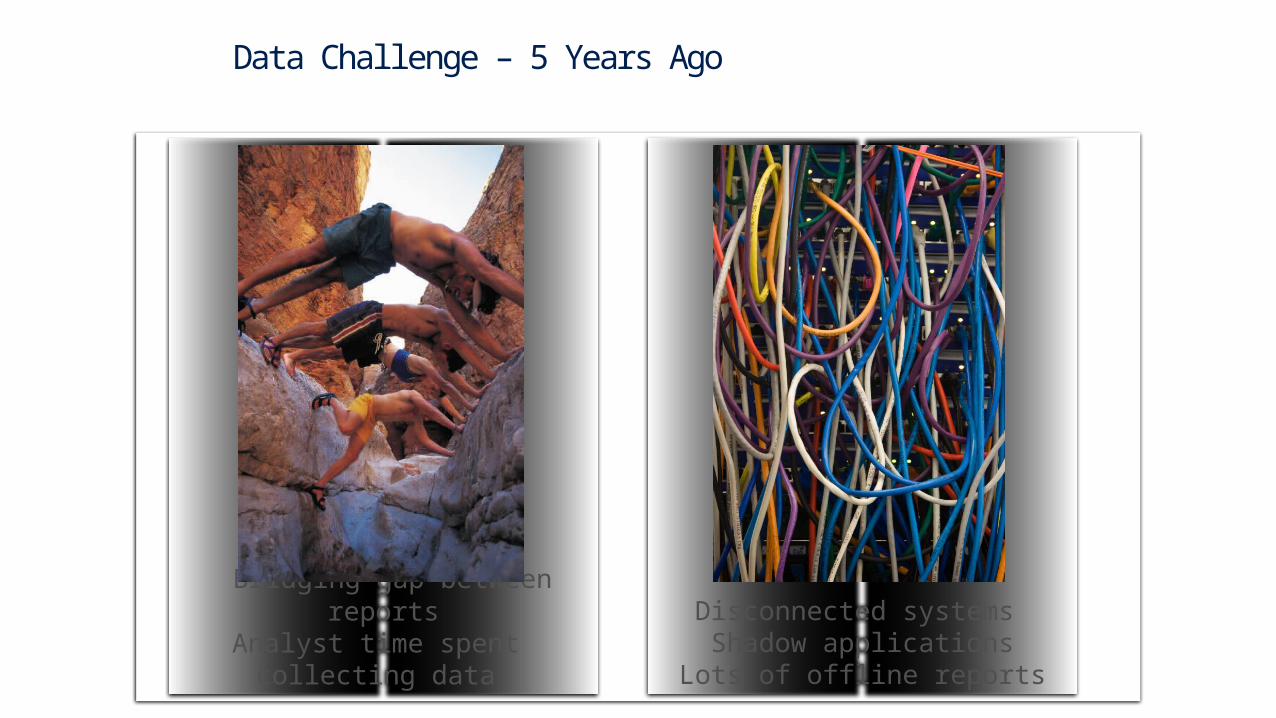
Bridging gap between reportsAnalyst time spent
collecting data
Disconnected systems Shadow applicationsLots of offline reports
Data Challenge – 5 Years Ago
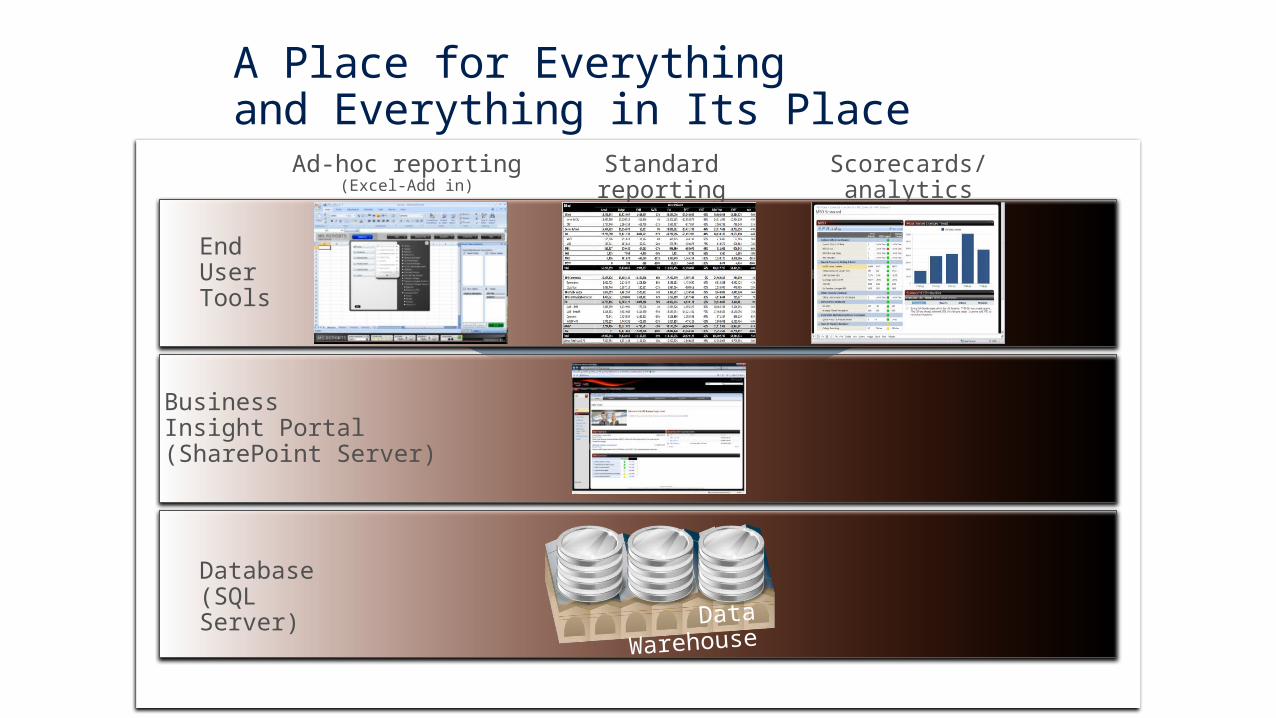
A Place for Everything and Everything in Its Place
Ad-hoc reporting(Excel-Add in)
Standard reporting
(Excel and SRS)
Scorecards/analytics
(Performance Point)
Business Insight Portal(SharePoint Server)
Database (SQL Server)
End User Tools
Data
Warehouse

Data OverloadData
Insight
Influence
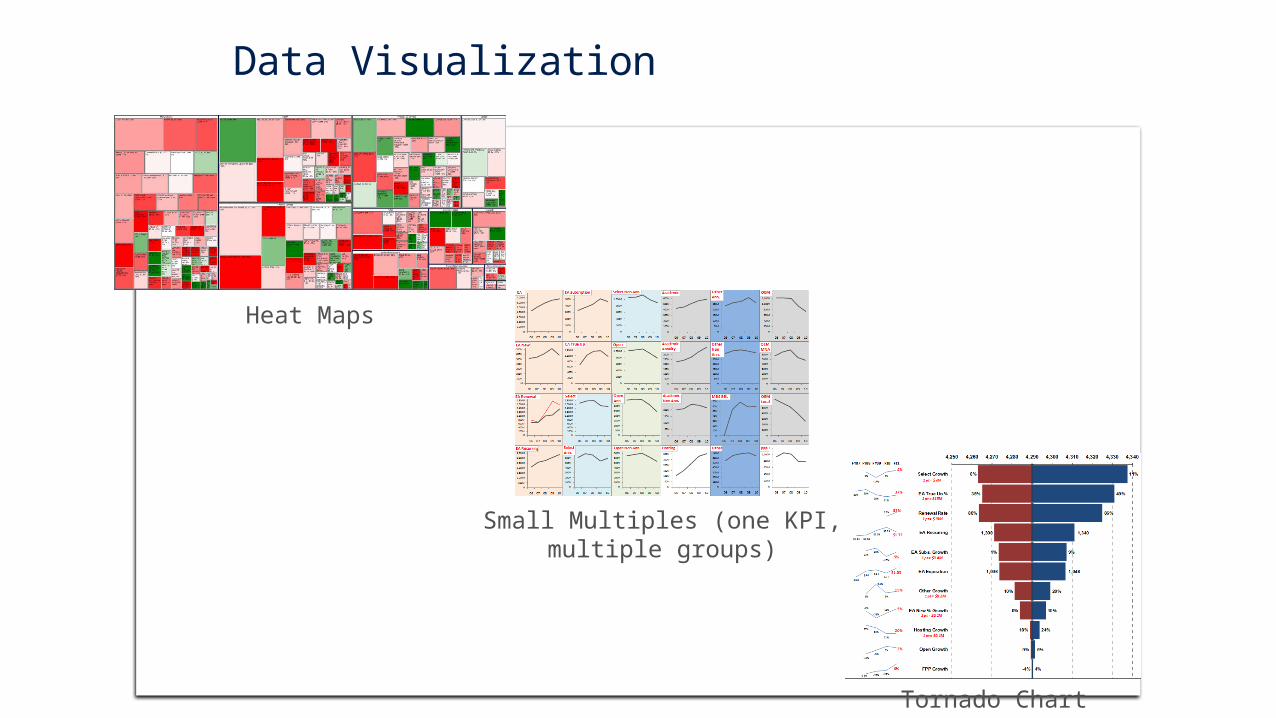
Data Visualization
Heat Maps
Small Multiples (one KPI, multiple groups)
Tornado Chart

Hard to Stay Connected
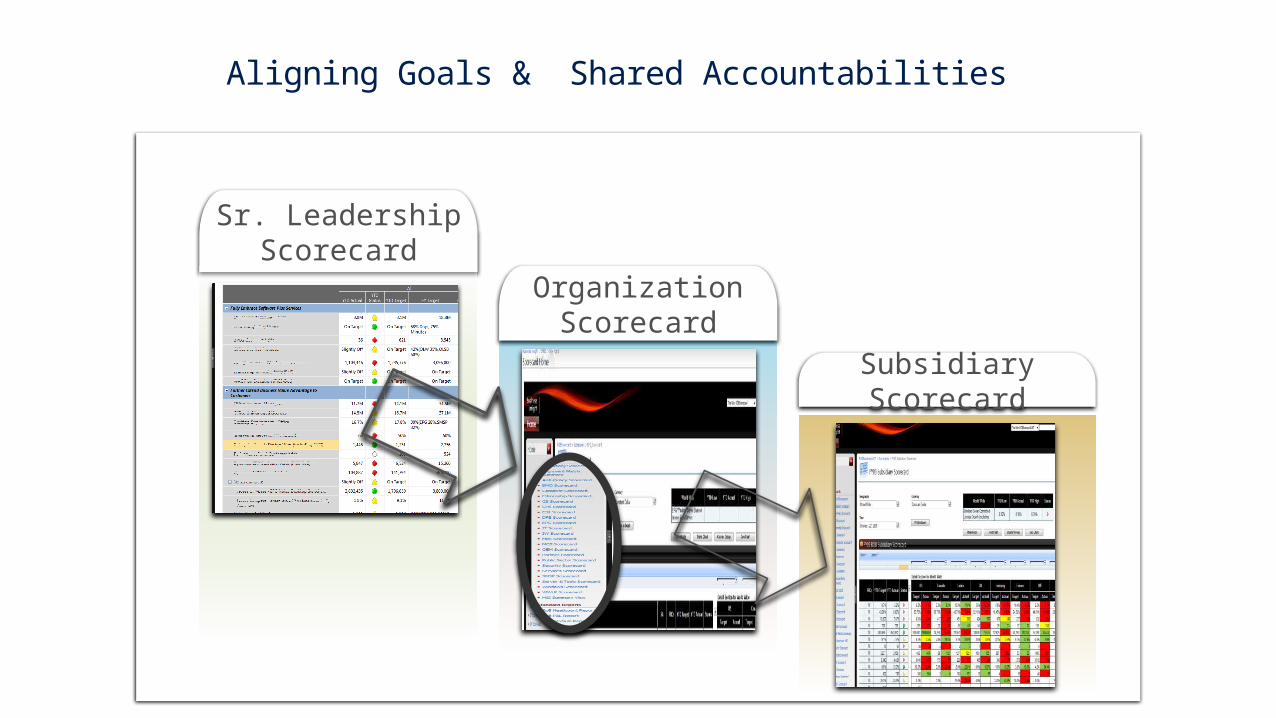
Sr. Leadership Scorecard
Aligning Goals & Shared Accountabilities
Organization Scorecard
Subsidiary Scorecard
27
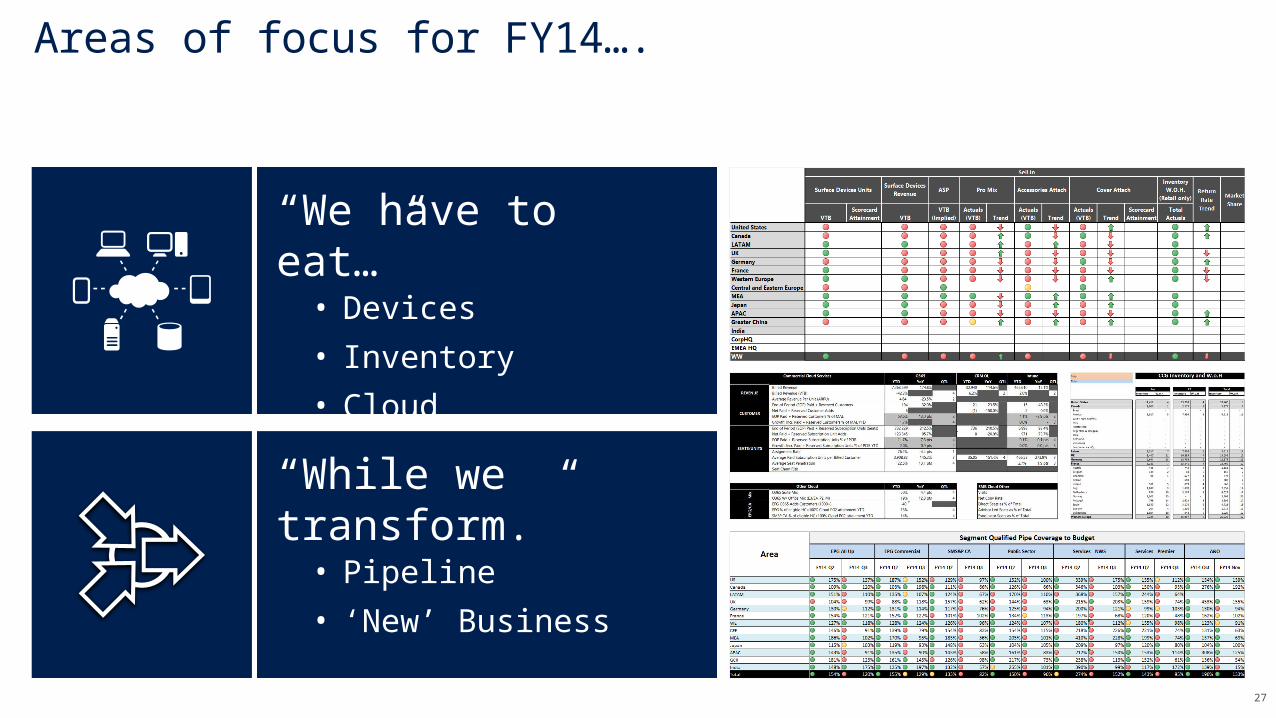
Areas of focus for FY14….
“While we transform.”• Pipeline
• ‘New’ Business
“We have to eat…”• Devices
• Inventory
• Cloud
28
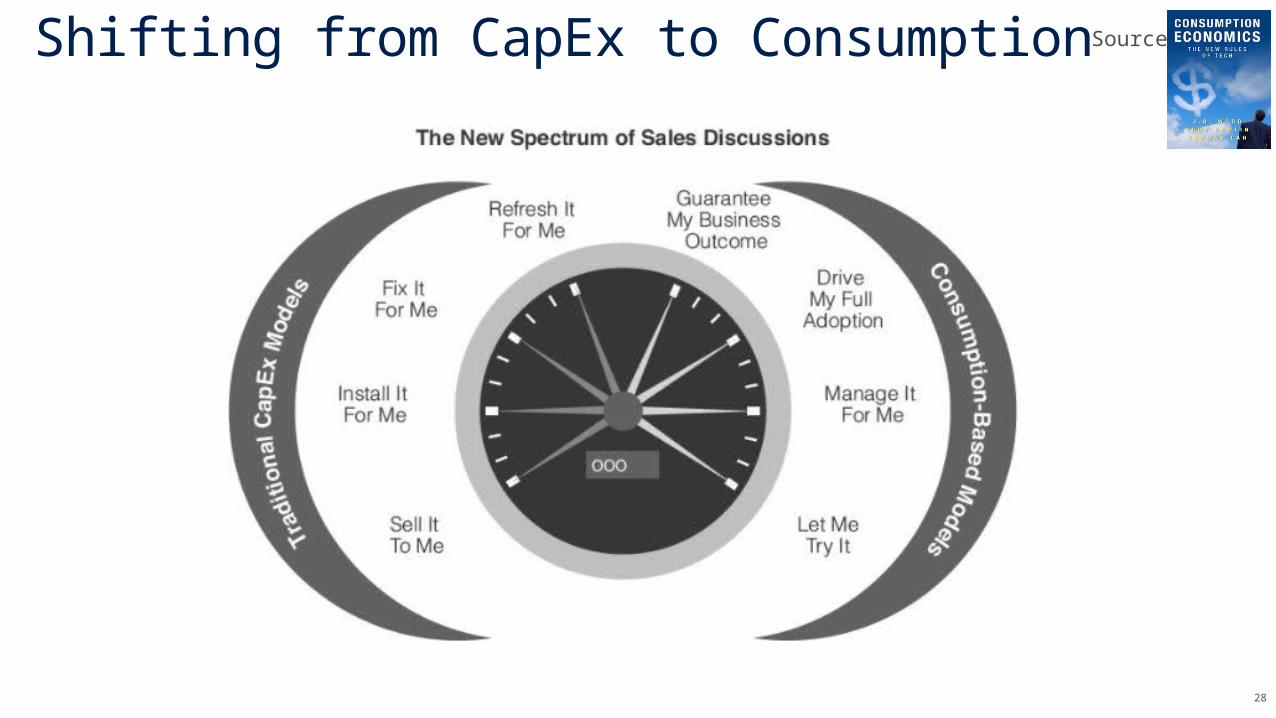
Shifting from CapEx to Consumption Source:

29
“You are going to be making a very significant bet on each customer you take on. You will have an expensive sales cycle. You will have a big services investment to get that customer and its end users ready…you might have little or no revenue from any of these steps. You are betting on the future.”--J. B. Wood “Consumption Economics: The New Rules of Tech”