beyond candlesticks - mec · chart ci chapter / renko charts construction of renko charts, l99...
TRANSCRIPT

BEYOND CANDLESTICKS
+ E f , E i [ E A L ,"Itarning is Like Rowing Upstream; Not to Adaance is to Fall Back"
a a a a a a a o o a a a a a a a a a a a a a a a a a a a a a a a a a a

BEYONDCANDLESTICKSNew |apanese Charting TechniquesRevealed
STEVE NISON
IOHN WILEY & SONS, INC.New York o Toronto o Chichester o Brisbane . Singapore
WILEY FINANCE EDITIONS
The New Technical Trader / Chande and KrollTrading on the Edge / DeboeckForecasting Financial and Economic Cycles / Niemira and KleinTrader Vic II / SperandeoGenetic Algorithms and Investment Strategies / BauerUnderstanding Swaps / MarshallFractal Market Analysis / PetersTrading Applications of ]apanese Candlestick Charting / Wagner and
MathenyFixed-Income Arbitrage / WongTrading for a Living / ElderThe Day Trader's Manual / EngThe Mathematics of Money Management / VinceIntermarket Technical Analysis / MurphyThe Foreign Exchange and Money Markets Guide / WalmsleyChaos and Order in the Financial Markets / PetersPortfolio Management Formulas / VinceFinancial Statement Analysis / FridsonMoney Management Strategies for Futures Traders / BalsaraDynamic Asset Allocation / HammerRelative Dividend Yield / SpareInside the Financial Futures Markets, 3rd Edition / Powers and
CastelinoOption Market Making / BairdFixed-Income Synthetic Assets / BeaumontSelling Short / WalkerThe New Technology of Financial Management / ChorafasManaged Futures in the Institutional Portfolio / EpsteinAnalyzing and Forecasting Futures Prices / HerbstForecasting Financial Markets / PlummerA Complete Guide to Convertible Securities Worldwide I ZubLakeCorporate Financial Risk Management / Wunnicke and WilsonInvesting in Intangible Assets / ParrTreasury Operations and the Foreign Exchange Challenge / ChorafasTrading and Investing in Bond Options / Wong

ACKNOWLEDGMENTSa a a o a a a a a a a a a o r a a a a a a a a a a a a a a a a a a a a a a o a a a a a a a
= 6 N H T f f . A M H"You Cnnnot Clap With One Hand"
A J"p"r,"se book that I had translated said that: "|apanese charts arefrequently considered secretive. The number of people who know theessentials of these charts are few and reference material is scarce."l Thispaucity of material was particularly true with some of the new techniquesrevealed in the second part of this book. However, thanks to the help ofsome important individuals, I was able to uncover many previously hid-den aspects of fapanese technical analysis.
Without the assistance of the translating done by Richard Solberg, itwould have been almost impossible to write this book-or my first one!Not only did Richard ably do the translating, but equally important washis tenacity in finding and obtaining the japanese books I needed for mybasic research. Richard has been one of my most vital resources.
As with my first book, I had the help of knowledgeable fapanesetraders who helped refine my knowledge by sharing valuable insightsobtained from their years of experience.
Mr. Hiroshi Okamoto, Director at Nomura Investment Trust, Mr. Ya-suhi Hayashi, Senior Trader at Sumitomo Life Insurance, Mr. Nori Ha-yashi, Investment Manager at Barclays Trust, and other members fromthe Nippon Technical Analysts Association (NTAA) in |apan were all verygracious. I am sure many of my questions may have seemed very rudi-mentary to them, but they were patient and open about sharing theirknowledge. Without their insights, this book would be much less de-tailed.
Mr. Kiyohiko Yoshizawa, vice president at Paine Webber, provided
vu

vlll Acknniedgments
valuable new facts and insights about the candles during our numerousmeetings.
One of my most important contacts was Mr. Yoji Inata, a correspon-dent for Reuters. Mr. Inata's assistance was critical f<lr the new toolsaddressed in this book; we spent many hours together. Not only did hetake his valuable time to review some of the new techniques to makesure I correctly understood the ideas, but he also took the extra step ofconferring with his ]apanese colleagues on points about which he wasnot 100o/o sure. Mr. Inata said that he enjoyed our studying together. Ithink he was being polite. Although I may have contributed to his knowl-edge in some respects, for the most part I was the student. I was fortunateto have had a gracious, knowledgeable, and friendly teacher.
Thanks again goes to my friend, Bruce Kamich. A true professional,he continues to provide me with a stream of insightful and helpful ideas.
The editor of this book, Susan Barry, was also the editor of my firstbook. Susan had the foresight to see how brightly the interest in thecandles would burn. She was a major factor in my choice of ]ohn Wiley& Sons to publish this book. I hope Susan does not decide to move to apublishing firm in the Antarctic. If I ever do a third book, I would haveto follow her.
As an English poet said: "Where ignorance is bliss, wisdom is folly."Before writing my first book, I was blissfully ignorant of all the time andeffort that goes into such a project. That book, made me aware of howdifficult the process is. Because of this, I had no desire to go through itall again. However, Dodge Dorland, Chief Investment Officer of LandorInvestment Management (New York, NY), gave me the push to do thissecond book. Dodge uses candles to trade stocks on an intra-day basisand has been one of the earliest proponents of candles. Anyone who hasdealt with Dodge can vouch for his amiability and for his knowledge.
Many of the charts in this book are from the MetaStock software byEQUIS International (Salt Lake City, UT). Without their assistance inproviding me with the new software to draw the kagi, three-line break,and renko charts, this book would be much less detailed. Their excellentsoftware, and helpful and knowledgeable staff makes MetaStock a plea-sure to use. For those interested in finding out more about the MetaStocksoftware, there is a coupon included at the back of this book. The dataused for the Metastock charts was from Dial-Data (Brooklyn, NY). I foundtheir data accurate and easily accessible.
I would like to thank Shahrokh Nikkhah whose early appreciation ofmy work and desire to make available the many advantages of candlestickanalysis to his clients brought about my joining his team where we offeradvisory and brokerage services at Daiwa Securities America. I wouldalso thank my colleague, Mark Tunkel for taking the time to help proof-
Acknowledgments
read this book.In this, as in my first book, you will see many CQG charts (Glenwood
Springs, CO). They are a real-time graphics charting service. CQG wasamong the first services in the West to offer candle charts to their clients.I have used their service for many years. The accuracy of their data andtheir support personnel, such as Steve Onstad in New York, make thisa premier real-time charting service. Their excellent worldwide reputationis well justified.
Reuters Ltd. (New York, London, and Tokyo) have also providedcharts for this project. Their RTA technical analysis real-time chartingproduct offers some unique capabilities. I have had the pleasure of givinga series of seminars for them throughout Europe. The fact that Reutershas gone through the time, effort, and expense to send me to Europe forthese seminars shows how committed they are in meeting the educationalneeds of their clients.
My first book, lapanese Candlestick Charting Techniques, was writtenaround the same time as the birth of my son, Evan. (At the time of Evan'sbkth, I frightened my wife, Bonnie, when I said I was going to namehim "Candlesticks Nison.") Evan is now four, and he enjoys "typing"
on my keyboard. I tell you this so that if there are typos, I now have anexcuse. My daughter, Rebecca, is eight and very bright. I have jokinglysaid that I wanted this book easy enough for a child to understand, so Ithink I'll ask her to proofread these pages (yet another excuse if you findany mistakes!). Finally, there is my loving and patient wife, Bonnie, whounderstands that it is great to have written, but most difficult to write.
Final thanks go to those who provided another incentive for writingthis book-the credit card companies and the bank that has my mortgage.
Note
loyama, Kenji, p.51.
ix

CONTENTS
PART ONE: CANDLES
Chapter
Chapter
INTRODUCTION
1 ovERvIEw
2 rHE BAsrcs
History of the candle charts, L3Evolution of the candle charts, L6
Construction of the candle line, L8Real body and shadows, 20The real body,20
Long white real bodies, 20Long white at a low price level, 2LLong white candle confirms support, 2LLong white body breaks resistance, 23Long white real bodies as suPPort, 25Long black real body at high price area,29Long black confirms resistance, 30Long black breaks support, 31Long black as resistance, 33Size and frequency of real bodies, 35Opening compared to prior real body, 38Spinning tops, 40
13
xl

Contents
Accumulation and distribution, 42Doj i ,45
Shadows,50High-wave candles, 52
55a
Chapter J THE PATTERNS
Single candle lines, 56The hammer, 56The hanging man, 59The shooting star, 64
Dual candle lines, 68Dark cloud cover, 58The piercing pattern, 73The engulfing patterns, 76Last engulfing patterns, 84Harami, 86
The window, 93Three windows, 102Two black gapping candles, 105Gapping doji, 106
Three or more candle lines, 109The evening star, L09The morning star, LL7
Record sessions, 1,21,
AChapter t CANDLES AND THE OVERALL TECHNICAL PICTURE
Stops, 130Risk/reward, L33Trend, L37Becoming a market chameleon, 142Computers and candles, L44
The importance of where a candle appears, \MThe question of determining specific criteria for the pattern,
145Placing the trade, 147When to offset a trade, L48
129
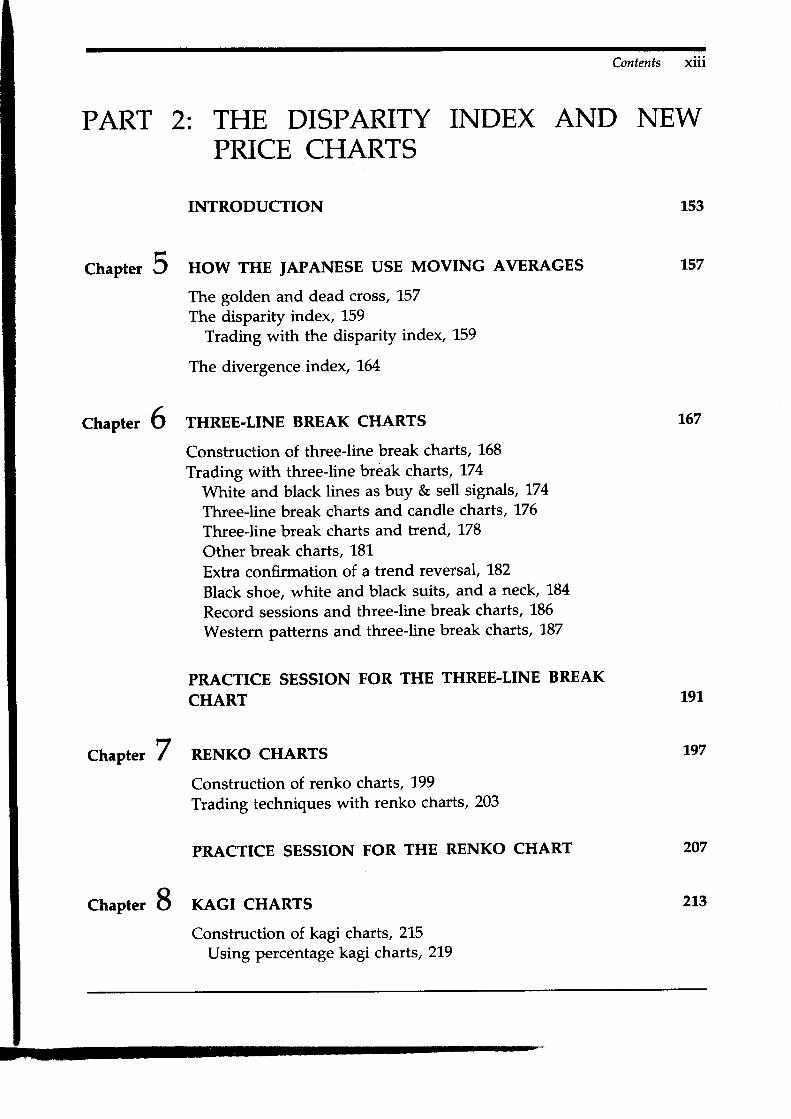
Contents xiii
PART 2: THE DISPARITY INDEX AND NEWPRICE CHARTS
INTRODUCTION 153
Chapter 5
Chapter 6
HOW THE IAPANESE USE MOVING AVERAGES
The golden and dead cross, L57The disparity index, 159
Trading with the disparity index, 159
The divergence index, L64
THREE.LINE BREAK CHARTS
Construction of three-line break charts, L68Trading with three-line break charts, l'74
lAlhite and black lines as buy & sell signals, 174Three-line break charts and candle charts, 176Three-line break charts and trend, 178Other break charts, 181Extra confirmation of a trend reversal, l'82Black shoe, white and black suits, and a neck, 184Record sessions and three-line break charts, L86Western patterns and three-line break charts, L87
PRACTICE SESSION FOR THE THREE-LINE BREAKCHART
CIChapter / RENKO CHARTS
Construction of renko charts, L99Trading techniques with renko charts, 203
PRACTICE SESSION FOR THE RENKO CHART
arChapter d KAGI CHARTS
Construction of kagi charts,215Using percentage kagi charts, 2L9
157
167
197
r97
207
2!3
xiv Contents
Trading techniques with kagi charts,220Buy on yang, sell on yin,220Shoulders and waists, 221Multi-level br eaks, 224Length of yang and yin, 224Where corrections stop within the prior kagi line, 226Double windows, 227Trendlines,2SlTweezers, 232Three-Buddha and reverse three-Buddha, 233Record sessions, 235
PR,ACTICE SESSION FOR THE KAGI CHART
CONCLUSION
GLOSSARY
BIBLIOGRAPHY
INDEX
241
247
275
a o o a a a a o a a a a a o a a o a o a o o o o o a a a o o o a o a o a a a o a a a
PART
+ + @
CANDLESa a a a a a o a a a a o o o a a a a a a o a a a o a a a a a a o o a o a a a o a a a
"Let Eaery Bird Sing its Own Song"
a a a a a a a a a a a a a a a a a a o a a a a a a o a o a a a a a a a a a a a a t a
INTRODUCTION
1.
2.
3.
A chart is like a map, the more information each one provides, the better
the chance of reaching your destination safely. Candle charts display a
more detailed and accurate map of the market than do bar charts. A
Japanese book that I had translated stated, "It is not an exaggeration to
say that candlesticks are the best in the world and a very exquisite cre-
ation for charts."l This is because, as detailed below, candle charts oPen
new avenues of analysis and offer many advantages over bar charts:
Candle charts will pictorially display the supply-demand situation by
showing who is winning the battle between the bulls and the bears.
Bar charts do not.
Like bar charts, candle charts will show the trend of the market, but
candle charts add another dimension of analysis by revealing the force
behind the move.
Bar chart techniques can often take weeks to transmit a reversal signal.
However, candle charts will often send out clues of imminent reversals
in one to three sessions. The result is that candle charts often providethe opportunity for more timely trades.
These are just some reasons why the flames of interest in candle charts
grow ever brighter. In just a few years, candle charts have joined bar
charts and point and figure charts as a basic charting technique.Candle charts are drawn using the same data as bar charts (the open,
high, low, and close), so they send all the same signals that can be found
ot but charts. Yet, as just discussed, the candles offer many advantages
over bar charts, so using candle charts instead of bar charts is a win-win
situation. When you use bar charts you only get bar chart signals. But,
with candle charts you get all the bar chart signals, plus you gain the

Candles
unique and powerful insights provided by the candles. so, why use abar chart?
Because the ]apanese are major players in most of the world's mar-kets, there is strong interest in how the |apanese use their technicals totrade. Candles are the most popular form of technical analysis in |apan.The importance of the candles for the |apanese trading community isillustrated in the following quote from the European magazine, Euroweek.This article quotes an English trader who works at a Japanese bank. Hestates: "All the |apanese traders here-and that's in the foreign exchange,futures and equities markets-use the candles. It might be difficult towork out the billions of dollars traded in London on interpretations ofthese charts each day, but the number would be significant."2
Think about it: Although billions are traded every day based on thecandle chart signals, until recently we had no knowledge of how the]apanese viewed the market with their technicals. This is hard to believe.Knowing the candles and their other technical tools discussed in thisbook may help answer the question, "What are the |apanese going to donext?."
Years ago, I met with the head of technical analysis for one of fapan'slargest life insurance companies (this fapanese trader wanted to meetwith me to learn how I used western technicals to trade). IzVhen he walkedinto my office, he saw I had candle charts on my desk. In a surprisedvoice, he asked: "You know about the candles?." I responded that I did.I then asked if he used them. He told me that his company's top man-agement would meet each Monday to discuss the world markets. At thesemeetings, he would bring his candle charts to offer his technical views.Then he pointed to my candle charts and asked: "How many otherAmericans know about this?." I said no one (this was before the publi-cation of my first book). He looked relieved. I then continued, "But Iwill soon have a book out about it." "So, many others will know aboutthis?," he asked in a disappointed tone. The point of the story is thatthe Japanese trader came to me to learn about how we, in the West, usetechnicals. The fapanese have learned from us and they know almost allof our technical methods. In most of the candlestick books and articles Ihave had translated from Japanese to English, there was at least somereference to western technical techniques. A quote from one of the booksI had translated stated, "To understand stocks it is not enough to knowthe |apanese chart methods . . . one must absorb the best parts of westerntechnicals: and on top of that using the best parts of Japanese charts tomake for a progressive outlook which is necessary for stock analysis."3We can see from this statement how the fapanese have used our methodsto enhance their own. one of the purposes of this book is to do the same

lntroduction
for Western traders-to show how to use the techniques implementedby the Japanese to enhance our market knowledge.
An article about my work appeared in the lapan Economic lournal. Tn
it, the reporter states: "lapan, which has been in the position to learnmany things from the West in the investments area, may be in the po-sition to teach something ."4 We now have access to a wealth of technicalinformation refined by generations to use; we afe learning from the Jap-anese.
Chapter 2 shows how to draw the basic candle line, and delves intosome history of the candle charts. Later in that chapter, I show how asingle candle line can provide important market insights. Chapter 3 dis-cusses the basic candle patterns. With the detailed descriptions of these
patterns, those new to candles and candle experts can discover new mar-ket perspectives. The last chapter in this section, Chapter 4 focuses onhow the overall technical picture is more important than a single candlepattern.
Notes
lHoshii, Kazutaka, p. L8.zEuroweek, August 30, 199'1.3Yasui, Taichi, p. 95.aThe
lapan Economic Joumal, ldy 23, 7991

CHAPTER 1
OVERVIEW
{ t J , tE)
) ( f f i n d-"The Buddha is Complete, But the Eyes Are Not in Yet"(The lob is Nof Yet Done)
THE EXPLOSIVE INTEREST IN THE CANDLES
FF
L here is a Japanese saying, "A clever hawk hides its claws." For overa century, the claws of Japanese technical analysis, that is candlestick
charts, were a secret hidden from the western world.For those new to the exciting field of candlestick charts, candlestick is
the term used for Japan's most popular and oldest form of technical
analysis. They are older than Western point and figure and bar charts.Amazingly, candlestick charting techniques, used for generations in theFar East, were virtually unknown to the West until I revealed them in
my first book, lapanese Candlestick Charting Techniques.I am pleased and proud that my first book has been credited with
revolutionizing technical analysis by igniting the flames of interest in thecandles. Before its publication, few people in the West had ever heardof a candle chart. Now, candle charting techniques are among the most
discussed form of technical analysis in the world!Interest in candle charts has become so intense that the World Bank
in Washington, DC asked me to address them on the subject. The world-wide interest in these previously secret techniques are reflected in thefinancial headlines below:
lnstitutional lnaestor-"Revealed! Ancient Japanese Trading System"
Wall Street loumal-"lapan's Candlesticks Light Traders' Path"
Euroweek-"Candlestick Charting Comes of Age"

Candles
Equity lnternational-"Candlestick Charting-A New Language for the west"Reuters-"Candlesticks Light New Path for Western Chartists,,
For over 70 years, the standard charting tools in the west have beenbar charts and point and figure charts. Yet, within a short time, candlecharts have now joined these as a basic charting tool. The rapidity withwhich this has happened is a direct reflection of the candle's popularityand value.
The groundswell of interest in the candlestick charting has become atopic in the media. A TV show, Tech Talk, on the business news cablestation CNBC is hosted by the famous technician, fohn Murphy. johntold me that a viewer once called and asked him, "What are those chartsthat look like hot dogs?" What an interesting and amusing idea, I thought,to Americanize these charts by referring to them as hot dog charts. ButI guess the term "candle chart," thankfully, is here to stay.
I have had many wonderful compliments from famous traders andanalysts. However, the most endearing compliment came from a womanwho wrote, "lf you ever have a down day, just remember there's a nicelittle grandmother in Missouri who's in awe of your accomplishments."This letter, besides being so gracious, illustrates the universal appeal ofcandles-from traders at the World Bank to a grandmother in Missouri.
The reason for the popularity of candlestick analysis is easy to un-derstand. They can be melded with any other form of technical analysis,they are applicable to any of the markets to which technical analysis isapplied, and they provide market insights not available anywhere else.
Why this book? A renowned 16th-century samurai swordsman statedthat "learning is the gate, not the house. You first have to go throughthe gate to get to the house."
My other book, lapanese Candlestick Charting Techniques, took youto the gate. This book takes you to the house and has many new, excit-ing, and effective techniques to improve your trading, investing, orhedging.
Japanese charting was considered a secret. However, I have managedto pry open the "secrets of the Orient" by exchanging ideas with manyJapanese traders who use candles and by having many hundreds of pagestranslated from ]apanese into English. Lin Yutang, a noted Chinese phi-losopher, sagely noted that one gets a different flavor from reading thesame book at different stages in life. Therefore, he says, all great bookscan be read with profit and pleasure a second time; I have found this tobe true.
In the time since the publication of my first book, I have reread myoriginal candlestick documents and have gleaned new insights. In ad-dition, I have obtained and translated new ]apanese material, have ex-

Overuiew
panded my dialogue with more fapanese technicians and, of course, havecontinued to learn from my use of candles. I reveal these new and val-uable insights in this book.
My first book focused on the futures markets. The candles have now
become so important that their popularity has spilled over from futuresinto stock, bond, and foreign exchange markets from around the world.As a result, this book will have many more of the charts than did myother book.
At times, a single candle line can be important. The Japanese have a
saying, "With the fall of one leaf we know that autumn has come to theworld." In this sense, a single candle line may be the first sign of a marketturn. In this book, I will show how to use individual candle lines to obtain
clues about the market's health.It has been very exciting to see the intense interest sparked by the
candles. However, it is often forgotten that the emergence of a candlepattern is but one aspect of trading. Other aspects, such as the risk andreward ratio of a potential trade and monitoring where the candle patternappears in the overall technical picture, must also be considered. This is
so important that I have devoted a chapter to these aspects.In my continuing studies of ]apanese trading techniques, I have un-
covered three charting methods that are very PoPular in ]apan, yet are
unknown to the West. These charting techniques are called three-linebreak charts, kagi charts, and renko charts. They are revealed in Part 2
of this book.In the days of fur trading in the United States, there was a comPany
called the Hudson Bay Trading Company. Th"y were known for takingrisks and for careful preparation. Trading journeys were undertaken withmuch excitement, but in case the fur traders forgot anything, they wouldcamp out the first night just a few miles away from the company's head-quarters. In other words, careful preparation spared the travelers poten-tial difficulties.
In Chapters 2 and 3, I too provide careful preparation by providing aprimer on basic candle theory and patterns. For those new to candlecharts, these chapters will provide the groundwork for your candle chartanalysis.
Many of you are probably already familiar with the basics of candlecharts. With this in mind, Chapters 2 and 3 will also offer a deeperknowledge of the candles by revealing new candle theories, techniques,and tools. As a result, even those knowledgeable about candles will gainnew insights and pelspectives into the power of the candle charts. Forexample, when I describe the candle patterns in Chapter 3, I will providea unique visual glossary of candle patterns. This method of drawing thepatterns will provide a dimension of candle pattern analysis that was
10 Candles
never before available. After you explore with me the beauty and powerof the candle charts, you will never be able to go back to a bar chart.
This book will be a self-contained unit. I will not go over all the candlepatterns; that is done in my first book. However, I will sometimes makereferences to the more obscure or rare patterns discussed in my first book.This is for the benefit of those who are familiar with all the candle pat-terns. Do not worry if you have not heard of the pattern before; it willnot detract from the discussion of the chart.
Numerous charts and exhibits will quickly and clearly make evidenthow candles can enhance your trading, timing, and investing. As shownthroughout the book, candles can be merged with any other form oftechnical analysis. Consequently, I have included charts that show howto fully utilize the candles' power alone, or when joined with other tech-nical tools.
Just as important as the recognition of candle patterns is an under-standing of the relationship of the candle patterns to the overall technicalpicture. Chapter 4 focuses on this vital, but often neglected, aspect. Inthis chapter, I will address how trading with the candles must take intoaccount the risk and reward of a potential trade, the stop-out level, andthe overall trend. I will also address the value of adapting to changingmarket conditions.
Before I discuss trading with candles, I want to clarify a few points.In the futures market, selling short is as common as buying long. This isnot true in the stock markeU most equity traders look to buy. Conse-quently, throughout this book when I use the term "bearish" or "sell-ing" when discussing a stock, you should not think of necessarily goingshort. Instead, view it as an area to protect existing longs by such meansas selling covered calls, moving up protective stops, or offsetting all orsome longs.
But this book is about more than candles. In Part II I reveal the dis-parity index, the three-line break, renko charts, and kagi. These tech-niques, popular in Japan, are virtually unknown in the west and, unlikecandle charting, little has been written about these techniques, even inJapan.
The disparity index compares the close to a moving average. It is usedin the same manner as dual moving averages, but it has an interestingwrinkle to it. The three-line break, kagi charts, and renko charts arepopular among Japanese traders. They are excellent technical tools fordetermining the trend of the market.
Whether you use the techniques discussed in this book individuallyor in combination with one another, you will discover that they providedynamic advantages for those who make use of their tremendouJ poten-tial.

11
Note to Reader: Many charts in this book, especially in Part II, weredrawn using technical analysis software from Metastock by EQUIS In-ternational (Salt Lake City, UT). A coupon for Metastock Software isincluded at the end of the book.

CHAPTER 2
THE BASICS
d \ s d t ."lnattention is Fatal"
HISTORY OF THE CANDLE CHARTS
rF
I Hg fapanese were the first to use technical analysis to trade one of theworld's first futures markets-rice futures. The Japanese started trading
in this market in the 1600s. Interestingly, the birth of the Japanese ricefutures market was a consequence of the country's military history.
After a century of internal warfare among the daimyo ( Japanese feu-dal lords), General Tokugawa Ieyasu, who ruled from Edo (the ancientname of Tokyo), won the famous battle at Sekigahara in 1600. This was
the battle that helped unify fapan. Tokugawa thereafter became Shogun
of all ]apan. After his victory over the daimyo, General Tokugawa clev-
erly required that all the feudal lords live in Edo with their families. Whenthe lords returned to their respective provinces, the entire family stayedat Edo as hostage. The feudal lord's main source of income was rice thatwas collected as tax from the peasants who worked their land. Since thisrice could not be transported from the daimyo's provinces all the way toEdo, they set up warehouses in the port city of Osaka to store their rice.
Because all these powerful daimyo lived so close to each other in Edo,they attempted to outdo one another in lavish dress, mansions, and otherluxuries. This was reflected by a popular saying at the time, "The Edoitewill not keep his earnings overnight." This showed that the daimyo in
Edo were seen as spendthrifts with an expensive lifestyle. To maintain
this lifestyle, the daimyo sold rice from their warehouse in Osaka; some-times thev even sold rice from future harvests. The warehouse would
13

t4 Candles
issue receipts for this future rice. These were called empty rice contracts("empty tice" since the rice was not in anyone's physical possession)and they were sold in the secondary market. This was the beginning ofone of the world's first futures market.
Trading in rice futures engendered much speculation, and it was fromthis speculation that Japanese technical analysis was born. The most fa-mous trader in the rice futures market was Homma. Homma traded inthe rice futures markets in the 1700s. He discovered that although therewas a link between the supply and demand of rice, the markets werealso strongly influenced by the emotions of the traders. Because of this,there were times when the market perceived a harvest as different fromthe actual. He reasoned that studying the emotions of the market couldhelp in predicting prices. In other words, he understood that there wasa difference between the value and the price of rice. This difference be-tween price and value is as valid today with stocks, bonds, and curren-cies, as it was with rice centuries ago.
In the material I had translated, candle charts are often called Sakatacharts in reference to the port city of Sakata, where Homma lived. How-ever, based on my research, it is unlikely that Homma used candle charts.As will be seen later, when I discuss the evolution of the candle charts,it was more likely that candle charts were developed in the early part ofthe Meiji period in japan (in the late 1800s).
whether or not Homma invented charting is open to question. Butdetermining whether one person, in this case Homma, created charts orused them to trade is not too important. There is a tendency in the Westto be preoccupied with imposing authorship to one person. It is morelikely that the candle charts we know today and all the techniques as-sociated with them tended to be a process of cumulative authorship byseveral people over many generations. Even if he did not invent candlecharts, Homma understood that the psychological aspect of the marketwas critical to his trading success. And it appears that the earliest formsof technical analysis in Japan dealt more with the psychology of themarket rather than charts.
In the book, The Fountain of GoId-The Three Monkey Record of Money,purportedly written by Homma, the author states: " After 60 years ofworking day and night I have gradually acquired a deep understandingof the movements of the rice market." The book then goes on to say:"when all are bearish, there is cause for prices to rise. when everyoneis bullish there is cause for the price to fall." This phrase echos what isnow called contrarian opinion, a tool important to so many traders. yet,The Fountain of Gold-The Three Monkey Record of Money, was written in1755.It is amazing that before America was a nation, the Japanese weretrading with contrarian opinion! The title had me perplexed for some
The Basics
time. I did not understand the reference to the "three monkeys" in the
title. Then in some of my translated material, it said something aboutcomparing successful trading to being like the three monkeys we all knewas children-see, hear, and speak no evil. Then it dawned on me; thetitle of the book, The Fountain of Gold-The Three Monkey Record of Money,means that for traders to get to their "fountains of gold," they shouldhave the characteristics of these three monkeys. Specifically:
L. "See no evil"-when yolJ see a bullish (bearish) trend, do not getcaught up in iU consider it an opportunity to sell (buy).
In the Fountain of Gold, it states that there is always a rotation of Yang(bullishness) and Yin (bearishness). This means that within each bullmarket, there is a bear market, and within a bear market, there is a bullmarket. This view may explain why fapanese candlestick techniques placeso much emphasis on reversal, rather than continuation, patterns.
2. "Hear no evil"-when vou hear bullish or bearish news, don't tradeon it.
It may be safer to take a position after you determine how the market
reacts to a news item rather than initiating a trade when the news is
released. Bernard Baruch, the millionaire stock speculator and presiden-
tial advisor, stated that what is important in market fluctuations "are not
the events themselves, but the human reactions to these events." Exhibit
2.L shows that how the market reacts to the news may be just as impor-
tant as the news itself.The Iraqi War started in the first few days of August 1990. Yet, Exhibit
2.L shows that gold stalled at$425. This $425level was gold's high earlier
in 1990. This failure to take out the prior high was in spite of the fact
that there was a Mideast War. Gold's failure to rally on suPPosedly
bullish news sent out volumes of information about the state of the mar-
ket. To wit, be careful of a market that fails to rally on bullish news. Note
that after this failure at$425, gold lost its luster as prices returned to their
pre-Mideast crisis price near $360 within two months.Also be aware of what the Japanese refer to as "whispering tactics."
This is what they call the spreading of false news to trick others in themarket. Try to keep out of rumor buffeted markets. Isaac Newton oncesaid, "I can calculate the motion of heavenly bodies but not the madness
of people." Why get involved with the madness of people?
3. "Speak no evil"-don't speak to others about what you are going todo in the market.
15

16 Candles
EXHIBIT 2.1. Observing the Market's Reaction to Fundamental News, Gold-December 1990, Daily
Has the following happened to you? Based on your analysis, you decideto buy into a market. You tell someone else of this decision, but they saysomething negative about that market. Because there is always a degreeof uncertainty, you get nervous and decide not to buy. Then, of course,the market rallies.
If you have carefully studied the market, it is safer not to speak toanyone about what you plan on doing unless you believe they have betterinsight than you. Look only to the market to give you direction. In oneof my favorite passages inThe Fountain of Gold, it says that ". . . to learnabout the market ask the market-only then can you become a di:testablemarket demon." Isn't that a wonderful phrase? Wouldn't you love tobecome a detestable market demon? The colorful language used by the Jap-anese is just one reason their technical techniques are so exciting.
Let us turn our attention to Exhibit 2.2, which illustrates the path thatultimately led to the candle charts.
Evolution of the Candle Charts
A. Stopping chart-Also referred to as a point, line, or star chart. Thiswas the earliest type of chart and was drawn by joining only closing

(A)Stopping Charts (close)
,4. .f+/ v J t(B)
Pole Charts (High-Low)
(D)Anchor Chart (High-Low-Close-Open)
prices. Th"y were named stopping charts because that was where theprices stopped by the end of the session. Stopping charts were drawnwith either diagonal lines or horizontal lines connecting the closes.
B. Pole chart-Its name is derived from the fact that the lines resemblepoles. This chart added the extra information imparted by showing therange between the high and the low of the session. These lines show notonly the direction of the move, but the extent of the move for eachsession.
C. Bar chart-This is a combination of the stopping and pole charts.D. Anchor chart-Named as such because it looks like an anchor.
Based on legend, these charts originated in the Kyoho Era (from 1716)from the fact that the usual meeting place for rice traders was port cities.
The anchor chart was an important event in the evolution of charting.With this chart, the opening price was now added and created a chartwith an open, high, low, and close. Just as important, and somethingunique to fapanese charts, was that the relationship between the openand close was pictorially displayed. The top and bottom of the anchor'svertical line are the high and low of that session. The horizontal line ofthe anchor line is the open. The arrow of the anchor line is the close. Ifthe close is higher than the open, the arrow points up; if the close islower, the arrow points down.
(c)Bar Chart (High-Low-Close)
(E)Candle Chart (High-Low-Close-Open)
The Basics 17
EXHIBIT 2.2. The Evolutionary
Path to the Candlestick Charts
,f t f ', f i
H
.,i t:l t T" T ' i l
H
+{ ' { + to * ' 4
:tr
18 C-andles
E. Candle chart-The next improvement from the anchor charts wasthe candle chart. Although they are shrouded in mystery, the candlesprobably started in the early part of the Meiji period (from 1868). As canbe seen in Exhibit 2.28, candle lines were a refinement of the anchorchart. The use of black and white real bodies made analyzing the un-derlying supply and demand situation visually easier to determine thanwith the anchor charts.
With the arrival of the candle charts, Japanese technical analysis flow-ered as people started thinking in terms of signals and trading strategies.Patterns were developed and market prediction became more important.Trying to forecast the market took on extra importance in the L870s whenthe fapanese stock market opened.
As can be seen from Exhibit 2.2, bar charts were one of the ancestorsof the more evolved and productive candle charts. In essence, this meansthat since most of the West is still using bar charts, it is also using a lessevolved form of charting than the Japanese are with candle charts.
CONSTRUCTION OF THE CANDLE LINE
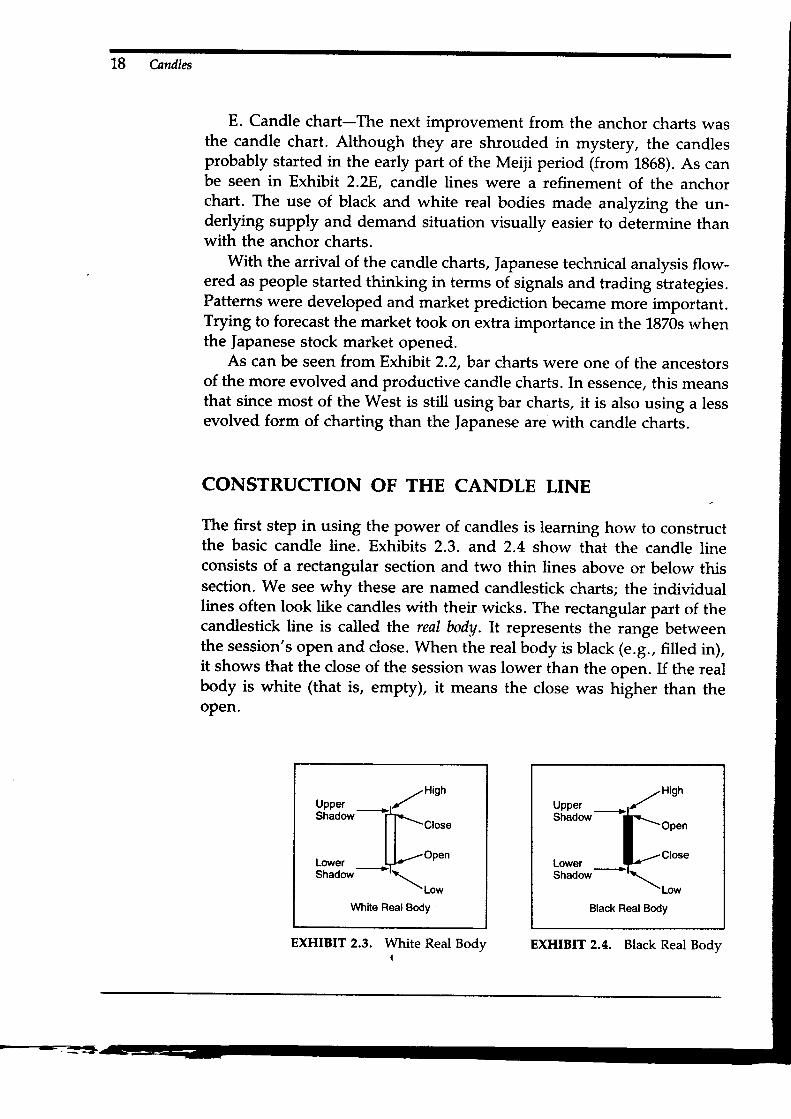
The first step in using the power of candles is learning how to constructthe basic candle line. Exhibits 2.3. and 2.4 show that the candle lineconsists of a rectangular section and two thin lines above or below thissection. We see why these are named candlestick charts; the individuallines often look like candles with their wicks. The rectangular part of thecandlestick line is called the real body. lt represents the range betweenthe session's open and close. When the real body is black (e.g., filled in),it shows that the close of the session was lower than the open. If the realbody is white (that is, empty), it means the close was higher than theoPen.
White Real Body
EXHIBIT 2.3. White Real BodvI
Black Real Body
EXHIBIT 2.4. Black Real Body
F.-==*

The Basics
The thin lines above and below the real body are the shadows. Theshadows represent the session's price eXtremes. The shadow above thereal body is referred to as the upper shadow and the shadow under thereal body is the lower shadow. Accordingly, the peak of the upper shadowis the high of the session and the bottom of the lower shadow is the lowof the session.
Candle charts can be used throughout the trading spectrum, fromdaily, to weekly, and intra-day charting. For a daily chart, one would usethe open, high, low, and close of the session. For a weekly chart, thecandle would be composed of Monday's open, then the high and low ofthe week, and Friday's close. On an intra-day basis, it would be the open,high, low, and close for the chosen time period (i.e., hourly).
Exhibit 2.3 shows a strong session in which the market opened nearthe low and closed near its high. We know that the close is higher thanthe open because of the white real body. Exhibit 2.4 illustrates a longblack candlestick. This is a bearish session in which the market openednear its high and closed near its low.
The |apanese focus on the relationship between the open and close.This makes sense; probably the two most important prices of the day arethe open and close. It is therefore surprising that American newspapershave openings for futures prices, but not for stocks. A member of theNippon Technical Analysts Association told me that he found it unusualthat U.S. newspapers do not have opening stock prices; the Japanesehave the openings in their papers. He said that he did not know whythe Americans disregard the openings.
I would expect that just as almost all technical software vendors nowcarry candle charts, so it may be that as candles become more popularin the equity market, newspapers may, by popular request, carry stockopenings. Until then, in order to obtain the data needed to draw thecandles (the open, high, low, and close) you need to use a data vendorservice. These services furnish prices on disks or through modems. Thedata supplied from a data vendor are then transferred into a technicalanalysis software package that will draw the candles based on thesedata.
A note of caution: Some data vendors who do not have the actualopening price of a stock default to the prior session's close as today'sopen. This, in my opinion, is not valid. You must have the true open todraw an accurate candle line. Although an open on a stock will usuallynot be much different from the prior close, there are some candle patternsin which a higher or lower opening (compared to the prior close) givesvaluable information. A data vendor that includes actual opens on stocksis Dial Data (Brooklyn, NY).
t9

20
REAL BODY AND SHADOWS
While an individual candle usually should not be used alone to place atrade, the size and color of its real body and the length of its shadowscan provide a wealth of information. Specifically, looking at a line's realbody and shadows gives a sense of the supply and demand situation.This section will discuss this basic idea, and explain how to use realbodies and shadows to get clues about the market's underlying strengthor weakness. By using the candle lines discussed below, you may be ableto get an early and tentative indication of market direction.
THE REAL BODY
In ]apanese charts, even an individual candle line has meaning, and oneof the first clues about the vitality of the market is to look at the size andcolor of the real body. To the |apanese, the real body is the essence ofthe price movement. This is a critical and powerful aspect of candle charts;through the height and color of the real body, candle charts clearly andquickly display the relative posture of the bulls and the bears.
This section will be segmented according to the decreasing size of thereal bodies. The first part of this section will consequently focus on longwhite and then long black real bodies. After these, attention is turned tocandles with small real bodies called spinning tops. These diminutivereal bodies display a market where the bulls and bears are in a tug ofwar.
This section will conclude with candles that have no real bodies. Thesecandles have the same (or nearly the same) opening and closing. Suchcandles, called doji (pronounced d6-gee), reflect a market in a state oftransition. Doji, as you will see later, can be an important market signal.
Long White Real Bodies
A long white real body is defined as a session that opens at or near thelow of session, and then closes at or near the session's high. The closeshould be much higher than the open. For example, if a stock opens at$40 and closes at $4ff/v it would not be a long white candle since theopening and closing range were relatively close. For a long white candleto have meaning, some Japanese candlestick traders believe that the realbody should be at least three times as long as the previous day's realbody.

The Basics 21
I, I
tlIt , ' i l "" , '
EXHIBIT 2.5. Long White at a Low Price Level
Long White at a Low Price Level
A single candle by itself is rarely sufficient reason to forecast an imme-diate reversal. It could, however, be one clue that the prior trend maybe changing. For instance, as shown in Exhibit 2.5, a long white realbody at a low price range may be the first sign of a market bottom. Along white candle shows that the ability to rise is virtually unimpededby the bears. The closer the close is to the high of the session, and thelonger the white real body, the more important the candle line.
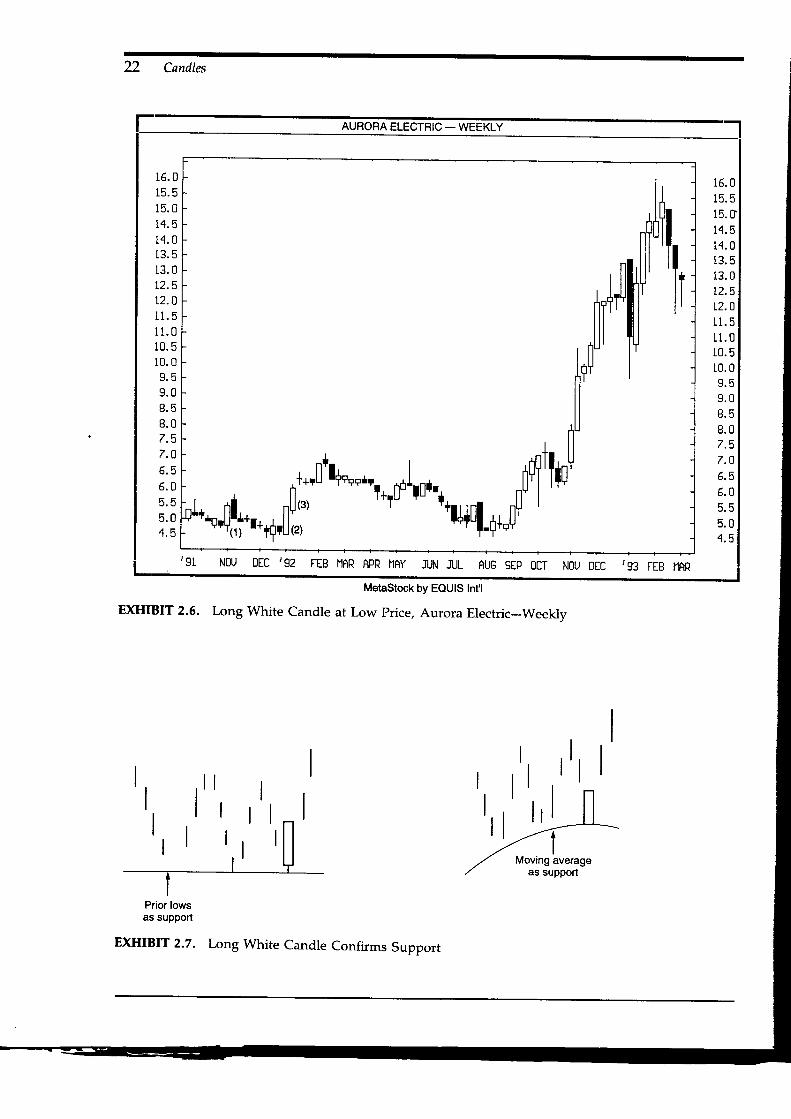
Exhibit 2.6 shows that in late \991., this stock was stabilizing near $5.The first sign that the bulls were attempting to take control was theunusually long white real body at 1. Note how this real body was ex-tended compared to the prior real bodies. However, an almost equallylong, but black real body (for information on black real bodies, see page29), on the week after candle L showed that the bears still had enoughforce to offset the bulls' advance. In early \992, another unusually longwhite candle, shown at2, appeared. This white candle opened on its low(since it does not have a lower shadow) and closed on its high (since itdoes not have an upper shadow). Such a candle is exceptionally strong,notably when it is so elongated as in candle 2. Candle 3 was anotherstrong white candle that propelled prices to new multi-month highs. Withthe tall white candles L and 2 both appearing near $5, we can see thesignificance of that $5 support area. Consequently, when prices correctedback to this level in fuly and August 1992, it is not surprising that theselloff stopped near $5.
Long White Candle Confirms Support
As shown in Exhibit 2.7, the tall white candle that rebounds from supportunderscores the aggressiveness of the bulls. A long white candle thatbounces off a support area such as a trendline, a moving average, or a.retracement level gives extra confirmation of that support.
22 Candles
AURORA ELECTRIC - WEEKLY
I 6 . U
15 .5t 5 . 01 4 . 5t 4 . 0t 3 . 513 .012.5L2.O1 1 . 5I 1 . 0t 0 . 51 0 . 09 . 59 . 08 . 5U . U7 q
7 . Ob . 5
b . u
5 . 04 . 5
1 5 . 0t 5 . 5t -5 .
.ilu,[,1i"-r+,0[|u*'*"**'?*'rolro*'**ru+nl-+*[[il+TtlioLl
t 4 . 51 4 . 013 .513 .012.5L2 .Ot t . 5t t . 0i - u . 5
1 0 . 09 . 5s . 08 . 58 . 07 . 57 . O5 . 55 . 05 . 56 n
4 . 5
' 9 1 ' 9?r L E IlAY JUN JUL 0cT NOU ' 93
T L H
MetaStock by EQUTS Int'l
EXHIBIT 2.6. Long white Candle at Low price, Aurora Electric-weekly
It l
Prior lowsas support
DGIIBIT 2.7. Long White Candle Confirms Support
"'IMoving average

The Basics 23
GENL RE _ DAILY
130123i - oL 1 A
127L26LZ5
L?4LZ3
122L?I120I 1 5
118LL7i - r b
LL4113LLz1 1 1LL0109108LO7
oo,[o,oo *l*,.,ofo,,
,ilr,,il[|il+'il*t,
'
130L29128L?7L?6L25L24L23122L Z L
120119118TL7l t6t t 5114l t ?
LLz1 t l110t0s108102
' 92 z3 14 ,93 t1 l8 OB
MetaStock by EQUIS Int'l
EXHIBIT 2.8. Long White Candle Confirms Support, General Re-Daily
In Exhibit 2.8, we see how drawing a support line with a candle chartis done the same way as with a bar chart. In this case, we are looking ata support line that is obtained by connecting the lows of the session (thatis, by connecting the bottom of the lower shadows). This upward slopingtrendline was tested numerous times. In late January, a bounce from thissupport via a long white real body showed the eagerness of the bulls tobuy near that support.
Long White Body Breaks Resistance
Exhibit 2.9 displays how the market can prove its mettle by piercing aresistance area with a tall white real body. As shown in Exhibit 2.10, thehighs at areas A and B disclosed a resistance area near $44 and $45. Inlate November, an extended white real body gapped higher on the oPen-

24 Candles
EXHIBIT 2.9. Long White Candle Breaks Resistance
ing and closed at the session's high. This tall white candle confirmed animportant breakout from the aforementioned resistance band. Note howin early 1993 the gap before this white candle became a support area. wewill look at the importance of gaps as support when windows are dis-cussed in the next chapter.
BANK AMERICA- DAILY
56.556.0s.5s.054.554.053.553.052.552.051 .55 t .0s).5s).049.5.19.048.5.18.047.547.946.546.O.15.545.044.511.O43.543.042.542.O41 .5. t l .0.1u.5
56.556.05 5 . 555.054 .554.053.553.052.552.O5 t . 55 1 . 0F N F
50.049.543.048 .548 .047.517.O46.546.O45.545 .014.544.843.543.042.542.O4 1 . 541 . 040 .5
'9.I t [ts
,,,il,,*o'*ot'lnf ,q'1,,*lrl-,fl,,ooh-*** l-il+_gap I
fl'1,pil"',il'
','1,0-*-,$ro-l*oLlS t. ry *t
L2 19 26 n a7 L4 ,93

The Basics
Long White Real Bodies as Support
Exhibit 2.11 brings out one of the more exciting uses of long white can-dles, specifically, that long white candles can become support areas. Ihave found this to be an excellent tool since it serves to alert traders tosupport zones that are not available with bar charts. The depth of thereaction should find support at either the middle of the long white realbody or the bottom of the entire white candle, including the lowershadow. The Japanese literature says that a long white real body shouldbe support in a rising market. However, based on my experience, it canalso be used as support in a falling market. The reason the market mayfall back after an exceptionally tall white real body is that prices may
become short-term overbought (that is, they rallied too far too fast). In
this scenario, the market may have to retrace some of the prior rally torelieve this overbought condition.
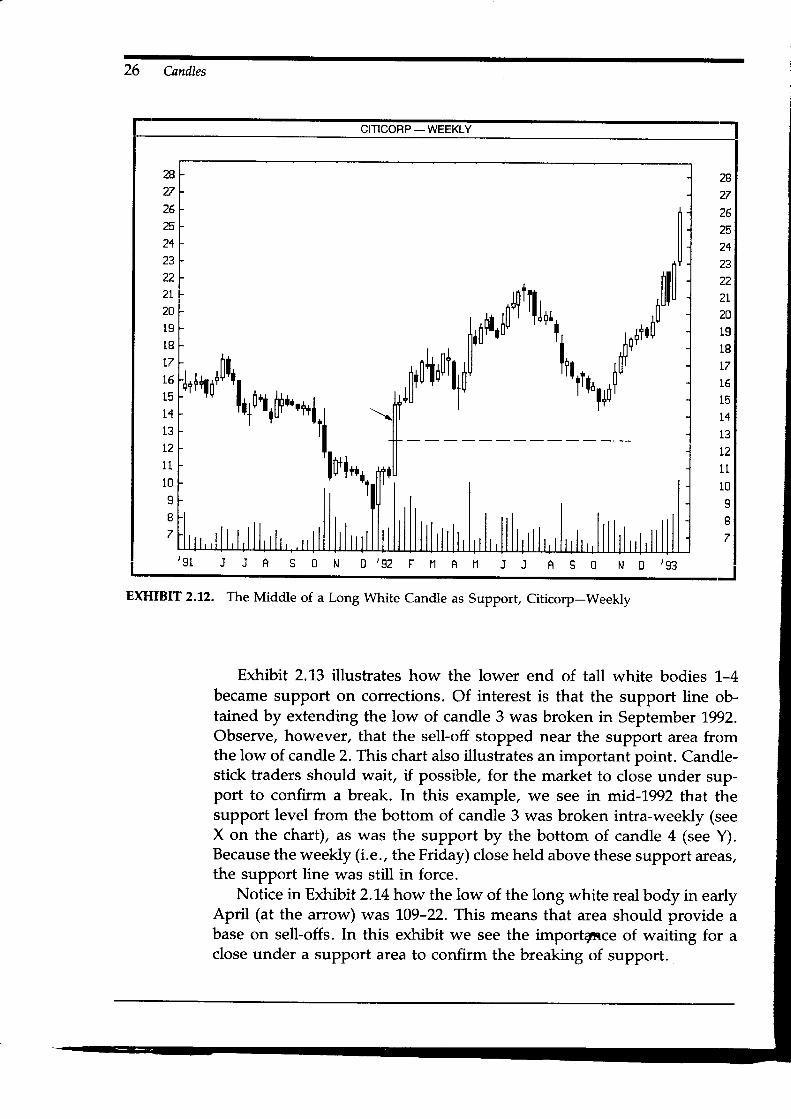
In Exhibit 2.12, the huge white candle in early 1992 propelled pricesfrom $1012 to about $15. Almost a 50o/o rise in one week! After such amove, it was not surprising that the market had to consolidate its gains.Based on the precept that a long white candle is support, the middle ofthe white real body (at the arrow), near $121/2, should then be monitoredas support. The power of the market is well reflected by the fact that forthe rest of 1992, the market held above this support area.
25
r l ' l r
1,1(1) 50o/" withinlong whitereal body Support
l 1 l
(2) Bottom of longwhite candle'slower shadow
EXHIBIT 2.11. Long White Real Bodies as
Support
Support
26 Candles
CITICORP - WEEKLY
n2726z3
24z3
222L20l9tsL7l b
l514t3L21 l
10
B7
*ilf*l**or*il+**,r*l-l
ll**--
il,1+,,lillttlft*,, ,,,*,,nililfil*pnfrntryil
f'o''f,,,,,-,+n{il{o+t'o'
2g2725252423222L20l918L7161514l3LZ.il.
10J
I7
' g l J R S O N t] ,92 F t1 A II J J A S B N D ,93
EXHIBIT 2.12. The Middle of a Long l4lhite Candle as support, Citicorp-weekly
Exhibit 2.13 illustrates how the lower end of tall white bodies L-4became support on corrections. Of interest is that the support line ob-tained by extending the low of candle 3 was broken in September 1992.Observe, however, that the sell-off stopped near the support area fromthe low of candle 2. This chart also illustrates an important point. Candle-stick traders should wait, if possible, for the market to close under sup-port to confirm a break. In this example, we see in mid-1992 that thesupport level from the bottom of candle 3 was broken intra-weekly (seeX on the chart), as was the support by the bottom of candle 4 (see Y).Because the weekll (i.e., the Friday) close held above these support areas,the support line was still in force.
Notice in Exhibit 2.14 how the low of the long white real body in earlyApril (at the arrow) was 109-22. This means that area should provide abase on sell-offs. In this exhibit we see the importilrce of waiting for aclose under a support area to confirm the breaking of support.

The Basics
EXHIBIT 2.L3. Bottom of Tall White as Support, Dow fones-Weekly
EXHIBIT 2.14. Bottom of Tall White Candle as Support with Bond Futures-D6ily

28 Candles
A method you could use with this concept of tall white candles assupport is to buy on a correction near the midpoint of the white candle.From that level down to the bottom of the long white candle (this includesthe bottom of the lower shadow) should be support. If the bottom endof the support zone (that is, the lows of the tallwhite candle) is pene-trated on a close, then you should reconsider your long position. ettimes, these support areas are broken on an intra-session basis, but aslong as the support holds on the close, I still view it as valid support.
one of our institutional clients told me he found that, at times, aftera tall white candle, the market corrects. I advised him that such action isnot surprising since after such a candle, the market may be overboughtand hence vulnerable to a setback. I then suggested the use of a longwhile candle as a support area in which he courd buy on a correction.Coincidentally, on November 23, at the time the trader and I were talkingabout this, the bond's first hour of trading had just ended. This firsthour, as shown in area 2 in Exhibit 2.1s, completed a tall white candle.since he traded bonds, I informed the client that support should be fromthe halfway point of this white candle down to the bottom of the candle,including the lower shadow. I then pointed out that there was anotherlong while candle from the preceding day's first hour of trading (see
using the support Zone in a Tall white Candle December 1993 Bond
The Basics 29
candle 1). The bottom of that tall white candle (including the shadow)was successfully defended as suPport with candle 2. Thus, there weretwo white candles (at L and 2) that reinforced the support near \14-16.Note how, after white real body 2, the market retraced about halfwayinto it before rallying.
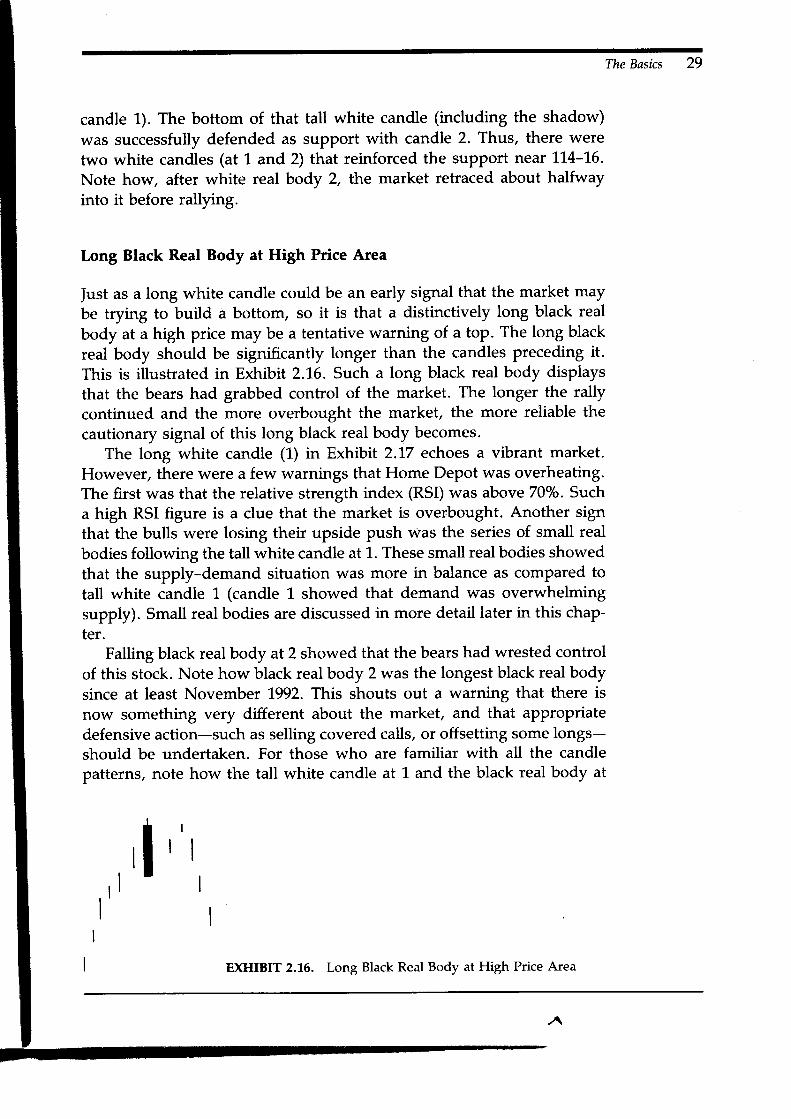
Long Black Real Body at High Price Area
just as a long white candle could be an early signal that the market maybe trying to build a bottom, so it is that a distinctively long black real
body at a high price may be a tentative warning of a top. The long blackreal body should be significantly longer than the candles preceding it.This is illustrated in Exhibit 2.16. Such a long black real body displaysthat the bears had grabbed control of the market. The longer the rallycontinued and the more overbought the market, the more reliable thecautionary signal of this long black real body becomes.
The long white candle (1) in Exhibit 2.17 echoes a vibrant market.However, there were a few warnings that Home Depot was overheating.The first was that the relative strength index (RSI) was above 70o/o. Sucha high RSI figure is a clue that the market is overbought. Another signthat the bulls were losing their upside push was the series of small realbodies following the tall white candle at 1. These small real bodies showedthat the supply-demand situation was more in balance as comPared totall white candle 1 (candle L showed that demand was overwhelmingsupply). Small real bodies are discussed in more detail later in this chap-ter.
Falling black real body at 2 showed that the bears had wrested controlof this stock. Note how black real body 2 was the longest black real bodysince at least November 1992. This shouts out a warning that there isnow something very different about the market, and that appropriatedefensive action-such as selling covered calls, or offsetting some longs-should be undertaken. For those who are familiar with all the candlepatterns, note how the tall white candle at 1 and the black real body at
r l ' ' , ,r ' l
EXHIBIT 2.16. Long Black Real Body at High Price Area
./\

30 Candles
HOME DEPOT & 14 PERIOD RSI
75
IU
5t5019181716{51113124L4nt u
515019181716151113121t{0
'32 23 0 07 r1 21 28,$ ir l8 t5
EXHIBIT 2.17. Large Black Candle at High Price and the Relative Strength Index,Home Depot-Daily
EXHIBIT 2.18. LongBlack Candle ConfirmsResistance
2 formed a bearish tower top, so named because the two long candles at1 and 2look like towers.
Long Black Confirms Resistance
If, as shown in Exhibit 2. j.8, the market backs off sharply from resistancethrough a long black candle, it is extra confirmation of the resistancearea. This is because such a candle means that either the bulls have
Prior highs asresistance
The Basics 31
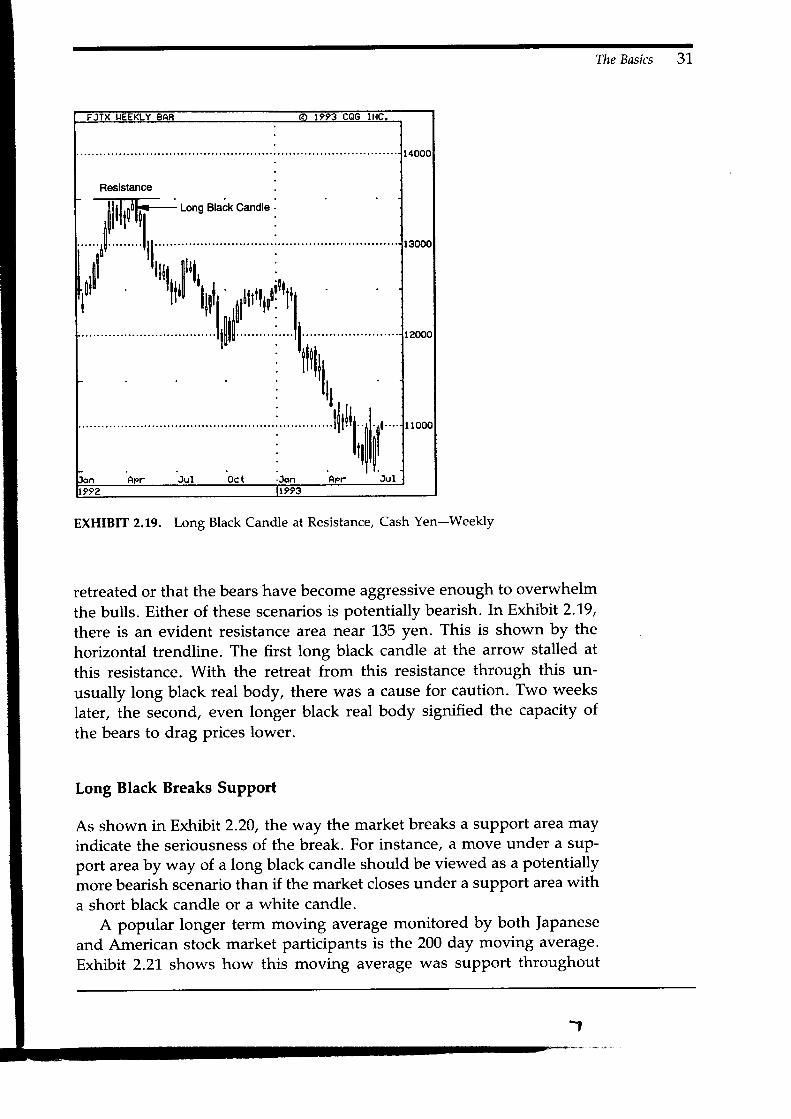
EXHIBIT 2.L9. Long Black Candle at Resistance, Cash Yen-Weekly
retreated or that the bears have become aggressive enough to overwhelm
the bulls. Either of these scenarios is potentially bearish. In Exhibit 2.19,
there is an evident resistance area near 135 yen. This is shown by the
horizontal trendline. The first long black candle at the arrow stalled at
this resistance. With the retreat from this resistance through this un-
usually long black real body, there was a cause for caution. Two weeks
later, the second, even longer black real body signified the capacity of
the bears to drag prices lower.
Long Black Breaks Support
As shown in Exhibit 2.20, the way the market breaks a support area mayindicate the seriousness of the break. For instance, a move under a suP-port area by way of a long black candle should be viewed as a potentiallymore bearish scenario than if the market closes under a support area with
a short black candle or a white candle.A popular longer term moving average monitored by both Japanese
and American stock market participants is the 200 day moving average.Exhibit 2.21- shows how this moving average was support throughout

32 Candles
l l rl , ' , t l ' ,
EXHIBIT 2.20. Long Black Candle Breaks Support
late 1992 into January 1993. However, the first sign of a break of thissupport came by way of long black real body 1. Although this only brokethe 200 day moving average line by a few cents, it was an early, butprovisional, sign of trouble. Final proof of a decisive break of the supportarea came with long black candlestick 2.
AMGEN - DAILY
75
,,**uiln'n'rPt'Tto*'nrf
*l'n*\c\n-
200 Day (2)MovingAverage
nln'r*or,l+
75
70
55
50
55
50
45
40
35
7E
55
60
55
50
15
40
35
'gz NOU 0Ec '93 FEB IlAR
EXHIBIT 2.21. Long Black Real Body Breaks Moving Average support, Amgen-Daily
The Basics 33
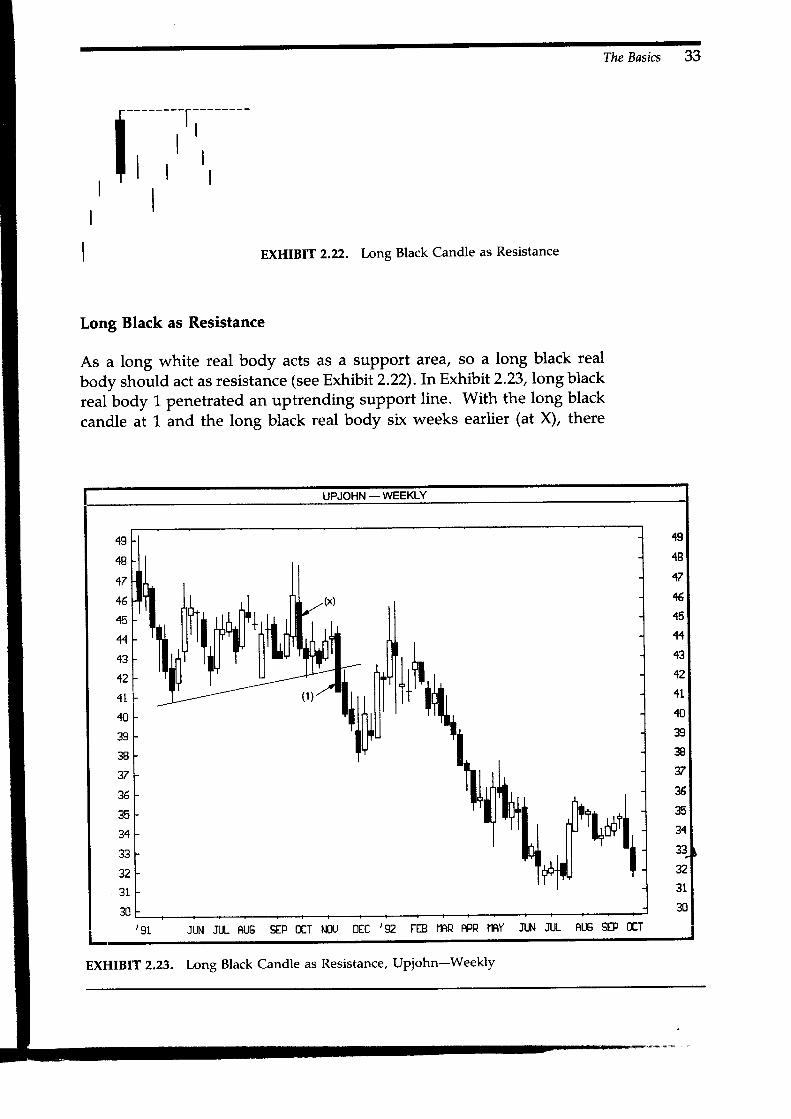
f ;";EXHIBIT 2.22. Long Black Candle as Resistance
Long Black as Resistance
As a long white real body acts as a support area, so a long black real
body should act as resistance (see Exhiblt2.22).In Exhibit 2.23,longblack
real body L penetrated an uptrending support line. With the long black
candle at 1 and the long black real body six weeks earlier (at X), there
UPJOHN -WEEKLY
49
48
17
16
45
44
43
12
1L
40
5E'
37
36
35
34
3Z
5 t
19
4B
17
1645
11.13
42
41
40
393S
v%
35
34
33
{ t l
n31
30,91 JUN JUL AUG SEP OCT NOU OEC ,92 FEB IIAR APR NAY JIJN JI.[. AIJ6 SEP OET
fiuNl(x)
(1 )
fiilr+ll 1
,-d'*'fEXHIBIT 2.23. Long Black Candle as Resistance, Upjohn-Weekly

34 Candles
was now a resistance zone that could be used to exit longs or to go short,on a bounce to that resistance.
Exhibit 2.24 displays a price explosion via a long white candle in late1991'. Using the theory of long candles, let us see how one could havetraded this market. A long white candle gives us a support area at 50o/owithin its real body. Consequently, a pullback to near the 50o/o retrace-ment of the long white could be used as an early buying zone. This couldhave been at areas 1 through 4. Now, we turn our attention to a pricetarget. Notice the exceptionally bearish long black real body from
-sup-
tember 1991, (at the arrow). As discussed above, we would expect a raliyto stall as it approaches the top of this black candle. Although the bullswere finally able to gather enough force to breach this resistance of thelong black candle, it took them over a year to accomplish this. Thus,buying on a pullback into the long white with a minimum target toseptember's long black real body could have been an effective tradingstrategy.
AMEX _ WEEKLY
30.029.529.o28.528.027.527.O26.526.025.525.024.524.0?3.523.O2?.522.O21. 521.0z u . a
rl^ | l?
tfl+t1tfl-
30.0? A F
29.028.528.027.8z t - u
26.3
?6.025.5% . 024.524.O23.523.CI22.522 .O21.52L.O
20.0t 5 . 5
l s .018 .518 .0
z u , 5
20.o19 .5t s . 0rB.5LB.0
' 9 1 ,gz
EXHIBIT 2.24. Long Black Candle as Resistance, Amex-Weekly J

BRISTOL MYERS - DAILY
72a l. L
7059bu
67
bb
65
61
63
62
6L
50
5S
5U
57
56
55
54
53
72
7L
7E
53
68
67
66
65
61
63
62
bt-
60
53
58
57
56
55
54
53
,92 NOU OEE ,93 FEB IlAR APR
The Basics
Size, Frequency, and Color of Real Bodies
The tone of the market can be gauged by comparing the relative height,frequency, and color of a group of candle lines. The first sign of trouble
in Exhibit 2.25 came with the long black candle at L. Note how this is the
longest black candle in some time. Then, an aPPearance of an elongated
black candle at 2 was an evident warning sign of trouble. The price de-
scent continued until February's tall white candle at 3 arose. This wasthe loftiest white real body in many months, and relayed that the bullshad entered the market in force. Observe how the midpoint of February's
white real body became a base for a minor rally.In the boxed section in Exhibit 2.26, we see a period in which the
market was trading laterally. With a bar chart, it would be difficult to
glean information about the relative strength of the bulls or the bears in
such an environment. With the candles, however, we can do this. In this
trading range environment, we can see that there were eight black real
MetaStock bY EQUIS Int'l
EXHIBIT 2.25. Slze and Color of Real Bodies, Bristol Myers-Daily
35
)
36 Candles
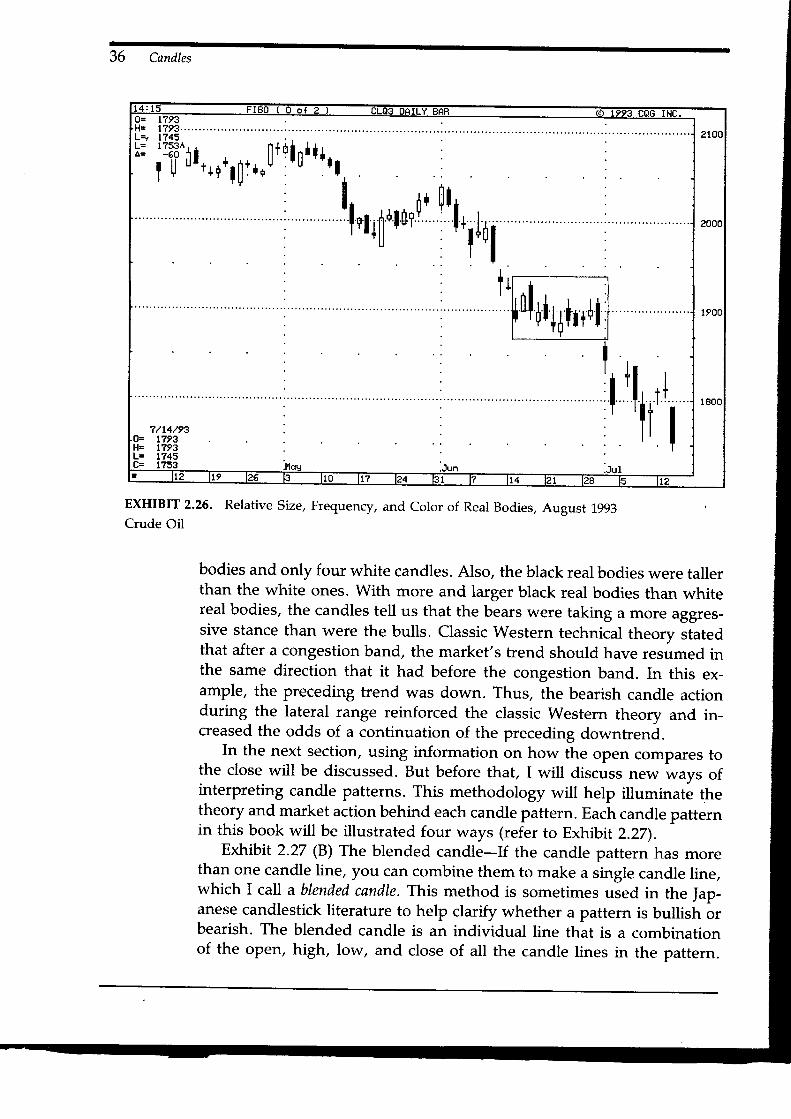
EXHIBIT 2.26. Relative size, Frequency, and Color of Real Bodies, August 1993Crude Oil
bodies and only four white candles. Also, the black real bodies were tallerthan the white ones. With more and larger black real bodies than whitereal bodies, the candles tell us that the bears were taking a more aggres-sive stance than were the bulls. Classic Western technical theory statedthat after a congestion band, the market's trend should have resumed inthe same direction that it had before the congestion band. In this ex-ample, the preceding trend was down. Thus, the bearish candle actionduring the lateral range reinforced the classic western theory and in-creased the odds of a continuation of the preceding downtrend.
In the next section, using information on how the open compares tothe close will be discussed. But before that, I will discuss new ways ofinterpreting candle patterns. This methodology will help illuminate thetheory and market action behind each candle pattern. Each candle patternin this book will be illustrated four ways (refer to Exhibit 2.22).
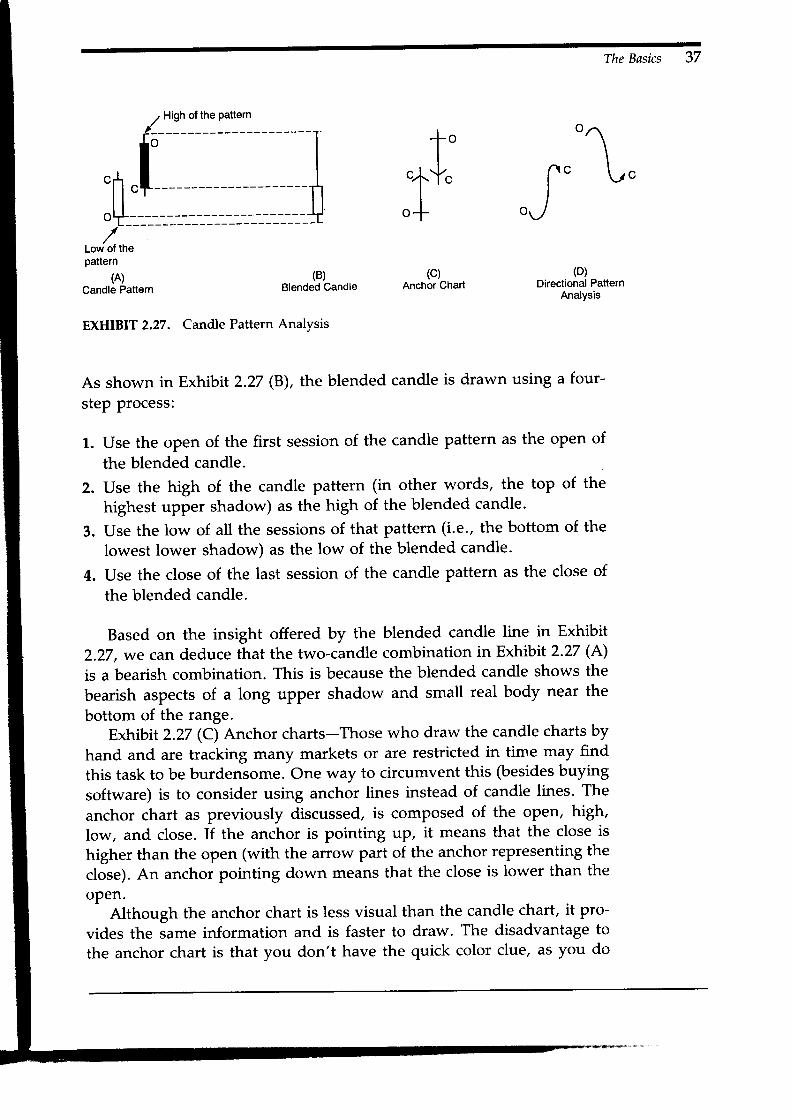
Exhibit 2.27 (B) The blended candle-If the candle pattern has morethan one candle line, you can combine them to make a single candle line,which I call ablended candle. This method is sometimes used in the ]ap-anese candlestick literature to help clarify whether a pattern is bullish orbearish. The blended candle is an individual line that is a combinationof the open, high, low, and close of all the candle lines in the pattern.
The Basics 37
Ico7 High of the Pattern
F---------
"1.Low of thepattern
(A)Candle Pattern
TI" "_f""\"(c)
Anchor Chart(B)
Blended Candle
EXHIBIT 2.27. Candle Pattern Analysis
As shown in Exhibit 2.27 (B), the blended candle is drawn using a four-
step process:
1. Use the open of the first session of the candle pattern as the open of
the blended candle.
2. Use the high of the candle pattern (in other words, the top of the
highest upper shadow) as the high of the blended candle.
3. Use the low of all the sessions of that pattern (i.e., the bottom of the
lowest lower shadow) as the low of the blended candle.
4. Use the close of the last session of the candle pattern as the close of
the blended candle.
Based on the insight offered by the blended candle line in Exhibit
2.27, we can deduce that the two-candle combination in Exhibit 2.27 (A)
is a bearish combination. This is because the blended candle shows the
bearish aspects of a long uPPer shadow and small real body near the
bottom of the range.Exhibit 2.27 (C) Anchor charts-Those who draw the candle charts by
hand and are tracking many markets or are restricted in time may find
this task to be burdensome. One way to circumvent this (besides buying
software) is to consider using anchor lines instead of candle lines. The
anchor chart as previously discussed, is composed of the open, high,
low, and close. If the anchor is pointing uP, it means that the close is
higher than the oPen (with the arrow part of the anchor rePresenting the
close). An anchor pointing down means that the close is lower than the
oPen.Although the anchor chart is less visual than the candle chart, it pro-
vides the same information and is faster to draw. The disadvantage to
the anchor chart is that you don't have the quick color clue, as you do
(D)Directional Pattern
Analysis

38 Candles
with the candle's white and black real bodies. But you can draw upsessions in red and down sessions in black (remember, however, thatunless you have a color printer, all the anchor lines will be black whena hard copy is printed).
Exhibit 2.27 (D) Directional pattern Analysis-To clarify the market,spath that unfolds during the candle pattern, I will draw arrows reflectingthe market's basic intra-session action. I call this directional pattern analysii.The path shown by the market's action in the directional pattern anaiysis'can be used as a rough method to gauge the overall price action duringthe session. Although the arrow in the directional pattern analysis willshow the path taken by the market during the sessfon, it will not showthe order of when these prices where touched.
For example, based on the relationship of the real body and shadowsof the first white candle in Exhibit 2.27 (A), we know that, at some timeduring the session, prices moved under the opening price. However, wedo not know when the price moved under the open. \Atrhile the arrow inExhibit 2.27 (D) may make it appear that the market immediatelv movedlower after the opening, it may not have unfolded that way. The marketinstead may have rallied after the open and later in the session fell underthe opening price. Thus, it is important to keep in mind that the direc-tional pattern analysis should be thought of as a visual clue about therelative price action of the open, high, low, and close compared to oneanother. However, it does not tell us the sequence of that price action.
Opening Compared to Prior Real Body
A disadvantage of candle charts is that they require the close to completethe candle line. There are some ways around this limitation. One t,.thodis to go to a shorter time. In other words, if you are looking at a dailychart, you can sometimes get a signal on the hourly chart before the closeof the daily session. Another mechanism to bypasi waiting for the close,and the one I will focus on here, is comparing the opening to the priorreal body.
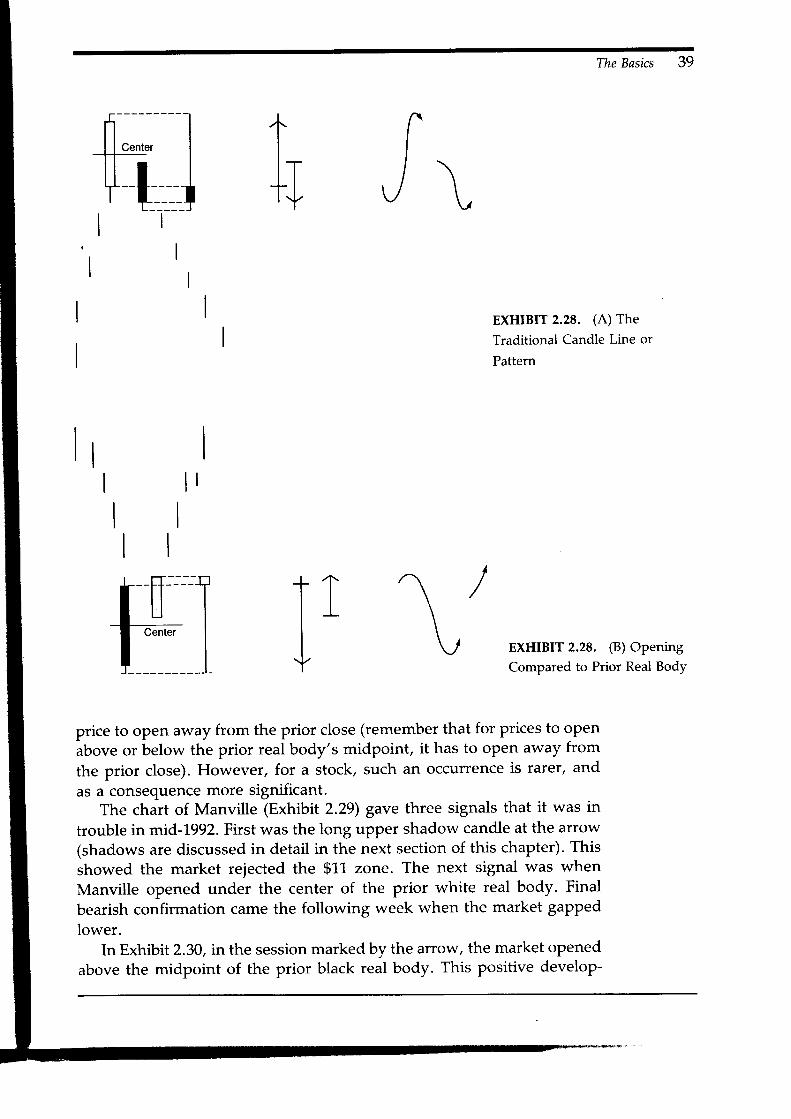
Exhibit 2.28 (A) illustrates that if the opening is under the midpointof the previous white real body, it could be a bearish scenario.
^Con-
versely, if the next day's opening is above the black body's midpoint, asshown in Exhibit 2.28 (B), it courd be viewed ur u poiitive sign. Thisconcept might be useful for those who are more aggressive "r,d ,irk-oriented and would want to buy or sell on an opening rather than waitingfor a close.
This technique is more important for stocks than for futures. This isbecause the futures market's higher volatility makes it more likely for the
h
The Basics 39
EXHIBIT 2.28. (A) The
Traditional Candle Line or
Pattern
EXHIBIT 2.28. (B) Opening
Compared to Prior Real Body
l l
I11 /
\"
price to open away from the prior close (remember that for prices to open
above or below the prior real body's midpoint, it has to open away from
the prior close). However, for a stock, such an occurrence is rarer, and
as a consequence more significant.The chart of Manville (Exhibit 2.29) gave three signals that it was in
ffouble in mid-1992. First was the long upper shadow candle at the arrow(shadows are discussed in detail in the next section of this chapter). This
showed the market rejected the $11 zone. The next signal was when
Manville opened under the center of the prior white real body. Final
bearish confirmation came the following week when the market gapped
lower.In Exhibit 2.30, inthe session marked by the arrow, the market opened
above the midpoint of the prior black real body. This positive develop-

40 C-andles
+rI|,iliil+'il1'1,'*lilh,ill
l'- .o- UPPer shadow
,ttl',i*f,[t*'
MANVILLE - WEEKLY
t n F
10 .0
s . 5
s .0
9 . 5
8 . 0
7 . 5
10.5
10.0
9 . 5
9 . 0
s . 5
7 n
5 . 5
8.0
7 .5
7 . 0
6 . 5' g l N 0 '92 F 11 A f1 J J A s o N o ,93 F tl A fl J
EXHIBIT 2.29. Open Under the Center of Prior White Real Body, Manville-Weeklv
ment was reinforced by the white candle's high volume activity. Thisvolume showed the pressure of the buying force.
Spinning Tops
we have seen the power inherent in tall white or black real bodies. Atall white body reflects a strong session in which the bulls are in control,whereas a long black real body means that the bears are in charge. Now,what would it mean if, instead of tall real bodies, there were small realbodies? This would tell us that the bulls and bears are in a tug of warand that there is more of a balance between supply and demand. Suchsmall real bodies, called spinning tops, tell us that the power to moveup or down is lacking, or as the ]apanese phrase it, the "market is losingits breath."
As shown in Exhibit 2.3L, these are spinning tops even if the lowerand/or uPPer shadows are large. It is the diminutive size of the real bo$r

The Basics 41,
RUBBERMAID - DAILY
35.0
34.5
34.0
? 2 F
33.0
32.5
5 t - u
3r .5
3 t .0
30.5
30.0
2S.5
23.0
28.5
35.0
34.5
34.0
32.5
5 Z . U
3 t . 5
? 1 n
30.5
30.0
29.5
? q n
28.5
,E3 F t o t5 L2
EXHIBIT 2.30. Open Above the Center of a Black Real Body, Rubbermaid-Daily
that defines a spinning top. A spinning toP is a warning sign that the
market is losing its momentum. For instance, if the market is at or near
a new high-especially after a steep advance-the emergence of a spin-
ning top could be a signal that the bulls are having trouble in continuing
their ascent. This could be a cautionary signal that the prior move is
stalling.In Exhibit 2.32, the strong, long white real bodies at the end of July
left no doubt about who had control of this market-the bulls. But the
two spinning tops after these long white real bodies sent out a warning
Real body can beblack or white
il
EXHIBIT 2.31. Spinning ToPs

42 Candles
EXHIBIT 2.32. Spinning Tops, Dow |ones-Daily
that the bulls were unable to maintain the momentum of their advance.The arrival of the spinning tops showed that the market was losing itsvitality. The black candles after the spinning top added more reason tosuspect a turn.
Accumulation and Distribution
One of the most powerful and important aspects of candle charts is theirability to meld themselves with any other form of technical analysis. Letus, for example, uncover how one candle (the spinning top), combinedwith volume, can provide critical information about the inner workingsof the market.
Two key concepts relating volume to price action are those of accu-mulation and distribution. Accumulation occurs when, at a low pricelevel, there is a high volume session with stagnant prices. The high vol-ume relays that the bears are attacking full force, throwing all their re-
sources and ammunition into the fray. But the stagnant prices during the
session show that the bears are unable to drag down prices. All that the
bears have tried to sell has been accumulated by the bulls. After such a
scenario, the bears may either run out of ammunition of just give up.
The consequence of either of these is a rally.Distribution is the opposite of accumulation. Distribution occurs when,
at a high price level, there is heavy volume but virtually frozen prices.
What is happening in such an environment is that the "smart" money
is thought to be distributing their supply to meet all the buying that is
entering the market. With distribution, the sellers are offering enough
supply to meet all the buyer's demand, thus keeping prices in check.
Distribution should therefore be viewed as a topping scenario.
Note that as part of the definition for either accumulation or distri-
bution, there must be little price movement. A spinning top reflects a
session in which there is little price action (as defined by the difference
between the open and the close). So, by combining volume with spinning
tops, we can determine when there is accumulation or distribution.
The Basics 43
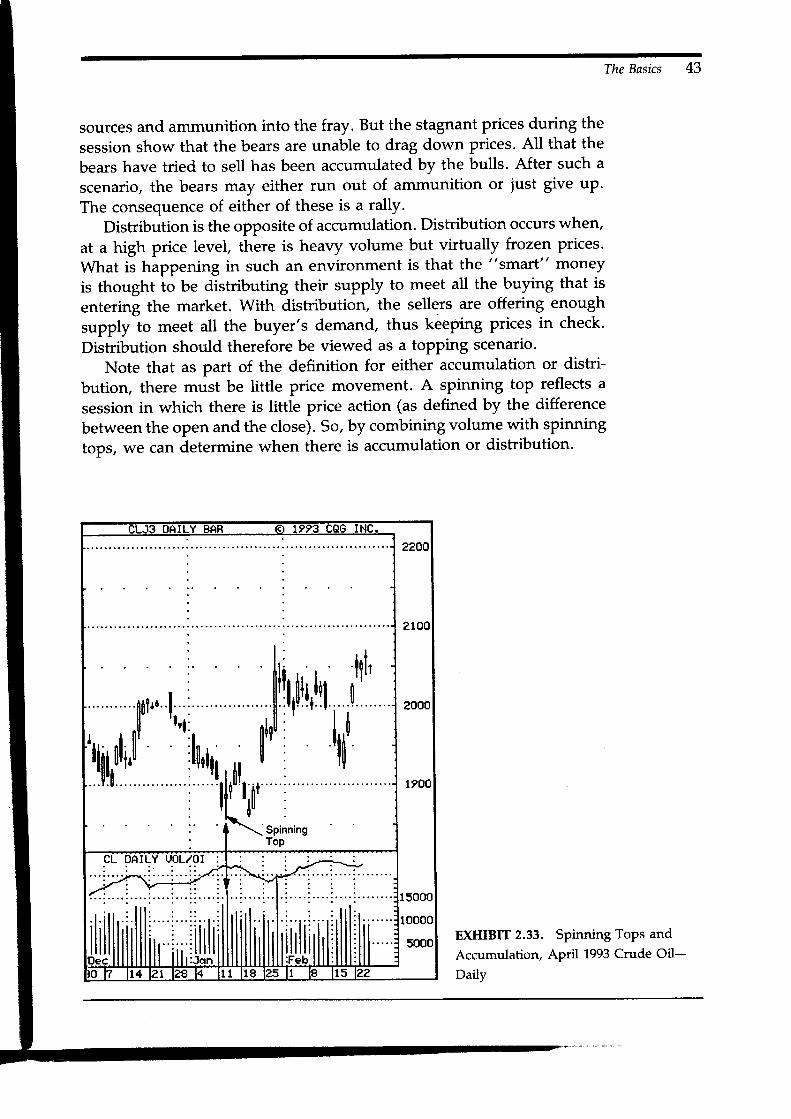
EXHIBIT 2.33. Spinning ToPs and
Accumulation, April 1993 Crude Oil-
Daily
44
Exhibit 2.33 shows that a spinning top candlestick emerged on January12. Note also the heavy volume of that session. As describe above, stag-nant prices and high volume at a low price level are classic signs ofaccumulation. The high-volume spinning top in this example shows thatthe selling Pressure was easily absorbed. This positive sign was furtherreinforced by the fact that this spinning top session made a new low forthe move, yet the bears were unable to maintain these new lows.
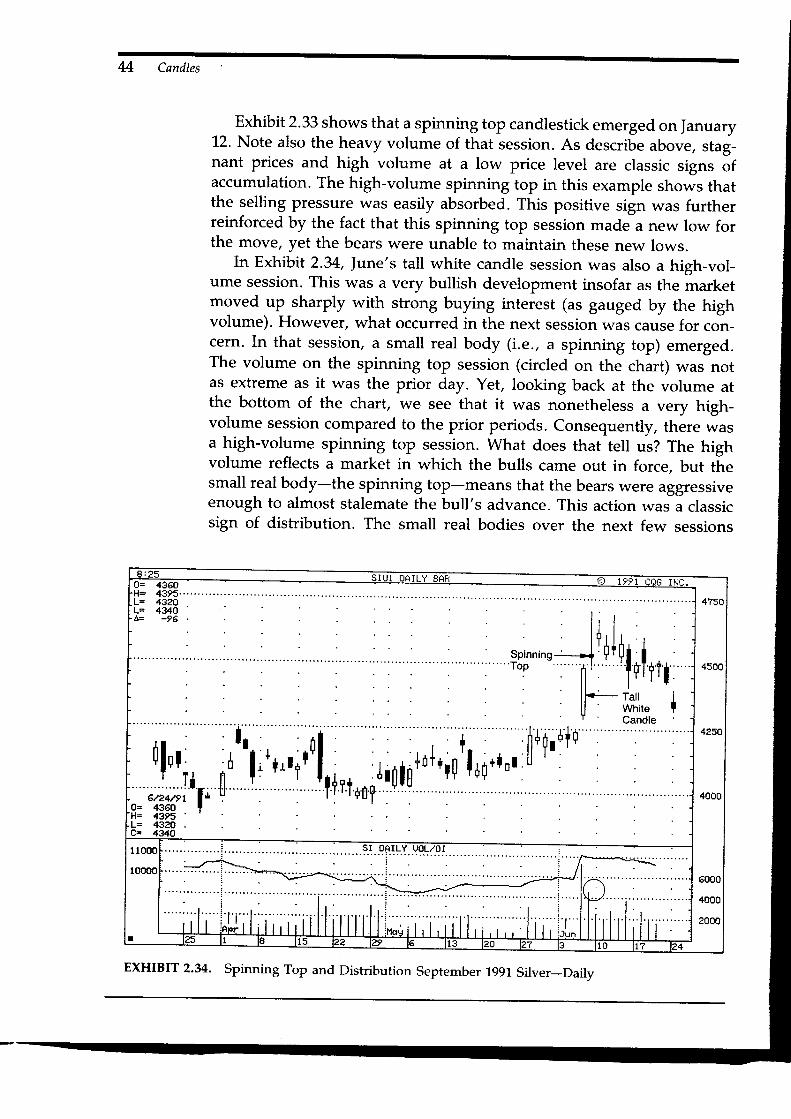
In Exhibit 2.34, June's tall white candle session was also a high-vol-ume session. This was a very bullish development insofar as the marketmoved up sharply with strong buying interest (as gauged by the highvolume). However, what occurred in the next session was cause for con-cern. In that session, a small real body (i.e., a spinning top) emerged.The volume on the spinning top session (circled on the chart) was notas extreme as it was the prior day. Yet, looking back at the volume atthe bottom of the chart, we see that it was nonetheless a very high-volume session compared to the prior periods. Consequently, there wasa high-volume spinning top session. \rvhat does that tell us? The highvolume reflects a market in which the bulls came out in force, but thesmall real body-the spinning top-means that the bears were aggressiveenough to almost stalemate the bull's advance. This action was a classicsign of distribution. The small real bodies over the next few sessions
EXHIBIT 2.34. spinning Top and Distribution september 1991 silver-Daily

The Basics 45
continued to echo the inability of the bulls to propel this market. Notehow the longest real bodies following the spinning top were black. Thisshowed that the bears had gained a foothold on the market.
Doii
One of the more important individual candlestick lines is the doji. Asshown in Exhibit 2.35, a doji session has a horizontal line instead of areal body. This is because a doji is formed when the session's open andclose are the same (or almost the same). If the market is trading laterallv,a doji is neutral. In essence the doji is echoing, on a micro scale, the
indecision reflected on a more macro scale by the market's sidewaysaction. However, a doji that emerges after the mature part of an uptrendor sell-off has a gteater chance of a market turn. At such a time, the
Japanese say that a doji provides "a hint of tops and bottoms."One should be especially cautious about a doji that arises after a tall
white candle which in turn aPPears after a significant uptrend. This is
true whether the doji is within the prior long white real body or aboveit. Such action represents a disparity about the state of the market. Spe-cifical$, the rally and tall white candles during such a rally tell us thatthe bulls are still in charge. But a doji means that the bulls are failing to
sustain the upside drive. This is shown in Exhibit 2.36.How do you decide whether a near doji day (i.e., where the open
and close are very close, but not exact) should be considered a doji? Onemethod is to look at a near doji day and compare it to recent action. Ifthere is a series of very small real bodies, I would not view the near dOjiday as significant since so many other recent periods had small real bod-ies or doji. (Other methods are covered in my first book).
As mentioned before, a doji is meaningful when it arises after a tallwhite candle during an uptrend. In this scenario, the market is consid-
II'{l+ I l,uu,n r'il* "r,il.
Examples of Doii
EXHIBIT 2.3s. Doii
t lEXHIBIT 2.35. Doji After a Tall White Real Body

46
f ; t rI ' l
IEXHIBIT 2.37. Doii as Resistance I
ered by the Japanese to be "tired." Also, as shown in Exhibit 2.37, thetop of a doji session (that is, the top of the upper shadow) often repre-sents resistance. However, if the highs of the doji session are exceeded,then the market's uptrend should continue. This is discussed in moredetail below.
A common mistake among those who use canctes is to use a doji asan outright buy or sell signal. This is not correct. The doji indicates, asthe japanese say, "a crossroads between the bulls and the bears." Whilethe doji can mean the market may reverse its prior trend, traders shouldview the doji as echoing a market in transition rather than being anoutright reversal pattern. Based on this, traders should wait until thenext session or two after the doji to show them which way the marketwill move.
If there is a doji during a rally, and if the market continues strongafter this doji, it is a bullish indication since the market has resolved itselffrom the state of transition (as shown by the doji) to its new trend-up.Thus, while a doji that appears after a rally could be an indication of areversal (since the market is at a crossroads), it is best to wait for bearishconfirmation over the next day or two to get a top reversal confirmation.For those who sell on a doji, the doji should act as resistance (see Exhibit2.37). If the market closes above the high of the doji, the japanese saythe market has become "refreshed." Based on this, a buy stop shouldbe placed above the high of the doji. The opposite would be true with adoji in a downtrend. To wit, a doji in a downtrend shows that the marketis at a point of indecision, and a white candle after such a doji showsthat the market has resolved itself to the bull side. A buy based on thedoji after a downtrend should have a sell stop under the doji's low (in-cluding the lower shadow). This is because such a scenario is viewed asa bearish continuation signal.
one of the most fascinating aspects about candle charts is that, inspite of their underlying simplicity, they provide so much valuable in-formation about the state of the market. For example, what is more il-
il
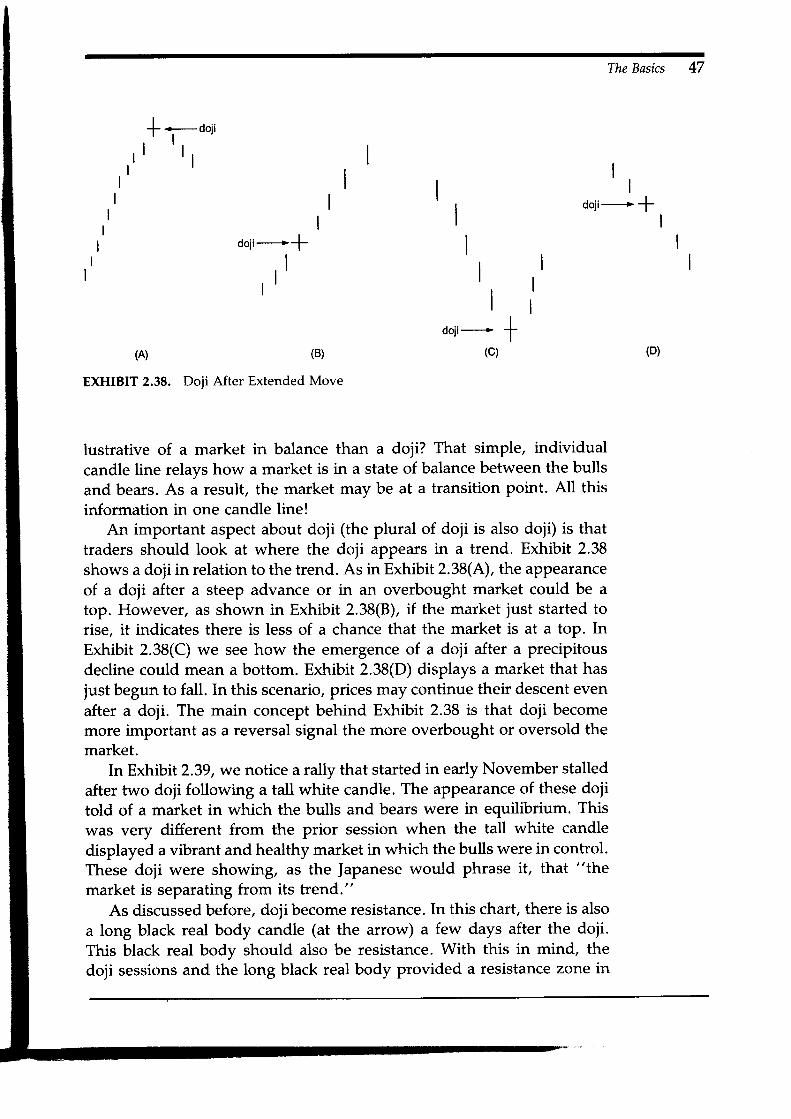
The Basics 47
, ,+Tr 0""
II
doji'---> f
doli--'-----+f
, lt l l , '
(A) (B)
EXHIBIT 2.38. Doji After Extended Move
ooii----- -l-(c)
lustrative of a market in balance than a doji? That simple, individualcandle line relays how a market is in a state of balance between the bullsand bears. As a result, the market may be at a transition point. All thisinformation in one candle line!
An important aspect about doji (the plural of doji is also doji) is thattraders should look at where the doji appears in a trend. Exhibit 2.38shows a doji in relation to the trend. As in Exhibit 2.38(A), the appearanceof a doji after a steep advance or in an overbought market could be atop. However, as shown in Exhibit 2.38(8), if the market just started torise, it indicates there is less of a chance that the market is at a top. InExhibit 2.38(C) we see how the emergence of a doji after a precipitousdecline could mean a bottom. Exhibit 2.38(D) displays a market that hasjust begun to fall. In this scenario, prices may continue their descent evenafter a doji. The main concept behind Exhibit 2.38 is that doji becomemore important as a reversal signal the more overbought or oversold themarket.
In Exhibit 2.39, we notice a rally that started in early November stalledafter two doji following a tall white candle. The appearance of these dojitold of a market in which the bulls and bears were in equilibrium. Thiswas very different from the prior session when the tall white candledisplayed a vibrant and healthy market in which the bulls were in control.These doji were showing, as the fapanese would phrase it, that "the
market is separating from its trend."As discussed before, doji become resistance. In this chart, there is also
a long black real body candle (at the arrow) a few days after the doji.This black real body should also be resistance. With this in mind, thedoji sessions and the long black real body provided a resistance zone in
(D)

48 &ndIes
oo,iloil
GAP _ DAILY
'92 09 15 23 D 0Z 11 2t 28 '93 tl t8 25 t 08 16 22 08
7 7 F .
32.07( tr,
? 6 6
? 4 q
? 4 n
9 r n
? t 6
J T . U
? N F
30.0) q 6
38.077 tr,
2 7 n
? ( 6
JD, U
? q 6
? E N
? 4 6
? ? 6
< < t l
?1 trJ L r J
a f | |
n i nJ I . U
? n 6
30.0
EXHIBIT 2.39. Doji After a Tall White Candle, Gap-Daily
the $37 to $38 area. It was within here that the market failed during theearly 1993 rally.
The arrow in Exhibit 2.40 points to a doji session in which the open,low, and close are at the bottom end of the session's range. This doji isknown as a gravestone doji. A gravestone doji looks like a wooden me-morial used in Buddhist funerals that is placed at a gravestone. It is saidthat those who buy at a high price level after this doji will die and becomeghosts. (Those familiar with candle patterns will note how this doji waspart of a classic evening doji star pattern [this pattern is discussed inChapter 3l).
Exhibit 2.41 shows how the small real bodies at 1 and the doji at 2warned that the market was losing its upside drive. After trading in alateral range for a few weeks, prices ascended to new highs in late ]an-uary. However, there were two clues that the rally might not be sustain-able. The first was the doji at 3. This showed that, although the markethad reached new highs, the upside drive had stalled. Another clue was

The Basics 49
EXHIBIT 2.40. Gravestone Doji August 1993 Natural Gas-Intra-Day
provided by the rate of change (ROC) oscillator. This oscillator comparestoday's closing price to that of ten sessions ago.
For this example, I show the ten day ROC. This compares today'sclose to that of ten days ago. With a healthy market, traders would liketo see an increasing ROC oscillator. This reflects that the market's upsidemomentum is growing as prices are ascending. However, note how atdoji 2, Dell touched a new high, yet the ROC oscillator was at a lower
reading than it was at the prior highs in December. This underscores aslackening of the upside drive.
Thus, the ROC oscillator helped reinforce the bearish implication ofdoji 2. As further confirmation of a top, there was the long black candleon the day after doji 3. A few days after this black candle, the ROCoscillator fell under 0 (some technicians view that as a time to sell). Thischart is an example of how easy it is to combine the candles with Westerntechnical tools.
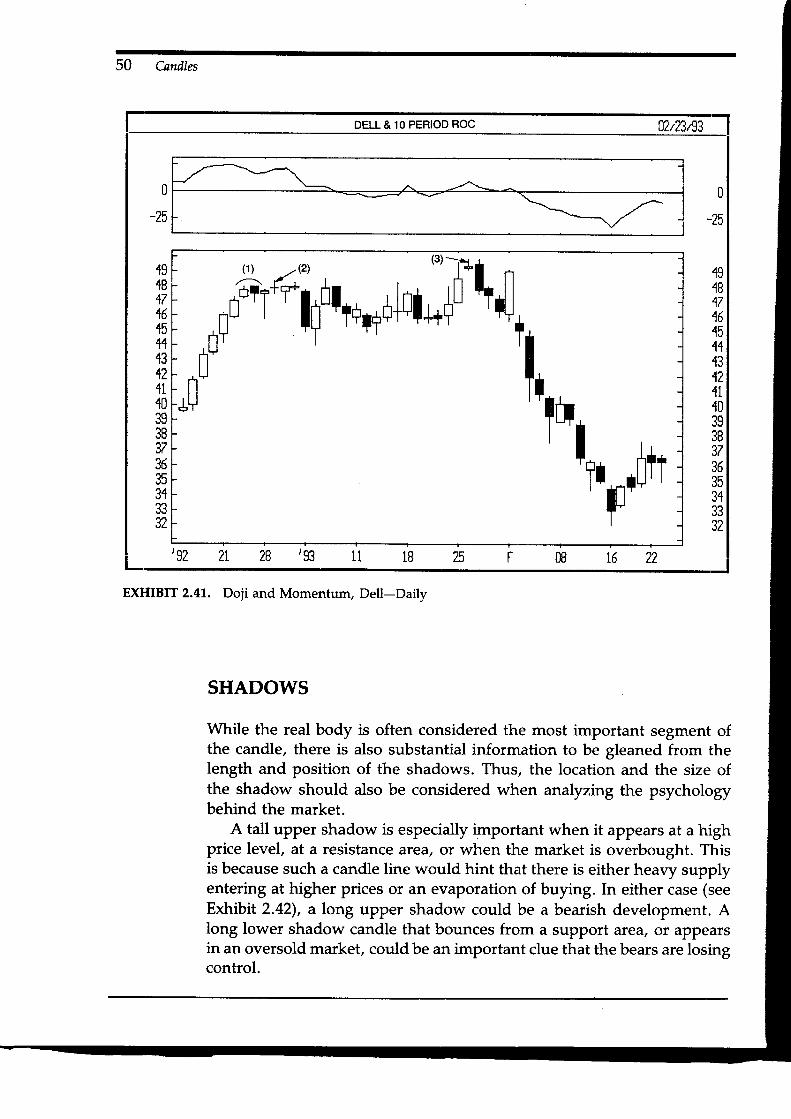
50 Candles
EXHIBIT 2.41. Doji and Momentum, Dell-Daily
SHADOWS
While the real body is often considered the most important segment ofthe candle, there is also substantial information to be gleaned from thelength and position of the shadows. Thus, the location and the size ofthe shadow should also be considered when analyzing the psychologybehind the market.
A tall upper shadow is especially important when it appears at a highprice level, at a resistance area, or when the market is overbought. Thisis because such a candle line would hint that there is either heavy supplyentering at higher prices or an evaporation of buying. In either case (seeExhibit 2.42), a long upper shadow could be a bearish development. Along lower shadow candle that bounces from a support area, or appearsin an oversold market, could be an important clue that the bears are losingcontrol.
DELL & 1O PERIOD ROC 02123r33
0-25
{9{8171515114?
124L{0
<K
3736?E
31
JL
-Ff 'T{lu,*o*hl;+T "*il'.
lF ' '1,
.'; 'Totrrrril+rtT
19181716151113124L10?q
JU3736?6
31JJ
37
'92 2l 2g '93 11 t8 tt OB t5 22
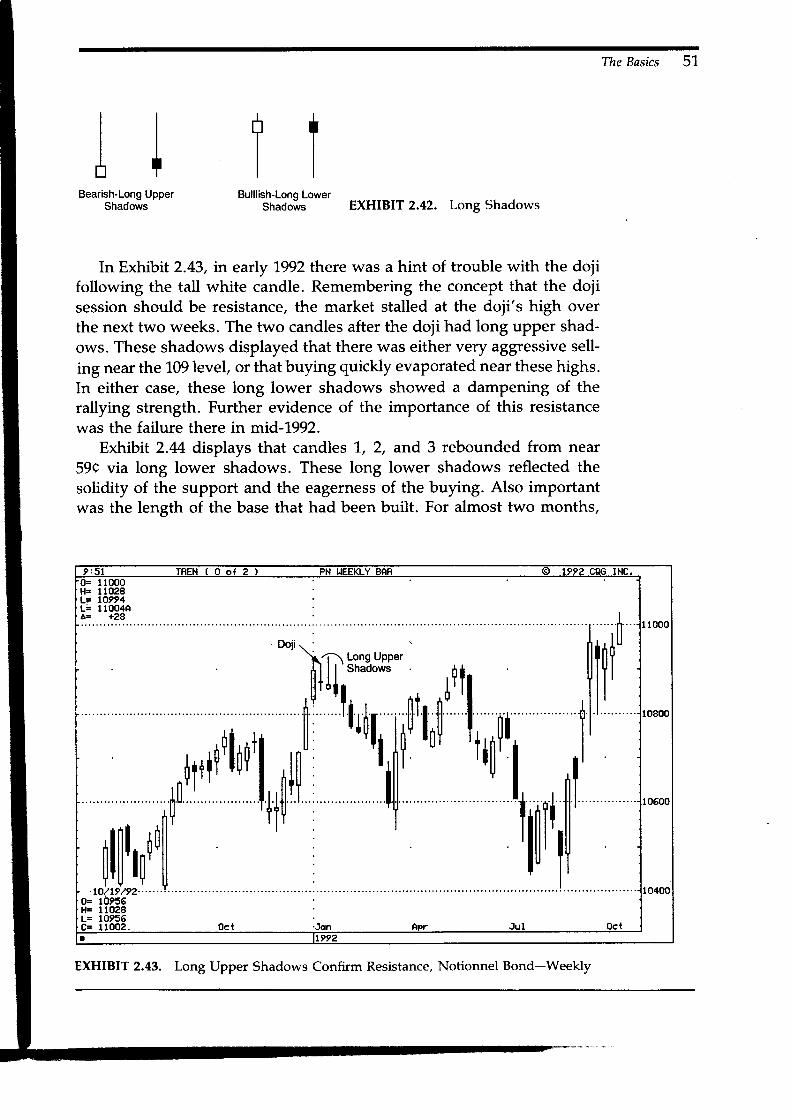
The Basics 51
TIl lBearish-Long Upper
ShadowsBulllish-Lono Lower
Shadoils EXHIBIT 2.42. Long Shadows
In Exhibit 2.43, in early L992 there was a hint of trouble with the dojifollowing the tall white candle. Remembering the concept that the dojisession should be resistance, the market stalled at the doji's high overthe next two weeks. The two candles after the doji had long upper shad-ows. These shadows displayed that there was either very aggressive sell-ing near the 109level, or that buying quickly evaporated near these highs.In either case, these long lower shadows showed a dampening of therallying strength. Further evidence of the importance of this resistancewas the failure there in mid-1992.
Exhibit 2.M displays that candles L, 2, and 3 rebounded from near59C via long lower shadows. These long lower shadows reflected thesolidity of the support and the eagerness of the buying. Also importantwas the length of the base that had been built. For almost two months,
EXHIBIT 2.43. Long Upper Shadows Confirm Resistance, Notionnel Bond-Weekly

52 Candles
EXHIBIT 2.44. Long Lower Shadows Confirm Support, fune 1993 Deutsche Mark-Daily
the bears tried to break prices under 59c and they failed. In general, thelonger the base, the more solid the scaffolding on which a rally can bebuilt.
A popular moving average among futures traders is the 65-day mov-ing average. This line often swerves as support or resistance. For ex-ample, note how in Exhibit 2.45 that it was support in early Novemberand again in early |anuary. The test of this support in early fanuary vialong lower shadows, shows how strongly and quickly the market sprangfrom there. For those who are familiar with candles, the first long lo*",shadow candle is a hammer. Hammers will be explained in the nextchapter.
High-Wave Candles
A candle with a long upper and lower shadows is called ahigh-wnae candle(shown in Exhibit 2.46).It shows that the market is in a standoff betweenthe bulls and bears. when a high-wave emerges after a downtrend oruptrend, the |apanese say that the market has lost its sense of direction.This lack of market orientation means that the prior trend is in jeopardy.

The Basics 53
EXHIBIT 2.45. Long Lower Shadows Confirm Support, March 1993 S & P Futures-
Daily
A doji that has long upper and lower shadows is either called a high-wave doji or a long-legged doji.
In Exhibit 2.47, a series of high-wave candles are displayed at 1', 2,and 3. The high-wave candle at L hinted that the bulls and bears wereat a standoff. The action that preceded candle t had a bearish bias. Thus,with the appearance of high-wave candle 1, the market had sent out aclue that the trend was probably in the process of change. This outlookwas reinforced by the dual white candles after high-wave candle 1. Themarket ascended from candle L until it got to another high-wave candle(at 2). From there, prices declined sharply in the next session via a longblack real body. However, at the session after this long black real body,a candle with an extended lower shadow (at X) showed that the lows
I
EXHIBIT 2.45. High-Wave Candles
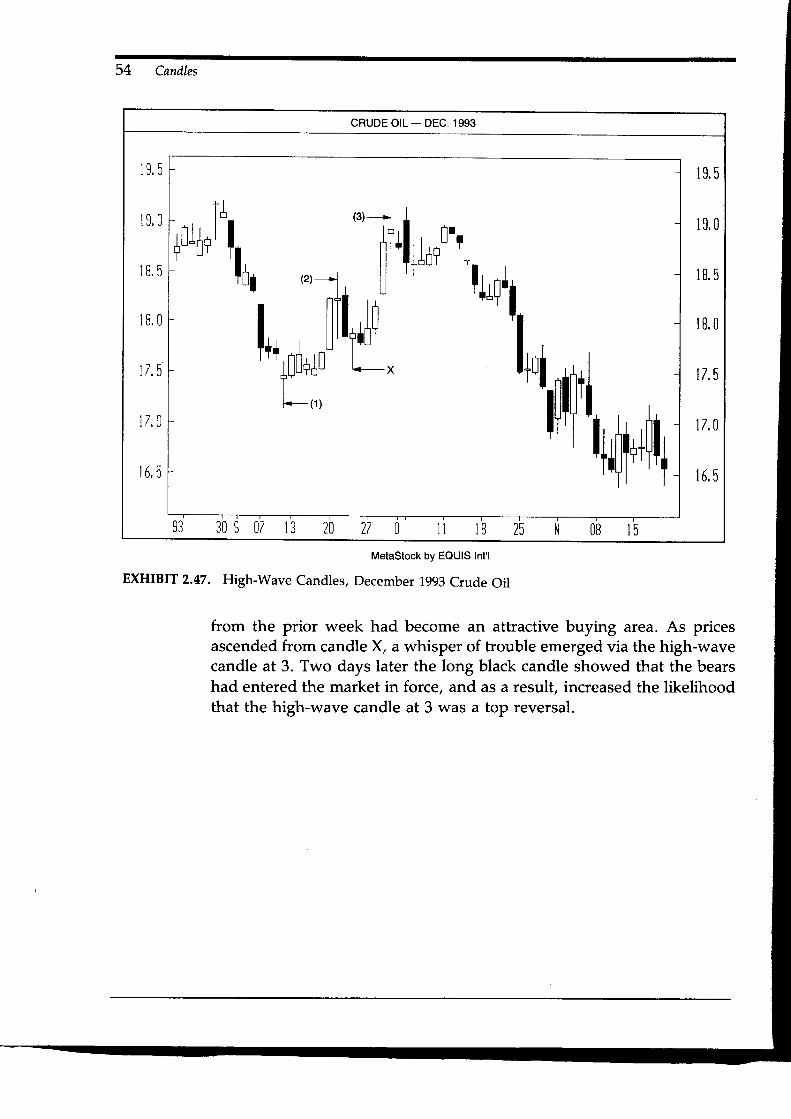
54 Candles
MetaStock by EQUIS Int'l
EXHIBIT 2.47. High-Wave Candles, December 1993 Crude Oil
from the prior week had become an attractive buying area. As pricesascended from candle X, a whisper of trouble emerged via the high-wavecandle at 3. Two days later the long black candle showed that the bearshad entered the market in force, and as a result, increased the likelihoodthat the high-wave candle at 3 was a top reversal.
CRUDE OIL - DEC. 1993
1 9 . 5 19. 5
19. 0 19, 0
1 0 6 lB. 5
lB, 0 rB. 0
17,5 t7 .5
l z . 0 l i . 0
l / f
l b , 3 16. 5
33 3 0 s07 l 3 20 lt IB ?5 OB 15

CHAPTER 3
THE PATTERNS
H E 6 i f 6 - - . 3 t Z E 6 D"He Whose Ranks are United in Purpose WiIl Be Victoious"
Dince the publication of my first book, I have had new ]apanese materialtranslated, have met new Japanese traders, and have continued my dia-logues with those japanese traders who have previously helped me. Inaddition, I have also had another three years of hands-on experience. Asa result, I have gleaned new insights and concepts that will be conveyedto you in this chapter.
This chapter will not be a reference to all the patterns that are in myfirst book. Instead, my aim here is twofold. For those new to candles,this chapter will reveal how some of the more common and importantcandle patterns can provide powerful insights into your market analysis.For those already knowledgeable about the candles, you will discovernew refinements and trading techniques. It is especially important to readthe detailed descriptions of the charts. It is in these that you will mosteasily see some of the new refinements of candle theory, as well as somenew concepts.
As one of the Japanese books I had translated stated, "the psychologyof the market participant, the supply and demand equation, and therelative strengths of the buyers and sellers are all reflected in the onecandlestick or in a combination of candlesticks."l In this chapter, I willdescribe the many uses and trading insights provided by individual can-dle lines and candle patterns based on two or more candle lines. Theorganization of this chapter is based on the number of lines that formthe pattern. Consequently, this chapter's first section will focus on in-dividual candle lines, such as the hammer and shooting star. The nextsection will delve into candle patterns comprised of two candle lines.
55

56
These include the dark cloud cover and two gapping black candles. Thefinal section in this chapter will address those candle patterns, such asthe evening star and record sessions, which have three or more candlelines.
SINGLE CANDLE LINES
In Chapter 2, I detailed how the length of the shadows can relay infor-mation about the resiliency of the bulls or the bears. For example, a longupper shadow echoes the ability of the bears to regain control of themarket during a rally. A long lower shadow pictorially reflects the bulls'ability to rally the market after the market's new session lows have beenmade.
In this section, the single candle lines I will be describing (the ham-mer, hanging man line, and the shooting star) either have a long upperor lower shadow. But, because they also possess the important aspect ofhaving a small real body near the top or bottom of the trading range,these candles lines take on increased importance when using candlecharts.
The Hammer
As shown by Exhibit 3.1-, the hammer, with its long lower shadow anda close near or at the high, is easily understood to be a bullish signal.The term "hammer" derives from the fact that the market is "hammering
out a base," or that a bottom is so solid that it does not break, evenwhen a hammer knocks away at it.
, , 1
VEXHIBIT 3.L. The Hammer
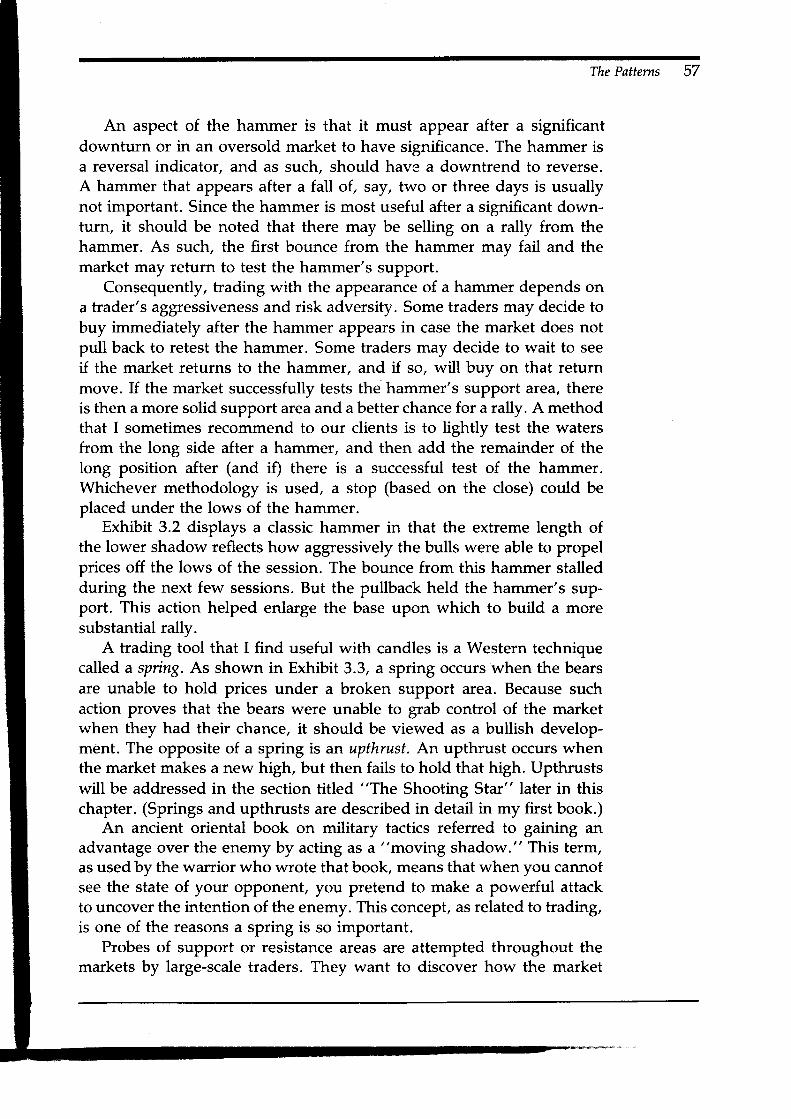
The Patterns
An aspect of the hammer is that it must appear after a significantdownturn or in an oversold market to have significance. The hammer isa reversal indicator, and as such, should have a downtrend to reverse.A hammer that appears after a fall of, say, two or three days is usuallynot important. Since the hammer is most useful after a significant down-turn, it should be noted that there may be selling on a rally from thehammer. As such, the first bounce from the hammer may fail and themarket may return to test the hammer's support.
Consequently, trading with the appearance of a hammer depends ona trader's aggressiveness and risk adversity. Some traders may decide tobuy immediately after the hammer appears in case the market does notpull back to retest the hammer. Some traders may decide to wait to seeif the market returns to the hammer, and if so, will buy on that returnmove. If the market successfully tests the hammer's support area, thereis then a more solid support area and a better chance for a rally. A methodthat I sometimes recommend to our clients is to lightly test the watersfrom the long side after a hammer, and then add the remainder of thelong position after (and if) there is a successful test of the hammer.Whichever methodology is used, a stop (based on the close) could beplaced under the lows of the hammer.
Exhibit 3.2 displays a classic hammer in that the extreme length ofthe lower shadow reflects how aggressively the bulls were able to propelprices off the lows of the session. The bounce from this hammer stalledduring the next few sessions. But the pullback held the hammer's sup-port. This action helped enlarge the base upon which to build a moresubstantial rally.
A trading tool that I find useful with candles is a Western techniquecalled a spring. As shown in Exhibit 3.3, a spring occurs when the bearsare unable to hold prices under a broken support area. Because suchaction proves that the bears were unable to grab control of the marketwhen they had their chance, it should be viewed as a bullish develop-ment. The opposite of a spring is an upthrust. An upthrust occurs whenthe market makes a new high, but then fails to hold that high. Upthrustswill be addressed in the section titled "The Shooting Star" later in thischapter. (Springs and upthrusts are described in detail in my first book.)
An ancient oriental book on military tactics referred to gaining anadvantage over the enemy by acting as a "moving shadow." This term,as used by the warrior who wrote that book, means that when you cannotsee the state of your opponent, you pretend to make a powerful attackto uncover the intention of the enemy. This concept, as related to trading,is one of the reasons a spring is so important.
Probes of support or resistance areas are attempted throughout themarkets by large-scale traders. They want to discover how the market
57
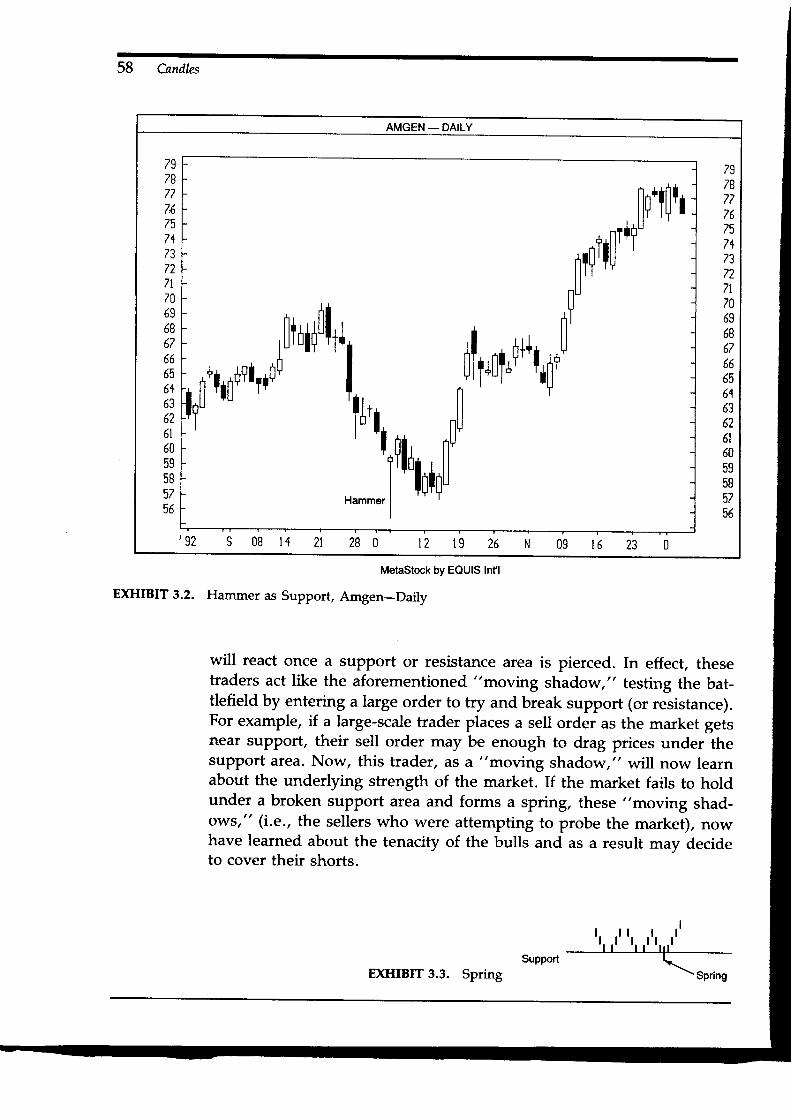
58 Candles
AMGEN _ DAILY
7g78) 7
7S7q
711 aI J
727l70
6867b b
656163b t
6l60595B5756
[ilrItil'+rIr-iilrr*r,n+r\1n*ilta4ill1rt,*,,,,0,*tn*,,ilo[ +rl-+++l*oril
Hammer |
' " ' t
797B7776757173727l706S686766656163626l60595B5756
'92 S 08 t4 2t 28 0 t 2 1 9 2 6 N 0 9 1 6 2 3 D
MetaStock by EQUIS Int'l
EXHIBIT 3.2. Hammer as Support, Amgen-Daily
will react once a support or resistance area is pierced. In effect, thesetraders act like the aforementioned "moving shadow," testing the bat-tlefield by entering a large order to try and break support (or resistance).For example, if a large-scale trader places a sell order as the market getsnear support, their sell order may be enough to drag prices under thesupport area. Now, this trader, as a "moving shadow,,, will now learnabout the underlying strength of the market. If the market fails to holdunder a broken support area and forms a spring, these "moving shad-ows," (i.e., the sellers who were attempting to probe the market), nowhave learned about the tenacity of the bulls and as a result may decideto cover their shorts.
" , , " " , , " ' , , " "Suppod \_
EXHIBIT 3.3. Spring \Sprins

The Patterns 59
EXHIBIT 3.4. Hammer and a Spring, Gold-Weekly
In Exhibit 3.4, we see one of the more powerful combinations of East-ern and Western technicals-a hammer and a spring. The 1993 low wasformed by a hammer. This hammer was also a spring since the low ofthe hammer's lower shadow stightly punctured a support zone, butsprang back above this broken support line. Also of interest in this chartis that the high made near $360 in mid-1992rwas formed by a doji follow-ing a tall white candle.
The Hanging Man
As shown in Exhibit 3.5, a hanging man has a very long lower shadow,a small real body (white or black) near the upper end of the trading rangeand little or no upper shadow. This is the same shape as the hammerline. However, as expressed in the Japanese literature, "If it appears frombelow, buy, and if appears from above, sell."
This phrase means that the same shape line can be bullish or bearish,depending on where it appears in a trend. If this line appears "from
below," that is, during a decline, it is a bullish hammer. However, if thissame shape line appears "from above," that is, during an uptrend, it isa sell signal and is referred to as a hanging man line.

60
,,Black,_rr or White
I l- crose shourd be, | | under hanging man's
, I reat body
l ll l
T
EXHIBIT 3.5. The Hanging Man I
Thus, the hanging man line is a top reversal signal that must arriveduring a rally, while the hammer is a bottom reversal line that mustappear during a decline; the same line can be bullish or bearish, de-pending on the trend preceding it. In this context, it is interesting thatthe japanese have two words for rice. They call it either "raislJ,, oi ,,go-han." Raisu is the |apanese term for rice when it is prepared westJrnstyle. The term "raisu" even sounds like the western word "rice.,, Go-han also means rice, but it is rice prepared japanese style. In other word.s,the Japanese refer to the exact same product-rice-by different names.\tVhat surrounds the rice determines whether the rice is referred to asraisu or gohan. So it is with the hammer and hanging man. whether thecandle line is a bullish pattern (the hammer) or a bearish pattern (thehanging man) is dependent on what precedes the line.
with the hanging man's long lower shadow reflecting buying interest,it may seem that the hanging man is a bullish signal. However, thehangman's action shows that once the market has fallen, it has becomevery fragile. The small teal body of the hanging man also shows that theprior uptrend may be in the process of changing. Because of the bullishaction of the hanging man session (during the session the market sellsoff and then rallies by the close), an important aspect of the hanging manlines is that there should be bearish confirmation. A common method ofbearish confirmation of a hangman is to wait to see if the next session,sclose is under the hanging man's real body. This is shown in Exhibit 3.5.
The reason for the importance of this confirmation has to do with thefact that the hanging man's long lower shadow shows that there is stillrising power left in the market. However, if prices fall under the hangingman's real body, it translates into the fact that everyone who bought atthe open or close of the hanging man session is now losing money. Insuch a scenario, these longs may decide to liquidate, and by doing so,may engender a further weakening of prices.
since my seminar on the candles at the world Bank in washington,
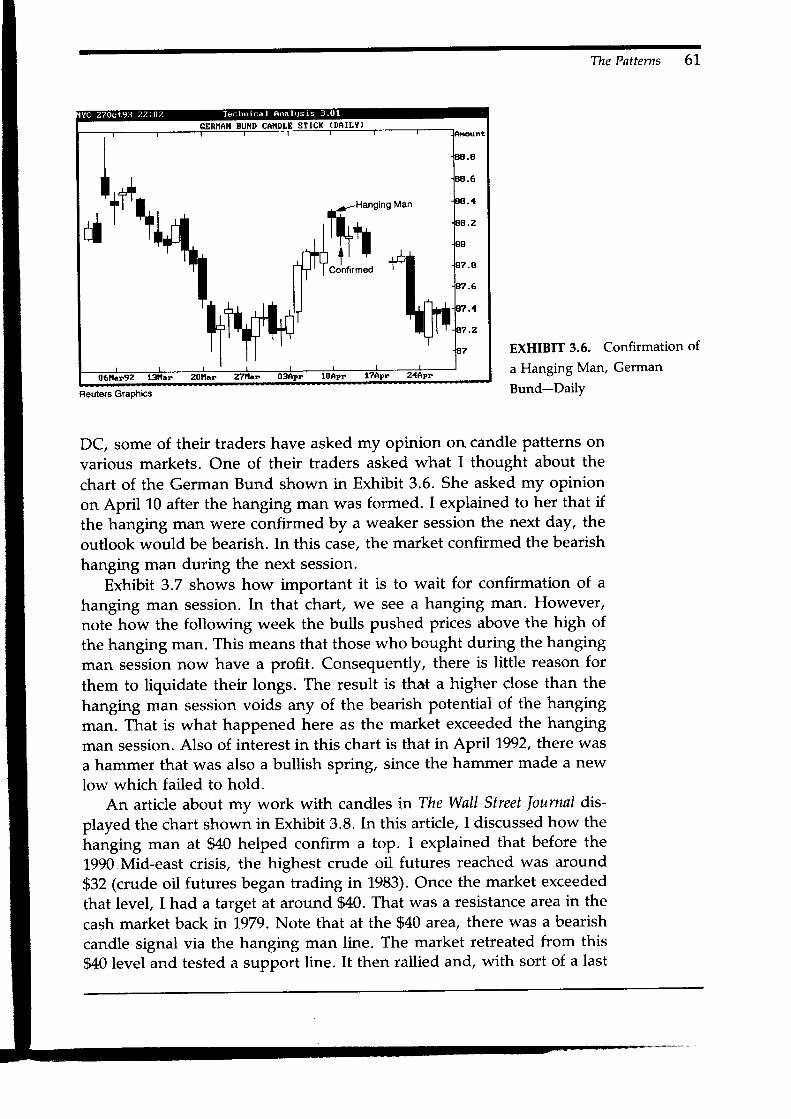
The Patterns 61
CAI IDLE STICX (DAIL I )
II
I . I I
, ' t l ' l r ,
, r - - H a n s i n s M a n;r "'*[l gu",-t:1}-ffliil' trrr
I
Fteuters Graphics
EXHIBIT 3.6. Confirmation of
a Hanging Man, German
Bund-Daily
DC, some of their traders have asked my opinion on candle patterns onvarious markets. One of their traders asked what I thought about the
chart of the German Bund shown in Exhibit 3.6. She asked my opinionon April 10 after the hanging man was formed. I explained to her that ifthe hanging man were confirmed by a weaker session the next day, the
outlook would be bearish. In this case, the market confirmed the bearishhanging man during the next session.
Exhibit 3.7 shows how important it is to wait for confirmation of ahanging man session. In that chart, we see a hanging man. However,note how the following week the bulls pushed prices above the high of
the hanging man. This means that those who bought during the hangingman session now have a profit. Consequently, there is little reason for
them to liquidate their longs. The result is that a higher close than the
hanging man session voids any of the bearish potential of the hangingman. That is what happened here as the market exceeded the hangingman session. Also of interest in this chart is that in April 1992, there wasa hammer that was also a bullish spring, since the hammer made a newlow which failed to hold.
An article about my work with candles in The Wall Street lournal dis-played the chart shown in Exhibit 3.8. In this article, I discussed how thehanging man at $40 helped confirm a top. I explained that before the1990 Mid-east crisis, the highest crude oil futures reached was around
$32 (crude oil futures began trading in 1983). Once the market exceededthat level, I had a target at around $40. That was a resistance area in the
cash market back in 1979. Note that at the $40 area, there was a bearishcandle signal via the hanging man line. The market retreated from thisg40level and tested a support line. It then rallied and, with sort of a last

Candles
EXHIBIT 3.7. waiting for Confirmation of a Hanging Man, Bonds-weekly
EXHIBIT 3.8. Hanging Man Confirms Resistance, November 1990 Crude Oil-Dailv
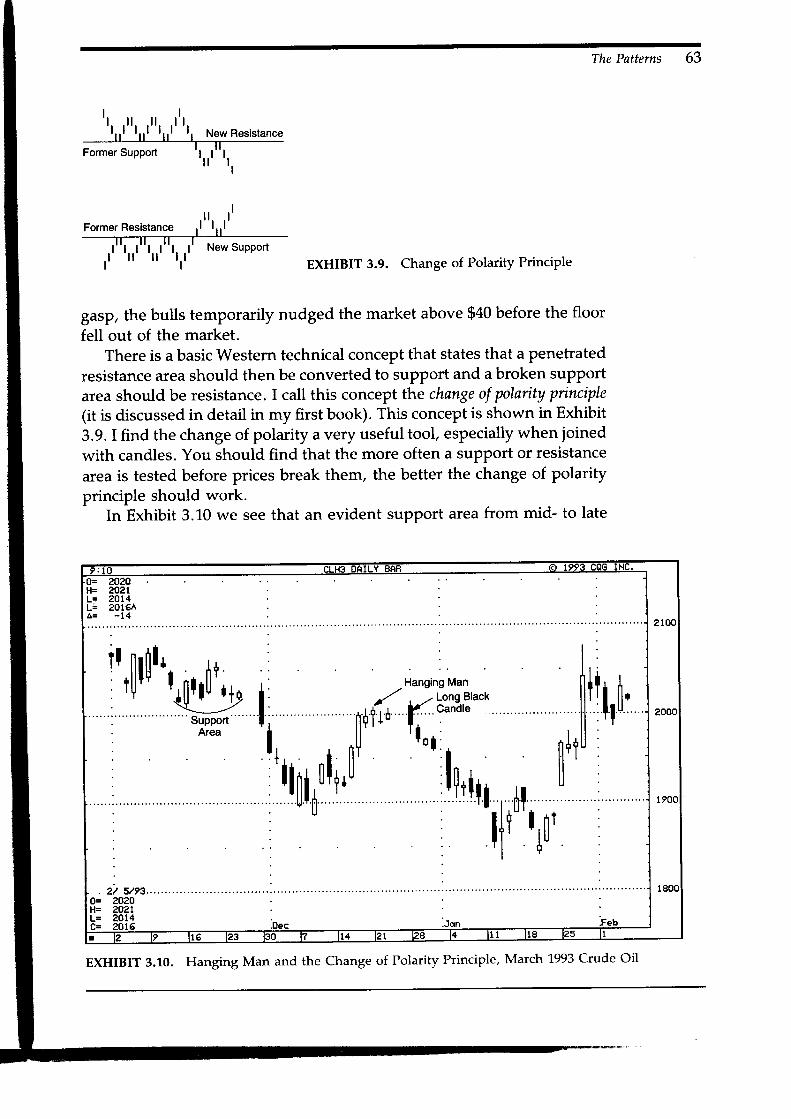
The Patterns 63
" , , , , " , , , , " , , , , " ' , , , * ew Res i s rance
rorr*r Support ",,iT,
t '
lr rr rr rlr
EXHIBIT 3.9. Change of Polarity Principle
gasp, the bulls temporarily nudged the market above $40 before the floor
fell out of the market.There is a basic Western technical concept that states that a penetrated
resistance area should then be converted to support and a broken supportarea should be resistance. I call this concept the change of polaity pinciple(it is discussed in detail in my first book). This concept is shown in Exhibit
3.9. I find the change of polarity a very useful tool, especially when joined
with candles. You should find that the more often a support or resistance
area is tested before prices break them, the better the change of polarityprinciple should work.
In Exhibit 3.10 we see that an evident support area from mid- to late
I
New Support
EXHIBIT 3.10. Hanging Man and the Change of Polarity Principle, March 1993 Crude Oil
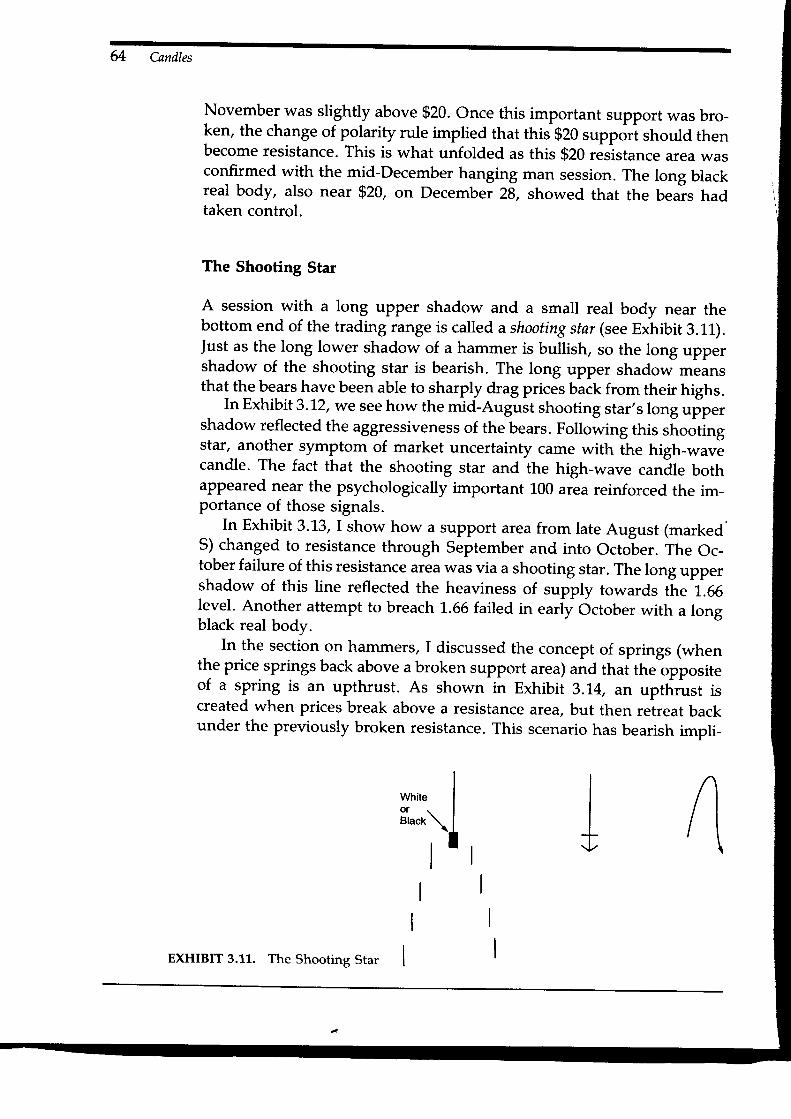
64 Candles
November was slightly above $20. Once this important support was bro_ken, the change of polarity rule implied that this$2O r,rppori should thenbecome resistance. This is what unfolded as this $20 resistance area wasconfirmed with the mid-December hanging man session. The long blackreal body, also near $20, on December 28, showed that the bears hadtaken control.
The Shooting Star
A session with a long upper shadow and a small real body near thebottom end of the trading range is called a shooting star (see Exhibit 3.11).|ust as the long lower shadow of a hammer is bullish, so the long uppershadow of the shooting star is bearish. The long upper shadow *eit sthat the bears have been able to sharply drag prices back from their highs.
In Exhibit 3.12, we see how the mid-August shooting star,s long ulpershadow reflected the aggressiveness of the bears. Following this shootingstar, another symptom of market uncertainty came with ihe high-wavecandle. The fact that the shooting star and the high-wurr. .u.,lle bothappeared near the psychologically important 100 area reinforced the im-portance of those signals.
In Exhibit 3.13, I show how a support area from late August (marked's) changed to resistance through september and into october. The oc-tober failure of this resistance area was via a shooting star. The long uppershadow of this line reflected the heaviness of supply towards the-1^.66level. Another attempt to breach 1.66 failed in eariy october with a longblack real body.
In the section on hammers, I discussed the concept of springs (whenthe price springs back above a broken support area) utra tnui the oppositeof a spring is an upthrust. As shown in Exhibit 3.\4, an upthrust iscreated when prices break above a resistance area, but then retreat backunder the previously broken resistance. This scenario has bearish impli-
white I3L*11
l r l
EXHIBIT 3.11. The Shooting Star

The Patterns
EXHIBIT 3.12. Shooting Star with a High-Wave Candle, September 1993 fapanese
Yen
EXHIBIT 3.13. Shooting Star and the Change of Polarity, Cash Deutsche Mark

66 Candles
EXHIBIT 3.14. An Upthrust
cations. At times, the upper shadow of a shooting star can also be partof an upthrust.
In Exhibit 3.15, there is a shooting star that pierced the January 7 and8 resistance area with its long upper shadow. The failure of the 6u[s tokeep prices in the new territory created a bearish upthrust.
To help clarify the difference between the hammer, hanging man, andshooting star lines, I have annotated Exhibit 3.16 with un "*u-ple of eachcandle line. Note that for each signal the market must be in a clearlydefined trend.
L. Shooting star-we can see how the shooting star must appear afteran uptrend. The shooting star's long upper shadow reflects marketrejection of higher prices.
EXHIBIT 3.15. shooting star and Upthrust, March 1992 Bonds-Intra-Day

The Patterns 67
DISNEY _ DAILY
47.5
4 7 . 0
16.5
46. 0
45. 54 6 n
44.5
41. 0
13. 5
4 3 . 0
1t . x
12.0
1 1 . 5
4 t . 0
40. 5
10. 0
iliq,:ii"'Man@
.l-,*s,,.r1'oil il||ttil dlll hn' ilril-nsMan@
",,,il *rJlrrJ 'o'rl \' '-lryil|']h**lill'ioq,ril,l l V u I ' H a m m e r
U F - - @
4 7 . 54 7 n
16. 5
46.0
45. 5
15. 0
14. 5
4 1 , 04 ? 6
13. 042.54 ? n
4 1 , 5
1 1 . 010. 540. 0
'92 2I ' 9 3 11 1 8 l b 22 I 3 29
MetaStock bY EQUIS Int'l
EXHIBIT 3.16. Hammet, Hanging Man, and Shooting Star Lines, Disney-Daily
2. Hammer-A long lower shadow candle that must aPPear during adowntrend.
3. Although this has the correct shape of a hammer or hanging man line
(a long lower shadow with a small real body near the highs of the
session), candle 3 is neither a hammer nor a hanging man. This is
because this line did not aPPear during an uptrend or a downtrend,but was in the middle of a trading range. Thus, line 3 is not a hammer(although the long, lower shadow could be viewed as a positive sig-nal).
4.,7. Rallies preceded these hanging man lines, which were confirmedduring the next session by a close under the hanging man's real body.In line 7, we can see a small uppef shadow. If the uPPer shadow is
relatively small, it is still considered a hanging man. (A small uPPershadow is also allowable with a hammer.) Note how the real body ofthe hanging man can be white or black.
5. This line has the correct shape of a shooting star (a tall uPPer shadowand a small real body at the lower end of the session's range). How-ever, since it does not appear after an uptread, it does not have thebearish implications as would a traditional shooting star.
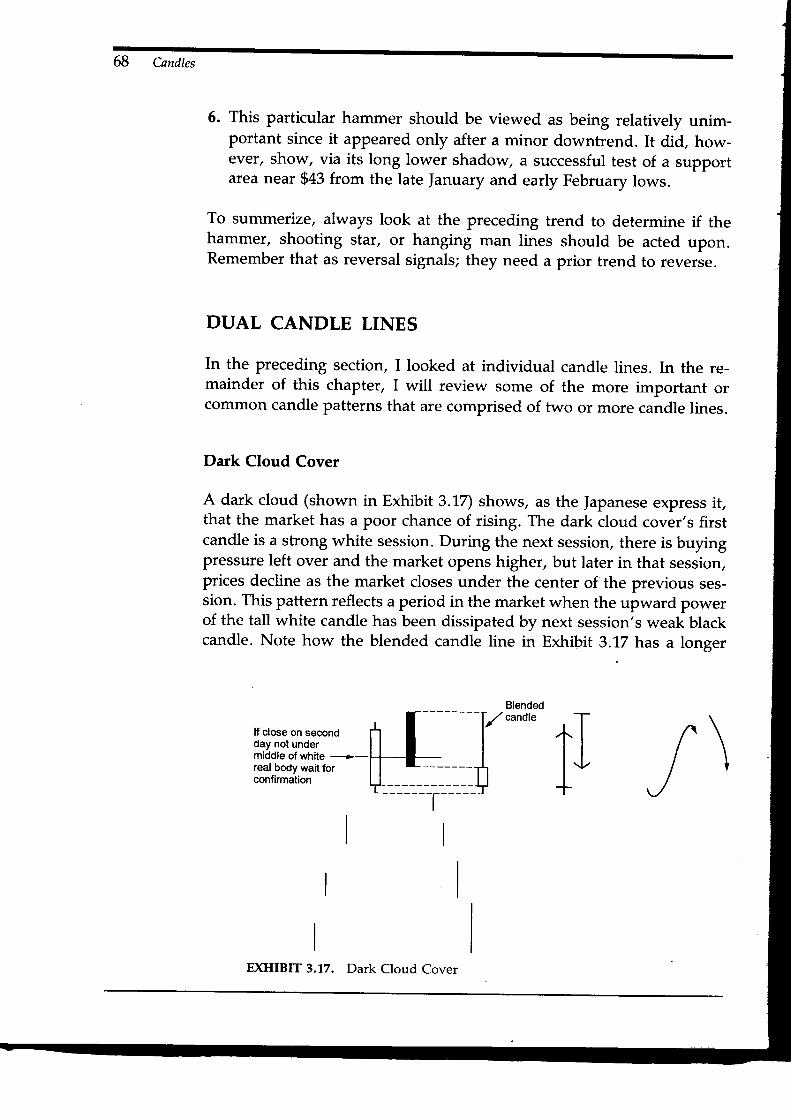
68
6. This particular hammer should be viewed as being relatively unim-portant since it appeared only after a minor downtrend. It did, how-ever, show, via its long lower shadow, a successful test of a supportarea near $43 from the late |anuary and early February lows.
To summerize, always look at the preceding trend to determine if thehammer, shooting star, or hanging man lines should be acted upon.Remember that as reversal signals; they need a prior trend to reverse.
DUAL CANDLE LINES
In the preceding section, I looked at individual candle lines. In the re-mainder of this chapter, I will review some of the more important orcommon candle patterns that are comprised of two or more candle lines.
Dark Cloud Cover
A dark cloud (shown in Exhibit 3.17) shows, as the Japanese express it,that the market has a poor chance of rising. The dark cloud cover's firstcandle is a strong white session. During the next session, there is buyingpressure left over and the market opens higher, but later in that session,prices decline as the market closes under the center of the previous ses-sion. This pattern reflects a period in the market when the upward powerof the tall white candle has been dissipated by next session's weak blackcandle. Note how the blended candle line in Exhibit 3.17 has a longer
lf close on secondday not undermiddle of white -->real body wait forconfirmation
/ \
II
EXHIBIT 3.17. Dark Cloud Cover
cand'e
p

The Patterns 69
upper shadow. In other words, the dark cloud cover displays pictorially
a time in the market in which selling Pressure is exceeding the buying
pressure.An ideal dark cloud cover's second session should close under the
midpoint of the prior white candle. If the black candle does not closebelow the halfway point, it is considered by some fapanese traders to be
an incomplete dark cloud cover. In such cases, it is best to wait for con-
firmation during the next session in the form of a weaker close. As ageneral rule, the deeper the close of the dark cloud cover's second sessionpushes into the white candle, the more bearish the signal.
A dark cloud that fails to move under the center of the prior candleis shown in Exhibit 3.18. Looking at the blended candle in Exhibit 3.18,
we see how there is less of an upper shadow than in the case of the more
classic dark cloud cover's blended candle shown in Exhibit 3.17. Thismeans the dark cloud cover in Exhibit 3.18 may be less bearish than astandard dark cloud cover. This is why there should be confirmation byfurther weakness after the type of dark cloud cover shown in Exhibit
3.18.There is a difference in how I would view the dark cloud cover in
stocks and futures. The ideal dark cloud cover has the second session'sopen above the high of the prior session. Since there is generally higher
price volatility in the futures market as compafed to stocks, it means that
I am more flexible about the definition of a dark cloud cover with stocks
than with futures. Specifically, with stocks I still view it as a dark cloud
cover if the second session opens above the prior session's close, rather
than its high. This is shown in Exhibit 3.19.
. f i ;I r--:-----------:r
I
I Close of candle (2) aboveI midpoint of candle (1)
EXHIBIT 3.18. Dark Cloud Variation 1
II
I Oo"n of candle (2)I above close of candle (1)
EXHIBIT 3.19. Dark Cloud Variation 2

70 Candles
However, if the second session of the dark cover of a stock does openabove the prior session's high (instead of its close), it would be more ofa potential reversal signal. This is because it is more bearish if the marketreverses after failing from a new high than it is if the market fails froman area that was not a new high.
A dark cloud cover often becomes resistance. In Exhibit 9.20, we seea dark cloud cover in late |anuary near 975.50. The market retreated fromthere until a hammer (that was also a spring) formed near 969 in Feb-ruary. The rally from this hammer stalled in March at the resistance setby the dark cloud. However, as with any form of technical analysis, thereshould be a price at which you should reconsider your original outlook.For a pattern like the dark cloud cover, if the market closes above thehigh of the dark cloud cover, the chances are that the market will continueits upward path. In this example, observe how the market not only closedabove the high of the dark cloud cover in late March, but did so via abullish rising gap. Another interesting aspect of this gap is that the ses-
SW BELL_ DAILY
B3
82
8lBO
Z9iltil
Dark Cloude s**-df,1j'[u*1lriltlol+,pt,*Jot'lo.,, ,0il{r+nrilil*'+i,l,o,,,,oooor"trr,l,+il
' 'r ' t'10*,,_,,00,/f lil I',o
F-Hammer and Spring
83
B2
8180
Z9
7B77t l
76
757+73
72
7l
70
bJ
78
77
76
757+73( L
7l
7Dht
' 9 2 0 2 t + 2 t z B ' $ l t l B 2 5 F 0 B L 6 z ? f i 0 B 1 5 z z 2 9 R 1 ) 1 q ' ( .
MetaStock by EQUIS Int'l
EXHIBIT 3.20. Dark Cloud Cover as Resistance, Southwest Bell-Daily

EASTERN KODAK- DAILY
4 6 6
4 E n
++,5
++.04 ? 5
+3. D
+2. 5
+2.0
41 6
+1. D
+0, 5
+0.0
+5.5
4 6 n
4 4 6
++. 04 ? 6
+3,041 tr
+2. D
4l E
+1. 0
4 n 6
+0.0' 9 2 t( 1D l 1
t ( 081+ ?B t2 l 9 LD nq l 5
"r,J u l,lil+ililolqt\10't'***,,*,,,/ '*t
/ <
The Patterns
sion after the gap created a shooting star. Yet the bearish implications ofthe shooting star was not confirmed since the market failed to close underthe rising gap (this will be discussed in detail later in this chapter underthe section on "windows"). Thus, when selling short based on a darkcloud cover, consider a stop on a close above the highs of that pattern.For those who are looking to buy, you should consider it when on theclose, prices pierce the high of the dark cloud cover.
Exhibit 3.21 is an example of two less than ideal dark cloud covers at1 and 2. Dark cloud cover L was not ideal since the second session (theblack candle) failed to close under the mid-point of the prior session.Dark clorrd cover 2lost some of its bearish importance because the secondsession of the pattern opened just above the prior close instead of theprior high. Yet, since both of these non-classic dark cloud covers emergedso close to one another, they served to reinforce each other. In otherwords, both dark cloud covers reflected the fact that as prices made newhighs near $45, the bears were able to drag prices back down under the
MetaStock bv EQUIS Int'l
EXHIBIT 3.21. Dark Cloud Covers in Close Proximity, Eastman Kodak-Daily
71
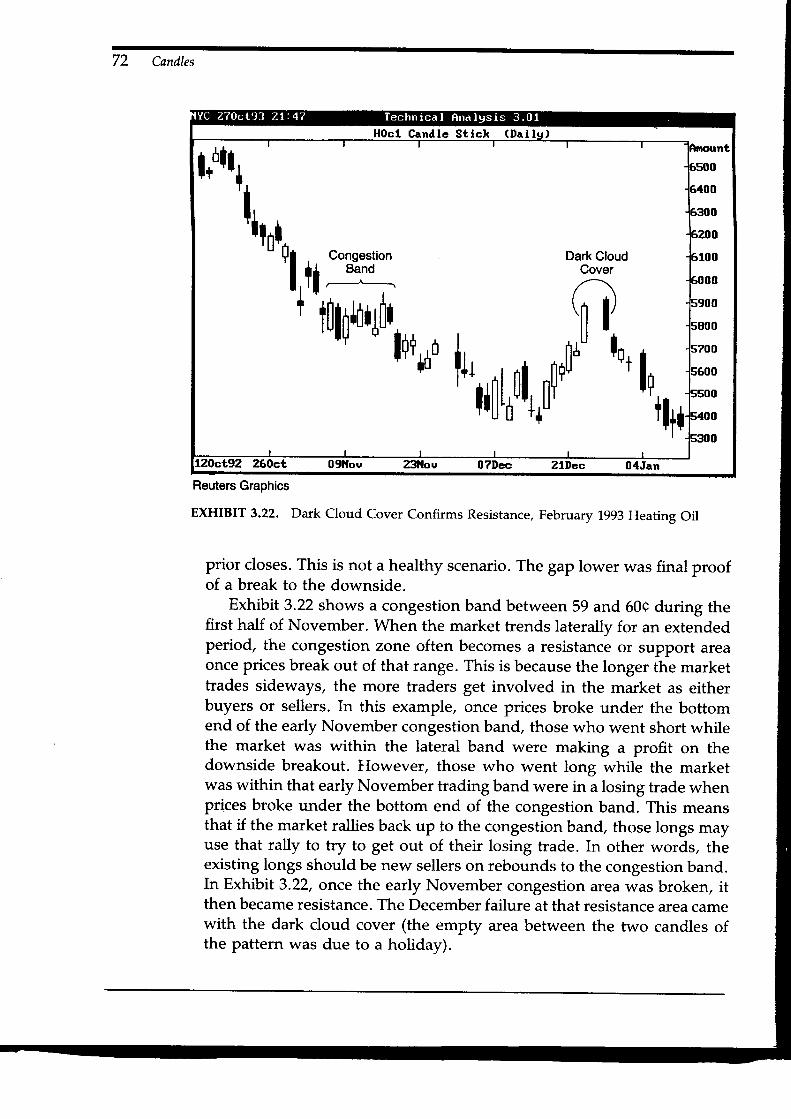
72 Candles
HOcl Cand lc S t ick (Da i l r r )
, Congestionil Band
rll -----;
t t0;ntnr,*ho,oo
Dark CloudCoverqi
1,, , ^,ilI' fo+T*'f4[onlr+[[+'
Reuters Graphics
EXHIBIT 3.22. Dark Cloud Cover Confirms Resistance, February 1993 Heating Oil
prior closes. This is not a healthy scenario. The gap lower was final proofof a break to the downside.
Exhibit 3.22 shows a congestion band between 59 and 60Q during thefirst half of November. When the market trends laterally for an extendedperiod, the congestion zone often becomes a resistance or support areaonce prices break out of that range. This is because the longer the markettrades sideways, the more traders get involved in the market as eitherbuyers or sellers. In this example, once prices broke under the bottomend of the early November congestion band, those who went short whilethe market was within the lateral band were making a profit on thedownside breakout. However, those who went long while the marketwas within that early November trading band were in a losing trade whenprices broke under the bottom end of the congestion band. This meansthat if the market rallies back up to the congestion band, those longs mayuse that rally to try to get out of their losing trade. In other words, theexisting longs should be new sellers on rebounds to the congestion band.In Exhibit 3.22, once the early November congestion area was broken, itthen became resistance. The December failure at that resistance area camewith the dark cloud cover (the empty area between the two candles ofthe pattern was due to a holiday).

The Patterns
The Piercing Pattern
As shown in Exhibit 3.23, the piercing pattern is the opposite of the darkcloud cover. The dark cloud cover appears after an uptrend, and is com-prised of a black real body that closes well into the prior white body. Thepiercing pattern is a white real body that closes within the prior blackreal body. This pattern shows that there is fierce buying at lower levels.
The following is an interesting and graphic explanation used in a]apanese book to describe what happens during the formation of thepiercing pattern
the last of the bulls that were backed into a corner and came out fightingin a heroic fight. Kamikaze fights are always frigh,tening, so the bearsseeing this take to the sidelines for the moment. In this quiet period, thebulls may get reinforcements, or after all the selling that has occurred,the supply road for the bears may be already broken."1
In other words, the downward energy of the market has been dissipated.There are various names for the two candle patterns that have the
second white candle close less than halfway into the prior black candle.These are discussed in detail in my other book. For the purposes of thediscussion here, these names are unimportant. What is important is thegeneral concept that the more the white candle pierces the black candle,the more constructive the signal. If the white candle fails to move deeplyinto the black candle, it reflects a weak counterattack by the bulls and
\ j
73
Close above prior black/candle's center
f I +I + li t
EXHIBIT 3.23. The Piercing Pattern
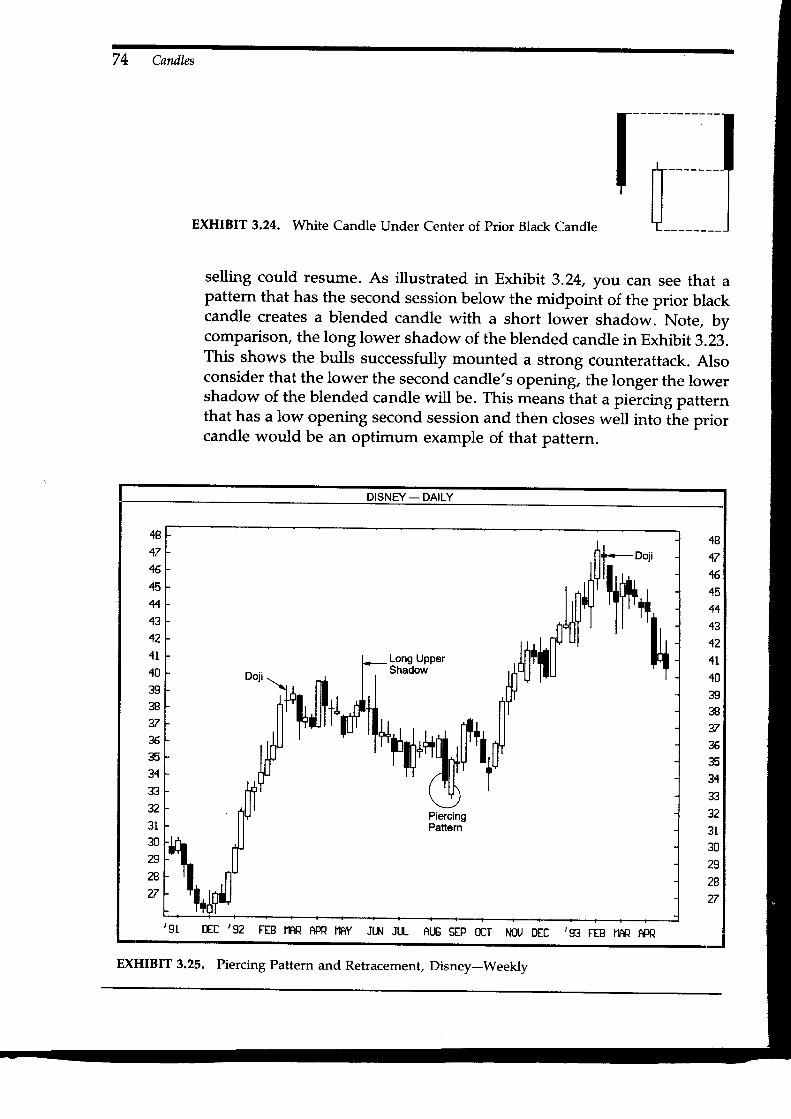
74 Candles
rrlEXHIBIT 3.24. IA/hite Candle Under Center of Prior Black Candle
selling could resume. As illustrated in Exhibit 3.24, you can see that apattern that has the second session below the midpoint of the prior blackcandle creates a blended candle with a short lower shadow. Note, bycomparison, the long lower shadow of the blended candle in Exhibit 3.23.This shows the bulls successfully mounted a strong counterattack. Alsoconsider that the lower the second candle's opening, the longer the lowershadow of the blended candle will be. This means that a pieicing patternthat has a low opening second session and then closes well into the priorcandle would be an optimum example of that pattern.
DISNEY - DAILY
,19
4716
45111342.ll
4B393837%3534
33323l3tl29n27
481715451113424L.10
39383736353433323130292827
,9I t}IC ,92 FEB IIAR mR NAY JI.['I JUL AUG SEP OCT NOU I]EC 'g3 FEB HAR APR
PiercingPattern
EXHIBIT 3.25. Piercing Pattern and Retracement, Disney-Weekly

lhe Patterns
It has been my experience that dark cloud covers are more prevalent
than are piercing patterns. Part of the reason may have to do with an old
Wall Street saying, "In on greed, out on fear." Although both greed and
fear are strong emotions, I think many would agree that of the two, fear
is the one that could cause the most volatile markets. During market
bottoms, traders or investors usually have the opportunity to wait for an
opportunity to enter the market. They may bide their time and wait for
a pullback or for the market to build a base, or to see how the marketreacts to news. Fear is more prevalent at tops. Fear is saying, "I want
out-now!"In Exhibit 3.25 we see that an advance that started in late 1991 stalled
at the doji following the tall white candle. The extended upper shadow
in May echoed the importance of the resistance area set by this doji. The
market then retreated until August's piercing pattern. The piercing pat-tern was also at a support area based on a 50o/o retracement of the rally
from the December low to the May high. The 50o/o retracement area shouldbe closely monitored by traders because such retracements are widelywatched by technicians. This pattern became support that was held inOctober with a high-wave candle. The rally from this base near $33 stalledat another doji following a tall white candle in early 1993.
Exhibit 3.26 displays that April's piercing pattern confirmed a support
75
EXHIBIT 3.25. Piercing Pattern Confirms Support, Silver-]uly 1992

76 Candles
area provided by the prior week's hammer. Another piercing pattern inlate May and early ]une signaled a temporary base for another assault atMay's resistance area near $4.rs. A series of two hanging man linesappeared at that resistance. Note how the first hanging man was notconfirmed (since the next session did not have a lower case). Only onthe day after the second hanging man session, with its close undei thesecond hanging man's real body, was the hanging man line confirmed.
The Engulfing Patterns
An engulfing pattern is a two candle pattern. A bullish engulfing pattern(shown in Exhibit 3.27A) is formed when, during a downtre"d; ; whitereal body wraps around a black real body. A bearish engulfing pattern(Exhibit 3.278) is completed when, during a rally, a black real Lody en-velops a white real body.
The engulfing pattern visually shows how the opposing forces hadgained control of the market. For example, a bullish engulfing patternreflects how the bulls have wrested control of the market from the bears.A bearish engulfing pattern shows how a superior force of supply hasoverwhelmed the bulls. The ]apanese say that with a bearish engulfingpattern, "the bulls are immobilized." we previously saw how with thedark cloud cover, the bears were able to move prices into the prior whitereal body, but with the bearish engulfing patterns, the powut of the bearswas such that they were able to pull the close under the entire priorwhite real body. The same concept can be used to compare a pieicingpattern to a bullish engulfing pattern. With the piercing pattern, the bullscounterattack strongly enough to push the close of the second white realbody well into the prior black real body. However, with the bullish en-gulfing pattern, the bulls' strength is that much greater since the closeof the white candle session is above the top of the prior black real body.Although this generally means that the bearish engulfing pattern is morebearish than a dark cloud cover, and a bullish engulfing pattern morebullish than a piercing pattern, it is equally important to see where thesepatterns emerge before deciding which is more important. For instance,a piercing pattern that confirms a major support area should be viewedmore likely as a bottom reversal signal than a bullish engulfing patternthat does not confirm support. This vital aspect of viewing the candlepatterns in conjunction with the overall technical picture will be discussedin depth in the next chapter.
The basic definition of an engulfing pattern is that the second realbody must engulf an opposite color real body. However, not all engulfingpatterns are equally important. The importance of the engulfing pattern
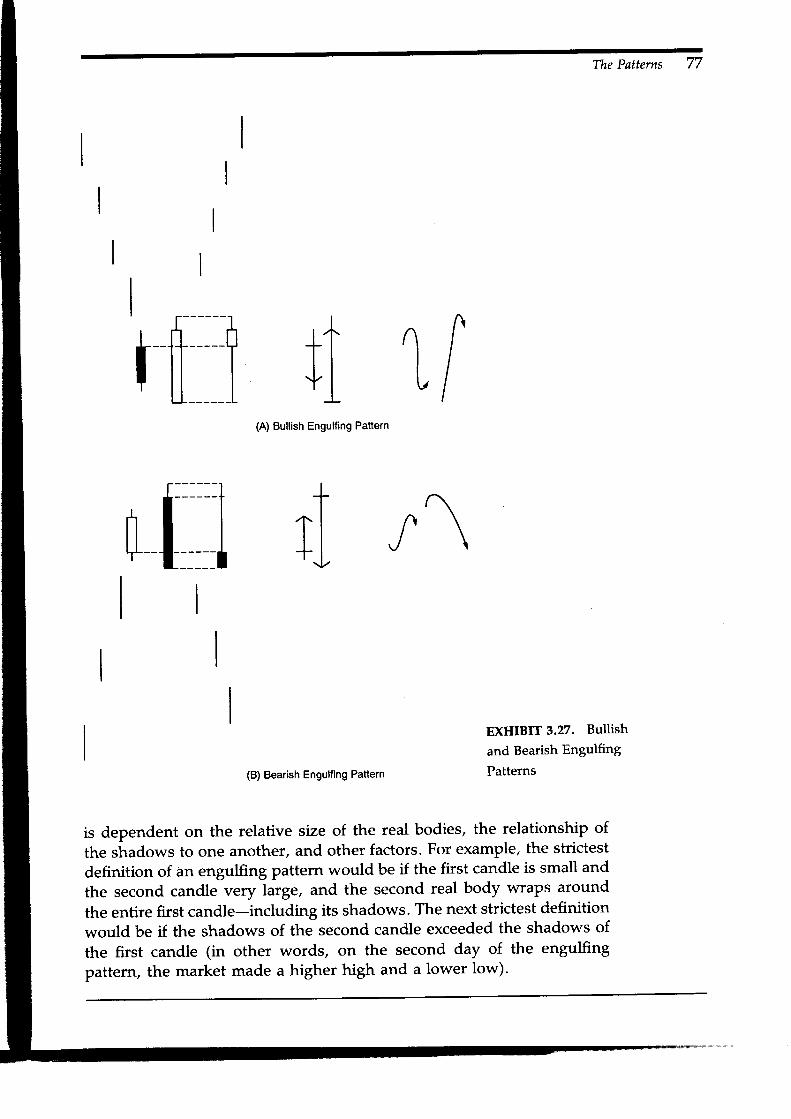
The Patterns 77
ffi il+rl
(A) Bullish Engulfing Pattern
(B) Bearish Engulfing Pattern
rI
/ \
EXHIBIT 3.27. Bullish
and Bearish Engulfing
Patterns
is dependent on the relative size of the real bodies, the relationship of
the shadows to one another, and other factors. For example, the strictest
definition of an engulfing pattern would be if the first candle is small and
the second candle very large, and the second real body wraPs around
the entire first candle-including its shadows. The next strictest definition
would be if the shadows of the second candle exceeded the shadows of
the first candle (in other words, on the second day of the engulfing
pattern, the market made a higher high and a lower low).

78
As with a dark cloud cover, if the market surpasses an engulfingpattern, it is said to go opposite to the pattern. This means that if pricesclose above the top of the bearish engulfing pattern (including the uppershadows), the outlook turns from bearish to bullish.
Aspects addressed in this section's charts include:
1,. how engulfing patterns become support and resistance;2. how an engulfing pattern can be combined with Western technical
tools;
3. why traders should be more flexible in defining an engulfing patternwith stocks compared to futures;
4. the importance of comparing the size of the two real bodies of theengulfing pattern;
5. the danger signal of a bearish engulfing pattern after a doji.
In Exhibit 3.28, the first sign of trouble was with the high-wave candlein late August. During the first two sessions of September, more troublearose with a bearish engulfing pattern. The market backed off from there,and found support at the mid-August rising gap. (we will look at howgaps become support or resistance later in this chapter.) The rally from
EXHIBIT 3.28. Bearish Engulfing Pattern as Resistance, December 1993 s&p

COCA-COLA- DAILY
4 4 6
4 4 n
4 ? 6
+3. D
+2,5
+2. 0
+1. 5
+1. 0
+0. 5
+0. D
? q E
? q n
++.5
++. D+3.5
+3. 0
+2.5
+2.0
+1 .5
+1. 0
+0.5
+0.0
39.5
39. 0
92 D7 t+ 28 q? 1t 18 TJ 08 t5 22 15 22 29
il0,'l,,oill*il|r+tlfliil
'l,,iool,ilolilt*,r\{I LongI UpperI Shadows r
t--^\
BullishEngutfingPattern
']*u
ilt t [T+hl ilt,
fu{"r*tl08
The Patterns
this gap stalled at the resistance area set up by the bearish engulfingpattern.
Exhibit 3.28 also displays how the candles can offer reversal signalsnot available to those using Western technical tools. With Western tech-nicals, there is a reversal signal called a top outside reversal session,sometimes also known as a key reversal. This occurs when prices makea new high for the move and then close lower than the previous session'sclose. Note how in the bearish engulfing pattern highlighted in theS & P was not a reversal session since the second session of this bearishengulfing pattern (i.e., the black candle) failed to make a new high forthe move. Yet, because the black candle enveloped the white candle, itwas a bearish engulfing pattern. Consequently, while no reversal patternwas revealed with western technicals, there was a reversal with candlecharts.
In Exhibit 3.29, we see how a selloff in December commenced withthe doji following the tall white candle. This area's resistance was con-
Metastock by EQUIS Int'l
EXHIBIT 3.29. Bullish Engulfing Pattern as Support, Coca Cola-Daily
79
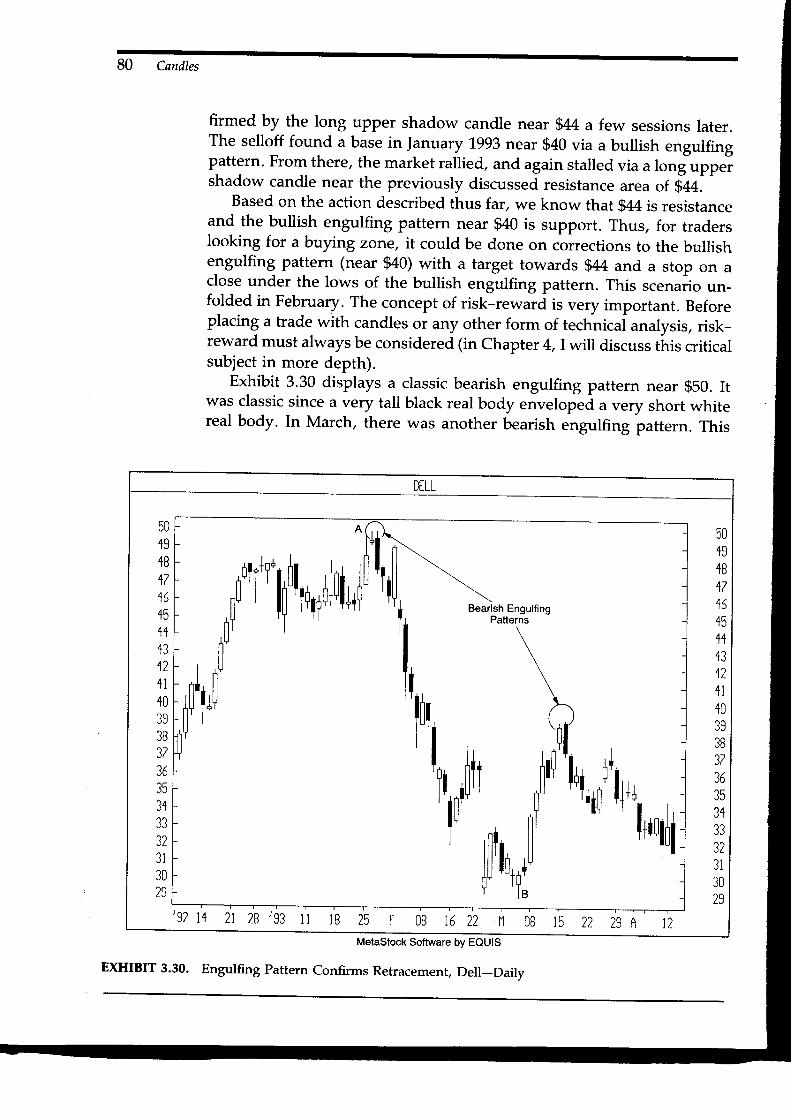
80 Candles
firmed by the long upper shadow candle near g44 a few sessions later..The selloff found a base in ]anuary 1993 near $40 via a bullish engulfingpattern. From there, the market rallied, and again stalled via a long uppershadow candle near the previously discussed resistance area of g44-
Based on the action described thus far, we know that $44 is resistanceand the bullish engulfing pattern near g40 is support. Thus, for traderslooking for a buying zone, it could be done on corrections to the bullishengulfing pattern (near $40) with a target towards $44 and a stop on aclose under the lows of the bullish engulfing pattern. This scenuiio ,rr.r-folded in February. The concept of risk-reward is very important. Beforeplacing a trade with candles or any other form of technicai analysis, risk-reward must always be considered (in Chapter 4, I will discuss tiris criticalsubject in more depth).
Exhibit 3.30 displays a classic bearish engulfing pattern near g50. Itwas classic since a very tall black real body enveloped a very short whitereal body. In March, there was another bearish engulfing pattern. This
DtLL
0B 16 22
50194B17A /1 D
45+113471 140393B17
^/JD
3531JJ
J I
3029
501918471515+1134?-11
1039383736353+33JIa 1J I
3029
' 92 11 21 28 r$ 1 l 18 25 12
Bearish EngulfingPatterns
\
im, \l"l^
i** :il|'1,,0*ilit,,fil'uloi*,g+*11**,,,,.,
,rilrro*Ll,''�Yr+in;iljfl' T!T l a
onotT*t,;OillFfi il1ili+*+ilil'
I
iilr1'['
ril
0 B 1 5 2 2 2 9 AMetaStock Software by EQUIS
EXHIBIT 3.30. Engulfing Pattern confirms Retracement, Dell-Daily

The Patterns
one confirmed a resistance area defined by a 50o/o retracement of theselloff from A to B.
Because stocks often open relatively unchanged from the prior close(as compared to the futures market), there should be more flexibility indefining an engulfing pattern with stocks than with the more volatilefutures markets. Specifically, I still view it as an engulfing pattern if theopen of the second session of the candle pattern is the same as the closeof the first candle. This is shown in Exhibit 3.31.
Exhibit 3.32 shows an example of a bullish engulfing pattern in whichthe open and the close were about the same. The importance of thispattern was reinforced by the fact that it became support during the AprilL993 pullback.
When looking at an engulfing pattern, you should consider the rela-tive sizes of the real bodies that form the pattern. An ideal bearish en-gulfing pattern has a very large real body enveloping a small white realbody. The diminutive size of the first small body of a bearish engulfingpattern shows that the momentum of the prior rally is slackening. Thelarge black real body after this small candle then proves that the bearshave overwhelmed the bulls.
However, if there are two almost equal size candles that comprise theengulfing pattern, the market may move into a lateral band, rather thanreverse (this concept may be useful for options traders who are lookingto sell volatility). I will use Exhibit 3.33 to illustrate this important con-cept. In this deutsche mark chart, there was a bearish engulfing patternin ]uly 1992 (1. on the chart). Note how the white and black candles wereabout equal in height. The fact that they are about equal means that thebears and the bulls are about equally strong. With no clear-cut victory ofthe bears over the bulls, it should not have been unexpected to see pricesmove sideways for a few weeks. On a breakout from this engulfing pat-
r "[
l"
81
I .-''| "l Ll"Bullish Engulfing
PailernBearish Enoutfino
EXHIBIT 3.31. Engulfing Patterns Where
Patteri -
Open and Close are the Same

82 Candles
GAP_WEEKLY
t+t3+2+1+0JJ
383735?6
313332?r
30fJ
a27
+++3+2+1+039383735353+JJ
323l30292827
,92 JUi{ ruL ilJ6 StP OCI NilJ DIC '93 FtB I1RR RPR I1AY JUN ruL ilJDMetaStock by EQUIS Int'l
EXHIBII 3.32. Engulfing Pattern and Stocks, Gap-Weekly
tern's resistance band, the market stalled at another bearish engulfingpattern at 2.
The bearish engulfing pattern at 2 was more significant with its smallwhite real body and massive black real body. It was thus more likely toPresage a price turn rather than a move into a lateral environment. Thisengulfing pattern then became a resistance area.
Exhibit 3.34 displays a bearish engulfing pattern in early 1ggr. Notehow the white and black candles were about equal. As just discussed,this could mean a period of consolidation; this is what unfolded as pricesmoved into a lateral trading band. The highs of this bearish engulfingpattern set up a resistance area that was confirmed by a long uppershadow. Another bearish engulfing pattern appeared in octobet iggz.Because the october bearish engulfing pattern had a very large black realbody and a small white one, it was more important than the prior en-gulfing pattern. Even more portentous with the october engulfing pat-tern was that it followed a doji. Specifically, if there is a bearish engulfingpattern that follows a doji, it is viewed as being a particularly bearishcombination.
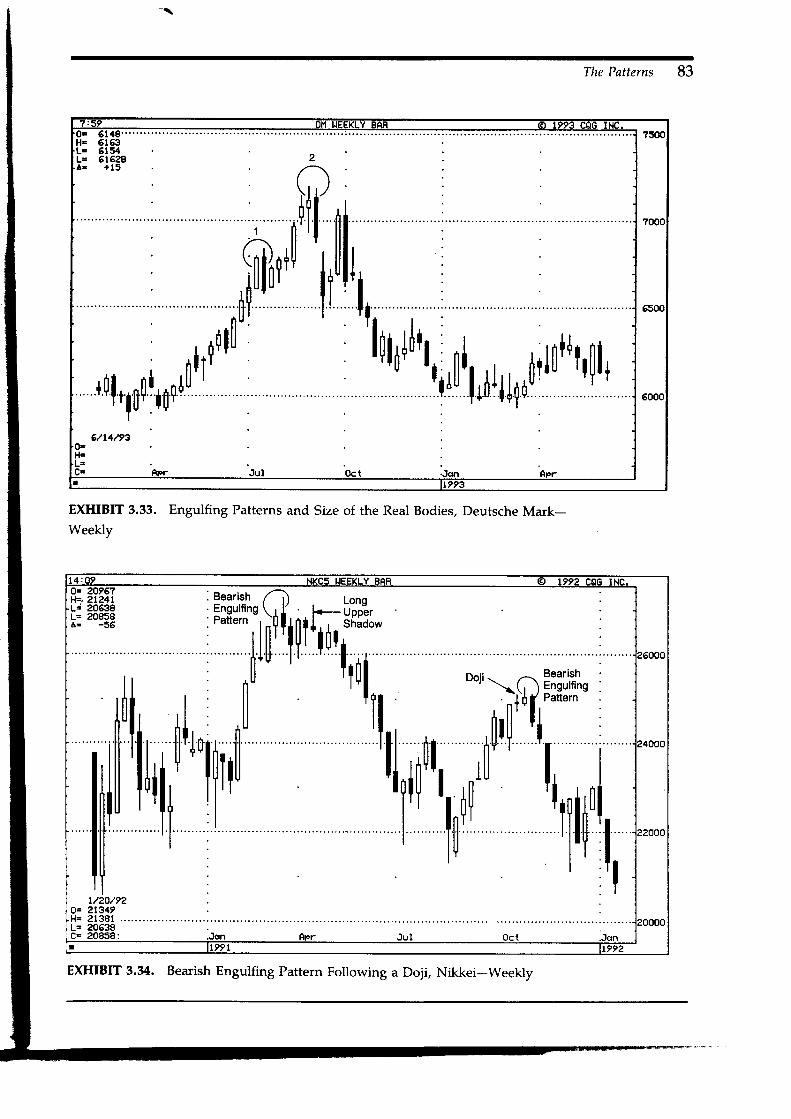
The Patterns 83
EXHIBIT 3.33. Engulfing Patterns and Size of the Real Bodies, Deutsche Mark-Weekly
O= 20967H=,21241L= 20638L= 2O958A= -56
EXHIBIT 3.34. Bearish Engulfing Pattern Following a Doji, Nikkei-weekly
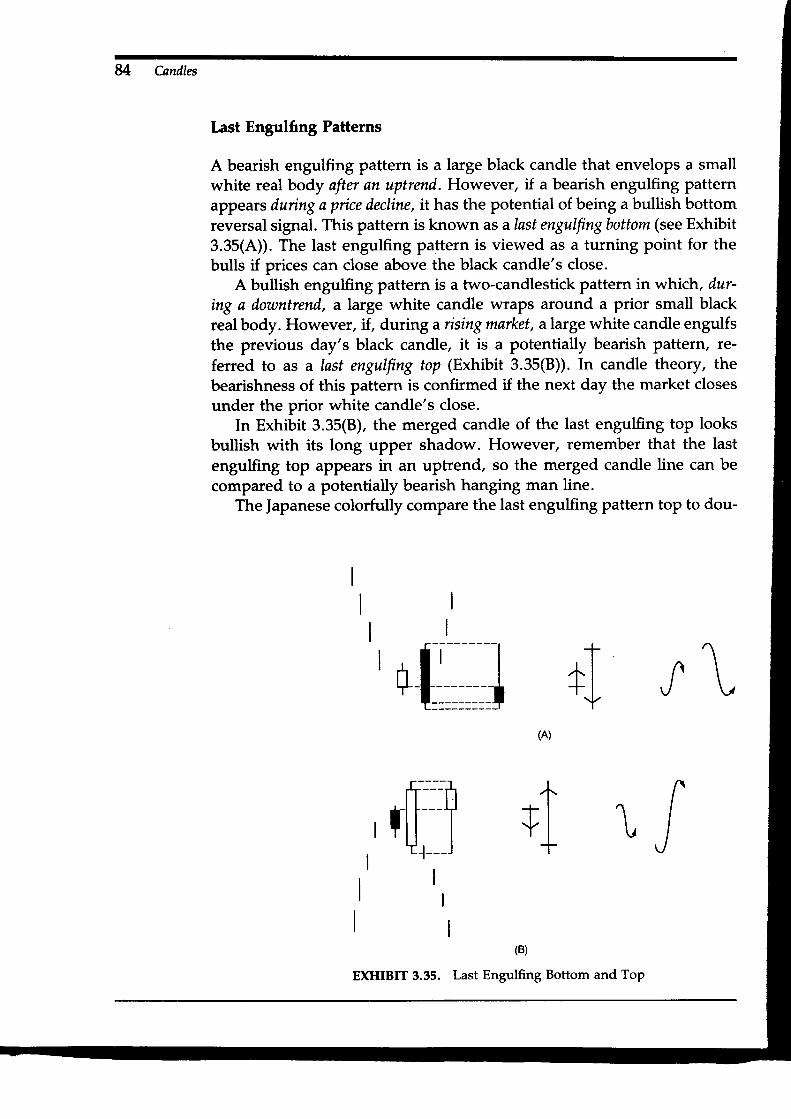
U C-andles
Last Engulfing Patterns
A bearish engulfing pattern is a large black candle that envelops a smallwhite real body after an uptrend. However, if a bearish engulfing patternappears duing a price decline, it has the potential of being a bullish bottomreversal signal. This pattern is known as a last engulfingbottom (see Exhibit3.35(A)). The last engulfing pattern is viewed as a turning point for thebulls if prices can close above the black candle's close.
A bullish engulfing pattern is a two-candlestick Pattern inw}":rich, dur-ing a downtrend, a large white candle wraps around a prior small blackreal body. However, if, during a rising market, a large white candle engulfsthe previous day's black candle, it is a potentially bearish pattern, re-ferred to as a last engulfing top (Exhibit 3.35(8)). In candle theory, thebearishness of this pattern is confirmed if the next day the market closesunder the prior white candle's close.
In Exhibit 3.35(8), the merged candle of the last engulfing top looksbullish with its long upper shadow. However, remember that the lastengulfing top appears in an uptrend, so the merged candle line can becompared to a potentially bearish hanging man line.
The |apanese colorfully compare the last engulfing pattern top to dou-
, r \
(B)
EXHIBIT 3.35. Last Engulfing Bottom and Top
{
(A)
++l
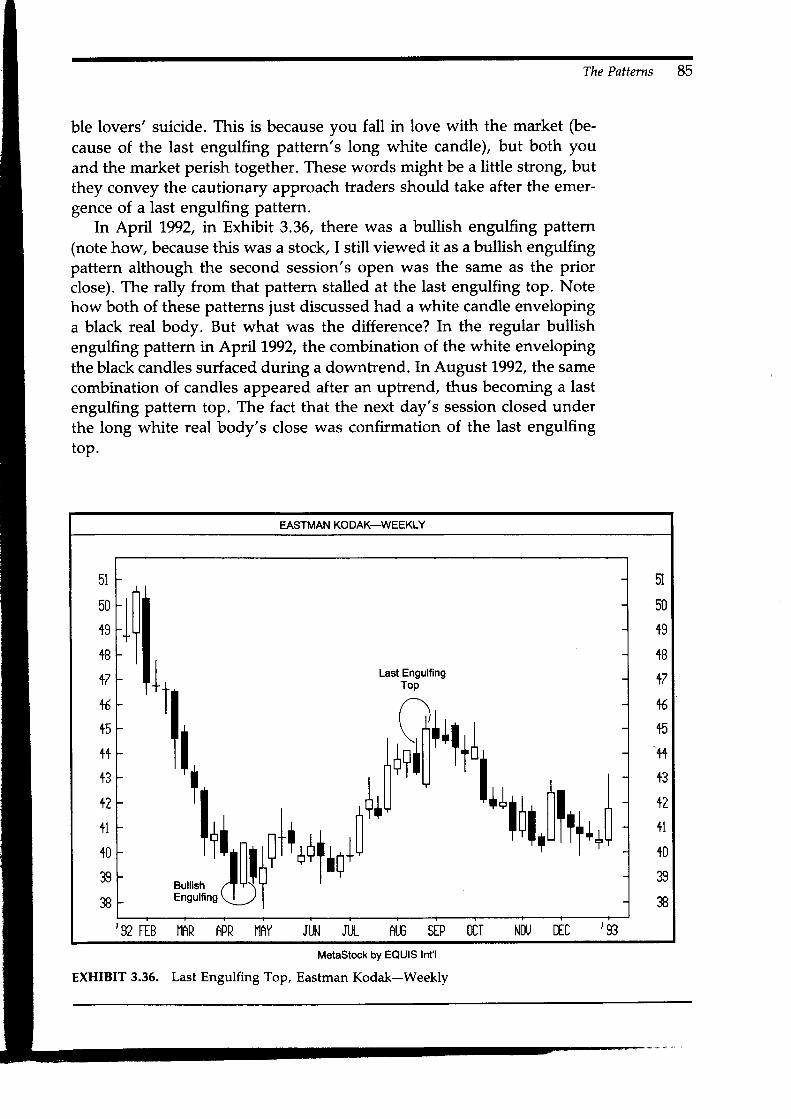
The Patterns
ble lovers' suicide. This is because you fall in love with the market (be-cause of the last engulfing pattern's long white candle), but both youand the market perish together. These words might be a little strong, butthey convey the cautionary approach traders should take after the emer-gence of a last engulfing pattern.
In April 1992, in Exhibit 3.36, there was a bullish engulfing pattern(note how, because this was a stock, I still viewed it as a bullish engulfingpattern although the second session's open was the same as the priorclose). The rally from that pattern stalled at the last engulfing top. Notehow both of these patterns just discussed had a white candle envelopinga black real body. But what was the difference? In the regular bullishengulfing pattern in April 1992, the combination of the white envelopingthe black candles surfaced during a downtrend. In August 1992, the samecombination of candles appeared after an uptrend, thus beco-i.g a lastengulfing pattern top. The fact that the next day's session closed underthe long white real body's close was confirmation of the last engulfingtoP.
MetaStock by EQUIS Int'l
EXHIBIT 3.35. Last Engulfing Top, Eastman Kodak-Weekly
85
EASTMAN KODAK-WEEKLY
I Last Engulfing
Bull ish /TV\TEnsullins\|, I
'92 ttB fthR ApR flRY JUN Jr.[-
50
+9+B+7+6+5+++3+2+1+0393B
51
50
19
+B+7+5+5+++3+2+1+0?q
3B
AIS StP OCT NDU DTD 93

86 Candles
EXHIBIT 3.37. Last Engulfing Bottom, fune 1993 Bonds-Daily
In Exhibit 3.37, a bearish engulfing pattern arose at April's price peak.Prices then descended, finding support at the bottom of the tall whitecandle. This support was tested in late April with a black candle wrappingaround a white real body. This had the shape of a bearish engulfingpattern, but it appeared during a downtrend. As such, it became a bullishlast engulfing bottom.
In Exhibit 3.38, at the September lows, there was a last engulfingbottom. One of the more interesting aspects of this chart is that thevolume on the long black candle session was unusually high. This couldbe viewed as a selling climax. This increased the chance that the lastengulfing pattern was a bottom reversal.
Harami
The harami is comprised of a long real body and a small real body withinits range. The harami is the reverse of an engulfing line. Whereas in anengulfing pattern there is a long candle engulfing the previous real body,a harami is an unusually long real body followed by a very small realbody.
After a downtrend, the emergence of a harami shows, as expressedin Japan, that "the decline is exhausting itself." A harami, after an ad-
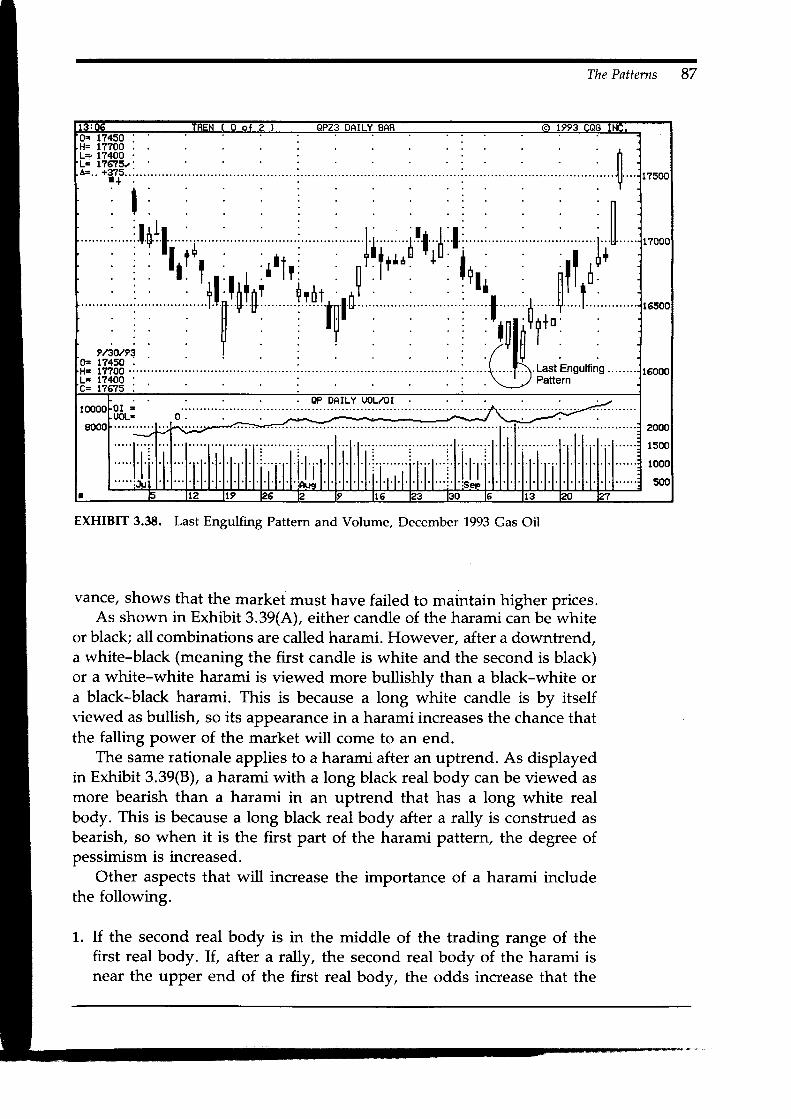
The Patterns 87
EXHIBIT 3.38. Last Engulfing Pattern and Volume, December 1993 Gas Oil
vance/ shows that the market must have failed to maintain higher prices.As shown in Exhibit 3.39(,4,), either candle of the harami can be white
or black; all combinations are called harami. However, after a downtrend,a white-black (meaning the first candle is white and the second is black)or a white-white harami is viewed more bullishly than a black-white ora black-black harami. This is because a long white candle is by itselfriewed as bullish, so its appearance in a harami increases the chance thatthe falling power of the market will come to an end.
The same rationale applies to a harami after an uptrend. As displayedin Exhibit 3.39(8), a harami with a long black real body can be viewed asmore bearish than a harami in an uptrend that has a long white realbody. This is because a long black real body after a rally is construed asbearish, so when it is the first part of the harami pattern, the degree ofpessimism is increased.
Other aspects that will increase the importance of a harami includethe following.
t. If the second real body is in the middle of the trading range of thefirst real body. If, after a rally, the second real body of the harami isnear the upper end of the first real body, the odds increase that the
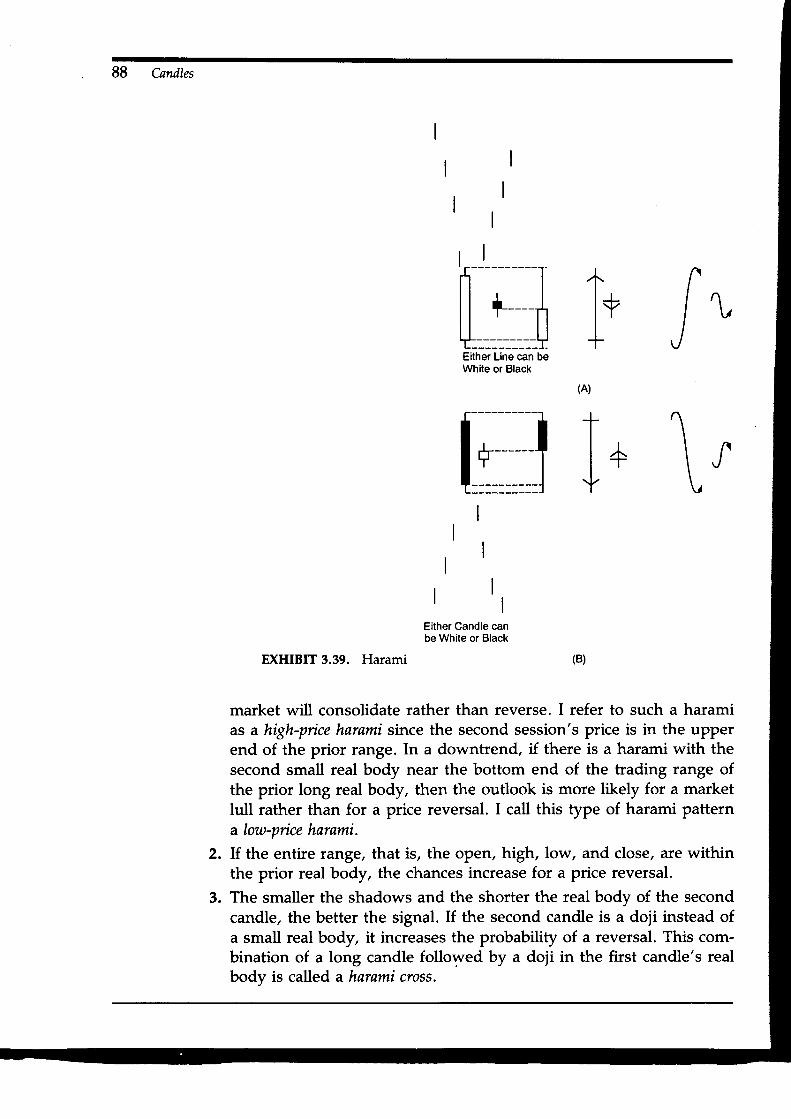
88 C.andles
I,\ ,
Either Candle canbe White or Black
EXHIBIT 3.39. Harami
market will consolidate rather than reverse. I refer to such a haramias a high-price haraml since the second session's price is in the upperend of the prior range. In a downtrend, if there is a harami with thesecond small real body near the bottom end of the trading range ofthe prior long real body, then the outlook is more likely for a marketlull rather than for a price reversal. I call this type of harami patterna lout-pice harami.
If the entire range, that is, the open, high, low, and close, are withinthe prior real body, the chances increase for a price reversal.
The smaller the shadows and the shorter the real body of the secondcandle, the better the signal. If the second candle is a doji instead ofa small real body, it increases the probability of a reversal. This com-bination of a long candle followed by a doji in the first candle's realbody is called a harnmi cross.
FIf i l
_____-_-_!Line can beor Black
r.--l-
LEitherWhite
(A)
tl +
Y

DOW CHEMICAL_ DAILY
59.559.058.558. D52.5v.D56.555.0s.5s,0E 4 E
5+.053.553052. 552. D6't E
51. 050.550.0+$5
s.5a 058.55&Dy.5fr,0K 555.054555.05+.55+. D53553.052552051. 551.050550.04 a q
' 92 DTD 93 FE nftR
Harami
Ir"'"1/',,r*,,phPR ilhY
The Patterns
Some fapanese literature refers to harami as transition periods in themarket. This means that if a harami in an uptrend is exceeded, it isviewed as a bullish continuation signal. If the price closes under the lowof the harami session in a downtrend, then expect more selling pressure.
Exhibit 3.40 illustrates how a rally that started with November'sbullish engulfing pattern hesitated at a harami in December. This haramihad two aspects that increased its reliability: the second day's small realbody was almost in the middle of the first real body, and the entire rangeof the second session (including the shadows) was within the real bodyof the first session. It is interesting how the same scenario unfolded inFebruary. Again, a rally began from a bullish engulfing pattern, and thenagain stalled with a classic harami. With the harami, as the japanesewould say, "a crack has entered the market." A shooting star a fewsessions after the February harami was also a bearish upthrust in whichthe market made a new high, but the bulls failed to hold these highs.(Although the shooting star session had a real body within the prior long
MetaStock by EQUIS Int'l
D(HIBIT 3.40. Harami, Dow Chemical-Daily
89
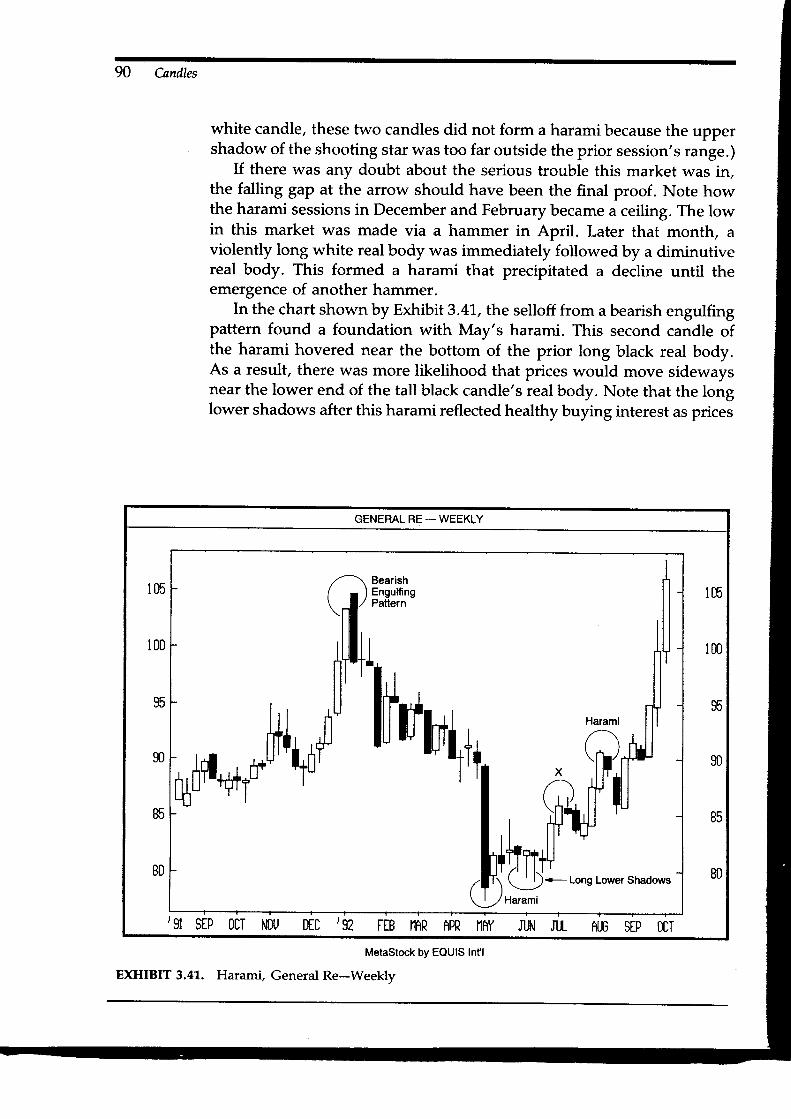
90 Candles
white candle, these two candles did not form a harami because the uppershadow of the shooting star was too far outside the prior session's range.)
If there was any doubt about the serious trouble this market was in,the falling gap at the arrow should have been the final proof. Note howthe harami sessions in December and February became a ceiling. The lowin this market was made via a hammer in April. Later that month, aviolently long white real body was immediately followed by a diminutivereal body. This formed a harami that precipitated a decline until theemergence of another hammer.
In the chart shown by Exhibit 3.41, the selloff from a bearish engulfingpattern found a foundation with May's harami. This second candle ofthe harami hovered near the bottom of the prior long black real body.As a result, there was more likelihood that prices would move sidewaysnear the lower end of the tall black candle's real body. Note that the longlower shadows after this harami reflected healthy buying interest as prices
GENERAL RE - WEEKLY
lm 105
IDD 100
atr qE
90 90
85 85
80 80
'91 stp oDI hffiJ DEC ,92 FTB IfiR hPR NAY
fii***'frrr*41d-il+l*u,nil
lt'ot*t
Jr,ht Jr.[- flJ6 stp DDIMetastock by EQUIS lnt'l
EXHIBIT 3.41. Harami, General Re-Weekly

The Patterns 91
EXHIBIT 3.42. Harami and the Size of the Second Real Body, November 1992
Heating Oil
got near $80. The pattern marked X was not a harami because the whitereal body was not unusually long. For a harami, the first real body hasto be very long relative to the preceding bodies. Another harami appearedin early August, but after an initial setback, prices exceeded the haramiso the trend resumed higher.
Exhibit 3.42 shows two examples of harami in which the open, high,low, and close of the second real body are within the first real body. TheOctober harami pattern was more important because of the extremelyshort real body. Its small size made it like a doji session. Thus, October'sharami could be viewed as a harami cross. The series of three long blackreal bodies (labeled 1.,2, and 3) following October's harami underscoredthe inherent weakness of the market.
In Exhibit 3.43, in February 1992, we see how a support area (whichincluded a hammer) formed within a $19.00-$19.50 area. Based on theaxiom that old support becomes resistance (the change of polarity prin-ciple), we would expect $19.00-$19.50 to become resistance. That is whatdeveloped as this resistance was first confirmed by a shooting star. Fromthere, the market descended until the piercing pattern occurred. Anotherassault at the $19.00-$19.50 resistance area materialized in Muy. At thattime, a harami pattern was followed by a dark cloud cover. Another failed

92
AST _ DAILY
n"02 . 5a . D205n 019. 519. 018. 518.0t 7 . 5t 7 . 015. 515.015. 515. 0r+.5t 4 n
22,021. 52r. 020.520.019.519.018.518. 0t 7 E
l / .015. 515. 015. 515. 0t 4 6
1+. 0' 9 2 1 0 t 8 2 + na I b 05 l 3 2D 27 t l 1B 25 D8 15
rr,illr,*il'l/!il"ri10,,.,,SLTt"n /";{ffi"ud cover
Support Zone Resistance Zone Aa-',
irntiu, rrr ;il'l!fi.''oilil'TT'l+llil' l*[ll,*il*++o 'u
oPiercingPattern
Hammer 'ffiiil.Il ' -
l.MetaStock by EQUIS Int'l
EXHIBIT 3.43. Harami Confirming a Resistance Zone, AST-Daily
attack at the resistance in late May occurred via a long upper shadowcandle (this candle was not a shooting star because it did not appear aftera rally).
As discussed before, the ideal harami pattern has the second session'sreal body in the middle part of the first candle. However, if during anuptrend the second candle hovers near the top of the prior candle (i.e.,a high-price harami), the chances increase for a consolidation rather thana price reversal. In Exhibit 3.M, we see how several high-price harami(marked 1 through 3) developed from early |une through late ]uly. Aftereach of these, the market consolidated for at least a week before movingout of the trading range. This chart brings out another use of a high-priceharami (or a low-price harami in a downtrend)-option traders can con-sider selling volatility. This is because after a high-price harami in anuptrend or a low-price harami in a downtrend, a trader could expect thatthe market posture may temporarily settle into a lateral band from apreviously strong trend. This could mean a decline in volatility.

The Patterns 93
EXHIBIT 3.44. Harami with Second Candle Near Top of Prior Candle, September
1993 Bonds
THE WINDOW
The window, also known as disjointed candles, is one of the more pow-erful candlestick patterns. As shown in Exhibit 3.45(A) and (B), a windowis the same as a gap in the West. That is, for a rising window, the topof yesterday's upper shadow should be under the low of the today'slower shadow. A falling window means that the low of yesterday's ses-sion (i.e., the bottom of the lower shadow) is above the top of today'supper shadow. Windows are a good visual clue because they clearlydisplay that the action and market sentiment is so one-sided.
In a talk I gave before a group of traders, I mentioned how, based onmy experiences, the window was a candle tool that I have found to workwell. After I mentioned this, a trader in the audience told me that heused to work at a Japanese bank. After my explanation of the importanceof windows, he said that he then understood why the )apanese tradersat the bank would routinely go to the charts looking for gaps-sometimeseven going back years to find one. This comment reinforced what I havefound to be true about the windows-it is a candle technique not to beignored.

94 Candles
Upper shadow of (1)does not touch lowershadow of (2)
r l t t l\____ _____{g_ l#__,_Hl"#.,?i"
f Ft';-------1-Bottom ofwindow
I
Close above bottomof window keepsuplrend intact
(A) Rising Window
Close under topol window keeps
Lower shadow of (1)does not touch uppershadow of (2)
Irop of Iwindow I
l t +alT
EXHIBIT 3.45. Rising and Falling windows (B) Falling window
Windows are continuation patterns in which the market resumes thetrend taken before the continuation pattern emerged. Thus, after a risingwindow, which is a bullish continuation pattern, the prior uptrend shouldcontinue. A falling window has bearish implications since it means theprior trend, in that case down, should resume.
There is a saying used in Japan about windows, "The reaction willgo until the window." In other words, the window should be the limiton a reaction. Thus, for a rising window, reactions (i.e., selloffs) shouldstop within the window. For a falling window, rebounds (i.e., rallies)should stop within the window.
when using windows as support and resistance, it should be notedthat the price may fall below the bottom of a rising window or above thetop of a falling window temporarily before prices move back in the di-rection of the window. This is illustrated in Exhibit 3.45(A) and (B).
A general rule that I have found useful based on my experience isthat if the price closes through the window, I then view the prior trendas being voided. For example, if there is a rising window between g83and $85 and then the market closes under the bottom of the window(i.e., under $83), the uptrend can be considered as over. Conversely, ifthere is a falling window between $62 and $60, once the bulls close the

The Patterns
market above the top of this window (at $62), then the bulls have brokenthe back of the bear market.
Based on the discussion above, an intra-session move under a risingwindow (or above a falling window) is not proof of a break. The conse-quence of this is that you should wait for the market to close under thebottom of a rising window (or above the top of a falling window) toconfirm that the uptrend is over (or that the downtrend has been voided).On a weekly chart, you should wait for a weekly (that is, a Friday) closeunder the bottom of the window to say that a window's support hadbeen broken. The risk in waiting for a close to confirm the break of awindow is that, by the time this happens, the market may be sharplyhigher or lower than you may have wanted to risk.
In this section, I will discuss:
95
1.
2 .
3 .
4.
J .
waiting for a closing price to confirm the break of a window's supportor resistance area;
how volume can influence the importance of a window;
using windows to confirm a trend reversal;
how windows can provide a quick clue to the market's health;
waiting for three sessions for confirmation of a window;
EXHIBIT 3.45. Intra-Session Break of a Window, December 1993 S&P
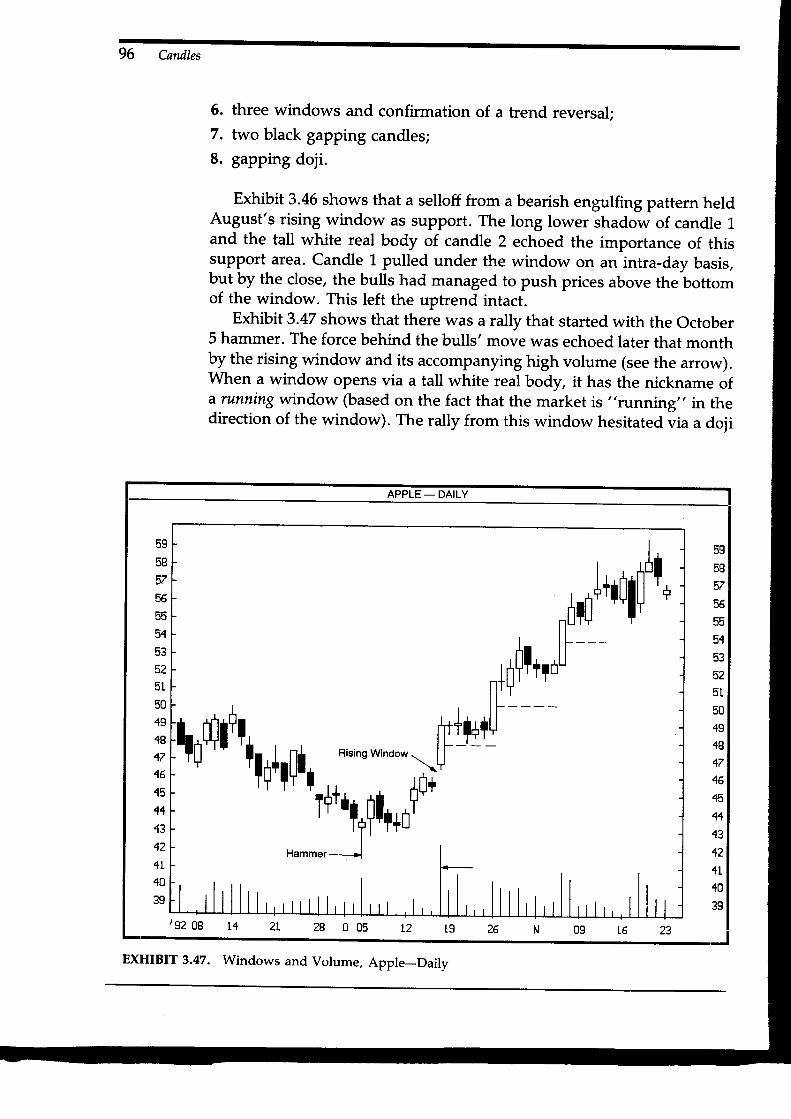
96 Candles
6. three windows and confirmation of a trend reversal;7. two black gapping candles;8. gapping doji.
Exhibit 3.45 shows that a selloff from a bearish engulfing pattern heldAugust's rising window as support. The long lower shadow of candle 1and the tall white real body of candle 2 echoed the importance of thissupport area. Candle 1 pulled under the window on an intra-day basis,but by the close, the bulls had managed to push prices above the bottomof the window. This left the uptrend intact.
Exhibit 3.47 shows that there was a rally that started with the October5 hammer. The force behind the bulls' move was echoed later that monthby the rising window and its accompanying high volume (see the arrow).ItVhen a window opens via a tall white real body, it has the nickname ofa running window (based on the fact that the market is "running" in thedirection of the window). The rally from this window hesitated via a doji
APPLE - DAILY
59
58
57
56
55
51
53
5?51
50
4S.18
4716
45
11
43
42
1L40
3S
lm;il*r-
ntltfrutt ttl+lt[],
, *,"'nn wnoow .l,, , ,T++rlrfh*Jf,*
Hammer-
5S
58
57
56
55
54
53
525l
50
4S48
4716
45
11
13
42
4 t40
3S'g2 oB L4 2 8 0 0 5 L2 t9 09 23
EXHIBIT 3.47. Windows and Volume, Apple_Daily

The Patterns
after the tall white candle. The fact that the pullback from this doji held
support at 50o/o of the white body (see the dashed line) showed the Powerof the bulls to support the market. Note how, as the market ascended,the midpoint of the tall white candles became support.
Exhibit 3.48 illustrates how fune's dark cloud cover short-circuited the
prior rally. The sell-off from this pattern found a floor at April's window.
Other aspects of this chart are interesting. The low of |une's price declinewas a harami. This harami appeared within the support band, as Pre-dicted by the window. This same combination of a harami within thewindow also emerged in Muy. Notice how the fune rebound from the
window stalled at the resistance area set uP by the dark cloud cover.A shooting star is potentially bearish, but what if the shooting star
session also forms a rising window-which is bullish? In Exhibit 3.49, we
see that such a scenario unfolded as in mid-January. After the shootingstar line appeared, I was asked by a client whether this was a sell signal(the client knew that a shooting star was normally a bearish signal). I
pointed out that while this was indeed a bearish shooting star, there wasanother aspect that was perhaps even more important-the rising win-
dow. I suggested to this client that if he wanted to sell short, he should
wait for the market to close under the bottom of the window to confirmthat the uptrend was over. Since the bears could not pulI prices under
97
EXHIBIT 3.48. Window as Support, September 1993 fapanese Yen
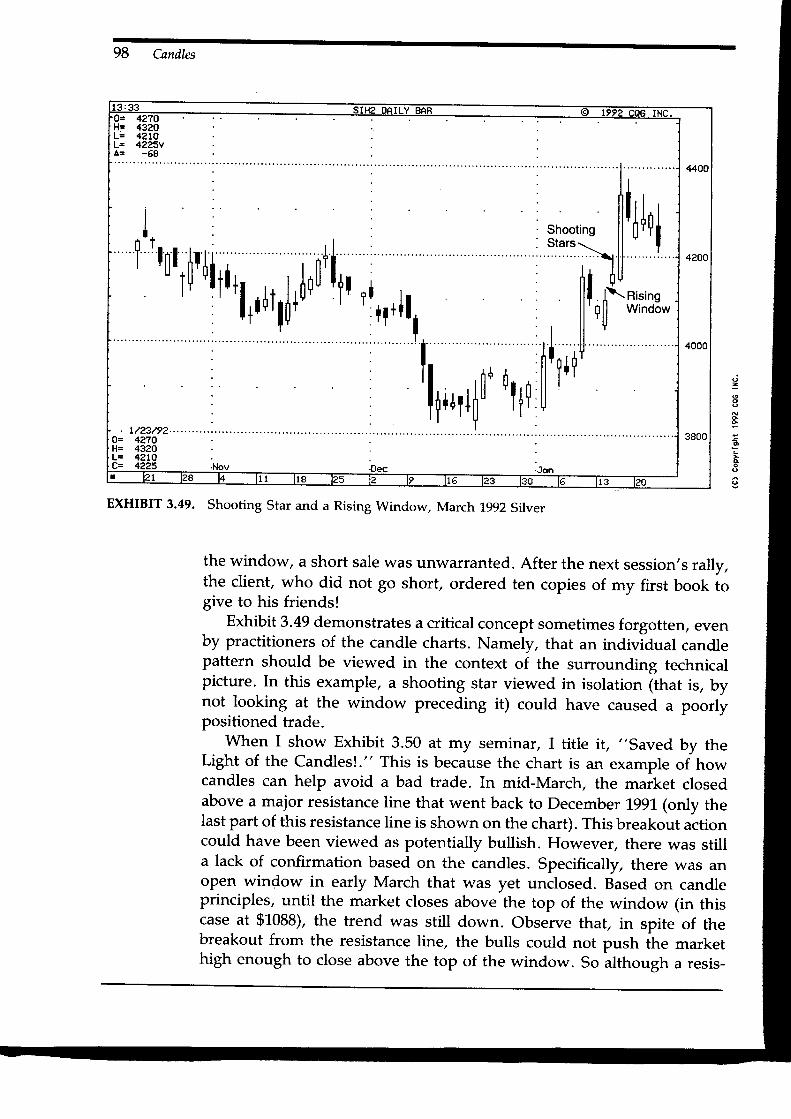
98 &ndles
-o
o6
the window, a short sale was unwarranted. After the next session's rally,the client, who did not go short, ordered ten copies of my first book togive to his friends!
Exhibit 3.49 demonstrates a critical concept sometimes forgotten, evenby practitioners of the candle charts. Namely, that an individual candlepattern should be viewed in the context of the surrounding technicalpicture. In this example, a shooting star viewed in isolation (that is, bynot looking at the window preceding it) could have caused a poorlypositioned trade.
when I show Exhibit 3.50 at my seminar, I title it, "saved by theLight of the Candles!." This is because the chart is an example of howcandles can help avoid a bad trade. In mid-March, the market closedabove a major resistance line that went back to December 1991 (only thelast part of this resistance line is shown on the chart). This breakout actioncould have been viewed as potentially bullish. However, there was stilla lack of confirmation based on the candles. Specifically, there was anopen window in early March that was yet unclosed. Based on candleprinciples, until the market closes above the top of the window (in thiscase at $1088), the trend was still down. observe that, in spite of thebreakout from the resistance line, the bulls could not push ihe markethigh enough to close above the top of the window. so although a resis-
EXHIBIT 3.49. shooting star and a Rising window, March 1992 silver
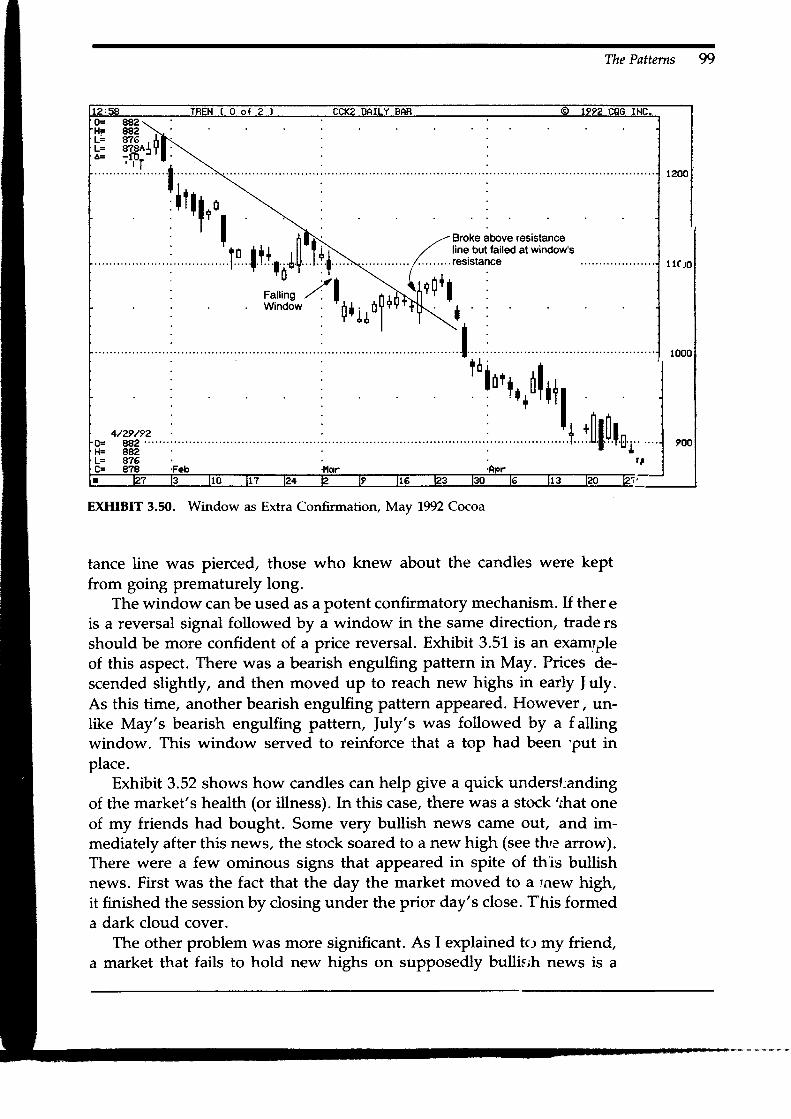
The Patterns 99
1.*�'.irilrfi+,orflh.}
nfi"-4t*,,,itr nfr+;0r+r+
:
EXHIBIT 3.50. Window as Extra Confirmation, May 1992 Cocoa
tance line was pierced, those who knew about the candles were keptfrom going prematurely long.
The window can be used as a potent confirmatory mechanism. If thereis a reversal signal followed by a window in the same direction, trade rsshould be more confident of a price reversal. Exhibit 3.51 is an examrpleof this aspect. There was a bearish engulfing pattern in May. Prices de-scended slightly, and then moved up to reach new highs in early I uly.As this time, another bearish engulfing pattern appeared. However, ur-like May's bearish engulfing pattern, July's was followed by a f allingwindow. This window served to reinforce that a top had been 'put inplace.
Exhibit 3.52 shows how candles can help give a quick underst;andingof the market's health (or illness). In this case, there was a stock rrhat oneof my friends had bought. Some very bullish news came out, and im-mediately after this news, the stock soared to a new high (see thre 6so*;.There were a few ominous signs that appeared in spite of this bullishnews. First was the fact that the day the market moved to a rnew high,it finished the session by closing under the prior day's close. This formeda dark cloud cover.
The other problem was more significant. As I explained to my friend,a market that fails to hold new highs on supposedly bullisrh news is a
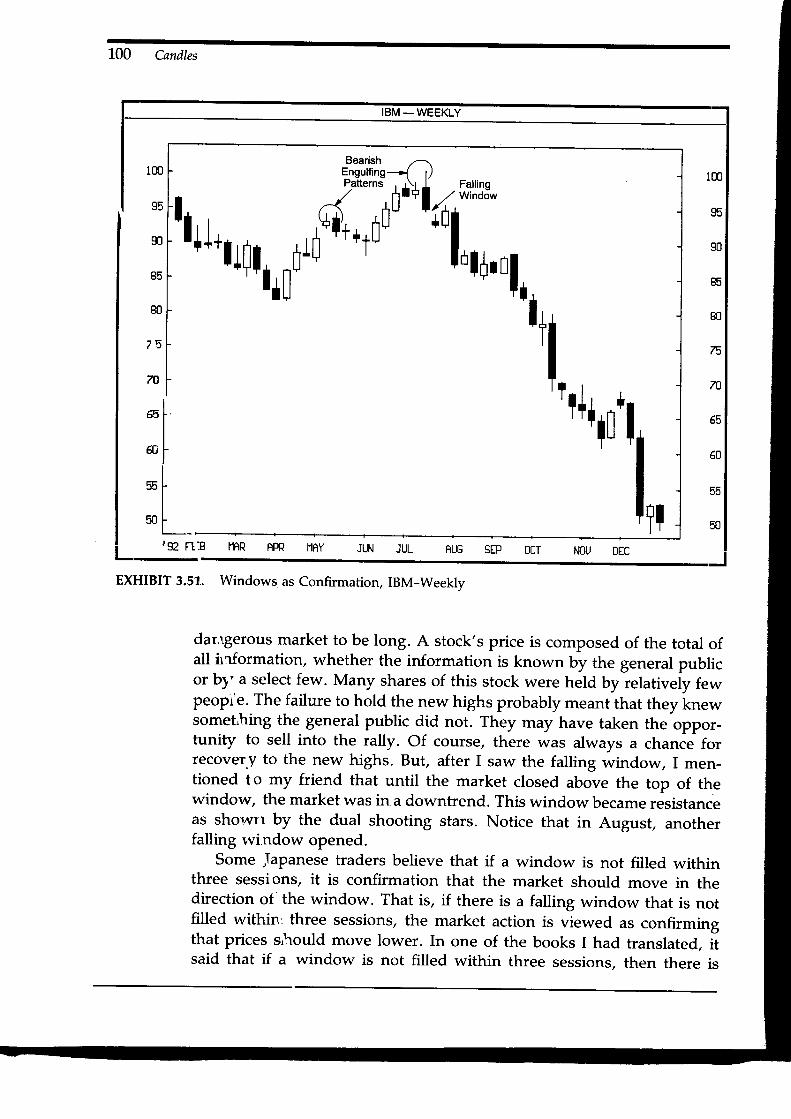
IBM _ WEEKLY
I
IrI
LI
L-' gz I
ll,=,llll,,[il,
I t . t s
Fqli,,'*l,r{+ril*1,,
L00 Candles
EXHIBIT 3.51. Windows as Confirmation, IBM-Weeklv
dar,rgerous market to be long. A stock's price is composed of the total ofall irrformation, whether the information is known by the general publicor b1'a select few. Many shares of this stock were held by relatively fewpeopi'e. The failure to hold the new highs probably meant that they knewsomet,hing the general public did not. They may have taken the oppor-tunity to sell into the rally. of course, there was always a chance fo,recover.y to the new highs. But, after I saw the falling window, I men-tioned to my friend that until the market closed above the top of thewindow, the market was in a downtrend. This window became resistanceas showrr by the dual shooting stars. Notice that in August, anotherfalling r,vi.ndow opened.
Some ,Tapanese traders believe that if a window is not filled withinthree sessions, it is confirmation that the market should move in thedirection oI'the window. That is, if there is a falling window that is notfilled within: three sessions, the market action is viewed as confirmingthat prices should move lower. In one of the books I had translated, itsaid that if a window is not filled within three sessions, then there is

The Patterns 101
DAXRO - DAILY
l,,,4,oiltu
lf ,/* -""ils s'�""
, il*1oil' '1" | ,\' ,,
4lilrndl,xor' lil"u illtr-"--il"
lil l**,,il,,. oto't,,*,,01,*0,ilh1t.,"
t 0
L7.O16 .516 .0t 5 . 5
15 .014 .5t4 .0t ? 6
13 .012.512.trt l n
r .1 .0t n E
10.0s .59 . 08 . 58 . 07 . 57 . 9E 6
5 . 05 . 55 . 04 . 54 n
L7 .g16.515 .015 .515 .014 .51 4 . 013 .513 .012 .5L2 .O1 t . 51 1 . 0r n F
1 0 . 09 . 5o n8 . 58 . 07 . 5? n
5 . 56 . 05 . 55 . 04 . 54 . 0
28t 4'92 t5 13
EXHIBIT 3.52. Windows as a Mechanism for Quickly Analyzing the Market,
Daxro-Daily
power to go thirteen more sessions in the direction of the gaP. I do not
agree with the preciseness of the last part of that statement, but this
technique of waiting three sessions for confirmation may Plovide a
method to confirm a window's support or resistance.In Exhibit 3.53, there was a falling window that opened in early March.
Based on the above discussion, a method to trade with this window couldbe to wait three sessions and see if within that time the market can close
above the top of the window. If the bulls cannot push prices (on a close)above the top of the window, candle theory states that this should in-
crease the chance that the downtrend will continue. After all, the bullshad three sessions to move prices through the window and failed to do
so. In this example, we see how the falling window acted as resistance
as the bulls tried in the third session to unsuccessfully push prices above
the window. Attempts in May at this window's resistance level at 624stalled via a dark cloud cover and then a long uPPer shadow candle (at
the arrow) a few sessions later.

102 Candles
EXHIBIT 3.53. windows and waiting Three sessions, June 1993 unleaded Gas
I would be careful about putting too much emphasis on three sessions.The Japanese place much importance on the number three in their cul-ture, and this has spilled into their technical analysis. Thus, look closelyat what happens when you get a window in your market. you may findthat if the window is not filled in within two, four, or even five sessions,rather than the more traditional three sessions, it could be proof of con-tinuation of the trend predicted by the window.
Three Windows
As discussed above, the Japanese emphasize the number three. In thiscontext, the Japanese view a market that has had three rising or fallingwindows in a row as a market that has reached maturity. The market insuch a scenario is viewed as being overextended and correction is likely.Three windows are shown in Exhibit 3.54.
Besides the windows, Exhibit 3.55 is of interest because it shows ex-amples of many candle patterns. After a series of bottoming patterns inJanuary that included a high-wave candle and the morning star, the mar-ket gave final bullish confirmation with a rising window. The marketascended strongly from there until a harami pattern was formed. The

I-L
Window 1 -----'-->
The Patterns 103
iLwindow t *--- ; ----F-
ctose below
Ll_ rop window
3 Falling Windows
EXHIBIT 3.54. Three Windows
__t__ --
ir.--3 Rising Windows
correction from this harami stopped in mid-February with a successfultest of January's window. From the February lows until the dark cloudcover in early March, there were three rising windows (numbered 1', 2,and 3). The market then broke lower via a falling window. Note howthat falling window became resistance over the next few days.
As shown in the example above, if there is a bearish candle signalafter three windows, one should offset long positions. However, the
lL,-Window 2 +
window. _ _I- --
IllI Close aboveI La- Bottom:f-- window
Window 2 '-"-+
Window 3 --->
EXHIBIT 3.55. A Dark Cloud Cover After Three Windows, ]une 1993 Crude Oil
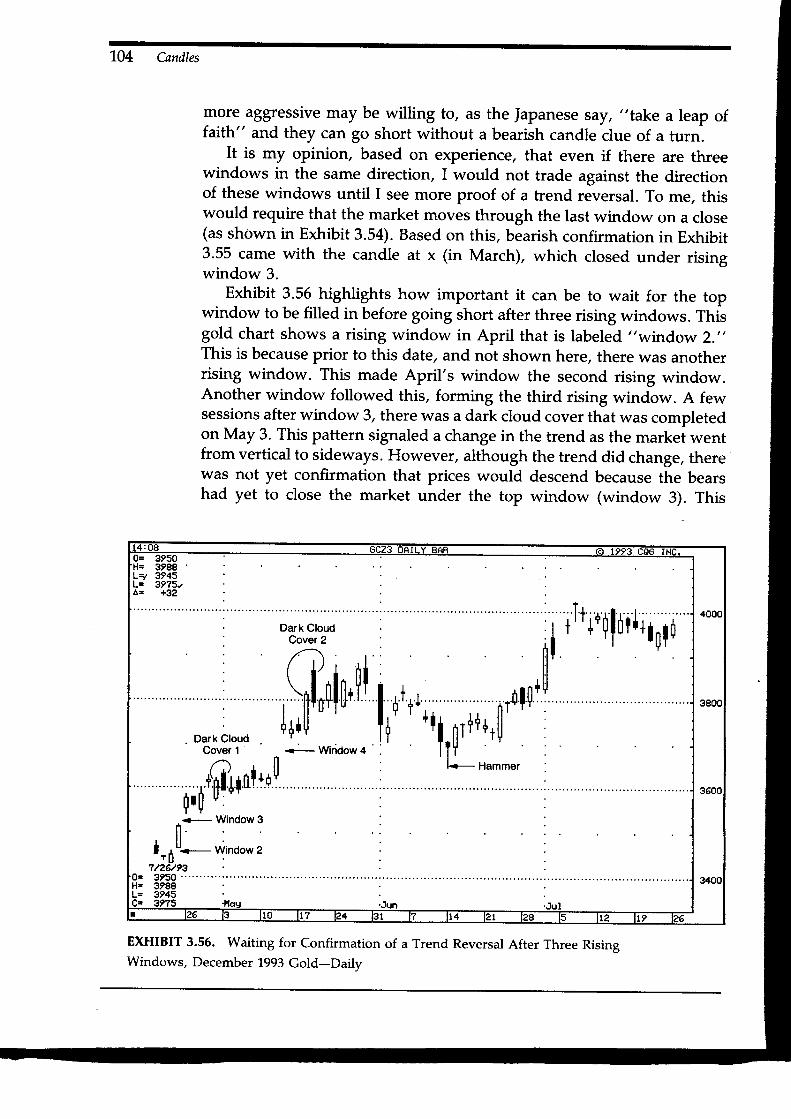
104 Candles
more aggressive may be willing to, as the Japanese say, "take a leap offaith" and they can go short without a bearish candle clue of a turn.
It is my opinion, based on experience, that even if there are threewindows in the same direction, I would not trade against the directionof these windows until I see more proof of a trend reversal. To me, thiswould require that the market moves through the last window on a close(as shown in Exhibit 3.54). Based on this, bearish confirmation in Exhibit3.55 came with the candle at x (in March), which closed under risingwindow 3.
Exhibit 3.55 highlights how important it can be to wait for the topwindow to be filled in before going short after three rising windows. Thisgold chart shows a rising window in April that is labeled "window 2."This is because prior to this date, and not shown here, there was anotherrising window. This made April's window the second rising window.Another window followed this, forming the third rising window. A fewsessions after window 3, there was a dark cloud cover that was completedon May 3. This pattern signaled a change in the trend as the market wentfrom vertical to sideways. However, although the trend did change, therewas not yet confirmation that prices would descend because the bearshad yet to close the market under the top window (window 3). This
EXHIBIT 3.55. Waiting for Confirmation of a Trend Reversal After Three RisingWindows, December 1993 Gold-Daily

The Patterns
window stayed open, and the market then continued on its upwardcourse. Interestingly, the same scenario as just discussed unfolded asanother dark cloud cover (dark cloud cover 2) formed after window 4.After dark cloud cover 2, prices again went from an uptrend into a lateralband. But the widow (number 4) remained unfilled on a close as it wassuccessfully defended by the bulls via a hammer. Note how the windowwas filled on an intra-day basis, but prices did not close under the bottomof window 4. This meant that the major uptrend was still in effect. Con-sequently, I usually recommend our clients to use three or more rising(or falling windows) at a time to offset or protect existing positions, butnot to go countertrend until the last window is filled in on a close.
Two Black Gapping Candles
\A/hile a falling window is bearish, it is even more portentous if the twocandles immediately following the window have black real bodies. Sucha combination is called two black gapping candles (Exhibit 3.57). The dualblack candles reinforce the fact that the trend has turned from up todown. This pattern is a sign, as the fapanese express it, of the "rout ofthe bulls."
The chart of Delta in Exhibit 3.58 gave a plethora of signals that it wasexperiencing trouble as it got in the $50 to $60 area. The topping signalsincluded:
1.. a bearish engulfing pattern;
2. a harami pattern;
3. an evening star;
4. a bearish engulfing pattern;
5. a bearish engulfing pattern;
6. long upper shadows, with the black candle following the white candle,forming a dark cloud cover, and for those knowledgeable about the
, Falling--L------- --/ Window
105
EXHIBIT 3.57. Two Black Gapping Candles

106 Cnndles
EXHIBIT 3.58. Two Gapping Black Candles Confirm Resistance, Delta-Daily
candle patterns, the three black candles following the white candle,forming a three-crow pattern.
The coup de grAce came with two black gapping candles in mid-Novem-ber.
In Exhibit 3.59, December's harami followed by a long black real bodywas an important warning. Also note how those three candles (that is,the two candles of the harami and the next candle) all had long uppershadows. After this group of bearish signals, there was a falling windowwith two black candles. This completed the two black gapping candles.
Gapping Doii
Exhibit 3.60 showr "d";i session that gaps lower during a decline. It issaid this is a time where selling meets more selling and thus is a bearish
il),a'"'"nwindow,rqi"1
f,ffiqfitj*f'ilo"o'
ltl , ' i l l'lillpl"o ,O|1,
ilr,r*rp'u\il
DELTA _ DAILEY
60.059 .559.058.558.057.557.055.556.055.555.054.554.053 .553 .05 t . 5
52.05 1 . 551. 050.550.013.543.048.548.017.547.O46.5
6U.059.559 .058.558.052.557.056.556.055.555.054.554 .053.553.052.552.O5 t . 551 . 050.550.049.549.048.548.047.517 .O46.5
'g2 24 14 2T L2 16 L1
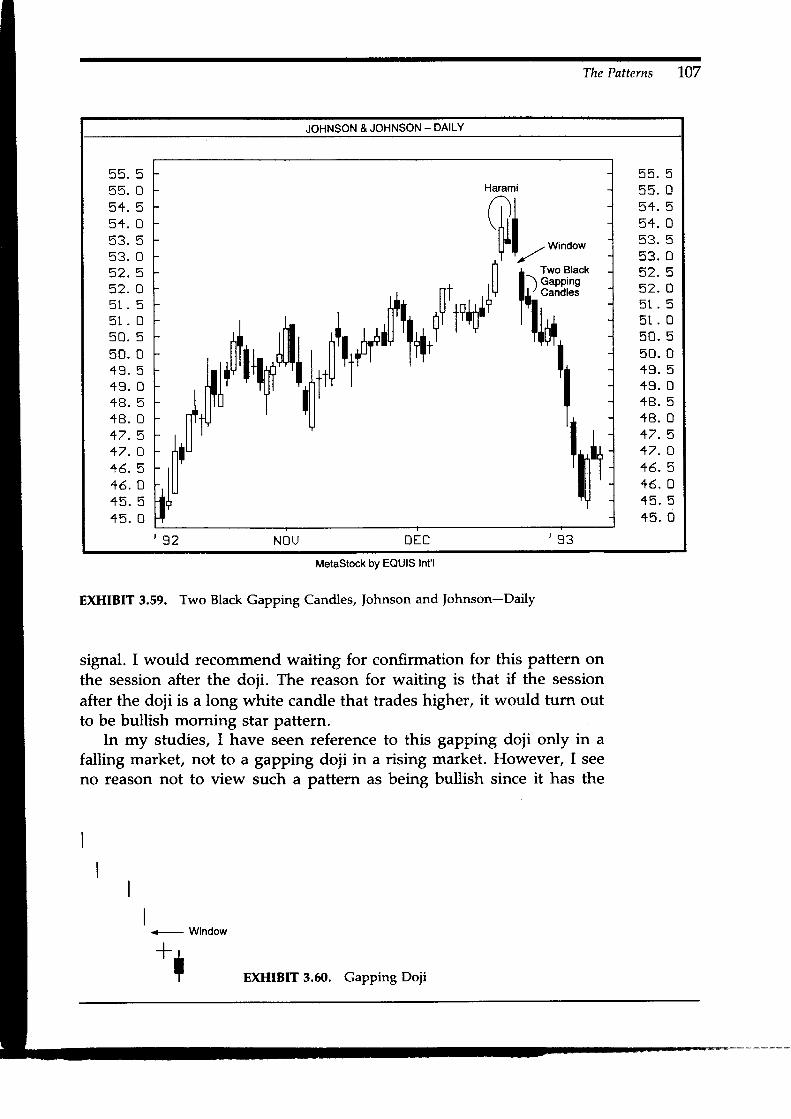
The Pntterns r07
JOHNSON & JOHNSON - DAILY
5 5 . 55 5 . 05 4 . 55 4 . 05 3 . 55 3 . D5 2 . 55 2 . 05 1 . 55 l . D5 0 . 55 0 . o4 9 . 54 3 . 04 8 . 54 8 . 04 7 . 51 7 . O4 6 . 51 6 . D4 5 . 54 5 . O
n\ililt' qfi ldt'il{rr**'*'fr
+11**,n[r
ilr'U
Harami
$L-"."-*il +u liff*.'r
ltf'
5 5 . 55 5 . 05 4 . 55 4 . 05 3 . 55 3 . O5 2 . 552. D5 r . 55 l . 05 0 . 55 0 . 04 9 . 54 9 . 04 8 . 54 8 . 01 7 . 51 7 . O1 6 . 54 5 . D4 5 . 54 5 . O
' 9 2 NOU D E C , 3 3
Metastock by EQUIS Int'l
EXHIBIT 3.59. Two Black Gapping Candles, |ohnson and |ohnson-Daily
signal. I would recommend waiting for confirmation for this pattern onthe session after the doji. The reason for waiting is that if the sessionafter the doji is a long white candle that trades higher, it would turn outto be bullish morning star pattern.
In my studies, I have seen reference to this gapping doji only in afalling market, not to a gapping doii in a rising market. However, I seeno reason not to view such a pattern as being bullish since it has the
II
I
+- Window
* ,
I ExHIBIT 3.00. Gapping Doji

108
requisite rising window. In such a scenario, I would also prefer to waitfor a higher session on the day following the doji. This is because thedoji could be a sign of a tired market and if a white candle followed thisdoji it would show that the market would then be refreshed.
As discussed in the section on doji, a doji after an uptrend or a tallwhite candle could be potentially bearish. However, I would view thefact that if a doji gaps higher, some of the potentially bearish implicationsof the doji are negated because the rising window shows the underlyingstrength of the market.
As shown in Exhibit 3.61, the doji at session 1 did not gap lower (thatis, the high of doji session 1 was above the low of the prior session).Because of this, doji 1 is not a classic gapping doji, although the marketcame so close to opening a falling window with doji l that I still viewedit as a gapping doji. Interestingly, the next session (at doji 2) the marketdid form a gapping doji. A sign of further weakness arose when thehammer and bullish engulfing pattern at 3 failed to hold as support whenprices closed under the support area set up by the bullish engulfingpattern. At 4 the market gave an important bearish signal via the fallingwindow.
The gapping doji is a rare pattern, but in Exhibit 3.62 there is a fallingcandle line with a small real body. While not a doji session, it could be
EXHIBIT 3.51. Gapping Doji, March 1994 Notionnel Bond

The Patterns 109
IBM - DAILY
56
55
51
53
3t
3 l
50
19
1B
17
16
15
11
13
12
11
ill*,t l lt a , l
/ l.i,F++""'/*.ltl*lltt*l33;''"n lui
, I- P,nl\+rJu,*
Shootino , ' l lB[T''n-,,l+ff. , q+illl
, ,.^ilh+il h*,u,,, nrlil,ru,fiftll, illttu x"""'--*Tl
Uf-o, -tiu++*
56
55
5{
53
52
5l
50
{9
1B
17
16
15
11
43
12
1 i
, 9 3 J U L RUG sip 0cI NOU
MetaStock by EQUIS Int'l
EXHIBIT 3.62. Gapping Doji, IBM-Daily
viewed as similar to a gapping doji in that the small real body is almosta doji and it gapped under the prior lows. (Even if a trader did not viewthis as a gapping doji, it could also be viewed as two black gappingcandles.) This chart has some interesting candle signals that illustratehow IBM was basing out near $40. These include the long lower shadowat candle L and a tall white real body at candle 2. A shooting star in lateAugust created problems on the rally from candle 2. The market brokeunder the lows of the mid-September hammer, but it is interesting howeasily we can see the selling pressure evaporating during this sell off (atX) by a series of gradually shrinking black real bodies. The long whitecandle at Y showed that the bulls had taken control.
THREE OR MORE CANDLE LINES
The Evening Star
As shown in Exhibit 3.63, the evening star is a three-candlestick pattern.The criteria for this pattern include an uptrending market in which a long

L10 Candles
Can be whitelf this is adoji, the patteis an evepingdoji star.
l1(2)
t,or black.
i l r" [ _
EXHIBIT 3.53. The Evening Star
white candle (candle 1 in the Exhibit) is followed by a small real body(candle 2). The small real body of the second candle line can be black orwhite and should not touch the real body of candle 1. The third candleof this pattern is a black real body that does not usually touch real body2, and then closes well into the white candle line that make up the firstcandle of this pattern. If the second candle of the evening star is a dojiinstead of a small real body, then the pattern is an etsening doji star.
In the Introduction to this book, I referred to the book written in themid-1700s entitled, The Fountain of Gold-TheThree Monkey Record of Money.In that book, reference is made to Yin and Yang markets. Yang is anotherterm for bullish (for example, a white candle is sometimes referred to asa yang line). A Yin move is a downturn. For instance, a black candle linecan be called a yin line. The Fountain of Gold has a section that reads,"When movement reaches an extreme, there is stillness. This stillnessgives rise to Yin." This is a verbal description of the evening star. Towit!
"When yang movement reaches an extreme"-the appearance of thelong white candle of the evening star pattern"There is stillness"-describes the small real body. The small realbody reflects a market at a transition phase in which the trend goesfrom up to a period of "stillness."
3. "This stillness gives rise to Yin"-aptly describes how the Yin (theblack candle) follows the stillness of the second candle line.
1 .
2.
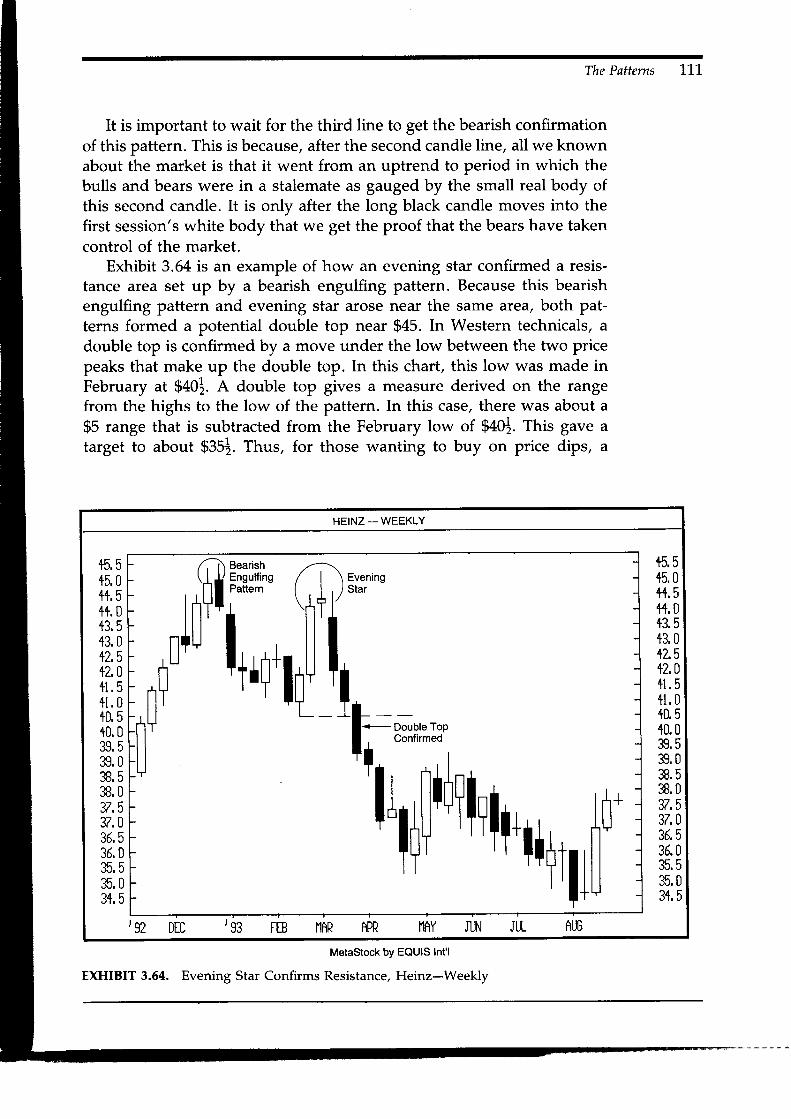
HEINZ _ WEEKLY
4 6 64 6 n4 4 6
++.04 ? E
+3. 0+2.5d.t nl L . U
41 6
+1. 04 n t r
4 n n
39. D38.538.037.532. DJb. J
36. D? 6 5
JD. U? 4 5
4 q E
ffi0++.5+1.0+3.541 n
+25+2,0+1. 5+1. 0+0.5+u039.539.038.538.032. 532.036. 536.035.5JC. U3+. 5
' gZ DID '93 FTB IlRR hR IIRY JUN
/1\ Evenins| | /S ta r
;il'I._--[. *m::''11{l**?iritr*+,ufil
l1,q*t l
iTI
BearishEngulfingPatternri$l
ilLj
JUL fiUG
The Patterns 111
It is important to wait for the third line to get the bearish confirmationof this pattern. This is because, after the second candle line, all we knownabout the market is that it went from an uptrend to period in which thebulls and bears were in a stalemate as gauged by the small real body ofthis second candle. It is only after the long black candle moves into thefirst session's white body that we get the proof that the bears have takencontrol of the market.
Exhibit 3.64 is an example of how an evening star confirmed a resis-tance area set up by a bearish engulfing pattern. Because this bearishengulfing pattern and evening star arose near the same area, both pat-terns formed a potential double top near $45. In Western technicals, adouble top is confirmed by a move under the low between the two pricepeaks that make up the double top. In this chart, this low was made inFebruary at $a012. A double top gives a measure derived on the rangefrom the highs to the low of the pattern. In this case, there was about a$5 range that is subtracted from the February low of $a01. This gave atarget to about ffi51. fhus, for those wanting to buy on price dips, a
MetaStock by EQUIS Int'l
EXHIBIT 3.54. Evening Star Confirms Resistance, Heinz-Weekly

LT2 Candles
MetaStock by EQUIS lnt'l
EXHIBIT 3.55. Evening Star as Resistance, Pfizer-Weekly
measured move target towards $3512 should be the area. We can see fromthis example how smoothly candle charts can be merged with classicWestern charting methods (e.9., the double top).
In Exhibit 3.65, I illustrate that the evening star can become resistance.As shown on this chart, November's evening star stopped the Decemberrally. I use the highest point of the three candles, that form the eveningstar-that is, the top of the highest upper shadows, as my resistance. Ifyou can withstand the risk, I would recommend using a close (ratherthan an intra-session move) above the evening star's high as a buy stop.In this case, it would require a weekly (that is, a Friday close) above thedashed line to confirm a breakout from the evening star's resistance area.
As previously discussed, there should be more flexibility in usingcandles in the stock market than in some of the other markets, such asfutures. As shown in Exhibit 3.63, the classic evening star's three realbodies should not be touching. However, because in the stock marketthe open price is usually near the prior session's close, the real bodiesmay touch. In Exhibit3.66, we see how the opening of the middle candle
PFIZER -WEEKLY
BO
I
o**ilttol* ;mrl Ress'�ance
flllll- 'f,?,,1
' "l_rilrl.r
80
75 75
70 70
65 65
bU 50
55 55
JL stp ODT N0u DTD ,93 FIB r.lftR RPR

The Patterns 113
WASTE MGMT- DAILY
35.0
35.'5
35.0
3+.5
3+.0
33. 5
33.0
32.5
32.0?t 6
31. 0
30.5
30.0
29.5
Evening Star
l' lti,ht,l35.0? 6 6
< h t l
? 4 6
3+, D? ? 6
33.0? ? 6
32, D?l 6
31, 0
30.5
30.0
,93 26 l 0 t 7 2+ D7 l + tr- I J L6
MetaStock bY EQUIS Int'l
EXHIBIT 3.55. Evening Star and Flexibility, Waste Management-Daily
of the pattern was about the same price as the prior session's close. Whilesome flexibility may be allowed with stocks in regard to the relation ofthe real bodies, it should be remembered that the more ideal the pattern,the greater the likelihood of a top.
The evening star from late August illustrated in Exhibit 3.67 is differ-ent from the more traditional evening star in that the third real body ofthis one is a small black real body rather than a long black one. However,I viewed this as an evening star variation with all the bearish implicationsof the more traditional evening star for a few reasons, which I will nowaddress:
The third candle of this evening star, although not a tall black candle,nonetheless reflected the potency of the bears by the fact that theywere able to drag prices well into the white real body of this pattern.
This evening star variation verified a resistance area. In mid-August,there was a group of bearish candle signals that included a shooting
1 .
2.

114 C-andles
EXHIBIT 3.67. Evening star and Flexibility, Natural Gas-september 1993
star, then three tall black real bodies #ter this shooting star, and thena long upper shadow of the candle of August 24. Note how all thesebearish candles emerged near 92.50 This is the level where the vari-ation of the evening star appeared.
Exhibit 3.68 shows a collapsing doji star. At a high-price level, themarket moves higher. After this, the market gaps lower via a falling doji.This is a point where selling overwhelms buying. If the next session is a
fi+ /window
| * f*ndow
t l
EXHIBIT 3.68. The Collapsing Doji Star I

GAP - DAILY
59585756555453525150494B471645c1] J
421 l
1039
595B5756555153525l50194B4716454413421l{039
The Patterns 115
black candle that gaps lower, it is called a collapsing doji star. The threecandles that make up this pattern are the same three as those needed forthe evening doji star. The difference is that the evening doji star has thedoji above the tall white real body, while the collapsing doji star has thedoji gapping under, instead of above, the first white candle. This patternis said to be an "omen of a large decline."
While not an ideal version, candle lines A, B, and C in Exhibit 3.69could be viewed as the collapsing doji star pattern. This chart shows thethree main conditions needed for the collapsing doji star pattern: 1) anuptrend to reverse (at the white candle at A), 2) a doji session that gapsunder the prior session (at B), and 3) another black candle that movesunder the doji session (at C).
Candle lines D and E show a gapping doji pattern (discussed in thesection on windows). While similar in appearance to the collapsing dojistar, the gapping doji is a bearish continuation pattern. This means thatit occurs during a downtrend, while the collapsing doji star is a topreversal pattern that occurs after an uptrend.
,,0*ilofi*o"lro,r/1i,,,*r do,il,r*..
MetaStock bY EQUIS Int'l
EXHIBIT 3.69. Collapsing Doji Star, Gap-Daily
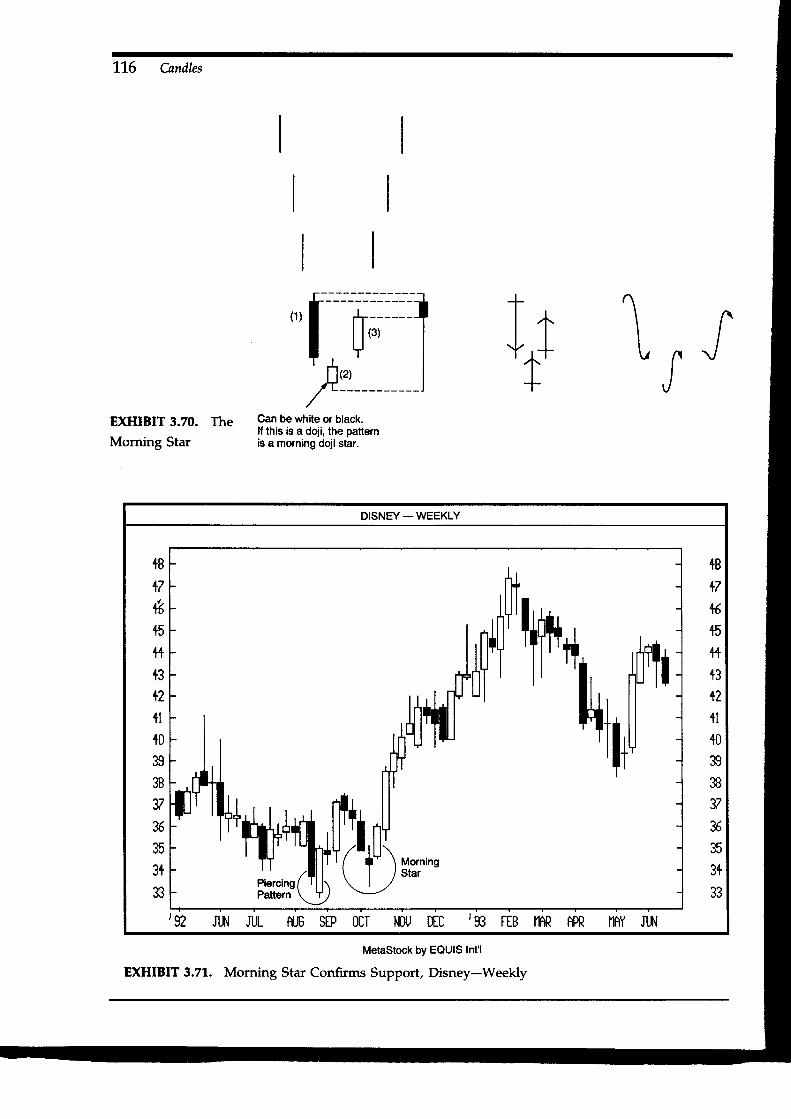
115 C-andles
EXHIBIT 3.70. The
Morning Star
Gan be white or black.lf this is a doji, the patternis a morning doii star.
IP \ r /
DISNEY-WEEKLY
,92 JI.I,] JUL flF sp ODT NsJ DtD ,93 FIB l1AR Am ilAY JUN
+8+7*
+5+++3+2fl
+D393837%s3+33
+B+7+6+5+++3+2+1+0393B37<A
353+
Metastock by EQUIS Int'l
EXHIBIT 3.71. Moming Star Confirms Support, Disney-Weekly

The Patterns
The Morning Star
Exhibit 3.70 shows that the classic morning star has none of the threereal bodies that make up the pattern touching. We can see from theblended candle in Exhibit 3.70 that the more that real body 3 pushes intoreal body 1, the longer the blended candle's lowet shadow, and hencethe more bullish the pattern.
As shown in Exhibit 3.7'1,, the area in which August's piercing patternappeared became support again in October via a classic morning star.Also, the middle candle of this morning star was a high-wave candle.
The three candles highlighted in Exhibit 3.72 at the August lows cre-ated a morning star. When, as in this case, the star portion of this patternis a doji, the pattern is referred to as a morning doji star. There is anotherinteresting aspect about this morning star. If there is a doji session thathas a gap before and after it, is called anabandonedbaby.In this chart ofPenney, note how there was a gap between sessions 2 and 3 of themorning star and almost a gap between the first two sessions. Thus, this
Metastock by EQUIS Int'l
EXHIBIT 3.72. Morning Star, ]CPenney-Daily
117
JCPENNEY- DAILY
78
77
7'6
75
7+
73
72
7l
ZO
59
5B
67
bb
55
tlr
r ,,,1['t'
r
++ild+r?hl +l iHril ll, ^[l ., ..q*il*Jr+1,il |n t
l+ilfl , ;1tr,il1t,,00'\,rn[ou*rr+r,il
tl ot'u
Tl ilL, Y'
/ l , Y r\l/
78a1( (
767q
7+73
72
7l
70
59
58
67
55
65' 9 2 A t D v ? + s 0 8 1 + 2 2 8 0 t 2 l 9 2 6 N

118 Candles
was almost a very rare abandoned baby pattern. The abandoned babybottom is, in terms of a bar chart, an island bottom that is also a doji.You can image how rare this combination is.
In the next chapter, I will focus on weighing the overall technicalpicture in relation to an individual candle pattern. In Exhibit 3.73, I willbriefly address this issue. The hammer is September (at hammer L) wasa potentially bullish signal. However, this bullishness was mitigated bythe fact that on the day of the hammer, the market opened a fallingwindow. Note how this window then became a resistance area. A fewsessions later, another hammer formed (shown at hammer 2). The sessionafter hammer 2 completed the third line needed for the morning starpattern. So, although there were two hammers in this chart, the overalltechnical picture for hammer 2 was more consecutive than it was forhammer 1 because of hammer 2's longer lower shadow and becausehammer 2 was part of a morning star pattern. As a result, for thoselooking to buy, the area to have considered would be after the completionof the morning star. Traders who needed more bullish confirmation could
APPLE _ DAILY
5S
58
57
56
55
54
53
52
51
50
49
48
47
46
45
44
43
42
5S
5B
57
55
55
54
53
52
5l
50
49
4B
47
46
45
44
43
42
'92 oB L4 2l 2 8 0 0 5 L2 1,9
t n. n -
ltlI '
I , I+rlll
ll''^, -^ ah^ ^ flt+f+fl]Close above | |Falling Window | |
ffli'ls- \1.Lfiiillg-'l-il1+,rT"q}H:::;"'
nilr*l--r lf$,Htt,"",",'",., _i++
09 t b
EXHIBIT 3.73. Morning Star and Overall Technical Picture, Apple-Daily

The Patterns 1I9
have waited until a close above the falling window's resistance area frommid-october. The rising window in mid-october gave even more bullishproof.
In Exhibit 3.74, there was a hint of a bottom near $12 based on thelune L992 bullish engulfing pattern. In late ]uly, the support area of thispattern (i.e., the lows of the bullish engulfing pattern it $fZ) was suc_cessfully defended. However, in August, these ib-, *"r" breached, butonly temporarily as the bulls were able to regain control of the marketby pulling prices back up over g12 again. In d&ng so, the market formeda morning star pattern and a spring.
As shown in Exhibit 3.75, the first candle of a classic morning star hasa large black real body. The third candle of the pattern is a tall white realbody that pushes well into the first candle of the pattern. In the morningstar pattern M1, the first candle had a small white real body instead of along lack real body. At patterns M2, the third candle (at the arrow) wasa small white real body instead of the more traditional long white realbody.
AST - WEEKLY
JUt.l JUL
2+
ry22
2l
2Dl q
t 8l 1t (
l b
1 +t <
1 ?
2+23
nttLL
20
1 9
l 8
t 7
1 5t 6
t +1 3
T2, g l '32 FtB NRR fiPR |1RY RU6 StP DDI |\]OU DTD
' l l
IITIL]t+*,tlll
,il|,ilfr"ll |[.T l\ Morningi Star
I
t+li l f
I
BullishEngulfingPattern
I
|u l+',93 FtB r]RRAPR
Metastock by EQUIS Int'l
EXHIBIT 3.74. Morning Star and a Spring, AST-Weekly

120 Candles
GM - DAILEY
? q n
38. 538. 037.537.036. 5Jb. U
35.5? 6 n
31 .531. 0? ? q?1 n
32. 532.031 . 5'lt n? n q
30.029. 529.028.528.0
? q n
38. 538. 0^ - +J ( . 3
37.035. 536. 035. 535. 034. 531. 033. 5JJ . U
? ? n
3 1 . 5J I . U
30. 530, 029. 529. 028.528. 0
0 07 11 2 t 28 ' �93 l l 18
J"lo,,n",l+1,,,*,qili,nrdnr[
Tlrr'+'{r;n'oi'*orul*r'*rilr
, fl-Tl t--l Metastock by EQUIs lnt'll { - 4 l r I-r' r I f-lt--l 't J
DGIIBIT 3.75. Morning Star and Subjectivity, GM-Daily
The fact that both of these morning star variations appeared near thesame support area meant that while both M1 and M2 were not classicmorning star patterns, they should be viewed nonetheless as bullish clues.This chart underscores an important point-candles are a form of patternanalysis, and as such, there is a subjectivity that goes with candlestickanalysis.
In this regard, I once wrote to the Nippon Technical Analysts Asso-ciation to see how they viewed candle chart patterns that were less thanideal versions of a pattern. This was their response: "We have found ourdiscussions very interesting in the sense that you try to be very specificin determining definitions of japanese exhibit readings while we try tokeep them flexible so as not to exclude all possibilities. This . . . may betraced to differences in the way of thinking of Westerners who preferbeing precise and definite and Orientals who like to be flexible."
The Patterns
This highlights an important point in that the exhibits I have illus-trated are mostly ideal versions of the patterns, but in the real world,one should not exclude the possibility that a less than ideal version ofthat pattern is valid. How do you determine if you should trade from aless than ideal pattern? Based on the Japanese literature, may conversa-tions with fapanese candle traders, and my experience, here are a fewsuggestions:
1. Wait for more confirmation of that pattern's prediction. For example,an ideal dark cloud cover should have the second session's close morethan halfway into the first candle's white real body. If the close is lessthan halfway into the white real body, then wait until the next sessionto see if the market remains weak.
2. If the less than ideal pattern confirms a support or resistance area, orif it appears in a very oversold or overbought market, the greater theodds that the pattern will be a reversal. For example, if there is ahammer in which the lower shadow is not very long, but if this "ham-
mer-like" line confirmed a 50o/o retracement area, I would view suchaction as having all the bullish import as would a more traditionalhammer.
3. A method you may find useful in helping to determine the significanceof a less than ideal pattern is to make a blended candle from thatpattern. Then see if the blended candle confirms the pattern's forecast.For example, look at Exhibit 3.75 (GM) previously discussed. I usedthis chart to draw the blended candles from morning star variationsM1 and M2. Notice how each of these blended candles had long lowershadows. The long lower shadows of both of the blended candles andthe fact that both M1 and M2 emerged near the same support with thelong white candle following M2 gave clues that the bears were losingcontrol of this market.
RECORD SESSIONS
\{ost candle patterns are composed of one, two, or three candles. Thisaspect shows one of the major advantages of the candle charts-they canoften send a reversal signal in only a few sessions, whereas bar chartscan take much longer. Although some candle patterns do take longer tounfold, they are nonetheless extremely valuable. One of these longer:erm pattern techniques is the eight to ten record sessions.
When a candle session makes a higher high, the japanese call it a
L21
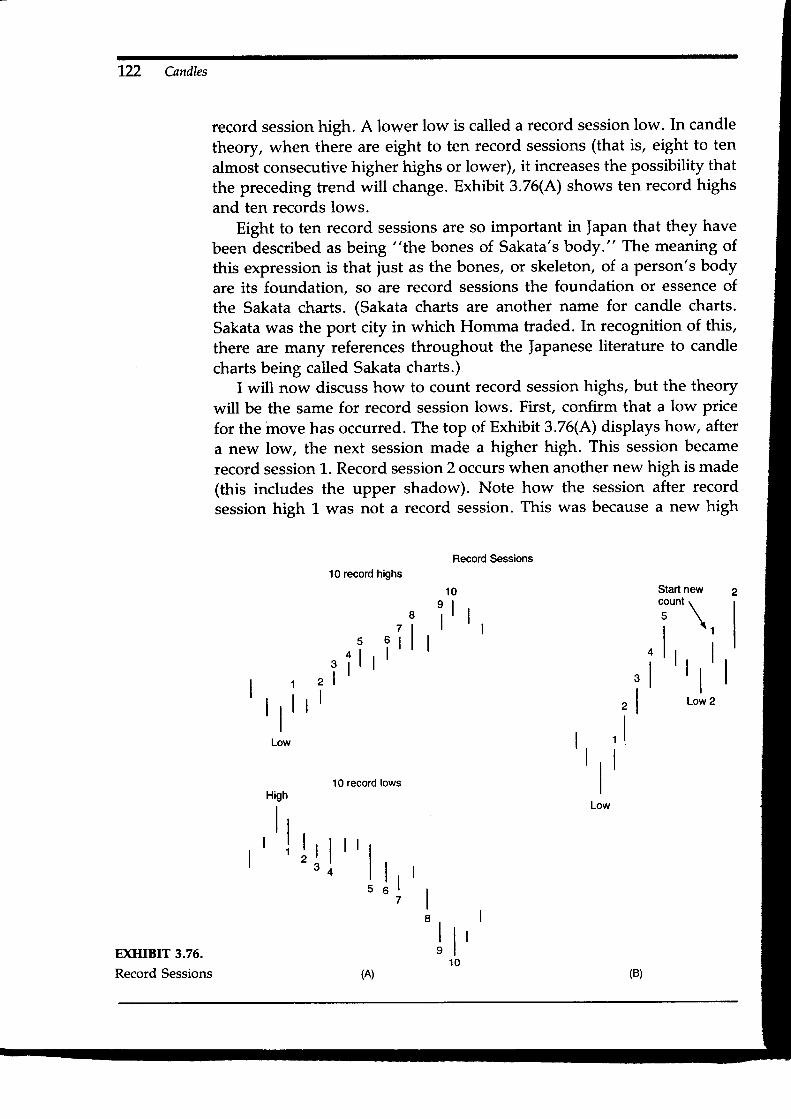
122 C-andles
EXHIBIT 3.76.
Record Sessions
record session high. A lower low is called a record session low. In candletheory, when there are eight to ten record sessions (that is, eight to ten
almost consecutive higher highs or lower), it increases the possibility thatthe preceding trend will change. Exhibit 3.76(A) shows ten record highsand ten records lows.
Eight to ten record sessions are so important in ]apan that they havebeen described as being "the bones of Sakata's body." The meaning ofthis expression is that just as the bones, or skeleton, of a person's bodyare its foundation, so are record sessions the foundation or essence ofthe Sakata charts. (Sakata charts are another name for candle charts.Sakata was the port city in which Homma traded. In recognition of this,there are many references throughout the ]apanese literature to candlecharts being called Sakata charts.)
I will now discuss how to count record session highs, but the theorywill be the same for record session lows. First, confirm that a low pricefor the move has occurred. The top of Exhibit 3.76(A) displays how, aftera new low, the next session made a higher high. This session becamerecord session 1. Record session 2 occurs when another new high is made(this includes the upper shadow). Note how the session after recordsession high 1 was not a record session. This was because a new high
10 record highs
10 record lows
Record Sessions
1 0 Start newI
I t ,count \5 \| \ r' i i
? i l lI 1 2 l' l r l r l
ILow
High
l r| ' t l t l r '
4
. l, l, l
t lI
Low
l r , lI
Low 2
' t
lr7 I' r
9
(A) (B)
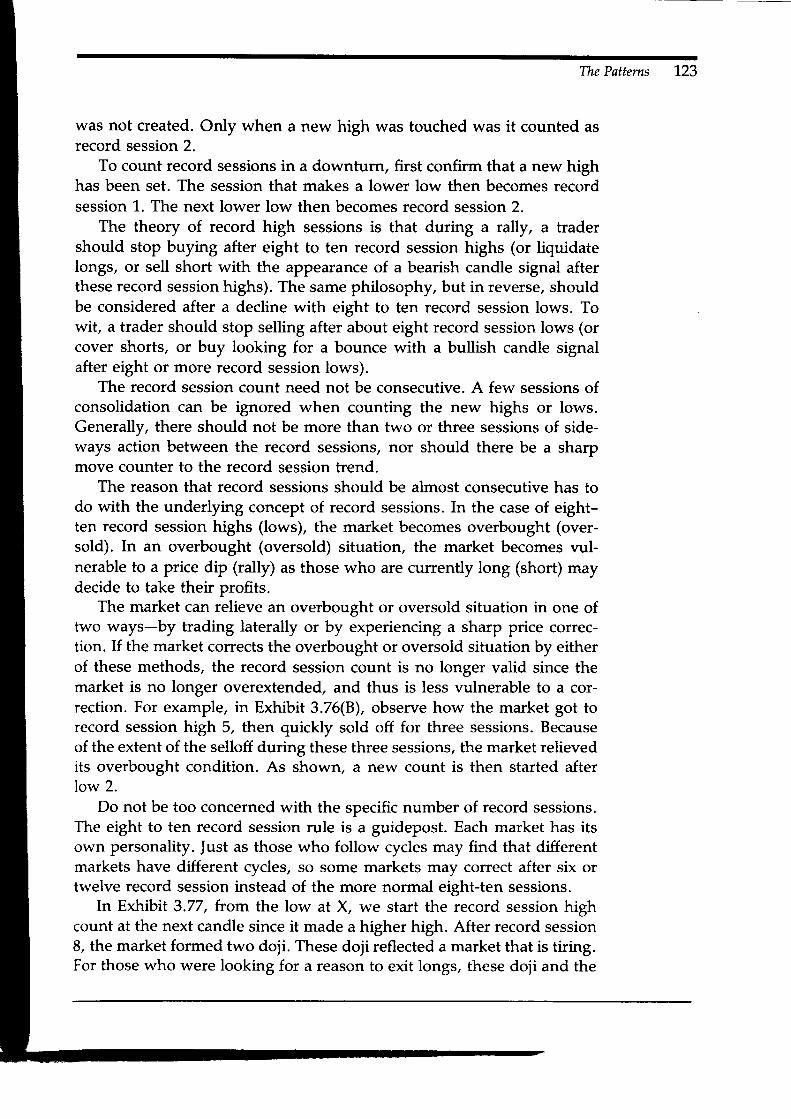
The Patterns
was not created. Only when a new high was touched was it counted asrecord session 2.
To count record sessions in a downturn, first confirm that a new highhas been set. The session that makes a lower low then becomes recordsession 1. The next lower low then becomes record session 2.
The theory of record high sessions is that during a rally, a tradershould stop buying after eight to ten record session highs (or liquidatelongs, or sell short with the appearance of a bearish candle signal afterthese record session highs). The same philosophy, but in reverse, shouldbe considered after a decline with eight to ten record session lows. Towit, a trader should stop selling after about eight record session lows (orcover shorts, or buy looking for a bounce with a bullish candle signalafter eight or more record session lows).
The record session count need not be consecutive. A few sessions ofconsolidation can be ignored when counting the new highs or lows.Generally, there should not be more than two or three sessions of side-ways action between the record sessions, nor should there be a sharpmove counter to the record session trend.
The reason that record sessions should be almost consecutive has todo with the underlying concept of record sessions. In the case of eight-ten record session highs (lows), the market becomes overbought (over-sold). In an overbought (oversold) situation, the market becomes vul-nerable to a price dip (rally) as those who are currently long (short) maydecide to take their profits.
The market can relieve an overbought or oversold situation in one oftwo ways-by trading laterally or by experiencing a sharp price correc-tion. If the market corrects the overbought or oversold situation by eitherof these methods, the record session count is no longer valid since themarket is no longer overextended, and thus is less vulnerable to a cor-rection. For example, in Exhibit 3.76(8), observe how the market got torecord session high 5, then quickly sold off for three sessions. Becauseof the extent of the selloff during these three sessions, the market relievedits overbought condition. As shown, a new count is then started afterlow 2.
Do not be too concerned with the specific number of record sessions.The eight to ten record session rule is a guidepost. Each market has itsown personality. |ust as those who follow cycles may find that differentmarkets have different cycles, so some markets may correct after six ortrvelve record session instead of the more normal eight-ten sessions.
In Exhibit 3.77, ftom the low at X, we start the record session highcount at the next candle since it made a higher high. After record session8, the market formed two doji. These doji reflected a market that is tiring.For those who were looking for a reason to exit longs, these doji and the
123
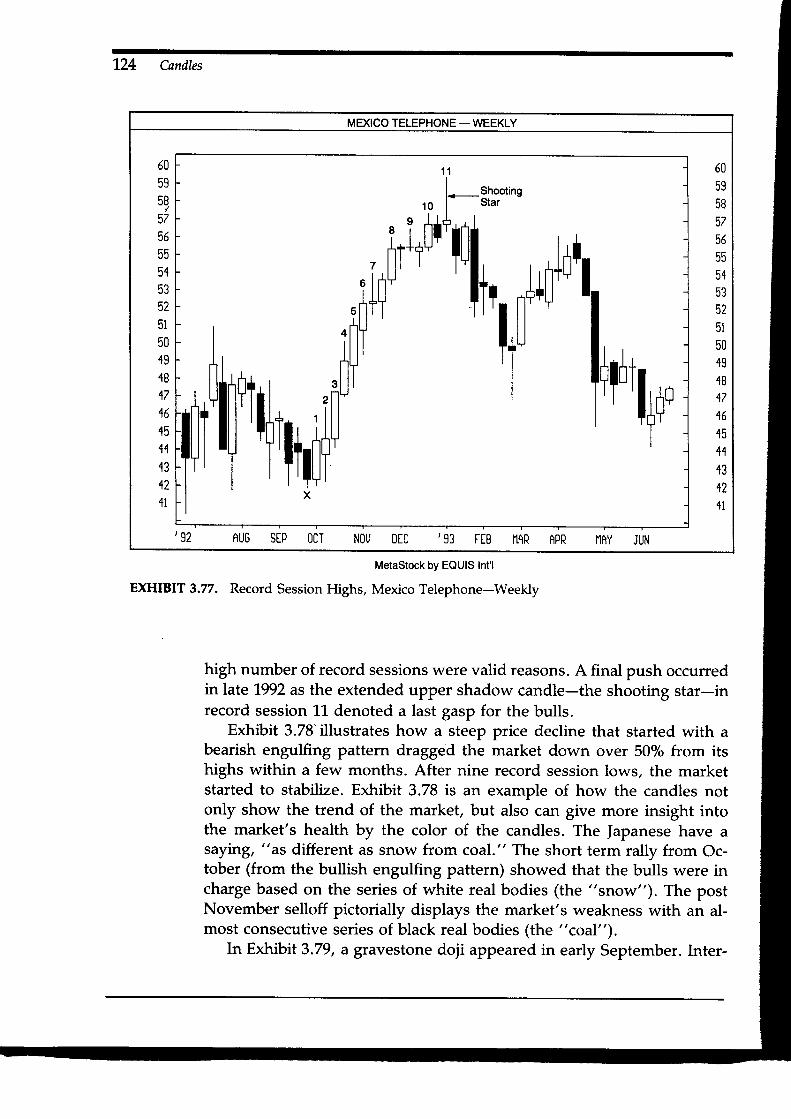
124 Candles
Metastock by EQUIS Int'l
EXHIBIT 3.77. Record Session Highs, Mexico Telephone-Weekly
high number of record sessions were valid reasons. A final push occurredin late 1992 as the extended upper shadow candle-the shooting star-inrecord session 11 denoted a last gasp for the bulls.
Exhibit 3.78'illustrates how a steep price decline that started with abearish engulfing pattern dragged the market down over 50o/o from itshighs within a few months. After nine record session lows, the marketstarted to stabilize. Exhibit 3.78 is an example of how the candles notonly show the trend of the market, but also can give more insight intothe market's health by the color of the candles. The ]apanese have asaying, "as different as snow from coal." The short term rally from Oc-tober (from the bullish engulfing pattern) showed that the bulls were incharge based on the series of white real bodies (the "snow"). The postNovember selloff pictorially displays the market's weakness with an al-most consecutive series of black real bodies (the "coaI"\.
In Exhibit 3.79, a gravestone doji appeared in early September. Inter-
MEXICO TELEPHONE - WEEKLY
NOU DtC '93 FEB I1AR APR I,IAY JUN
60595B57565551533t
5l5019481716151113121l
60595B5756555453523t
5049484716151143121l
92 AUG SEP OCT
tr
|t+'T

The Patterns 125
AMGEN _WEEKLY
80
7q
70
65
OU
55
hn
15
10
35
80
75
70
65
60
55
50
15
10
35
, 92 JUN JUL ..AU6 SEP OCT NOU DEC ,93 FEB I1AR APR I1AY JUN JUL
z-\ Bearish( , - )Engul f ing
niIli'""'"+l Iilil
''*l*fn'td' "!;,'!#nF
I
]|h
I ItlY
fil'l r
' l lTflTY
+noht*+
. , I l
, Atu'fIt++o !,r0t-.+t
MetaStock bY EQUIS Int'l
EXHIBIT 3.78. Record Session Lows, Amgen-Weekly
estingly, this gravestone also confirmed that there was a potential top
based on the record session concept. After making a new low at L, the
market on the next day made a higher high. This was record session 1.
After record session 3, the market took a breather for a few days before
going on to a fresh new high, and then formed record session 4. As we
can see, between record sessions 3 and 4, the market can trade laterally
for a few sessions without intermpting the count for record sessions.
(However, if these sessions after record session 5 were sharp selloffs,
then the record session count would have to start again). By the time the
Nikkei gets to record sessions 7 and 8 (which are shooting stars), the
market is already in trouble, With the gravestone doji at record session 9
becoming a top.In Exhibit 3.80, a piercing pattern emerged after a nine-count record
session. As a result, a rebound could be expected. From the 1993 high
near $21 to the low of the piercing pattern, we get a 50o/o retracement

EXHIBIT 3.79. Record session High and Bearish Confirmation, Nikkei-Daily
EXHIBIT 3.80. Record Session Lows and Retracement Levels, Crud.e Oil-Weekly
The Patterns
level near $19. This is where the market stalled after the rebound fromthe piercing pattern.