bias-correction and dynamical downscaling strategy to
TRANSCRIPT
ISSN 0252-1075
Contribution from IITM
Research Report No. RR-145
ESSO/IITM/SERP/SR/01(2019)/196
Bias-Correction and Dynamical Downscaling Strategy to Improve
the Prediction of Extreme Weather Events on Extended Range
Manpreet Kaur, R Phani, Susmitha Joseph, A.K. Sahai*, R. Mandal, A. Dey and R. Chattopadhyay
Indian Institute of Tropical Meteorology (IITM) Earth System Science Organization (ESSO)
Ministry of Earth Sciences (MoES) PUNE, INDIA
http://www.tropmet.res.in/
ISSN 0252-1075
Contribution from IITM
Research Report No. RR-145
ESSO/IITM/SERP/SR/01(2019)/196
Bias-Correction and Dynamical Downscaling Strategy to Improve
the Prediction of Extreme Weather Events on Extended Range
Manpreet Kaur, R Phani, Susmitha Joseph, A.K. Sahai*, R. Mandal, A. Dey and
R. Chattopadhyay
*Corresponding Author Address:
Dr. A.K. Sahai
Indian Institute of Tropical Meteorology,
Dr. Homi Bhabha Road, Pashan,
Pune – 411008, India.
E-mail: [email protected]
Phone: +91-(0)20-25904520
Indian Institute of Tropical Meteorology (IITM)
Earth System Science Organization (ESSO)
Ministry of Earth Sciences (MoES)
PUNE, INDIA
http://www.tropmet.res.in/
DOCUMENT CONTROL SHEET --------------------------------------------------------------------------------------------------------------------------------------
Earth System Science Organization (ESSO) Ministry of Earth Sciences (MoES)
Indian Institute of Tropical Meteorology (IITM)
ESSO Document Number
ESSO/IITM/SERP/SR/01(2019)/196
Title of the Report Bias-Correction and Dynamical Downscaling Strategy to Improve the Prediction of Extreme Weather
Events on Extended Range
Authors Manpreet Kaur, R Phani, Susmitha Joseph, A.K. Sahai*, R. Mandal, A. Dey and R. Chattopadhyay
Type of Document
Scientific Report (Research Report)
Number of pages and figures
37, 17
Number of references
37
Keywords Dynamical downscaling, Bias-correction, Extended range prediction
Security classification Open
Distribution
Unrestricted
Date of Publication
January 2019
Abstract
This study aims to document the strengths and shortcomings of forecast strategy being developed
based on dynamical downscaling for better extended range prediction of extreme weather events.
One heavy rainfall event and two cyclone cases are selected to dynamically downscale the global
forecasts of Extended Range Prediction (ERP) system using Weather Research and forecasting
(WRF) model at 9km for Indian domain. The ERP outputs are bias-corrected and fed to WRF as
lateral boundary conditions to minimize migrated errors from parent model via boundary
conditions. Results show bias-corrected downscaled ERP is more efficient in predicting extreme
weather with 10-12 days lead time.
Summary
Indian subcontinent is prone to weather extremes like cyclones and heavy rainfall events causing
severe damages due to floods and landslides. General circulation models (GCMs) running at coarse
resolution are unable to forewarn the intensity of these catastrophic rains at sufficient lead time. In
this study, a forecast strategy of dynamical downscaling is adopted to improve the extended range
predictions of high impact weather events. Ensemble members of an Extended Range Prediction
(raw-ERP) system based on higher (T382) and lower (T126) resolution of Climate Forecast System
(CFSv2) and Global Forecast system (GFS) are downscaled individually using Weather Research and
Forecasting (WRF) model. WRF run at 9 km resolution for Indian region such that the selected
model domain is large enough to include ocean-atmospheric interactions in lateral boundary
conditions. Downscaled ERP (ERPWRF) will take advantage of good prediction skills of raw-ERP in
capturing the large scale signals and will help to reduce spatio-temporal errors in regional detailing.
For the present study we have selected three different events - two cyclone cases and one heavy
rainfall event. Global raw-ERP ensemble forecasts are bias-corrected to minimize GCM intrigued
biases via boundary conditions. Bias-corrected and downscaled forecasts show improvement in
predicting the spatio-temporal evolution of rainfall associated with the selected severe weather
cases. This study affirms that dynamical downscaling can be an effective tool to generate useful
high resolution predictions at 10-12 days lead time.
Contents
Abstract 1
Summary 2
1 Introduction 3
2 Data and Methodology
2.1 Models
2.2 Bias-correction & dynamical downscaling
2.3 Objective tracking algorithm
5
5
5
6
3 Results and Discussions
3.1 Cyclonic Storm Roanu of 2016
3.1.1 Results from Experiments
3.1.2 Results from final setup
3.2 Uttarakhand Heavy Rainfall 2013
3.3 Severe Cyclonic Storm Mora of 2017
6
6
7
8
8
9
4 Conclusions and Remarks 10
Acknowledgements 11
References 12
Figures 15
1
Bias-Correction and Dynamical Downscaling Strategy to
Improve the Prediction of Extreme Weather Events on
Extended Range
Manpreet Kaur, R Phani, Susmitha Joseph, A.K. Sahai*, R. Mandal, A. Dey and
R. Chattopadhyay
Indian Institute of Tropical Meteorology, Pune-411008
Abstract
This study aims to document the strengths and shortcomings of forecast strategy being developed based
on dynamical downscaling for better extended range prediction of extreme weather events. One heavy
rainfall event and two cyclone cases are selected to dynamically downscale the global forecasts of
Extended Range Prediction (ERP) system using Weather Research and forecasting (WRF) model at 9km
for Indian domain. The ERP outputs are bias-corrected and fed to WRF as lateral boundary conditions to
minimize migrated errors from parent model via boundary conditions. Results show bias-corrected
downscaled ERP is more efficient in predicting extreme weather with 10-12 days lead time.
*Corresponding Author:
Dr. A.K. Sahai
Indian Institute of Tropical Meteorology,
Dr. Homi Bhabha Road, Pashan,
Pune – 411008, India.
E-mail: [email protected]
Phone: +91-(0)20-25904520
2
Summary
Indian subcontinent is prone to weather extremes like cyclones and heavy rainfall events causing severe
damages due to floods and landslides. General circulation models (GCMs) running at coarse resolution
are unable to forewarn the intensity of these catastrophic rains at sufficient lead time. In this study, a
forecast strategy of dynamical downscaling is adopted to improve the extended range predictions of high
impact weather events. Ensemble members of an Extended Range Prediction (raw-ERP) system based on
higher (T382) and lower (T126) resolution of Climate Forecast System(CFSv2) and Global Forecast
system (GFS) are downscaled individually using Weather Research and Forecasting (WRF) model. WRF
run at 9 km resolution for Indian region such that the selected model domain is large enough to include
ocean-atmospheric interactions in lateral boundary conditions. Downscaled ERP (ERPWRF) will take
advantage of good prediction skills of raw-ERP in capturing the large scale signals and will help to reduce
spatio-temporal errors in regional detailing. For the present study we have selected three different events -
two cyclone cases and one heavy rainfall event. Global raw-ERP ensemble forecasts are bias-corrected to
minimize GCM intrigued biases via boundary conditions. Bias-corrected and downscaled forecasts show
improvement in predicting the spatio-temporal evolution of rainfall associated with the selected severe
weather cases. This study affirms that dynamical downscaling can be an effective tool to generate useful
high resolution predictions at 10-12 days lead time.
Key-Words: Dynamical downscaling, Bias-correction, Extended range prediction
3
1. Introduction
Extreme weather events are devastative due to their impacts on society such as excessive loss of lives,
severe economic collapse and endangered ecosystems. Cyclonic storms and low pressure systems causing
exceptionally heavy precipitation are few examples of extreme events. Studies have shown increasing
trends of heavy rainfall( ≥ 100 mm/day) and very heavy rainfall (≥150 mm/day) over Indian region1.
Increased frequency of such severe weather events are suspected to be linked to changes in hydro-cycle
due to enhanced green-house effect2. Forewarning of these extreme cases at least 10-12 days in advance
can help in reducing socio-economic loss.
The forecasting of meteorological parameters with 2-3 weeks lead time is referred as extended range
prediction. This sub seasonal forecast range has predictability due to the presence of quasi-periodicities in
intra-seasonal scales; and is important for different sectors like agriculture, health, water management etc.
A real time forecast system for extended range prediction (ERP) of active and break spells of Indian
summer monsoon is developed at Indian Institute of Tropical Meteorology (IITM). This system is now
operational at India Meteorological Department (hereafter termed as IITM/IMD ERP). ERP system is a
combination of deterministic as well as probabilistic forecast which includes coupled model Climate
Forecast System (CFSv2)3 and Atmospheric model Global Forecast System (GFS) at higher (T382) and
lower (T126) resolutions with ensembles of perturbed initial conditions (ICs)4.
ERP has impressive skill in predicting Monsoon onset & progression, cyclone genesis, Madden-Julian
Oscillation, heat and cold waves with a lead time of two weeks5. It has been found in previous studies that
ERP system is successful in providing outlooks on impending heavy rainfall events, albeit there are some
spatio-temporal errors5,6
. Therefore, it is hypothesized in this study that if the model could reasonably
predict the large scale features associated with heavy rainfall events, then it is possible to reduce the
spatio-temporal errors using dynamical downscaling approach. Skillful prediction of extreme events is
needed at sufficient lead time and since the IITM/IMD ERP system can capture the large scale features
well, downscaling of ERP outputs will be an added value.
Dynamical downscaling involves running high resolution model (generally regional models (RCMs)) at
regional sub-domain with coarser resolution model outputs as large scale boundary conditions.
Traditional way of such downscaling is using global model outputs directly, which is likely to infuse
GCM biases via initial and lateral boundary conditions7. The biases in parent GCM when given as initial
and lateral boundary conditions (hereafter referred as ICs and LBCs) are likely to grow further in RCM
simulations and the results can have too much deviation with time. Analyzing the climate change
4
simulations within ENSEMBLES project, Christensen suggested that a simple bias-correction that can
retain synoptic and climate variability signals8 should be applied to control error growth. Dynamical
downscaling with such bias-corrections is found to be effective in different climate projections. There are
studies with RCM that show bias-corrected winds and sea-surface temperature (SST) alleviate shear bias,
and bias correction of all boundary variables helps in cyclone development in Atlantic9. Bias-corrections
applied to RCM input variable like wind speed, temperature, geo-potential height, specific humidity and
SST shows better simulated rainfall intensity over Mongolia10
. A study over central U.S. and Canada
illustrates that bias-correction can significantly improve downscaled middle-upper air temperature, wind
vectors, geo-potential and water vapor7. Aforementioned studies based on dynamical downscaling deals
with climate simulations and future projection in general, with some studies addressing individual
weather extreme cases in particular8,9,11–14
. Novelty of the present work is that it downscales global
extended range predictions in forecasting mode using Weather Research Forecast (WRF). The 16 ERP
ensemble members are given as LBCs to the WRF which have signals of MJOs and ISOs15
. These 16
members are bias-corrected individually for all input variables.
Apart from inherited GCM bias, RCMs simulations are also prone to internal systematic biases due to
physical parameterization schemes. Different parameterization schemes induce dry or wet biases
depending upon activation and closure assumptions. A detailed study to analyze the strength of three
different cumulus parameterization schemes (Betts-Miller-Janjić (BMJ)16,17
, Kain-Fritsch (KF)18
, and
Grell and Dévényi (GD)19
) in simulating monsoon seasonal rainfall and their possibilities to infuse biases
shows that GD underestimates the heavy precipitation (>10mm/day) while KF overestimates the heavy
precipitation as seen in rainfall rate probability density function (PDF)20
. At higher resolution (<10km),
cumulus parametization can be switched off (i.e. grey-zone) as grid-scale microphysics is sufficient to
resolve sub-grid processes. Recent studies have shown that WRF grey-zone resolution (9km) captures the
monsoon intra-seasonal oscillations as well as the spatio-temporal evolution of Indian summer monsoon
rainfall (ISMR)21
. Yue Zheng and co-authors performed WRF experiments in three convection treatments
- with KF, modified KF scheme22
(multi-scale KF or MSKF) and no Cumulus. In MSKF, the adjustment
mean time and entrainments processes are modified and it has grid resolution dependency. It is found that
with MSKF, excess rainfall amount is reduced with improvements in predicting location as well as
intensity of surface precipitation at high resolution of 3km and 9km22
. Downscaled ERP (hereafter
ERPWRF) has been tested with different physics options beforehand and WRF double moment 6-class23
is found to show better results with MSKF18
cumulus scheme (Physics tests are not included in this
report).
5
Some recent studies indicate that changes in land-use land-cover (hereafter LU/LC) pattern can induce
significant changes in temperature and wind patterns and also in the seasonal rainfall24,25
. Deforestation
for urbanization, agriculture and other developmental works can intensify climate change issue, thereby
increasing frequency of weather hazards. Therefore, it is expected that usage of better LU/LC datasets
over Indian region in the RCMs may improve the prediction of extreme events.
This work documents the initial findings of reconstructed strategy based on bias-correction and dynamical
downscaling. In order to test the impact of land-use change on extreme event simulations, we have
incorporated LU/LC data for Indian region obtained from National Remote Sensing Centre (NRSC)26
in
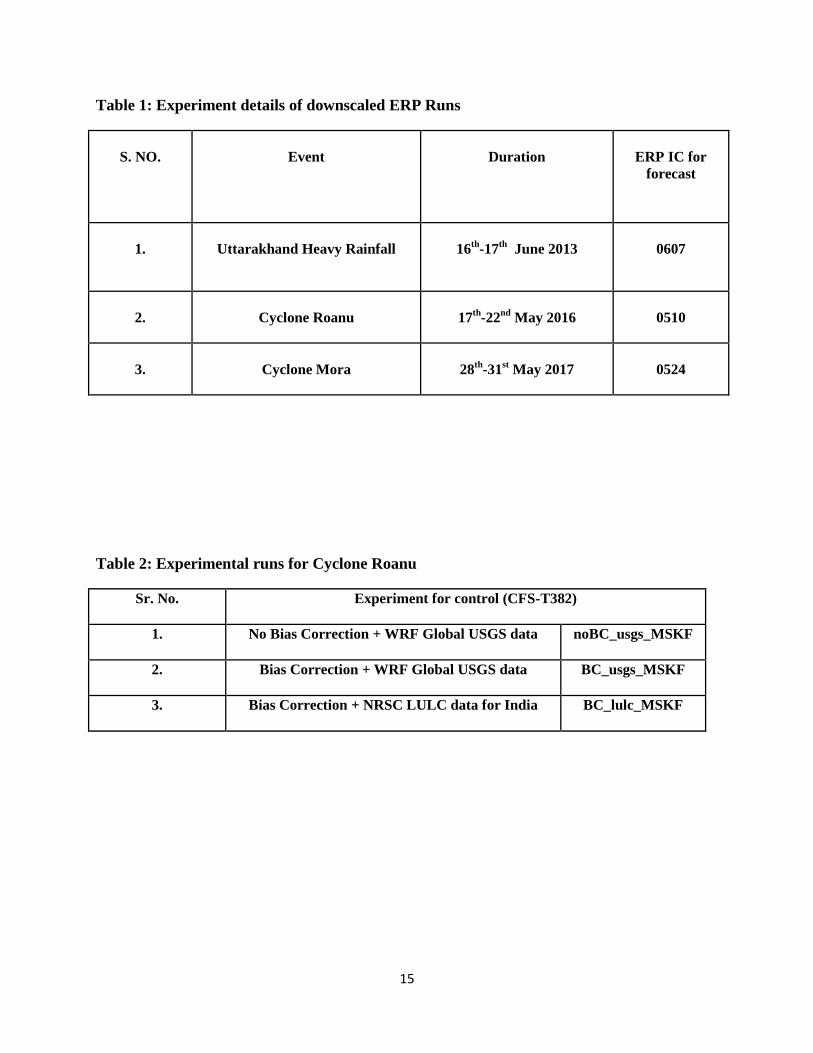
WRF for downscaled simulations. Three different extreme events which includes two cyclones Roanu
(2016) and Mora (2017) and Uttarakhand heavy precipitation (2013) case as described in Table 1, are
selected for the present study.
2. Data and Methodology:
2.1 Models
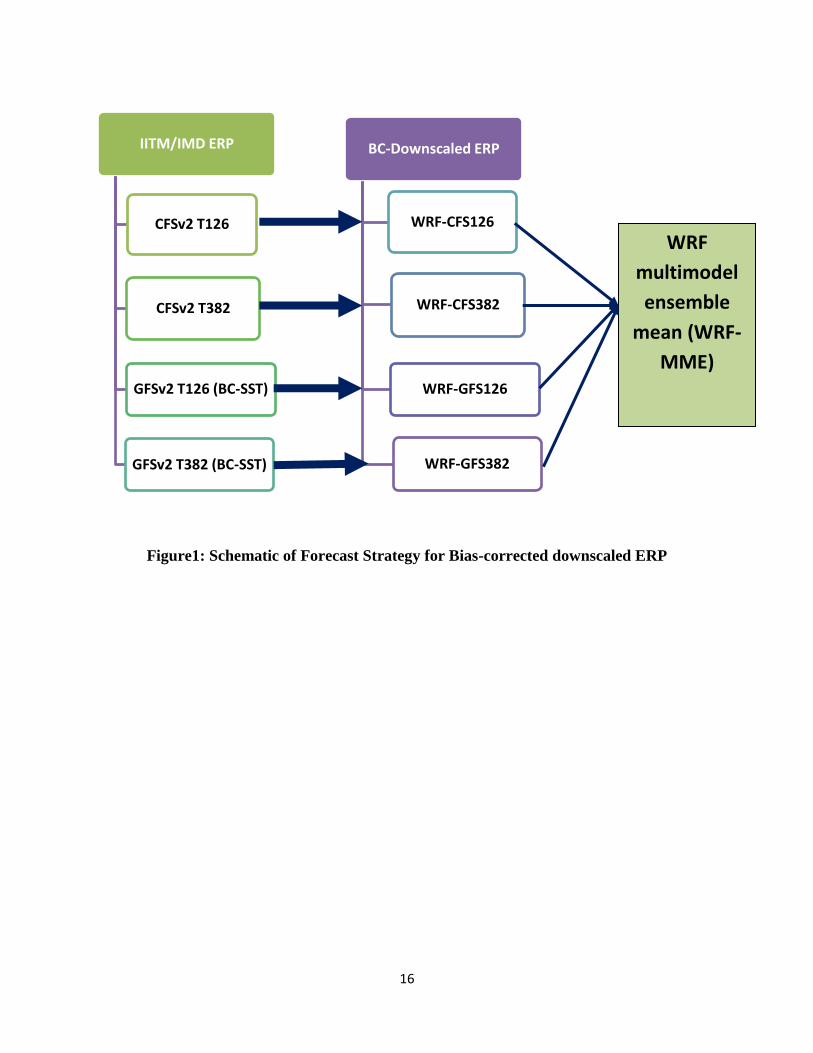
The IITM/IMD ERP is an ensemble prediction system with 16 ensemble members based on coupled
model CFSv2 and the atmospheric model GFS, both at two resolutions T382 (~37 km) and T126 (~100
km) running in forecast and hindcast mode on weekly basis. The ERP has 4 ensemble members each from
four variants (CFS-T382, CFS-T126, GFS-T382 and GFS-T126). Regional model used in our study is
WRF with Advanced Research WRF dynamic solver (WRF-ARW version 4.0); which is a meso-scale
numerical modeling system used for research and forecasting applications in atmospheric sciences27
. All
the ensembles of ERP are regridded to 1x1 degree resolution, bias-corrected and are given as ICs and
LBCs to WRF. The horizontal resolution for the single domain ERPWRF is 9 km with domain centered at
India having 1001x945 grid points (250S - 55
0N; 30
0E - 128
0E) and 37 vertical levels. Downscaling is
attempted with micro-physics WRF double moment class-6 (WDM6)23
and cumulus parameterization
MSKF18
, Yonsei University scheme is planetary boundary layer (pbl) physics28
, Dudhia scheme29
for
shortwave radiation and RRTM scheme30
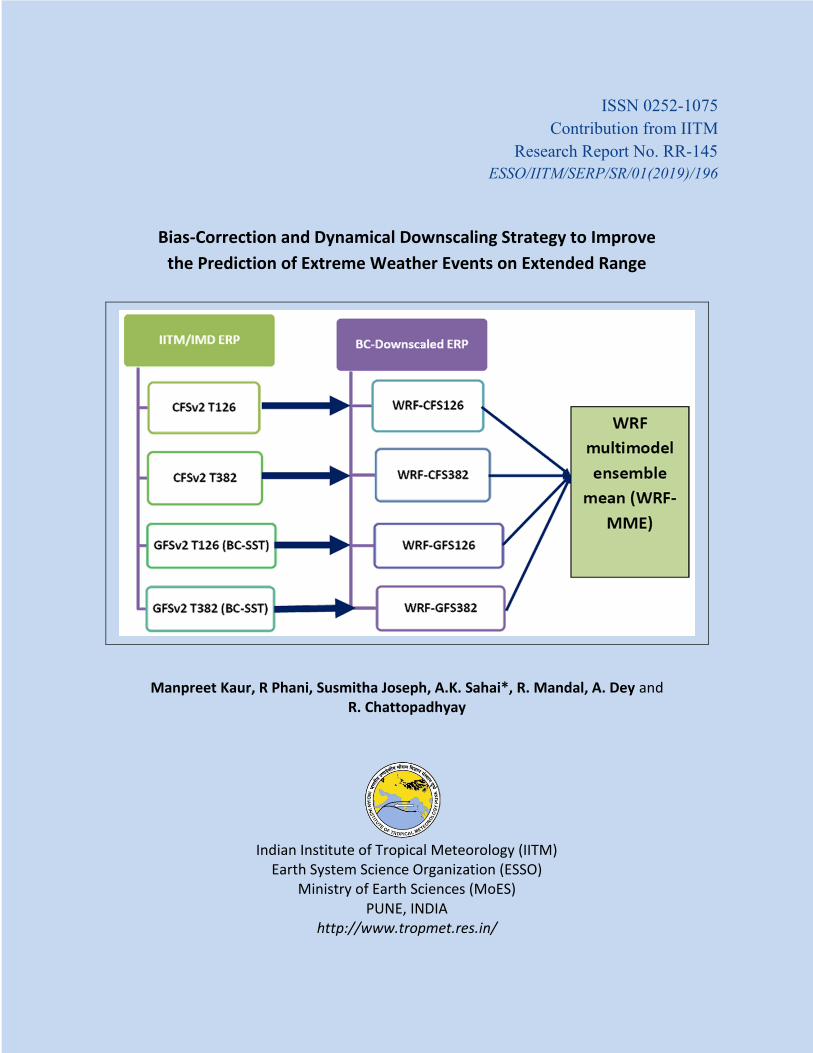
for long wave radiation. Detailed schematic of downscaled ERP
is given in Figure1.
2.2 Bias-correction & dynamical downscaling
Output from IITM/IMD ERP models i.e. all 16 members are bias-corrected for model mean with 6-hourly
Climate Forecast System Reanalysis (CFSR)31
data and then individually given to WRF-ARW model as
6
ICs and LBCs. Each and every variable of ERP outputs that goes as LBCs to WRF is bias-corrected with
reference to the reanalysis data.
(1)
is model anomaly which is superimposed over observed mean as follows,
(2)
i.e. (3)
Variables which are bias-corrected and given as inputs to WRF include vertical profiles of temperature,
winds, humidity, geo-potential and surface variables SST, mean sea level pressure (MSLP), soil-moisture,
soil-temp, snow depth etc.
LU/LC data from ISRO-NRSC26
is incorporated in WRF for Indian domain. Observational datasets used
to verify the model predictions are IMD-TRMM merged rainfall32
and ERA5 reanalysis33
for winds and
MSLP.
2.3 Objective tracking algorithm
Cyclone tracks of raw-ERP and ERPWRF are plotted using objective tracking algorithm which is a
modified version of Geophysical Fluid Dynamics Laboratory (GFDL) vortex-tracker developed by
NOAA/NCEP34
. This algorithm is widely used to locate storm position in multi-model ensemble
prediction system34,35
.
3. Results & Discussions:
We carried out different experiments with downscaling forecast setup for different extreme cases, few
final experiments are explained here (see Table 2) for cyclone Roanu with one ensemble member i.e.
control run of CFS-T382. In order to understand the importance of bias-corrections on ERPWRF,
comparison is made between the downscaled forecast runs with bias-correction and without bias-
correction. Also, the impact of land-use in WRF using default dataset i.e. United State Geological Survey
(hereafter USGS) and NRSC-LU/LC is compared. After comparison, the better forecast setup is finalized
for present study. Then the runs are made for all 16 members for all three selected cases using the final
setup that includes 6-hour bias-correction using NRSC-LU/LC data in WRF.
7
3.1 Cyclonic Storm Roanu of 2016
The cyclonic storm Roanu occurred during onset phase of southwest monsoon 2016. This system initiated
as low pressure area over north Sri Lanka and adjoining areas of gulf of Mannar and southwest Bay of
Bengal (BOB) on 16 May, developed into a depression on 17th May and deep depression on 18
th May, as
it moved north northeastwards. Further on 19th May, it intensified into cyclonic storm and moving along
the east Indian coast re-curved northeastwards. Finally on 22nd
May, it weakened into depression over
parts of northeast India and Myanmar36
.
3.1.1 Results from Experiments
In the first experiment (noBC_usgs_MSKF), we have not corrected input ICs and LBCs for biases; and
default USGS data is used in WRF. The second experiment (BC_usgs_MSKF) uses bias-corrected WRF
input, but USGS data is kept same. Another experiment (BC_lulc_MSKF) is done with bias-corrected ICs
and LBCs and also by replacing Indian domain USGS data with the NRSC-LU/LC data. (please refer
Table 2 for experiment details)
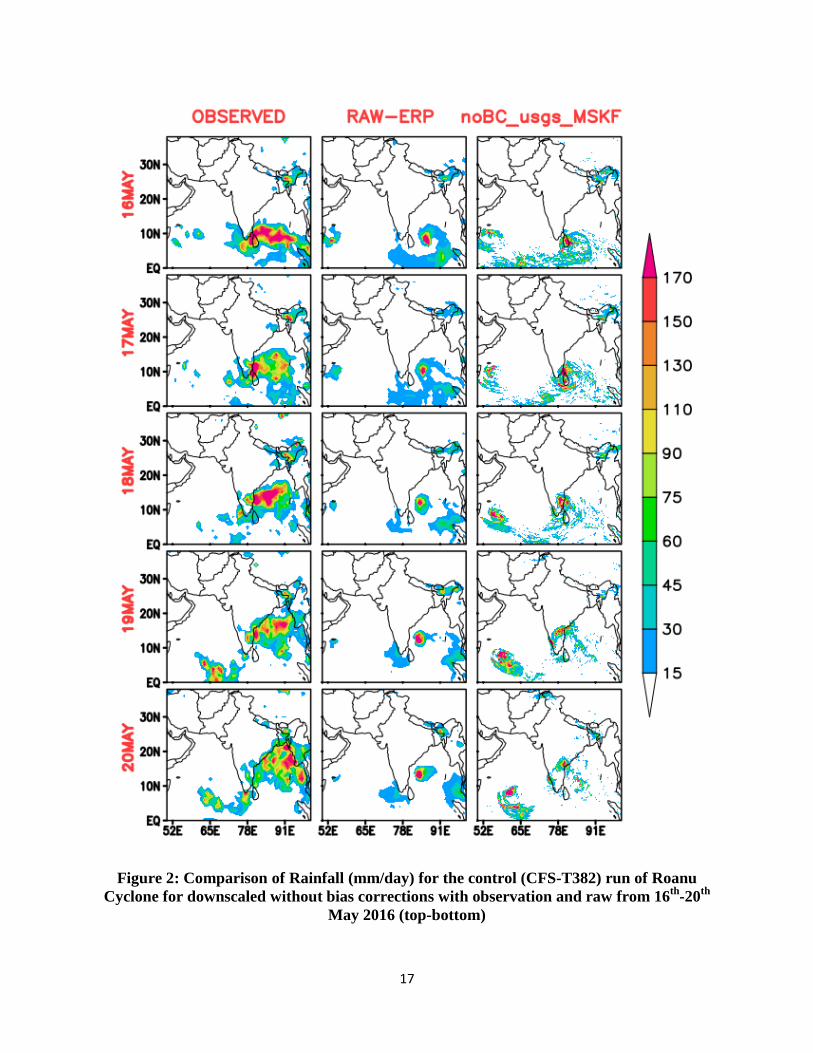
Figure 2 depicts observed rainfall along with rainfall from raw-ERP (control CFS-T382) and
noBC_usgs_MSKF rainfall. In observed rainfall, cyclonic system is developed near Sri Lanka and moved
northeastwards along the east coast of India. In raw-ERP, this system is slightly away from Sri Lanka
coast and seems to be stagnant near Tamil Nadu and Andhra coast during 16th to 20
th May. In the case of
noBC_usgs_MSKF, this system has developed at right location and started moving into the eastern
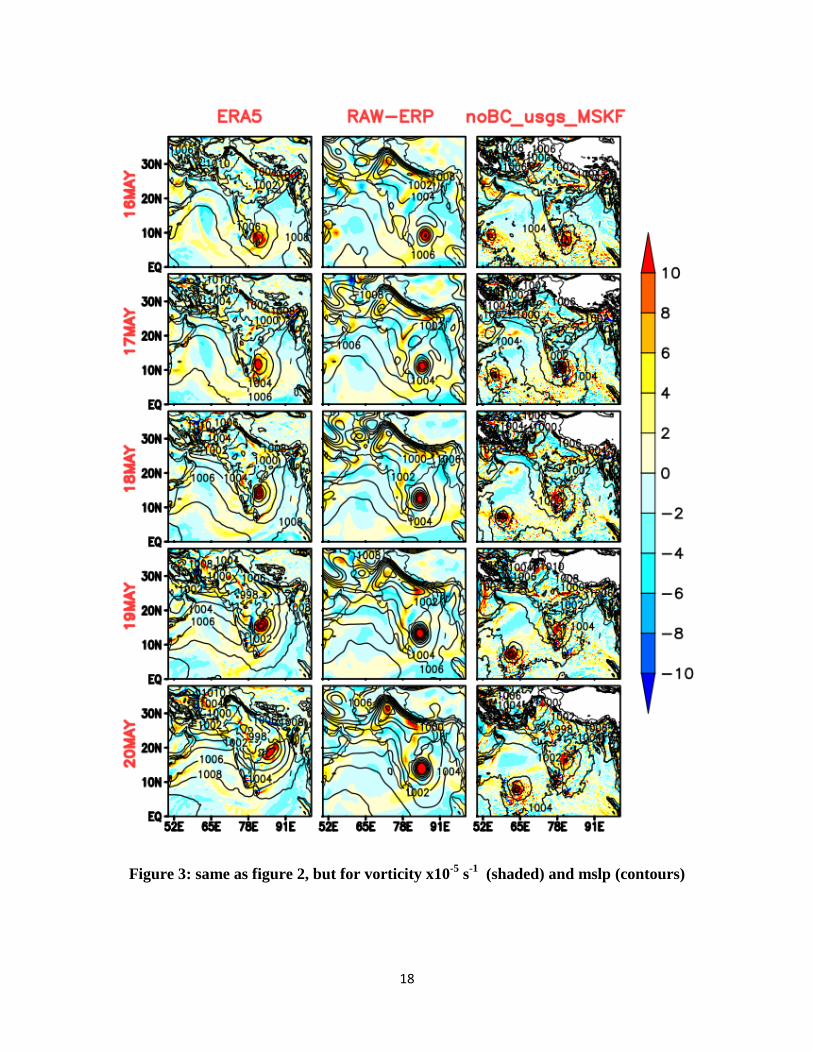
peninsular coast instead of moving towards northeast. Similar features are noted from the vorticity and
MSLP plots in Figure 3.
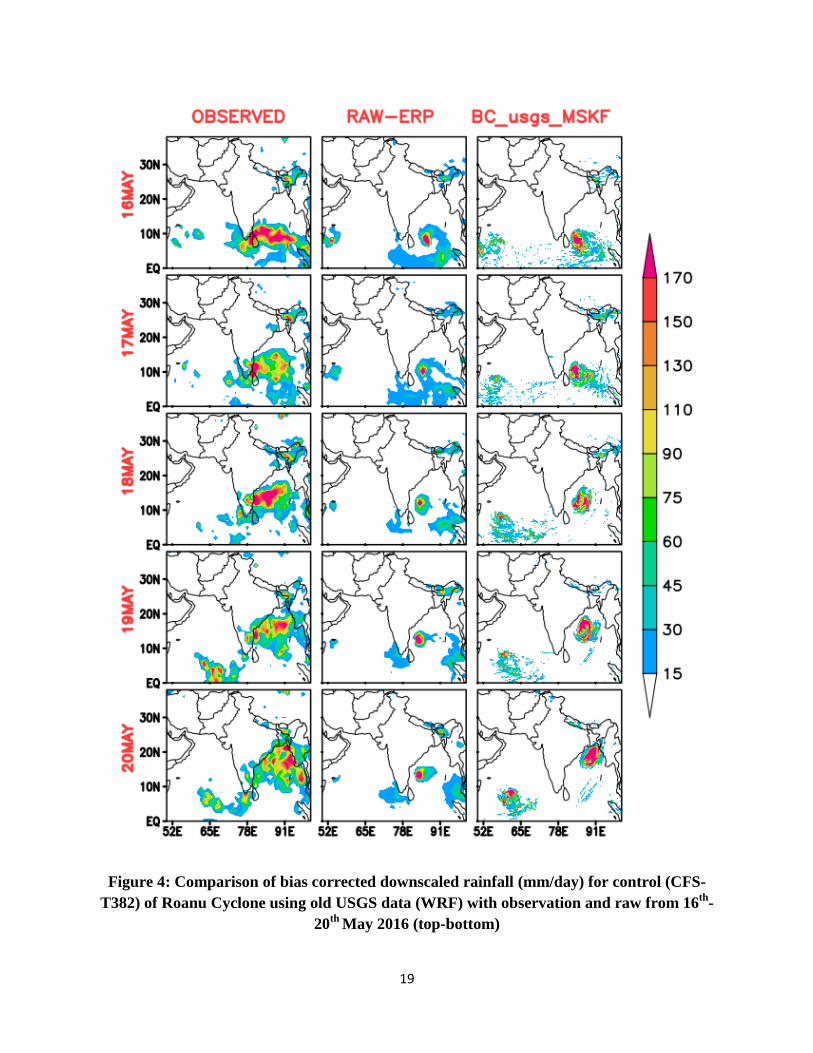
Rainfall spatial plot for BC_usgs_MSKF, given in right most column of Figure 4, shows a clear
movement of the system similar to the observed but slightly away from the coast. The development and
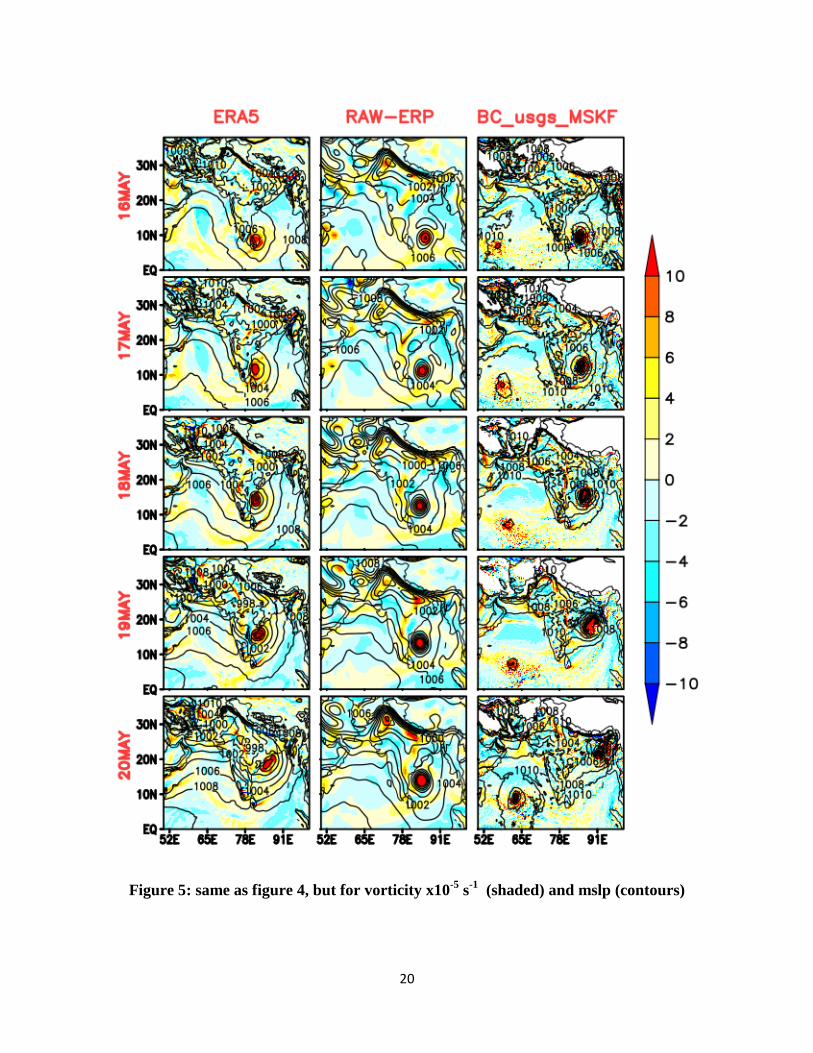
directional movement of system is found to be improved with bias-correction. Figure 5 for vorticity and
MSLP support this movement but it is seen that a strong false system is predicted in Arabian Sea near
equator, which is absent in observation (extreme left panel of the figure).
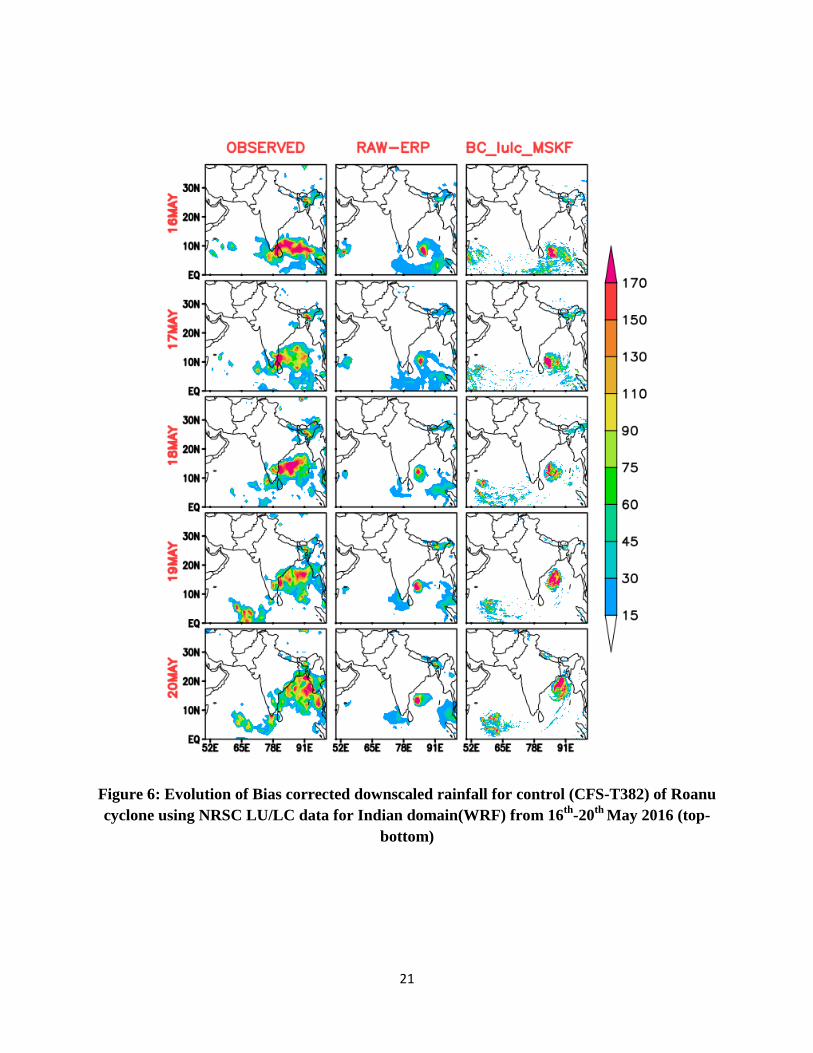
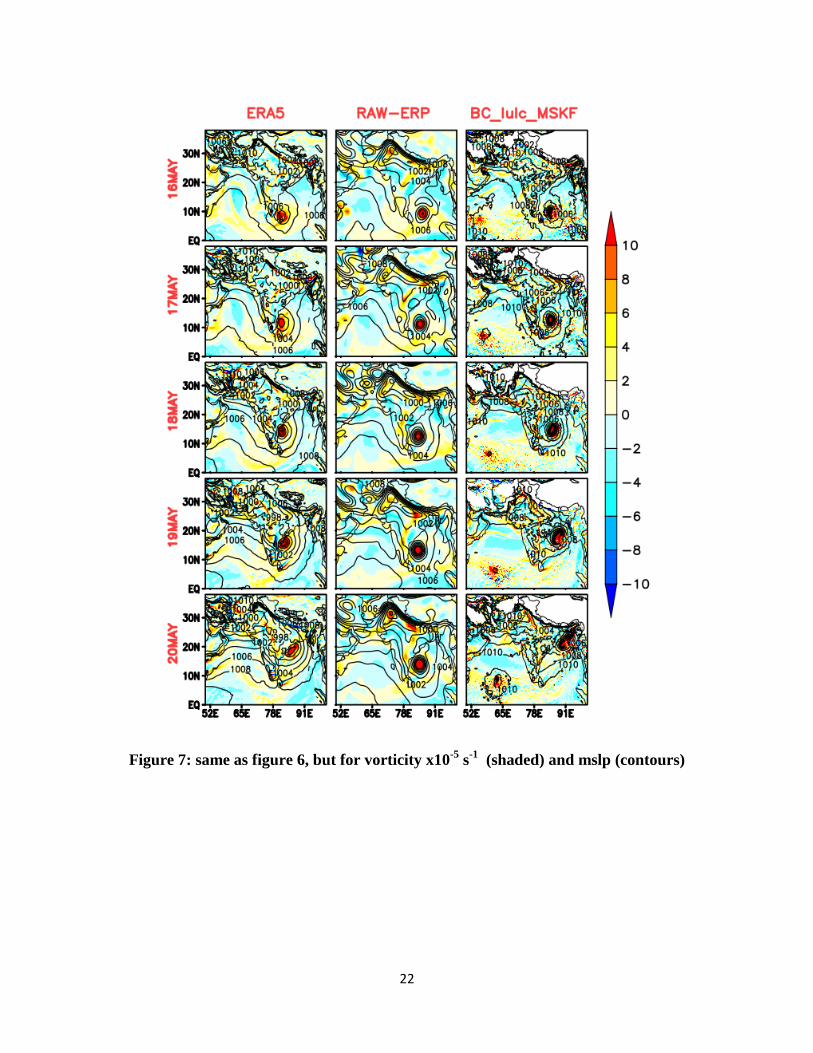
By replacing USGS data with NRSC-LU/LC data over Indian region, the development, intensification
and northeastward movement of Roanu is comparable to observation, as seen from Figure 6 and 7. The
spatial and temporal evolution of the cyclone is better captured by BC_lulc_MSKF. And the false system
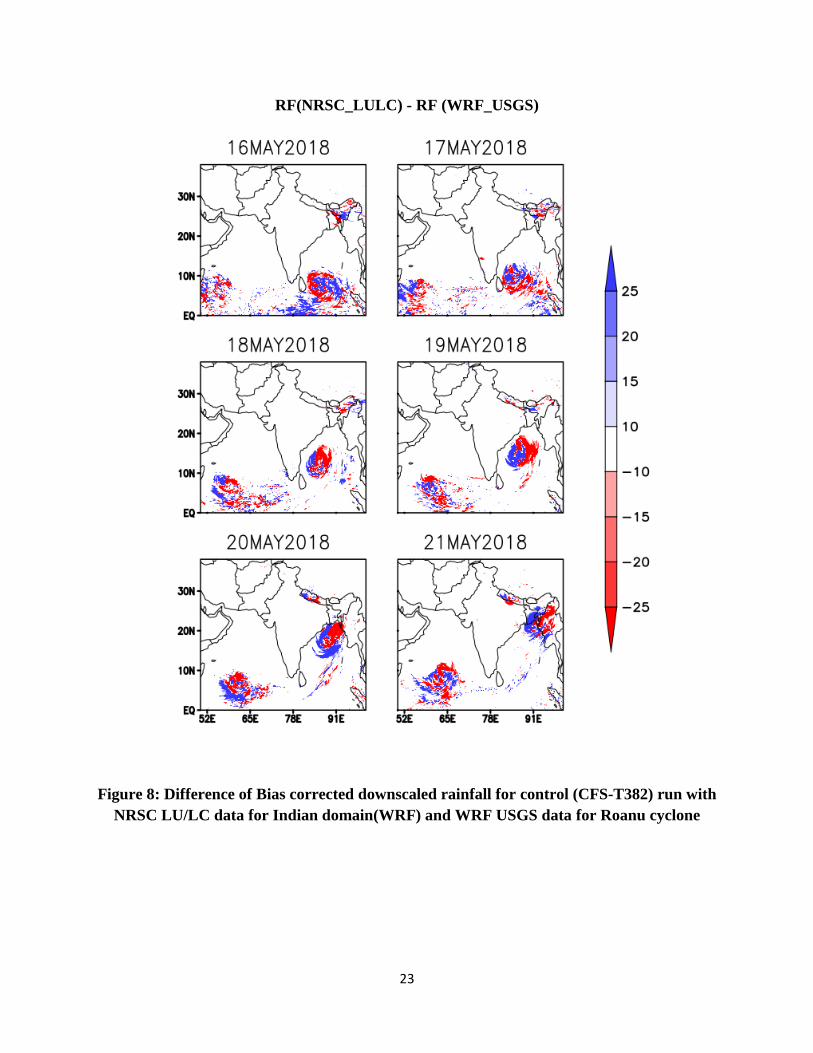
over Arabian sea, seen in BC_usgs_MSKF is less intense in the BC_lulc_MSKF. This becomes clearer in
Figure 8 where the difference of rainfall for BC_lulc_MSKF and BC_usgs_MSKF (RainfallBC_lulc_MSKF-
8
RainfallBC_usgs_MSKF) is plotted. It is found that cyclonic movement is fast in BC_usgs_MSKF and the
Arabian Sea feeble system is more intensified, as compared to BC_lulc_MSKF.
As evident from above mentioned plots, BC_lulc_MSKF is giving more accurate results and close to
observation.
3.1.2 Results from final setup
Based on the results from experiments discussed in previous section, we have finalized the downscaling
forecast setup for this study which includes 6-hourly bias-correction and incorporated NRSC-LU/LC data
in WRF. The model has been run for all 16 ensembles and the ensemble average of WRF output
(hereafter termed as ERPWRF) is analyzed.
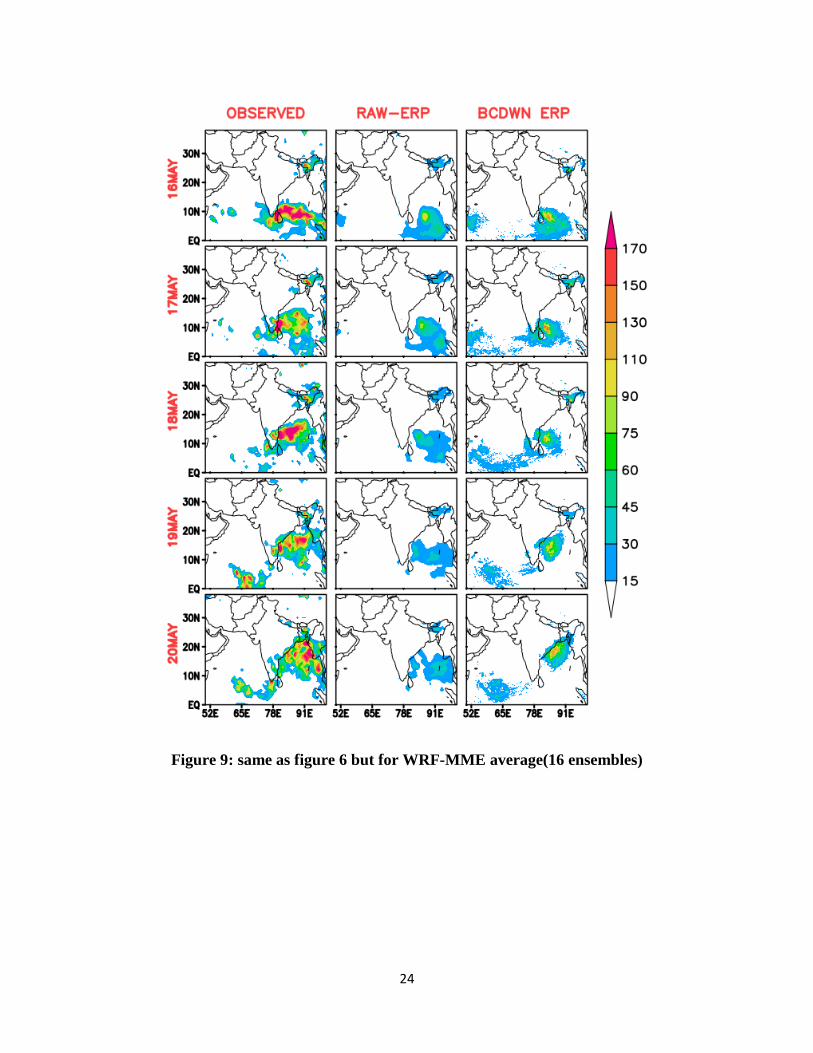
Figure 9 shows the observed, raw-ERP multi-model ensemble mean (MME) and ERPWRF rainfall for
the Roanu cyclone. Observed rainfall amount is more than 170 mm extended almost from 770-100
0E, raw-
ERP did capture cyclone vortex but the magnitude and spatial extent of rainfall are not realistic when
compared to the observations. In ERPWRF forecasted magnitude as well as zonal spread of rainfall is
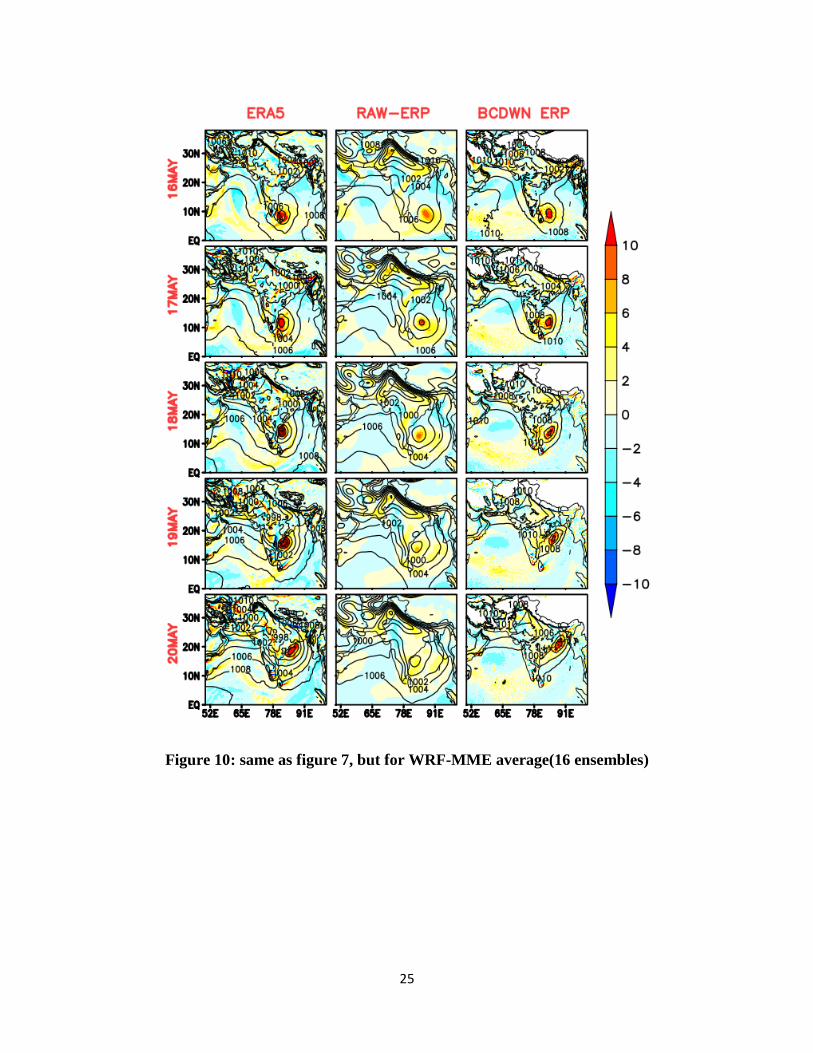
better than raw-ERP. In Figure 10 vorticity (shaded) and mean sea level pressure (MSLP contours) are
shown from 16th-20
th May 2016 for ERA5 reanalysis, raw-ERP, ERPWRF. The vortex in raw-ERP is
moving very slow into the Odisha coast. On the other hand, ERPWRF is giving better intensity of cyclone
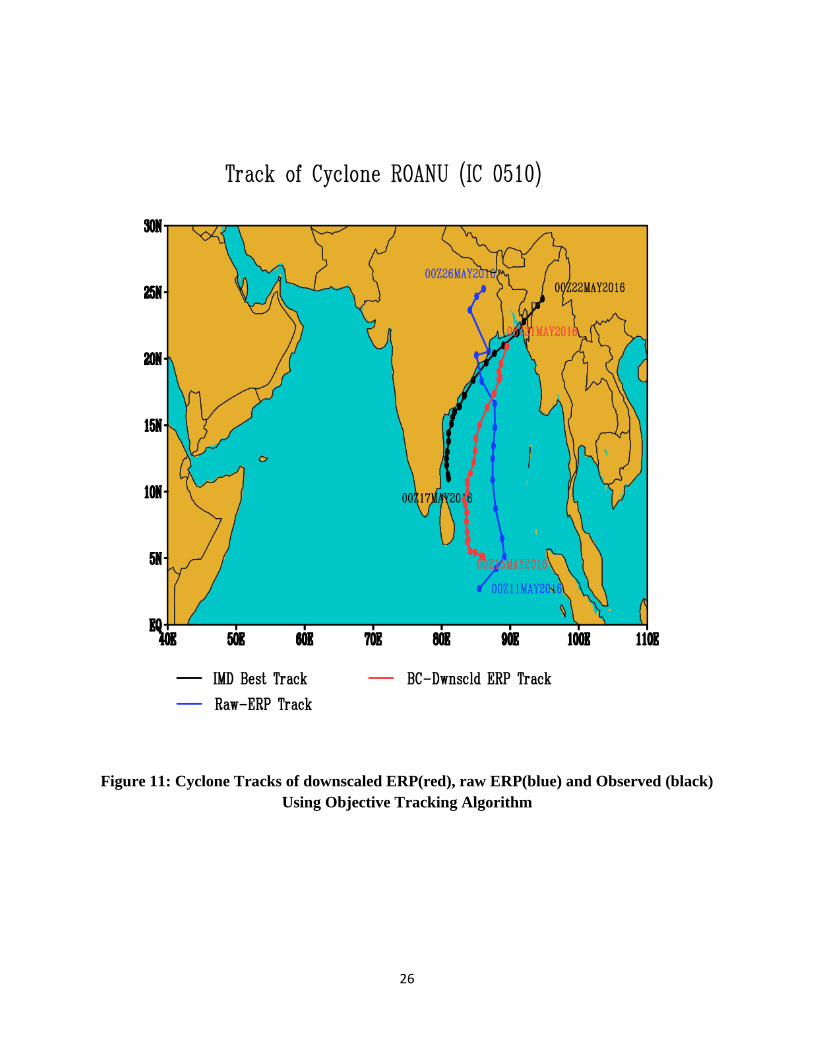
with vortex moving northeastward slightly away from coast. Figure 11 shows the track of Roanu cyclone
using objective tracking algorithm for raw-ERP (blue) and ERPWRF (red) compared against IMD best
track (black). Track for raw-ERP shows slow vortex movement and the direction of this system is quite
different from the observation. ERPWRF track is close to the observed IMD track albeit with a shift
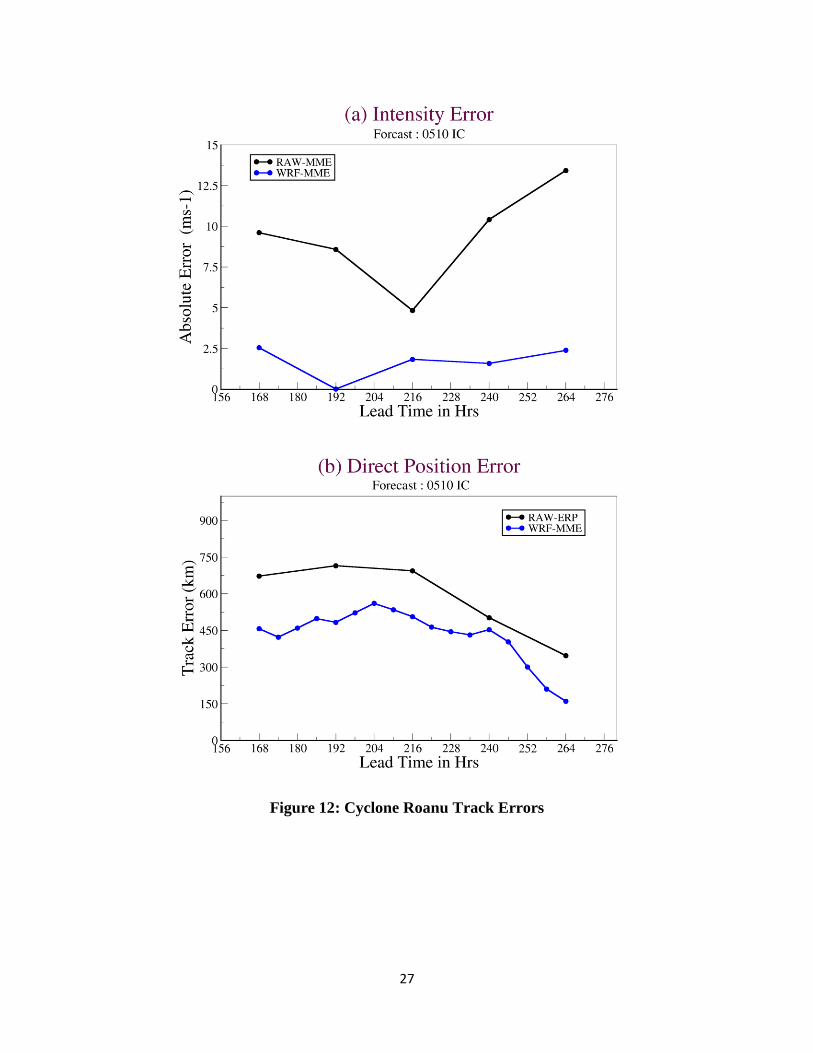
towards east. Cyclone Roanu intensity (Figure12 (a)) and position (Figure12 (b)) errors are plotted, it is
evident from Figure12 that in WRF-MME both errors are reduced, Intensity error shows that Roanu
cyclone intensity is improved remarkably in WRF-MME.
3.2 Uttarakhand Heavy Rainfall 2013
Heavy rainfall during 14th
-17th
June 2013 in Uttarakhand caused landslides and flooding resulting into
excessive loss. Studies have shown that this event was a result of interaction of monsoonal flow with the
trough in mid-latitude westerlies (similar to 2010 Pakistan flood)6.
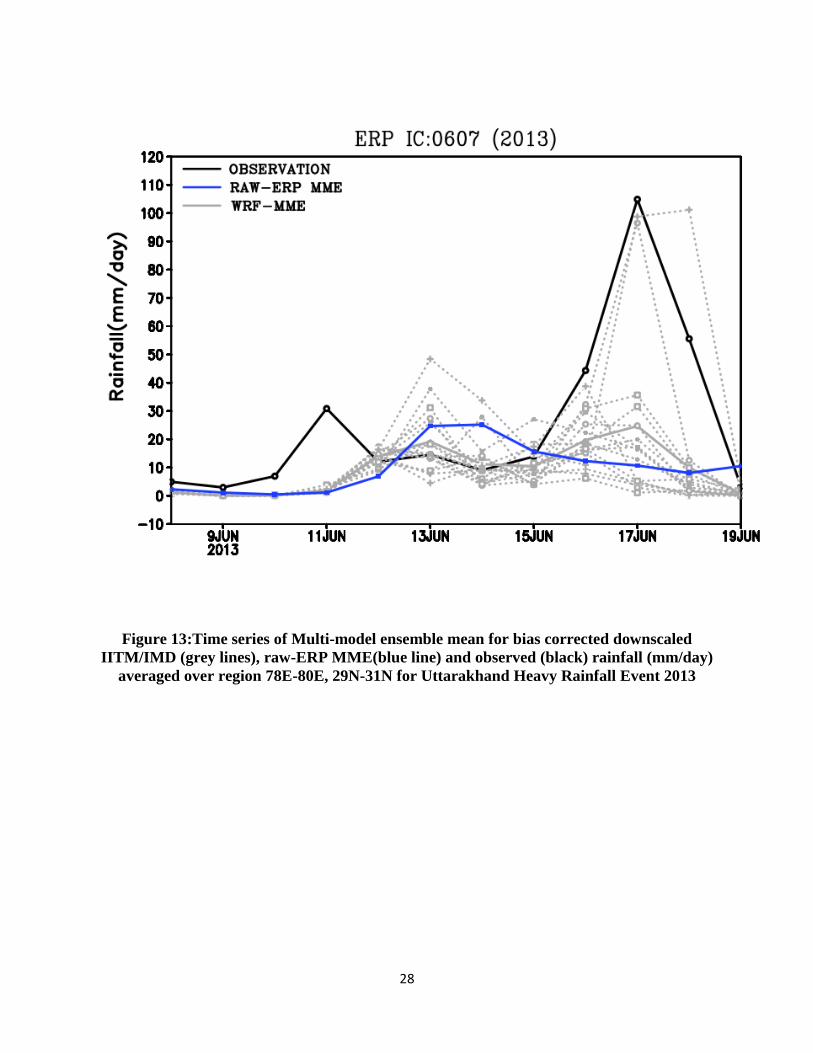
Extended range forecasts of 16 ensemble members from 7th June initial condition is downscaled
individually after bias-correction. Figure 13 shows the time series of area averaged rainfall (in mm/day)
over Uttarakhand region (780E-80
0E, 29
0N-31
0N) plotted for Ensemble members (dotted grey lines),
9
mean of all 16 members i.e. WRF-MME (solid grey line) and IMD rainfall data (black line) that is used
for comparison. Although observed rainfall show two peaks on 11th and 17
th June, the raw-ERP ensemble
mean (blue line) failed to predict these peaks. It is evident that in ERPWRF, few members are giving
rainfall amount comparable to observations. However rainfall is much less in most of the members,
resulting the mean to be around 20mm while the observed rainfall was >100mm on 17th June. Though the
intensity of the rainfall is not captured by WRF-MME, the probability of getting 100mm rainfall is more
than 10% on 17th June from the ERPWRF indicating that the model is able to capture the intensity of the
event to some extent.
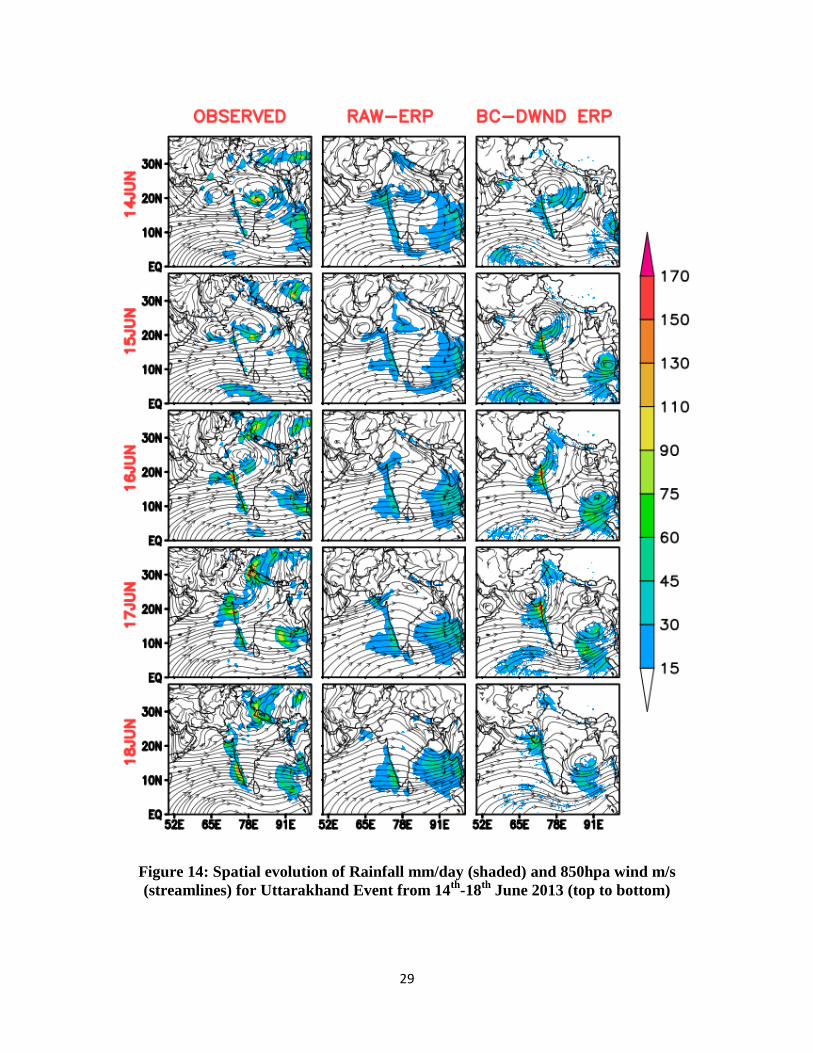
This can also be explained from the Figure 14 where the spatial distribution of rainfall (shaded) and
velocity streamlines (850hpa winds) are shown for 14th -18
th June 2013. Observed, raw-ERP and
ERPWRF are compared; raw-ERP could not predict rainfall over the Uttarakhand region during this
period but ERPWRF has realistically captured the rainfall and circulation pattern. Observed circulation
pattern shows interaction between an offshore trough over west coast and BOB low pressure system
moving northwestwards, which was the prominent meteorological aspect as highlighted in earlier study6.
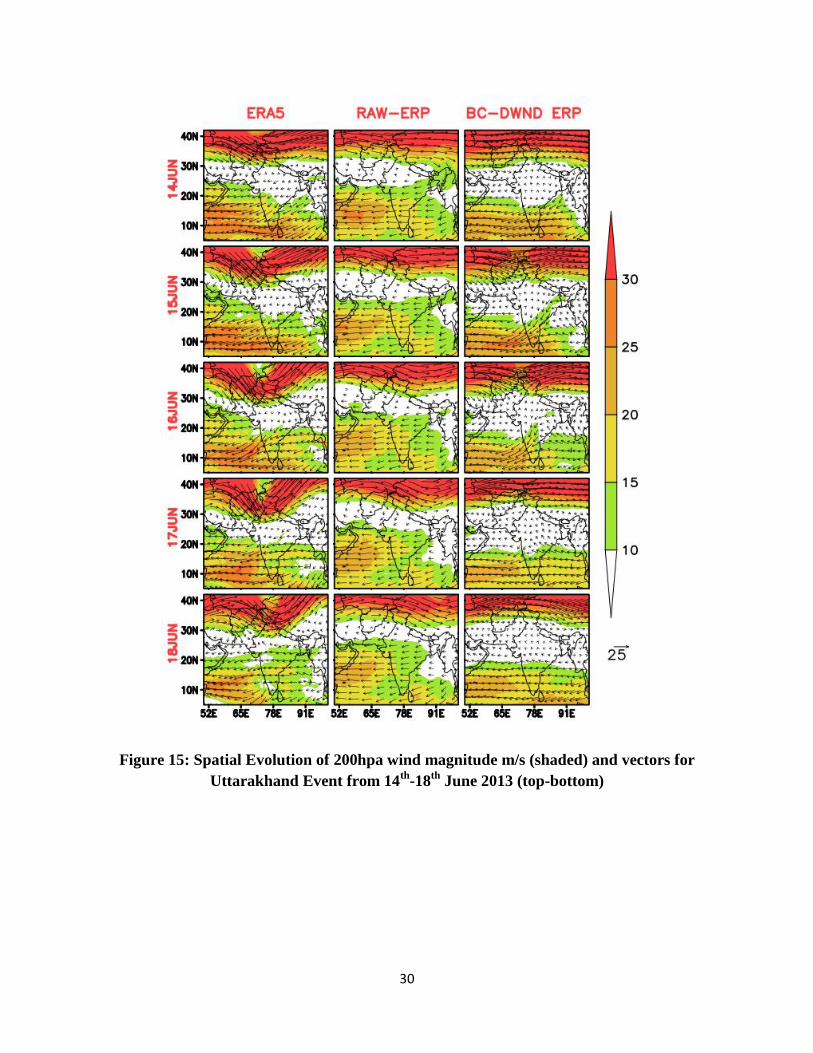
In Figure 15 200hpa wind vector and it's magnitude(shaded) has been plotted, where a deep upper
tropospheric westerly trough over northern part of country can be seen in observation. This upper level
trough has favored unstable local conditions at lower level6 which resulted in the heavy rainfall over the
region. This trough is absent in raw-ERP, whereas in ERPWRF upper level trough is present though not
as prominent as in observation. ERPWRF also captured the northeasterly flow over Arabian Sea similar to
observation which implies that the model could predict overall circulation pattern. Since the dynamics
behind the event is captured by bias-corrected and downscaled setup to some extent, it can be concluded
that the rainfall peak in ERPWRF is realistic and not caused by any false conditions. ERPWRF is able to
give indication with more than 10% probability of 17th June Uttarakhand rainfall (> 9.5cm) almost 10
days in advance from initial condition of 7th June.
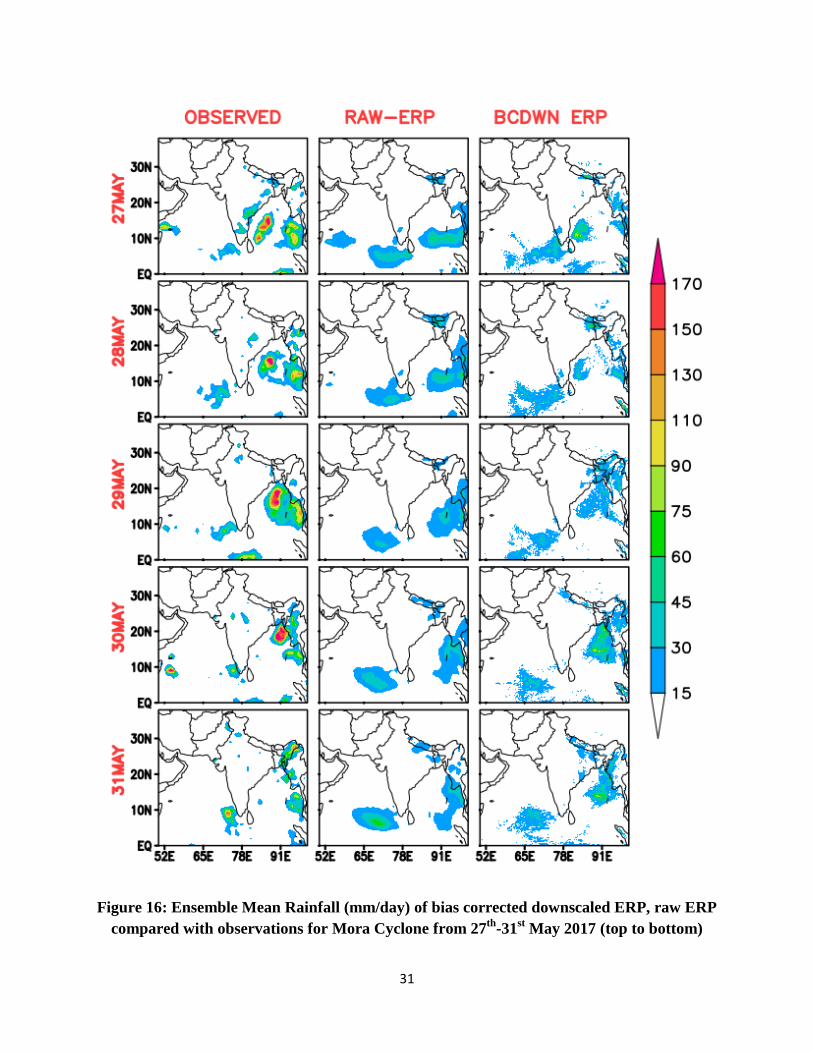
3.3 Severe Cyclonic Storm Mora of 2017
A well Marked low pressure area over central Bay of Bengal became depression on 28th May 2017,
moved east northeastwards and same day intensified into cyclonic storm Mora. On 29th May it moved
north northwestward, kept on moving in this direction and finally weakened into depression over
northeast Indian states37
.
Figure 16 depicts the rainfall from observations, raw-ERP and ERPWRF forecasts from 27th to 31
st May
2016. ERPWRF is able to forecast rainfall spatial extent similar to observation but the intensity is very
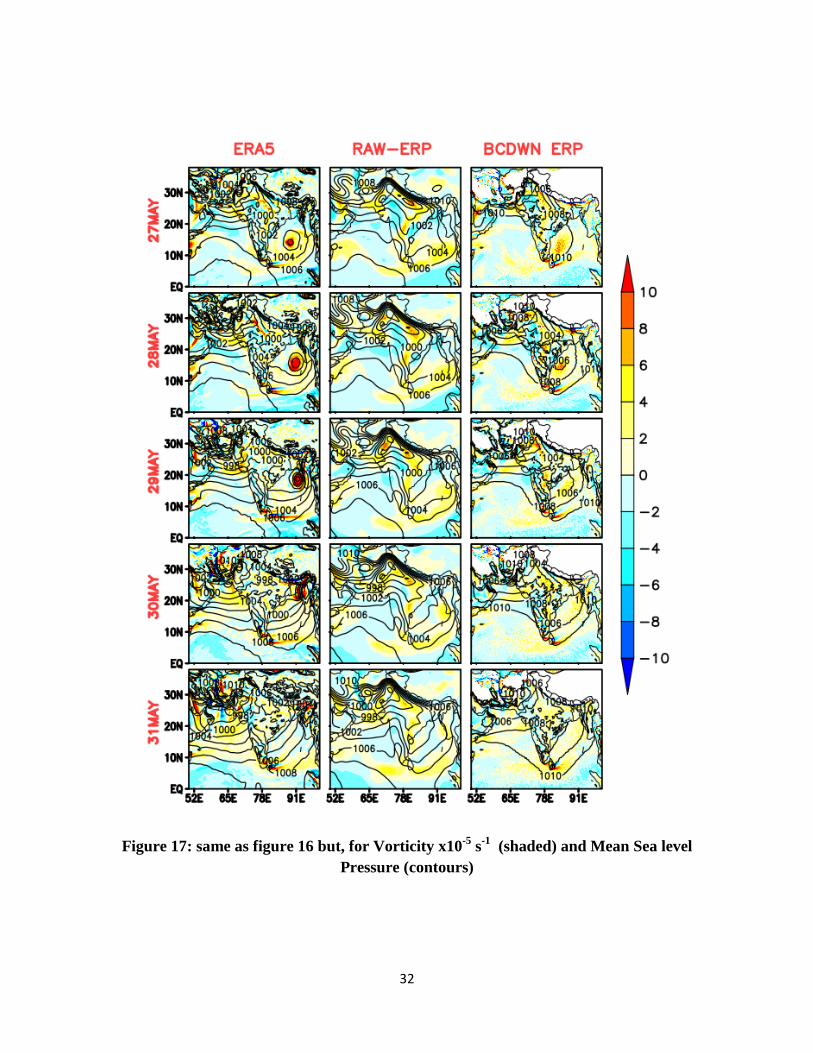
less. Although the rainfall associated with the cyclone follows observed movement, the vortex is not
10
predicted by ERPWRF (Figure 17). The raw-ERP has not shown the rainfall intensity and movement of
the cyclone and no vortex formation is seen (Figure 17). Since objective tracking algorithm decides the
track based on threshold values of vorticity and MSLP, which are not fulfilled by either raw-ERP or
ERPWRF, the track could not be plotted for cyclone Mora. Its noticed that there are some shortcoming in
predicting Mora cyclone with respect to its intensity and track compared to observation. Still it is better
captured in ERPWRF compared to raw-ERP.
4. Conclusions and Remarks
An assessment of bias-correction and downscaling forecast strategy with an aim to improve the extreme
events in extended range prediction is presented in this study. For this, the ERP forecasts are downscaled
to 9km resolution after bias-correction. Initial results suggest that bias-corrected and downscaled ERP
outputs shows better evolution of selected extreme events. All the runs are started with initial conditions
7-10 days prior to the event and these runs are carried out with 6-class WRF double moment scheme
along with MSKF cumulus parameterization for better representation of the large-scale and the grid-scale
precipitation. Also, the influence of the land-use land-cover has been tested for the tropical cyclone
Roanu. ERPWRF forecasts using NRSC-LU/LC data shows some improvement in predicting the rainfall
intensity and overall system movement. However, as the tested case is an oceanic system, the results does
not show any prominent difference. The impact of LU/LC data in predicting heavy rainfall events over
Indian region is being explored in detail and will be reported shortly in a separate study.
The final forecast setup for the present study uses 6-hourly bias-correction and NRSC-LU/LC data for all
16 members of the ERP. It is found that the ERPWRF forecast of rainfall intensity and track for Roanu
cyclone is better than the raw-ERP. The interaction between monsoon low pressure systems and mid-
latitude westerly trough associated with Uttarakhand heavy rainfall event is predicted to some extent by
ERPWRF. Although the vortex formation for cyclone Mora is absent in ERPWRF, it showed some
improvement in predicting the spatial pattern of rainfall.
The benefit of using forecast strategy based on dynamical downscaling is to take advantage of skillful
coarse resolution forecasts from established prediction system to get more reliable weather information at
higher resolution and with lead time of at least 10-12 days. Besides having few shortcomings, the bias-
corrected and downscaled approach provides optimism in predicting extreme events. The shortcomings
noticed in the present study will be addressed in future studies.

11
Acknowledgements
IITM is fully funded by Ministry of Earth Science, Govt. of India. Model runs are carried out on
High Performance Computer (HPC) Pratyush installed at IITM, Pune. Authors are grateful to the
Dr. P. Mukhopadhyay and Dr. Swapna P. for their constructive comments.
12
References
1. Goswami BN, Venugopal V, Sengupta D, Madusoodan MS, Xavier PK. Increasing Treand of
Extreme Rain Events Over India in Warming Environment. Science (80- ). 2006;314:1442-1445.
2. Easterling DR, Evans JL, Groisman PY. Observed Variability and Trends in Extreme Climate
Events: A Brief Review *. 1999:417-425.
3. Saha S, Moorthi S, Wu X, et al. The NCEP climate forecast system version 2. J Clim.
2014;27(6):2185-2208. doi:10.1175/JCLI-D-12-00823.1
4. Abhilash S, Sahai AK, Pattnaik S, Goswami BN, Kumar A. Extended range prediction of active-
break spells of Indian summer monsoon rainfall using an ensemble prediction system in NCEP
Climate Forecast System. Int J Climatol. 2014;34(1):98-113. doi:10.1002/joc.3668
5. Sahai AK, Chattopadhyay R, Joseph S, Phani R, Abhilash S. Range Prediction System and its
Application. Vayu Mandal. 2016;42(2).
6. Joseph S, Sahai AK, Sharmila S, et al. North Indian heavy rainfall event during June 2013:
diagnostics and extended range prediction. Clim Dyn. 2015;44(7-8):2049-2065.
doi:10.1007/s00382-014-2291-5
7. Xu Z, Yang ZL. An improved dynamical downscaling method with GCM bias corrections and its
validation with 30 years of climate simulations. J Clim. 2012;25(18):6271-6286.
doi:10.1175/JCLI-D-12-00005.1
8. Christensen JH, Boberg F, Christensen OB, Lucas-Picher P. On the need for bias correction of
regional climate change projections of temperature and precipitation. Geophys Res Lett.
2008;35(20). doi:10.1029/2008GL035694
9. Bruyère CL, Done JM, Holland GJ, Fredrick S. Bias corrections of global models for regional
climate simulations of high-impact weather. Clim Dyn. 2013;43(7-8):1847-1856.
doi:10.1007/s00382-013-2011-6
10. Sato T, Kimura F, Kitoh A. Projection of global warming onto regional precipitation over
Mongolia using a regional climate model. J Hydrol. 2007;333(1):144-154.
doi:10.1016/j.jhydrol.2006.07.023
11. Done JM, Holland GJ, Bruyère CL, Leung LR, Suzuki-Parker A. Modeling high-impact weather
and climate: lessons from a tropical cyclone perspective. Clim Change. 2015;129(3-4):381-395.
doi:10.1007/s10584-013-0954-6
13
12. Lo JCF, Yang ZL, Pielke RA. Assessment of three dynamical climate downscaling methods using
the Weather Research and Forecasting (WRF) model. J Geophys Res Atmos. 2008;113(9).
doi:10.1029/2007JDO09216
13. Houze RA, McMurdie LA, Rasmussen KL, Kumar A, Chaplin MM. Multiscale Aspects of the
Storm Producing the June 2013 Flooding in Uttarakhand, India. Mon Weather Rev.
2017;145(11):4447-4466. doi:10.1175/MWR-D-17-0004.1
14. Srinivas C V., Hariprasad D, Bhaskar Rao D V., Anjaneyulu Y, Baskaran R, Venkatraman B.
Simulation of the Indian summer monsoon regional climate using advanced research WRF model.
Int J Climatol. 2013;33(5):1195-1210. doi:10.1002/joc.3505
15. Sahai AK, Sharmila S, Abhilash S, Chattopadhyay R, Borah N. Simulation and extended range
prediction of monsoon intraseasonal oscillations in NCEP CFS / GFS v2 framework. May 2013.
16. Janjic ZI. BMJ_2004.pdf.
17. Betts AK, Miller MJ. A new convective adjustment scheme. Part 11: Single column tests using
GATE wave, BOMEX, ATEX and arctic air-mass data sets. 1986;2:693-709.
18. Kain JS. The Kain–Fritsch Convective Parameterization: An Update. J Appl Meteorol.
2004;43(1):170-181. doi:10.1175/1520-0450(2004)043<0170:TKCPAU>2.0.CO;2
19. Grell GA, Devenyi D. A generalized approach to parameterizing convection combining ensemble
and data assimilation techniques. 2002;29(14):10-13.
20. Mukhopadhyay P, Taraphdar S, Goswami BN, Krishnakumar K. Indian Summer Monsoon
Precipitation Climatology in a High-Resolution Regional Climate Model: Impacts of Convective
Parameterization on Systematic Biases. Weather Forecast. 2010;25(2):369-387.
doi:10.1175/2009WAF2222320.1
21. Chen X, Pauluis O, Zhang F. Regional simulation of Indian summer monsoon intraseasonal
oscillations at gray-zone resolution. Atmos Chem Phys. 2018;18(2):1003-1022. doi:10.5194/acp-
18-1003-2018
22. Zheng Y, Alapaty K, Herwehe JA, Del Genio AD, Niyogi D. Improving High-Resolution Weather
Forecasts Using the Weather Research and Forecasting (WRF) Model with an Updated Kain–
Fritsch Scheme. Mon Weather Rev. 2016;144(3):833-860. doi:10.1175/MWR-D-15-0005.1
23. Lim K-SS, Hong S-Y. Development of an Effective Double-Moment Cloud Microphysics Scheme
with Prognostic Cloud Condensation Nuclei (CCN) for Weather and Climate Models. Mon
Weather Rev. 2010;138(5):1587-1612. doi:10.1175/2009MWR2968.1
14
24. Li J, Zheng X, Zhang C, Chen Y. Impact of Land-Use and Land-Cover Change on Meteorology in
the Beijing – Tianjin – Hebei Region from 1990 to 2010. 2018. doi:10.3390/su10010176
25. Paul S, Ghosh S, Oglesby R, Pathak A, Chandrasekharan A. Weakening of Indian Summer
Monsoon Rainfall due to Changes in Land Use Land Cover. Nat Publ Gr. 2016;(August).
doi:10.1038/srep32177
26. Roy, Parth & Murthy, Msr & Sharma, Jaswant & Murthy, Y.V.S. & Veena Suresh, Sai & Murthy,
K.S. & Kandrika, Sreenivas & Kameswara Rao, S.V.C. & Anasuya, T & Porwal, M.C. & Pathak,
Suparn & Ravi Kumar, M.V. & Bothale, Vinod & Sekhar, N.Seshadri & Ramadevi, B. National
Land Use and Land Cover Mapping Using Multi-temporal AWiFS Data. 2008;(December).
27. Klemp JB, Gill DO, Barker DM, Duda MG, Wang W, Powers JG. A Description of the Advanced
Research WRF Version 3. 2008;(June).
28. Hong S-Y, Noh Y, Dudhia J. A New Vertical Diffusion Package with an Explicit Treatment of
Entrainment Processes. Mon Weather Rev. 2006;134(9):2318-2341. doi:10.1175/MWR3199.1
29. Dudhia J. Numerical Study of Convection Observed during the Winter Monsoon Experiment
Using a Mesoscale Two-Dimensional Model. J Atmos Sci. 1989;46(20):3077-3107.
doi:10.1175/1520-0469(1989)046<3077:NSOCOD>2.0.CO;2
30. Mlawer EJ, Taubman SJ, Brown PD, Iacono MJ, Clough SA. Radiative transfer for
inhomogeneous atmospheres: RRTM, a validated correlated-k model for the longwave. J Geophys
Res Atmos. 1997;102(D14):16663-16682. doi:10.1029/97JD00237
31. Saha S, Moorthi S, Pan HL, et al. The NCEP climate forecast system reanalysis. Bull Am Meteorol
Soc. 2010;91(8):1015-1057. doi:10.1175/2010BAMS3001.1
32. Mitra AK, Bohra AK, Rajeevan MN, Krishnamurti TN. Daily Indian Precipitation Analysis
Formed from a Merge of Rain-Gauge Data with the TRMM TMPA Satellite-Derived Rainfall
Estimates. J Meteorol Soc Japan. 2009;87A:265-279. doi:10.2151/jmsj.87A.265
33. Hersbach H. ERA5 and the use of ERA data European Centre for Medium-Range.
34. Marchok TP. 2. data requirements. 1998.
35. Ganesh SS, Sahai AK. A New Approach to Improve the Track Prediction of Tropical Cyclones
Over North Indian Ocean. 2018;(Ic):1-9. doi:10.1029/2018GL077650
36. IMD. RSMC Bulletin for Tropical Cyclones.; 2016.
37. IMD. RSMC Bulletin for Tropical Cyclones.; 2017.
15
Table 1: Experiment details of downscaled ERP Runs
S. NO.
Event
Duration
ERP IC for
forecast
1.
Uttarakhand Heavy Rainfall
16th
-17th
June 2013
0607
2.
Cyclone Roanu
17th
-22nd
May 2016
0510
3.
Cyclone Mora
28th
-31st May 2017
0524
Table 2: Experimental runs for Cyclone Roanu
Sr. No. Experiment for control (CFS-T382)
1. No Bias Correction + WRF Global USGS data noBC_usgs_MSKF
2. Bias Correction + WRF Global USGS data BC_usgs_MSKF
3. Bias Correction + NRSC LULC data for India BC_lulc_MSKF
16
Figure1: Schematic of Forecast Strategy for Bias-corrected downscaled ERP
IITM/IMD ERP
CFSv2 T126
CFSv2 T382
GFSv2 T126 (BC-SST)
GFSv2 T382 (BC-SST)
BC-Downscaled ERP
WRF-CFS126
WRF-CFS382
WRF-GFS126
WRF-GFS382
WRF
multimodel
ensemble
mean (WRF-
MME)
17
Figure 2: Comparison of Rainfall (mm/day) for the control (CFS-T382) run of Roanu
Cyclone for downscaled without bias corrections with observation and raw from 16th
-20th
May 2016 (top-bottom)
18
Figure 3: same as figure 2, but for vorticity x10-5
s-1
(shaded) and mslp (contours)
19
Figure 4: Comparison of bias corrected downscaled rainfall (mm/day) for control (CFS-
T382) of Roanu Cyclone using old USGS data (WRF) with observation and raw from 16th
-
20th
May 2016 (top-bottom)
20
Figure 5: same as figure 4, but for vorticity x10-5
s-1
(shaded) and mslp (contours)
21
Figure 6: Evolution of Bias corrected downscaled rainfall for control (CFS-T382) of Roanu
cyclone using NRSC LU/LC data for Indian domain(WRF) from 16th
-20th
May 2016 (top-
bottom)
22
Figure 7: same as figure 6, but for vorticity x10-5
s-1
(shaded) and mslp (contours)
23
RF(NRSC_LULC) - RF (WRF_USGS)
Figure 8: Difference of Bias corrected downscaled rainfall for control (CFS-T382) run with
NRSC LU/LC data for Indian domain(WRF) and WRF USGS data for Roanu cyclone
24
Figure 9: same as figure 6 but for WRF-MME average(16 ensembles)
25
Figure 10: same as figure 7, but for WRF-MME average(16 ensembles)
26
Figure 11: Cyclone Tracks of downscaled ERP(red), raw ERP(blue) and Observed (black)
Using Objective Tracking Algorithm
27
Figure 12: Cyclone Roanu Track Errors
28
Figure 13:Time series of Multi-model ensemble mean for bias corrected downscaled
IITM/IMD (grey lines), raw-ERP MME(blue line) and observed (black) rainfall (mm/day)
averaged over region 78E-80E, 29N-31N for Uttarakhand Heavy Rainfall Event 2013
29
Figure 14: Spatial evolution of Rainfall mm/day (shaded) and 850hpa wind m/s
(streamlines) for Uttarakhand Event from 14th
-18th
June 2013 (top to bottom)
30
Figure 15: Spatial Evolution of 200hpa wind magnitude m/s (shaded) and vectors for
Uttarakhand Event from 14th
-18th
June 2013 (top-bottom)
31
Figure 16: Ensemble Mean Rainfall (mm/day) of bias corrected downscaled ERP, raw ERP
compared with observations for Mora Cyclone from 27th
-31st May 2017 (top to bottom)
32
Figure 17: same as figure 16 but, for Vorticity x10-5
s-1
(shaded) and Mean Sea level
Pressure (contours)