bibliography - springer978-3-8349-8926-0/1.pdf · bibliography auckenthaler, c. ... barclays...
TRANSCRIPT

144 BIBLIOGRAPHY
Bibliography
Auckenthaler, C. (1991). Trust Banking – Theorie und Praxis des Anlagegeschäfts. Bern: Paul Haupt.
Bank for International Settlements (BIS, 2005). Amendment to the Capital Accord to incorporate market risks. Retrieved December 14, 2009 from http:// www.bis.org/publ/bcbs119.pdf?noframes=1
Bank for International Settlements (BIS, 2004). International Convergence of Capi-tal Measurement and Capital Standards. Retrieved December 14, 2009 from http://www.bis.org/publ/bcbs107.pdf
Barclays Capital (2010). Global family of indices – February 2010. Retrieved March 12, 2010 from www.themarkets.com (restricted access).
BlueOrchard (2009). Fund prospect Dexia Microcredit Fund. Retrieved May 14, 2009 from http://www.blueorchard.com/jahia/Jahia/Products_1/pid/190
Brinson, G. P., Hood, L. R. & G. L. Beebower (1986). Determinants of Portfolio Performance. Financial Analysts Journal, 39-44.
Brooks, C. & H. M. Kat (2002). The Statistical Properties of Hedge Fund Return Index Returns and Their Implications for Investors. The Journal of Alternative Investments, 26-44.
Callaghan, I., Gonazalez, H. Maurice, D. & C. Novak (2007). Microfinance – On the Road to Capital Markets. Journal of Applied Corporate Finance, Morgan Stanley, 115-124.
Campbell, J. Y., Lo, A. W. & A. C. MacKinlay (1997). The econometrics of finan-cial markets. Princeton: Princeton University Press
Citigroup (2010). International market indexes – February 2010 performance. Retrieved March 12, 2010 from www.themarkets.com (restricted access).
P. M. Becker, Investing in Microfinance, DOI 10.1007/978-3-8349-8926-0 © Gabler Verlag | Springer Fachmedien Wiesbaden GmbH 2010

BIBLIOGRAPHY 145
Consultative Group to Assist the Poor (CGAP, 2009a). The impact of the financial crisis on microfinance institutions and their clients. CGAP Brief. Retrieved De-cember 14, 2009 from http://www.cgap.org/gm/document-1.9.38570/CGAPBrief _MIV.pdf
Consultative Group to Assist the Poor (CGAP, 2009b). MIV performance and pros-pects: highlights from the CGAP 2009 MIV Benchmark Survey. CGAP Brief. Retrieved December 14, 2009 from http://www.cgap.org/gm/document-1.9.38570/CGAPBrief_MIV.pdf
Consultative Group to Assist the Poor (CGAP, 2009c). Asset and liability manage-ment for deposit-taking microfinance institutions. CGAP focus note. Retrieved December 14, 2009 from http://www.cgap.org/gm/document-1.9.34818/FN 55.pdf
Consultative Group to Assist the Poor (CGAP, 2007). Savings for poor people: good for clients, good for business? Retrieved December 14, 2009 from http://dev.cgap.org/gm/document-1.9.3912/Portfolio_Dec2007.pdf
Chobra, V. & W. Ziemba (1993). The effects of errors in means, variances, and covariances on optimal portfolio choice. Journal of Portfolio Management, 6 -11.
Churchill, C. (2006). What is insurance for the poor. In Churchill, C. (ed.), Protect-ing the poor: a microinsurance compendium, ILO, 12-24.
Coleman, J. (1990). Social capital in the creation of human capital. American Jour-nal of Sociology, 95-120.
Copeland, T. E. & J. E. Weston (1988). Financial theory and corporate policy, 3rd ed. Reading: Addison Wesley.
Credit Suisse First Boston (2010). CSFB/Tremont Hedge Fund Index, www.hedgeindex.com.
Davies, G. (2004). Scenarios come to Davos. A GBN conversation with Ged Davis. Retrieved December 12, 2009 from http://www.weforum.org/pdf/CSI/ GBN_Davis_interview.pdf
146 BIBLIOGRAPHY
Dieckmann, R. (2007). Microfinance: an emerging investment opportunity. Interna-tional Issues. Frankfurt: Deutsche Bank Research.
EFSE (2010). Microcredit for big ideas. EFSE brochure. Retrieved February 2, 2010 from http://www.efse.lu/fileadmin/downloads/publications/brochures/ EFSE_Microcredit.pdf
Fama, E. & K. R. French (1993). Common risk factors in the returns on stocks and bonds. Journal of Financial Economics, 3-56.
Fama, E. (1965). The behaviour of stock market prices. Journal of Business, 34-105.
Felder-Kozu, N. (2008). Kleiner Einsatz, grosse Wirkung. Mikrofinanzierung und Mikrofranchising – Modelle gegen die Armut. Zürich: rüffer & rub.
Gantenbein, P. Laternser, S. & K. Spremann (2001). Anlageberatung und Portofo-liomanagement. Zürich: NZZ Verlag.
Gottschalk, K. & M. Steinbrecher (2005). Wie Szenarien die strategische Unter-nehmenssteuerung balancieren. Organisationsentwicklung, 24-33.
GPR (2009). GPR construction and maintenance procedures. FTSE NAREIT US real estate index series. Retrieved January 14, 2010 from http://www. propertyshares.com/images/pdf/ConstructionMaintenanceSeptember2006.pdf
Hollis, A. & A. Sweetman (2003). Microfinance and Famine: The Irish Loan Funds during the Great Famine. Working Paper.
Hollis, A. & A. Sweetman (1997). Complementarity, Competition and Institutional Development: The Irish Loan Funds through Three Centuries. Working Paper.
Horneff, W.J., Raimond, H. M., Mitchell, O. S. & M. Z. Stamos (2009). Asset allo-cation over the life cycle with investment-linked survival-contingent payouts. Journal of Banking and Finance, 1688-1699.
J.P.Morgan (2010). Emerging markets bond index monitor. Retrieved March 12, 2010 from www.themarkets.com (restricted access).

BIBLIOGRAPHY 147
Kaduff, J. V. (1996). Shortfall-risk-basierte Portfolio-Strategien: Grundlagen, Anwendungen, Algorithmen. Bern: Paul Haupt.
Kalin, D. & R. Zagst (1999). Portfolio optimization: volatility constraints versus shortfall constraints. OR Spectrum, 97-122.
Kataoka, S. (1963). A stochastic programming model. Econometrica, 181-196.
Kielholz, W. & A. P. Durrer (1997). Insurance derivatives and securitization: new hedging perspectives for the US cat insurance market. The Geneva Papers on Risk and Insurance, 3-16.
Lang, S. (2009). Core Satellite Portfoliomanagement. Bern: Haupt Verlag.
Lhabitant, F. S. (2004). Hedge funds – quantitative insights. Chichester: Wiley.
Lintner, J. (1965). The valuation of risk assets and the selection of risky investments in stock portfolios and capital budgets. Review of Economics and Statistics, 13-37.
Littlefield, E. & C. Kneiding (2009). The global financial crisis and its impact on microfinance. CGAP Occasional Paper.
LPX (2009). Guide to the LPX equity indices, Version 2.7. Retrieved January 14, 2010 from http://www.lpx-group.com/lpx/fileadmin/images/indices/ LPX_ Guide_to_the_Equity_Indices.pdf
Mandelbrot, B. (1963). New methods in statistical economics. Journal of Political Economy, 207-209.
Markowitz, H. (1987). Mean-variance analysis. Oxford: Basil Blackwell.
Markowitz, H. (1959). Portfolio Selection – Efficient Diversification of Investments. New York: John Wiley.
Markowitz, H. (1952). Portfolio Selection. Journal of Finance, 77-91.

148 BIBLIOGRAPHY
Maslakovic, M. (2009). IFSL report on sovereign wealth funds 2009. Retrieved December 28, 2009 from http://www.ifsl.org.uk/upload/CBS_Sovereign %20Wealth%20Funds%202009.pdf
McKinsey (2006). Optimising capital supply in support of microfinance industry growth. Presentation for Omidyar Network/The SEEP Network, Microfinance Investor Roundtable. Retrieved August 24, 2009 from http://seepstage. forumone.com/content/library/detail/4656
Meehan, J. (2004). Tapping financial markets for microfinance. Working Paper. Retrieved August 25, 2009 from http://www.microcapital.org/downloads/ resourcepapers/GFUSA-CapitalMarkets.pdf
Merton, R. C. (1990). Continuous-time finance. Cambridge: Blackwell.
Merton, R. C. (1969). Lifetime portfolio selection under uncertainty: the continuous time case. Review of Economics and Statistics, 247-257.
Minx, E. & E. Böhlke (2006). Denken in alternativen Zukünften. Internationale Politik Nr. 12, 14-22.
Minx, E. & H. Roehl (2006). Werkzeugkiste für Berater und Change Manager: 9. Szenario-Technik. Organisationsentwicklung, 78-81.
Minx, E. & H. Roehl (1998). Von Inseln und Brücken – Wissensentwicklung durch Szenarien bei der Daimler-Benz AG. zfo no.3, 167-170.
Missler-Behr, M. (2006). Auf der Suche nach Zukunftsbildern – eine Regelbasis zur Szenarienauswahl. In: Wilms, F. (eds.). Szenariotechnik. Vom Umgang mit der Zukunft. Bern: Paul Haupt.
MIX/Microfinance Information Exchange (2009). The MicroBanking Bulleting No. 19. Retrieved January 16, 2010 from http://www.themix.org/sites/ default/files/MBB%2019%20-%20December%202009_0.pdf

BIBLIOGRAPHY 149
MIX/Microfinance Information Exchange (2008). The MicroBanking Bulleting No. 17. Retrieved January 16, 2009 from http://www.themix.org/microbanking-bulletin/mbb-issue-no-17-autumn-2008
Mossin, J. (1966). Equilibrium in a capital asset market. Econometrica, 768-783.
MSCI Barra (2010). Index definitions. Retrieved March 12, 2010 from http://www.mscibarra.com/products/indices/international_equity_indices/definitions.html
Porter, M. (1985). Competitive Advantage. New York: Free Press.
Reilly, F. K. & K. C. Brown (2006). Investment analysis and portfolio management, 8th edition. Mason: Thomson.
responsAbility (2009). Fund prospect responsAbility Global MF Fund. Retreived May 14, 2009 from http://www.responsability.com/site/index.cfm?id_art=42157 &act MenuItemID=20541&vsprache=DE
Ringland, G. (1998). Scenario planning. Managing for the future. Chichester: Wiley & Sons.
Ringland, G. (2002). Scenarios in business. Chichester: Wiley & Sons.
Rosenberg, R., Gonzalez, A. & S. Narain (2009). The New Moneylenders: Are the Poor Being Exploited by High Microcredit Interest Rates? CGAP Occasional Paper.
Roy, A. D. (1952). Safety first and the holding of assets. Econometrica, 431-449.
Scholes, M. & J. Williams (1977). Estimating betas from nonsynchronous data. Journal of Financial Economics, 309-327.
SWP (Stiftung Wissenschaft und Politik, 2008). Europäische Energiesicherheit 2020. Szenarien für mögliche Entwicklungen in Europa und seinen energiepoli-tisch wichtigsten Nachbarregionen. SWP-Studien.

150 BIBLIOGRAPHY
Schwartz, P. (1996). The art of the long view: paths to strategic insight for yourself and your company. New York: Doubleday.
Seibel, H. D. (2005). Does history matter? The old and the new world of microfin-ance in Europe and Asia. Working Paper.
Seibel, H. D. (2003). History matters in microfinance. Working Paper.
Sharpe, W. F., Alexander, G. J. & J. V. Bailey (1999). Investments, 6th ed. Upper Saddle River: Prentice Hall.
Sharpe, W. F. (1964). Capital asset prices: a theory of market equilibrium under conditions of risk. Journal of Finance, 425-442.
Standard & Poor’s (2009). S&P GSCI commodity indices. Retrieved on January 14, 2010 from http://www2.standardandpoors.com/spf/pdf/index/SP_GSCI_ Fact-sheet.pdf
Steiner, M. & C. Bruns (2007). Wertpapiermanagement, 9th ed. Stuttgart: Schäffer-Poeschel.
Spremann, K. & P. Gantenbein (2005). Kapitalmärkte. Stuttgart: Lucius&Lucius.
Spremann, K. (2008). Portfoliomanagement, 4th ed. München: Oldenbourg.
Spremann, K. (1997). Humankapital im Portefeuille privater Investoren. Zeitschrift für Betriebswirtschaft, 145-147.
Spremann, K. (1995). Asset-Allokation im Lebenszyklus und Vintage-Programm. In: Gehrig, G. (eds.): Private Banking, Zürich, 115-146.
Swiss Re (2007). Swiss Re launches the first catastrophe bond indices. Retrieved January 14, 2010 from http://www.swissre.com/resources /a67d68804660790fb 923fd276a9800c6-IDUR_74LC9G_Swis.pdf
Symbiotics (2010). Symbiotics50 index information. Retrieved February 14, 2010 from Symbiotics (restricted access).

BIBLIOGRAPHY 151
Telser, L. G. (1955). Safety first and hedging. The Review of Economic Studies, 1-16.
Treynor, J. (1962). Toward a theory of market value of risky assets. Unpublished manuscript.
Tobin (1965). The theory of portfolio selecting. Brechling, F.B.R & Hahn, F.H. (editors). The theory of interest rates. London: Macmillan.
UBS (2008). UBS global convertible bond index. Index guidelines. Retrieved on March 12, 2010 from www.themarkets.com (restricted access).
Uysal, E., Trainer, F. H. & J. Reiss (2001). Revisiting mean-variance optimization. Journal of Portfolio Management, 71-81.
von Pischke, J. D. (2006). New partnerships for sustainability and outreach. In Matthäus-Maier, I. & von Pischke, J.D. (eds.), New partnerships for innovation in microfinance (pp. 1-13). Berlin: Springer.
von Stauffenberg, D. (2008). The 2007 microfinance investment vehicle survey. Retrieved February 28, 2009 from http://microrate.com/home/publications/ microfinance-research-reports
Wack, P. (1985). Scenarios: shooting the rapids. Harvard Business Review, 139-150.
Wack, P. (1985). Scenarios: unchartered waters ahead. Harvard Business Review, 72-79.
WEF Report (2010). The future of the global financial system - navigating the chal-lenges ahead. World Scenario Series. Retrieved February 2, 2010 from http://www.weforum.org/en/initiatives/Scenarios/NFA/index.htm
WEF Report (2009a). The Future of the global financial system: a near-term out-look and long-term scenarios. World Scenario Series. Retrieved March 13, 2009 from http://www.weforum.org/en/initiatives/Scenarios/NewFinancialArchitec- ture/index.htm

152 BIBLIOGRAPHY
WEF (2009b). Scenario planning. Homepage of World Economic Forum. Retrieved April 16, 2009 from http://www.weforum.org/en/initiatives/Scenarios/index.htm
Zimmermann, H. (2004). Sind Kapitalschutzstrategien in der Vorsorge sinnvoll? Überlegungen aus ökonomischer Sicht. Schweizer Personalvorsorge, 19-25.

INTERVIEWS 153
Interviews
De Bleecker, Berg. PGGM, Investment Manager. Telephone interview. Amsterdam: June 30, 2009.
Huber, Patrik. responsAbility Social Investments AG, Member of the Board. Per-sonal interview. Zurich: April 28, 2009 and several more discussions during and after the scenario process.
Krauss, Annette. University of Zurich, Head of Centre for Microfinance. Personal interview. Zurich: April 2, 2009 and several more discussions during the scenario process.
Knöpfel, Ivo. onValues, CEO. Personal interview. Zurich: June 26, 2009.
Mammertz, Rochus. responsAbility Social Investments AG, equity and regulation specialist. Telephone interview. Zurich: June 30, 2009.
von Stauffenberg, Damian. Microrate, CEO. Personal interview. London: October 31, 2008 and several more discussions during the scenario process.
P. M. Becker, Investing in Microfinance, DOI 10.1007/978-3-8349-8926-0 © Gabler Verlag | Springer Fachmedien Wiesbaden GmbH 2010
154 APPENDIX
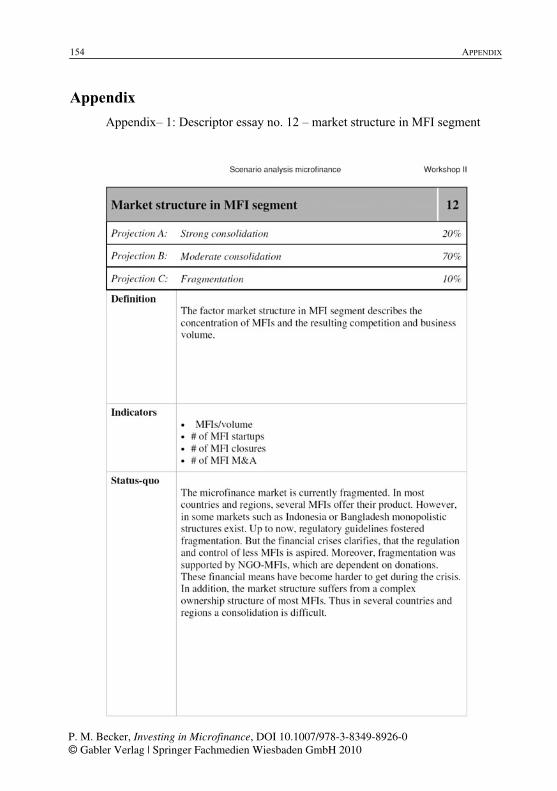
Appendix Appendix– 1: Descriptor essay no. 12 – market structure in MFI segment
P. M. Becker, Investing in Microfinance, DOI 10.1007/978-3-8349-8926-0 © Gabler Verlag | Springer Fachmedien Wiesbaden GmbH 2010

APPENDIX 155

156 APPENDIX
Appendix– 2: Questionnaire regarding attractiveness of asset classes
Scenario analysis microfinance Workshop II
Questionnaire: RETURN EXPECTATIONS Name: ___________________________
Task: Please indicate for the following asset classes in every scenario a risk-adjusted attractivity. In which asset class do you want to invest your money?
Skale: 1 (very unattractive) 4 (rather attractive) Joker: - (no answer) 2 (unattractive) 5 (attractive) 3 (rather unattractive) 6 (very attractive)
Asset class A2 A3 A4 B1 Wildcard
• MF Equity
• MF Debt
• EM Corporate Debt
• EM Sovereign Debt
• EM Equity
• Money Market USD
• Global Equity
• Global Bonds
• High-Yield Bonds
• Investment Grade Bonds
Task 2: Please indicate a probability for every scenarioRemark: The probabilities of all five scenarios should add to 100%.
A2 A3 A4 B1 Wildcard
Probability
Scenario
Scenario

APPENDIX 157
Appendix– 3: Questionnaire regarding correlation measures
Scenario analysis microfinance Workshop II
Questionnarie: CORRELATION Name: ___________________________Idea: Measure correlations of macroeconomic and market factors with different asset classes
Factor Asset class 1 0.5 0 -0.5 -1 no answer
• Increasing EM growth EM Corporate Bonds � � � � � �EM Bonds � � � � � �EM Equity � � � � � �MF Debt � � � � � �MF Equity � � � � � �
• Increasing EM inflation EM Corporate Bonds � � � � � �EM Bonds � � � � � �EM Equity � � � � � �MF Debt � � � � � �MF Equity � � � � � �
• Increasing EM FX volatility EM Corporate Bonds � � � � � �EM Bonds � � � � � �EM Equity � � � � � �MF Debt � � � � � �MF Equity � � � � � �
• Increasing global liquidity EM Corporate Bonds � � � � � �EM Bonds � � � � � �EM Equity � � � � � �MF Debt � � � � � �MF Equity � � � � � �
• Increasing political stability (in countries) EM Corporate Bonds � � � � � �EM Bonds � � � � � �EM Equity � � � � � �MF Debt � � � � � �MF Equity � � � � � �
• High debt level EM Corporate Bonds � � � � � �EM Bonds � � � � � �EM Equity � � � � � �MF Debt � � � � � �MF Equity � � � � � �
• Negative primary budget EM Corporate Bonds � � � � � �EM Bonds � � � � � �EM Equity � � � � � �MF Debt � � � � � �MF Equity � � � � � �
• Increasing commodity prices EM Corporate Bonds � � � � � �EM Bonds � � � � � �EM Equity � � � � � �MF Debt � � � � � �MF Equity � � � � � �
• Increasing global political stability EM Corporate Bonds � � � � � �EM Bonds � � � � � �EM Equity � � � � � �MF Debt � � � � � �MF Equity � � � � � �
• Increasing acceptance of market economy in EM EM Corporate Bonds � � � � � �EM Bonds � � � � � �EM Equity � � � � � �MF Debt � � � � � �MF Equity � � � � � �
• Globalisation EM Corporate Bonds � � � � � �EM Bonds � � � � � �EM Equity � � � � � �MF Debt � � � � � �MF Equity � � � � � �

158 APPENDIX
Appendix– 4: Covariance and correlation matrices excluding microfinance
MM
USD
EQ W
orld
EQ
EM
FI W
orld
FI IL
FI E
MFI
CR
EFI
HY
FI C
BFI
CA
TH
FPE
RE
ITs
CO
M
Mon
ey M
arke
t USD
0.00
000.
0000
0.00
00-0
.000
10.
0000
0.00
000.
0000
0.00
000.
0000
0.00
000.
0001
0.00
020.
0000
0.00
01E
quiti
es W
orld
0.00
000.
0323
0.03
980.
0020
0.00
630.
0115
0.00
780.
0149
0.01
950.
0012
0.00
730.
0384
0.03
100.
0181
Equ
ities
EM
0.00
000.
0398
0.06
590.
0016
0.00
800.
0176
0.01
070.
0218
0.02
690.
0017
0.01
170.
0542
0.03
950.
0299
Gov
Bon
ds W
orld
0.00
000.
0020
0.00
160.
0049
0.00
430.
0022
0.00
370.
0013
0.00
250.
0003
0.00
05-0
.002
40.
0040
0.00
23G
ov B
onds
Infla
tion
Lin
ked
-0.0
001
0.00
630.
0080
0.00
430.
0076
0.00
440.
0057
0.00
470.
0056
0.00
070.
0020
0.00
380.
0098
0.00
89G
ov B
onds
EM
0.00
000.
0115
0.01
760.
0022
0.00
440.
0121
0.00
550.
0096
0.00
930.
0008
0.00
370.
0156
0.01
370.
0076
Cre
dit B
onds
0.00
000.
0078
0.01
070.
0037
0.00
570.
0055
0.00
820.
0069
0.00
720.
0008
0.00
260.
0078
0.01
180.
0085
Hig
h Y
ield
Bon
ds0.
0000
0.01
490.
0218
0.00
130.
0047
0.00
960.
0069
0.01
660.
0115
0.00
130.
0047
0.02
080.
0183
0.01
10C
onve
rtib
le B
onds
0.00
000.
0195
0.02
690.
0025
0.00
560.
0093
0.00
720.
0115
0.02
130.
0013
0.00
700.
0250
0.01
780.
0148
Cat
Bon
ds0.
0000
0.00
120.
0017
0.00
030.
0007
0.00
080.
0008
0.00
130.
0013
0.01
510.
0007
0.00
190.
0018
0.00
18H
edge
Fun
ds0.
0000
0.00
730.
0117
0.00
050.
0020
0.00
370.
0026
0.00
470.
0070
0.00
070.
0200
0.01
210.
0065
0.00
82Pr
ivat
e E
quity
0.00
010.
0384
0.05
42-0
.002
40.
0038
0.01
560.
0078
0.02
080.
0250
0.00
190.
0121
0.13
070.
0408
0.02
75R
EIT
s0.
0002
0.03
100.
0395
0.00
400.
0098
0.01
370.
0118
0.01
830.
0178
0.00
180.
0065
0.04
080.
0500
0.02
07C
omm
oditi
es0.
0000
0.01
810.
0299
0.00
230.
0089
0.00
760.
0085
0.01
100.
0148
0.00
180.
0082
0.02
750.
0207
0.07
08
Ris
k0.
5%18
.0%
25.7
%7.
0%8.
7%11
.0%
9.1%
12.9
%14
.6%
12.3
%14
.1%
36.2
%22
.4%
26.6
%
MM
USD
EQ W
orld
EQ
EM
FI W
orld
FI IL
FI E
MFI
CR
EFI
HY
FI C
BFI
CA
TH
FPE
RE
ITs
CO
M
Mon
ey M
arke
t USD
1.00
0.01
-0.0
1-0
.08
-0.0
40.
00-0
.04
-0.0
40.
000.
010.
040.
060.
020.
05E
quiti
es W
orld
0.01
1.00
0.86
0.16
0.40
0.58
0.48
0.64
0.75
0.06
0.29
0.59
0.77
0.38
Equ
ities
EM
0.01
0.86
1.00
0.09
0.36
0.62
0.46
0.66
0.72
0.05
0.32
0.58
0.69
0.44
Gov
Bon
ds W
orld
-0.0
30.
160.
091.
000.
710.
290.
580.
140.
250.
030.
05-0
.09
0.25
0.12
Gov
Bon
ds In
flatio
n L
inke
d-0
.07
0.40
0.36
0.71
1.00
0.46
0.72
0.41
0.44
0.07
0.16
0.12
0.51
0.39
Gov
Bon
ds E
M-0
.03
0.58
0.62
0.29
0.46
1.00
0.55
0.68
0.58
0.06
0.24
0.39
0.56
0.26
Cre
dit B
onds
0.00
0.48
0.46
0.58
0.72
0.55
1.00
0.59
0.55
0.07
0.20
0.24
0.58
0.35
Hig
h Y
ield
Bon
ds-0
.03
0.64
0.66
0.14
0.41
0.68
0.59
1.00
0.61
0.08
0.26
0.45
0.64
0.32
Con
vert
ible
Bon
ds-0
.03
0.75
0.72
0.25
0.44
0.58
0.55
0.61
1.00
0.07
0.34
0.47
0.55
0.38
Cat
Bon
ds0.
000.
060.
050.
030.
070.
060.
070.
080.
071.
000.
040.
040.
060.
06H
edge
Fun
ds0.
010.
290.
320.
050.
160.
240.
200.
260.
340.
041.
000.
240.
210.
22Pr
ivat
e E
quity
0.01
0.59
0.58
-0.0
90.
120.
390.
240.
450.
470.
040.
241.
000.
500.
29R
EIT
s0.
100.
770.
690.
250.
510.
560.
580.
640.
550.
060.
210.
501.
000.
35C
omm
oditi
es0.
010.
380.
440.
120.
390.
260.
350.
320.
380.
060.
220.
290.
351.
00

APPENDIX 159
Appendix– 5: Covariance and correlation matrices including microfinance (quan-titative approach)
MM
USD
EQ
Wor
ldEQ
EM
FI W
orld
FI IL
FI E
MFI
CR
EFI
HY
FI C
BFI
CA
TH
FPE
RE
ITs
CO
MFI
MF
Mon
ey M
arke
t USD
0.00
000.
0000
0.00
00-0
.000
10.
0000
0.00
000.
0000
0.00
000.
0000
0.00
000.
0001
0.00
020.
0000
0.00
010.
0000
Equi
ties W
orld
0.00
000.
0323
0.03
980.
0020
0.00
630.
0115
0.00
780.
0149
0.01
950.
0012
0.00
730.
0384
0.03
100.
0181
-0.0
001
Equi
ties E
M0.
0000
0.03
980.
0659
0.00
160.
0080
0.01
760.
0107
0.02
180.
0269
0.00
170.
0117
0.05
420.
0395
0.02
99-0
.000
2G
ov B
onds
Wor
ld0.
0000
0.00
200.
0016
0.00
490.
0043
0.00
220.
0037
0.00
130.
0025
0.00
030.
0005
-0.0
024
0.00
400.
0023
0.00
00G
ov B
onds
Infla
tion
Link
ed-0
.000
10.
0063
0.00
800.
0043
0.00
760.
0044
0.00
570.
0047
0.00
560.
0007
0.00
200.
0038
0.00
980.
0089
0.00
00G
ov B
onds
EM
0.00
000.
0115
0.01
760.
0022
0.00
440.
0121
0.00
550.
0096
0.00
930.
0008
0.00
370.
0156
0.01
370.
0076
0.00
00C
redi
t Bon
ds0.
0000
0.00
780.
0107
0.00
370.
0057
0.00
550.
0082
0.00
690.
0072
0.00
080.
0026
0.00
780.
0118
0.00
850.
0000
Hig
h Y
ield
Bon
ds0.
0000
0.01
490.
0218
0.00
130.
0047
0.00
960.
0069
0.01
660.
0115
0.00
130.
0047
0.02
080.
0183
0.01
100.
0000
Con
vert
ible
Bon
ds0.
0000
0.01
950.
0269
0.00
250.
0056
0.00
930.
0072
0.01
150.
0213
0.00
130.
0070
0.02
500.
0178
0.01
48-0
.000
1C
at B
onds
0.00
000.
0012
0.00
170.
0003
0.00
070.
0008
0.00
080.
0013
0.00
130.
0151
0.00
070.
0019
0.00
180.
0018
0.00
00H
edge
Fun
ds0.
0000
0.00
730.
0117
0.00
050.
0020
0.00
370.
0026
0.00
470.
0070
0.00
070.
0200
0.01
210.
0065
0.00
82-0
.000
1Pr
ivat
e Eq
uity
0.00
010.
0384
0.05
42-0
.002
40.
0038
0.01
560.
0078
0.02
080.
0250
0.00
190.
0121
0.13
070.
0408
0.02
75-0
.000
3R
EIT
s0.
0002
0.03
100.
0395
0.00
400.
0098
0.01
370.
0118
0.01
830.
0178
0.00
180.
0065
0.04
080.
0500
0.02
070.
0001
Com
mod
ities
0.00
000.
0181
0.02
990.
0023
0.00
890.
0076
0.00
850.
0110
0.01
480.
0018
0.00
820.
0275
0.02
070.
0708
-0.0
005
Cre
dit -
Mic
rofin
ance
0.00
00-0
.000
1-0
.000
20.
0000
0.00
000.
0000
0.00
000.
0000
-0.0
001
0.00
00-0
.000
1-0
.000
30.
0001
-0.0
005
0.00
73
Ris
k0.
5%18
.0%
25.7
%7.
0%8.
7%11
.0%
9.1%
12.9
%14
.6%
12.3
%14
.1%
36.2
%22
.4%
26.6
%8.
5%
MM
USD
EQ
Wor
ldEQ
EM
FI W
orld
FI IL
FI E
MFI
CR
EFI
HY
FI C
BFI
CA
TH
FPE
RE
ITs
CO
MFI
MF
Mon
ey M
arke
t USD
1.00
0.01
-0.0
1-0
.08
-0.0
40.
00-0
.04
-0.0
40.
000.
010.
040.
060.
020.
050.
02Eq
uitie
s Wor
ld0.
011.
000.
860.
160.
400.
580.
480.
640.
750.
060.
290.
590.
770.
380.
00Eq
uitie
s EM
0.01
0.86
1.00
0.09
0.36
0.62
0.46
0.66
0.72
0.05
0.32
0.58
0.69
0.44
-0.0
1G
ov B
onds
Wor
ld-0
.03
0.16
0.09
1.00
0.71
0.29
0.58
0.14
0.25
0.03
0.05
-0.0
90.
250.
120.
00G
ov B
onds
Infla
tion
Link
ed-0
.07
0.40
0.36
0.71
1.00
0.46
0.72
0.41
0.44
0.07
0.16
0.12
0.51
0.39
0.01
Gov
Bon
ds E
M-0
.03
0.58
0.62
0.29
0.46
1.00
0.55
0.68
0.58
0.06
0.24
0.39
0.56
0.26
0.00
Cre
dit B
onds
0.00
0.48
0.46
0.58
0.72
0.55
1.00
0.59
0.55
0.07
0.20
0.24
0.58
0.35
0.00
Hig
h Y
ield
Bon
ds-0
.03
0.64
0.66
0.14
0.41
0.68
0.59
1.00
0.61
0.08
0.26
0.45
0.64
0.32
0.00
Con
vert
ible
Bon
ds-0
.03
0.75
0.72
0.25
0.44
0.58
0.55
0.61
1.00
0.07
0.34
0.47
0.55
0.38
-0.0
1C
at B
onds
0.00
0.06
0.05
0.03
0.07
0.06
0.07
0.08
0.07
1.00
0.04
0.04
0.06
0.06
0.00
Hed
ge F
unds
0.01
0.29
0.32
0.05
0.16
0.24
0.20
0.26
0.34
0.04
1.00
0.24
0.21
0.22
0.00
Priv
ate
Equi
ty0.
010.
590.
58-0
.09
0.12
0.39
0.24
0.45
0.47
0.04
0.24
1.00
0.50
0.29
-0.0
1R
EIT
s0.
100.
770.
690.
250.
510.
560.
580.
640.
550.
060.
210.
501.
000.
350.
01C
omm
oditi
es0.
010.
380.
440.
120.
390.
260.
350.
320.
380.
060.
220.
290.
351.
00-0
.02
Cre
dit -
Mic
rofin
ance
0.00
0.00
-0.0
10.
000.
010.
000.
000.
00-0
.01
0.00
0.00
-0.0
10.
01-0
.02
1.00
160 APPENDIX
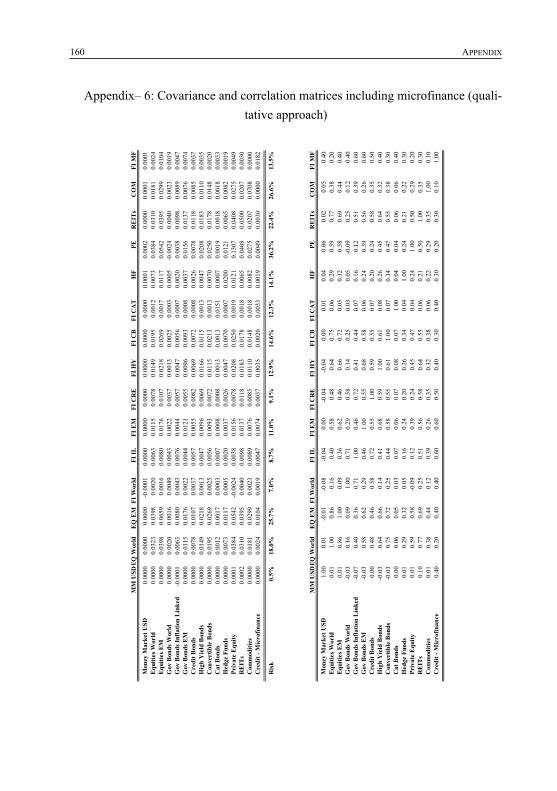
Appendix– 6: Covariance and correlation matrices including microfinance (quali-tative approach)
MM
USD
EQ
Wor
ldEQ
EM
FI W
orld
FI IL
FI E
MFI
CR
EFI
HY
FI C
BFI
CA
TH
FPE
RE
ITs
CO
MFI
MF
Mon
ey M
arke
t USD
0.00
000.
0000
0.00
00-0
.000
10.
0000
0.00
000.
0000
0.00
000.
0000
0.00
000.
0001
0.00
020.
0000
0.00
010.
0001
Equi
ties W
orld
0.00
000.
0323
0.03
980.
0020
0.00
630.
0115
0.00
780.
0149
0.01
950.
0012
0.00
730.
0384
0.03
100.
0181
0.00
24Eq
uitie
s EM
0.00
000.
0398
0.06
590.
0016
0.00
800.
0176
0.01
070.
0218
0.02
690.
0017
0.01
170.
0542
0.03
950.
0299
0.01
04G
ov B
onds
Wor
ld0.
0000
0.00
200.
0016
0.00
490.
0043
0.00
220.
0037
0.00
130.
0025
0.00
030.
0005
-0.0
024
0.00
400.
0023
0.00
19G
ov B
onds
Infla
tion
Link
ed-0
.000
10.
0063
0.00
800.
0043
0.00
760.
0044
0.00
570.
0047
0.00
560.
0007
0.00
200.
0038
0.00
980.
0089
0.00
47G
ov B
onds
EM
0.00
000.
0115
0.01
760.
0022
0.00
440.
0121
0.00
550.
0096
0.00
930.
0008
0.00
370.
0156
0.01
370.
0076
0.00
74C
redi
t Bon
ds0.
0000
0.00
780.
0107
0.00
370.
0057
0.00
550.
0082
0.00
690.
0072
0.00
080.
0026
0.00
780.
0118
0.00
850.
0037
Hig
h Y
ield
Bon
ds0.
0000
0.01
490.
0218
0.00
130.
0047
0.00
960.
0069
0.01
660.
0115
0.00
130.
0047
0.02
080.
0183
0.01
100.
0035
Con
vert
ible
Bon
ds0.
0000
0.01
950.
0269
0.00
250.
0056
0.00
930.
0072
0.01
150.
0213
0.00
130.
0070
0.02
500.
0178
0.01
480.
0020
Cat
Bon
ds0.
0000
0.00
120.
0017
0.00
030.
0007
0.00
080.
0008
0.00
130.
0013
0.01
510.
0007
0.00
190.
0018
0.00
180.
0033
Hed
ge F
unds
0.00
000.
0073
0.01
170.
0005
0.00
200.
0037
0.00
260.
0047
0.00
700.
0007
0.02
000.
0121
0.00
650.
0082
0.00
19Pr
ivat
e Eq
uity
0.00
010.
0384
0.05
42-0
.002
40.
0038
0.01
560.
0078
0.02
080.
0250
0.00
190.
0121
0.13
070.
0408
0.02
750.
0049
RE
ITs
0.00
020.
0310
0.03
950.
0040
0.00
980.
0137
0.01
180.
0183
0.01
780.
0018
0.00
650.
0408
0.05
000.
0207
0.00
30C
omm
oditi
es0.
0000
0.01
810.
0299
0.00
230.
0089
0.00
760.
0085
0.01
100.
0148
0.00
180.
0082
0.02
750.
0207
0.07
080.
0000
Cre
dit -
Mic
rofin
ance
0.00
000.
0024
0.01
040.
0019
0.00
470.
0074
0.00
370.
0035
0.00
200.
0033
0.00
190.
0049
0.00
300.
0000
0.01
82
Ris
k0.
5%18
.0%
25.7
%7.
0%8.
7%11
.0%
9.1%
12.9
%14
.6%
12.3
%14
.1%
36.2
%22
.4%
26.6
%13
.5%
MM
USD
EQ
Wor
ldEQ
EM
FI W
orld
FI IL
FI E
MFI
CR
EFI
HY
FI C
BFI
CA
TH
FPE
RE
ITs
CO
MFI
MF
Mon
ey M
arke
t USD
1.00
0.01
-0.0
1-0
.08
-0.0
40.
00-0
.04
-0.0
40.
000.
010.
040.
060.
020.
050.
40Eq
uitie
s Wor
ld0.
011.
000.
860.
160.
400.
580.
480.
640.
750.
060.
290.
590.
770.
380.
20Eq
uitie
s EM
0.01
0.86
1.00
0.09
0.36
0.62
0.46
0.66
0.72
0.05
0.32
0.58
0.69
0.44
0.40
Gov
Bon
ds W
orld
-0.0
30.
160.
091.
000.
710.
290.
580.
140.
250.
030.
05-0
.09
0.25
0.12
0.40
Gov
Bon
ds In
flatio
n Li
nked
-0.0
70.
400.
360.
711.
000.
460.
720.
410.
440.
070.
160.
120.
510.
390.
60G
ov B
onds
EM
-0.0
30.
580.
620.
290.
461.
000.
550.
680.
580.
060.
240.
390.
560.
260.
60C
redi
t Bon
ds0.
000.
480.
460.
580.
720.
551.
000.
590.
550.
070.
200.
240.
580.
350.
50H
igh
Yie
ld B
onds
-0.0
30.
640.
660.
140.
410.
680.
591.
000.
610.
080.
260.
450.
640.
320.
40C
onve
rtib
le B
onds
-0.0
30.
750.
720.
250.
440.
580.
550.
611.
000.
070.
340.
470.
550.
380.
30C
at B
onds
0.00
0.06
0.05
0.03
0.07
0.06
0.07
0.08
0.07
1.00
0.04
0.04
0.06
0.06
0.40
Hed
ge F
unds
0.01
0.29
0.32
0.05
0.16
0.24
0.20
0.26
0.34
0.04
1.00
0.24
0.21
0.22
0.30
Priv
ate
Equi
ty0.
010.
590.
58-0
.09
0.12
0.39
0.24
0.45
0.47
0.04
0.24
1.00
0.50
0.29
0.20
RE
ITs
0.10
0.77
0.69
0.25
0.51
0.56
0.58
0.64
0.55
0.06
0.21
0.50
1.00
0.35
0.30
Com
mod
ities
0.01
0.38
0.44
0.12
0.39
0.26
0.35
0.32
0.38
0.06
0.22
0.29
0.35
1.00
0.10
Cre
dit -
Mic
rofin
ance
0.40
0.20
0.40
0.40
0.60
0.60
0.50
0.40
0.30
0.40
0.30
0.20
0.30
0.10
1.00

APPENDIX 161
Appendix– 7: Optimized portfolio weights excluding microfinance
0.5
0.75
11.
251.
52
2.5
3.25
45
710
Mon
ey M
arke
t USD
0.0%
0.0%
0.0%
0.0%
0.0%
0.0%
0.0%
20.0
%20
.0%
20.0
%20
.0%
20.0
%E
quiti
es W
orld
0.0%
0.0%
3.4%
6.7%
8.2%
7.7%
7.1%
5.5%
5.1%
4.7%
4.0%
3.1%
Equ
ities
EM
81.1
%64
.3%
44.5
%31
.9%
24.5
%16
.5%
12.1
%9.
2%6.
7%4.
5%1.
7%0.
0%G
ov B
onds
Wor
ld0.
0%0.
0%0.
0%0.
0%0.
0%11
.1%
20.7
%17
.9%
23.4
%28
.3%
34.2
%38
.9%
Gov
Bon
ds In
flatio
n L
inke
d0.
0%0.
0%0.
0%0.
0%0.
0%0.
0%0.
0%0.
0%0.
0%0.
0%0.
0%0.
0%G
ov B
onds
EM
0.0%
0.0%
0.0%
0.0%
0.0%
0.0%
0.0%
0.0%
0.0%
0.0%
0.0%
0.0%
Cre
dit B
onds
0.0%
0.0%
0.0%
0.1%
9.2%
11.5
%10
.6%
8.3%
7.8%
6.8%
4.2%
2.2%
Hig
h Y
ield
Bon
ds0.
0%0.
0%0.
0%0.
0%0.
0%0.
0%0.
0%0.
0%0.
0%0.
8%3.
9%6.
2%C
onve
rtib
le B
onds
0.0%
1.7%
8.4%
11.7
%10
.2%
7.8%
6.2%
4.9%
3.9%
3.1%
1.8%
0.8%
Cat
Bon
ds0.
0%5.
3%15
.0%
20.6
%21
.8%
21.7
%21
.2%
16.8
%16
.6%
16.2
%15
.7%
15.3
%H
edge
Fun
ds0.
0%14
.5%
18.0
%20
.1%
19.7
%18
.4%
17.3
%13
.7%
13.1
%12
.5%
11.7
%11
.1%
Priv
ate
Equi
ty18
.9%
14.1
%10
.2%
7.7%
6.5%
5.3%
4.8%
3.7%
3.4%
3.1%
2.7%
2.4%
RE
ITs
0.0%
0.0%
0.5%
1.2%
0.0%
0.0%
0.0%
0.0%
0.0%
0.0%
0.0%
0.0%
Com
mod
ities
0.0%
0.0%
0.0%
0.0%
0.0%
0.0%
0.0%
0.0%
0.0%
0.0%
0.0%
0.0%
Ret
urn
p.a.
11.5
9%10
.22%
8.85
%8.
02%
7.37
%6.
47%
5.90
%5.
05%
4.73
%4.
44%
4.09
%3.
83%
Ris
k p.
a.25
.42%
20.9
3%16
.66%
14.2
4%12
.45%
10.1
3%8.
79%
6.87
%6.
18%
5.63
%5.
07%
4.76
%
Shor
tfal
l in
year
s13
.00
11.3
39.
598.
537.
726.
646.
005.
014.
634.
364.
164.
16
lam
bda

162 APPENDIX
Appendix– 8: Optimized portfolio weights including microfinance (quantitative approach) – risk factor set to 8.5%
0.5
0.75
11.
251.
52
2.5
3.25
45
710
Mon
ey M
arke
t USD
0.0%
0.0%
0.0%
0.0%
0.0%
0.0%
0.0%
0.0%
0.0%
13.5
%20
.0%
20.0
%E
quiti
es W
orld
0.0%
0.0%
0.0%
0.0%
0.0%
2.0%
3.5%
3.9%
3.6%
3.0%
2.6%
2.2%
Equ
ities
EM
81.1
%61
.9%
47.9
%38
.9%
31.8
%22
.0%
15.9
%10
.8%
8.1%
6.3%
3.9%
1.7%
Gov
Bon
ds W
orld
0.0%
0.0%
0.0%
0.0%
0.0%
0.0%
0.0%
3.5%
10.4
%11
.1%
15.5
%21
.1%
Gov
Bon
ds In
flatio
n L
inke
d0.
0%0.
0%0.
0%0.
0%0.
0%0.
0%0.
0%0.
0%0.
0%0.
0%0.
0%0.
0%G
ov B
onds
EM
0.0%
0.0%
0.0%
0.0%
0.0%
0.0%
0.0%
0.0%
0.0%
0.0%
0.0%
0.0%
Cre
dit B
onds
0.0%
0.0%
0.0%
0.0%
0.0%
0.0%
2.2%
6.7%
6.4%
5.4%
4.7%
3.2%
Hig
h Y
ield
Bon
ds0.
0%0.
0%0.
0%0.
0%0.
0%0.
0%0.
0%0.
0%0.
0%0.
0%0.
0%1.
9%C
onve
rtib
le B
onds
0.0%
0.0%
0.0%
0.0%
2.6%
5.6%
6.3%
5.2%
4.3%
3.5%
2.6%
1.7%
Cat
Bon
ds0.
0%0.
0%0.
0%1.
2%4.
8%9.
1%11
.4%
12.3
%12
.5%
10.8
%10
.2%
10.2
%H
edge
Fun
ds0.
0%0.
0%3.
7%7.
5%8.
6%10
.0%
10.7
%10
.6%
10.3
%8.
8%7.
9%7.
6%Pr
ivat
e Eq
uity
18.9
%13
.8%
10.6
%8.
5%7.
1%5.
1%4.
0%3.
2%2.
9%2.
5%2.
1%1.
8%R
EIT
s0.
0%0.
0%0.
0%0.
0%0.
0%0.
0%0.
0%0.
0%0.
0%0.
0%0.
0%0.
0%C
omm
oditi
es0.
0%0.
0%0.
0%0.
0%0.
0%0.
0%0.
0%0.
0%0.
0%0.
0%0.
0%0.
0%M
icro
finan
ce d
ebt
0.0%
24.2
%37
.8%
43.9
%45
.0%
46.2
%46
.1%
43.8
%41
.4%
35.0
%30
.6%
28.6
%
Ret
urn
p.a.
11.5
9%9.
87%
8.68
%7.
93%
7.39
%6.
70%
6.26
%5.
77%
5.42
%4.
86%
4.39
%4.
12%
Ris
k p.
a.25
.42%
19.3
4%15
.33%
12.9
6%11
.31%
9.36
%8.
24%
7.13
%6.
41%
5.36
%4.
52%
4.13
%
Shor
tfal
l in
year
s13
.00
10.3
88.
447.
226.
345.
284.
694.
133.
783.
292.
862.
73
lam
bda

APPENDIX 163
Appendix– 9: Optimized portfolio weights including microfinance (qualitative approach) – risk factor set to 13.5%
0.5
0.75
11.
251.
52
2.5
3.25
45
710
Mon
ey M
arke
t USD
0.0%
0.0%
0.0%
0.0%
0.0%
0.0%
0.0%
20.0
%20
.0%
20.0
%20
.0%
20.0
%E
quiti
es W
orld
0.0%
0.0%
3.4%
6.7%
8.2%
7.9%
8.2%
6.3%
6.5%
6.6%
5.8%
3.4%
Equ
ities
EM
81.1
%64
.3%
44.5
%32
.0%
24.4
%16
.3%
11.1
%8.
3%5.
4%2.
7%0.
0%0.
0%G
ov B
onds
Wor
ld0.
0%0.
0%0.
0%0.
0%0.
0%10
.9%
19.4
%16
.3%
21.8
%26
.3%
31.9
%37
.5%
Gov
Bon
ds In
flatio
n L
inke
d0.
0%0.
0%0.
0%0.
0%0.
0%0.
0%0.
0%0.
0%0.
0%0.
0%0.
0%0.
0%G
ov B
onds
EM
0.0%
0.0%
0.0%
0.0%
0.0%
0.0%
0.0%
0.0%
0.0%
0.0%
0.0%
0.0%
Cre
dit B
onds
0.0%
0.0%
0.0%
0.0%
9.2%
11.1
%9.
7%8.
2%6.
6%5.
5%2.
5%0.
5%H
igh
Yie
ld B
onds
0.0%
0.0%
0.0%
0.0%
0.0%
0.0%
0.0%
0.0%
0.0%
0.5%
3.6%
5.6%
Con
vert
ible
Bon
ds0.
0%1.
7%8.
4%11
.7%
10.2
%8.
0%6.
8%5.
5%4.
7%4.
0%2.
9%1.
5%C
at B
onds
0.0%
5.3%
15.0
%20
.7%
21.8
%21
.5%
20.5
%16
.3%
15.7
%15
.2%
14.4
%14
.2%
Hed
ge F
unds
0.0%
14.5
%18
.0%
20.1
%19
.7%
18.4
%17
.2%
13.6
%12
.9%
12.3
%11
.4%
10.7
%Pr
ivat
e Eq
uity
18.9
%14
.1%
10.2
%7.
7%6.
5%5.
3%4.
7%3.
7%3.
3%3.
0%2.
6%2.
2%R
EIT
s0.
0%0.
0%0.
6%1.
1%0.
0%0.
0%0.
0%0.
0%0.
0%0.
0%0.
0%0.
0%C
omm
oditi
es0.
0%0.
0%0.
0%0.
0%0.
0%0.
0%0.
0%0.
0%0.
0%0.
0%0.
0%0.
0%M
icro
finan
ce d
ebt
0.0%
0.0%
0.0%
0.0%
0.0%
0.6%
2.5%
1.9%
3.1%
3.9%
4.8%
4.5%
Ret
urn
p.a.
11.5
9%10
.22%
8.85
%8.
02%
7.37
%6.
46%
5.89
%5.
04%
4.71
%4.
42%
4.07
%3.
84%
Ris
k p.
a.25
.42%
20.9
3%16
.66%
14.2
4%12
.45%
10.1
2%8.
76%
6.86
%6.
14%
5.58
%5.
02%
4.73
%
Shor
tfal
l in
year
s13
.00
11.3
39.
598.
537.
726.
645.
985.
004.
594.
314.
114.
10
lam
bda

164 APPENDIX
Appendix– 10: Optimized portfolio weights including microfinance with risk fac-tor set to 10%
0.5
0.75
11.
251.
52
2.5
3.25
45
710
Mon
ey M
arke
t USD
0.0%
0.0%
0.0%
0.0%
0.0%
0.0%
0.0%
12.6
%20
.0%
20.0
%20
.0%
20.0
%E
quiti
es W
orld
0.0%
0.0%
3.4%
6.9%
10.1
%12
.4%
12.3
%10
.6%
9.6%
9.5%
6.3%
3.8%
Equi
ties E
M81
.1%
64.3
%44
.5%
31.5
%22
.2%
12.0
%7.
2%4.
3%2.
4%0.
0%0.
0%0.
0%G
ov B
onds
Wor
ld0.
0%0.
0%0.
0%0.
0%0.
0%3.
4%12
.1%
14.4
%16
.0%
20.3
%27
.8%
32.7
%G
ov B
onds
Infla
tion
Lin
ked
0.0%
0.0%
0.0%
0.0%
0.0%
0.0%
0.0%
0.0%
0.0%
0.0%
0.0%
0.0%
Gov
Bon
ds E
M0.
0%0.
0%0.
0%0.
0%0.
0%0.
0%0.
0%0.
0%0.
0%0.
0%0.
0%0.
0%C
redi
t Bon
ds0.
0%0.
0%0.
0%0.
0%2.
5%7.
3%5.
9%4.
6%3.
8%3.
2%0.
6%0.
0%H
igh
Yie
ld B
onds
0.0%
0.0%
0.0%
0.0%
0.0%
0.0%
0.0%
0.0%
0.0%
0.0%
2.4%
4.0%
Con
vert
ible
Bon
ds0.
0%1.
7%8.
4%11
.5%
11.6
%10
.3%
9.0%
7.3%
6.3%
5.7%
3.8%
2.2%
Cat
Bon
ds0.
0%5.
3%15
.0%
19.2
%18
.9%
18.0
%17
.1%
14.6
%13
.1%
12.6
%12
.4%
12.3
%H
edge
Fun
ds0.
0%14
.5%
18.0
%19
.4%
18.6
%17
.2%
16.0
%13
.4%
11.9
%11
.3%
10.5
%9.
9%Pr
ivat
e Eq
uity
18.9
%14
.1%
10.2
%7.
8%6.
4%5.
0%4.
4%3.
6%3.
1%2.
8%2.
3%1.
9%R
EITs
0.0%
0.0%
0.6%
1.1%
0.7%
0.0%
0.0%
0.0%
0.0%
0.0%
0.0%
0.0%
Com
mod
ities
0.0%
0.0%
0.0%
0.0%
0.0%
0.0%
0.0%
0.0%
0.0%
0.0%
0.0%
0.0%
Mic
rofin
ance
deb
t0.
0%0.
0%0.
0%2.
7%9.
0%14
.4%
16.0
%14
.5%
13.8
%14
.6%
13.9
%13
.2%
Ret
urn
p.a.
11.6
%10
.2%
8.8%
8.0%
7.3%
6.4%
5.9%
5.1%
4.7%
4.4%
4.1%
3.9%
Ris
k p.
a.25
.4%
20.9
%16
.7%
14.2
%12
.4%
10.2
%8.
8%7.
2%6.
2%5.
7%5.
2%4.
9%
Shor
tfal
l in
year
s13
.00
11.3
39.
598.
517.
756.
766.
145.
324.
764.
514.
334.
31
lam
bda

APPENDIX 165
Appendix– 11: Optimized portfolio weights including microfinance with risk fac-tor set to 12%
0.5
0.75
11.
251.
52
2.5
3.25
45
710
Mon
ey M
arke
t USD
0.0%
0.0%
0.0%
0.0%
0.0%
0.0%
0.0%
18.1
%20
.0%
20.0
%20
.0%
20.0
%E
quiti
es W
orld
0.0%
0.0%
3.4%
6.6%
8.5%
9.7%
9.8%
7.9%
7.8%
7.7%
6.0%
3.5%
Equ
ities
EM
81.1
%64
.3%
44.5
%31
.9%
24.2
%14
.6%
9.5%
6.9%
4.2%
1.7%
0.0%
0.0%
Gov
Bon
ds W
orld
0.0%
0.0%
0.0%
0.0%
0.0%
8.6%
17.1
%15
.9%
20.0
%24
.3%
30.7
%36
.2%
Gov
Bon
ds In
flatio
n L
inke
d0.
0%0.
0%0.
0%0.
0%0.
0%0.
0%0.
0%0.
0%0.
0%0.
0%0.
0%0.
0%G
ov B
onds
EM
0.0%
0.0%
0.0%
0.0%
0.0%
0.0%
0.0%
0.0%
0.0%
0.0%
0.0%
0.0%
Cre
dit B
onds
0.0%
0.0%
0.0%
0.0%
8.6%
9.7%
8.3%
6.5%
5.6%
4.6%
1.8%
0.0%
Hig
h Y
ield
Bon
ds0.
0%0.
0%0.
0%0.
0%0.
0%0.
0%0.
0%0.
0%0.
0%0.
3%3.
2%5.
1%C
onve
rtib
le B
onds
0.0%
1.7%
8.4%
11.8
%10
.3%
8.8%
7.6%
6.0%
5.3%
4.7%
3.2%
1.8%
Cat
Bon
ds0.
0%5.
3%15
.0%
20.7
%21
.5%
20.3
%19
.4%
15.7
%14
.8%
14.3
%13
.7%
13.6
%H
edge
Fun
ds0.
0%14
.5%
18.0
%20
.1%
19.6
%18
.0%
16.8
%13
.5%
12.6
%12
.0%
11.1
%10
.5%
Priv
ate
Equ
ity18
.9%
14.1
%10
.2%
7.7%
6.5%
5.2%
4.6%
3.6%
3.2%
2.9%
2.5%
2.1%
REI
Ts0.
0%0.
0%0.
5%1.
2%0.
0%0.
0%0.
0%0.
0%0.
0%0.
0%0.
0%0.
0%C
omm
oditi
es0.
0%0.
0%0.
0%0.
0%0.
0%0.
0%0.
0%0.
0%0.
0%0.
0%0.
0%0.
0%M
icro
finan
ce d
ebt
0.0%
0.0%
0.0%
0.0%
0.8%
5.0%
6.8%
5.8%
6.6%
7.5%
7.7%
7.3%
Ret
urn
p.a.
11.6
%10
.2%
8.8%
8.0%
7.4%
6.4%
5.9%
5.1%
4.7%
4.4%
4.1%
3.9%
Ris
k p.
a.25
.4%
20.9
%16
.7%
14.2
%12
.4%
10.1
%8.
7%6.
9%6.
1%5.
6%5.
0%4.
8%
Shor
tfal
l in
year
s13
.00
11.3
39.
598.
537.
726.
635.
995.
044.
604.
334.
134.
12
lam
bda
166 APPENDIX
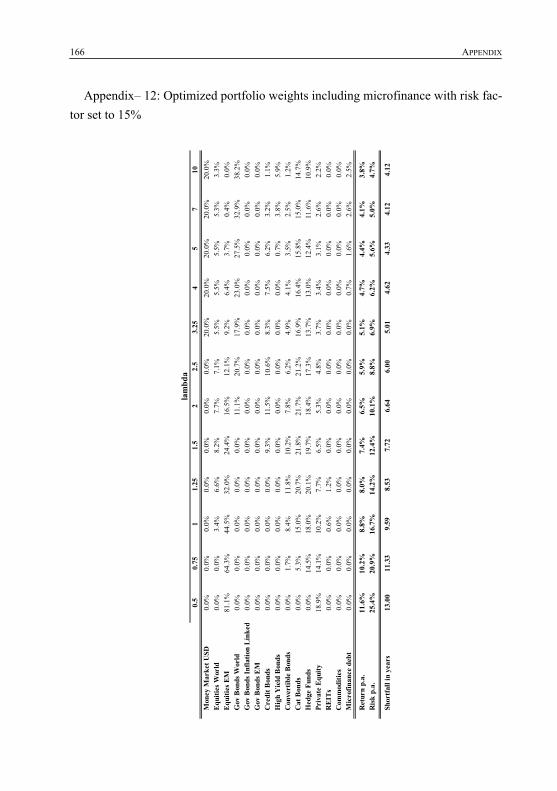
Appendix– 12: Optimized portfolio weights including microfinance with risk fac-tor set to 15%
0.5
0.75
11.
251.
52
2.5
3.25
45
710
Mon
ey M
arke
t USD
0.0%
0.0%
0.0%
0.0%
0.0%
0.0%
0.0%
20.0
%20
.0%
20.0
%20
.0%
20.0
%E
quiti
es W
orld
0.0%
0.0%
3.4%
6.6%
8.2%
7.7%
7.1%
5.5%
5.5%
5.5%
5.3%
3.3%
Equ
ities
EM
81.1
%64
.3%
44.5
%32
.0%
24.4
%16
.5%
12.1
%9.
2%6.
4%3.
7%0.
4%0.
0%G
ov B
onds
Wor
ld0.
0%0.
0%0.
0%0.
0%0.
0%11
.1%
20.7
%17
.9%
23.0
%27
.5%
32.9
%38
.2%
Gov
Bon
ds In
flatio
n L
inke
d0.
0%0.
0%0.
0%0.
0%0.
0%0.
0%0.
0%0.
0%0.
0%0.
0%0.
0%0.
0%G
ov B
onds
EM
0.0%
0.0%
0.0%
0.0%
0.0%
0.0%
0.0%
0.0%
0.0%
0.0%
0.0%
0.0%
Cre
dit B
onds
0.0%
0.0%
0.0%
0.0%
9.3%
11.5
%10
.6%
8.3%
7.5%
6.2%
3.2%
1.1%
Hig
h Y
ield
Bon
ds0.
0%0.
0%0.
0%0.
0%0.
0%0.
0%0.
0%0.
0%0.
0%0.
7%3.
8%5.
9%C
onve
rtib
le B
onds
0.0%
1.7%
8.4%
11.8
%10
.2%
7.8%
6.2%
4.9%
4.1%
3.5%
2.5%
1.2%
Cat
Bon
ds0.
0%5.
3%15
.0%
20.7
%21
.8%
21.7
%21
.2%
16.9
%16
.4%
15.8
%15
.0%
14.7
%H
edge
Fun
ds0.
0%14
.5%
18.0
%20
.1%
19.7
%18
.4%
17.3
%13
.7%
13.0
%12
.4%
11.6
%10
.9%
Priv
ate
Equ
ity18
.9%
14.1
%10
.2%
7.7%
6.5%
5.3%
4.8%
3.7%
3.4%
3.1%
2.6%
2.2%
REI
Ts0.
0%0.
0%0.
6%1.
2%0.
0%0.
0%0.
0%0.
0%0.
0%0.
0%0.
0%0.
0%C
omm
oditi
es0.
0%0.
0%0.
0%0.
0%0.
0%0.
0%0.
0%0.
0%0.
0%0.
0%0.
0%0.
0%M
icro
finan
ce d
ebt
0.0%
0.0%
0.0%
0.0%
0.0%
0.0%
0.0%
0.0%
0.7%
1.6%
2.6%
2.5%
Ret
urn
p.a.
11.6
%10
.2%
8.8%
8.0%
7.4%
6.5%
5.9%
5.1%
4.7%
4.4%
4.1%
3.8%
Ris
k p.
a.25
.4%
20.9
%16
.7%
14.2
%12
.4%
10.1
%8.
8%6.
9%6.
2%5.
6%5.
0%4.
7%
Shor
tfal
l in
year
s13
.00
11.3
39.
598.
537.
726.
646.
005.
014.
624.
334.
124.
12
lam
bda