big data algorithms for visualization and supervised...
TRANSCRIPT

Big Data Algorithms for Visualization
and Supervised Learning
Nemanja Djuric
Temple University, December 2nd, 2013

My work Remote sensing
Djuric, N., Lakesh, K., Vucetic, S., Semi-Supervised Learning for Integration of Aerosol Predictions from Multiple Satellite Instruments, IJCAI 2013 (Outstanding paper award)
Large-scale learning
Djuric, N., Lan, L., Vucetic, S., Wang, Z., BudgetedSVM: A Toolbox for Scalable SVM Approximations, JMLR 2013
Djuric, N., Grbovic, M., Vucetic, S., Distributed Confidence-Weighted Classification on MapReduce, IEEE BigData 2013
Wang, Z., Djuric, N., Crammer, K., Vucetic, S., Trading Representability for Scalability: Adaptive Multi-HyperplaneMachine for Nonlinear Classification, KDD 2011
Memory-constrained online learning
Djuric, N., Vucetic, S., Random Kernel Perceptron on ATTiny2313 Microcontroller, SensorKDD @ KDD 2010

My work Traffic state estimation and prediction
Coric, V., Djuric, N., Vucetic, S., Traffic State Estimation from Aggregated Measurements using Signal Reconstruction Techniques, TRR: Journal of the Transp. Research Board 2012
Djuric, N., Radosavljevic, V., Coric, V., Vucetic, S., Travel Speed Forecasting using Continuous Conditional Random Fields, TRR: Journal of the Transportation Research Board 2011
Label ranking
Grbovic*, M., Djuric*, N., Vucetic S., Multi-prototype Label Ranking with Novel Pairwise-to-Total-Rank Aggregation, IJCAI 2013
Grbovic, M., Djuric, N., Vucetic S., Supervised Clustering of Label Ranking Data using Label Preference Information, MLJ 2013
Grbovic, M., Djuric, N., Vucetic S., Supervised Clustering of Label Ranking Data, SDM 2012 (Best of SDM)

My work Bioinformatics
Radivojac, P., Clark, W. T., ..., Toppo, S., Lan, L., Djuric, N.,
Guo, Y., Vucetic, S., Bairoch, A., Linial, M., Babbitt, P. C.,
et al., A Large-scale Evaluation of Computational
Protein Function Prediction, Nature Methods 2013
Lan, L., Djuric, N., Guo, Y., Vucetic, S., MS-kNN: Protein
Function Prediction by Integrating Multiple Data Sources,
BMC Bioinformatics 2012 (Top performing team)
Unsupervised object matching
Djuric, N., Grbovic, M., Vucetic S., Convex Kernelized
Sorting, AAAI 2012
Large data visualization
Djuric, N., Vucetic S., Efficient Visualization of
Large-scale Data Tables through Reordering and
Entropy Minimization, ICDM 2013
Introduction
Big Data!
Big Data is pervasive; data sets with millions of examples and
features are now a rule rather than an exception
Crowdsourcing, remote sensing, social networks, etc.
Globally-recognized, strategic
importance of Big Data
Focus of major internet companies
“Big Data Research and Development
Initiative” by the US government

Introduction
“Big data is high volume, high velocity, and/or high
variety information assets that require new forms of
processing to enable enhanced decision making,
insight discovery and process optimization.”
Many challenges to machine
learning and data mining researchers
Standard tools and frameworks are not
capable of addressing new tasks
Even linear time and space
complexity may no longer be tractable

Outline of the presentation
Large data visualization
EM-ordering and TSP-means
Large-scale learning
Adaptive Multi-hyperplane Machines
BudgetedSVM: A C++ toolbox for large-scale learning
Distributed confidence-weighted learning on MapReduce
Unsupervised object matching
Convex Kernelized Sorting
Combination of experts
Semi-supervised aggregation of noisy experts
Using Gaussian CRF to improve aerosol retrieval and traffic estimation

Data visualization
Immediate feedback that can lead to faster knowledge
discovery
Intuitive way of interacting with unknown data
Long history of visualization tools, characterized by slow
progress in recent years
New visualization approaches are required in order to tackle
modern large-scale problems
Our task: Visualizing large data matrices
How to visualize a data matrix?
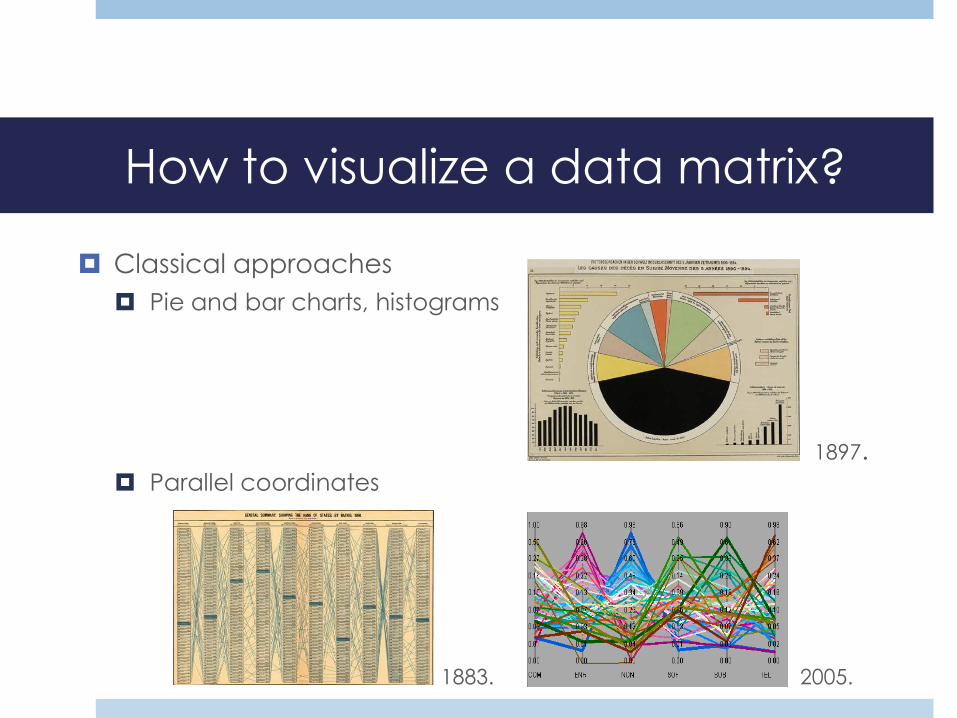
Classical approaches
Pie and bar charts, histograms
Parallel coordinates
1897.
1883. 2005.
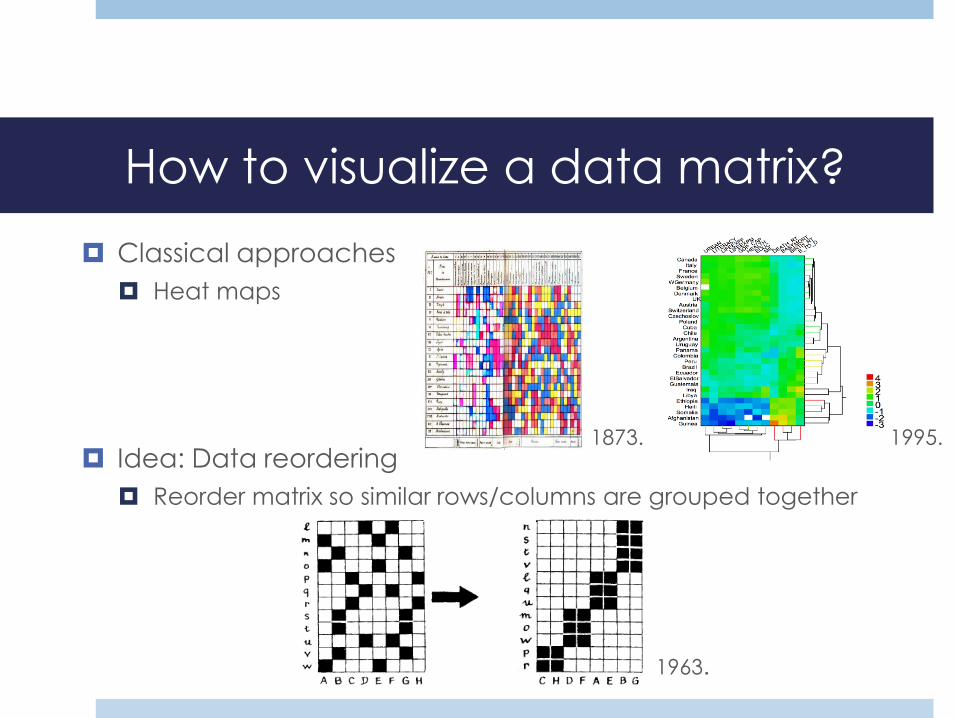
How to visualize a data matrix?
Classical approaches
Heat maps
Idea: Data reordering
Reorder matrix so similar rows/columns are grouped together
1873. 1995.
1963.

The proposed method: Example
Waveform benchmark data set
Please click here: EM-ordering example

EM-ordering
Data reordering can be considered from the viewpoint of
data compression
Reorder the data so that it is maximally compressible
Assume data set D = {xi, i = 1, .., n} is given, where xi = [xi1, xi2, .., xim]
are m-dimensional examples
Differential Predictive Coding (DPC)
Use local context to code the value of xi
ni
DniD
iii
nDPCi
,...,2),( where
},...,,{},...,1,{
1
21
xx
xx
* Djuric, N., Vucetic, S., Efficient Visualization of Large-scale Data Tables through Reordering and Entropy Minimization, ICDM 2013
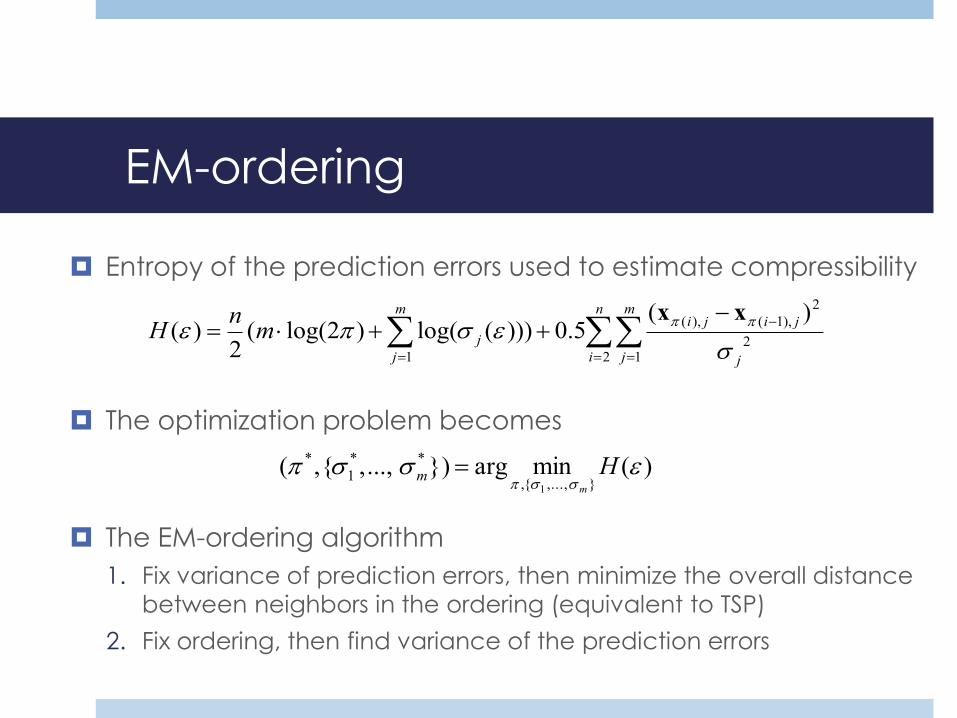
EM-ordering
Entropy of the prediction errors used to estimate compressibility
The optimization problem becomes
The EM-ordering algorithm
1. Fix variance of prediction errors, then minimize the overall distance
between neighbors in the ordering (equivalent to TSP)
2. Fix ordering, then find variance of the prediction errors
n
i
m
j j
jijim
j
jmn
H2 1
2
2
),1(),(
1
)(5.0)))(log()2log((
2)(
xx
)(minarg})...,,{,(}...,,{,
**
1
*
1
Hm
m

TSP-solver
Super-quadratic time complexity of the best TSP solvers is
prohibitive on large data
We propose an O(n log(n)) method, called TSP-means
After creating 2l-tree through recursive runs of k-means, solve TSP
defined on each node while traversing the tree breath-first

Real-world applications
Minneapolis traffic data set
Original data set Reordered data set Locations of the sensors

Large-scale learning
Classification is one of the fundamental machine
learning tasks
Big data brings new challenges
What to do when faced with data sets with millions data
points and/or features?
Traditional non-linear classifiers such as kernel SVM are
inefficient in this setting, unlike linear models
Can we combine accuracy of kernel SVMs with efficiency
of linear models?

Large-scale learning: Multi-class SVM
Assume a data set D = {(xn, yn), n = 1, …, N}, where xn is
a feature vector, and yn is one of M class labels
Multi-class SVM (Crammer et al., JMLR 2001)
Model is parameterized by M weight vectors wi
Prediction is given as
, where
By concatenating all weights wi, we can write

Large-scale learning: Multi-class SVM
Multi-class SVM training
We find the weights by minimizing the following problem
where
This model was extended (Aiolli et al., JMLR 2005) by
assigning a fixed number of weights to each class
, with

Large-scale learning: Multi-class SVM
The resulting Multi-hyperplane Machine (MM) loss function
is non-convex, and the authors propose to solve the modified loss function
where zn is a preset index of a true-class weight
1. We fix a single true-class hyperplane to each training data
point at the beginning of a training epoch
2. After the whole data set is seen, compute and fix new assignments zn and repeat the optimization

Adaptive Multi-hyperplane Machines
We proposed Adaptive MM (AMM), which adaptively learns
an appropriate number of weights for each class
In a nutshell
Assign to each class an infinite number of zero-weights
Use Stochastic Gradient Descent (SGD) to solve the MM
optimization problem
During training, the algorithm finds an appropriate number of
weights suitable for the problem complexity
Provided theoretical guarantees of convergence and
generalization
* Wang, Z., Djuric, N., Crammer, K., Vucetic, S. Trading Representability for Scalability: Adaptive Multi-Hyperplane Machine for Nonlinear Classification, KDD 2011

Adaptive MM
At the tth training iteration, minimize the instantaneous
objective function
SGD optimization
If data point misclassified, true-class weight pushed towards the
point and winning other-class weight pushed away
Points are reassigned to weights after each epoch is completed zero weights get assigned to points and will
be updated to non-zero in the next epoch (adaptability)

Adaptive MM
Theorem 1
If we denote by W* the optimal MM solution, it holds
Theorem 2
Assume we are able to correctly classify an IID-sampled training set of size N, then we can upper bound generalization error with
probability greater than 1−δ as

Extensions: Online group lasso
Enforce group-level sparsity of the weight matrix W
Online truncated gradient (Langford et al., JMLR 2009)
Let wg be a vector representing a gth group of elements
from the weight matrix W, with g = 1, …, G, then
Theoretical guarantees of convergence
Analogous to online variant of group lasso
Straightforward implementation

Extensions: Growing AMM
SGD fails to learn good weights for highly non-linear patterns
Idea: “Clone” existing non-zero weights when misclassification
Results on 4×4 checkerboard data set
Robust to noise, significantly outperforms AMM
BudgetedSVM
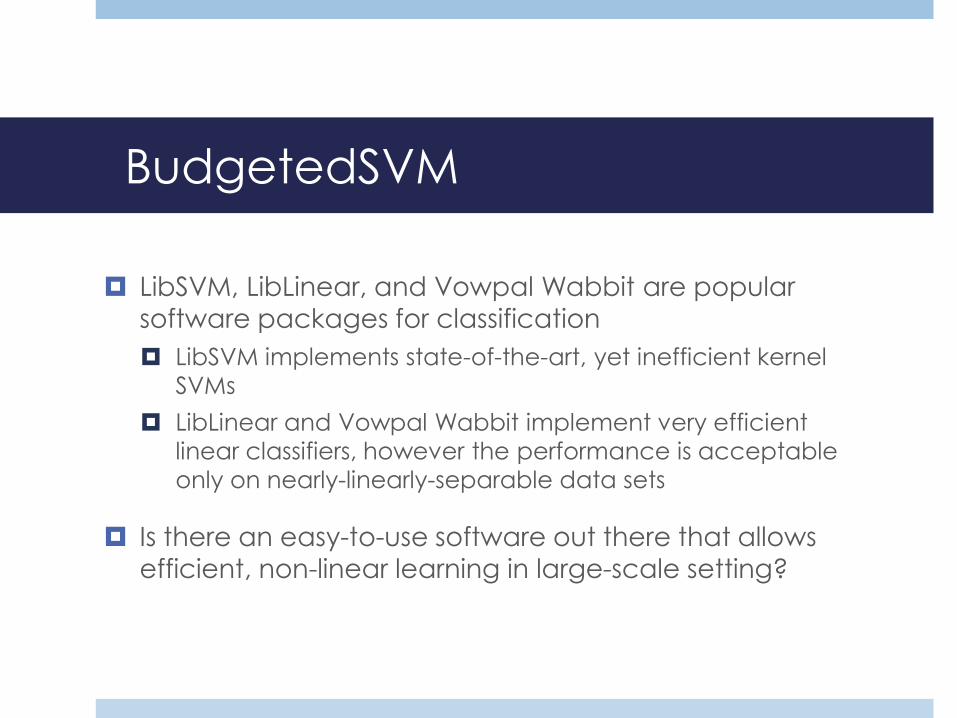
LibSVM, LibLinear, and Vowpal Wabbit are popular
software packages for classification
LibSVM implements state-of-the-art, yet inefficient kernel
SVMs
LibLinear and Vowpal Wabbit implement very efficient
linear classifiers, however the performance is acceptable
only on nearly-linearly-separable data sets
Is there an easy-to-use software out there that allows
efficient, non-linear learning in large-scale setting?

BudgetedSVM
We developed a software package that combines
accuracy of kernel SVMs with efficiency of linear SVMs
Implements 3 large-scale, multi-class, non-linear classifiers
in C++ (AMM, LLSVM, BSGD classifiers)
Budgeted, accurate, non-linear models trained within
minutes on data sets with millions of examples/features
Highly-optimized routines and data structures
Provides an API for handling large-scale data
* Djuric, N., Lan, L., Vucetic, S, Wang, Z. BudgetedSVM: A Toolbox for Scalable SVM Approximations, JMLR 2013

BudgetedSVM
Comparison with the state-of-the-art classifiers
Available from SourceForge.net
More than 300 downloads since summer, try it out!
BB

Confidence-Weighted classification
The task is to train a linear binary classifier to separate
training data points
Online Confidence-Weighted (CW) classifier, in addition
to the prediction margin, outputs our confidence in the
prediction for the incoming test data point
Assumes a multivariate Gaussian over linear classifiers
Given a trained CW model, this induces a Gaussian distribution over the prediction margin for a new point (xt, yt)

CW classification
Online training algorithm is derived having in mind the
following constraints (Dredze et al., ICML 2008; Crammer
et al., NIPS 2009)
New parameter estimates should be close to those from the
previous iteration
Margin for a new training point should be maximized, while
uncertainty minimized
Solve the following optimization problem (AROW):

CW classification on MapReduce
Train a single AROW classifier on each of M mappers, aggregate them on reducer
On reducer, we minimize the following objective function
or its empirical estimate
We can obtain closed-form updates for mean vector and covariance matrix
* Djuric, N., Grbovic, M., Vucetic, S. Distributed Confidence-Weighted Classification on MapReduce, IEEE BigData 2013

CW training on MapReduce
Finding a derivative of the objective function with
respect to mean and covariance matrix, we obtain
The second equation is an algebraic Riccati equation of
the form XAX=B, solved as
, with

Results
Real-world, industrial-size Ad Latency data set
1.3 billion data examples, 21 measured features
Online advertising domain
Improve online experience through timely delivery of relevant ads to the users
Can we detect if the ad will be late before it is served?
Representation
user features (browser type, device type, ISP, location, connection speed, etc.)
ad features (ad type, ad size, ad dimensions, etc.),
vendor features (where is the ad served from, hardware used, etc.)
Results
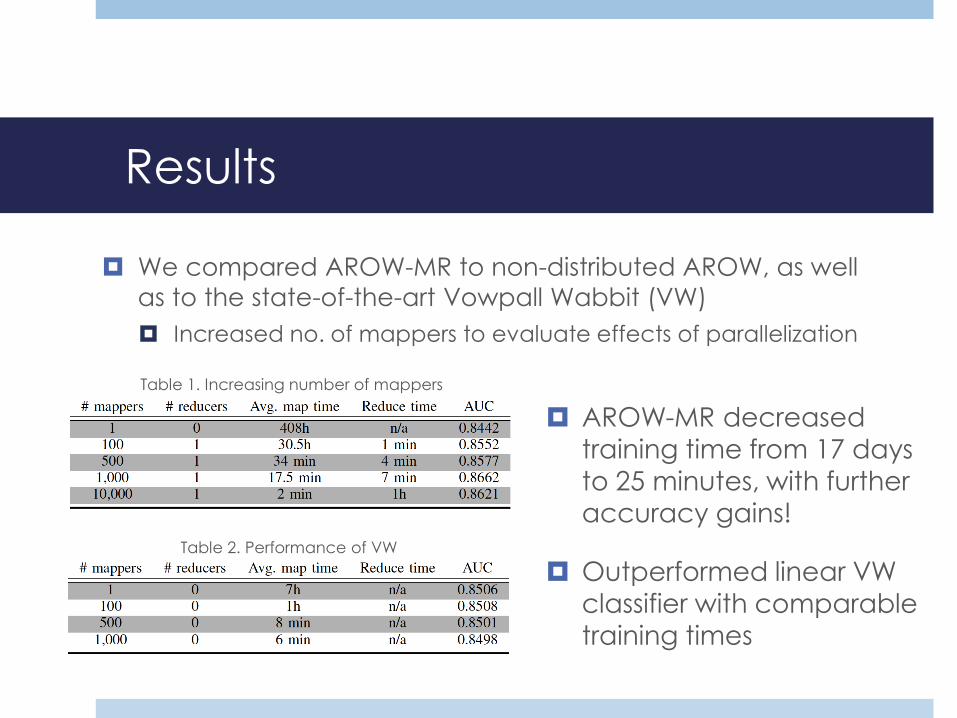
AROW-MR decreased training time from 17 days
to 25 minutes, with further
accuracy gains!
Outperformed linear VW classifier with comparable
training times
Table 1. Increasing number of mappers
Table 2. Performance of VW
We compared AROW-MR to non-distributed AROW, as well
as to the state-of-the-art Vowpall Wabbit (VW)
Increased no. of mappers to evaluate effects of parallelization

Object matching
Given two sets X = {xi, i = 1, .., m} and Y = {yi, i = 1, .., m}, find
one-to-one matching between “similar” objects
Problem appears in many areas (bioinformatics, computer vision,
natural language processing, …)
Closely related to transfer learning
Match objects from two different domains, but without an
option to compare them

Kernelized Sorting
Hilbert-Schmidt Independence Criterion (HSIC) measures dependency between sets X and Y, empirically
estimated as
If the sets are independent, then HSIC is minimal and equal to 0
Hence, matching problem is defined as (π is a
permutation matrix: πij = 1 if xi and yj match, 0 otherwise)
)( maximize T
m
LKtrace
)( 22 LKtracem

Convex Kernelized Sorting
Reformulate KS problem as follows:
Given two m × m matrices K and L, value of trace(K L) is
maximized if rows of K and columns of L are permuted such
that rows of K and corresponding columns of L are identical
up to a constant multiplier
To obtain convex problem, we allow π to be doubly-
stochastic, and KS becomes:
2TT ||)(|| minimize FLK )( maximize T
m
LKtrace
KS CKS
* Djuric, N., Grbovic, M., Vucetic, S., Convex Kernelized Sorting, AAAI 2012

Results
Match English documents to documents in other languages
Baseline matches the documents simply by length
Average no. of correct matches after 5 runs reported below (best
result given in parentheses)
CKS consistently outperforms the competing state-of-the-art

Remote sensing - Aerosols
Aerosols are small particles suspended in the atmosphere,
originating from natural and man-made sources
Estimation of global aerosol distribution is one of the biggest
challenges in climate research
Negative effect on public health
Profound effect on Earth’s radiation budget
Standard measure of distribution is Aerosol Optical Depth (AOD)
Ground-based sensors (AERONET network of instruments)
Satellite-based sensors aboard Terra, Aqua, Aura, Calipso, SeaStar,
and other Earth-observing satellites

Measuring aerosol distribution
Ground-based sensors (Sun photometers)
High accuracy of AOD estimates
High cost of installment and maintenance
Satellite-based sensors
Lower accuracy of AOD estimation
Global daily coverage

Problem setting
OBJECTIVE: find an optimal combination of available
satellite measurements, using scarce AERONET
measurements as a ground-truth AOD during training
We are given training data set consisting of targets yi
(AERONET) and of estimates of yi by K different experts
(satellites), with Nu unlabeled and Nl labeled data points
Considered approaches
Semi-supervised combination of experts
Gaussian Conditional Random Fields

Combination of experts: Related work
Bates and Granger, 1969;
Granger and Ramanathan, 1984
Supervised method, no missing data allowed
Raykar et al., 2009; Ristovski et al., 2010
Unsupervised methods, no missing data allowed
Experts assumed independent
The proposed semi-supervised method presents a
significant generalization of the two approaches
Allows missing data, correlated experts, and finds different
data-generating regimes

Methodology
Data points sampled IID, and target follows
normal distribution,
Denote by a K-dimensional vector of expert
predictions, sampled from multivariate Gaussian,
Training task is to find the parameters
y
yi ~ Norm(my,s y
2 )
yi | yi ~ Norm(yi1,S) K
yi
N
Q= {S,my,s y
2}
y
* Djuric, N., Kansakar, L., Vucetic, S., Semi-Supervised Learning for Integration of Aerosol Predictions from Multiple Satellite Instruments, IJCAI 2013 (outstanding paper award)

Inference
Once the training is completed, aggregated prediction
can be found as a mean of the posterior distribution
(assuming no missing experts)
where the mean can be computed as follows,
yi =y 'i
T S '-11
1TS '-1
1, with yi
' = [yiT,my ]
T and S'=S 0
0 s y
2
é
ë
êê
ù
û
úú
yi | yii ~ Norm(yi, (1TS'-1
1)-1)

Training
Learning by maximizing likelihood of the training data
We write probability of the training data as follows
The probability of unlabeled data set is equal to
P(D |Q)= P(Du |Q)×P(Dl |Q)
P(Du |Q) = P(yi |Q)i=1
Nu
Õ = P(yi | y,Q)P(y |Q)dyy
òi=1
Nu
Õ
= (| S ' |-1
(2p )K-11TS '-11
)exp(-1
2(y 'i- yi1)
TS '-1(y 'i- yi1))i=1
Nu
Õ

Training
Further, the probability of labeled data can be written as
To simplify the equations, we assume that , which
amounts to an uninformative prior over the target variable
After finding derivative of the data log-likelihood with respect to , we obtain an iterative update equation,
s y
2 ®¥
P(Dl |Q)= P(yi | yi,Q)i=Nu+1
N
Õ =1
(2p )K /2 |S |0.5exp(-0.5(yi - yi1)
TS-1(yi - yi1))i=Nu+1
N
Õ
S=1
N((Yl - yl1
T )T (Yl - yl1T )+ Yu
TYu +
Nu11T
1TS-1
1+ (yi
211
T - yi(1yiT + yi1
T ))i=1
Nu
å )
S-1
Bates and Granger, 1969 Ristovski et al., 2010

Further advantages
Straightforward to account for missing experts due to the
assumption of Gaussianity
Incorporation of domain knowledge through a Wishartprior over the precision matrix
We derive an approach for partitioning data into several
regimes, where expert predictions within each regime are sampled from a different multivariate Gaussian
Learned using the EM algorithm

Results
We used 5 years of aerosol data from 33 AERONET US
locations, and predictions from 5 experts (MISR, Terra
MODIS, Aqua MODIS, OMI, SeaWiFS)
Training data set with 6,913 labeled examples (roughly 200 examples per site)
58% of satellite predictions missing

Results
Evaluating usefulness of partitioning
From each site we randomly sampled 100 points, and
assumed that 50 are labeled and 50 unlabeled

Results
Evaluating usefulness of unlabeled data
Randomly selected 2, 4, and 6 sites and took 100 points from
each as labeled data; then, we selected 100 points from
each remaining site and treated them as unlabeled
Simulates large areas where just few AERONET sites are available
Unlabeled data helpful, although benefit decreased when larger amounts of labeled data points were available
Structured Learning with GCRF
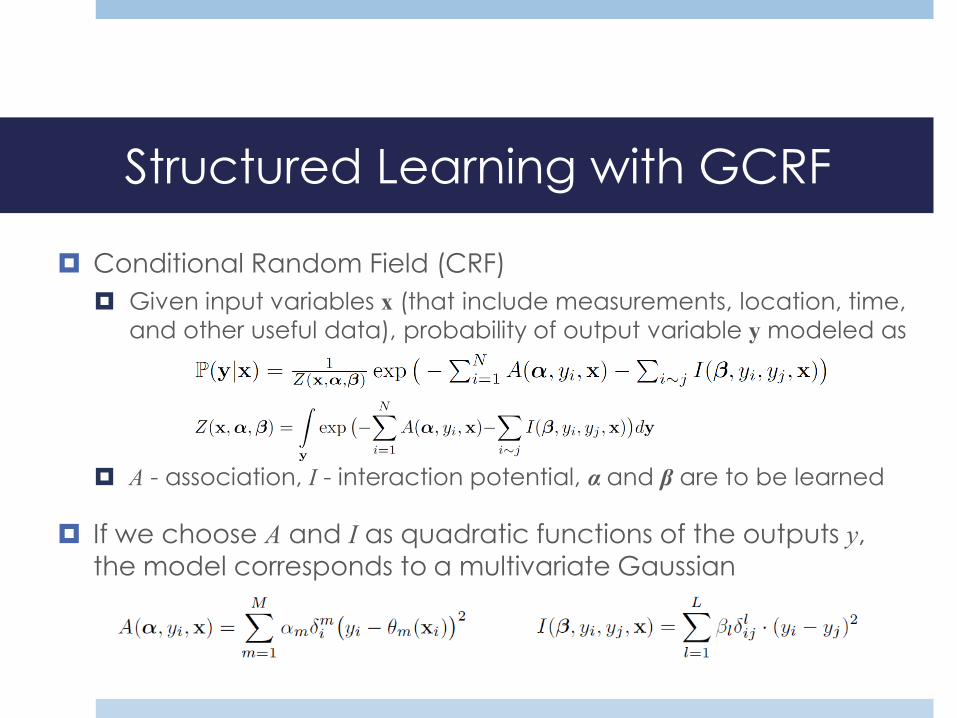
Conditional Random Field (CRF)
Given input variables x (that include measurements, location, time,
and other useful data), probability of output variable y modeled as
A - association, I - interaction potential, α and β are to be learned
If we choose A and I as quadratic functions of the outputs y,
the model corresponds to a multivariate Gaussian

GCRF for AOD estimation
We considered 5 satellite instruments
2 instruments have overpass time in the morning (Terra MODIS
and MISR,10:30am local time)
3 instruments have a time of overpass in the afternoon (Aqua
MODIS, OMI, and SeaWiFS,1:30pm local time)
We assume high correlation between AOD at 10:30am and
1:30pm on the same day, as well as between AOD values at
the same time between two consecutive days

GCRF Model I
We estimate AOD at 10:30am and 1:30pm for each location
The corresponding graphical model
GCRF Model II
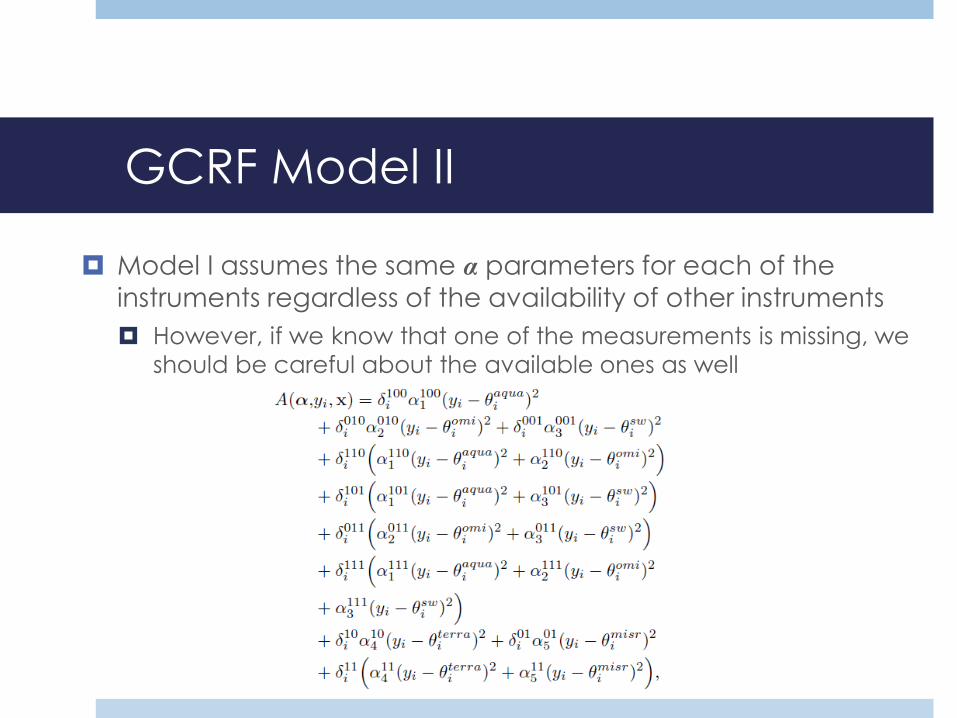
Model I assumes the same α parameters for each of the
instruments regardless of the availability of other instruments
However, if we know that one of the measurements is missing, we
should be careful about the available ones as well

Results
Results given in terms of RMSE
We give results for various models, used parameters, and
availability patterns

Results
Learned parameters of Model II provide insight in the
quality of instruments
Within-day interaction much stronger than day-to-day
interaction
OMI assigned very low α, except when all satellites are
available (issue with OMI filter?)
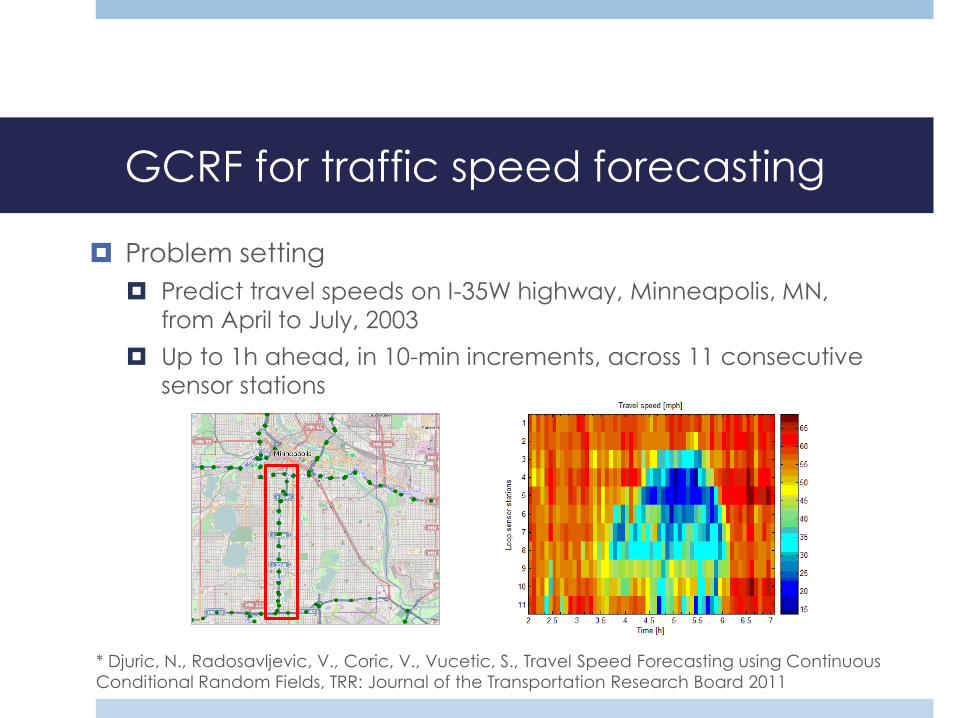
GCRF for traffic speed forecasting
Problem setting
Predict travel speeds on I-35W highway, Minneapolis, MN,
from April to July, 2003
Up to 1h ahead, in 10-min increments, across 11 consecutive
sensor stations
* Djuric, N., Radosavljevic, V., Coric, V., Vucetic, S., Travel Speed Forecasting using Continuous
Conditional Random Fields, TRR: Journal of the Transportation Research Board 2011

Results
Compared with linear regression
Baseline predictors
Downstream sensor speed
Upstream sensor speed
Historical average
Current speed
Ongoing / future work
Semi-supervised combination of experts
Parameterized priors?
Structured output, non-IID data?
GMRF priors?
Data visualization
Developing software for visual exploration
Distributed implementation?
Binary features, user-provided constraints on orderings?
Many-to-many object matching
Scaling up CKS? Regularization? Semi-supervised?

Ongoing / future work
Large-scale learning
Completing characterization and implementation of group
lasso for AMM
Extending more state-of-the-art methods to large-scale
domain (GCRF training using MapReduce, GraphLab,
GraphChi?)
AMM-rank, evaluation of large-scale label ranking method
Dirichlet process?
Structured learning
Application of GCRF to aerosol estimation (sunglint, clouds?)
Speeding up GCRF, further assumptions on the structure

Conclusions
Inadequacy of standard machine learning tools in large-scale setting is apparent
Novel methods are necessary to address plethora of Big Data problems
Large-scale learning
Efficient, non-linear AMM classifiers
Highly-optimized BudgetedSVM C++ toolbox
Confidence-weighted classification on MapReduce
Data visualization
Fast, efficient knowledge discovery
Semi-supervised combination of experts
Accounts for unlabeled data, missing data, correlations
Useful in many areas of machine learning
Structured learning in remote sensing and traffic estimation

Thank you!
Questions?