big data & data analytics in der rückversicherung ... · structured vs. unstructured ... big...
TRANSCRIPT

Big Data & Data Analytics in der Rückversicherung –Analyse strukturierter und unstrukturierter Daten
Weiterbildungstag der DGVFMHannover, 16. Juni 2016Wolfgang Hauner, Head of Data Analytics
Image: Bayerische Zugspitzbahn Bergbahn AG / Lechner

Agenda
Data Analytics Framework1 Technology Stack2
The People behind Big Data & Analytics3 Current / Planned Activities4
16.06.2016 2
Advanced Analytics: Methods and Examples5 Conclusion6

Agenda
Data Analytics Framework1 Technology Stack2
The People behind Big Data & Analytics3 Current / Planned Activities4
16.06.2016 3
Advanced Analytics: Methods and Examples5 Conclusion6
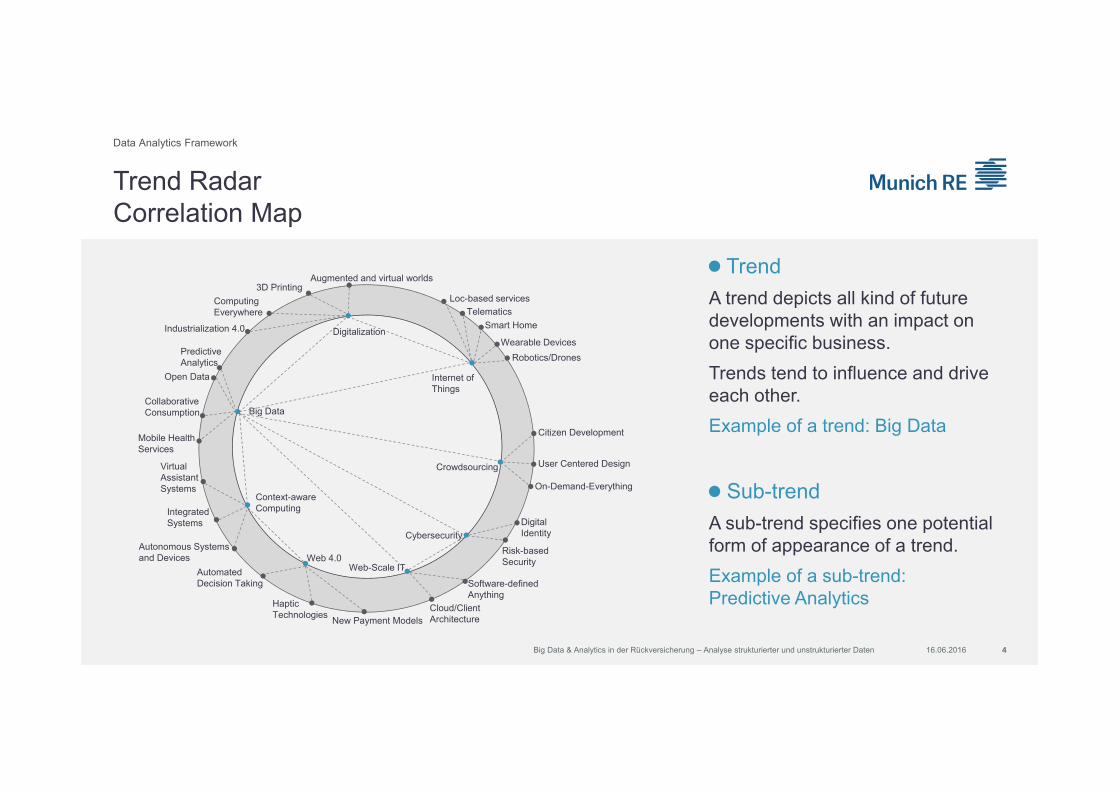
TrendA trend depicts all kind of future developments with an impact on one specific business. Trends tend to influence and drive each other.Example of a trend: Big Data
Sub-trendA sub-trend specifies one potential form of appearance of a trend. Example of a sub-trend: Predictive Analytics
Trend RadarCorrelation Map
16.06.2016
Computing Everywhere
VirtualAssistantSystems
Risk-based Security
Haptic Technologies
Integrated Systems
Autonomous Systems and Devices
Collaborative Consumption
Automated Decision Taking
Predictive Analytics
Industrialization 4.0
Cloud/Client Architecture
Software-defined Anything
Mobile Health Services
3D PrintingAugmented and virtual worlds
Citizen Development
User Centered Design
New Payment Models
Digital Identity
On-Demand-Everything
Wearable DevicesRobotics/Drones
Smart Home
Loc-based services
Big Data
Internet of Things
Cybersecurity
Digitalization
Context-aware Computing
Open Data
Web 4.0Web-Scale IT
Telematics
Crowdsourcing
Data Analytics Framework
Big Data & Analytics in der Rückversicherung – Analyse strukturierter und unstrukturierter Daten 4

Leverage data knowledge
16.06.2016
Data Analytics Framework
Center of Competence Knowledge / Technology
Link to Innovation Topics
Build Analytics Community
Generate business value through data analytics
Big Data & Analytics in der Rückversicherung – Analyse strukturierter und unstrukturierter Daten 5
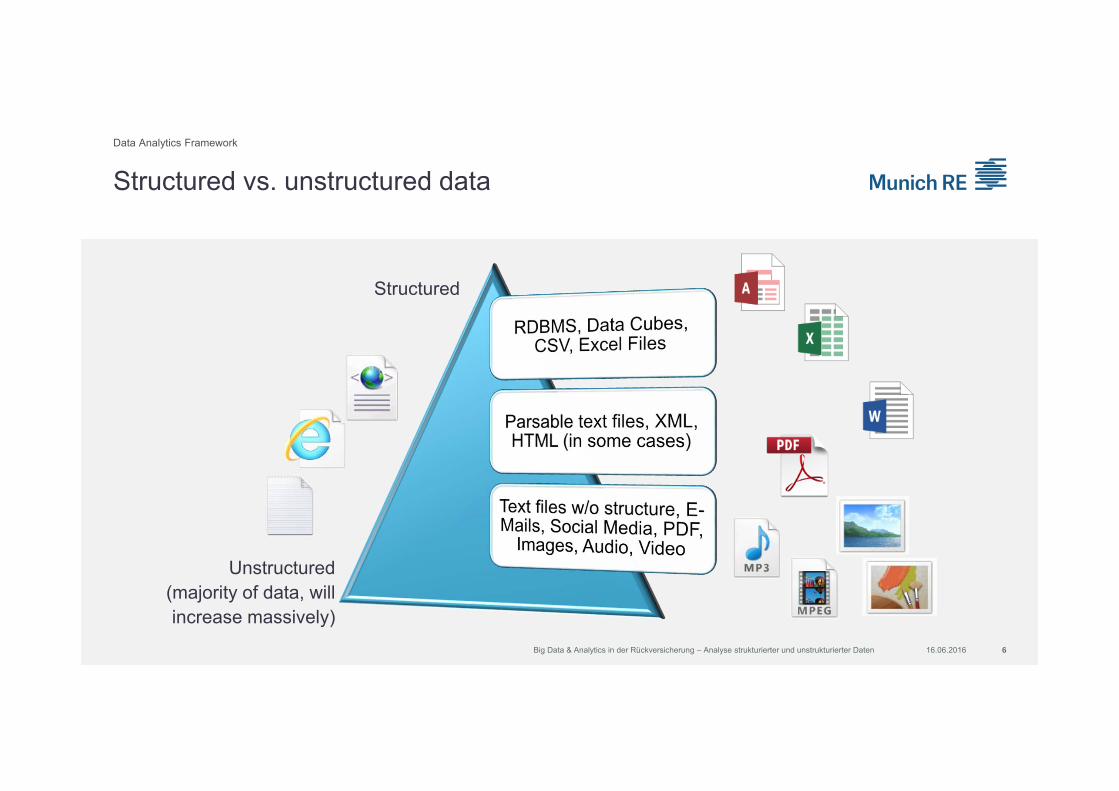
Structured vs. unstructured data
16.06.2016 6Big Data & Analytics in der Rückversicherung – Analyse strukturierter und unstrukturierter Daten
Data Analytics Framework
Structured
Unstructured(majority of data, will increase massively)

Advanced Analytics is our core competenceData Analytics Framework
Predictive Modeling
regression andmachinelearningmodels
Multivariate Effect Analysis
regression and machine learning
models
advanced visualizationtechniques
Explorative Analysis
singular valuedecomposition, natural
language processing
Textmining
Predict outcomes based on certain explaining factors
Predict claimed amount per individual based on age, gender, disease etc.
Figure out how certain factorsinfluence a target variable
Influence of age, gender,disease etc. on claimed amount
Dynamically visualize data ofany size
Get a quick and easy overview of databy using heatmaps, correlationmatrices etc.
Convert large amounts ofunstructured text into a structuredform
Extract key topics from claims reports
Provide expert support in all analytical areas
16.06.2016
Advanced Analytics
Big Data & Analytics in der Rückversicherung – Analyse strukturierter und unstrukturierter Daten 7
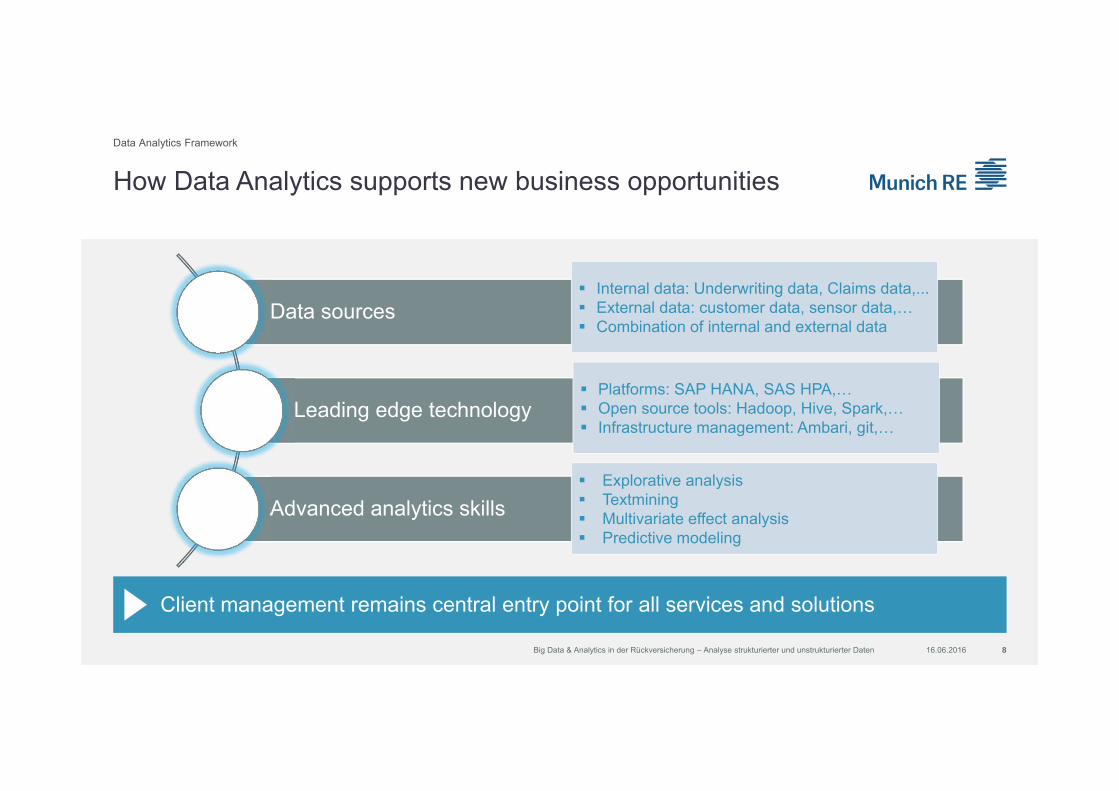
How Data Analytics supports new business opportunities
16.06.2016
Data sources
Leading edge technology
Advanced analytics skills
Client management remains central entry point for all services and solutions
Internal data: Underwriting data, Claims data,... External data: customer data, sensor data,… Combination of internal and external data
Platforms: SAP HANA, SAS HPA,… Open source tools: Hadoop, Hive, Spark,… Infrastructure management: Ambari, git,…
Explorative analysis Textmining Multivariate effect analysis Predictive modeling
Data Analytics Framework
Big Data & Analytics in der Rückversicherung – Analyse strukturierter und unstrukturierter Daten 8
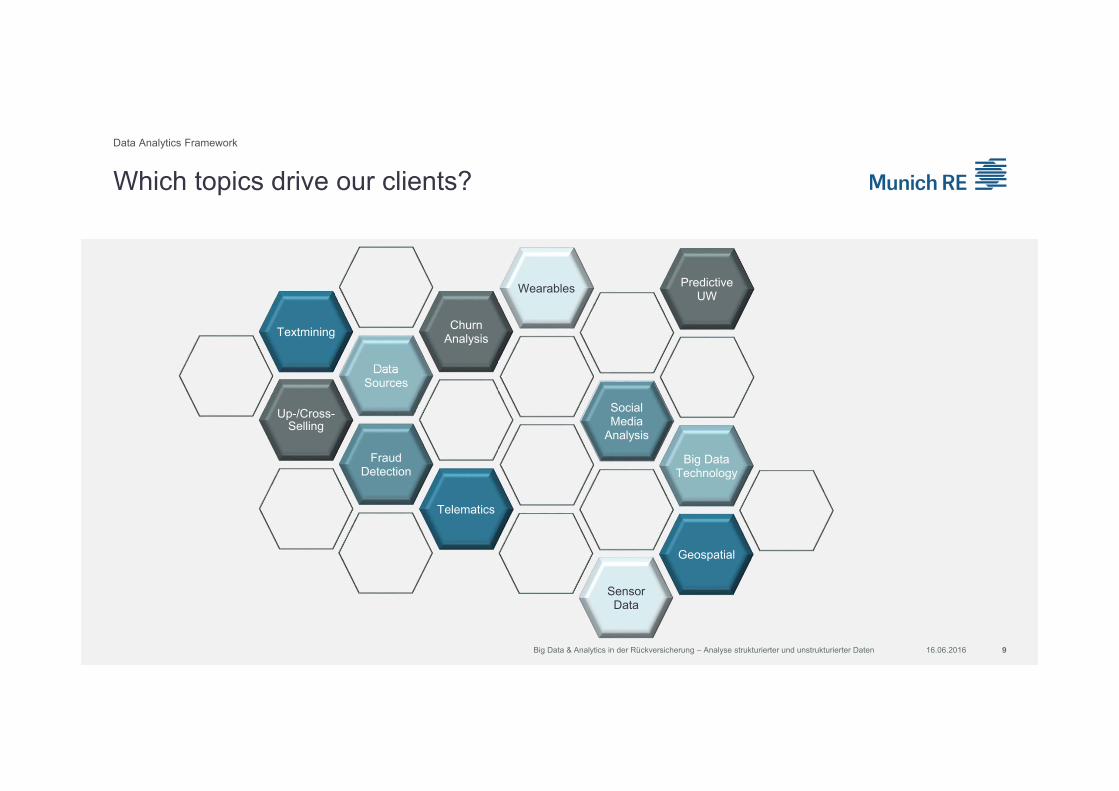
Which topics drive our clients?
16.06.2016
Up-/Cross-Selling
Data Sources
Textmining ChurnAnalysis
Wearables
SocialMedia
Analysis
FraudDetection
Big Data Technology
PredictiveUW
Telematics
Sensor Data
Geospatial
Data Analytics Framework
Big Data & Analytics in der Rückversicherung – Analyse strukturierter und unstrukturierter Daten 9

Agenda
Data Analytics Framework1 Technology Stack2
The People behind Big Data & Analytics3 Current / Planned Activities4
16.06.2016 10
Advanced Analytics: Methods and Examples5 Conclusion6
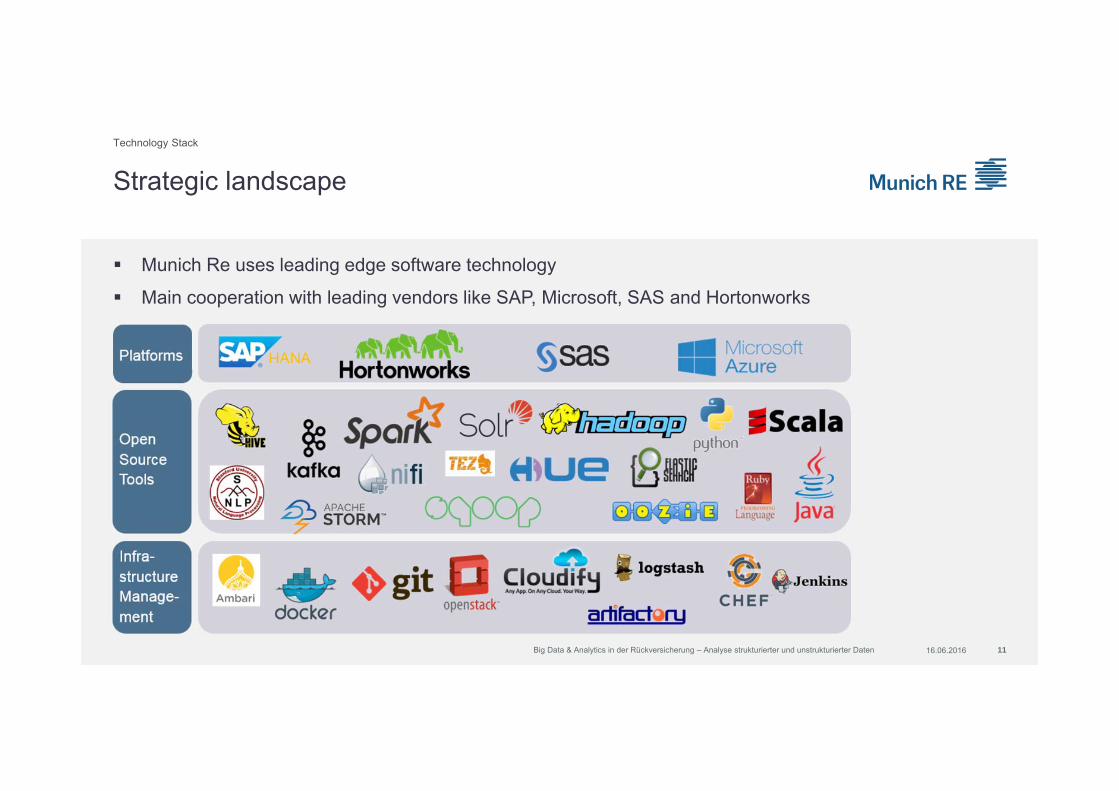
Strategic landscape
Munich Re uses leading edge software technology
Main cooperation with leading vendors like SAP, Microsoft, SAS and Hortonworks
Technology Stack
16.06.2016Big Data & Analytics in der Rückversicherung – Analyse strukturierter und unstrukturierter Daten 11
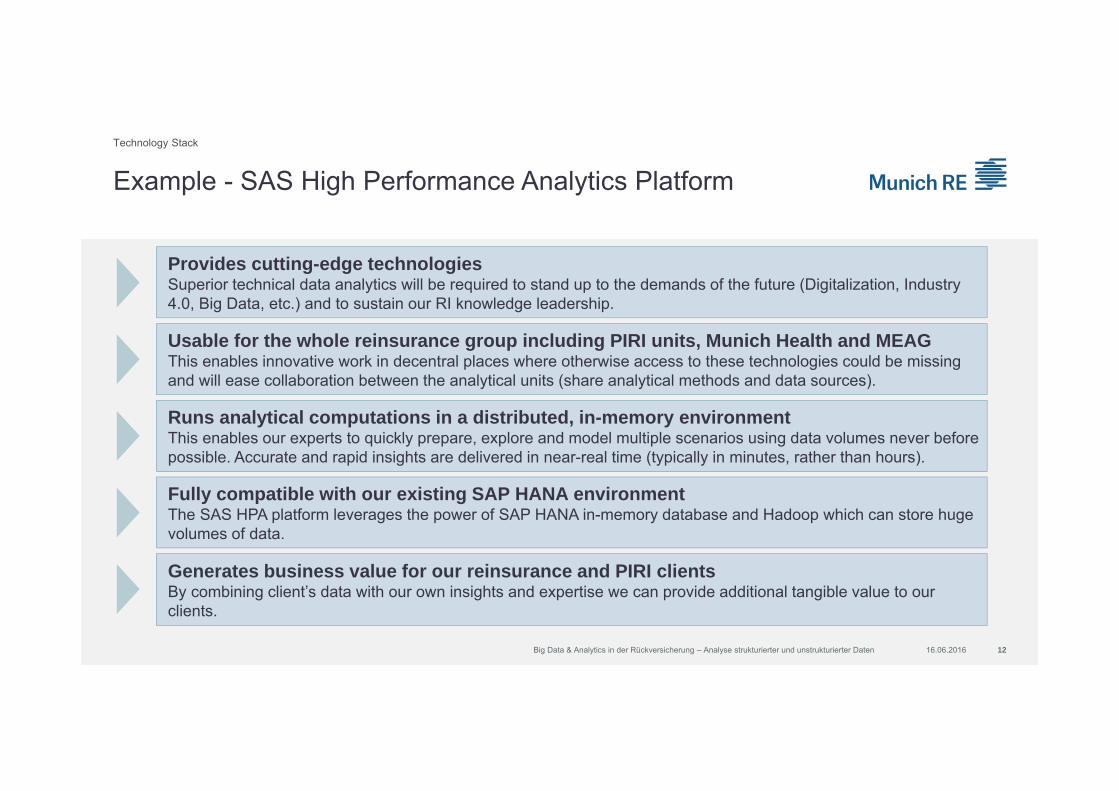
Example - SAS High Performance Analytics Platform
Provides cutting-edge technologiesSuperior technical data analytics will be required to stand up to the demands of the future (Digitalization, Industry 4.0, Big Data, etc.) and to sustain our RI knowledge leadership.
Usable for the whole reinsurance group including PIRI units, Munich Health and MEAGThis enables innovative work in decentral places where otherwise access to these technologies could be missing and will ease collaboration between the analytical units (share analytical methods and data sources).
Runs analytical computations in a distributed, in-memory environmentThis enables our experts to quickly prepare, explore and model multiple scenarios using data volumes never before possible. Accurate and rapid insights are delivered in near-real time (typically in minutes, rather than hours).
Fully compatible with our existing SAP HANA environmentThe SAS HPA platform leverages the power of SAP HANA in-memory database and Hadoop which can store huge volumes of data.
Generates business value for our reinsurance and PIRI clientsBy combining client’s data with our own insights and expertise we can provide additional tangible value to our clients.
16.06.2016Big Data & Analytics in der Rückversicherung – Analyse strukturierter und unstrukturierter Daten 12
Technology Stack
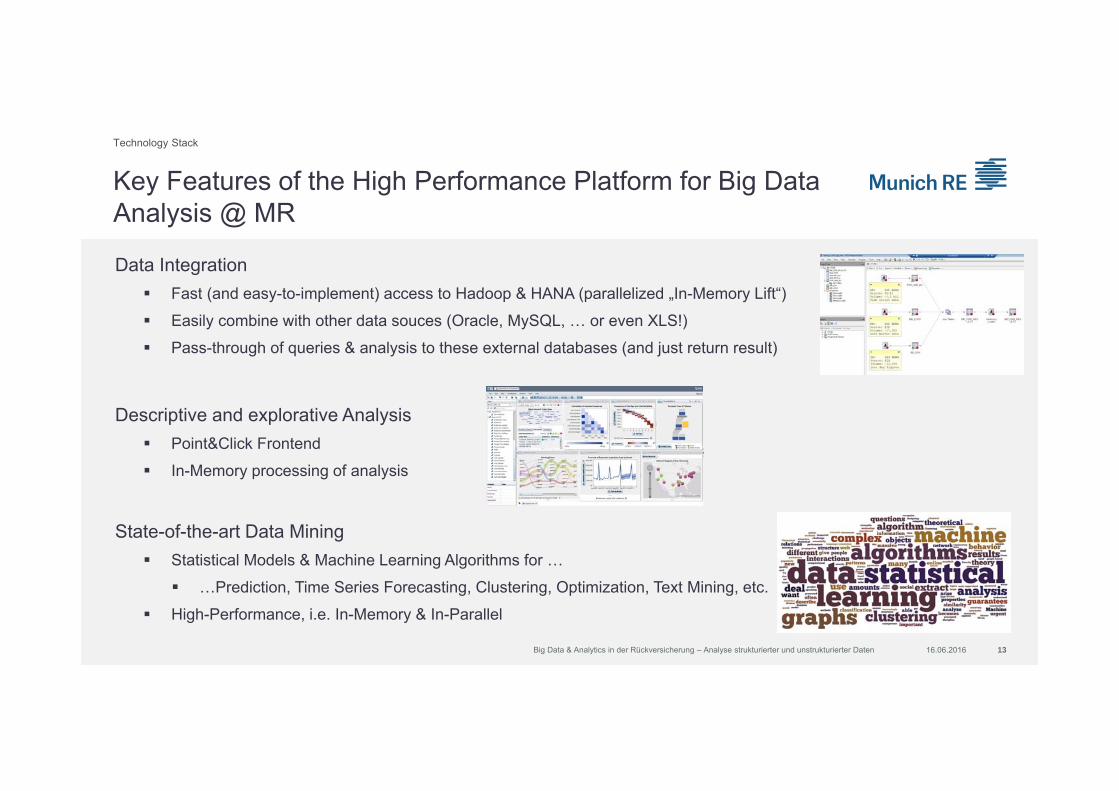
Key Features of the High Performance Platform for Big Data Analysis @ MR
Data Integration Fast (and easy-to-implement) access to Hadoop & HANA (parallelized „In-Memory Lift“)
Easily combine with other data souces (Oracle, MySQL, … or even XLS!)
Pass-through of queries & analysis to these external databases (and just return result)
Descriptive and explorative Analysis Point&Click Frontend
In-Memory processing of analysis
State-of-the-art Data Mining Statistical Models & Machine Learning Algorithms for …
…Prediction, Time Series Forecasting, Clustering, Optimization, Text Mining, etc.
High-Performance, i.e. In-Memory & In-Parallel
16.06.2016Big Data & Analytics in der Rückversicherung – Analyse strukturierter und unstrukturierter Daten 13
Technology Stack
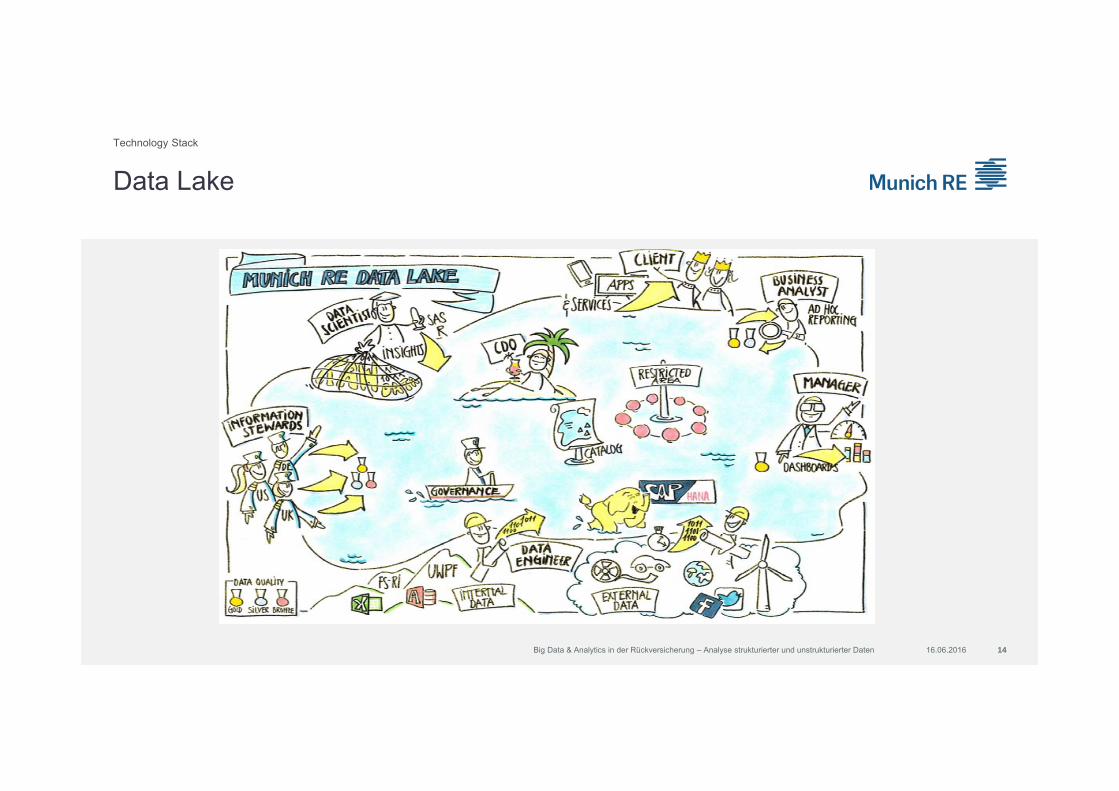
Data LakeTechnology Stack
16.06.2016Big Data & Analytics in der Rückversicherung – Analyse strukturierter und unstrukturierter Daten 14

Agenda
Data Analytics Framework1 Technology Stack2
The People behind Big Data & Analytics3 Current / Planned Activities4
16.06.2016 15
Advanced Analytics: Methods and Examples5 Conclusion6

Typical setup
16.06.2016 16Big Data & Analytics in der Rückversicherung – Analyse strukturierter und unstrukturierter Daten
The People behind Big Data & Analytics

Data Scientists and Data Engineers
16.06.2016 17Big Data & Analytics in der Rückversicherung – Analyse strukturierter und unstrukturierter Daten
Statistics / Machine Learning
Programming (e.g. R, Python, SAS, SQL, Hadoop Tools [Pig, Hive, Spark,…])
Visualization
Business/domain knowledge
Soft skills (Creative, Curious, Communicative, Collaborative, Critical)
Strong software engineering (SAS HPA, Hadoop, Java, HTML, Java Script, etc.) anddatabase skills
Provide data infrastructure / architecture, e. g. Data Lake
Seamless integration of different systems
Provision of user interfaces and applicationprogramming interfaces for data scientists etc.
Collection, processing and maintenance of data
Data Scientist Data Engineer
The People behind Big Data & Analytics
Agenda
Data Analytics Framework1 Technology Stack2
The People behind Big Data & Analytics3 Current / Planned Activities4
16.06.2016 18
Advanced Analytics: Methods and Examples5 Conclusion6

Pilot Fact SheetRisk Management Platform for NatCat Pools
Results Benefits Easier, faster and cheaper information about exposure and
losses
Transparency on all exposures and losses independent of participation and risk assessment
Database on loss events allows in-depth trend detection
Faster & more effective claims management
16.06.2016
Current / Planned Activities
Big Data & Analytics in der Rückversicherung – Analyse strukturierter und unstrukturierter Daten 19
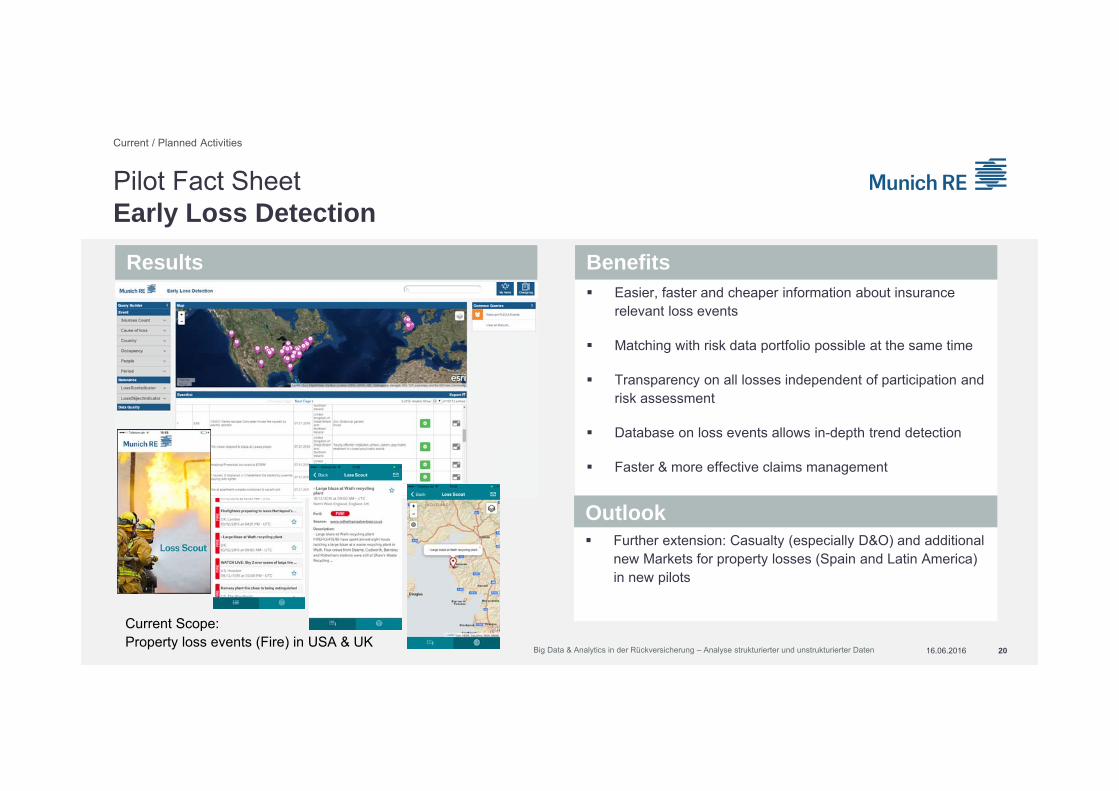
Pilot Fact SheetEarly Loss Detection
Results Benefits
16.06.2016 20
Easier, faster and cheaper information about insurance relevant loss events
Matching with risk data portfolio possible at the same time
Transparency on all losses independent of participation and risk assessment
Database on loss events allows in-depth trend detection
Faster & more effective claims management
Outlook Further extension: Casualty (especially D&O) and additional
new Markets for property losses (Spain and Latin America) in new pilots
Current / Planned Activities
Big Data & Analytics in der Rückversicherung – Analyse strukturierter und unstrukturierter Daten
Current Scope:Property loss events (Fire) in USA & UK
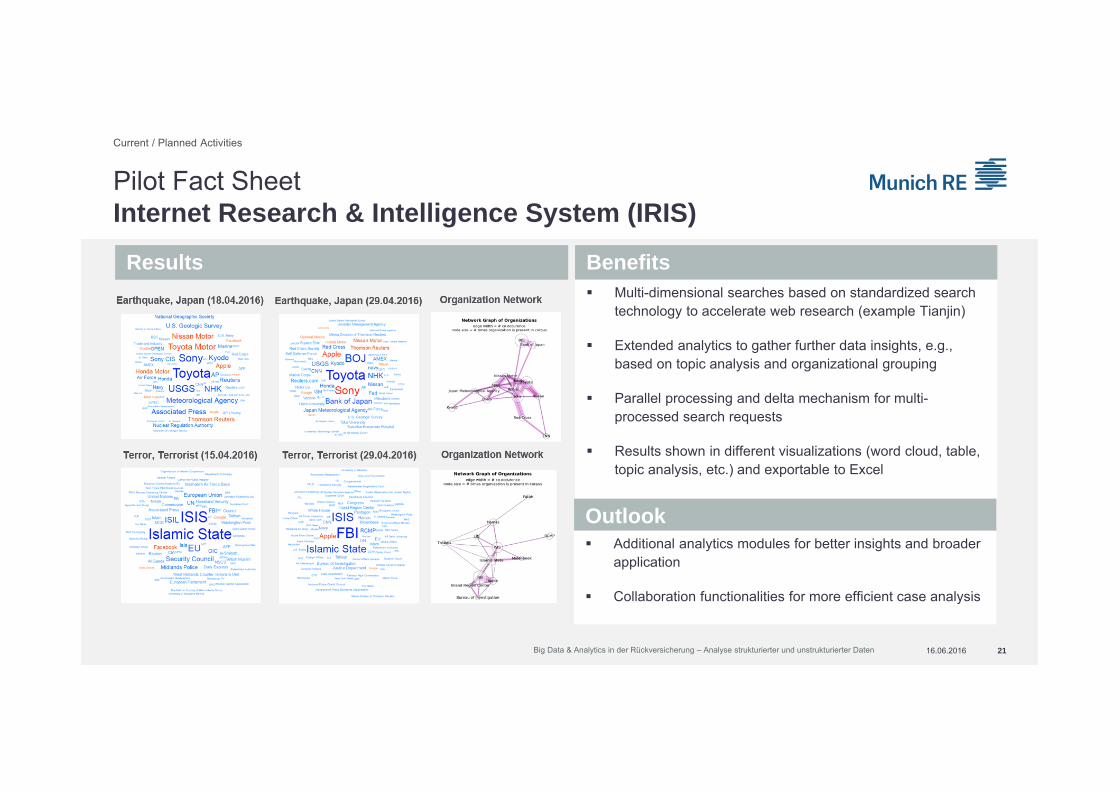
Pilot Fact SheetInternet Research & Intelligence System (IRIS)
Results Benefits
16.06.2016 21
Multi-dimensional searches based on standardized search technology to accelerate web research (example Tianjin)
Extended analytics to gather further data insights, e.g., based on topic analysis and organizational grouping
Parallel processing and delta mechanism for multi-processed search requests
Results shown in different visualizations (word cloud, table, topic analysis, etc.) and exportable to Excel
Outlook Additional analytics modules for better insights and broader
application
Collaboration functionalities for more efficient case analysis
Big Data & Analytics in der Rückversicherung – Analyse strukturierter und unstrukturierter Daten
Current / Planned Activities
Agenda
Data Analytics Framework1 Technology Stack2
The People behind Big Data & Analytics3 Current / Planned Activities4
16.06.2016 22
Advanced Analytics: Methods and Examples5 Conclusion6
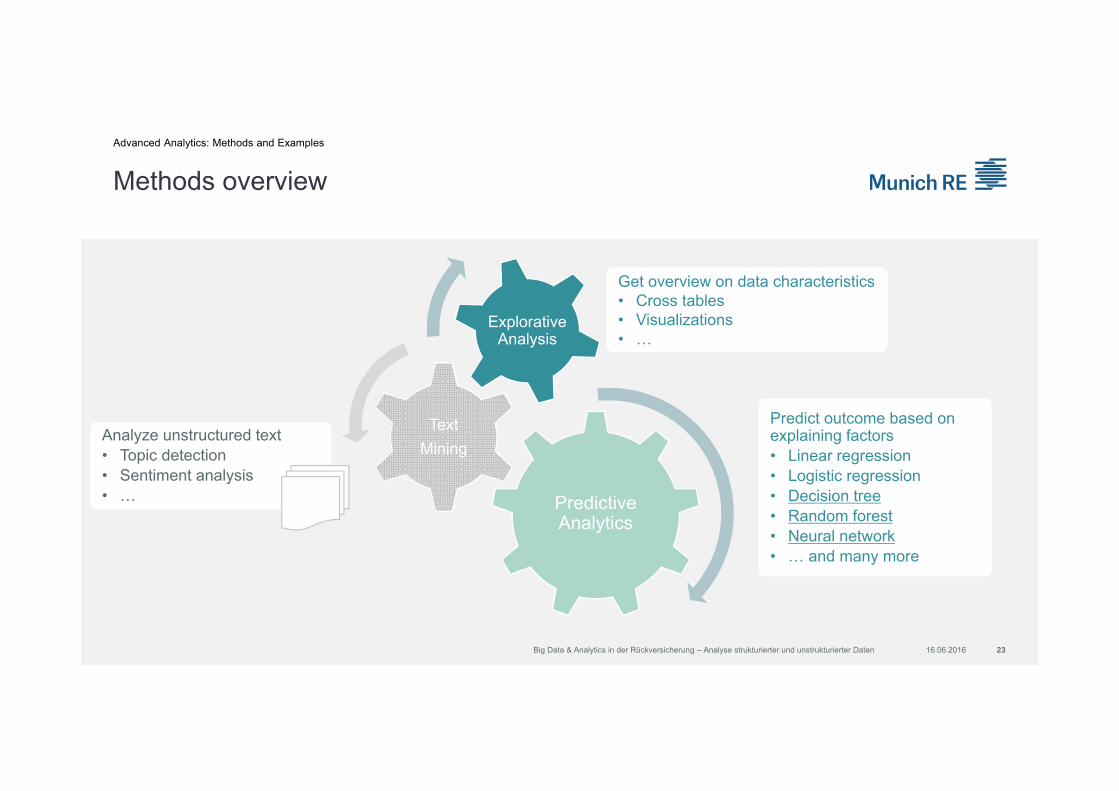
Methods overview
23
Explorative Analysis
Get overview on data characteristics• Cross tables• Visualizations• …
Predictive Analytics
Predict outcome based on explaining factors• Linear regression• Logistic regression• Decision tree• Random forest• Neural network• … and many more
TextMining
Analyze unstructured text• Topic detection• Sentiment analysis• …
Advanced Analytics: Methods and Examples
Big Data & Analytics in der Rückversicherung – Analyse strukturierter und unstrukturierter Daten 16.06.2016
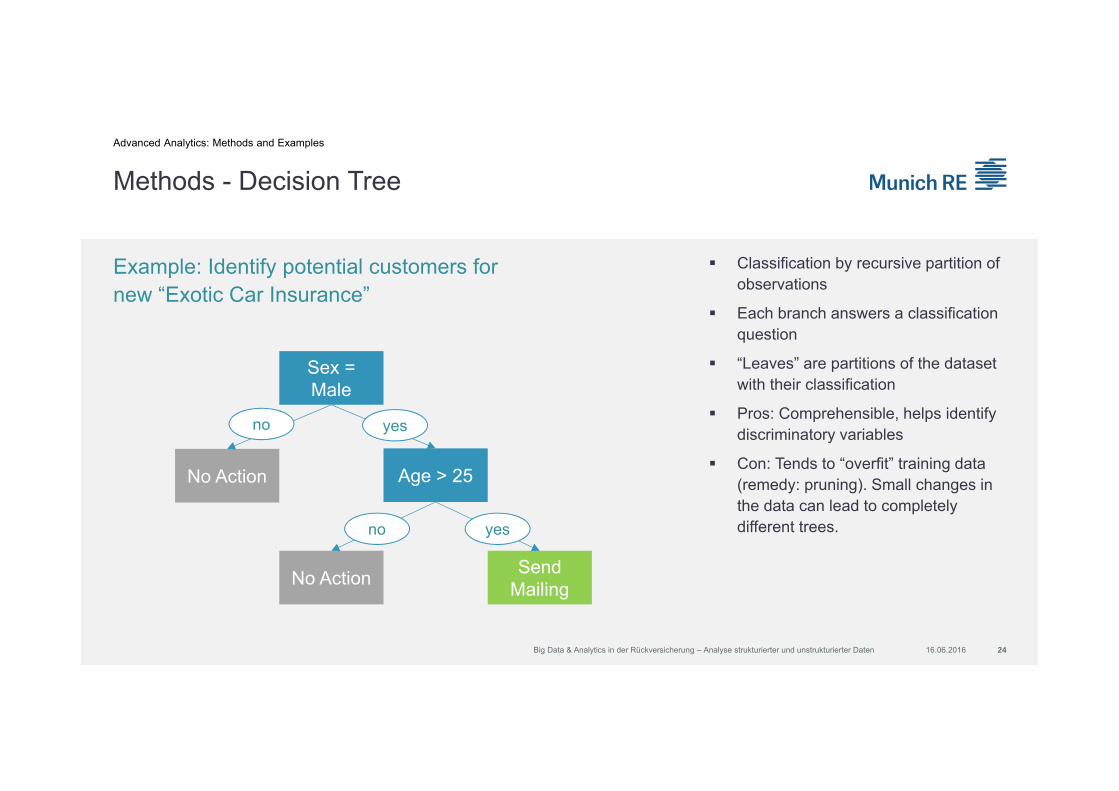
Classification by recursive partition of observations
Each branch answers a classification question
“Leaves” are partitions of the dataset with their classification
Pros: Comprehensible, helps identify discriminatory variables
Con: Tends to “overfit” training data (remedy: pruning). Small changes in the data can lead to completely different trees.
Methods - Decision Tree
24
Sex = Male
Age > 25No Action
No Action Send Mailing
yes
yes
no
no
Example: Identify potential customers for new “Exotic Car Insurance”
Advanced Analytics: Methods and Examples
16.06.2016Big Data & Analytics in der Rückversicherung – Analyse strukturierter und unstrukturierter Daten
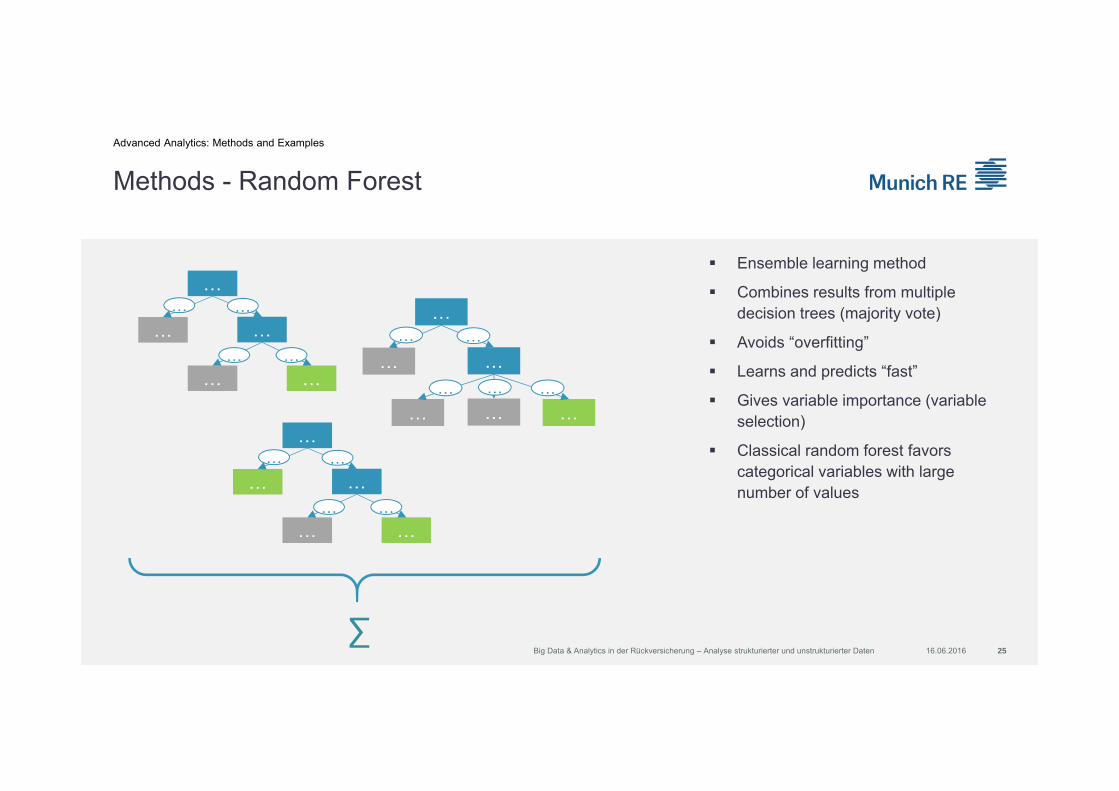
Ensemble learning method
Combines results from multiple decision trees (majority vote)
Avoids “overfitting”
Learns and predicts “fast”
Gives variable importance (variable selection)
Classical random forest favors categorical variables with large number of values
Methods - Random Forest
25Big Data & Analytics in der Rückversicherung – Analyse strukturierter und unstrukturierter Daten
…
……
… …
…
…
…
…
…
……
… …
…
…
…
…
…
……
… …
…
…
…
………
∑
Advanced Analytics: Methods and Examples
16.06.2016
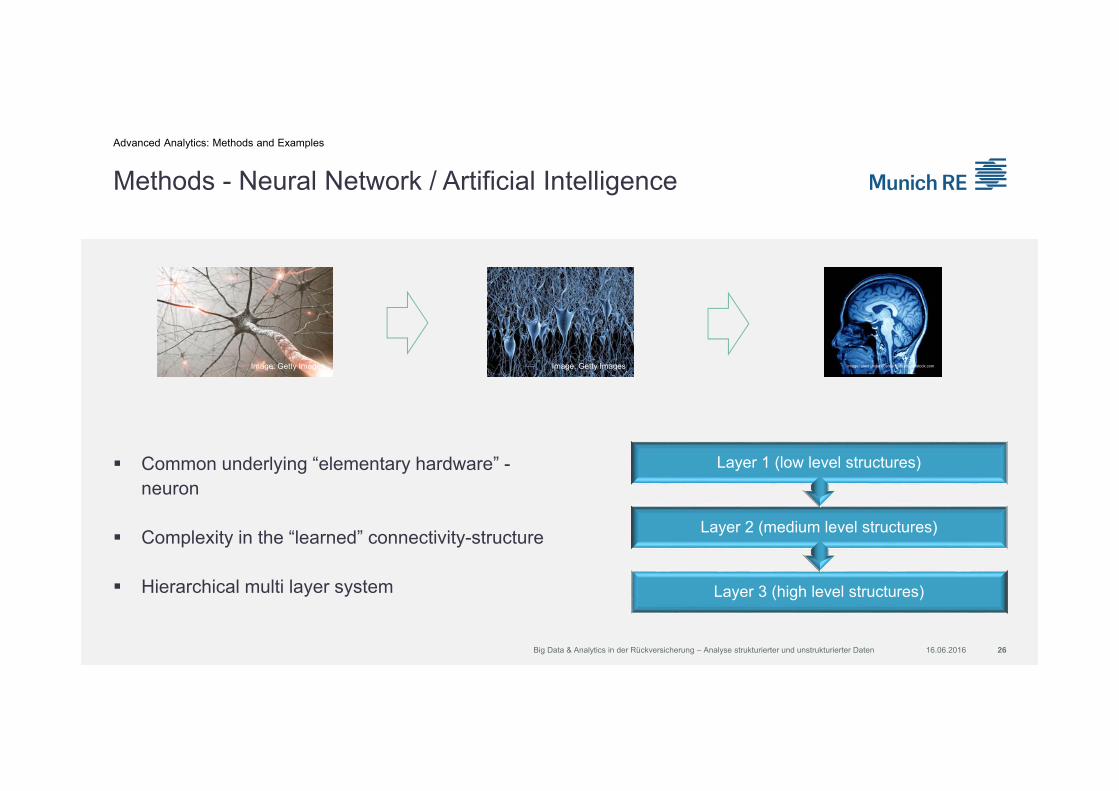
Methods - Neural Network / Artificial Intelligence
26
Common underlying “elementary hardware” -neuron
Complexity in the “learned” connectivity-structure
Hierarchical multi layer system
Advanced Analytics: Methods and Examples
16.06.2016Big Data & Analytics in der Rückversicherung – Analyse strukturierter und unstrukturierter Daten
Image: Getty Images Image: Getty Images Image: used under license from shutterstock.com
Layer 3 (high level structures)
Layer 2 (medium level structures)
Layer 1 (low level structures)
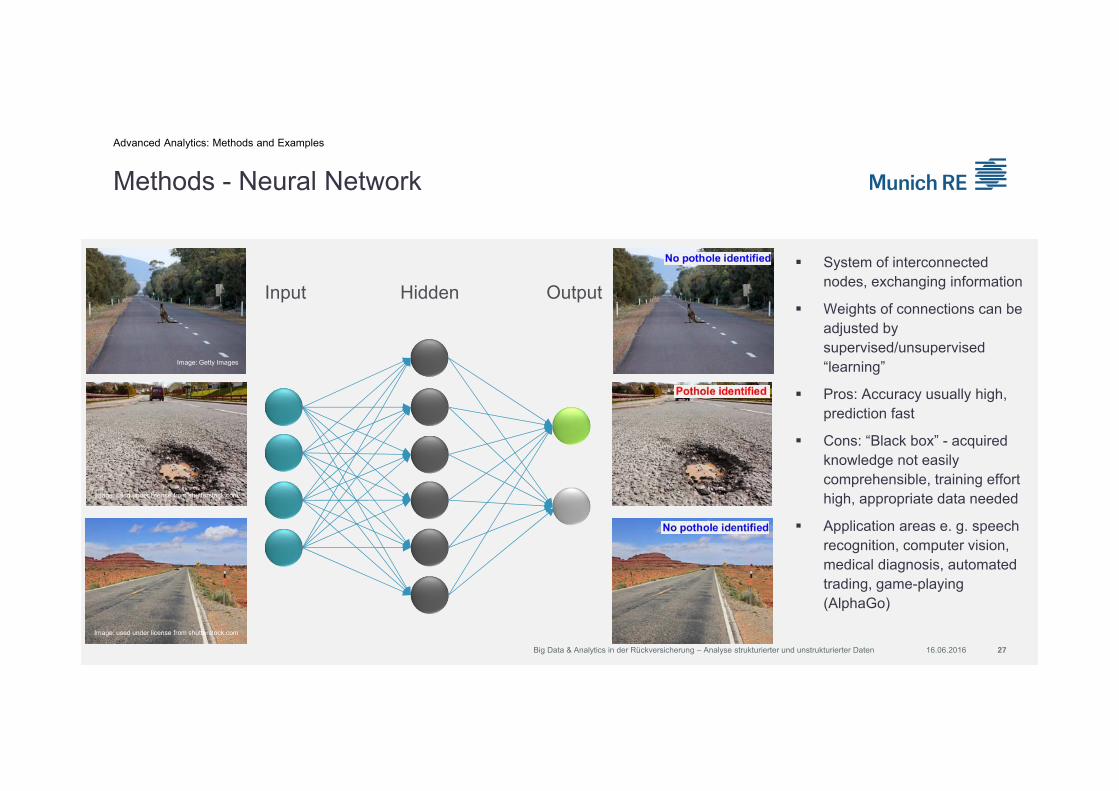
System of interconnected nodes, exchanging information
Weights of connections can be adjusted by supervised/unsupervised “learning”
Pros: Accuracy usually high, prediction fast
Cons: “Black box” - acquired knowledge not easily comprehensible, training effort high, appropriate data needed
Application areas e. g. speech recognition, computer vision, medical diagnosis, automated trading, game-playing (AlphaGo)
Methods - Neural Network
27Big Data & Analytics in der Rückversicherung – Analyse strukturierter und unstrukturierter Daten
Input Hidden Output
Advanced Analytics: Methods and Examples
Image: used under license from shutterstock.com Image: used under license from shutterstock.com
Image: used under license from shutterstock.com Image: used under license from shutterstock.com
Image: Getty Images Image: Getty Images
16.06.2016
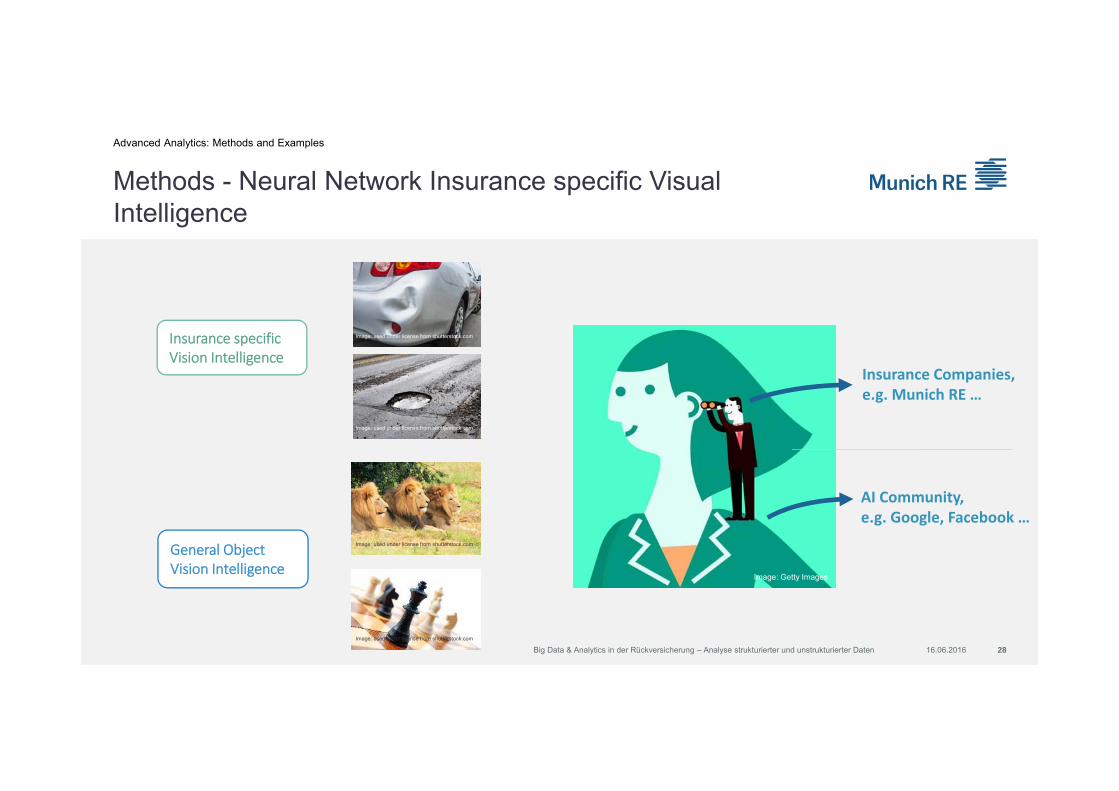
Methods - Neural Network Insurance specific Visual Intelligence
28
Advanced Analytics: Methods and Examples
Big Data & Analytics in der Rückversicherung – Analyse strukturierter und unstrukturierter Daten 16.06.2016
Insurance Companies, e.g. Munich RE …
AI Community, e.g. Google, Facebook …
Insurance specific Vision Intelligence
General ObjectVision Intelligence
Image: used under license from shutterstock.com
Image: used under license from shutterstock.com
Image: Getty Images
Image: used under license from shutterstock.com
Image: used under license from shutterstock.com
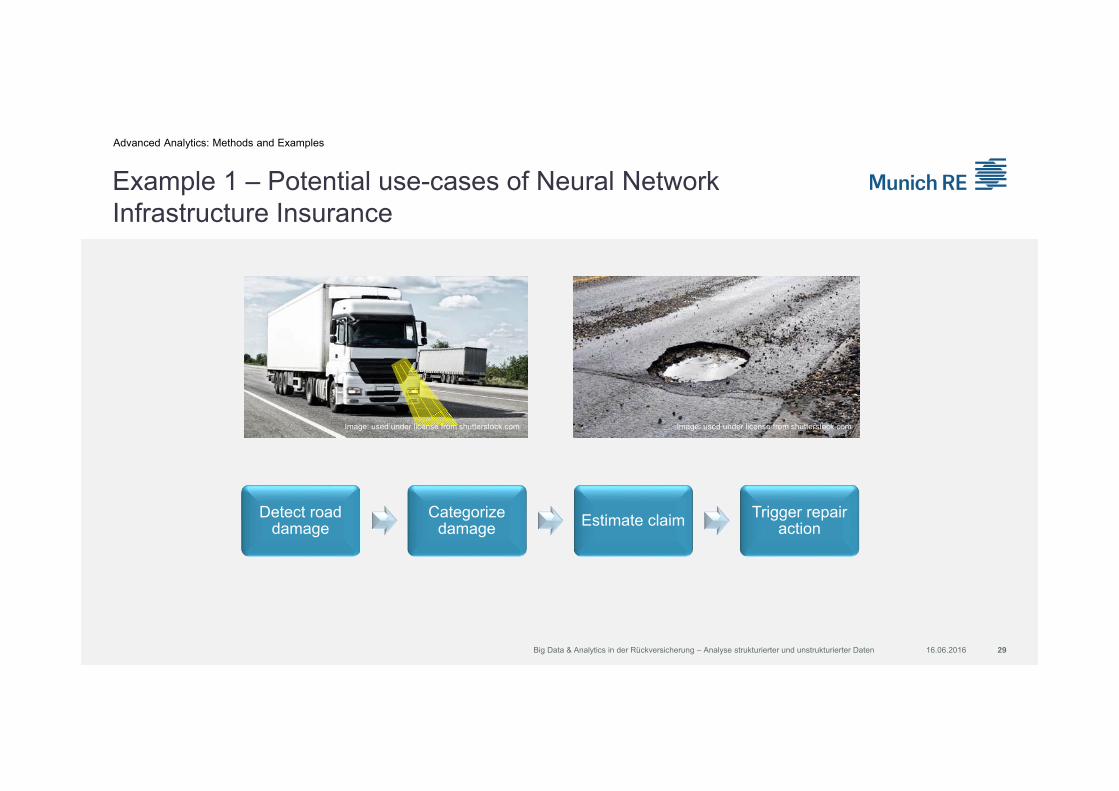
Example 1 – Potential use-cases of Neural NetworkInfrastructure Insurance
29
Detect road damage
Categorize damage Estimate claim Trigger repair
action
Advanced Analytics: Methods and Examples
16.06.2016Big Data & Analytics in der Rückversicherung – Analyse strukturierter und unstrukturierter Daten
Image: used under license from shutterstock.com Image: used under license from shutterstock.com
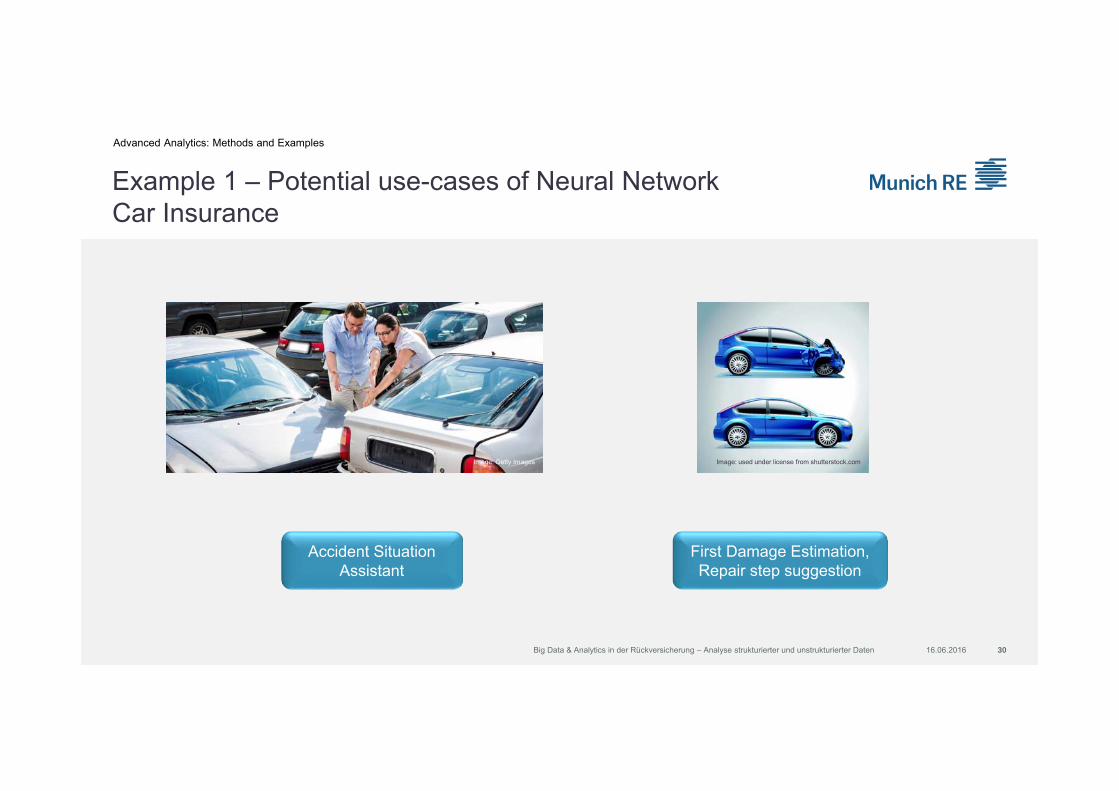
Example 1 – Potential use-cases of Neural NetworkCar Insurance
30
First Damage Estimation, Repair step suggestion
Accident Situation Assistant
Advanced Analytics: Methods and Examples
16.06.2016Big Data & Analytics in der Rückversicherung – Analyse strukturierter und unstrukturierter Daten
Image: Getty Images Image: used under license from shutterstock.com

Example 2 – Explorative Analysis: SAS Visual AnalyticsAd hoc exploration of data
16.06.2016
Advanced Analytics: Methods and Examples
Applied to loss estimates from 1980 to 2015 provided by Munich Re‘sNat Cat Service
In Italy, most frequent Nat Catevents are hydrological, most fatal Nat Cat events are climatological(driven by 2003 heat wave) andmost expensive Nat Cat eventsgeophysical
Example: Nat Cat events in Italy
Intuitive and easy to usevisualization techniques
Big Data & Analytics in der Rückversicherung – Analyse strukturierter und unstrukturierter Daten 31
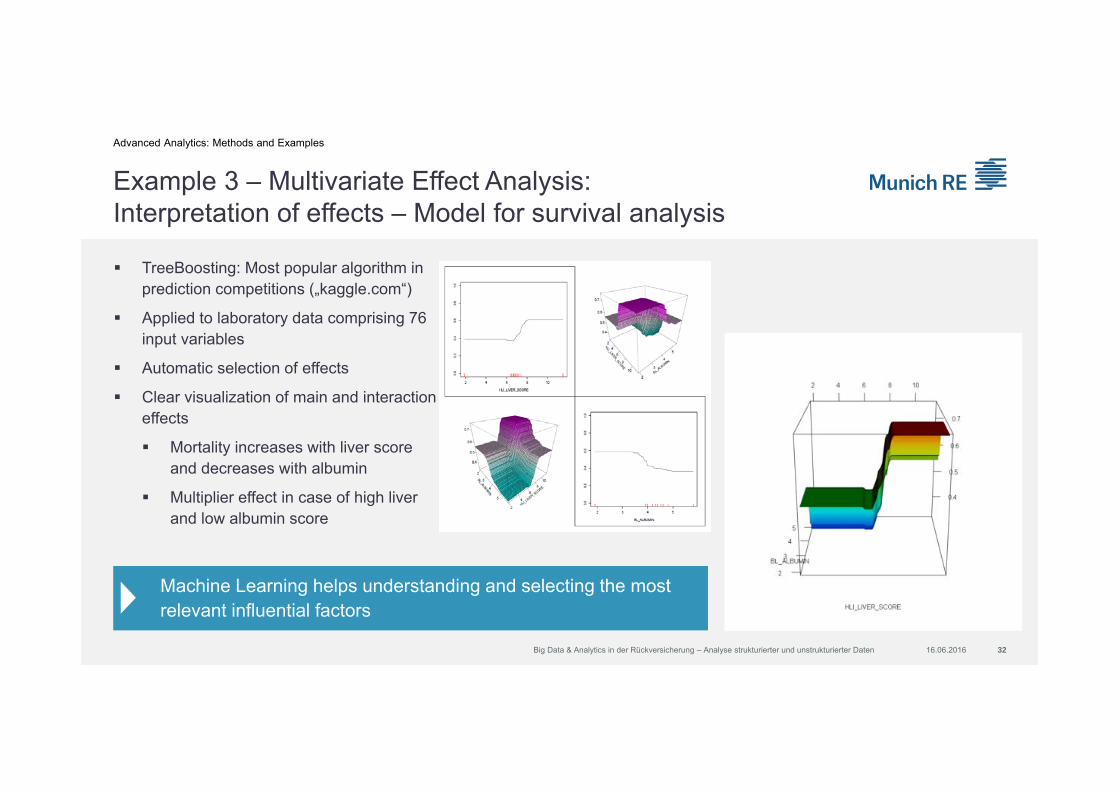
Example 3 – Multivariate Effect Analysis: Interpretation of effects – Model for survival analysis
16.06.2016
TreeBoosting: Most popular algorithm in prediction competitions („kaggle.com“)
Applied to laboratory data comprising 76 input variables
Automatic selection of effects
Clear visualization of main and interactioneffects
Mortality increases with liver score and decreases with albumin
Multiplier effect in case of high liverand low albumin score
Advanced Analytics: Methods and Examples
Machine Learning helps understanding and selecting the mostrelevant influential factors
Big Data & Analytics in der Rückversicherung – Analyse strukturierter und unstrukturierter Daten 32

Example 4 – Multivariate Effect Analysis: Statistical model – Insurance product hot spot analysis
Results Benefits Provides an accurate overview of an insurance product’s
sales structure
Blue regions represent a low probability to purchase the insurance product, while purple regions represent the hotspots
Various factors like age, gender, occupation, place of residence, etc. can be taken into account for the model creation
Supports resource allocation of sales forces
Outlook Extend the model’s application area to any lines of business
Analysis of customer needs
16.06.2016
Advanced Analytics: Methods and Examples
Big Data & Analytics in der Rückversicherung – Analyse strukturierter und unstrukturierter Daten 33

Example 5 – Analysis of MR’s bodily injury database (BID) using Decision Trees / Random Forests
The BID comprises bodily injury claims known by Munich Re which exceeded a certain total loss amount.
The BID contains the following information:
Technical: date of accident, amount per head of damage, mortality table, …
Medical: degree of invalidity (DoI), diagnosis,…
Socio-ecological: marital status, occupation, gender, date of birth,…
The analysis was done in R, an open-source software for statistical analysis
16.06.2016 34Big Data & Analytics in der Rückversicherung – Analyse strukturierter und unstrukturierter Daten
Advanced Analytics: Methods and Examples

Example 5 - Decision trees are a vivid tool which estimates a target variable depending on various factors
16.06.2016 35Big Data & Analytics in der Rückversicherung – Analyse strukturierter und unstrukturierter Daten
Advanced Analytics: Methods and Examples
5 mn€
7 mn€
6,5 mn€ 8 mn€
3,5 mn€
… …
Age < 15 Age >= 15
DoI < 73 DoI >= 73 … …
Incurred amount Age DoI
Gender…
Target variable Explaining variables
Decision Tree
Fictitiousexample
Mean incurredamount
Decision trees offer a data-driven approach of automatically modeling complexstructures and identifying the most important factors
Result
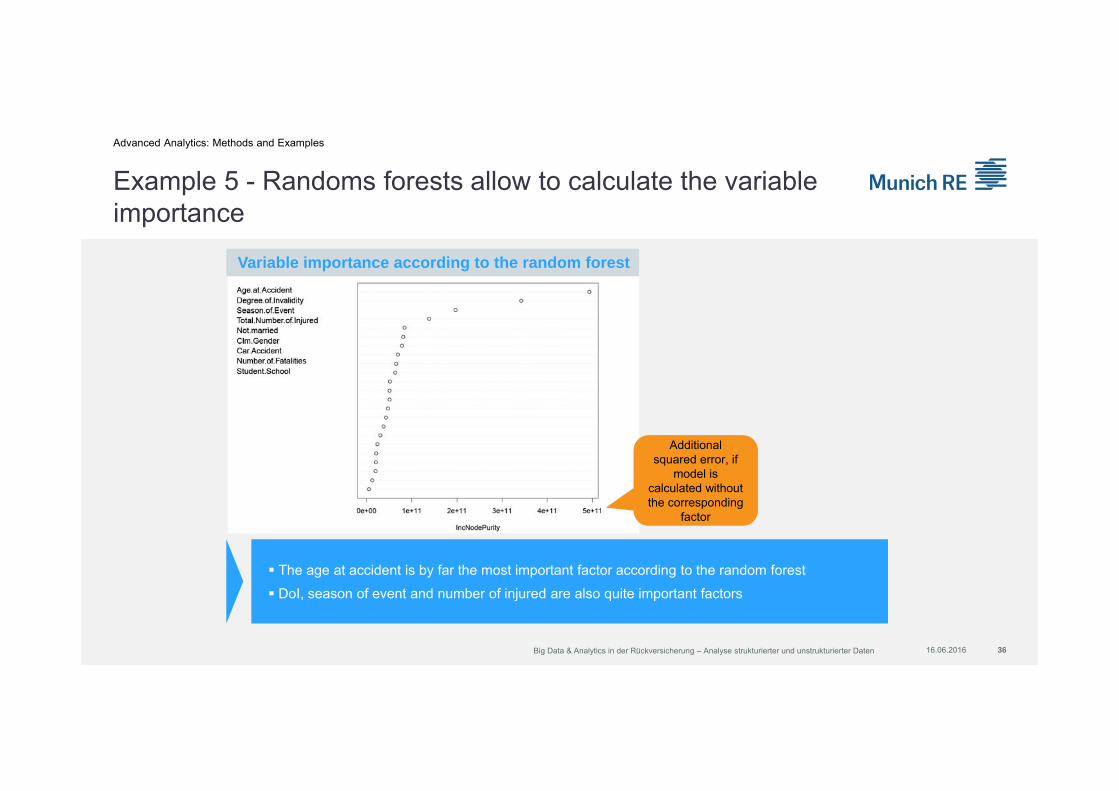
Example 5 - Randoms forests allow to calculate the variable importance
16.06.2016 36Big Data & Analytics in der Rückversicherung – Analyse strukturierter und unstrukturierter Daten
Advanced Analytics: Methods and Examples
The age at accident is by far the most important factor according to the random forest
DoI, season of event and number of injured are also quite important factors
Variable importance according to the random forest
Additional squared error, if
model iscalculated withoutthe corresponding
factor
Agenda
Data Analytics Framework1 Technology Stack2
The People behind Big Data & Analytics3 Current / Planned Activities4
16.06.2016 37
Advanced Analytics: Methods and Examples5 Conclusion6
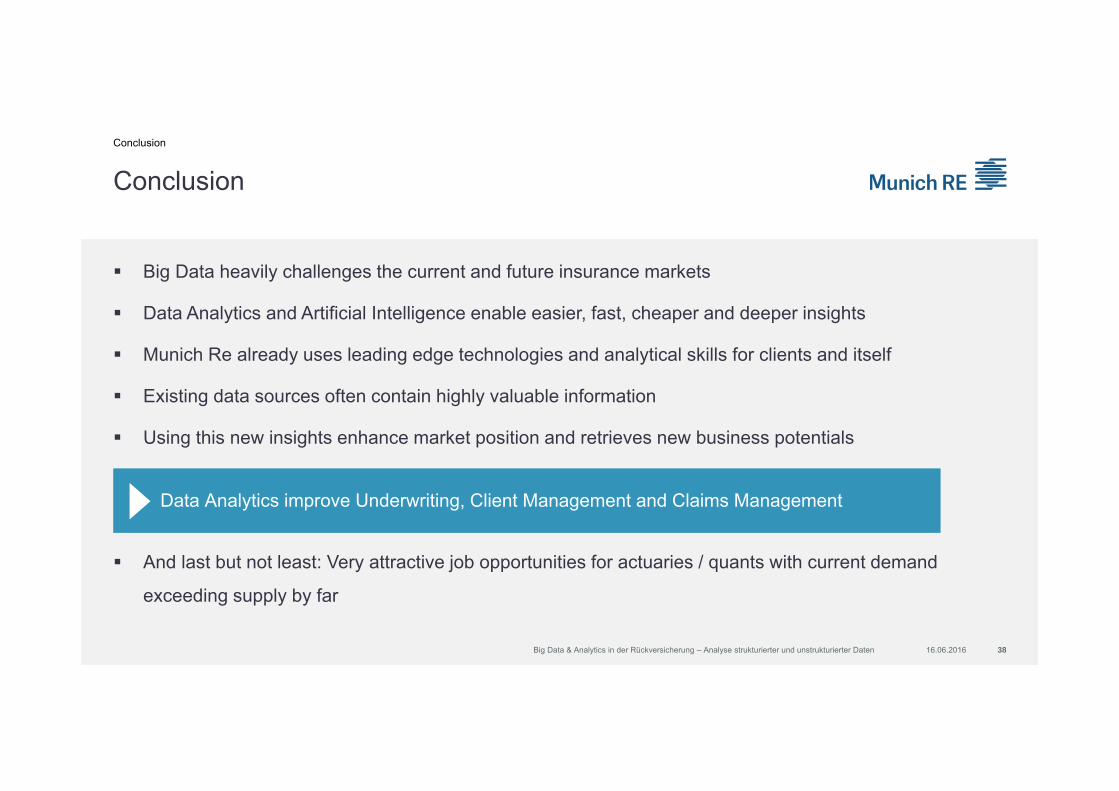
Big Data heavily challenges the current and future insurance markets
Data Analytics and Artificial Intelligence enable easier, fast, cheaper and deeper insights
Munich Re already uses leading edge technologies and analytical skills for clients and itself
Existing data sources often contain highly valuable information
Using this new insights enhance market position and retrieves new business potentials
And last but not least: Very attractive job opportunities for actuaries / quants with current demand
exceeding supply by far
Conclusion
16.06.2016 38Big Data & Analytics in der Rückversicherung – Analyse strukturierter und unstrukturierter Daten
Conclusion
Data Analytics improve Underwriting, Client Management and Claims Management

Thank you very much for your attention
Wolfgang Hauner, Head of Data Analytics
Image: Bayerische Zugspitzbahn Bergbahn AG / Lechner
© 2016 Münchener Rückversicherungs-Gesellschaft © 2016 Munich Reinsurance Company